Article

Potential for Energy Production from Farm Wastes Using Anaerobic Digestion in the UK: An Economic Comparison of Different Size Plants

1
RCUK National Centre for Sustainable Energy Use in Food Chains, Institute of Energy Futures, Brunel University London, Uxbridge, Middlesex UB8 3PH, UK
2
Agricultural Centre for Sustainable Energy Systems, Department of Animal Production, Welfare and Veterinarian Sciences, Harper Adams University, New Port TF10 8NB, UK
*
Author to whom correspondence should be addressed.
Energies 2017, 10(9), 1396; https://doi.org/10.3390/en10091396
Submission received: 28 June 2017 / Revised: 21 August 2017 / Accepted: 6 September 2017 / Published: 13 September 2017
(This article belongs to the Special Issue Economics of Bioenergy 2016)

Abstract

:
Anaerobic digestion (AD) plants enable renewable fuel, heat, and electricity production, with their efficiency and capital cost strongly dependent on their installed capacity. In this work, the technical and economic feasibility of different scale AD combined heat and power (CHP) plants was analyzed. Process configurations involving the use of waste produced in different farms as feedstock for a centralized AD plant were assessed too. The results show that the levelized cost of electricity are lower for large-scale plants due to the use of more efficient conversion devices and their lower capital cost per unit of electricity produced. The levelized cost of electricity was estimated to be 4.3 p/kWhe for AD plants processing the waste of 125 dairy cow sized herds compared to 1.9 p/kWhe for AD plants processing waste of 1000 dairy cow sized herds. The techno-economic feasibility of the installation of CO2 capture units in centralized AD-CHP plants was also undertaken. The conducted research demonstrated that negative CO2 emission AD power generation plants could be economically viable with currently paid feed-in tariffs in the UK.

1. Introduction

Anaerobic digestion (AD) processes enable the use of organic wastes such as food and farm waste for the generation of energy and biofertilizer [1]. In AD processes, metabolic bacteria break down organic matter into simpler chemical compounds such as CH4, CO2, NH3, and H2S without oxygen [2]. Before being digested, the organic matter undergoes pretreatment which involves removal of undesirable materials, the addition of water, and mixing to form a slurry. The byproducts of AD are biogas and digestate [3]. The digestate can be used directly on land as fertilizer or further processed into compost to increase its quality and value [3]. The biogas can be combusted in boilers for the production of heat or in internal combustion engines for the production of electricity and heat in a Combined Heat and Power (CHP) arrangement. Alternatively, the biogas can be processed downstream to remove CO2 and water vapor for biomethane production [1]. Biogas from agriculture waste exhibits a CH4 mole fraction in the range 50–60% and it is considered to be a carbon-neutral fuel. AD plants can thus be perceived not only as a waste reduction technology but also as a means of decarbonization of the energy system, contributing to emission reduction targets [4]. The introduction of CO2 capture and storage technologies in biofueled plants could also enable negative CO2 emission energy production, given the fact that CO2 emissions are being captured from a plant operating using carbon neutral feedstock [5,6].
The application of AD energy generation plants is currently experiencing growth in a number of European countries such as Germany, Italy, and the UK, primarily due to renewable heat and electricity production incentives [7]. The growth in the number of AD plants is expected to continue in the future, extending the share of this technology in the future energy generation mix [8].
There were approximately 378 AD combined heat and electricity (CHP) plants operating in the UK in 2015. Installed power capacity for these plants was close to 388 MWe, of which 125 MWe corresponded to AD plants processing farm waste. A large percentage (75%) of the AD CHP plants in the UK agriculture sector exhibits individual installed power generation capacity up to 500 kWe [9]. Feed-in tariffs paid to small scale generators is significantly higher than the one for larger scale plants, in fact the UK electricity feed-in tariff for AD plants with installed power generation capacity of up to 250 kWe (6.93 p/kWhe) is 180% higher than the feed-in tariff for plants which installed power generation capacity is larger than 500 kWe (2.49 p/kWhe) [10]. The UK government revised these tariffs during the first quarter of this year, significant differences were observed for the plants with installed generation capacity larger than 500 kWe that used to receive 5.76 p/kWhe before 31 March 2017.
Heat production using AD plants is as well favored by the UK Renewable Heat Incentive (RHI) scheme, which provides quarterly payments over twenty years for non-domestic thermal energy production using renewable resources [11]. RHI tariffs are scale and technology dependent, offering larger payment per unit of heat produced for small scale generators.
Incentive policy in the UK and in other European countries has encouraged small to medium industries and farms to deploy AD plants as a way to obtain economic benefits associated with the use of their organic waste [9]. It must be noted, however, that the biogas yield associated with the waste of these farms will lead to a relatively low thermal flow, leading to more inefficient power generation units given the fact that larger turbo machinery tends to exhibit larger electrical efficiency.
The technical and economic feasibility of AD plants in the context of agriculture and farm waste processing has been analyzed by a number of researchers [12,13,14,15]. These studies focused on the investigation of the techno-economic performance of the AD reaction system, rather than extensively analyzing energy conversion technologies for biogas.
Biogas can be converted into electricity using boilers and bottoming Rankine cycle systems employing steam or organic working fluids. Electricity and heat can also be generated by combusting the biogas in the internal combustion engines of CHP systems. Electrical efficiency tends to be higher for larger and more expensive engine-driven CHP systems as they enable the implementation of more precise manufacturing processes and energy efficiency improvement technologies such as turbocharging and intercooling [16,17]. Surveys indicated that efficiency for biogas fueled engines ranged from 35% to 40% for power outputs between 50 and 800 kWe. This power range corresponds to the biogas yields associated with the waste of dairy farm herds of between 100 and 1000 dairy cows. The overall power generation efficiency can be increased further by using the heat in the high temperature flue gases of the gas engine of the CHP system to generate additional power through the use of Organic Rankine Cycle (ORC) power systems [18].
The use of gas engine power generation technology for different size AD plants was investigated by Lantz [19]. The author estimated the capital investment cost for different size plants and the specific investment cost per unit of installed power. It was shown that the specific investment cost for larger plants (consequence of their higher electrical generation efficiency and non-linear cost relationship) was lower than the analogous values for small scale plants. The possibility of combining the waste from different farms to increase the thermal input of the power devices was also suggested.
The use of waste from different small farms as feedstock to a centralized AD plant offers the advantage of enabling larger thermal input for the power generation system, but impacts of transport and maximum available reactor size should be taken into consideration. Previous studies that discussed the opportunity of combining waste from different farms to be processed in large AD based energy plants mostly focused on the optimization of the overall plant size without paying sufficient attention to the characteristics and limitations of available energy conversion technologies [20,21,22].
The incorporation of CO2 capture and storage processes in fossil and biogenic fueled power plants is envisaged as the most economically feasible way to reach the emission reduction objectives associated with the two degree target [23]. As previously said, these plants enable electricity generation with negative CO2 emissions and are expected to play a key role in the low carbonization of the energy system [24,25,26]. Deployment of CO2 capture technologies is also encouraged in low to medium scale energy plants [27] and it is assumed that in the future these generators will join a hypothetical CO2 transport net because it does not seem feasible to build a duct for small CO2 flow to be transported. CO2 capture using solvent-based gas separation units is the most industrially widespread CO2 capture process [28,29]. CO2 from the combustion effluent is chemically absorbed by the separation agent (example: mono-ethanol amine) and the separation agent is thermally regenerated in a stripper. The heat source for the reboiler of the stripper is provided by steam at approximately 2 bar (120 °C). A rich CO2 stream is obtained on the top of the stripper, downstream dried, and compressed up to 110 bar for allowing geological storage. Further details about solvent-based processes in the role of post combustion CO2 capture processes can be found in [30,31,32] whilst CO2 geological storage is further discussed in [28].
The aim of this paper is to report on the analysis of the technical and economic feasibility of energy generation from AD plants of different sizes in the UK context, focusing mainly on power production. Internal combustion engines equipped with a bottoming ORC system for electricity generation have been considered. Post-combustion technologies in the role of CO2 capture processes have also been assessed for larger scale plants and economic compensations for the smaller waste suppliers have also been studied.

2. Methodology

2.1. Farm Sizes and Bio-Gas Yield

Different scales for AD-energy conversion plants were the subject of investigation in this article: 125 dairy cow sized herd (Plant Size I), 250 dairy cow sized herd (Plant Size II), 500 dairy cow sized herd (Plant Size III), 1000 dairy cow sized herd (Plant Size IV), and an AD centralized plant. Herd sizes were based on the dairy size farm classification used in the livestock maps [33] produced by the UK Department of Environment, Food and Rural Affairs (DEFRA).
The process design for the centralized plant was effected by considering one of the largest currently operating AD reactors with volume close to 3000 m3 [13]. Based on this size, using an organic loading rate of 3 kg of volatile solids/m3 per day [13] and an average waste production per cow of approximately 53 kg/day (not including parlor washing) [34], it was estimated that the associated feedstock corresponded to the waste produced by 2670 cows. It must be noted that it was assumed that the amount of collectable waste was independent of herd size; leading to an over estimation of slurry production, especially for small herd sizes due to the fact that cows can spend a sizeable amount of time outdoors with only a fraction of the daily waste collected. This article is only focused on the use of cow dairy slurry as AD feedstock, and does not study the effect of co-digestion of other agriculture wastes.
The AD centralized plant was assumed to be located in the Cheshire region and that the required slurry feedstock for its operation was supplied by using the waste of farms up to 1000 cows located in a 6.7 km × 6.7 km area, as displayed in Figure 1.
Chemical and physical properties for the dairy cow slurry are displayed in Table 1.
Volatile solids (VS) represent the portion of the organic solids that can be digested, while the remainder of the solids is fixed [37]. Biogas flowrate per kg VS and biogas compositions (Table 2) were quantified by using the Boyle–Buswell stoichiometric relationship [39] considering that the total volatile solid content of the slurry can be degraded by the microorganisms in the anaerobic digester. This is a common methodology that has previously been applied in several articles [12,13,14,15] aiming to assess the potential for biogas and energy generation from organic solid waste via the anaerobic digestion process. It was assumed that the introduction of bio-diesel scrubbers downstream of the AD reactors would enable the reduction of NH3 and H2S content to acceptable levels for being used as fuel in gas engines [40].

2.2. Power Generation Using Gas Engine and Organic Rankine Cycle Systems

The technical performance in term of biogas inlet thermal flow, power generation, and parasitic loss for each plant size is presented in Table 3. Based on the thermal input associated with the different plant sizes, a careful selection of gas engine models was undertaken using the data provided by different engine vendors [16,17,41]. Specially tailored process simulations were undertaken employing Aspen Hysys process design software [42], considering the composition of the biogas from the AD reactor and using the pressure ratio specification, the number of compression and intercooling stages, and the operating conditions reported by the vendors. Gas engines were modelled using existing unit operations in the software as described in [43,44]. Turbo-charging compression with intercooling stages were simulated using compressors and intercoolers available in the software. The Otto cycle gas engine itself was modelled as a process involving the compression stage (employing compressor blocks), the combustion of biogas (in a Gibbs reactor), and the flue gas expansion (modelled as a turbine block). For the different plant scales, it was possible to identify a specific gas engine model that could be employed for power generation based on the associated biogas thermal flow.
Energy consumption for farming-related activities for the different herd sizes was estimated based on the information presented by [45,46]. It was assumed that the power consumption for the operation of the AD reactor system was mainly due to the power required for the stirring and pumping of the slurry (7.2 kWh/ton of input slurry), as reported by [47]. Heat requirement during the AD reaction process was quantified by considering the required thermal energy for pre-heating the slurry from ambient temperature to the AD operating conditions and heat transfer processes in the reactor jacket, as detailed in [13].
As previously mentioned, the feasibility of using one of the largest AD facilities currently deployed for power generation was explored. Based on the information presented by [13], the volume for the AD reactor in this centralized plant was around 3770 m3. The corresponding biogas generation of a reactor of this size would be approximately equivalent to 3.8 MWth, which matches the needs of the largest and highest efficiency biogas-fueled engines manufactured by a market leading company [16]. It must be noted that in this plant, on site parasitic loss is mainly caused by the power consumption in the AD reactor, however (as further detailed in result section), electricity consumed in the small slurry supply farm was also considered. This is because AD centralized plants are assumed to provide a free electricity generation fee to the small slurry supplier farms.
The technical performance for the different plants was compared using the specific power generation per mass unit of volatile solids (kg VS). The mathematical expression used is illustrated in Equation (1).
SPG VS = Power GSE + Power ORC Mass SLR × VS   ( % ) 100
The capital investment cost for the AD reactor was quantified by employing the correlation developed by [13], updated to the current value of UK sterling using the CEPCI (Chemical Engineering Plant Cost Index) and the corresponding exchange rate, Equation (2). The yearly operation and maintenance cost for the AD reaction system was assumed to be 7% of the total capital cost of the AD reactor [48,49].
CI   AD = 24,361 × AD RV   ( m 3 ) 0.6999
As it was mentioned in the Introduction, digestate can be obtained as an AD byproduct. Digestate can be used as fertilizer in the farm, thus, considering that grass or crops exhibit lower growth rate during winter, digestate must be stored at least for 22 weeks [34]. In this work, it was assumed that digestate could be stored in a HDPE (high-density polyethylene) lined lagoon that would be built once the AD plants were deployed in the farm. The cost for slurry storage tanks upstream of the AD reactor was not quantified in this work because it was considered that currently operating farms would have already these tanks, however cost data for slurry tanks [34] was used for modelling the cost of digestate tanks.
Capital investment costs for gas engines were based on the equations presented by [17,50]. The correlation was updated to current value of UK sterling using the CEPCI index and the corresponding exchange rate. The resulting mathematical expression is presented in Equation (3).
CIC GSE = ( 3432 × Power   ( kW e ) GSE 0.666 ) + 11,097
Operation and maintenance cost (O&M) for the gas engine was estimated using the correlations presented in the above cited references and shown in Equation (4).
O & M GSE = 5.896 × Power   ( kW e ) GSE 0.2219
Gas engines enable power generation as well as heat production. Heat from the gas engine jacket, lubricant oil, and hot flue gases could be recovered. Heat from the gas engine jacket and from the lubricant oil enables to produce hot water at 90 °C, the thermal content of this hot water can fully satisfy the farm and AD reactor heat demands. This heat can be accounted in terms of the RHI incentives in the UK [11], thus the farm could also get payments for heat production and use.
Heat from the combustion effluents of the gas engine could be recovered for district heating or for extra electricity generation using Organic Rankine Cycles [51]. In this work, it was decided to analyze the second option. However, it must be noted that that the hot flue gases could be used to satisfy the heat demand of industrial sites or villages located in the proximity of the farm with the installed AD reactor with gas engine. In this work, exhaust flue gases were assumed to be cooled down to a temperature 10 degrees higher than their dew point and used as a heat source for a R245fa ORC. R245fa is one of the most commonly employed fluids in ORC systems [52]. Efficiency for ORC pumps and expanders was determined using linear correlations taking into account thermal inputs for the cycle, based on data for currently available machinery on the market [53]. Capital costs for ORC systems were estimated using the correlation presented in Equation (5) and operation and maintenance costs were quantified by considering the yearly specific values for O&M costs to be £ 55.6 per installed kWe [15]. Values were updated to current value of UK sterling using CEPCI and the corresponding exchange rate.
CIC ORC = ( 1728 × Power   ( kW e ) ORC ) + 11,290
For all the plants under analysis in this article, capital costs associated with grid connection infrastructure were also considered. It was decided to use cost data from a currently 300 kW AD-CHP plant in the UK [54] built in 2011. This cost was updated to 2016 pound sterling using the corresponding CEPCI index. Linear upscaling or downscaling was assumed. Contingency and engineering work costs were also accounted for, and were considered to be 3% of the total capital investment cost [54].
For the centralized AD plant, the option of installing a CO2 capture process was analyzed in an attempt to design a negative CO2 emission power plant. The biogas combustion flue gases have a CO2 mole fraction close to 10.5%, quite similar in CO2 composition to the effluents of coal fired power plants (12%). Based on this, a specific energy consumption close to 150 kJth/mol of captured CO2 was assumed [30]. This energy penalty is associated with steam production for the operation of the reboiler. Heat for steam generation is obtained by the cooling down of the flue gas from the gas engine which are thermally integrated as the heat source for the reboiler. Considering that the outlet temperature for the flue gas downstream of the reboiler is around 46 °C, it was decided that installing an ORC would not be feasible given the low temperature of the effluents. Rich CO2 stream obtained in the top of the absorber must be compressed up to critical pressure and then pumped till approximately 110 bar for enabling geological storage [55]. Capital investment cost data for CO2 post combustion units was downscaled (based on CO2 flow) from the cost figures presented by the European best practice guidelines for assessment of CO2 capture technologies [55], while the quantification for the capital cost for CO2 compression was undertaken using the information from quotes and correlation present in online cost estimator tools [56]. O&M was also estimated by using the ratio between yearly O&M and the capital investment cost for the post combustion CO2 capture unit reported in [55].
Two parameters were selected to compare the economic performance of the different plant sizes: the specific investment cost Equation (6) and the levelized cost of electricity Equation (7). The specific investment cost accounts for the capital investment cost divided by the net power generation capacity of the plant [19]. The levelized cost of electricity generation (LCOE) is defined as the discounted lifetime cost of ownership and use of a generation asset, converted into an equivalent unit of cost of generation in pence/kWhe [57]. As displayed by Equation (7), the levelized cost of electricity was estimated as the ratio of the total costs of the plant (including both capital and operating costs), to the total amount of electricity expected to be generated over the plant’s lifetime. Subscript n and r in Equation (7) make reference to a given year in plant operation and to the discount rate, respectively.
SIC = CIC Power output
LCOE = n CIC   + O & M ( 1 + r ) n n Power output   n ( 1 + r ) n

3. Results

The main technical and economic performance parameters for the analyzed waste to energy conversion processes are presented and discussed in this section as follows.

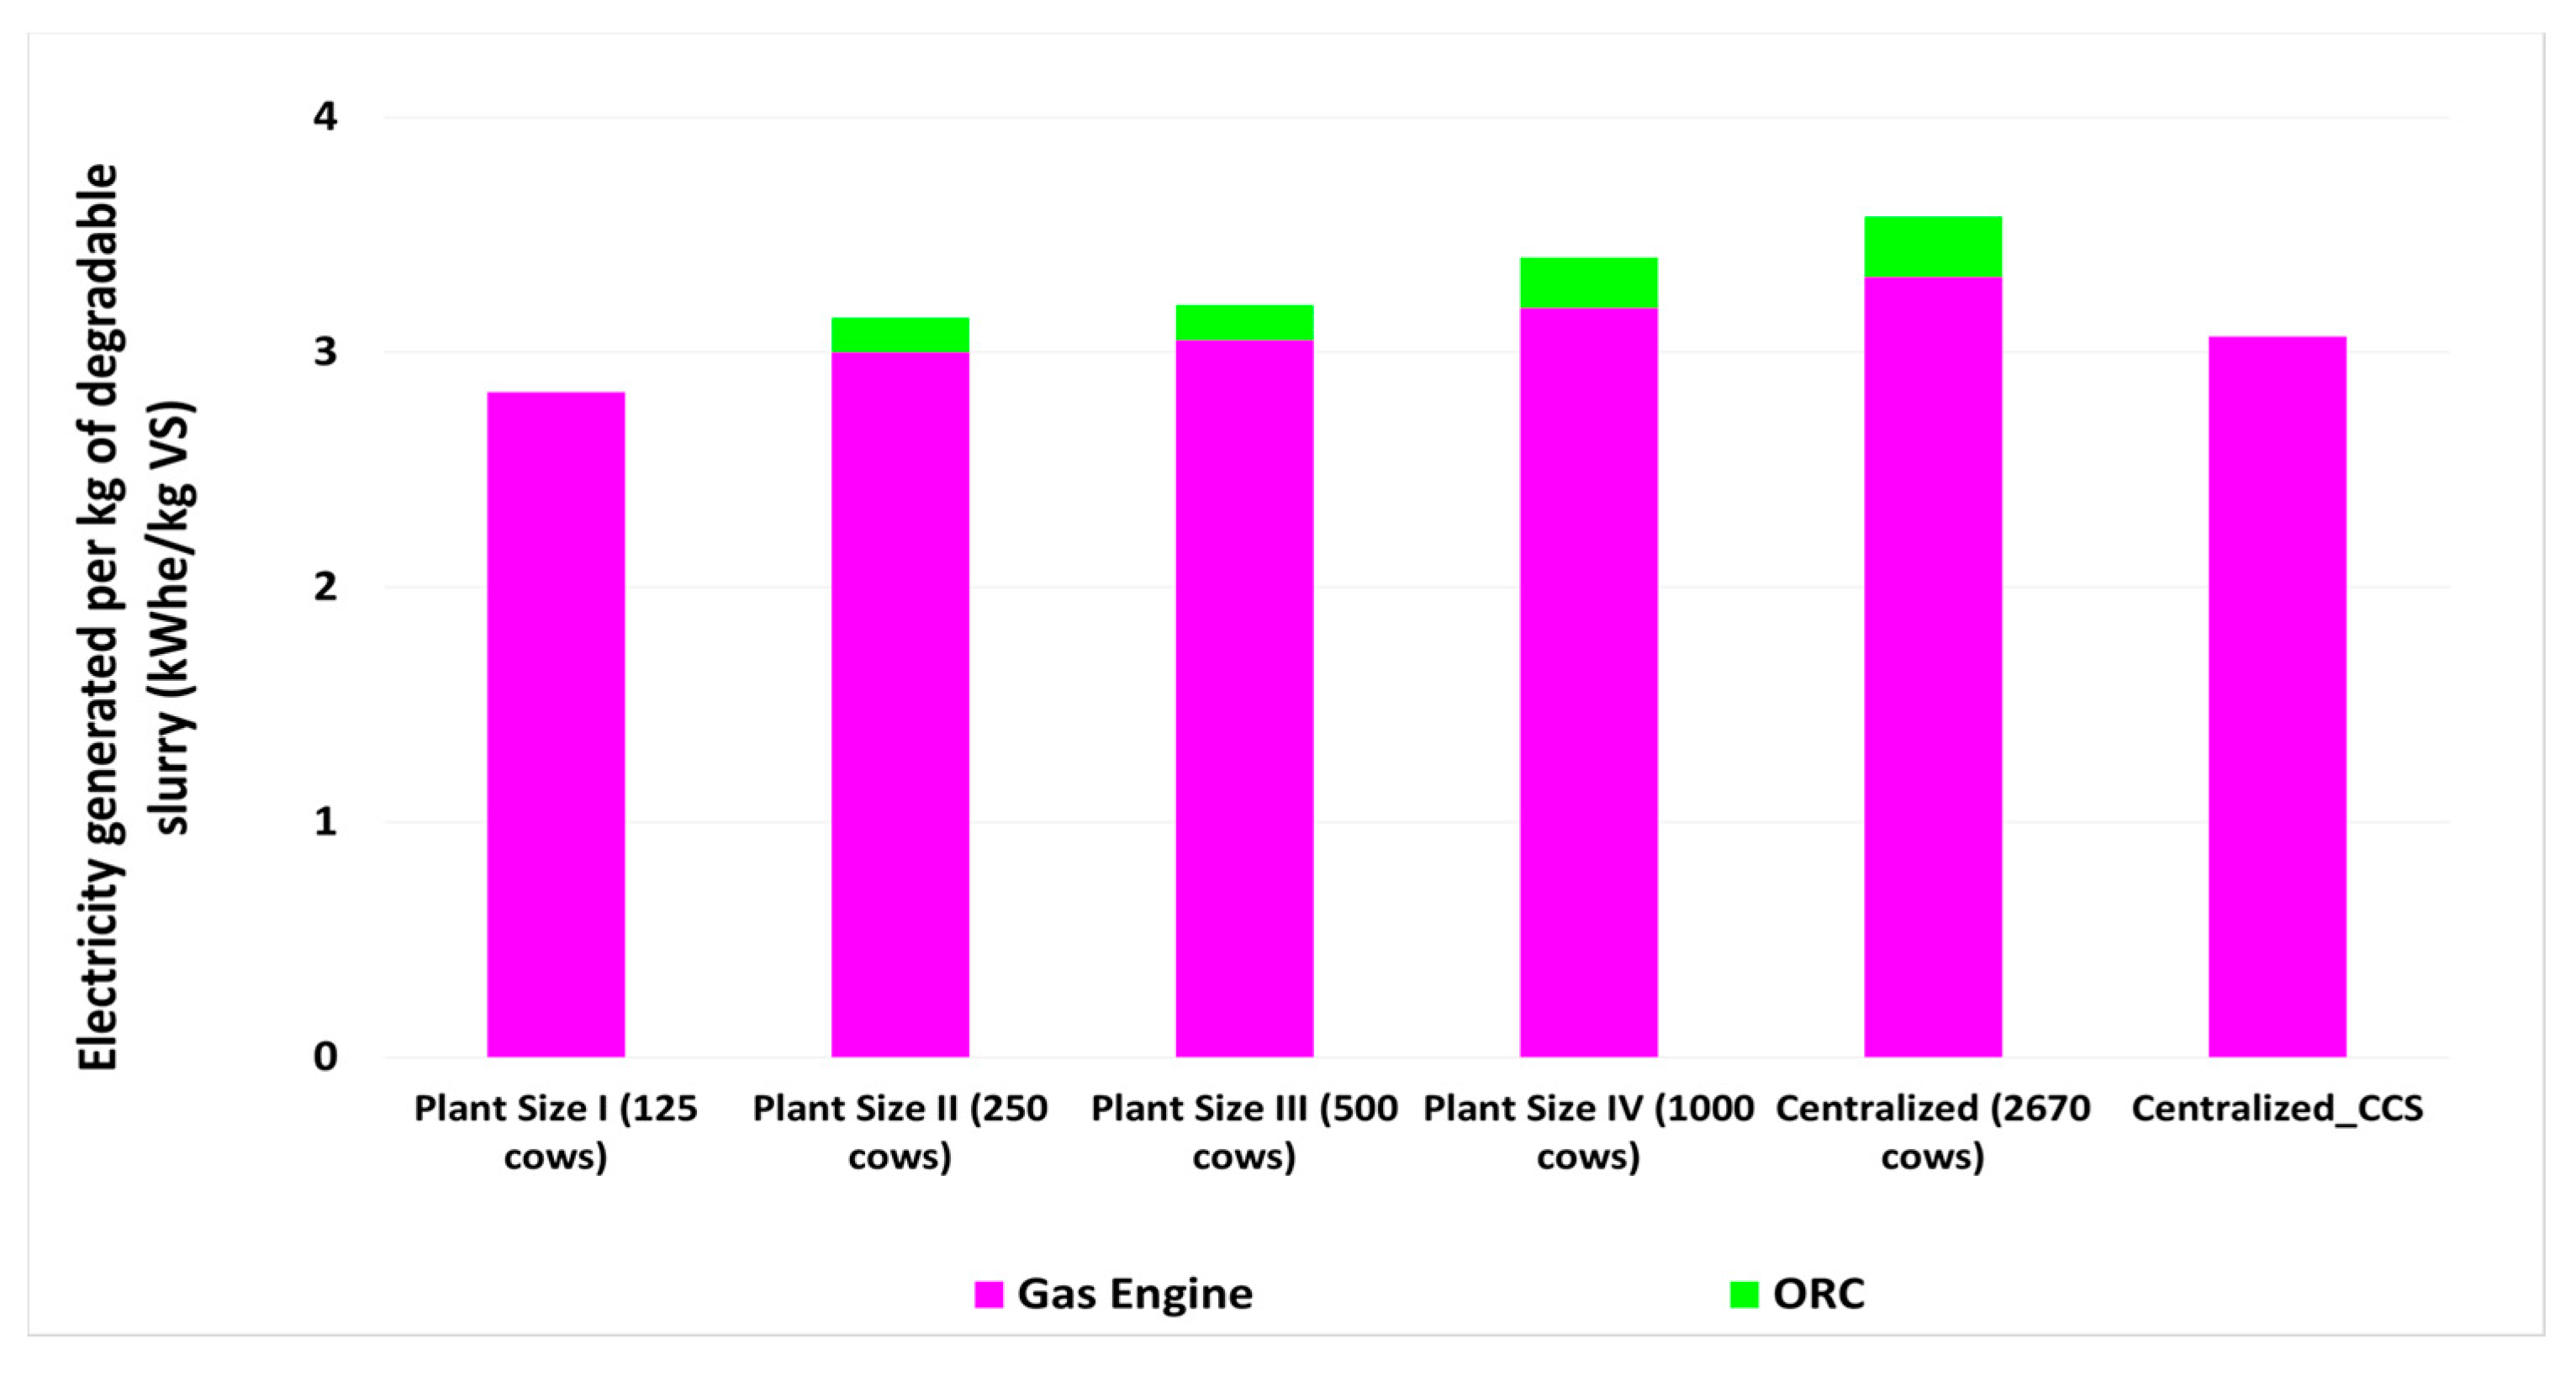
3.1. Technical Indicators

The specific power generation per kg of VS, estimated as the ratio between the power output of the gas engine and the ORC and the total amount of volatile solids contained in the waste fed to the AD reactor, is presented in Figure 2 for the different plant sizes under consideration in this article. Table 4 presents a detailed summary of the plant performance in term of energy outputs and fuel inputs.
The increase of electrical efficiency according to the thermal input (for non-CO2 capture cases) led to a higher specific power generation in the gas engine. Efficiency of the ORC systems was also higher when they were installed downstream of the larger gas engines. This is because larger heat-to-power conversion machines tend to be more efficient as their power generation capacity increases. As can be seen from Figure 2, the specific generation per kg of VS increased almost linearly with plant size for the plant sizes investigated. The trend is not followed by the plant with installed CO2 capture processes due to the associated energy penalty that leads to a lower power generation.

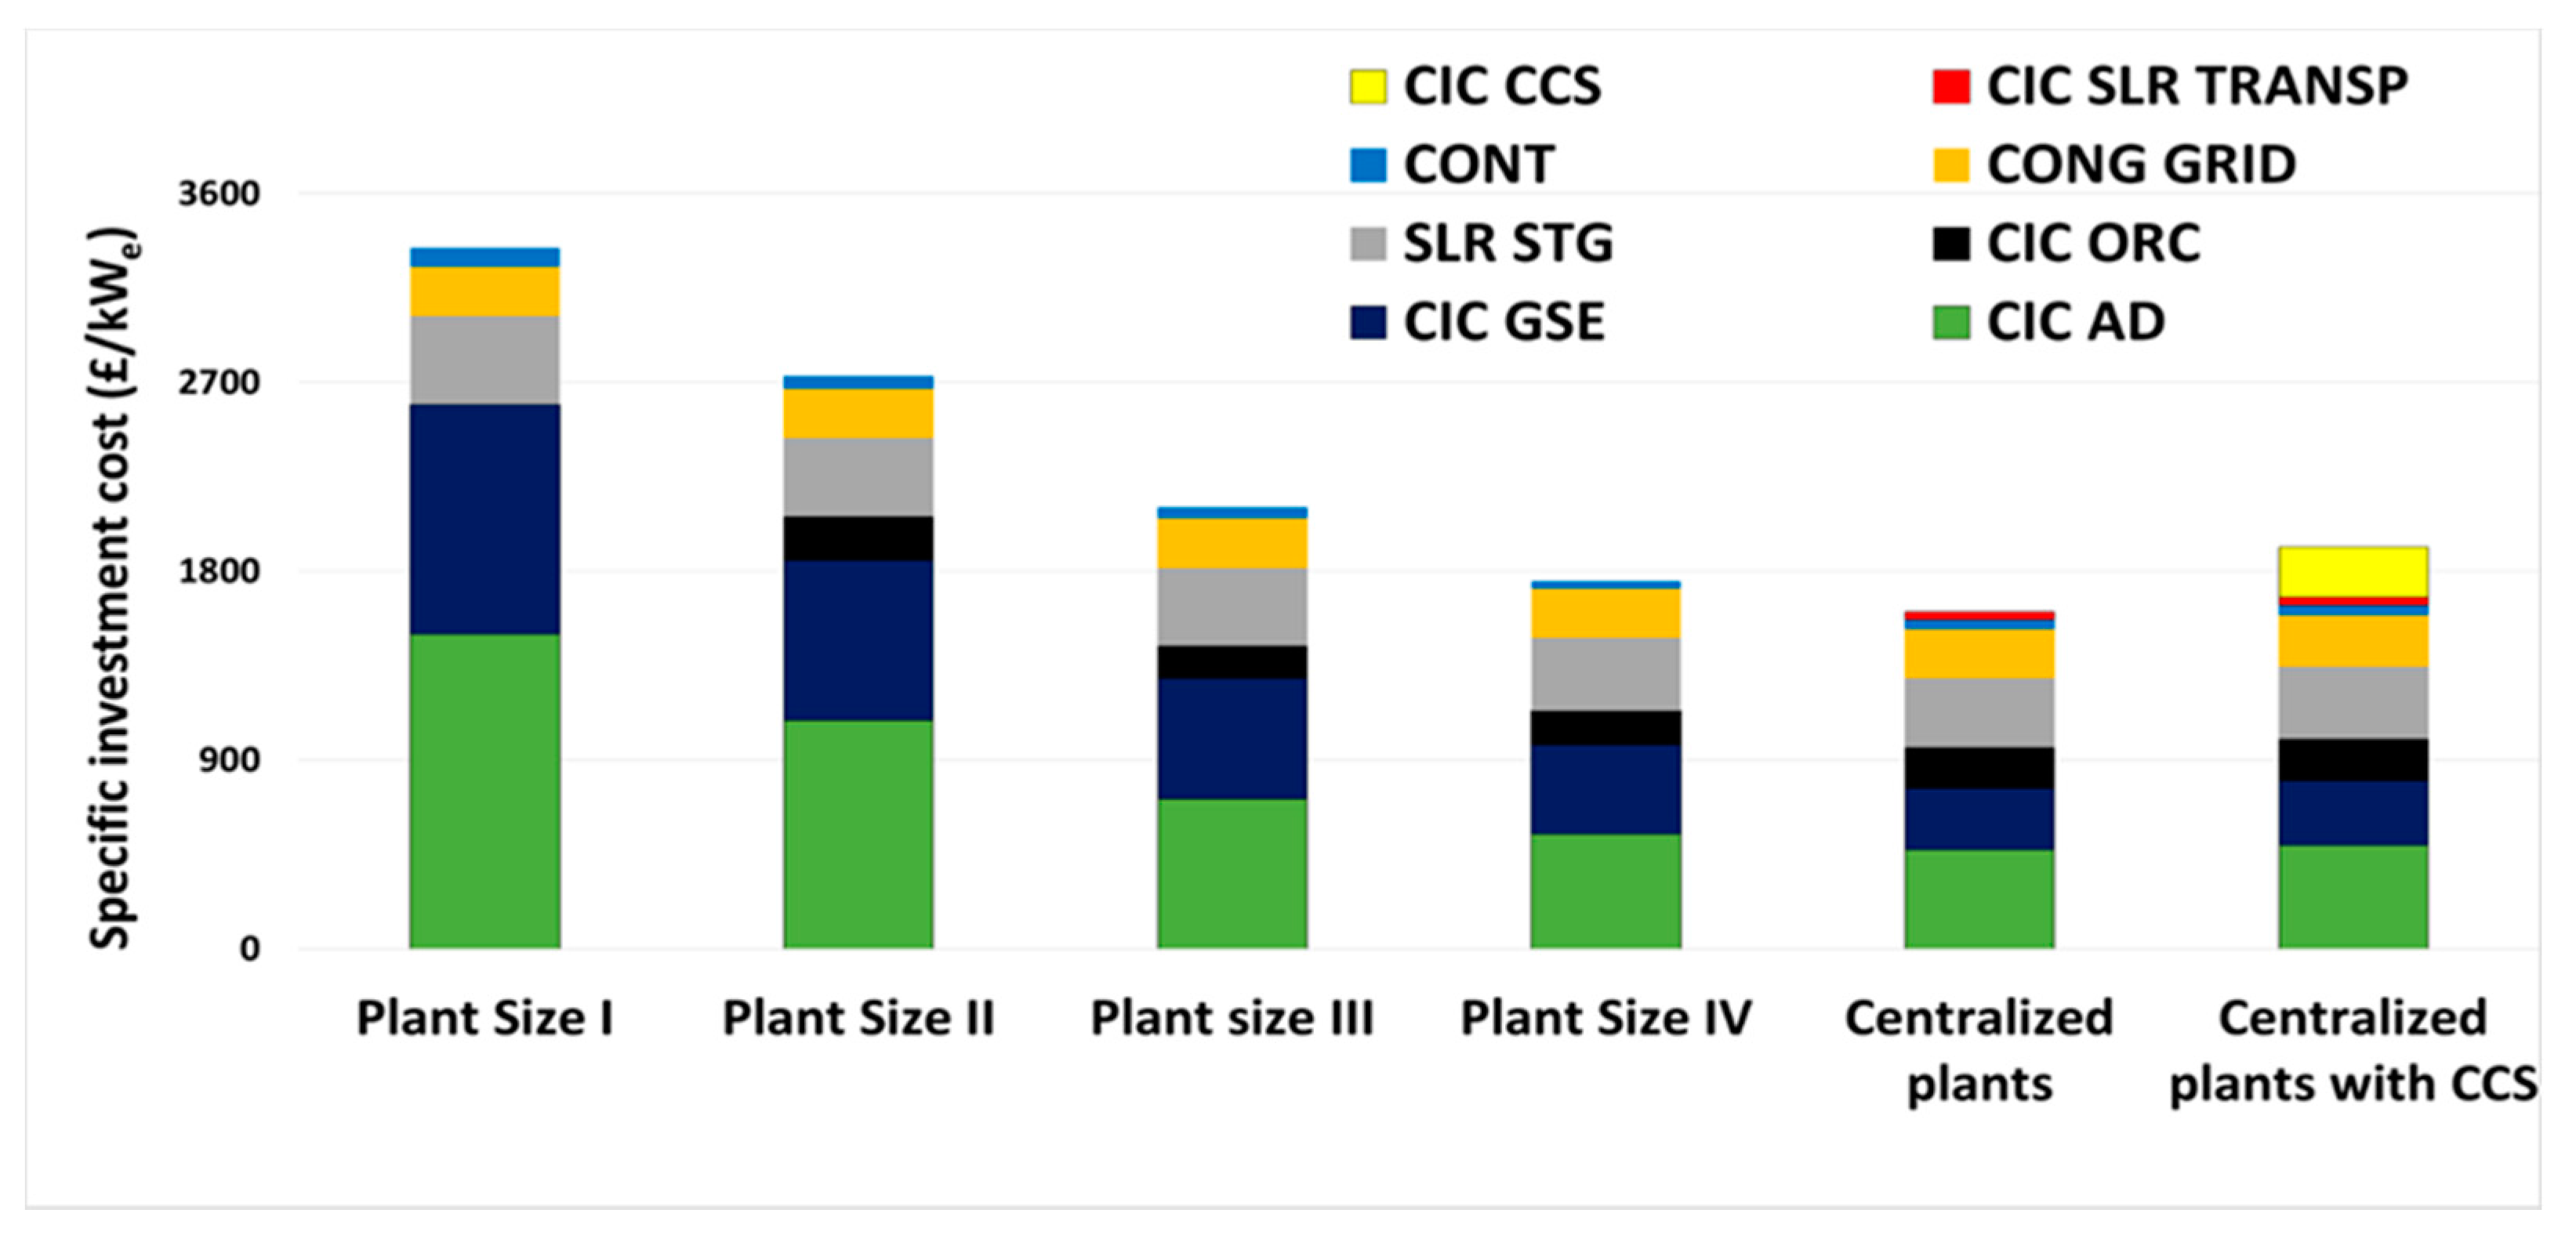
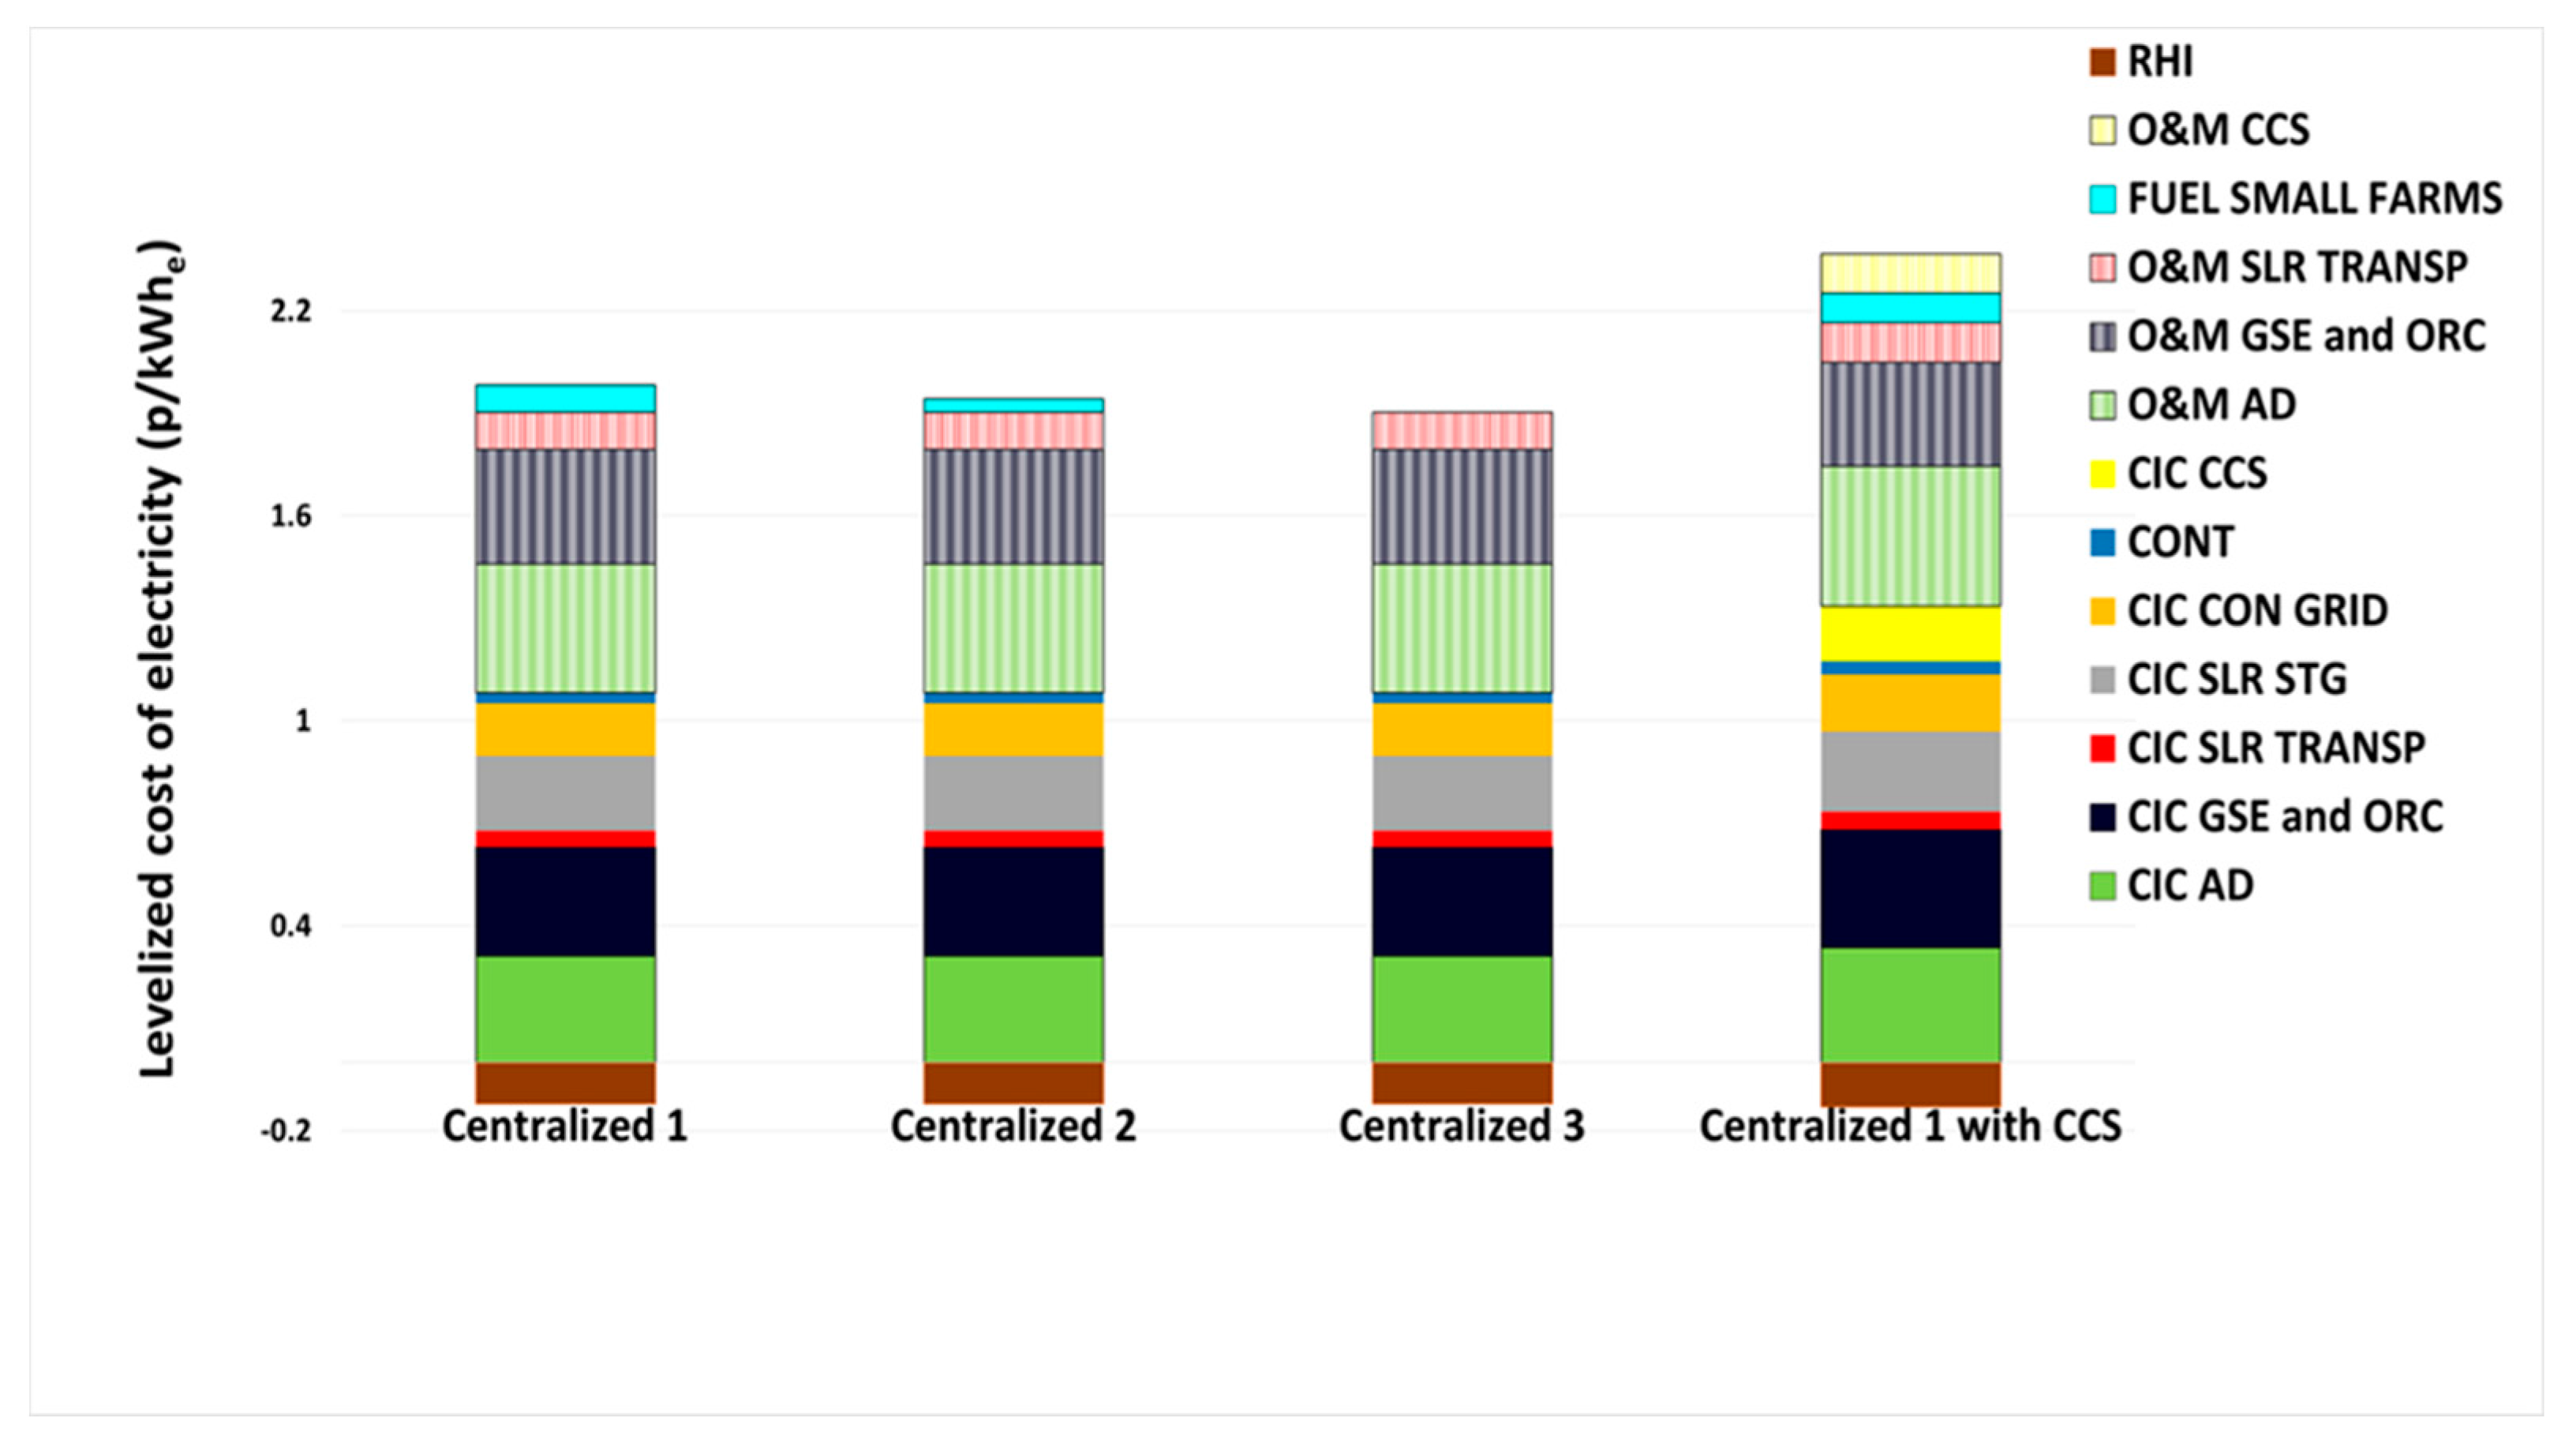
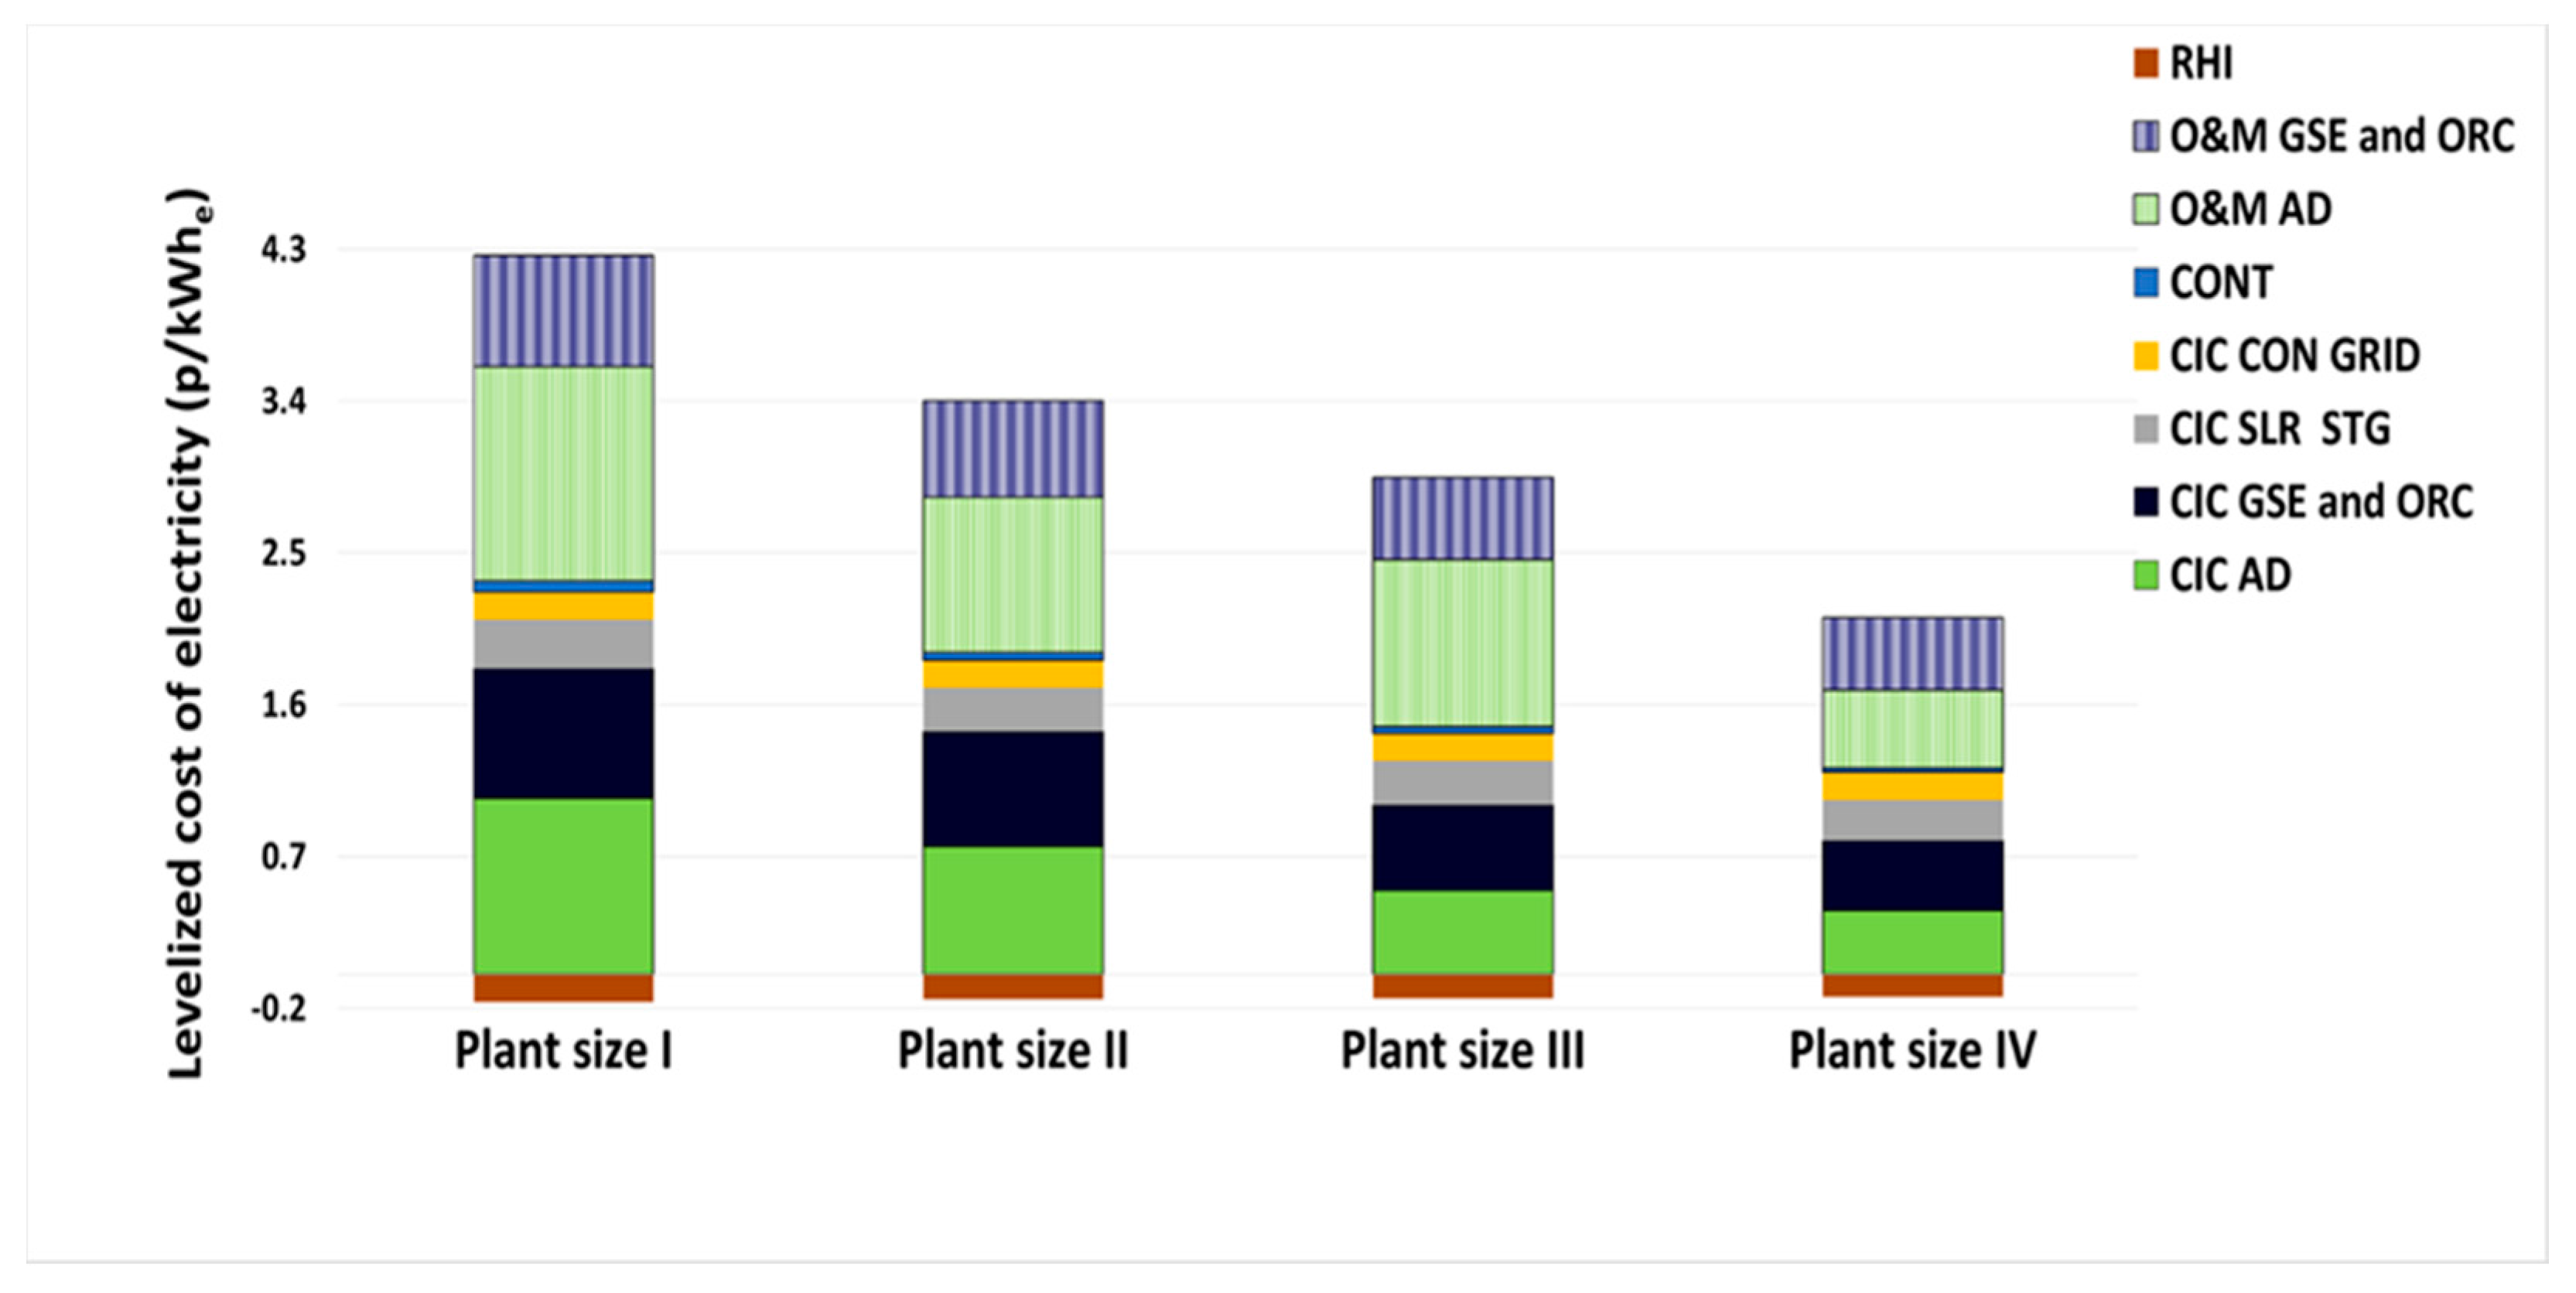
3.2. Economic Indicators

Figure 3 presents the specific investment cost per installed power for the different plant sizes. Lower specific investment costs were obtained for larger AD-CHP plants. This is consequence of the fact that that the increase of the capital investment cost follows a non-linear relationship with an exponent lower than 1, while the electrical power output increases linearly with power system size. It could be observed that the AD reactor makes the largest contribution to the specific capital cost, followed by the specific capital investment cost for the gas engine and the ORC systems.
Figure 4 displays the levelized cost of electricity for the different plant sizes and the individual cost elements that make up the total levelized costs. It is apparent that the Operation and Maintenance costs make the larger contribution, followed by the other major elements of total capital costs. This is because it was assumed that the operation and maintenance cost for the AD reaction system accounted for 7% of the capital investment cost, based on [48,49]. Thus, for a life time of 20 years, the maintenance cost is higher than the capital investment cost for the reactor. Negative cost contributions are presented in the plot as a consequence of the payment for heat generation used for the supply of thermal energy for the farms (RHI).
These results indicated that different feed-in tariffs should be required according to the scale of the generators. In the UK, three feed-in tariff ranges exist for electricity generation using biogas from AD. For those plants with an installed capacity that is lower than 250 kWe, the revenues per kWhe is around 6.24 p/kWhe. For the plants in which the installed capacity is between 250 and 500 kWe, the feed-in tariff is 5.90 p/kWhe and close to 2.24 p/kWhe for plants larger than 500 kWe [10]. Based on this scale and the estimated power generation, it was concluded that Plant Sizes I, II, and III would be under the first tariff group, Plant Size III suited the second tariff group, whilst Plant Size IV and the centralized plants were part of the third tariff scheme. It must be noted however that these feed in tariffs have been revised by the UK government since the beginning of this research. Significant differences were reported for the feed-in tariff scheme in the case of plants with installed capacity from 500 to 500 kWe since the tariff was close to 5.76 p/kWhe until 31 March 2017.
Under the new tariff scheme, the feed in tariff was 173%, 217%, and 238% higher than the levelized cost of electricity when analyzing Plant Sizes I, II, and III. For Plant Scale IV, under the revised tariff scheme, the feed in tariff was only 13% higher than the estimated LCOE, however, until March 2017, the feed in tariff would have been 299% higher than the LCOE.
The economic performance of a centralized plant was also assessed in this article. The operation of this kind of plant requires slurry feedstock from small farms. These farms could use the slurry as feedstock for the deployment of their own AD plants or as fertilizer, and thus different scenarios were considered to economically compensate for their waste. Economic compensations for the small farms lead to operative costs for the centralized plants. Three possible compensation schemes for the small farms were analyzed in this article, being named Centralized Scheme 1, Centralized Scheme 2, and Centralized Scheme 3.
In Centralized Scheme 1, it was assumed that the centralized plants offered free generation fee electricity and 100% fuel subsidy for the small farms. In Centralized Scheme 2, it was considered that the large plant provided free generation fee electricity and covered 50% of the fuel costs of the smaller farm for the supply of the slurry. In Centralized Scheme 3, the large plant only provided free generation fee electricity to the smaller farms supplying the slurry. Figure 5 shows the levelized cost of electricity for the centralized plant options.
It can be appreciated that the main cost difference between Centralized Schemes 1, 2, and 3, is associated with the level of fuel subsidy to the individual farms supplying the slurry. Considering the tariff scheme valid since April 2017, the feed-in tariff for Centralized I plant was 25.7% larger than its LCOE, 28.3% higher than the LCOE for Centralized II, and 31.0% higher than the corresponding LCOE for Centralized III. Using the scheme valid until April 2017, the feed in tariff would have been 290% higher than the LCOE for Centralized I, 297% higher for Centralized II and 303% larger for Centralized III.
For the Centralized option with CCS, a larger contribution of the capital investment costs for the AD reactor and for the gas engine can be observed in comparison with the other centralized pants under study. This is due to the fact that less electricity is generated (lower power generation output leads to a higher levelized cost of electricity for the same capital investment cost). Under the current scheme, the feed-in tariff is approximately 5% larger than the levelized cost for this plant configuration, whilst the feed-in tariff valid until 31 March 2017 was 276% higher than the levelized cost of electricity.
The comparison between the levelized cost and the feed-in tariff could be analyzed both from the generator and state prospective. From the generator prospective, the feed-in tariff should be designed so that the margin of profits enables a quick payback time, thus it should lead to a larger ratio between the feed in tariff and the levelized cost of electricity. From a state-based prospective, high feed-in tariffs for small scale plants would involve a larger payment to obtain the same power output than if a large scale plant or an AD centralized plant were considered. Consequently, a good solution would be to consider schemes like Centralized 1, 2, and 3, in which small farms supplying slurry can get economic compensation and power generation takes place in more efficient plants.

4. Discussions

The purpose of this section is to undertake a critical analysis of the possible sources of uncertainties associated with the assumptions and models employed for the techno-economic assessment of the AD CHP plants. This section is also intended to analyze how the results in here presented for the UK could be generalized to other national contexts, and to give suggestions for the design of incentive policy.
In this article, the use of dairy cow slurry as feedstock for AD plants was considered. The total solid content ranges from 2 to 11% based on the information presented in literature [35,36]. In this work, a total content of 10% was assumed, however this wide variability may lead to different biogas yields per mass unit of slurry and consequently to different power outputs.
Biogas yield was quantified using the Boyle–Buswell equation (stoichiometric conversion) and considering that the total content of volatile solid could be biologically degraded, this modelling assumption and the employed methodology could have caused an overestimation of the produced biogas in the AD plant.
Capital cost estimations were undertaken using data from existing plants and vendors, thus they can be considered to be representative of the technologies under investigation. The capital investment cost for the anaerobic digester was quantified using published correlations based on quotes for existing plants in the UK. Gas engine costs were evaluated using cost correlations for biogas fueled engines on the range of power outputs for the plants under study. Costs for ORC cycles were accounted using data from suppliers. Digestate storage cost figures were based on information provided by studies undertaken by DEFRA in which values per stored cubic meter of slurry/digester were presented, these values are purely technology dependent, being constant for different capacities. Data from currently operating AD-CHP plants was used for the estimation of the capital cost of connection to grid infrastructure, the reported specific investment cost (£/kWe) was considered to be constant for all the plant sizes. Contingency and engineering work was also accounted for, assuming 3% for the different scale sizes. Digestate storage, connection to the grid, and contingency and engineering work are the costs that may exhibit the largest uncertainty, however they just represent between 7 to 13% of the levelized cost of electricity for these plants. It must be noted that cost for general infrastructure for the plants has not been included as part of the economic assessment, however its contribution is expected not to change the observed cost trends that are mainly driven by the AD reactor and the power generation train.
Results presented in this article are valid for the UK context, in terms of feedstock, costs, and comparison with currently paid incentives. Feedstock composition is a function of the dairy cow feeding system that can be country or region specific. National context mainly influences the operating and maintenance costs, especially when assessing centralized plants for which livestock territorial density and farm size may differ.
Despite differences underlined in the previous paragraph, trends in terms of comparative assessment of individual plant sizes are expected to be similar to the ones presented in this work, when the same methodology was employed for the techno-economic performance of AD-CHP plants. This is because the influence of equipment size on capital investment cost is likely to follow regressions with an exponent lower than 1 (based on data from quotes or process and cost simulations), however, increases in installed capacity lead to linear increases of the power output and thus lower investment and levelized costs. Feed-in tariffs in other countries such as Germany [63] are higher for small scale plants, thus confirming that specific investment costs and levelized costs for smaller plants are higher than for larger plants since the incentive policy is designed to obtain a fixed return rate and a short payback time for the different scales.
In the case of the comparative assessment of centralized plants and individual plants in relatively large scale farms, the generalization of the outcomes of this work to other national contexts may be not so straightforward. Significant differences in terms of economic parameters between the centralized plants and Plant Size 1, 2, and 3 could be observed, however it is difficult a priori to define what may happen when comparing with Plant Size 4. This is because it will depend on the difference of power generation between the two sizes, fuel prices, and distance for slurry transport.
As stated, the incorporation of CO2 capture in AD plants enables power generation with negative CO2 emissions, however it leads to an energy penalty associated with the energy duty for the separation unit. To our understanding, there are no previous works assessing the incorporation of post-combustion solvent based units in AD electricity plants, and thus validation of the results in terms of economic assessment is not possible. Capital investment costs were quantified using values from databases for process equipment and downscaling from technical reports for fossil fuel plants, however, considering the small size of the units, the results for the cost assessment could exhibit considerable uncertainties. Independently of the national context and absolute cost figures, the plant with installed CO2 capture presents a higher levelized cost of electricity in comparison with the Centralized schemes. Thus, similar trends to the ones shown in this paper for the UK context are expected to be observed in other national contexts.
The techno-economic performance for the different plant scales discussed in this paper enables us to understand the need of a size-based feed-in tariff scheme. AD power plants in small plants exhibit higher levelized costs of electricity, thus requiring a larger feed-in tariff to make the technology deployment profitable. From a state budget perspective, the development of AD power plants in larger scales farms would enable one to obtain the same power output with a lower economic compensation. The centralized plant options presented in this work can then be considered a trade-off solution in terms of employing higher efficiency power generation devices, lower levelized cost of electricity, use of waste from small farms, and economic valorization of this waste. Considering the scale of the centralized plants, the incorporation of CO2 capture units could be more feasible than in small plants, allowing negative CO2 emission power plants. The results presented in this paper are expected to be a guide for stakeholders interested in the deployment of AD plants and for governments in their design of incentive policy.

5. Conclusions

In this study, the techno-economic feasibility of using biogas for electricity production was investigated for different AD plant sizes. Reciprocating gas engines in combination with Organic Rankine Cycle systems for electrical power generation were considered for different biogas thermal input ranges. The following conclusions can be drawn:
  • For the larger scale plants, a larger electrical efficiency was observed which led to higher power production per mass of bio-degradable waste and a lower levelized cost of electricity for AD power plants.
  • The combination of the slurry from different farms for AD and power generation in centralized, large capacity systems enables more efficient heat and power generation that increases the economic viability of these systems.
  • Analysis of the techno-economic feasibility of the introduction of CO2 capture and storage processes in AD-based electricity generation showed that it is possible to achieve negative CO2 emission power production with the potential for economic benefits helped by incentives currently on offer in the UK.

Acknowledgments

The authors would like to acknowledge the funding received from the Research Councils UK (RCUK) and particularly the Engineering and Physical Sciences Research Council (EPSRC) under Grant Number: EP/K011820/1 (Centre for Sustainable Energy Use in Food Chains-CSEF) and EP/M007359/1 (Recovery and re-use of energy, water and nutrients from waste in the food chain-Redivivus). All data used in the study and results are provided in full in the results section of this paper. Any additional data or information can be obtained from the authors.

Author Contributions

Gabriel D. Oreggioni, Baboo Lesh Gowreesunker and Savvas Tassou conceived and designed the research question and effectuated and verified the technical and economic estimations for the different sized power plants. Gabriel D. Oreggioni was the researcher on charge of the paper writing; having received feedback from the different co-authors. Giuseppe Bianchi provided technical guidance and cost data for the assessment of the ORC cycles incorporated in the plants. Matthew Reilly, Marie E. Kirby, Trisha A. Toop and Mike K. Theodorou contributed to this manuscript with their know how in dairy farms, slurry storage technologies and practical application of AD processes; by verifying and suggesting input data and by revising the article.

Conflicts of Interest

The authors declare no conflict of interest. The founding sponsors had no role in the design of the study; in the collection, analyses, or interpretation of data; in the writing of the manuscript, and in the decision to publish the results.

Nomenclature

AbbreviationMeaning
ADAnaerobic Digestion.
AD RV Anaerobic Digester (reactor volume)
CEPCIChemical Engineering Plant Cost Index
CICCapital investment cost (£/kWe)
CCSCarbon capture and storage
CON GRIDConnection to the grid
CONTContingency and engineering costs (£)
DEFRAUK Department of Environment, Food and Rural Affairs
FUEL TRANSPFuel transport
GSEGas engine
hpHorse power
HDPEHigh-density polyethylene
LLitter
MEAMono-ethanol amine
LCOELevelized cost of electricity(£/kWh)
O&MOperation and maintenance costs (£/year)
ORCOrganic Rankine cycle
pPence
Power   ( kW e ) GSE Power output gas engine (kWe)
Power   ( kW e ) ORC Power output organic Rankine cycle(kWe)
PSAPressure swing adsorption
rDiscount/interest rate for the estimation of levelized cost of electricity (Equation (7))
RHIRenewable heat incentive
SICSpecific investment cost (£/kWe)
SLR.STGSlurry storage
SLR.TRANSP.Slurry transport
VSVolatile solid content in the slurry
UKUnited Kingdom
Subscripts
biogasBiogas
eRefers to electricity
hHour
inputSubscript to refer to thermal inputs for electricity generation devices
nSubscript to refer to a given year in power plant operation
RVReactor Volume
SLRSlurry
thThermal (in general thermal input)

References

  1. Kaparaju, P.; Vija, V.K.; Läntelä, J. Case and Feasibility Studies of Small-Scale Upgrading in Europe and India; Valorgas: Southampton, UK, 2010. [Google Scholar]
  2. Batstone, D.J.; Keller, J.; Angelidiaki, I.; Kalyuzhnyi, S.V.; Pavlostathis, S.G.; Rozzi, A.; Sanders, W.T.M.; Siegrist, H.; Vavlin, V.A. Anaerobic Digestion Model No 1; IWA Task Group for Mathematical Modelling of Anaerobic Digestion Process: London, UK, 2001. [Google Scholar]
  3. Drosg, B.; Fuchs, W.; Al Seadi, T.; Madsen, M.; Linke, B. Nutrient Recovery by Biogas Digestate Processing; IEA Bioenergy: Paris, France, 2015. [Google Scholar]
  4. International Energy Agency (IEA). Energy Technology Perspectives; IEA: Paris, France, 2010. [Google Scholar]
  5. Schakel, W.; Meerman, H.; Talaei, A.; Ramirez, A.; Faaij, A. Comparative life cycle assessment of biomass co-firing plants with carbon capture and storage. Appl. Energy 2014, 131, 441–467. [Google Scholar] [CrossRef]
  6. Carpentieri, M.; Corti, A.; Lombardi, L. Life cycle assessment (LCA) of an integrated biomass gasification combined cycle (IGCC) with CO2 removal. Energy Convers. Manag. 2005, 46, 1790–1808. [Google Scholar] [CrossRef] [Green Version]
  7. European Biogas Association. Annual Report; European Biogas Association: Bruxelles, Belgium, 2015. [Google Scholar]
  8. Gowreesunker, B.L.; Tassou, S.A. Energy generation potential of anaerobic digestion from the food and farming wastes of the UK food chain. Renew. Bioresources 2014, 2, 1–6. [Google Scholar] [CrossRef]
  9. Anaerobic Digestion and Bioresources Association (ADBA). Anaerobic Digestion Market Report; ADBA: London, UK, 2015. [Google Scholar]
  10. Office of Gas and Electricity Markets (OFGEM). Feed in Tariff Rates. Available online: https://www.ofgem.gov.uk/environmental-programmes/fit/fit-tariff-rates (accessed on 21 August 2017).
  11. OFGEM. Non-Domestic Renewable Heat Incentive (RHI). Available online: https://www.ofgem.gov.uk/environmental-programmes/non-domestic-rhi (accessed on 21 August 2017).
  12. Hopwood, L. Farm-Scale Anaerobic Digestion Plant Efficiency; National Non-Food Crops Centre (NNFCC): York, UK, 2011. [Google Scholar]
  13. Jain, S. Cost Abating Greenhouse Gas Emissions for UK Dairy Farms by Anaerobic Digestion of Slurry. Ph.D. Thesis, University of Southampton, Southampton, UK, 2013. [Google Scholar]
  14. Poliafico, M. Anaerobic Digestion: Decision Support Software. Master’s Thesis, Cork Institute of Technology, Cork, Ireland, 2007. [Google Scholar]
  15. Theofanous, E.; Kythreotou, N.; Panayiotou, G.; Vyrides, I. Energy production from piggery waste using anaerobic digestion: current status and potential in Cyprus. Renew. Energy 2014, 71, 263–270. [Google Scholar] [CrossRef]
  16. 2G Cogeneration. Product Range. Available online: https://www.2-g.com/module/dateidownload/2g_product (accessed on 21 August 2017).
  17. GE Power Generation. Gas Reciprocating Engine. Available online: https://www.geopower.com (accessed on 21 August 2017).
  18. Gewald, D.; Siokos, K.; Karellas, S.; Spliethoff, H. Waste heat recovery from a landfill gas fired power plant. Renew. Sustain. Energy Rev. 2012, 16, 1779–1789. [Google Scholar] [CrossRef]
  19. Lantz, M. The economic performance of combined heat and power from biogas produced from manure in Sweden-A comparison of different CHP technologies. Appl. Energy 2012, 98, 502–511. [Google Scholar] [CrossRef]
  20. Ghafoori, E.; Flynn, P.C. Optimizing the logistics of anaerobic digestion of manure. Appl. Biochem. Biotechnol. 2007, 136, 525–638. [Google Scholar]
  21. Ghafoori, E.; Flynn, P.C. Optimizing the size of anaerobic digesters. Trans. ASABE 2007, 50, 1029–1036. [Google Scholar] [CrossRef]
  22. Ghafoori, E.; Flynn, P.C.; Checkel, M.D. Carbon credits required to make manure biogas plant economics. Int. J. Green. Energy 2007, 4, 339–349. [Google Scholar] [CrossRef]
  23. Independent Police Complaints Council (IPCC). Anthropogenic and Natural Radiative Forcing. In Fifth Assessment Report (AR5); IPCC: Geneva, Switzerland, 2013. [Google Scholar]
  24. IEA. Energy Technology Perspectives: Scenarios and Strategies to 2050; IEA: Paris, France, 2010. [Google Scholar]
  25. Azar, C.; Lindgren, K.; Obersteiner, M.; Riahi, K.; Van Vuuren, D.P.; Michel, K.; Den Elzen, G.J.; Mollersten, K.; Larson, E.D. The feasibility of low CO2 concentration targets and the role of bio-energy with carbon capture and storage (BECCS). Clim. Chang. 2010, 100, 195–202. [Google Scholar] [CrossRef]
  26. Rogelj, J.; Hare, W.; Lowe, J.; Van Vuuren, D.P.; Riahi, K.; Matthews, B.; Hanaoka, T.; Jiang, K.; Meinshausen, M. Emission pathways consistent with a 2 °C global temperature limit. Clim. Chang. 2011, 1, 413–418. [Google Scholar] [CrossRef]
  27. IEA. CO2 Capture from Medium Scale Plants; IEA: Paris, France, 2017. [Google Scholar]
  28. IPCC. Special Report on Carbon Dioxide Capture and Storage; IPCC: Geneva, Switzerland, 2005. [Google Scholar]
  29. Markewitz, P.; Kuckshinrichs, W.; Leitner, W.; Linssen, J.; Zapp, P.; Bongartz, R.; Schreiber, A.; Muller, T. Worldwide innovations in the development of carbon capture technologies and the utilization of CO2. Energy Environ. Sci. 2012, 5, 7281–7305. [Google Scholar] [CrossRef] [Green Version]
  30. Ahn, H.; Luberti, M.; Liu, Z.; Brandani, S. Process configuration studies of the amine capture process for coal-fired power plants. Int. J. Greenh. Gas Control 2013, 16, 29–40. [Google Scholar] [CrossRef]
  31. Rochelle, G.T. Amine Scrubbing for CO2 Capture. Science 2009, 325, 1652–1654. [Google Scholar] [CrossRef] [PubMed]
  32. Sanchez Fernandez, E.; Goethe, E.L.F.; Manzolini, G.; Rezvani, S.; Vlugt, T.J.H. Thermodynamic assessment of amine based CO2 capture technologies in power plants based on European Benchmarking Task Force methodology. Fuel 2014, 129, 318–329. [Google Scholar] [CrossRef]
  33. DEFRA. Maps of Livestock Populations in 2000 and 2010 across England. Available online: https://www.gov.uk/government/uploads/system/uploads/attachment_data/file/183109/defra-stats-foodfarm-landuselivestock-june-detailedresults-livestockmaps111125.pdf (accessed on 21 August 2017).
  34. Dairy, Co. Cost Effective Slurry Storage Strategies on Dairy Farm; Agriculture & Horticulture Development Board: Warwickshire, UK, 2010. [Google Scholar]
  35. MidWest Plan Service (MWPS). Manure Characteristics: Manure Management System Series; MWPS: Ames, IA, USA, 2004. [Google Scholar]
  36. SWARM Hub. Manure Analysis—Is Slurry Just Slurry? Available online: https://www.swarmhub.co.uk/index.php?dlrid=4319 (accessed on 21 August 2017).
  37. Nijaguna, B.T. Biogas Technology; New Age International: Delhi, India, 2002. [Google Scholar]
  38. ECN. Phyllis Database 2014. Available online: https://www.ecn.nl/Phyllis (accessed on 21 August 2017).
  39. Boyle, W.C. Energy recovery from sanitary landfills. In Microbial Energy Conversion; Schlegel, H.G., Barnea, J., Eds.; Pergamon Press: Oxford, UK, 1977; pp. 119–138. [Google Scholar]
  40. RENEW. Renewable Fuels for Advanced Powertrains. Optimum Processing Route for FT Synthesis. In Flue Gas Cleaning Deliverable. Available online: http://www.renew-fuel.com/fs_documents.php (accessed on 21 August 2017).
  41. GE Power Generation. Wauskesha VHP Series Engine and Generators. Available online: https//powergen.geopower.com/products/reciprocating-engines/waukesha-vhp.html (accessed on 21 August 2017).
  42. Aspentech. Aspen Hysys. Available online: http://home.aspentech.com/products/engineering/aspen-hysys (accessed on 21 August 2017).
  43. Oreggioni, G.; Brandani, S.; Luberti, M.; Baykan, Y.; Friedrich, D.; Ahn, H. CO2 capture from syngas by an adsorption process at a biomass gasification CHP plant: Its comparison with amine-based CO2 capture. Int. J. Greenh. Gas Control 2015, 35, 71–81. [Google Scholar] [CrossRef]
  44. Ekwonu, M.C.; Perry, S.; Oyedoh, E.A. Modelling and simulation of gas engines using Aspen HYSYS. J. Eng. Sci. Technol. 2013, 6, 1–4. [Google Scholar]
  45. Peebles, R.W.; Reinemann, D.J.; Straub, R.J. A modular computer model for milking center energy use. In Proceedings of the International Winter Meeting of the American Society of Agriculture Engineers, Chicago, IL, USA, 14–17 December 1993. [Google Scholar]
  46. Dunn, P.; Butler, G.; Bilsborrow, P.; Brough, D.; Quinn, P. Energy Efficiency, Renewable Energy and Energy Efficiency Option for UK Dairy Farms; Newcastle University: Callaghan, Australia, 2010. [Google Scholar]
  47. Berglund, M.; Borjesson, P. Assessment of energy performance in the life-cycle of biogas production. Biomass Bioenergy 2006, 30, 254–266. [Google Scholar] [CrossRef]
  48. Kottner, M.; Kusch, S.; Kaiser, A.; Dorrie, D.; Collins, D. Economic Modelling of Anaerobic Digestion/Biogas Installation in Arrange of Rural Scenarios in Cornwall; International Biogas and Bioenergy Centre of Competence: Kirchberg, Germany, 2008. [Google Scholar]
  49. Redman, G.A. Detailed Economic Assessment of Anaerobic Digestion Technology and Its Sustainability to UK Farming and Waste Systems; The Anderson Centre: Leicestershire, UK, 2010. [Google Scholar]
  50. ASUE. BHKW-Kenndaten 2005, Module Anbieter Kosten. Available online: http://www.asue.de/sites/default/files/asue/themen/blockheizkraftwerke/2005/broschueren/05_05_05_BHKW-Kenndaten-2005.pdf (accessed on 21 August 2017).
  51. Tchanche, B.F.; Lambrinos, G.; Frangoudakis, A.; Papadakis, G. Low-grade heat conversion into power using organic Rankine cycles—A review of various applications. Renew. Sustain. Energy Rev. 2011, 15, 3963–3979. [Google Scholar] [CrossRef]
  52. Wang, E.H.; Zhang, H.G.; Fan, B.Y.; Ouyang, M.G.; Zhao, Y.; Mu, Q.H. Study of working fluid selection of organic Rankine cycle (ORC) for engine waste heat recovery. Energy 2011, 36, 3406–3418. [Google Scholar] [CrossRef]
  53. Quoilin, S.; Van Den Broek, M.; Declaye, S.; Dewallef, P.; Lemort, V. Techno-economic survey of Organic Rankine Cycle (ORC) systems. Renew. Sustain. Energy Rev. 2013, 22, 168–186. [Google Scholar] [CrossRef]
  54. Bilsborrow, P. Anaerobic Digestion in the UK—An overview; Newcastle University: Callaghan, Australia, 2011. [Google Scholar]
  55. FP7—ENERGY. CAESAR Project: European Best Practice Guidelines for Assessment of CO2 Capture Technologies. Politecnico di Milano-Alstom UK. Available online: http://www.energia.polimi.it/new/D%204_9%20best%20practice%20guide.pdf (accessed on 21 August 2017).
  56. Matches Process Equipment Cost Estimates. Available online: https://www.matche.com/equipcost/Default.html (accessed on 21 August 2017).
  57. DECC. Electricity Generation Costs; Department of Energy & Climate Change (DECC): Aberdeen,UK, 2013. Available online: https://www.gov.uk/government/publications/decc-electricity-generation-costs-2013.
  58. 2G. Technical Specification Filius 204. Available online: https://logicenergy.net/images/2g_technical_specification/filius-204-64kw-bg.pdf (accessed on 21 August 2017).
  59. 2G. Technical Specification Filius 206. Available online: http://www.2g-energy.com/media/1809/tsp_filius-206bg_60hz_480v_en.pdf (accessed on 21 August 2017).
  60. 2G. Technical Specification 2G-KWK-250BGG. Available online: http://www.eko-star.eu/doc/2G-kwk250bg.pdf (accessed on 21 August 2017).
  61. 2G. Technical Specification Avus 500. Available online: www.eko-star.eu/doc/2G-avus500bbg.pdf (accessed on 21 August 2017).
  62. 2G. Technical Specification avus1500b. Available online: http://www.eko-star.eu/doc/2G-avus1500b.pdf (accessed on 21 August 2017).
  63. German Energy Blog. German Feed-in Tariffs 2014 (from08). Available online: http://www.germanenergyblog.de/?page_id=16379 (accessed on 21 August 2017).
Figure 1. DEFRA livestock map for the area under study.
Energies 10 01396 g001
Figure 2. Specific electricity generated per kg VS.
Energies 10 01396 g002
Figure 3. Specific investment cost for the different plant sizes.
Energies 10 01396 g003
Figure 4. Levelized cost of electricity for the different individual plant sizes.
Energies 10 01396 g004
Figure 5. Levelized cost of electricity for the different centralized schemes.
Energies 10 01396 g005
Table 1. Physical and chemical properties for dairy cow slurry.
Dairy Cow Slurry Physical and Chemical Properties
Proximate analysis
(weight percentage)
Ultimate analysis
(dry and ash free) 3
Total solid content (%)10.0 1Carbon (%)58.62
Volatile solid content (%)8.0 2Hydrogen (%)7.69
Nitrogen (%)2.92
Sulphur (%)0.27
Oxygen(%)30.50
1 Assumed, based on reports and lab analysis for dairy cow slurry [35,36]; 2 Considering that 80% of the total solid content of the slurry can be considered volatile solid content [37]; 3 Ultimate analysis presented in [38] for dry and ash free slurry.
Table 2. Biogas flowrate and mole fractions for main components.
Biogas Flow-Rate and Composition
Raw bio-gas“Cleaned bio-gas”
Bio-gas flow-rate (kg/kg VS)1.75Bio-gas flow-rate (kg/kg VS)1.73
Mole Fraction
CH455.6CH457.3
CO240.1CO241.2
NH34.1NH31.5
H2S0.16H2S0.02
Table 3. Energy consumption and biogas yield for the different plant scale under study.
Scale Plant IScale Plant IIScale Plant IIIScale Plant IVCentralized Plants
Herd characteristics
Herd size (cows)12525050010002670
Cow slurry per day (kg/day)662513,25026,50053,000141,510
Biogas flow inlet to turbo-machinery
Biogas flow rate (kg/day)92518513702740419,770
Digestate
Digestate (kg/s)569911,39922,80045,596121,740
AD energy consumption
Electricity consumption (kW)2.04.08.016.042.5
Heat consumption (kW)3.26.412.825.668.5
Farm energy consumption
Heat demand (kW)1.92.54.08.025.8
Power demand (kW)1.93.87.414.846.1
Table 4. Technical performance indicators for the different plant sizes and machinery.
Technical Performance IndicatorsPlant Size IPlant Size IIPlant Size IIIPlant Size IVCentralizedCentralized CCS
Gas Engine (GE)
Thermal input (kW)178.4356.7713.51427.03810.53810.5
ModelFilius 204 [58]Filius 206 [59]Patruus 2G KWK 370 [60]Avus 500 [61]Avus 1500b [62]Avus 1500b [62]
GE: electrical efficiency (%)36.138.238.840.542.242.2
Power output (kW)64.4136.3276.8577.91608.01608.0
Organic Rankine cycles (ORC)
Thermal input (kW)-107.9196.4376.3847.0_
ORC: electrical efficiency (%)-6.06.810.114.5-
Power output (kW)-6.513.438.0122.8-
Overall plant performance
Power generation gas engine and ORC (kW)64.4142.8290.2615.91730.81608
Power consumption herd/s (kW)1.93.87.414.846.146.1
Power consumption AD (kW)2.04.08.016.042.542.5
Power CO2 compression (kW)-----106.8
Net power output (kW)60.5135.0274.8584.71642.21412.6

