Factors Contributing to Haze Pollution: Evidence from Macao, China


1
School of Business, Macao Polytechnic Institute, Macao, China
2
Department of Logistics and Maritime Studies, The Hong Kong Polytechnic University, Hong Kong, China
*
Author to whom correspondence should be addressed.
Energies 2017, 10(9), 1352; https://doi.org/10.3390/en10091352
Submission received: 17 July 2017
/
Revised: 4 September 2017
/
Accepted: 6 September 2017
/
Published: 7 September 2017
Abstract
:Haze is a major environmental concern in many cities because it adversely affects people’s physiological and psychological well-being. This paper examines the extent of haze in Macao during the period 1986–2016. It identifies the relationships between haze, energy use, and meteorological conditions directly. The haze in Macao changed over the period 1986–2016 with air pollution getting worse and then improving after 2007. Specifically, the number of haze hours increased from 3 in 1986 to 766 in 2007, and then dropped to 57 in 2016, while the total energy use increased from 12,246 TJ in 1986 to 37,144 TJ in 2007, and then to 42,405 TJ in 2016. As per primary energy, Macao used 12,096 TJ in 1986, 21,388 TJ in 2007, and 16,647 TJ in 2016 excluding aviation kerosene. Bivariate correlations show that haze was most positively and significantly associated with annual primary energy use. Multiple regression analysis indicates that the number of hours with haze was significantly, positively related to the consumption of gas oil/diesel, fuel oil, and natural gas in Macao and aviation kerosene. Nevertheless, the improvement in Macao could come at a cost to areas in downwind of Zhuhai’s coal power stations supplying Macao’s electricity energy.
1. Introduction
The population of the world’s cities has been increasing steadily, and so have the numbers of high-rise commercial and residential buildings, shopping malls, buses, coaches, and private vehicles in each of these cities. Since the operations of all buildings and vehicles demand energy, the consumption of primary energy sources such as gasoline, gas oil/diesel, kerosene, fuel oil, liquefied petroleum gas, and natural gas, and secondary energy such as electricity have been increasing rapidly. On the other hand, people in the cities are exposed to and complain about poor visibility and conditions of haze [1,2,3,4]. Farjardo et al. [1] explored young people’s opinions on visibility in Beijing. They found that about 95 percent of respondents indicated visibility in Beijing to be important or very important. Mao et al. [2] suggested that haze including its particulate matter can be considered as the main cause of chronic cough in China. Xiao et al. [4] indicated that haze episode in Beijing and most of the eastern region in China in 2013 forced the government to improve energy consumption structure by increasing the proportion of clean energy sources. Thach et al. [5] studied the relationship between poor visibility and public health issues such as mortality in Hong Kong. Mace et al. [6] explored the association between visibility and psychological reactions in US national parks while Othman et al. [7] reported that the occurrence of smoke haze was associated with an increase in inpatient cases by as much as 31 percent in comparison to a normal day in Malaysia. Zhang et al. [3] explored the relationship between haze and daily hospital admissions in Guangzhou using generalized additive model. They reported that haze was associated with cardiovascular illnesses. These researchers showed that poor visibility and haze adversely affected people’s health physiologically and psychologically. Haze consists mostly of particulate matter and aerosols [8,9,10,11,12]. Jansen et al. [8] collected air samples in Hangzhou, China and found that the contribution of secondary inorganic aerosols to PM2.5 mass increased by around 50 percent during haze episodes. Li et al. [10] collected PM2.5 samples in Nanjing, China, during a severe haze-fog event. They reported that the mass concentrations of metals including Zn, As, Pb, Cd, Mo, and Cu were higher during haze-fog events than those in non-haze fog days. Some metals such as Zn, As, Pb, Cd, and Cu are found in fossil fuels [13] and traffic-related emissions [14]. Guo et al. [12] indicated that non-methane hydrocarbons are amongst the key ozone precursors, which can cause haze episodes in urban areas. Guo et al. [12] also noted that non-methane hydrocarbons may come from gasoline evaporation, solvent use, vehicular emission, and natural gas leakage, which are likely the same sources as the metals mentioned by Jansen et al. [8] and Li et al. [10].
Haze is defined as “an aggregation in the atmosphere of very fine, widely dispersed, solid or liquid particles, or both, giving the air an opalescent appearance that subdues colors” [15]. In cities, air pollutants from a diverse range of sources disperse in the atmosphere and merge into a featureless, uniform layer of haze that adversely affects visibility [15] and causes mild to moderate psychological stress [16]. The American Meteorological Organization describes haze as a mixture of aerosols and particles suspended in air, reducing visibility by scattering light while the World Meteorological Organization has yet to establish a classification of haze densities [17]. The Macao Meteorological and Geophysical Bureau (the Bureau) defines ‘haze’ as the condition under which visibility is equal to, or less than 5 km and relative humidity is less than 80 percent. These parameters are chosen because Macao is a small coastal city with a land area of 30.4 km2 and the distance between the monitoring station and Macao’s border is only slightly larger than 5 km. The Bureau keeps daily records of the numbers of hours with haze. In the 1980s and 1990s, haze hours were recorded by professional meteorologists in the Bureau. Since the Millennium, the number of haze hours was determined by hourly readings from a forward scatter visibility meter and a relative humidity meter. The figures were confirmed by professional meteorologists in the Bureau. Specifically, it has been found that Macao was generally covered by haze almost continuously between September and March, year after year over the past decade [18].
In contrast to past research that had focused on the characterization of haze based on the chemical analysis of samples collected during haze events and the association of haze with the physical and psychological reactions of residents [7,10,11,16], this paper explores the extent of haze in Macao by using long-term time-series data. It also investigates the association between energy use, meteorological conditions, and the numbers of hours with haze in Macao. Understanding the direction and strength of association between energy use, meteorological conditions, and haze should shed light on possible solutions to environmental degradation.
Macao’s Social and Economic Development
Macao was a small tourism city in Asia in the 1980s. It had a land area of about 16 km2 and a population of 0.3 million. After returning to China at the end of 1999, the Government of Macao decided to liberalize the gaming industry in 2002. Since then, casino operators have invested heavily to build mega-casinos, resorts, convention and exhibition centers, shopping malls, and theatres. In recent years, Macao has attracted over 30 million visitors a year. Macao’s population also increased from 0.43 million in 2000 to 0.64 million in 2016. Meanwhile, Macao’s area increased from 25.4 to 30.4 km2 by land reclamation projects. Currently, Macao’s urban density is about 21,000 people per km2 (one of the highest in the world), and this figure increases by 50 percent due to the surge of visitors during weekends and holidays.
2. Method
2.1. Data Sources
All data of this study were official data obtained from government sources. Specifically, the annual energy consumption data were obtained from the Macao Statistics and Census Service [19,20]. The Macao Meteorological and Geophysical Bureau performs real-time measurements of air temperature, atmospheric pressure, and rainfall in its meteorological observation station located at the eastern part of the Grand Taipa Hill (i.e., the central location of Macao). Air temperature was recorded using a calibrated liquid-in-glass thermometer, atmospheric pressure was recorded using a calibrated mercury barometer, and rainfall was recorded using a high-precision rain gauge [21]. As mentioned above, the number of haze hours was determined by hourly readings from a forward scatter visibility meter and a relative humidity meter, and was confirmed by professional meteorologists in the Bureau. Daily records of the number of hours with haze, monthly mean atmospheric pressures, monthly mean air temperatures, and monthly total rainfall figures were obtained from the Macao Meteorological and Geophysical Bureau [22]. To explore whether haze is a cross-border environmental issue from the north, annual haze days in Guangzhou were collected from the online network of Guangzhou Meteorological Bureau [23].
2.2. Stationarity of Time-Series
A time-series can be modeled by an autoregressive (AR) model or its derivative such as an autoregressive moving average (ARMA) model when it is a stationary process. It is known that a stationary time series has a constant mean, a constant variance, and the autocovariance function between two points in the series only depending on the time interval. A typical time-series can be expressed as:
where yt is the variable of interest, ρ is a coefficient, εt is the error, and t is the time index. When ρ = 1, unit root is present and the time-series is not stationary. When |ρ| < 1, the time-series is stationary. The Dickey-Fuller test is a very popular method to determine whether a time-series has a unit root. Sometimes, a time-series can have a trend and it is stationary after removing the trend. Hence, there are three main versions of the Dickey-Fuller test:
- Test for a unit root:where ∆ is the delta operator defined by and β is (ρ − 1).
- Test for a unit root with a drift:where is the drift.
- Test for a unit root with a drift and a deterministic time trend:where is coefficient of the time trend.
Each version of the Dickey-Fuller test has its own critical tau value [24], which depends on the sample size. In each case, the null hypothesis is that there is a unit root and the time series is not stationary, while the alternative hypothesis is that the time series is stationary. In this paper, only the versions (ii) and (iii) of the Dickey-Fuller test were performed because the test version (ii) covered the test version (i).
2.3. Association between Variables
The association between two variables was characterized by Pearson’s correlation coefficient. The coefficient, r, was calculated as
where x and y are values of the variables, and n is the size of dataset.
2.4. Regression Analysis
Multiple regression analysis was employed to assess the relationships between the independent variables and the dependent variable. The accuracy of the identified model was determined by the coefficient of determination, r2. The coefficient provides a measure of how well the collected data are predicted by the model [25]. It was calculated by:
where SSR is the sum of squared regression, SST is the sum of squared total, and SSE is the sum of squared error.
3. Results and Analysis
3.1. Haze and Meteorological Conditions
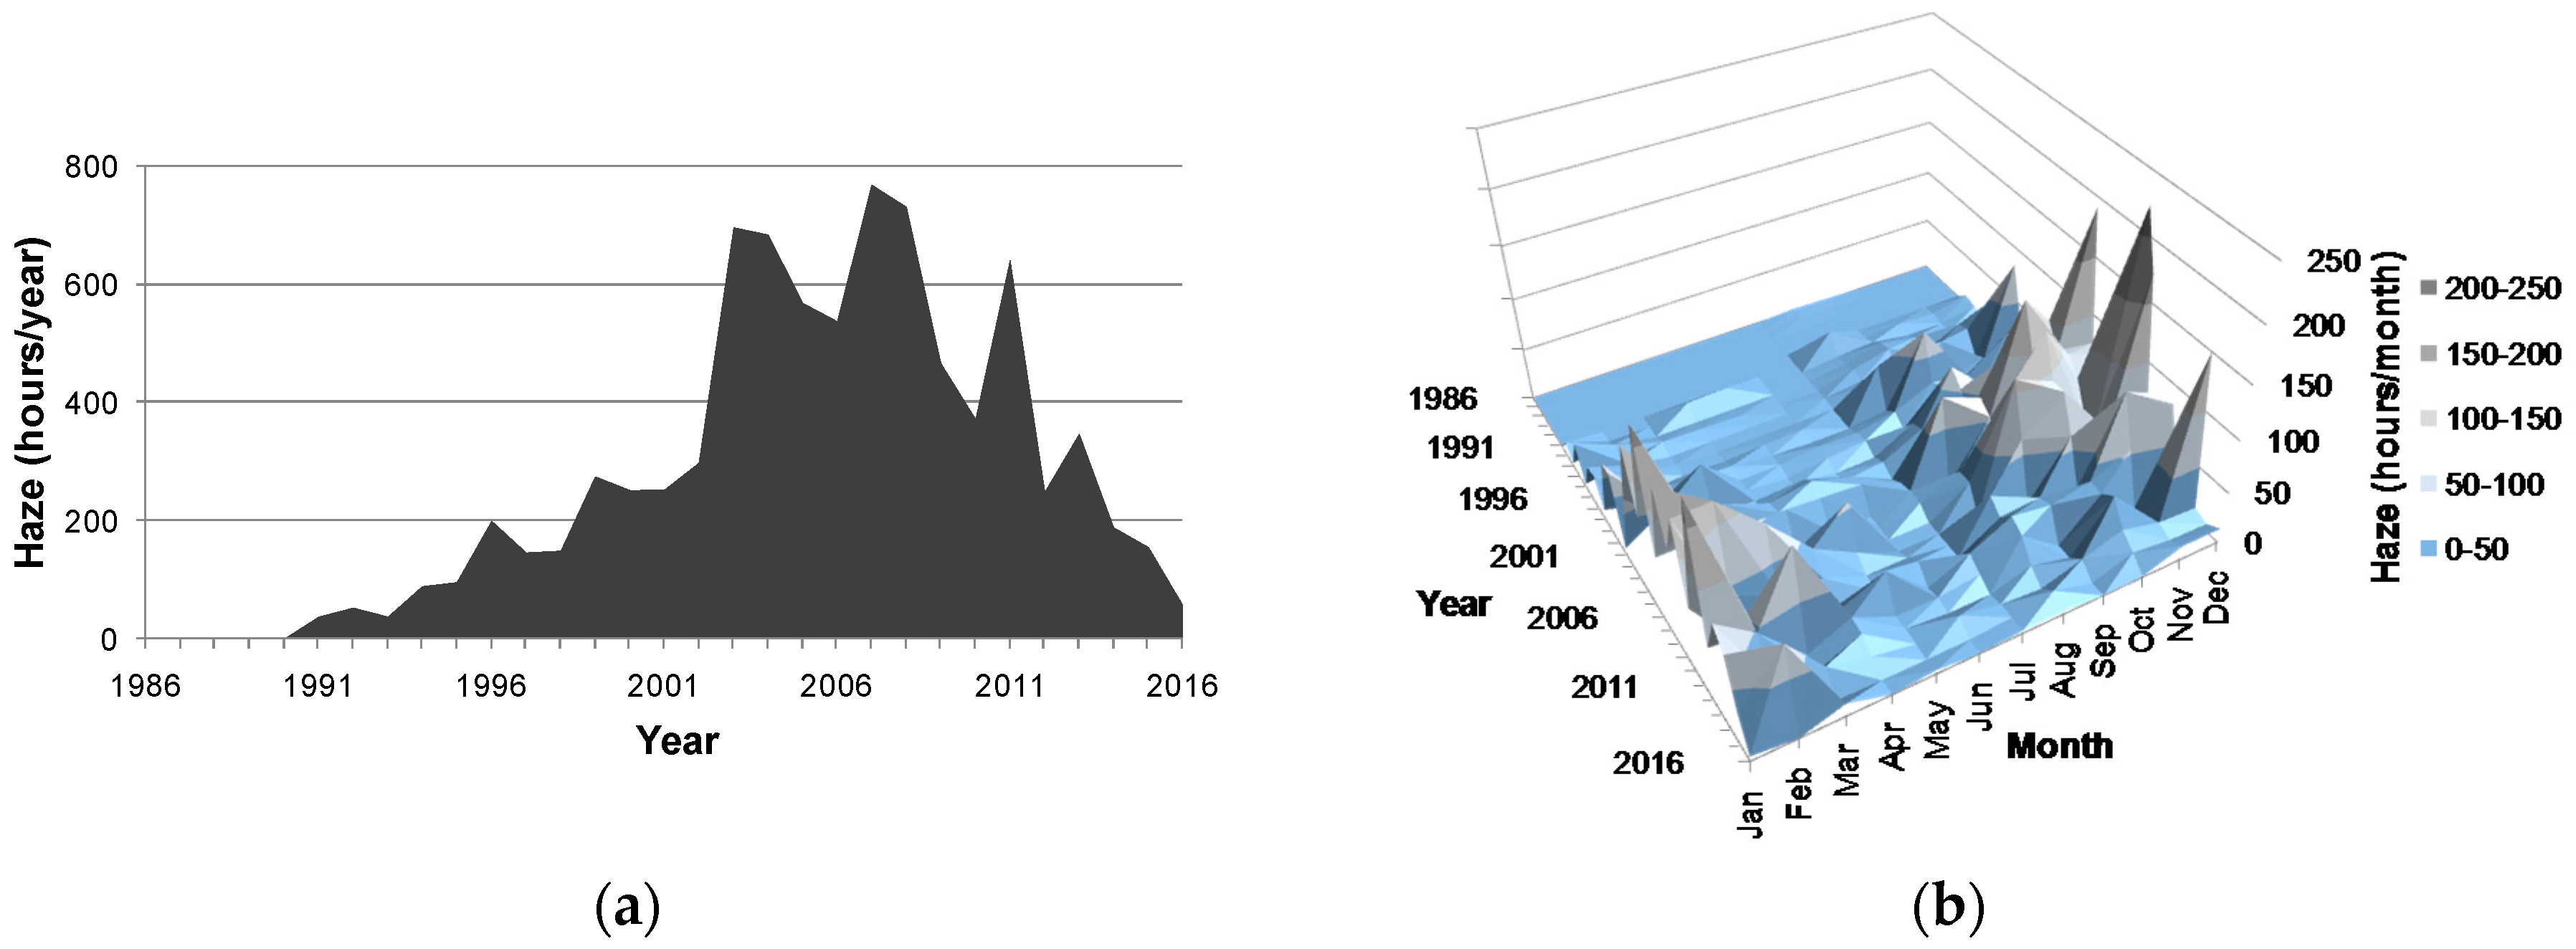
Visibility is an integrative parameter that refers to the ability to see a distant object [25]. When air pollutants are emitted from anthropogenic sources, haze is formed under a stable atmospheric inversion layer, adversely affecting the visibility over the city. Haze has been a common phenomenon in winter in China’s cities [3,8,9,12,18,26]. In Macao, haze is defined as the condition under which visibility is equal to, or less than 5 km and relative humidity is less than 80 percent. The condition is recorded by trained meteorologists and confirmed by a forward scatter visibility meter. The Macao Meteorological and Geophysical Bureau keeps daily records of the number of hours with haze. Figure 1a shows the records for the period 1986 to 2016.
Figure 1a shows that the number of hours with haze increased steadily from 0 in 1990 to 297 in 2002. However, it sharply increased to 694 in 2003. Between 2003 and 2008, the number of hours with haze ranged from 536 and 766. The figure has decreased since 2008. Figure 1b shows the monthly numbers of hours with haze. Note that haze has been a common phenomenon in autumns and winters, i.e., between September and March, during the past fourteen years.
Figure 2a–c show monthly mean atmospheric pressure, monthly mean air temperature, and monthly total rainfall figures for the period 1986 to 2016. These figures show that Macao has higher atmospheric pressure, lower air temperature, and lesser rainfall between October and March i.e., in the autumn and winter months.
3.2. Energy Use in Macao
Macao’s social and economic development had remained relatively steady before the liberalization of the gaming industry in 2002. Table 1 summarizes the consumption of primary energy sources in 1986, 1991, 1996, 2001, 2006, 2011, and 2016, respectively. It also shows the consumption of electricity (1 GWh is equivalent to 3.6 × 10 TJ)—a secondary energy in these years.
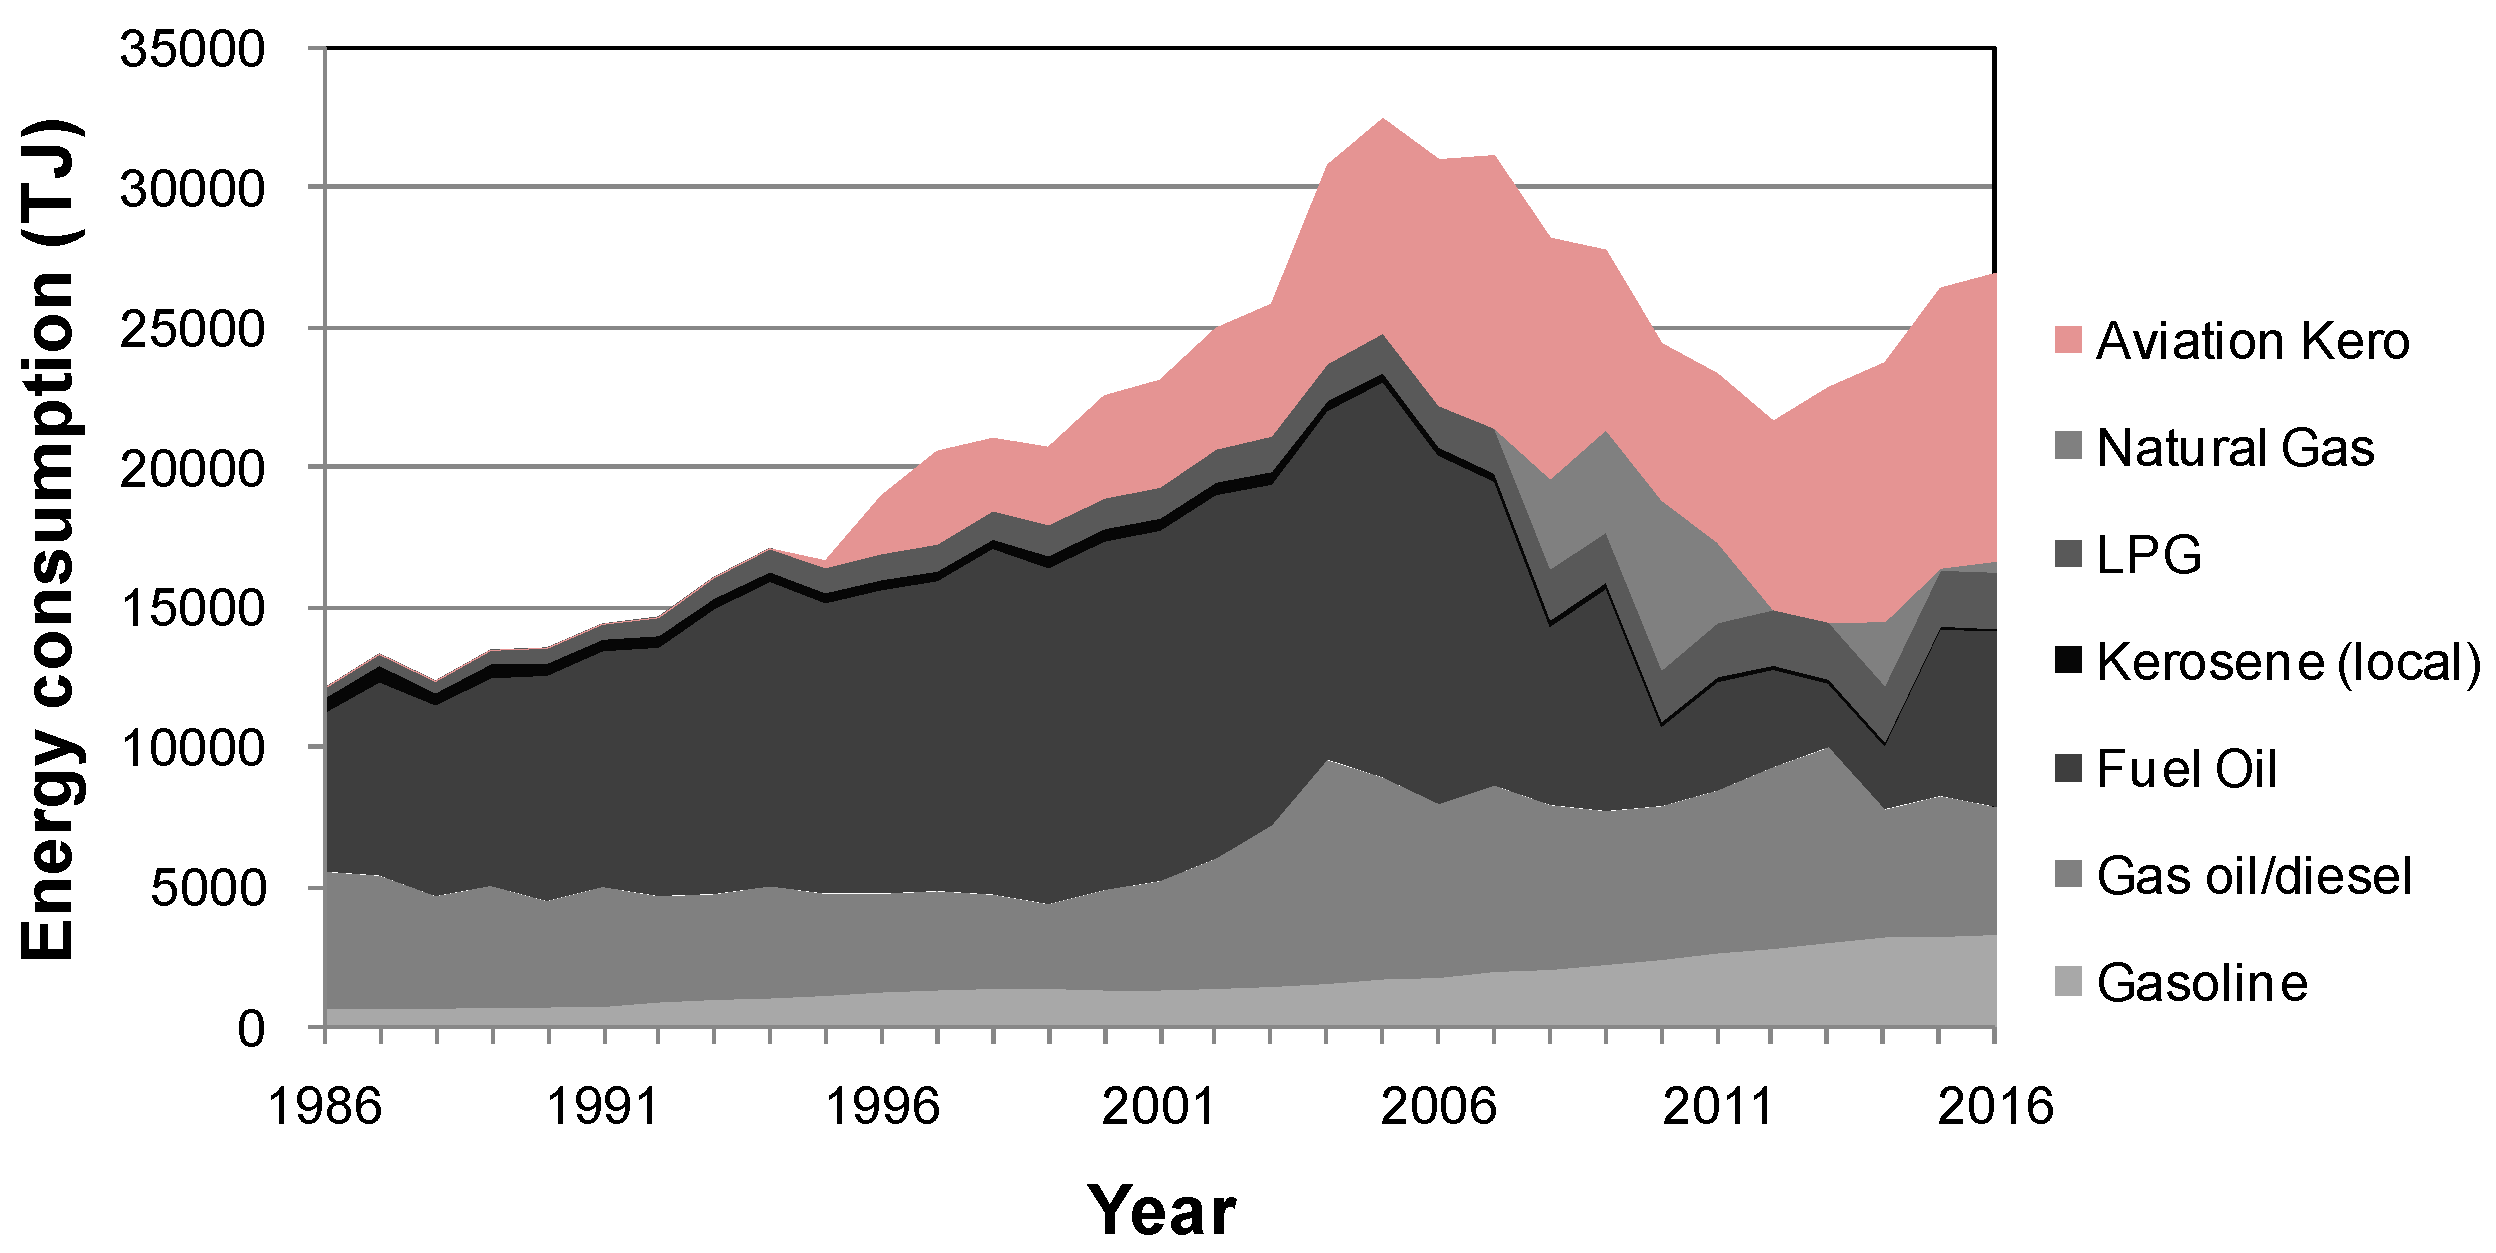
Figure 3 shows the primary energy use figures for Macao over the period 1986 to 2016. This figure shows that Macao’s total primary energy use had been increasing continuously from 1986 to 2005. The consumption of oil products such as gas oil/diesel and fuel oil has decreased quite significantly since 2005. This was because Macao’s power companies had imported more electricity from mainland China, thus burning less fuel oil and gas oil/diesel since 2005. The percentage of imported electricity increased from 15 percent in 2005 to 81 percent in 2016 [20].
More specifically, gasoline is consumed primarily by private vehicles, gas oil/diesel by buses, coaches, trucks, industrial boilers and Macao’s power plants, fuel oil by jetfoils and Macao’s power plants, kerosene by industrial companies, liquefied petroleum gas by domestic cookers and hot water burners, and aviation kerosene by aircrafts (after the opening of Macao International Airport in 1995). Macao’s power company has used natural gas as a fuel since 2008.
3.3. Stationarity of the Annual Haze Time-Series Data and the Annaul Energy Consumption Data
The annual haze time-series and the annual total primary energy consumption time-series were examined using the Dickey-Fuller tests based on Equations (3) and (4). Table 2 shows the results of the Dickey-Fuller tests on the null hypothesis that the annual haze time-series and the annual energy consumption time-series had unit roots. As each of the calculated tau values was greater than the critical value in the table of critical values [24], the null hypothesis was rejected, and two time-series were found to be non-stationary. As the annual haze time-series and the annual total primary energy consumption time-series were found to be non-stationary, AR or ARMA models cannot be reliably used for these non-stationary time series.
3.4. Correlation and Multiple Regression Analysis
Bivariate correlations were performed between the number of hours with haze, the consumption of motor gasoline, gas oil/diesel, fuel oil, kerosene, liquefied petroleum gas, natural gas, and aviation kerosene, and meteorological variables including annual mean atmospheric pressure in hPa, annual mean air temperature in °C, and annual total rainfall in mm using the annual data from 1986 to 2016. The calculated Pearson’s correlation coefficients are shown in Table 3. Although one might expect years with more rainfall days or more total rainfall to be cleaner years due to scavenging effects, the results show that the number of haze hours per year was not significantly correlated with annual total rainfall (r = 0.08, n.s.). It could be explained by the emissions of pollutants that had a much greater significant effect on haze than that of the cleansing mechanism on an annual basis.
The correlation values show that there were significant positive relationships between haze and some oil products such as motor gasoline, gas oil/diesel, and liquefied petroleum gas consumed locally, and between haze and aviation kerosene consumption that was partly consumed in Macao during aircrafts’ taking off and landing. A multiple regression analysis was then employed to determine the effects of primary energy consumption on the number of hours with haze. All fuel consumptions were first input as the independent variables, while the numbers of hours with haze was selected as the dependent variable. A backward procedure was used in which variables with a p value less than 0.05 were retained. After several iterations, the following multiple regression equation was obtained:
where Haze is the number of hours with haze, GasOil is the consumption of gas oil/diesel in TJ, FuelOil is the consumption of fuel oil in TJ, NG is the consumption of natural gas in TJ, and Keroseneaviation is the consumption of aviation kerosene in TJ. Figures underneath the coefficients are values for t-statistics and figures in brackets are p-values.
The r2-value of Equation (7) was 0.741, i.e., 74.1 percent of the variance in the number of hours with haze could be explained by the consumption of gas oil/diesel, fuel oil, natural gas, as well as aviation kerosene. The relationships between these three variables and haze were significant at p < 0.001. The coefficients indicated the relative influence of the independent variables on dependent variable. In other words, a unit increase in the consumption of gas oil, fuel oil, natural gas, and aviation kerosene in TJ increased the number of hours with haze by 0.043, 0.042, 0.076, and 0.033 h per year, respectively. The 95 percent confidence intervals for these coefficients were [0.027, 0.058], [0.026, 0.058], [0.035, 0.117], and [0.019, 0.048], respectively.
Figure 4 compares the numbers of hours with haze using Equation (7) against actual data. It also provides the band of predicted values using the 95 percent confidence intervals of the coefficients.
3.5. Associations between Haze and Meteorological Variables on a Monthly Basis
Figure 2a–c shows monthly mean atmospheric pressure, monthly mean air temperature, and monthly total rainfall figures between 1986 and 2016. Pair-wise correlations were performed between the number of hours with haze and each of the meteorological variables on a monthly basis for each year for the period 1986–2016. Researchers have used pair-wise correlations to identify the relationships between poor visibility and monthly meteorological conditions [25]. Table 4 shows the values of pair-wise correlation between haze and each meteorological variable. It was found that the number of hours with haze was positively, strongly, and significantly associated with monthly mean atmospheric pressure in the past decade while it was negatively and weakly associated with monthly mean air temperature and monthly total rainfall since 1996. It is because the correlation, r-value, must be greater than 0.497 for p < 0.05 for 10 degrees of freedom. In other words, the number of hours with haze might be associated with high levels of mean atmospheric pressure, which often leads to the lower mixed layer height [28]. Researchers [29,30] have also reported that lower mean air temperature may reduce the ambient ventilation. Hence, haze seems to be more pronounced during the autumn and winter months from September to March in Macao.
3.6. Association between Haze in Macao and Haze Days in Guangzhou
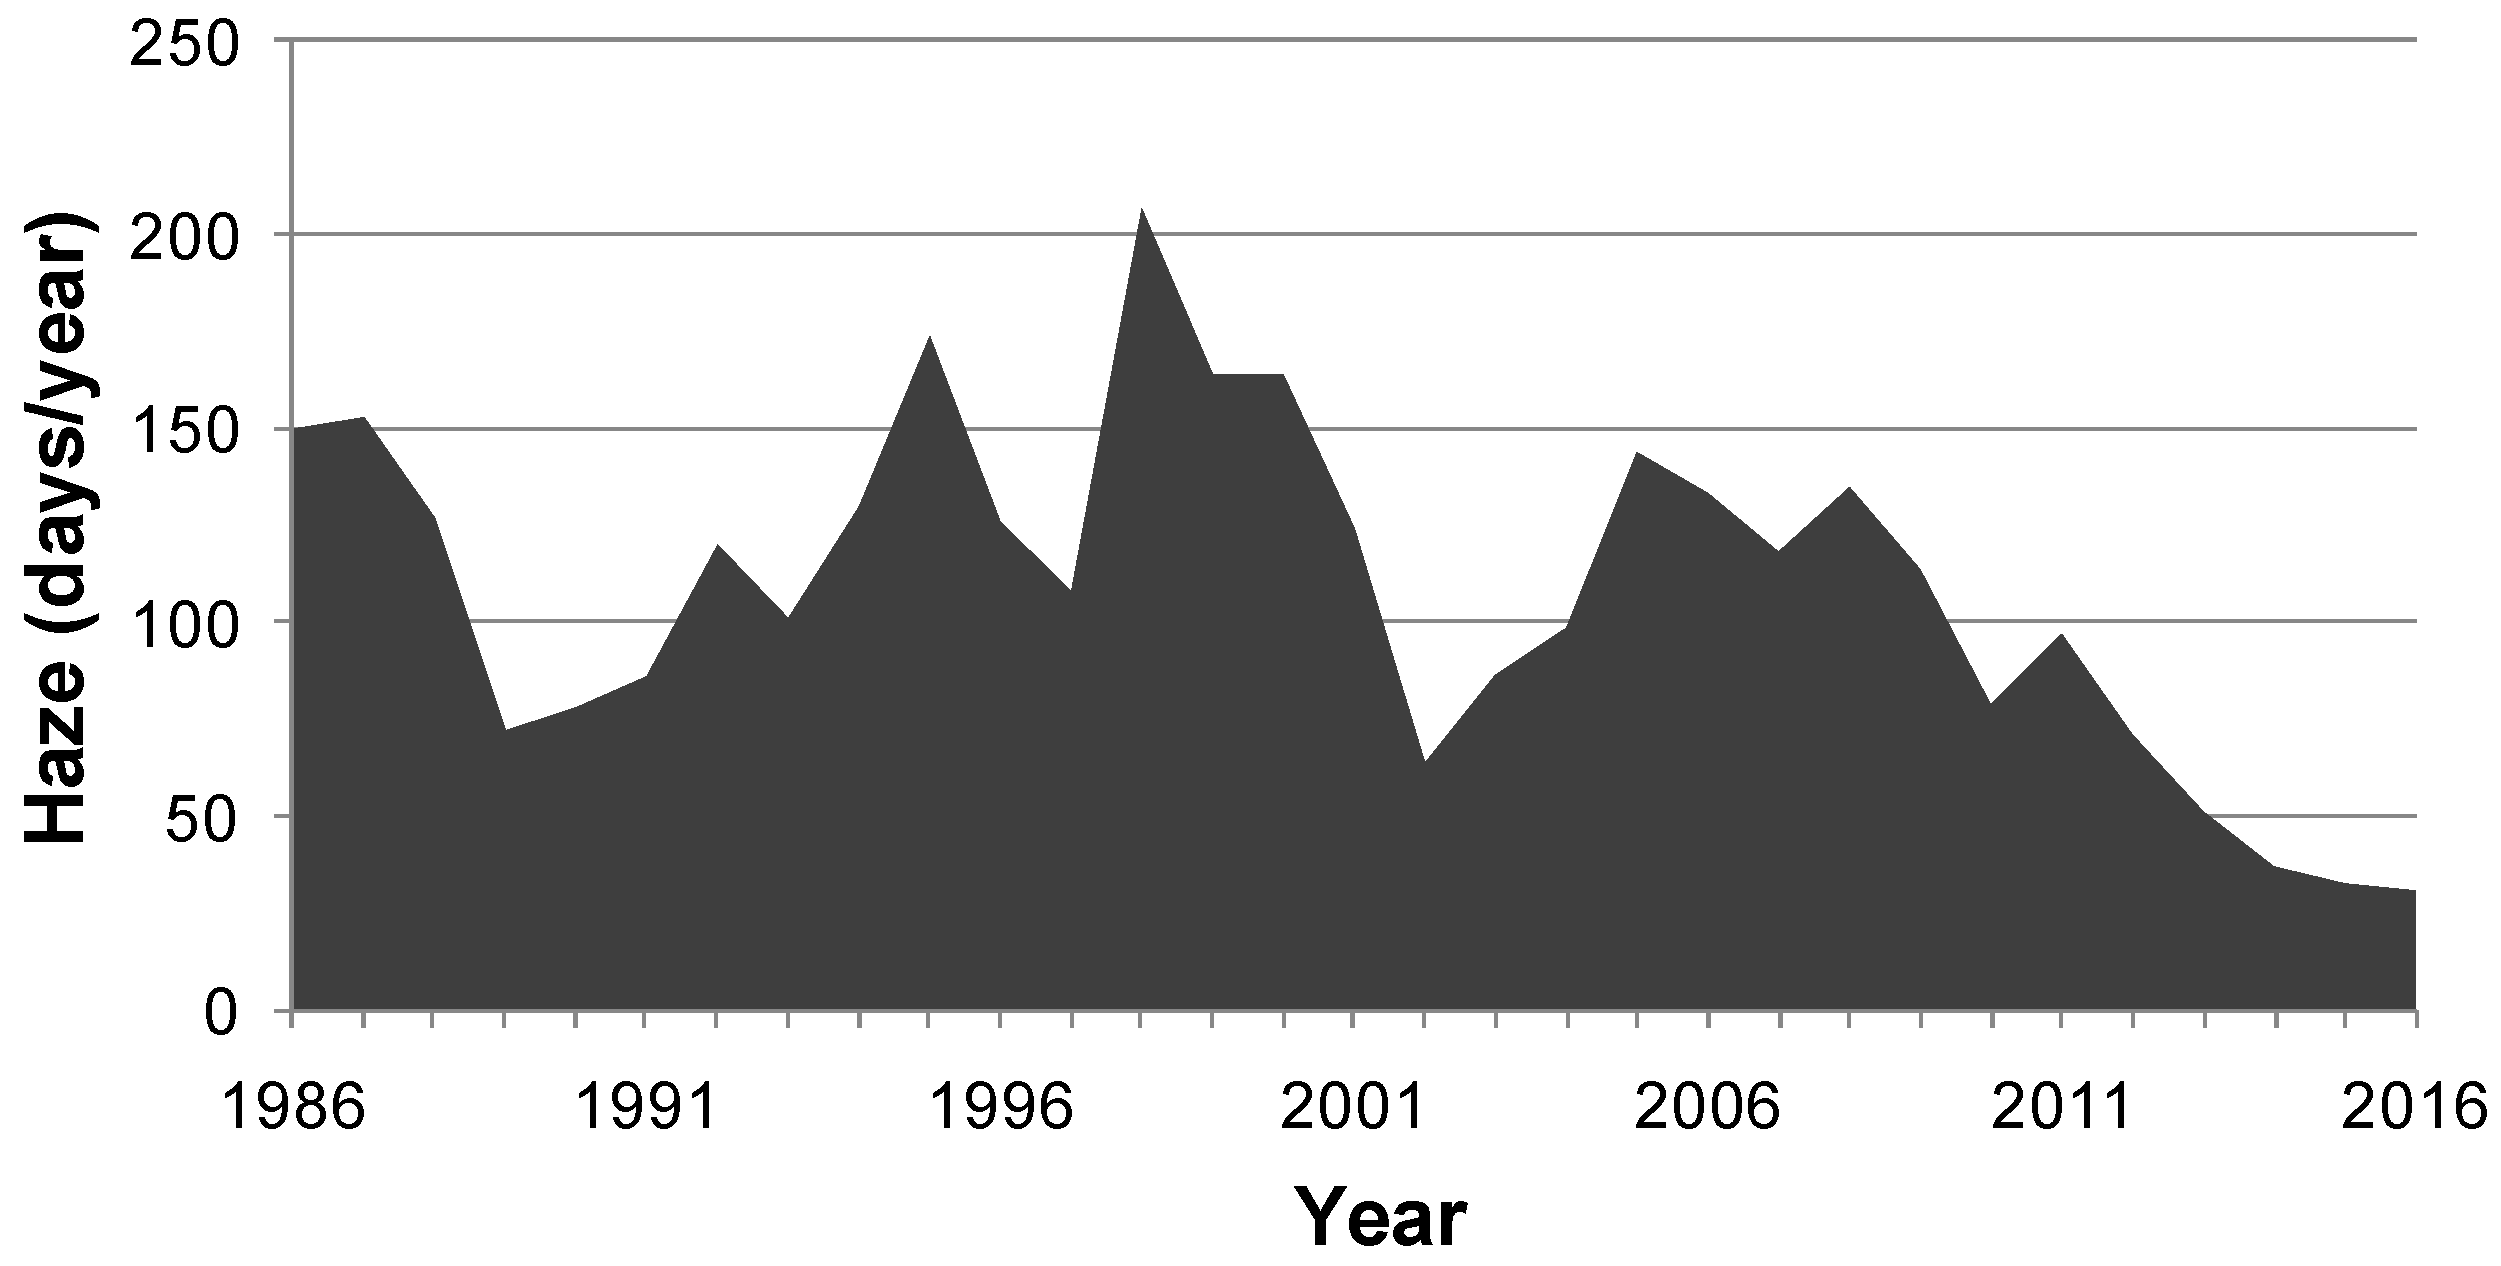
Macao is located on the southwestern side of the Pearl River Delta while Hong Kong is at the southeastern side. Whenever haze is reported, Macao (or Hong Kong) people claim that most of the air pollutants come from the north across the border [31]. Although Guangzhou, Zhongshan, and Zhuhai are located on the north of Macao, only the Meteorological Bureau in Guangzhou has been recording the annual numbers of haze days for more than three decades, while there were no official data on haze days/hours published by the local meteorological stations in Zhongshan and Zhuhai. Figure 5 shows the number of haze days per year in Guangzhou for the period 1986 to 2016. A comparison of the total number of hours with haze in Macao, shown in Figure 1a, and the number of haze days in Guangzhou shown in Figure 5 demonstrates that changes in haze conditions in these two cities are very different. A correlation analysis was performed to test whether the haze condition in Macao was associated with haze condition in Guangzhou. The result showed that there was no significant relationship (r = −0.06, p > 0.05) between haze in Guangzhou and haze in Macao in the long run, implying that haze in Macao is primarily caused by local emissions rather than cross-border air pollution from the north. Besides, haze needs relatively still air—so haze is not likely to be transported from one place to another.
4. Discussion
Haze often appears in media headlines. This paper is one of the first publications to employ long-term time series data in investigating the relationship between the number of hours with haze (i.e., the integral form of air pollutants discharged from a wide range of sources), the consumption of fossil fuel energy, and the meteorological variables in Macao on an annual basis. The number of hours with haze increased continuously from 0 to 766 h a year between 1990 and 2007 while the consumption of primary energy (including oil products, natural gas, and aviation kerosene) had increased by 130 percent. Multiple regression analyses have shown that gas oil/diesel, fuel oil, and natural gas consumed locally and the burning of aviation kerosene were significantly associated with the number of hours per year with haze in Macao. A correlation analysis between monthly haze data and monthly records of meteorological variables has indicated that the number of hours with haze was strongly, significantly associated with high atmospheric pressure that leads to the lower mixed layer height in the past decade. The combustion of oil products produces particulate matter, sulfur oxides, nitrogen oxides, and volatile organic compounds including non-methane hydrocarbons. All of these air pollutants are well-known sources of haze. Besides, around 150 commercial aircrafts, which emit a significant amount of particulate matter in low troposphere, take off and land at the Macao International Airport each day [32]. It is possible that there is a significant correlation between the number of humid hours (the hours with a relative humidity between 75 and 80 percent) each year/month and the number of haze hours per year/month. However, the hourly relative humidity data were not available from the Bureau’s publications.
Since 2005, Macao’s power company has been importing more and more electricity from Zhuhai, and has reduced the burning of fuel oil and gas oil/diesel at its power plants significantly. As a result, the amount of oil products consumed locally decreased continuously from 2005 to 2014. The number of haze hours also changed from 567 to 346 per year during the same period. Macao’s power company has announced that it would import more electricity from Zhuhai and reduce the operational capability of its local power plants further, implying the haze condition of Macao will continue to improve over the near future. Nevertheless, the imported electricity from Zhuhai is produced by a coal-fired power plant at Jinwan—located at 50 km southwest of Macao. Since Zhuhai Jinwan Power Plant is on the Chinese mainland where the pollution regulations, compliance, and monitoring are not likely to be as stringent as in Macao, the increases in its power production will emit larger quantities of carbon dioxide, sulfur dioxides, nitrogen oxides, and particulate matter affecting its vicinity. Moreover, the number of aircrafts departing from and arriving at the Macao International Airport will very likely increase, leading to an increase in the consumption of aviation kerosene. As a result, it is very likely that the number of hours with haze will decrease in the short-run due to the continual decrease in the burning of oil products in Macao’s power plants. The anticipated future increase in local pollutant emissions and the haze will most likely be due to the Zhuhai Jinwan Power Plant. The implications are twofold. First, the Macao Government, or governments sharing a similar context, should take a proactive approach to consider the impact of energy mix on environmental conditions. Second, the transfer of environmental burdens (e.g., power generation) to neighboring areas needs to be re-examined as an environmental policy because it runs against environmental ethics and does not help in reducing the actual pollution.
5. Conclusions
Haze is a major concern in many cities. In Macao, the number of hours with haze increased from 0 to 766 hours a year between 1990 and 2007 and decreased quite dramatically to 57 h in 2016. That provided an opportunity to explore what caused the change in hazy weather condition. During the same period of time, Macao’s energy mix also changed quite dramatically. Specifically, Macao started importing a significant percentage of electricity from its neighboring city and cut down the burning of fuel oil and gas oil/diesel substantially in its power plant. The results of multiple regression analysis indicated that gas oil/diesel, fuel oil, and natural gas consumed locally and the burning of aviation kerosene were significantly associated with the number of hours per year with haze in Macao.
Acknowledgments
This study was supported in part by the Research Grants Council of Hong Kong under grant number PolyU 152629/16E.
Author Contributions
Wai-Ming To and Peter K. C. Lee conceived the study. Wai-Ming To performed the data collection and analyzed the data; Wai-Ming To, Peter K. C. Lee, and Chi-To Ng prepared the paper. All authors have read and approved the final version of the manuscript.
Conflicts of Interest
The authors declare no conflicts of interest.
References
- Fajardo, O.A.; Jiang, J.; Hao, J. Assessing young people’s preferences in urban visibility in Beijing. Aerosol Air Q. Res. 2013, 13, 1536–1543. [Google Scholar] [CrossRef]
- Mao, W.; Xia, W.; Chen, J. Air pollution and chronic cough in China. CHEST J. 2013, 144, 362–363. [Google Scholar] [CrossRef] [PubMed]
- Zhang, Z.; Wang, J.; Chen, L.; Chen, X.; Sun, G.; Zhong, N.; Kan, H. Impact of haze and air pollution-related hazards on hospital admissions in Guangzhou, China. Environ. Sci. Pollut. Res. 2014, 21, 4236–4244. [Google Scholar] [CrossRef] [PubMed]
- Xiao, J.; Cheng, J.; Shen, J.; Wang, X. A system dynamics analysis of investment, technology and policy that affect natural gas exploration and exploitation in China. Energies 2017, 10, 154. [Google Scholar] [CrossRef]
- Thach, T.Q.; Wong, C.M.; Chan, K.P.; Chau, Y.K.; Chung, Y.N.; Ou, C.Q.; Yang, L.; Hedley, A.J. Daily visibility and mortality: Assessment of health benefits from improved visibility in Hong Kong. Environ. Res. 2010, 110, 617–623. [Google Scholar] [CrossRef] [PubMed]
- Mace, B.L.; Bell, P.A.; Loomis, R.J. Visibility and natural quiet in national parks and wilderness areas: Psychological considerations. Environ. Behav. 2004, 36, 5–31. [Google Scholar] [CrossRef]
- Othman, J.; Sahani, M.; Mahmud, M.; Ahmad, M.K.S. Transboundary smoke haze pollution in Malaysia: Inpatient health impacts and economic valuation. Environ. Pollut. 2014, 189, 194–201. [Google Scholar] [CrossRef] [PubMed]
- Jansen, R.C.; Shi, Y.; Chen, J.; Hu, Y.; Xu, C.; Hong, S.; Li, J.; Zhang, M. Using hourly measurements to explore the role of secondary inorganic aerosol in PM2.5 during haze and fog in Hangzhou, China. Adv. Atmos. Sci. 2014, 31, 1427–1434. [Google Scholar] [CrossRef]
- Li, M.; Zhang, L. Haze in China: Current and future challenges. Environ. Pollut. 2014, 189, 85–86. [Google Scholar] [CrossRef] [PubMed]
- Li, H.; Wang, Q.G.; Shao, M.; Wang, J.; Wang, C.; Sun, Y.; Qian, X.; Wu, H.; Yang, M.; Li, F. Fractionation of airborne particulate-bound elements in haze-fog episode and associated health risks in a megacity of southeast China. Environ. Pollut. 2016, 208, 655–662. [Google Scholar] [CrossRef] [PubMed]
- Seinfeld, J.H.; Pandis, S.N. Atmospheric Chemistry and Physics: From Air Pollution to Climate Change, 2nd ed.; John Wiley & Sons: New York, NY, USA, 2006. [Google Scholar]
- Guo, S.; Tan, J.; Duan, J.; Ma, Y.; Yang, F.; He, K.; Hao, J. Characteristics of atmospheric non-methane hydrocarbons during haze episode in Beijing, China. Environ. Monit. Assess. 2012, 184, 7235–7246. [Google Scholar] [CrossRef] [PubMed]
- Alloway, B.J.; Ayres, D.C. Chemical Principles of Environmental Pollution; Blackie Academic & Professional: London, UK, 1997. [Google Scholar]
- Haus, N.; Zimmermann, S.; Wiegand, J.; Sures, B. Occurrence of platinum and additional traffic related heavy metals in sediments and biota. Chemosphere 2007, 66, 619–629. [Google Scholar] [CrossRef] [PubMed]
- Hyslop, N.P. Impaired visibility: The air pollution people see. Atmos. Environ. 2009, 43, 182–195. [Google Scholar] [CrossRef]
- Ho, R.C.; Zhang, M.W.; Ho, C.S.; Pan, F.; Lu, Y.; Sharma, V.K. Impact of 2013 south Asian haze crisis: Study of physical and psychological symptoms and perceived dangerousness of pollution level. BMC Psychiatry 2014, 14, 81. [Google Scholar] [CrossRef] [PubMed]
- The American Meteorological Organization. Haze. The American Meteorological Organization, 2017. Available online: http://glossary.ametsoc.org/wiki/Haze (accessed on 1 May 2017).
- To, W.M.; Lai, T.M.; Chung, W.L. Fuel life cycle emissions for electricity consumption in the world’s gaming center—Macao SAR, China. Energy 2011, 36, 5162–5168. [Google Scholar] [CrossRef]
- Macao Statistics and Census Service. The Yearbook of Statistics (From 1986 to 2016); Macao Statistics and Census Service: Macao, China, 2016.
- Macao Statistics and Census Service. Energy Statistics (From 2000 to 2016); Macao Statistics and Census Service: Macao, China, 2017.
- Macao Meteorological and Geophysical Bureau. The Meteorological Instruments Used by the Macao Meteorological and Geophysical Bureau; Macao Meteorological and Geophysical Bureau: Macao, China, 2017.
- Macao Meteorological and Geophysical Bureau. The Yearbook of Meteorological Observations (From 1986 to 2016); Macao Meteorological and Geophysical Bureau: Macao, China, 2017.
- Guangzhou Meteorological Bureau. Guangzhou Climate Bulletin (From 1986 to 2016, in Chinese); Guangzhou Meteorological Bureau: Guangzhou, China, 2017. [Google Scholar]
- Dickey, D.A.; Fuller, W.A. Likelihood ratio statistics for autoregressive time series with a unit root. Econometrica 1981, 49, 1057–1072. [Google Scholar] [CrossRef]
- To, W.M. Association between energy use and poor visibility in Hong Kong SAR, China. Energy 2014, 68, 12–20. [Google Scholar] [CrossRef]
- Fan, S.; Wang, B.; Tesche, M.; Engelmann, R.; Althausen, A.; Liu, J.; Zhu, W.; Fan, Q.; Li, M.; Ta, N.; et al. Meteorological conditions and structures of atmospheric boundary layer in October 2004 over Pearl River Delta area. Atmos. Environ. 2008, 42, 6174–6186. [Google Scholar] [CrossRef]
- Cai, W.; Wang, C.; Chen, J. Revisiting CO2 mitigation potential and coasts in China’s electricity sector. Energy Policy 2010, 38, 4209–4213. [Google Scholar] [CrossRef]
- Majewski, G.; Rogula-Kozłowska, W.; Czechowski, P.O.; Badyda, A.; Brandyk, A. The impact of selected parameters on visibility: First results from a long-term campaign in Warsaw, Poland. Atmosphere 2015, 6, 1154–1174. [Google Scholar] [CrossRef]
- Aryal, R.K.; Lee, B.K.; Karki, R.; Gurung, A.; Kandasamy, J.; Pathak, B.K.; Sharma, S.; Giri, N. Seasonal PM 10 dynamics in Kathmandu Valley. Atmos. Environ. 2008, 42, 8623–8633. [Google Scholar] [CrossRef]
- Aryal, R.K.; Lee, B.K.; Karki, R.; Gurung, A.; Baral, B.; Byeon, S.H. Dynamics of PM2.5 concentrations in Kathmandu Valley, Nepal. J. Hazard. Mater. 2009, 168, 732–738. [Google Scholar] [CrossRef] [PubMed]
- Dissanayake, S. Pollution Clouds Hong Kong’s Future. BBC News. 2007. Available online: http://news.bbc.co.uk/2/hi/asia-pacific/6768977.stm (accessed on 1 May 2017).
- Carslaw, D.C.; Beevers, S.D.; Ropkins, K.; Bell, M.C. Detecting and quantifying aircraft and other on-airport contributions to ambient nitrogen oxides in the vicinity of a large international airport. Atmos. Environ. 2006, 40, 5424–5434. [Google Scholar] [CrossRef]
Figure 1.
(a) The number of hours with haze per year for the period 1986 to 2016; (b) The number of hours with haze per month for the period 1986 to 2016.
Figure 1.
(a) The number of hours with haze per year for the period 1986 to 2016; (b) The number of hours with haze per month for the period 1986 to 2016.

Figure 2.
(a) Mean atmospheric pressure; (b) Mean air temperature from; and (c) Total rainfall figures over the period 1986 to 2016.
Figure 2.
(a) Mean atmospheric pressure; (b) Mean air temperature from; and (c) Total rainfall figures over the period 1986 to 2016.
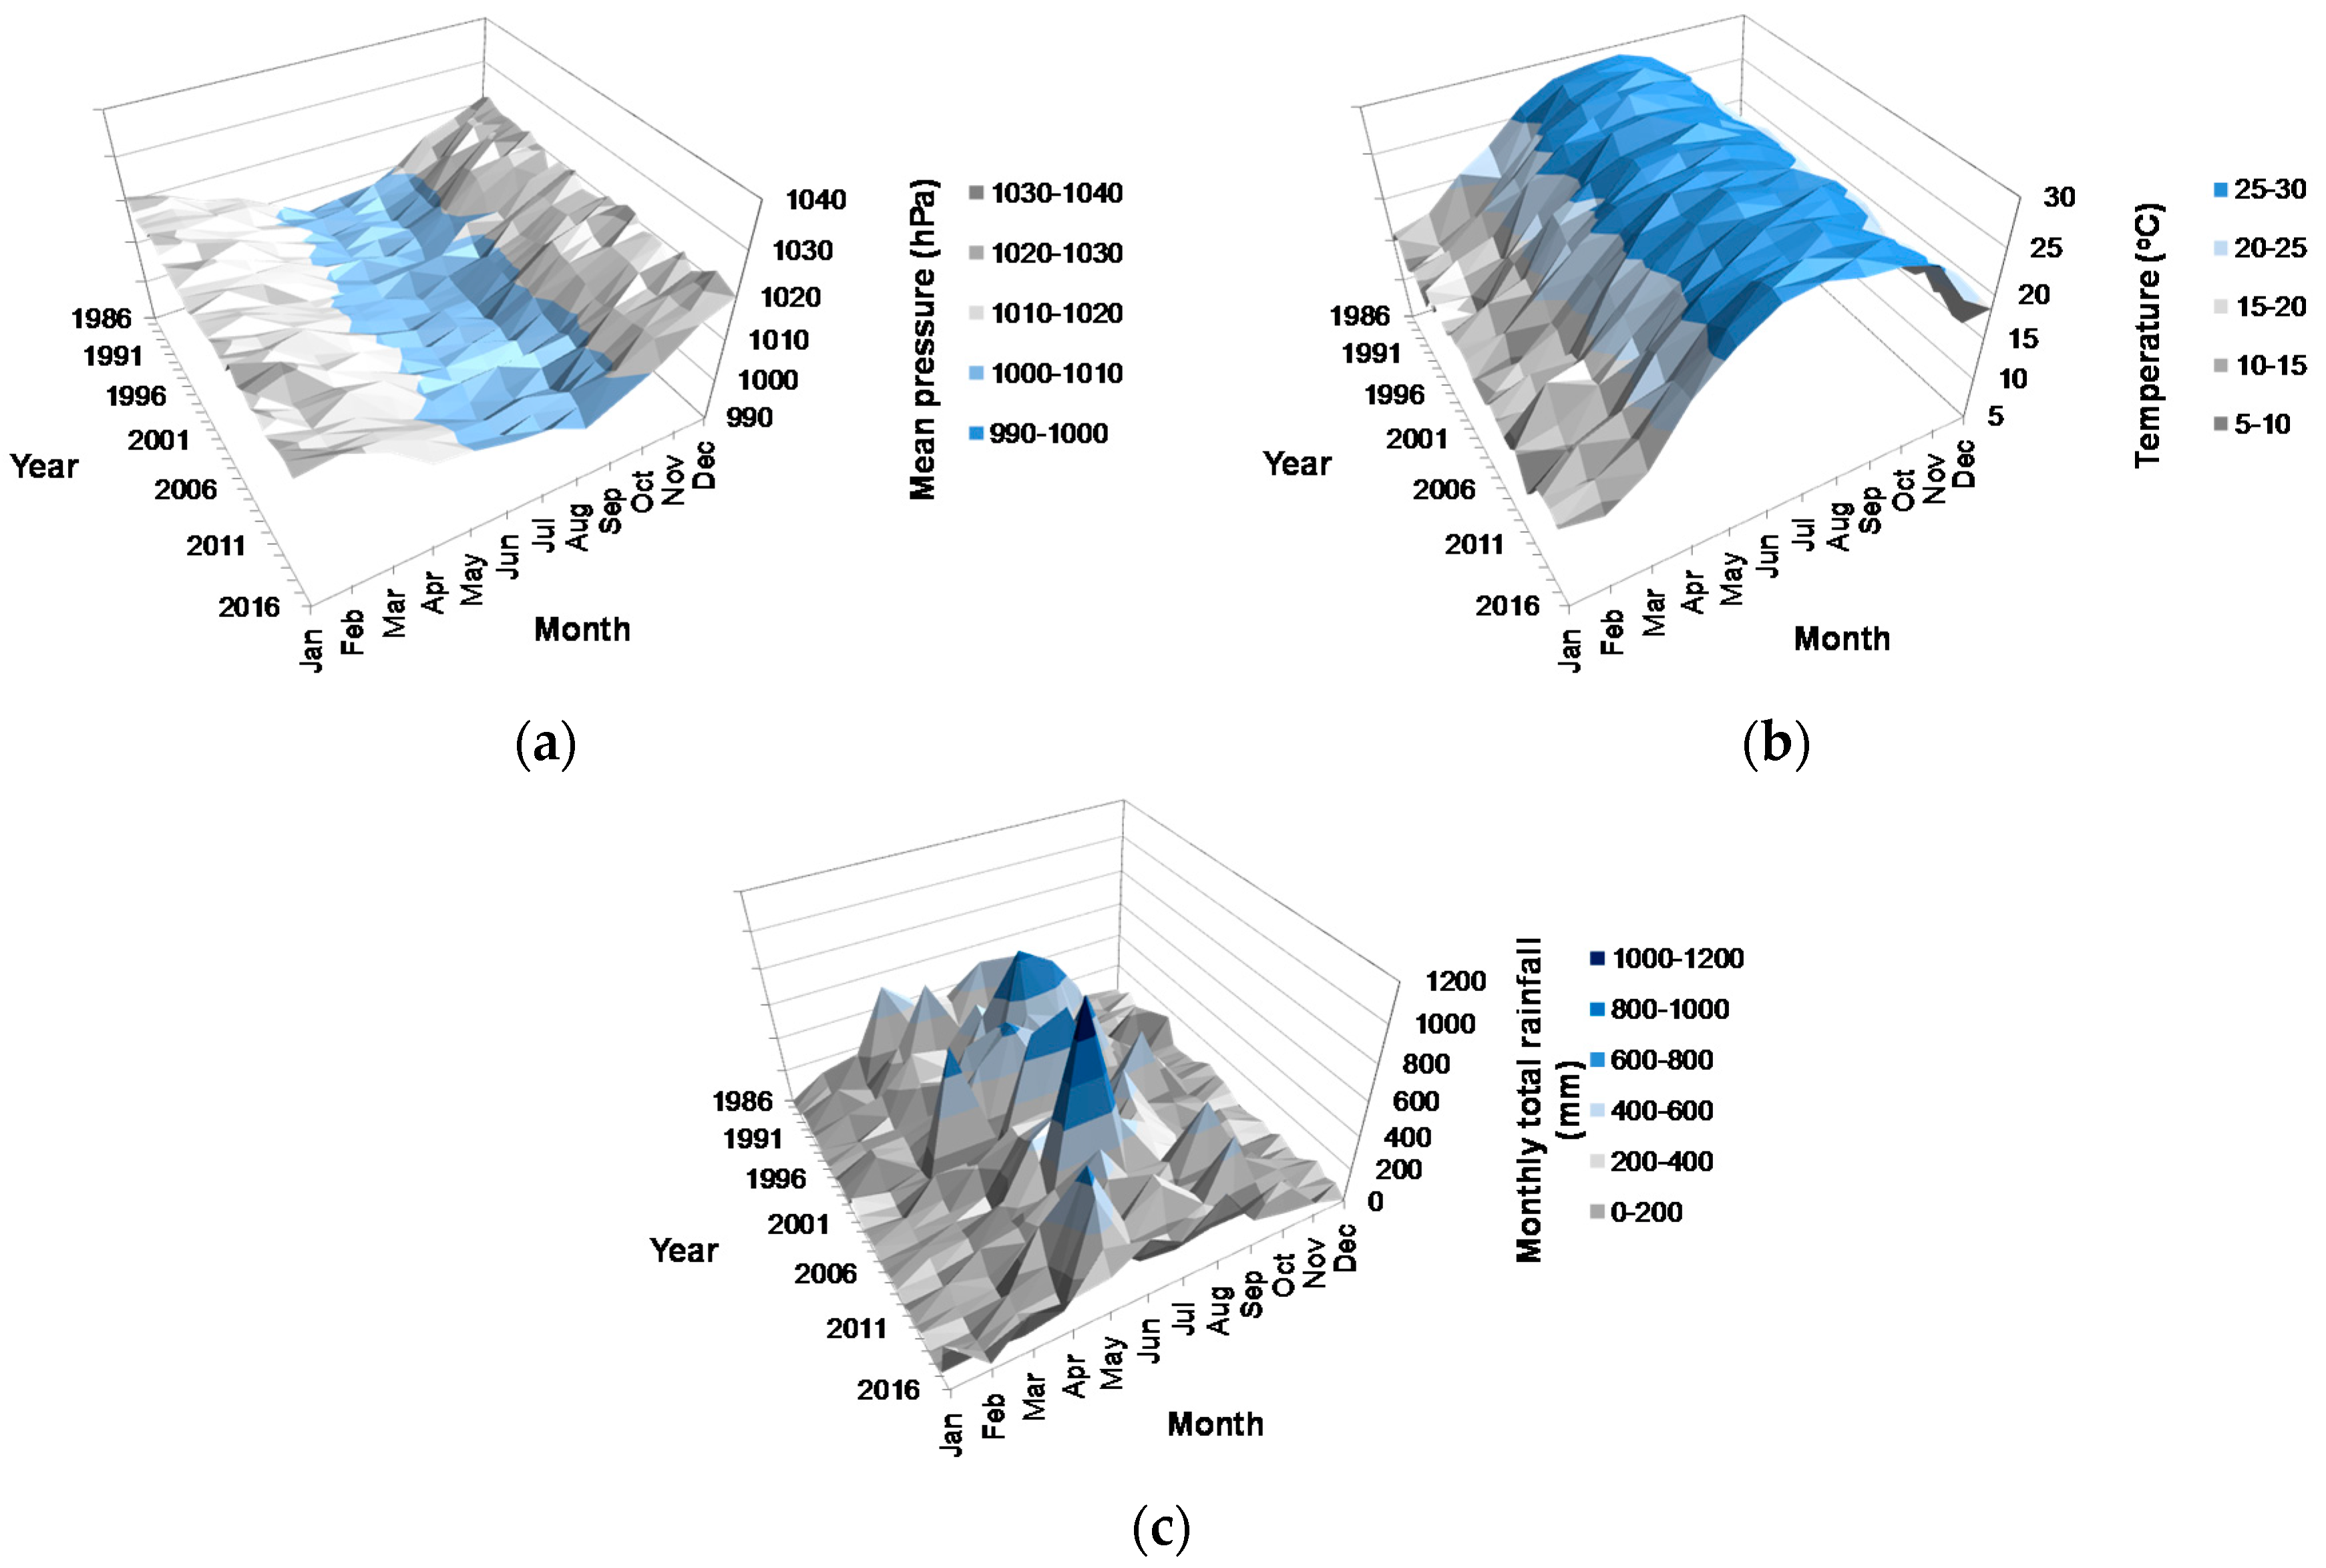
Figure 3.
The consumption of primary energy in Macao from 1986 to 2016.
Figure 4.
Variations in the actual and predicted number of hours of haze in Macao over the period 1986–2016.
Figure 4.
Variations in the actual and predicted number of hours of haze in Macao over the period 1986–2016.
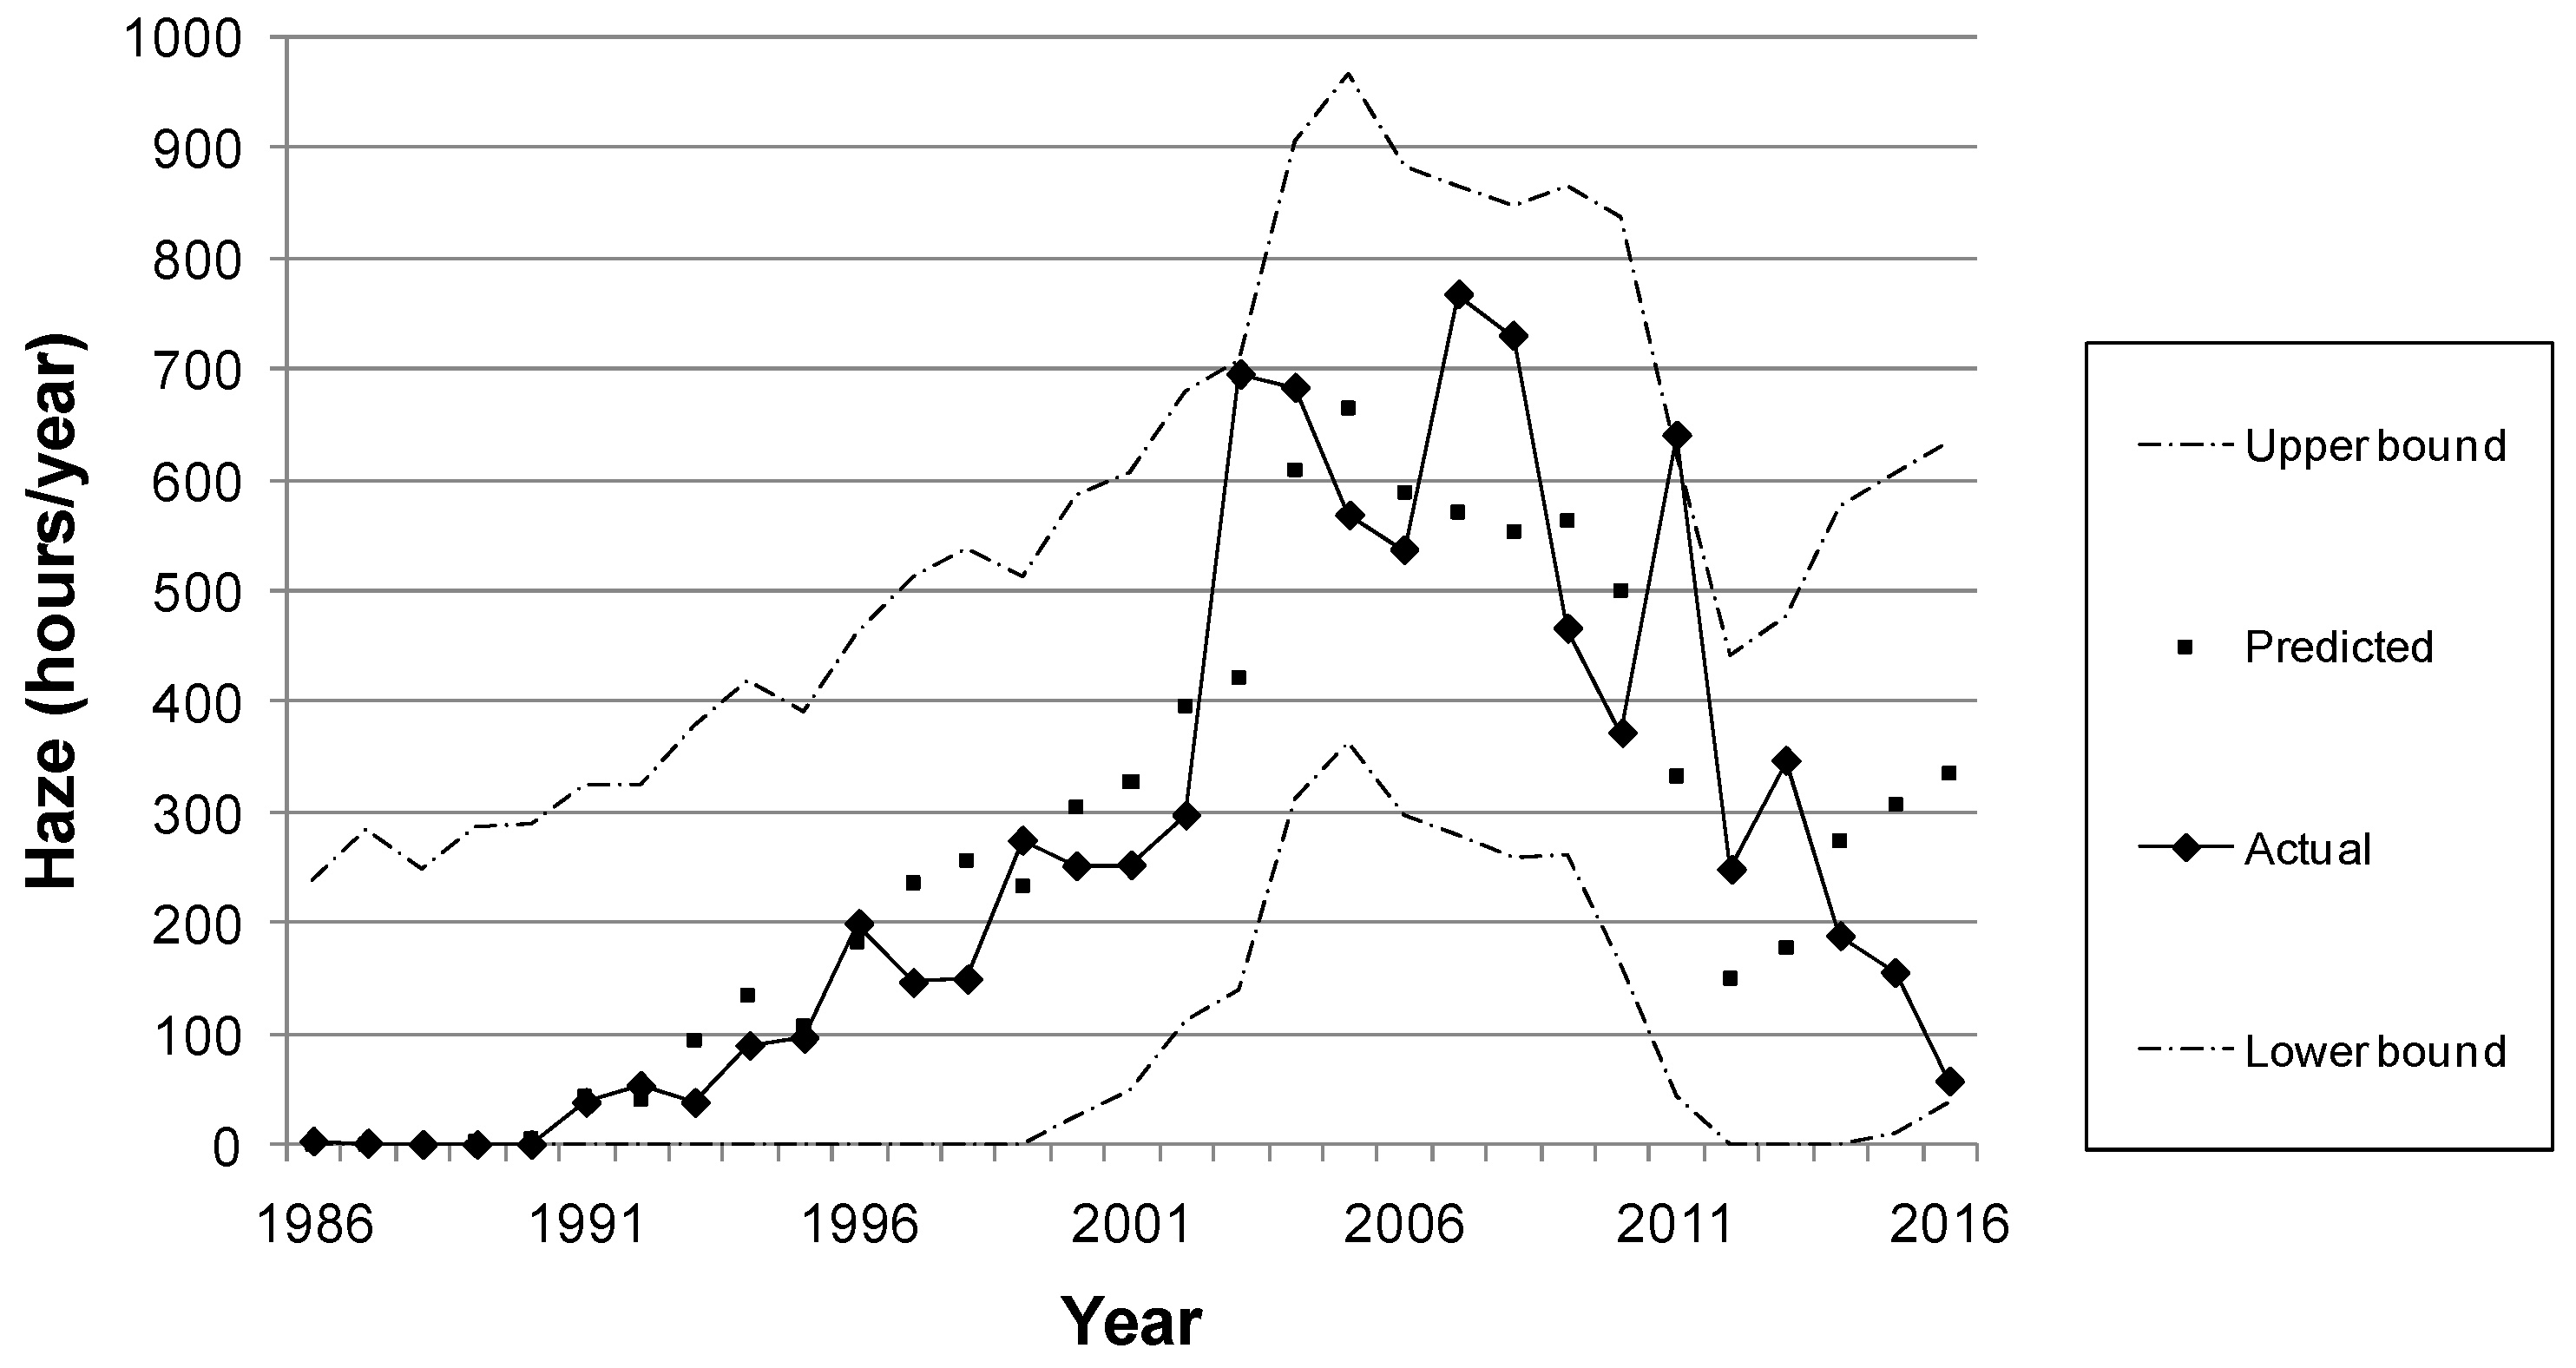
Figure 5.
The numbers of haze days in Guangzhou over the period 1986–2016.


Table 1.
Import of fossil fuels (primary source of energy) in 1986, 1991, 1996, 2001, 2006, 2011, and 2016.
Table 1.
Import of fossil fuels (primary source of energy) in 1986, 1991, 1996, 2001, 2006, 2011, and 2016.
| Year | Primary Energy in TJ | ||||||
| Motor Gasoline | Gas oil & Diesel | Fueloil | Kerosene | Liquefied Petroleum Gas | Natural Gas | Aviation Kerosene 1 | |
| 1986 | 666 | 4878 | 5660 | 533 | 358 | 0 | 0 |
| 1991 | 748 | 4240 | 8438 | 417 | 561 | 0 | 0 |
| 1996 | 1263 | 3498 | 10,842 | 363 | 952 | 0 | 2057 |
| 2001 | 1340 | 3869 | 12,509 | 447 | 1117 | 0 | 3803 |
| 2006 | 1777 | 6195 | 12,427 | 295 | 1488 | 0 | 8769 |
| 2011 | 2659 | 5787 | 3864 | 190 | 1954 | 2873 | 6003 |
| 2016 | 3329 | 4526 | 6270 | 95 | 2032 | 393 | 10,258 |
| Year | Secondary Energy (i.e., Electricity in GWh) | ||||||
| Net Imported Electricity 2 | Net Electricity Produced Locally 3 | Electricity Consumed | |||||
| 1986 | 42 | 489 | 531 | ||||
| 1991 | 95 | 756 | 860 | ||||
| 1996 | 222 | 1126 | 1348 | ||||
| 2001 | 249 | 1353 | 1602 | ||||
| 2006 | 946 | 1459 | 2424 | ||||
| 2011 | 3165 | 691 | 3856 | ||||
| 2016 | 4306 | 988 | 5294 | ||||
1 The Macao International Airport was opened for commercial operations in November 1995. 2 Macao has started to rely more heavily on imported electricity since 2007. 3 Macao’s oil-fired power plants primarily used fuel oil (93 percent) and diesel oil (7 percent) to generate electricity before 2007. Macao’s power company started using fuel oil and natural gas to generate electricity in 2008 but its natural gas supplier was not able to supply natural gas to Macao’s power plants in 2012, 2013, 2015, and 2016. Macao’s oil-fired power plant efficiency was about 41 percent while Zhuhai’s coal-fired power plant efficiency was about 40 percent [27].
Table 2.
Results of Dickey-Fuller tests.
| Critical/Tau Values | Annual Haze Time-Series | Annual Total Primary Energy Consumption Time-Series | ||||
|---|---|---|---|---|---|---|
| Constant, No Trend | Constant, with Trend | Constant, No Trend | Constant, with Trend | |||
| Calculated tau value | −1.693 | −1.256 | −1.351 | −1.081 | ||
| Critical value [24]: | For a sample size of 25 | Significant at 0.01 level | −3.75 | −4.38 | −3.75 | −4.38 |
| Significant at 0.05 level | −3.00 | −3.60 | −3.00 | −3.60 | ||
| For a sample size of 50 | Significant at 0.01 level | −3.58 | −4.15 | −3.58 | −4.15 | |
| Significant at 0.05 level | −2.93 | −3.50 | −2.93 | −3.50 | ||
| Null hypothesis-stationary | rejected | rejected | rejected | rejected | ||
Note: n = 31 in these cases.
Table 3.
Correlations between haze, energy consumption, and meteorological conditions.
| Energy Use (in TJ) | |||||||
| Motor Gasoline | Gas Oil/Diesel | Fuel Oil | Kerosene | Liquefied Petroleum Gas | Natural Gas | Aviation Gasoline | |
| Haze | 0.38 * | 0.73 ** | 0.17 | −0.33 | 0.59 ** | 0.34 | 0.66 ** |
| Annual Meteorological Conditions | |||||||
| Annual Mean Atmospheric Pressure | Annual Mean Air Temperature | Annual Total Rainfall | |||||
| Haze | −0.10 | −0.35 | 0.08 | ||||
Note: n = 31 (i.e., 31 pairs). * p < 0.05. ** p < 0.001.
Table 4.
Pair-wise correlations between haze and meteorological conditions.
| Year | Correlation between Haze and Monthly Mean Atmospheric Pressure | Correlation between Haze and Monthly Mean Air Temperature | Correlation between Haze and Monthly Total Rainfall |
|---|---|---|---|
| 1986 | −0.47 | −0.47 | −0.11 |
| 1991 | −0.24 | 0.22 | 0.24 |
| 1996 | 0.10 | −0.33 | −0.35 |
| 2001 | 0.31 | −0.15 | −0.31 |
| 2006 | 0.70 ** | −0.43 | −0.75 ** |
| 2011 | 0.79 ** | −0.82 ** | −0.63 * |
| 2016 | 0.51 * | −0.43 | −0.32 |
Note: n = 12. * p < 0.05. ** p < 0.01.
© 2017 by the authors. Licensee MDPI, Basel, Switzerland. This article is an open access article distributed under the terms and conditions of the Creative Commons Attribution (CC BY) license (http://creativecommons.org/licenses/by/4.0/).
Share and Cite
MDPI and ACS Style
To, W.-M.; Lee, P.K.C.; Ng, C.T. Factors Contributing to Haze Pollution: Evidence from Macao, China. Energies 2017, 10, 1352. https://doi.org/10.3390/en10091352
AMA Style
To W-M, Lee PKC, Ng CT. Factors Contributing to Haze Pollution: Evidence from Macao, China. Energies. 2017; 10(9):1352. https://doi.org/10.3390/en10091352
Chicago/Turabian StyleTo, Wai-Ming, Peter K. C. Lee, and Chi To Ng. 2017. "Factors Contributing to Haze Pollution: Evidence from Macao, China" Energies 10, no. 9: 1352. https://doi.org/10.3390/en10091352
Note that from the first issue of 2016, this journal uses article numbers instead of page numbers. See further details here.