1. Introduction
Generally, distribution networks are designed to support a certain amount of load depending on power consumption pattern. Addition of EVs would affect the overall load pattern, leading to power quality concerns such as voltage unbalance, in diverse manner depending on EV charging pattern over a day. In general, assessment of an expected overwhelming EVs charging loading profile and its consequent power quality impact in a distribution network could be carried out using either a deterministic method or through stochastic modeling of EVs charging pattern [
1,
2]. As a fact of matter, it is complicated to quantify a number of EV charging events per day and the associated load and impact on the grid through a deterministic approach because it involves multiple factors involving complete mobility pattern of an EV driver/owner. Thus, there is need to develop a probabilistic model of EV charging to estimate an expected load in the system to illustrate rigorous power quality index that may be used by utilities to upgrade their infrastructure for supporting large penetration of EVs [
3]. In literature, most authors modeled EV charging load based on some reasonable assumption while ignoring a few important aspects. For instance, in reference [
4], authors assume a fixed percentage of EVs and in [
5] all EVs are assigned a certain distance traveled per day. A rigid EV charging schedule is assumed in [
6,
7]. Authors in [
8,
9] assume a certain mileage and corresponding fixed amount of power consumption by each EV. Papers [
10,
11] consider a predefined probability distribution curve to estimate a covered mileage and associated power consumption. In this regard, authors in the references [
12,
13,
14] have made a good attempt to enlighten impact of EVs on power system reliability through different approaches. Authors in [
12] presented the development of a probabilistic model considering the driving distance, charging times, charging locations, battery state-of-charge, and charging requirements of a plug-in hybrid electric vehicles (PHEV) considering the important PHEV characteristics, charging scenarios, and power system parameters. A probabilistic analytical approach is applied in [
14] using an IEEE reliability test system with limited stochastic features of EV charging. The research reported in reference [
15] presented the development of a control method for bidirectional charging and discharging with limitation of defining moment of charging for PHEVs only. An estimation of EVs charging load and its impact on power system is also reported in [
16] but with limited adequacy.
To the authors’ best knowledge, there is room to develop a comprehensive probabilistic model to describe EVs charging load to estimate an expected load data that may be used by utilities to upgrade their infrastructure for supporting large penetration of EVs in near future. Assuming EV charging load and its impact on the grid through a deterministic approach may not exhibit realistic scenarios and practicing results. In fact, EVs are meant to serve not only as conveyance but also as energy storage devices. More importantly, in order to use the battery effectively, we must know the current and future Profile of the Departure and Travel Time (PDTT) of a vehicle.
In fact, the power consumption and the corresponding consequences of an EV charging load may either be quantified based on daily energy consuming residential activities or driving activity pattern of individual and it can be developed through a comprehensive probabilistic modeling of related residential activity in combination with EV driving patterns to demonstrate its affect in terms of voltage unbalance. Thus a probabilistic modeling of EV charging pattern associated with residential load for voltage unbalance assessment is developed while considering all the relevant factors explained in
Section 2.
2. Stochastic Modeling Approach
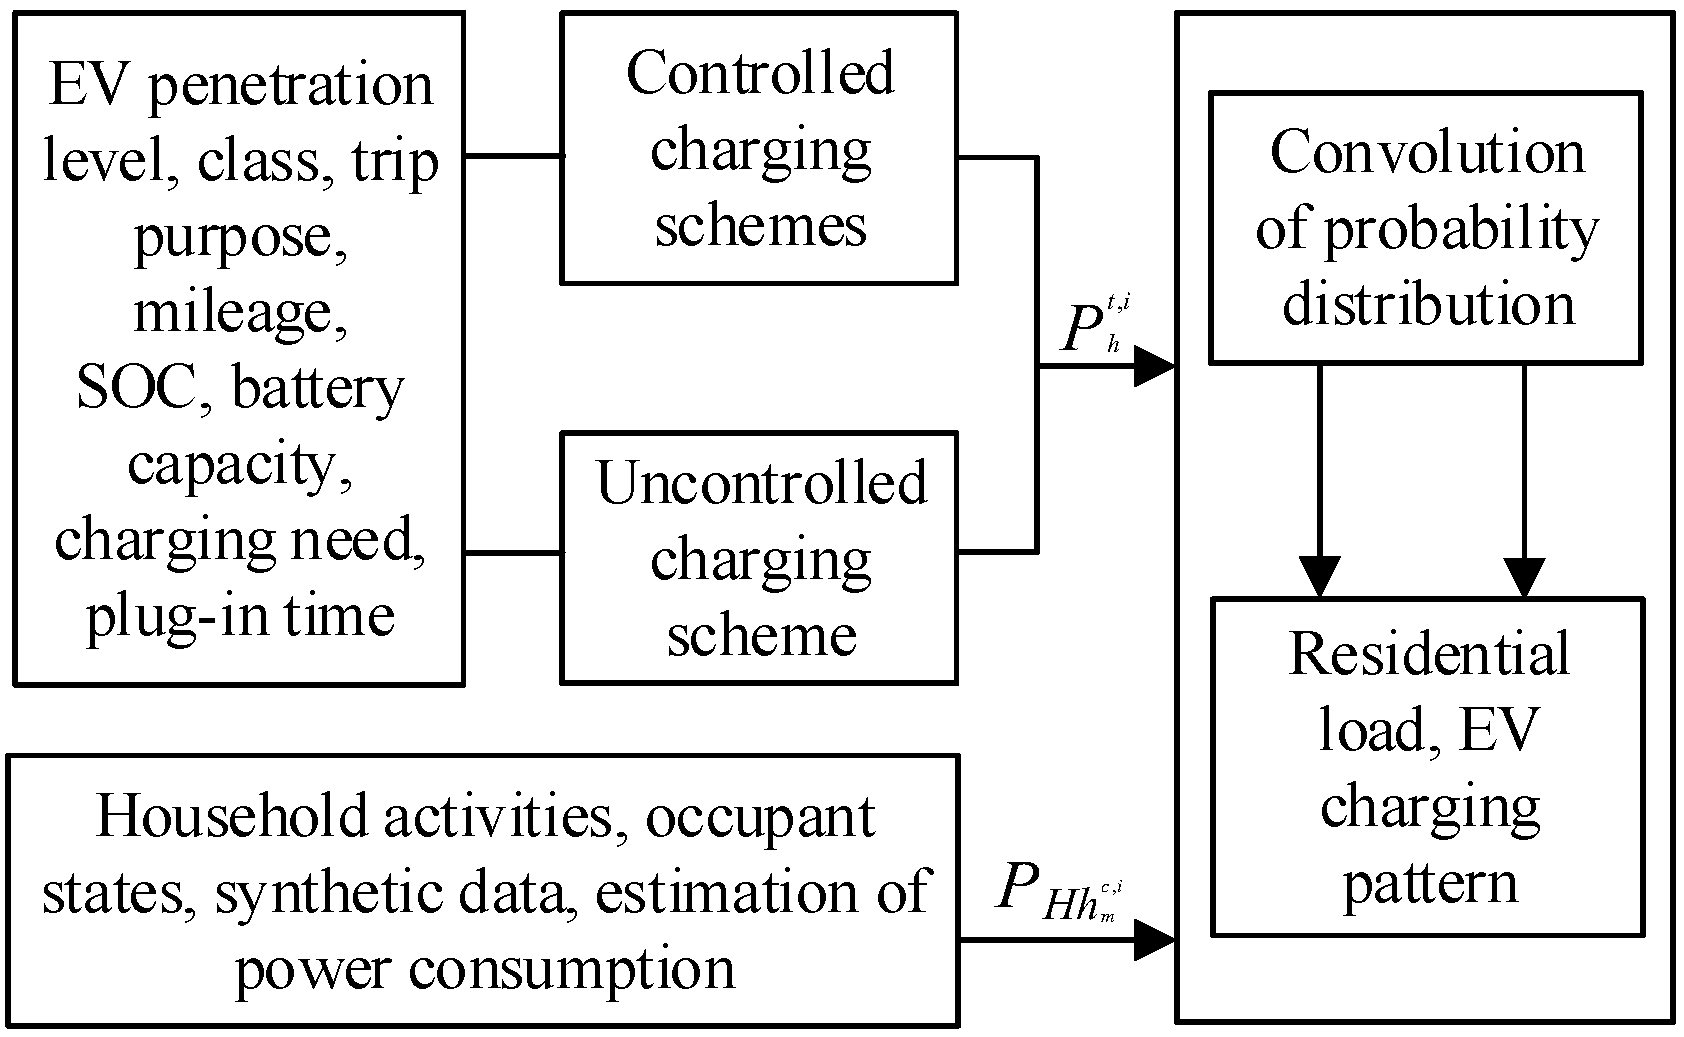
This model is aimed at estimating an EV charging profile with inter-related electricity-dependent residential activities to demonstrate its power quality index in terms of voltage unbalance. The modeling scheme is shown in
Figure 1.
Following factors are considered and need to be defined for stochastic modeling to come up with a probabilistic charging pattern of all EVs in the system: EV penetration level in the study network, class of EVs (car, van), EV battery capacity, state of charge (SOC) of battery at time , EV driving habits, type of trip in view of trip purpose in terms of schooling, commuting, holiday trip, mileage, vehicle battery capacity, charging need and charging time (plug-in moment), state of charge (SOC), recharging frequency per day, usage diversity and dynamic charging price factor under two different types of EV charging schemes are considered including controlled and uncontrolled charging in accordance with peak of off-peak hours, i.e., these are categorized based on grid loading conditions and corresponding variable electricity price. The charging need is reflected in terms of amount of electrical energy consumed by driving an EV or total energy transferred to EV battery when plugged-in for recharging. Residential load modeling is based on discrete time stochastic Markov chain model that yields data of synthetic activity through modeling the behavior of an occupant. The presented work gives probabilistic model of EV charging pattern over a period of 24 h through stochastic modeling of all the corresponding features, mentioned above, and then corresponding voltage unbalance factor (VUF) is computed at load buses of the network.
3. Modeling of Residential Load Activities
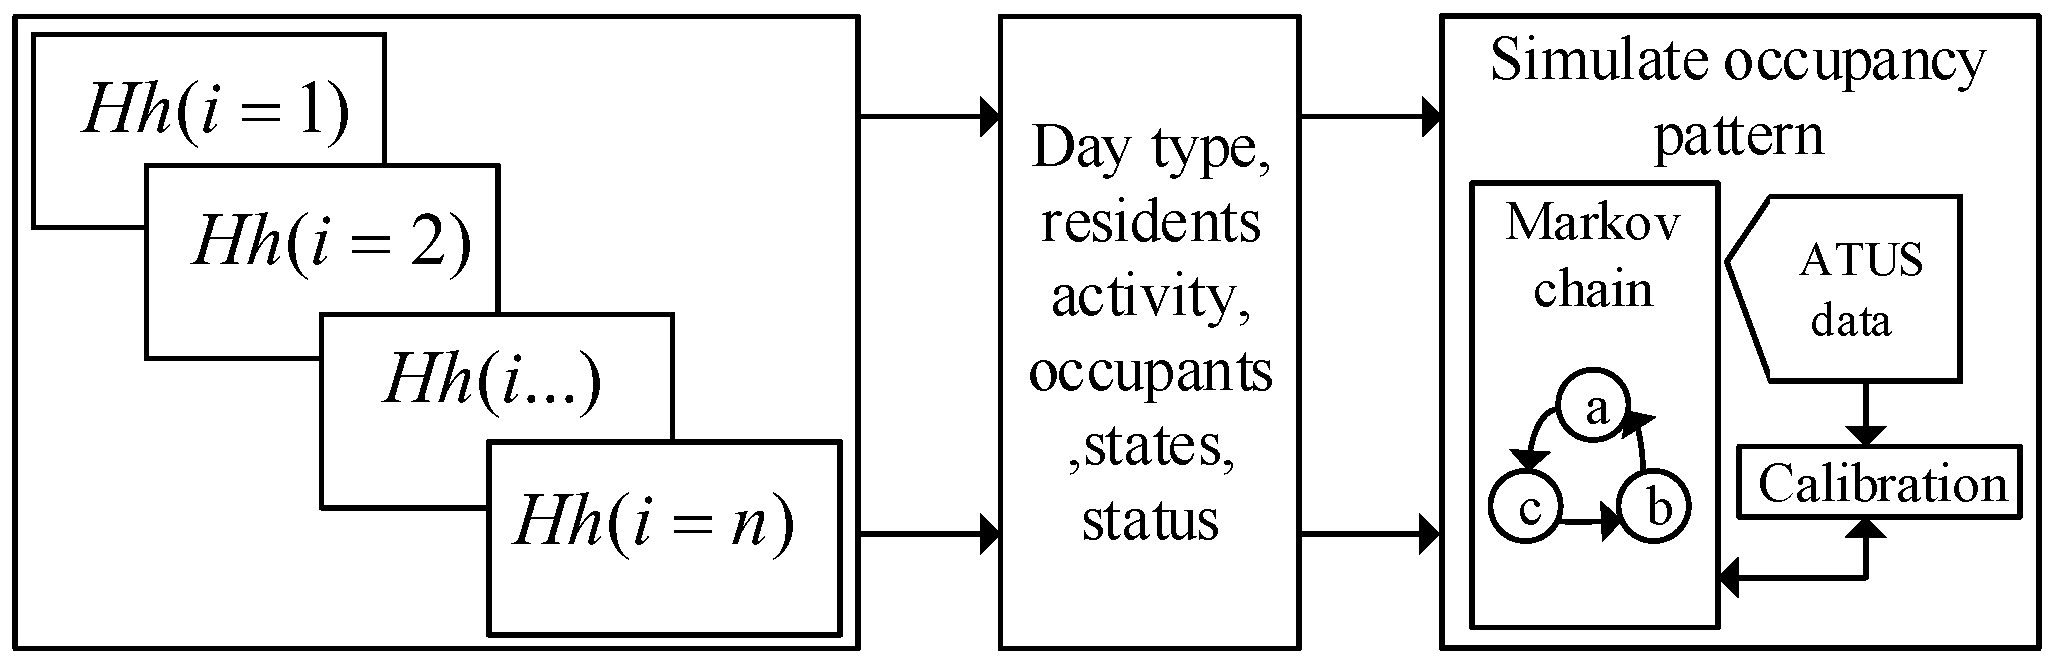
This modeling is based on discrete time stochastic Markov chain model that yields data of synthetic activity. The model involves heterogeneous Markov chain for prediction of energy consumption through modeling the behavior of an occupant. An activity pattern for each individual is formed for calculating associated power consumption. A set of all possible activities are categorized as power consuming activities and non-power consuming activities including sleeping, book reading, cleaning, laundry, cooking, dish washing, leisure, away, when working and not working and it is assumed that each individual would occupy one of these nine states in discrete time steps.
Occupancy profile and power demand can be generated by simulating human activities. The modeling scheme is shown in
Figure 2.
Occupancy Pattern, Cumulative Activities and Power Consumption
Considering
N number of possible states denoting as
according to Markov property, the probability for a process to occupy a state
at time
t may be found using transition matrix, as given in Equation (
1).
A daily activity pattern is characterized by time of a week including weekday and weekends i.e.,
, age groups
or gender
G of an activity occupant, status of employment
and etc, based on the statistics defined in American Time Use Survey (ATUS) [
17]. Sub-sampling of the whole data collected for each person during time
yields a set of transition probabilities.
In order to calibrate the residential model with probability distribution modeling, the probability distribution function (PDF) and cumulative distribution functions (CDFs) are defined and modeled according to the system parameters. Let’s suppose
where
represents a scalar quantity (e.g., activity) and
is a consumer entity, and expected value of
is
and is expressed in Equation (
2).
where
,
and
represent variance, standard deviation of each individual and correlation between individuals respectively. Variance of linearly combined percentile values due to a certain variance between loads is obtained through sum of derivatives, as given in Equation (
3).
where,
are the parameters of beta PDF, ‘
’ is the upper bound of scaled parameter range, ‘
’ is the lower bound,
represents confidence level/interval and
is the inverse beta function,
represents variance of distribution
and
stands for conditional variance of percentile distribution of
[
18]. The Markov chain yields time dependent activities for
, sample
i and activity
a.
4. Stochastic Modeling of EV Charging
This section basically presents an estimation tool of the PDTT of the EV over 24 h that is based on the Statistics of the Departure and Travel Time (SDTT). This section formulated the prediction problem of PDTT in terms of maximum-likelihood estimation criteria under the condition that the SDTT is available. We have presented a global optimal formula within a rationale of computational complexity cost, and for that firstly, a Markov model is presented with all possible PDTT of an EV and is derived from the available SDTT. In the stochastic modeling, plug-in time and charging moment of EV charging are considered important, as it may reflect an instant increase in load when an EV is plugged-in and the charging pattern is characterized by the factors mention in
Section 2. It is worth-noting that number of charging event may not be simply computed based on number of EVs in a distribution network zone rather it depends on activity pattern of an individual and the related iterations. The stochastic modeling is given in the following sub-sections.The novel features we have introduced in this section include: we have applied the proposed scheme to multiple users with their different driving habits, different routes, different occupation and different living style and have incorporated environment related information with a number of EVs and diverse driving data as explained above. This section also covers the major requirements of fast and precise on-line state estimation (SE) criteria that is required in integrating EV into systems. The presented approach is totally different from the state-of-the-art deterministic approaches, as it uses a probabilistic state transition model to account for these novel uncertainties by efficient and new distributed state estimation. A contribution is made in EV activity pattern modeling by considering a number of possible purposes of different trips and formulating their probability of occurrence using categorical distribution function.
4.1. Departure and Travel Time Profile
Profile of departure and travel (DTP) time is represented as a binary pattern. Let
T be time of a full day, the departure time is represented as
and the distance traveled is
i.e., an EV starts travel at
and remains in travel for period
. The statistics of departure and travel times are taken from [
19,
20]. Estimation of maximum likelihood of a departure and travel times for an individual, in a period of day, is formulated based on the statistical date given in reference [
21,
22]. Considering
and
as two variables that represent a state at time
t and the latest departure time respectively.
Given:
and
to find:
,....
, and maximizing:
where,
represents number for departures for an EV,
and
are random variables and ∀ is a universal quantifier. Objective of the function defined in Equation (
4) is to represent a joint probability as a combination of two states
and
. Equation (
5) implies that only current departure time is considered in a period of a day where travel time of an EV must fall within
. Equation (
6) means that there should not be an overlapping/repetition of traveling periods (i.e., one travel time is calculated only once), thus the duration of travel must be predicted for a day [
23,
24].
Having decomposed the maximizing process using Markov property and introducing some variables to obtain recursive solution, as given in Equation (
7), with
and
, an optimal state after
is given in Equation (
8).
4.2. EV Activity Pattern Model
Having formulated the profile of departure and travel/arrival time, the research study proceeds with EV trips and driving pattern modeling. In order to involve controlled and uncontrolled charging, a day is divided into three different time sets including peak and off-peak load hours, based on an average daily load curve given in [
25]. A Monte Carlo Simulation (MCS) based probabilistic model is developed using transportation survey data taken from American Time Use Survey 2009 (ATUS) [
17,
26]. The model uses categorical distribution function and is divided into five stages,
through
and these are explained below. Total number of EVs in the study area are divided into a number of possible purposes of different trips
k and corresponding probability of occurrence of a trip with a particular purpose is represented in Equation (
9).
where,
is the probability for a trip to occur with purpose
and
is an integer variable.
,
represent number of purposes, number of trips for
u and average trips per year respectively, and
stands for total number of EVs considered. Adopting bottom-up approach, yearly trips are divided into 12 months, where, probability of a trip in month
m is expressed in Equation (
10). Similarly,
is an integer variable,
stands for probability for a trip with purpose
u that is likely to occur in a particular month
a.
Probability of a trip to happen in a day is given in Equation (
11). In the next stage, two types of days are considered including week day and weekend, i.e.,
would be same for up to five days and different for other two days (weekend).
where,
,
and
denote the probability of occurrence of a trip with purpose
u in a specific day type
, number of weeks in a month and total trips in a day
d respectively. Furthermore, the total trips in a day are distributed among number of EVs as per Log-normal PDF with a mean and standard deviation, as expressed in Equations (
12) and (
13).
where,
z is an integer that denotes number of daily trips,
is the daily trips per EV and is defined as
,
stands for number of EVs with day trips
z in month
m and
is the standard deviation.
represents probability of trips
z in day
. Furthermore, the trips are distributed into 24 h of a day.
5. EVs State Transition and Battery Usage
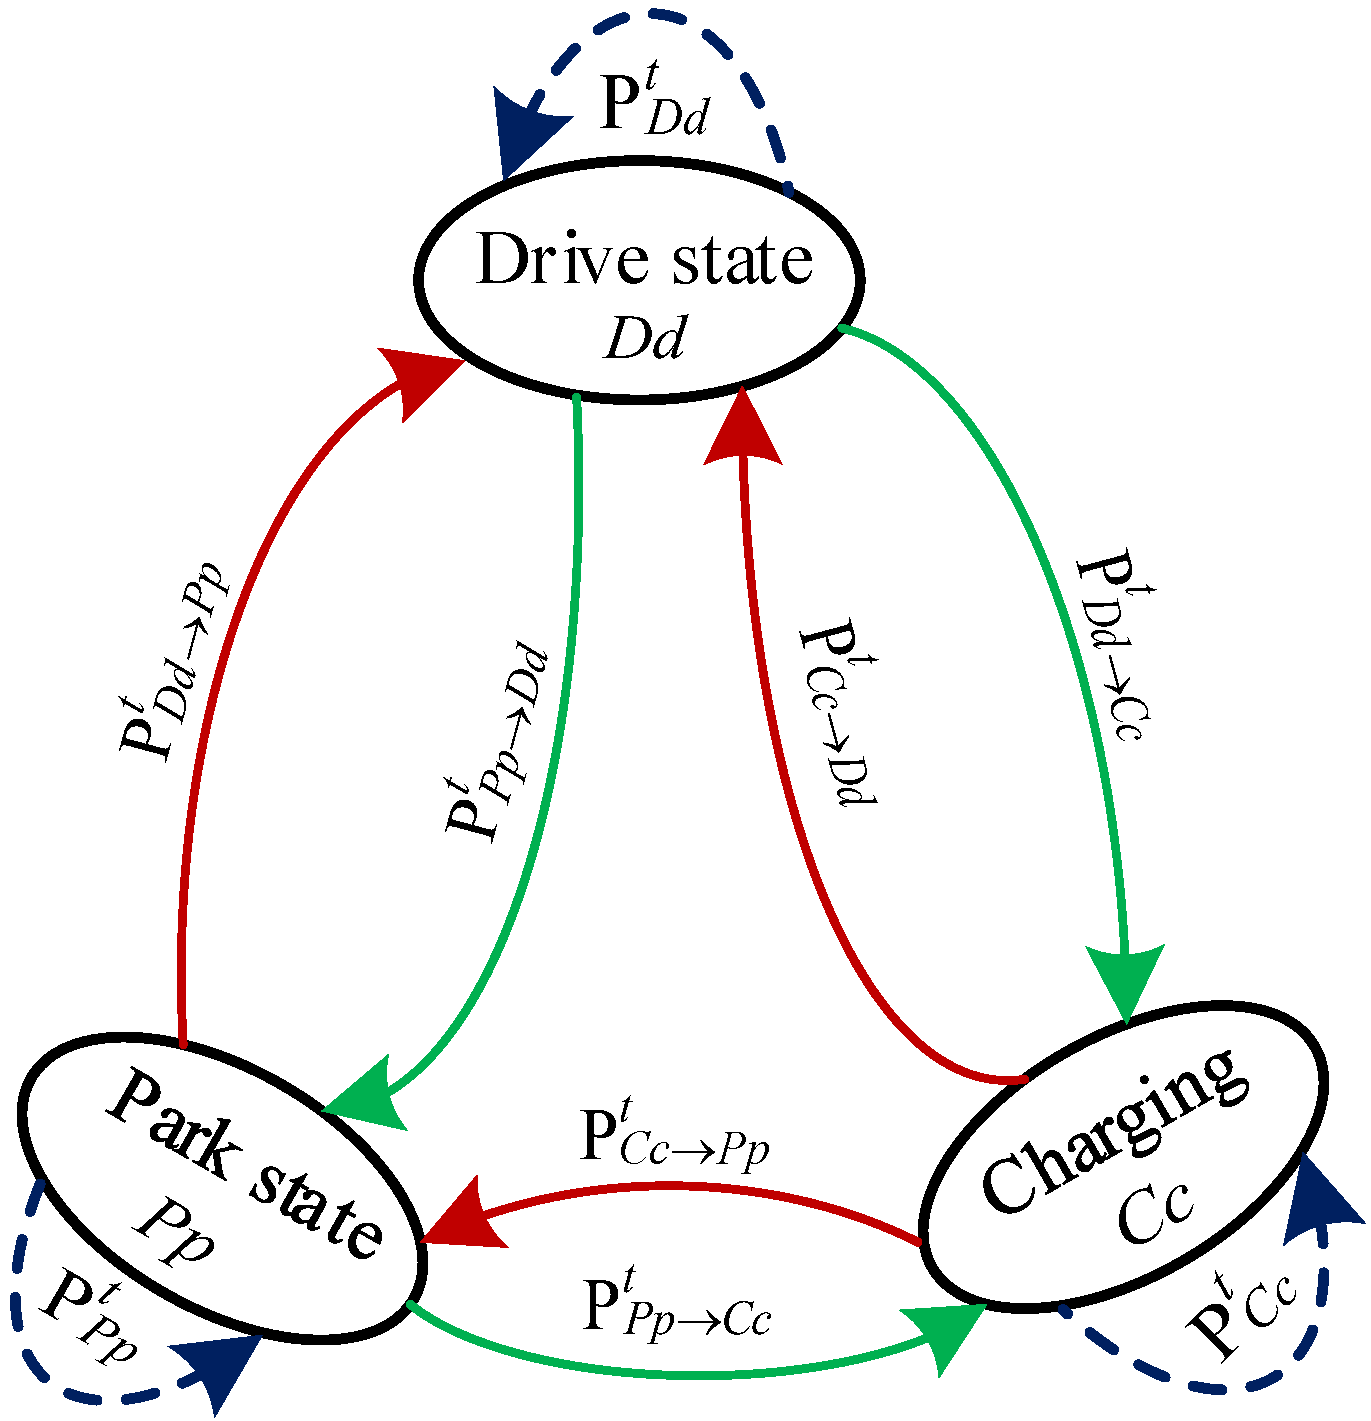
The modeling is carried out in two stages: firstly a travel pattern model is developed and then a charging pattern model is determined. MCS is used to generate trip mileage based on corresponding purpose while covering diversity factors. States of EVs at 30 min time step with its year-round movement pattern is simulated based on discrete-state and time Markov chain process, assuming that an EV would occupy one out of a finite set of three states including, movement (drive), parked and being recharging and these are represented by
respectively. For various activities, a trial is performed at each time step, EV state transition probability is represented in
Figure 3. Occurrence of an events/state at time
t is represented by
with probability
.
The equalities, as given in Equation (
14), are arbitrarily satisfied for
. The battery consumption
of an EV depends on multiple factors such as velocity
of the vehicle, driving patterns
and activity co-efficient
. The EV battery depletion is restricted by a certain depth of discharge
.
The estimation of an expected charging profile
may be carried out using Monte Carlo Simulation (MCS) for
n number of samples.
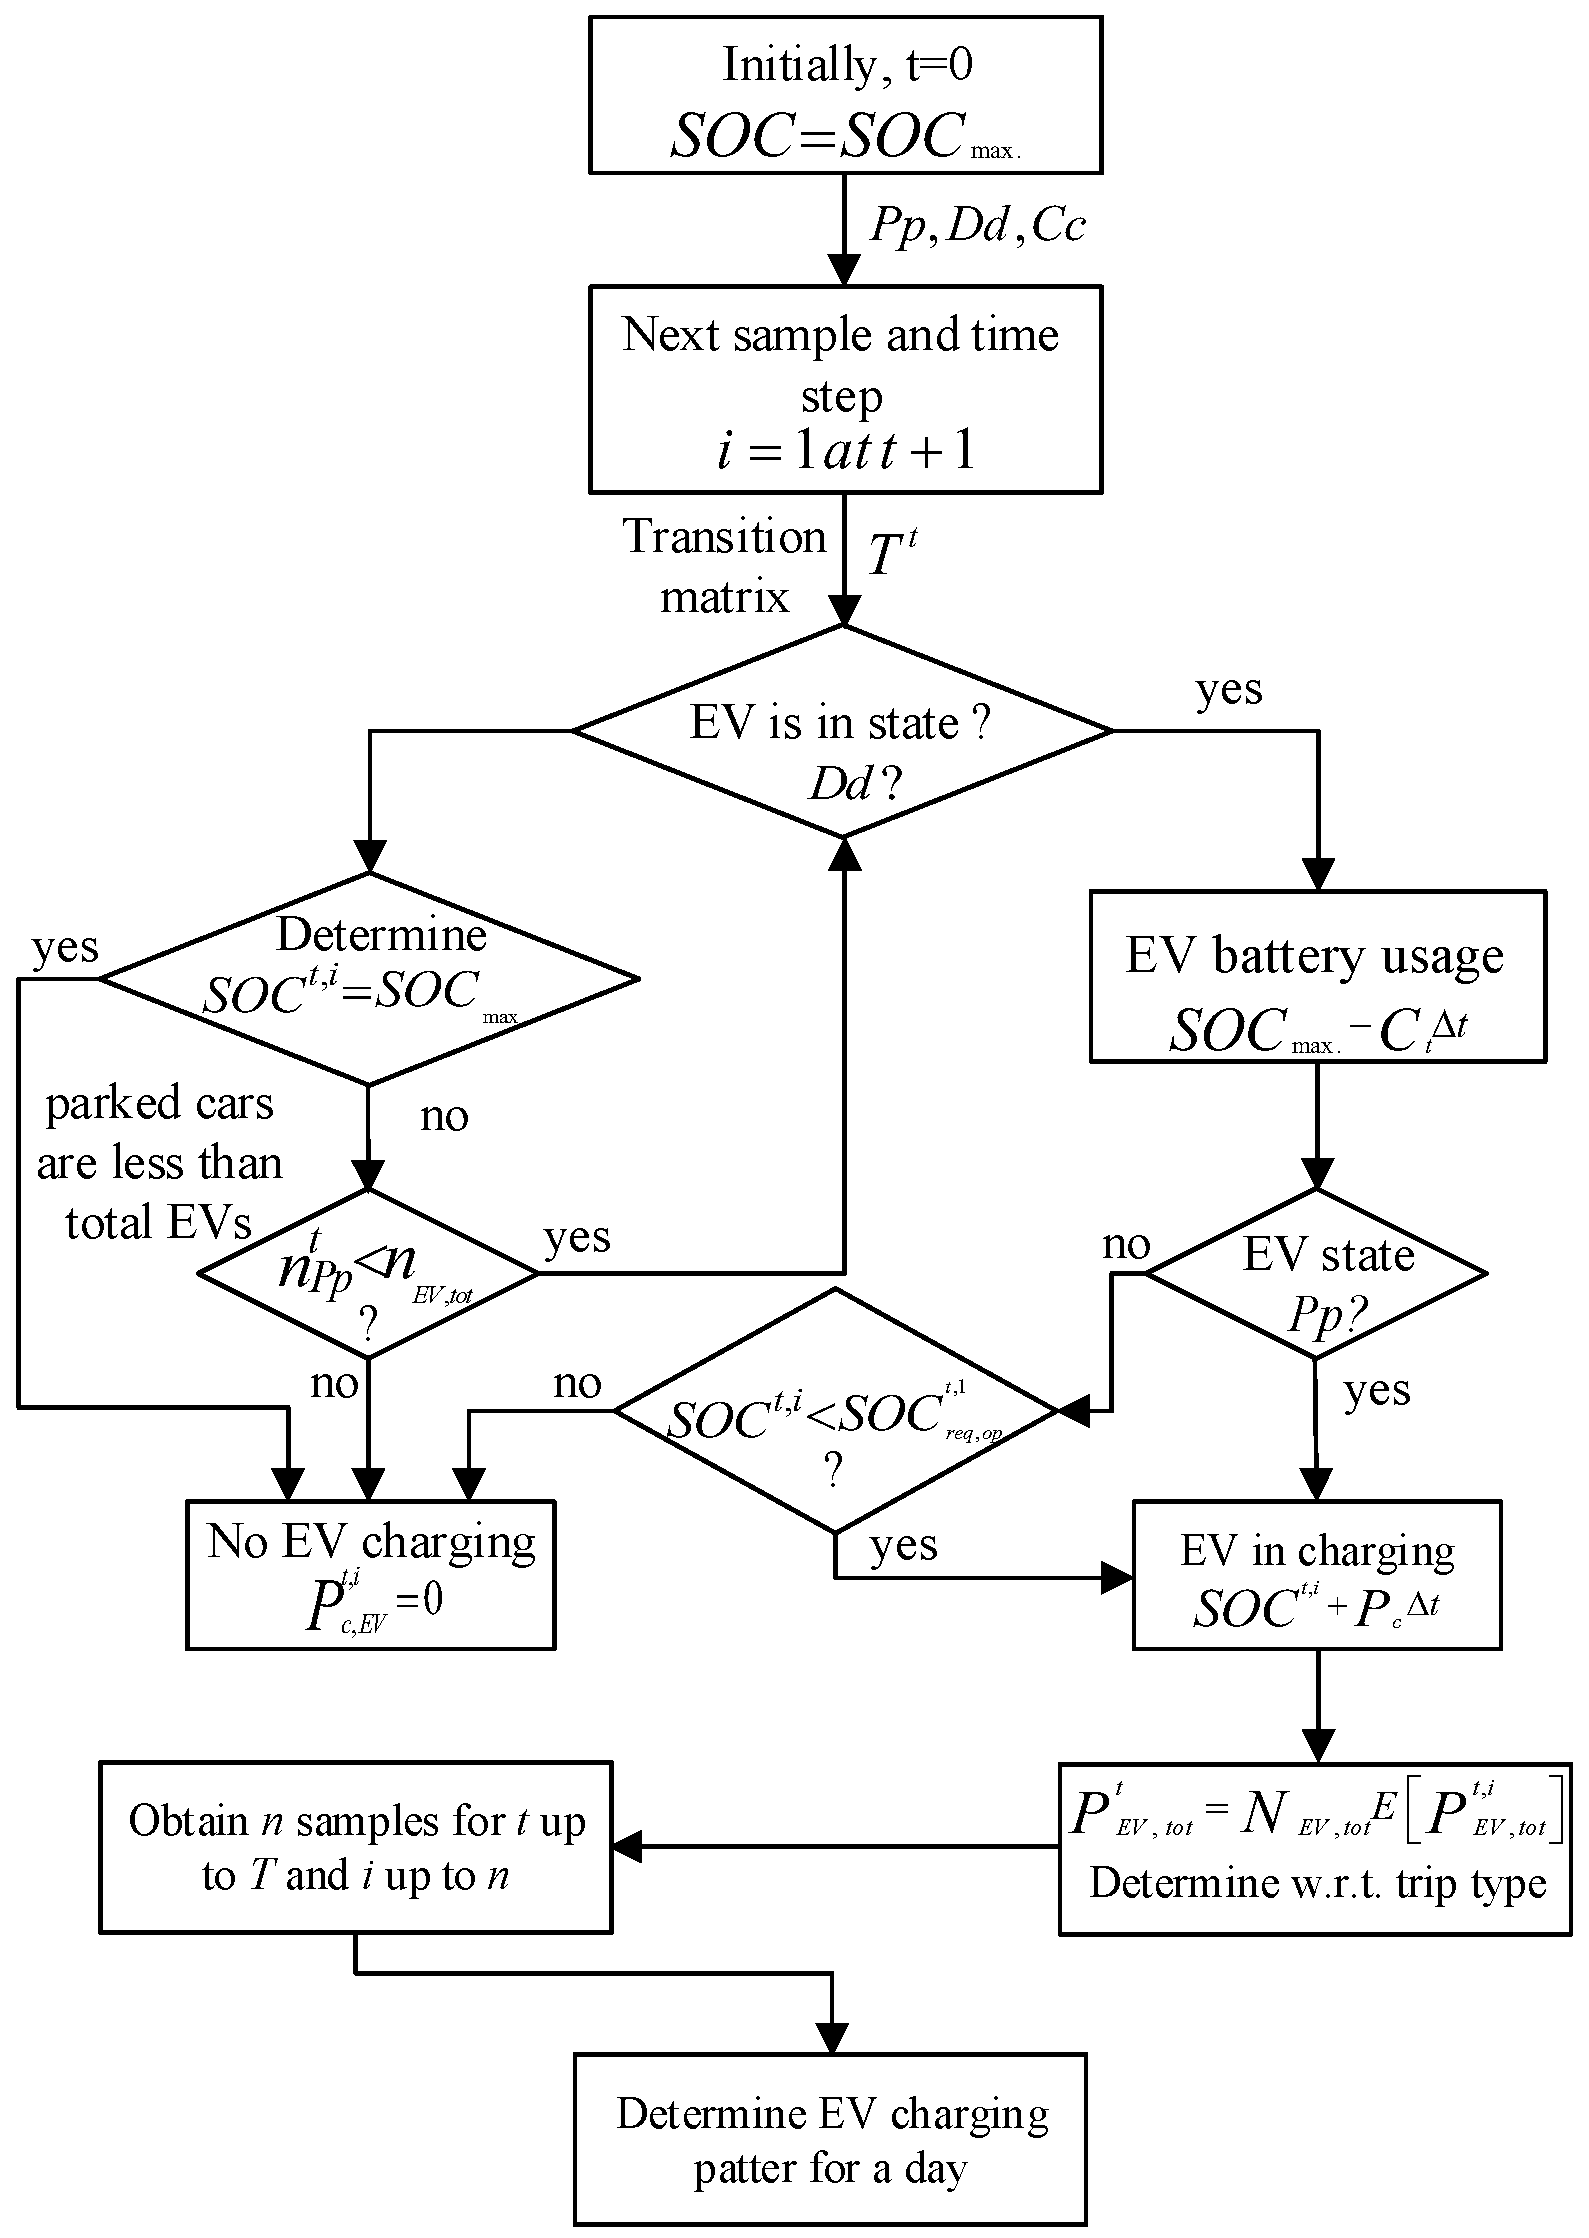
A scheme for determining an EV charging pattern over 24 h is shown in
Figure 4. The algorithm mainly takes into account estimation of charging profile and activity pattern based EV battery usage with illustration of SOC parameters, state transition probability (of EVs states) estimation and etc. Initially, it starts with current and predicts EV’s states based on transition matrix at next sample
i and time step. After determining the battery state, an expected charging profile is quantified with respect to trip type for
n samples for
t up to
T and
i up to
n.
One of the main issues faced by EV charging scenarios is the uncertainties that when and where an electric vehicle will travel and that when will it be re-charged in any next time slots. This major problem requires the development of stochastic based novel approaches to quantify the corresponding load profiles. The novel contribution of this section is the development of a mathematical tool that is based on statistical data which is not available in literature. Computation of state transition probability is of its own kind. For various activities, a trial is performed at each time step, and EV state transition probability is represented in accordance with the proposed simulation algorithm, which make it distinct from other researches. The presented scheme for determining an EV charging pattern hours is exclusively devised, shown in
Figure 4 in the manuscript. The algorithm may certainly be considered a significant contribution which not only considers stochastic factors of travel pattern and charging pattern but it also takes account of EV battery parameters.
6. EV Charging Load Model, Voltage Unbalance and System Description
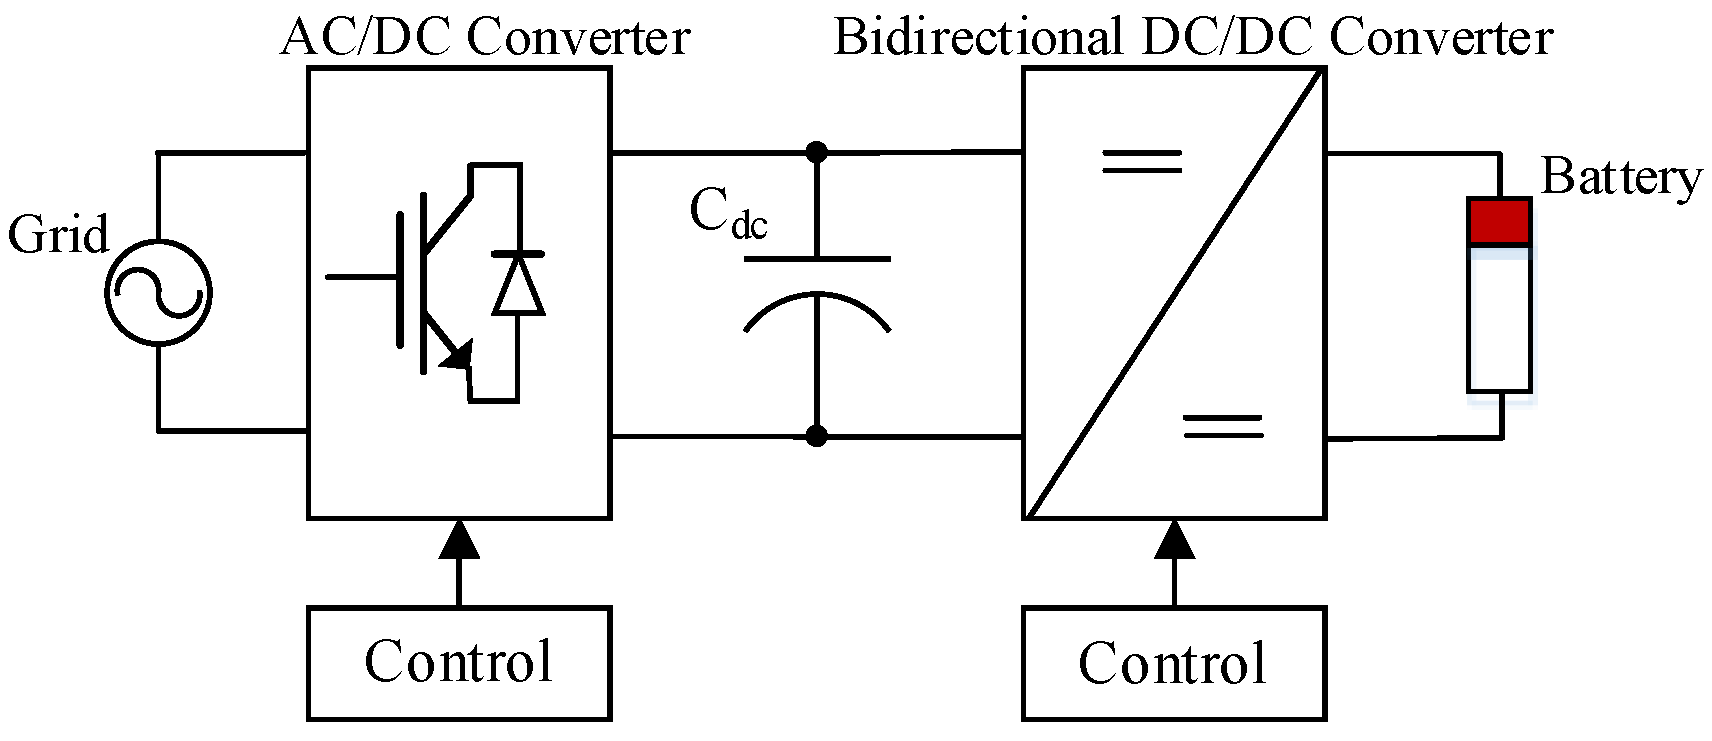
An EV charging load is modeled as a real kind of electric vehicle. The model is not assumed to draw a constant charging power from the grid and SOC is considered based on the battery voltage and internal resistance while taking into account converter losses. A diagram of EV grid integration is shown in
Figure 5.
Voltage unbalance is defined a ratio of the negative sequence voltage component to the positive sequence voltage component, [
27]. Mathematically it is given in Equation (
15).
where,
=
,
and
represent positive and negative sequence voltage components respectively. The European Norm EN 50160 IEC 61000 are considered relevant standards for EV charging requirements and are used here, [
28,
29].
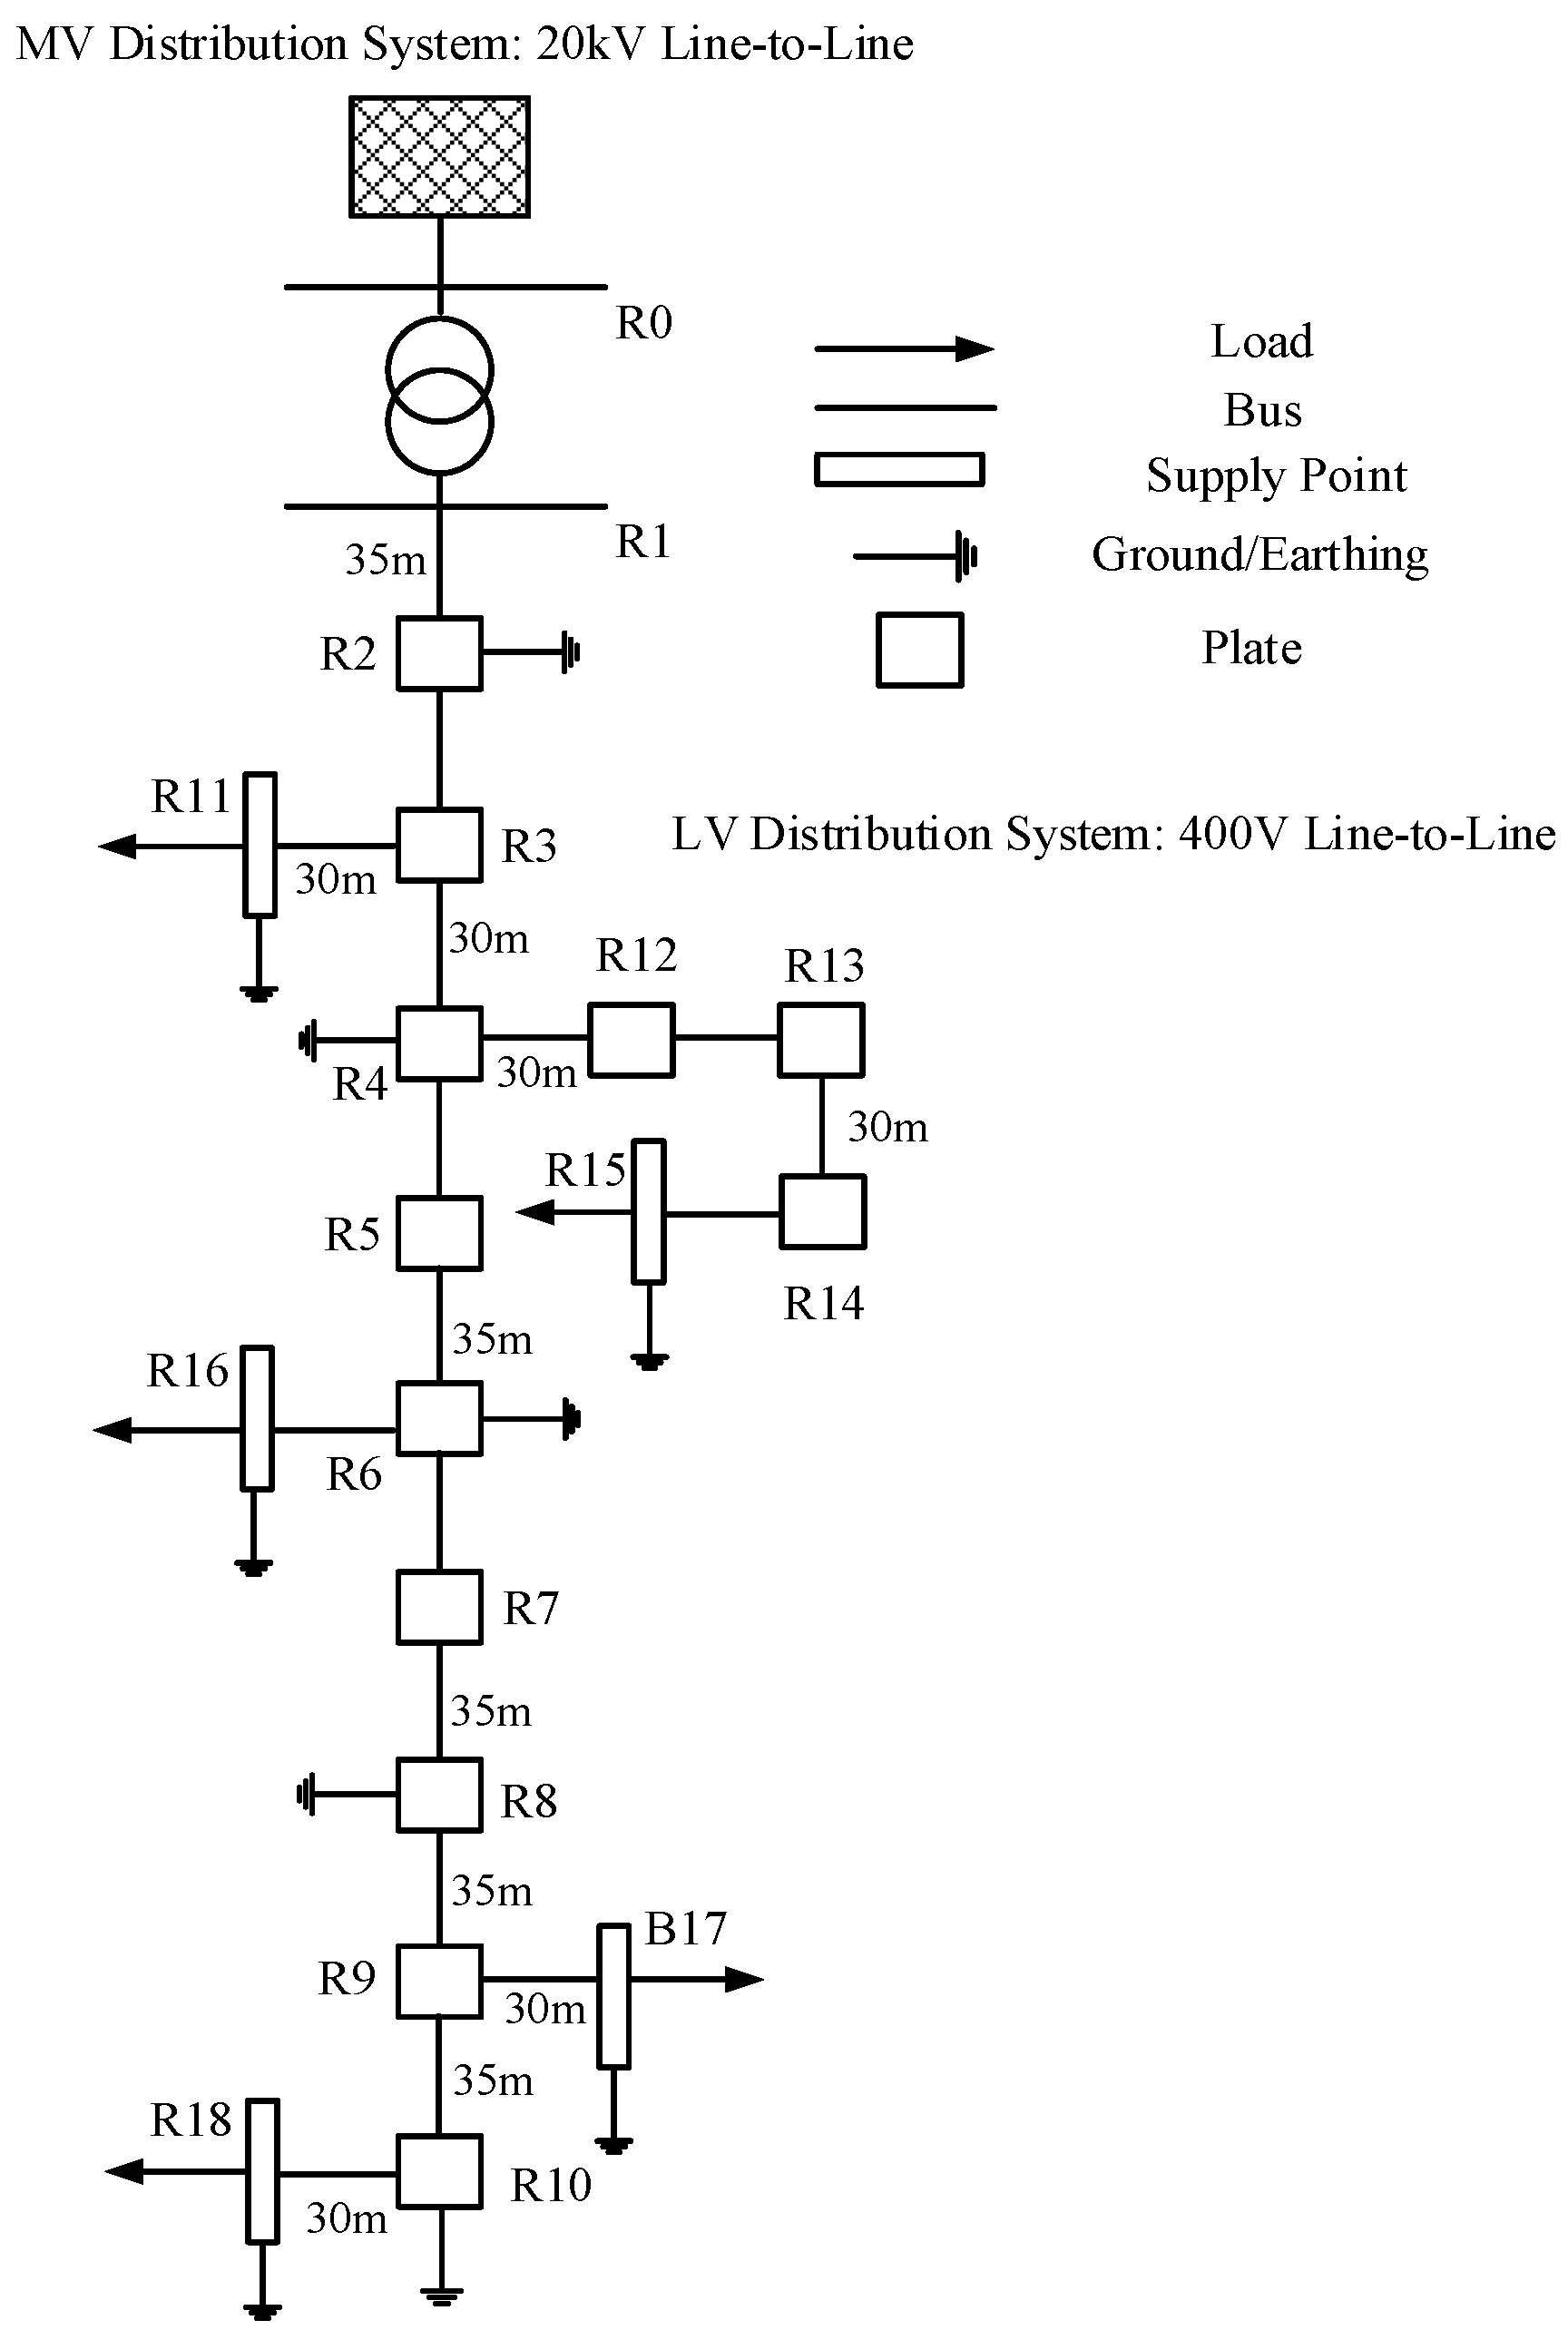
The sample LV distribution network is based on network by CIGRE Task Force C6.04.02 [
30]. In the urban distribution feeder it is assumed that the load is equally distributed before addition of EV charging load. The distribution network is depicted in
Figure 6. It is pertinent to mention, that the presented work is the only attempt to test this network through EV charging load which is obtained under probabilistic modeling. Again, it is not reported anywhere in the literature. All other deterministic approaches on the same network yield results which may not reflect the real-time scenarios. Thus, the approach adopted in this paper is more tangible and yields the results which have more real life implications.
7. Case Study
This case study presents an EV charging pattern over 24 h of a day for three different EV penetration levels under two case scenarios. Then, its impact in terms of voltage unbalance factor is investigated on a test urban distribution network. In this study two charging levels of different charging power at single-family home and residential parking lots, respectively, are considered and these are supposed to be a commonly available charging facilities.
The presented model is used to simulate residents electricity dependent activities calibrated with trip-type dependent EV travel and charging pattern using Markov chain process based on time-use data given by American Time Use Survey 2009 (ATUS) and the relevant National Travel Survey respectively [
17]. The model considers two cases for possibly encountering all stochastic features of residents and EV users.
Case I: It considers trip type based uncontrolled EV charging for weekday, weekend during the months , and that include March to May, June to August and December to March that represent spring, summer and winter seasons respectively. In this case occurrence of EV charging depends on the depth of discharge or current SOC after performing a certain type of trip. In general, EV battery consumption would be different in different seasons, as an obvious fact, EV battery depletion in summer season would be higher because of additional air conditioning, that consumes more energy than heating, and high ambient temperature causes fast battery depletion. Whereas, the spring season is assumed to reflect the same co-efficient for autumn, as the ambient conditions i.e., temperature and regular routine of vehicle owners remain almost same. Temperatures in different months are assumed in accordance with record of maximum and minimum temperature ranges in recent years for these months. In this case, EV would only be recharged at single residential units at charging power of 2.6 kW.
Case II: It has the same parameters of day type and seasons as Case I with addition of; controlled EV charging scheme that is based on instant tariff. Where, flexibility and willingness of EV users to postpone their charging need is determined based on type and purpose of trip. In this case, the charging facility is only available at dwelling (multi-units) parking lots and the charging power is 3.7 kW.
Three major sets of trip-types are considered based on their mutual properties: (i) school and work commuting are considered of similar nature because these are performed with low velocity and five days a week at almost same timings in the morning; (ii) Trips related to groceries and personal businesses such as bank, hospital, restaurant are considered to be similar to each other because these are performed in an urban areas in a random routine; (iii) Third set of trip-types include visiting friends, leisure related and and holiday trips and these are assumed to take place involving highway driving with relatively higher mean velocity and battery usage. The maximum battery storage is considered to be 20 kWh. The state transition probabilities are average values based on the taken time-use data of residents. and these mainly depend on housing and day type.
In this case study, total number of EVs are considered in terms of EV penetration level (PL). In order to illustrate a reasonable EV charging pattern profile and then its impact on voltage unbalance in a distribution network, three different EV penetration levels of 34%, 50% and 65% are considered, where, total represents percentage of EVs in the total transportation system and an uneven charging scenario among three phases of the system is obtained that could cause voltage unbalance factor to exceed 2%. However, charging profile would mainly depend on the factors and approaches, mentioned in above sections, that are taken into account while modeling the system, for instance the parameters are taken as stochastic variables and their adopted values in different cases.
Values of the PDFs used in the presented model are based on the data given in ATUS and the relevant parameters of PDFs are contained in
Table 1, where,
and
represent values of mean and standard deviation of the Log-normal respectively and
k and
j are the corresponding values of the shape and scale parameters respectively. The maximum likelihood method is used to determine appropriate parameters for all sets of purpose based trip-types. It has been observed that trip-types with relatively small distance covered are inclined by Log-normal PDF due to its low mean values and the trips with large distance covered are suitably fitted with Wei-bull PDF because of their flexibility to incline with PDFs types.
8. Results
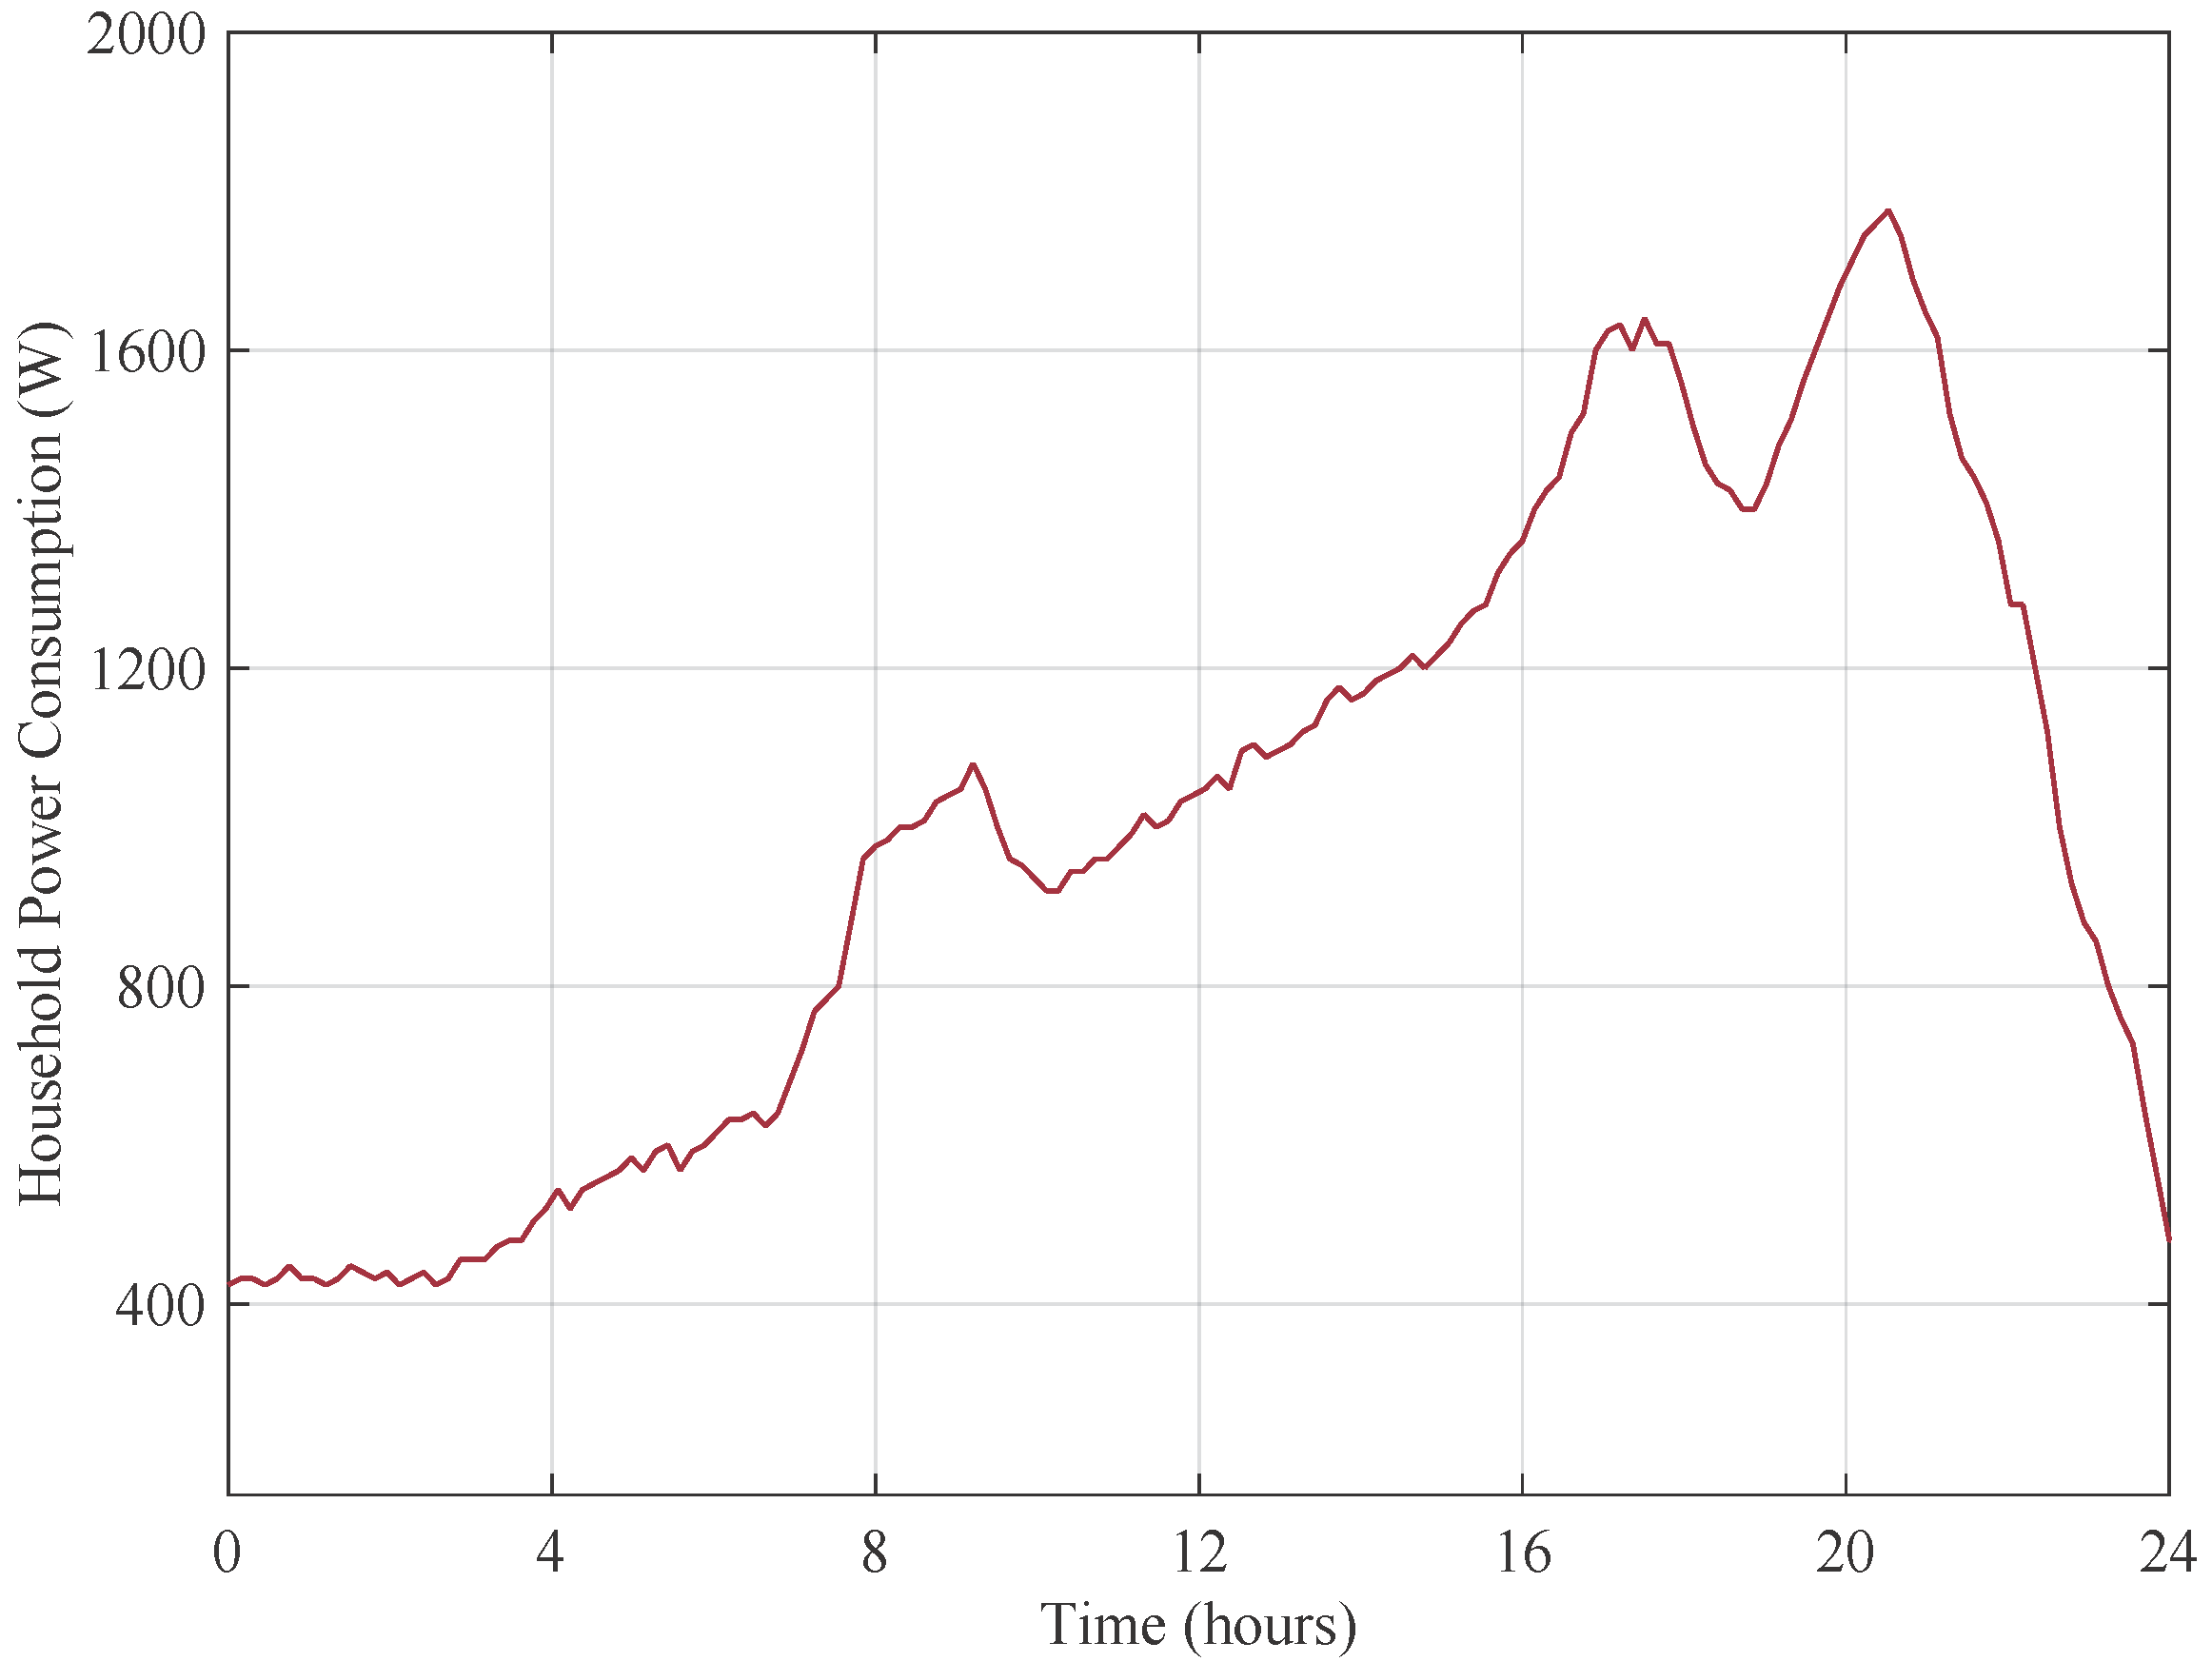
In this section, the results of residential load model and trip-type based residential activity dependent EV charging pattern are presented and illustrated. The residential model is validated through performed simulations, an average power consumption per household for 24 h of a day is shown in
Figure 7, where the shown diurnal load patterns replicate an actual average household consumption data. A household’s contribution towards peak load reaches near 1.8 kW and it is seen as a great electricity consumption in the afternoon and evening hours. It also shows that behavior of the model is a bit low in morning than that of evening hours reflecting behaviour of the residents to return home. Similar approaches have been presented in [
31] that give statistics for the power demand of 14 modeled houses and a variance of electricity consumption on annual basis in a single-family home, respectively.
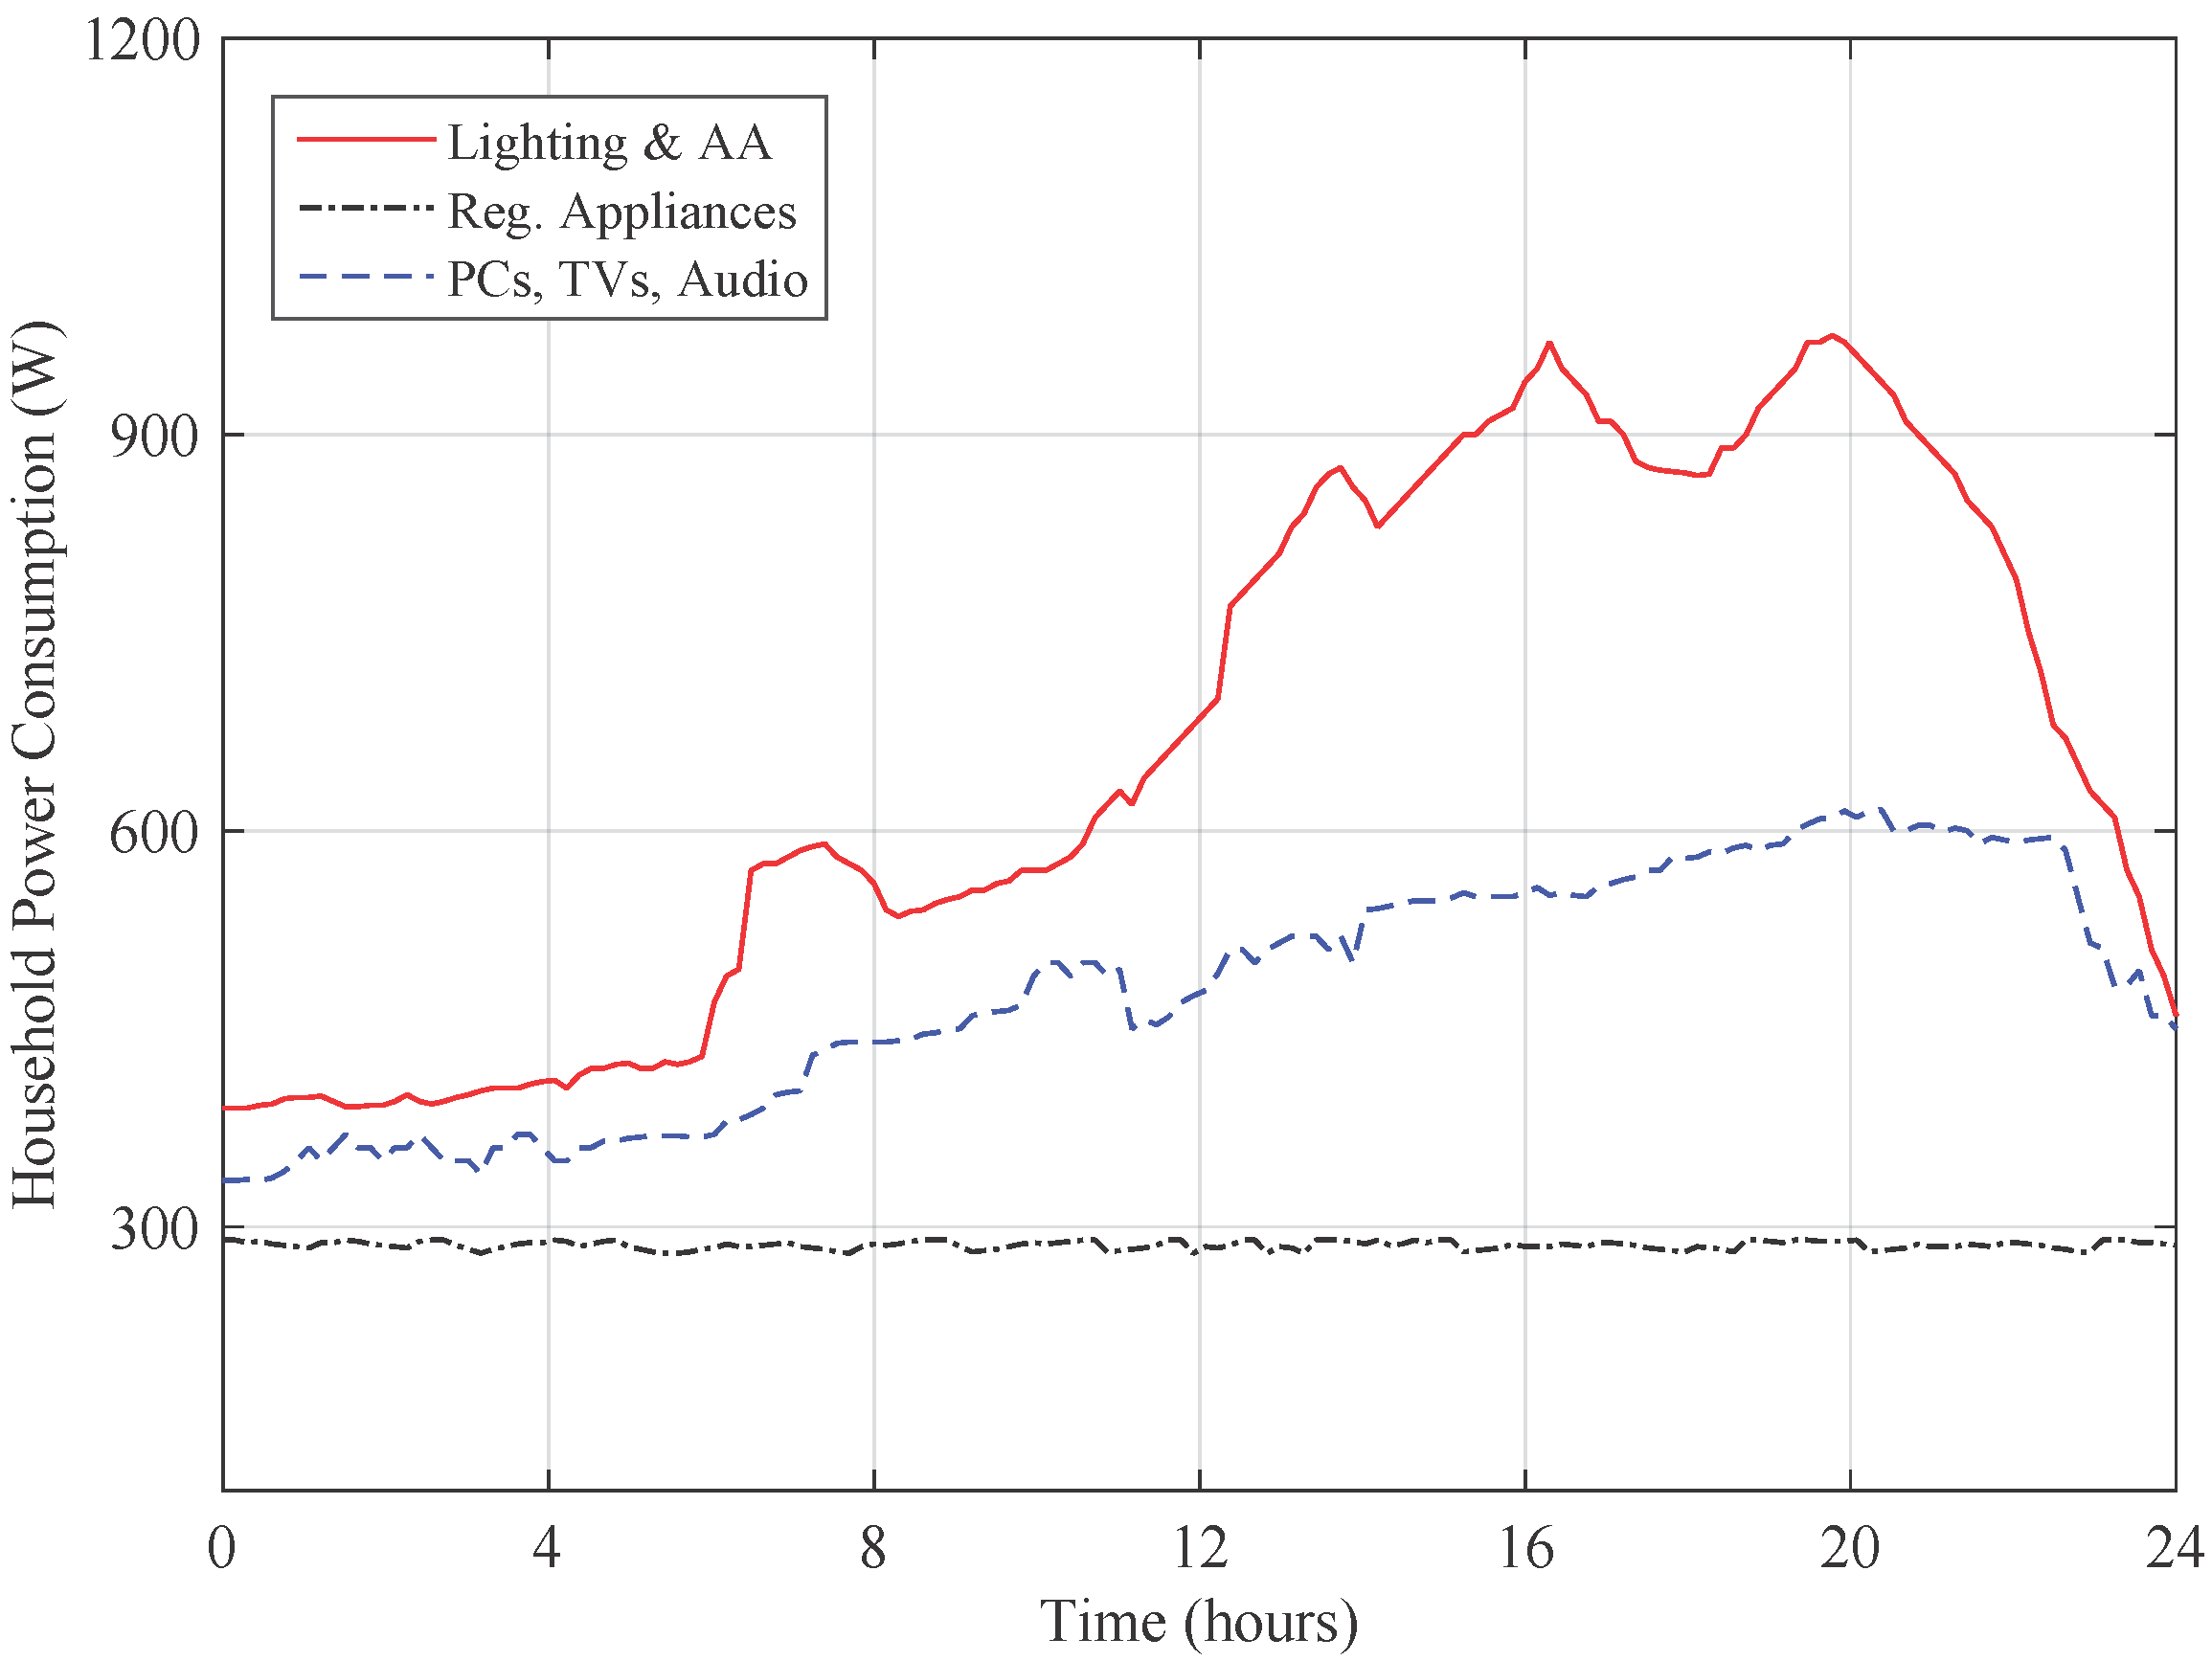
Figure 8 shows a typical household load with differentiated electricity consuming activities including load curve of regular appliances such as refrigerator, computers and televisions (PC&TVs) lighting air conditioner and additional appliances (lighting&AA) such as iron, ovens and etc. It may be observed that load of lighting&AA is a large part of the overall consumption that is most likely to happen in afternoon and peaks occur at around 16:00 and 20:00. While, load data of regular appliances remains nearly consistent through 24 h due to a fact that such appliances remain ON for almost all times of a day. The results demonstrate that peaks of routine consumption may be taken as a reference in order to avoid coincidence of other electricity consuming activities that may possibly be postponed particularly in afternoon and evening hours.
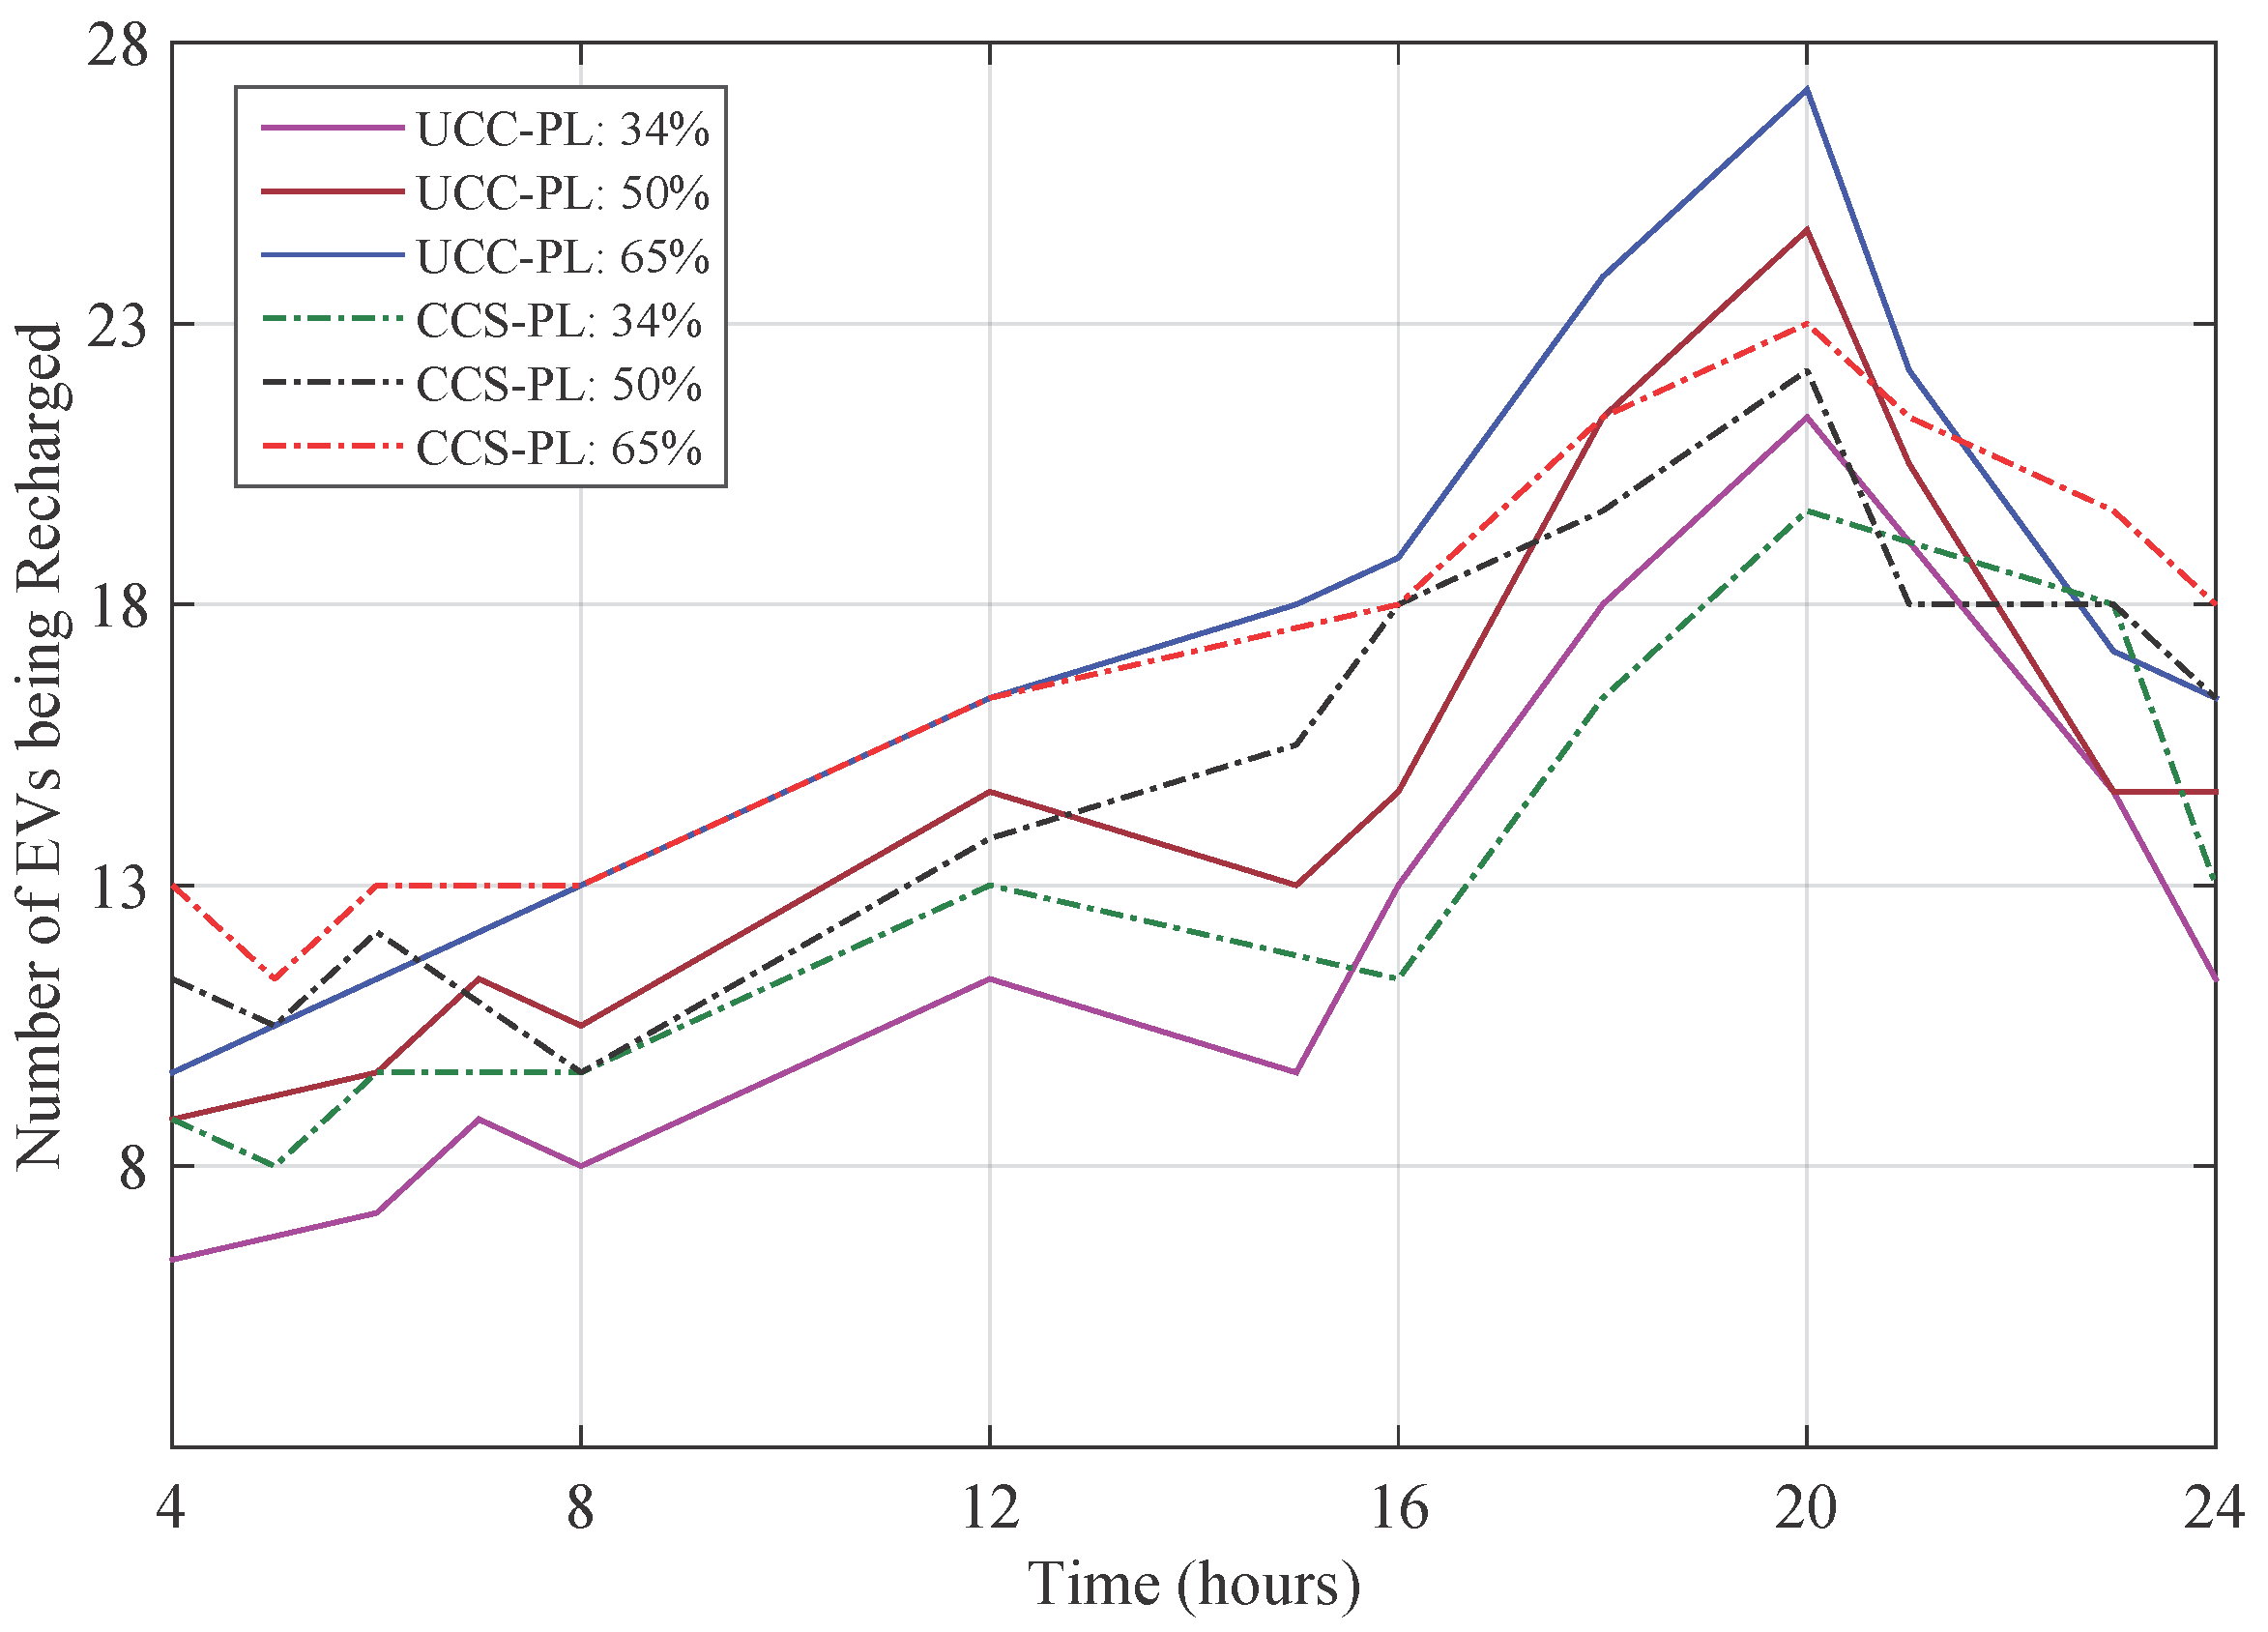
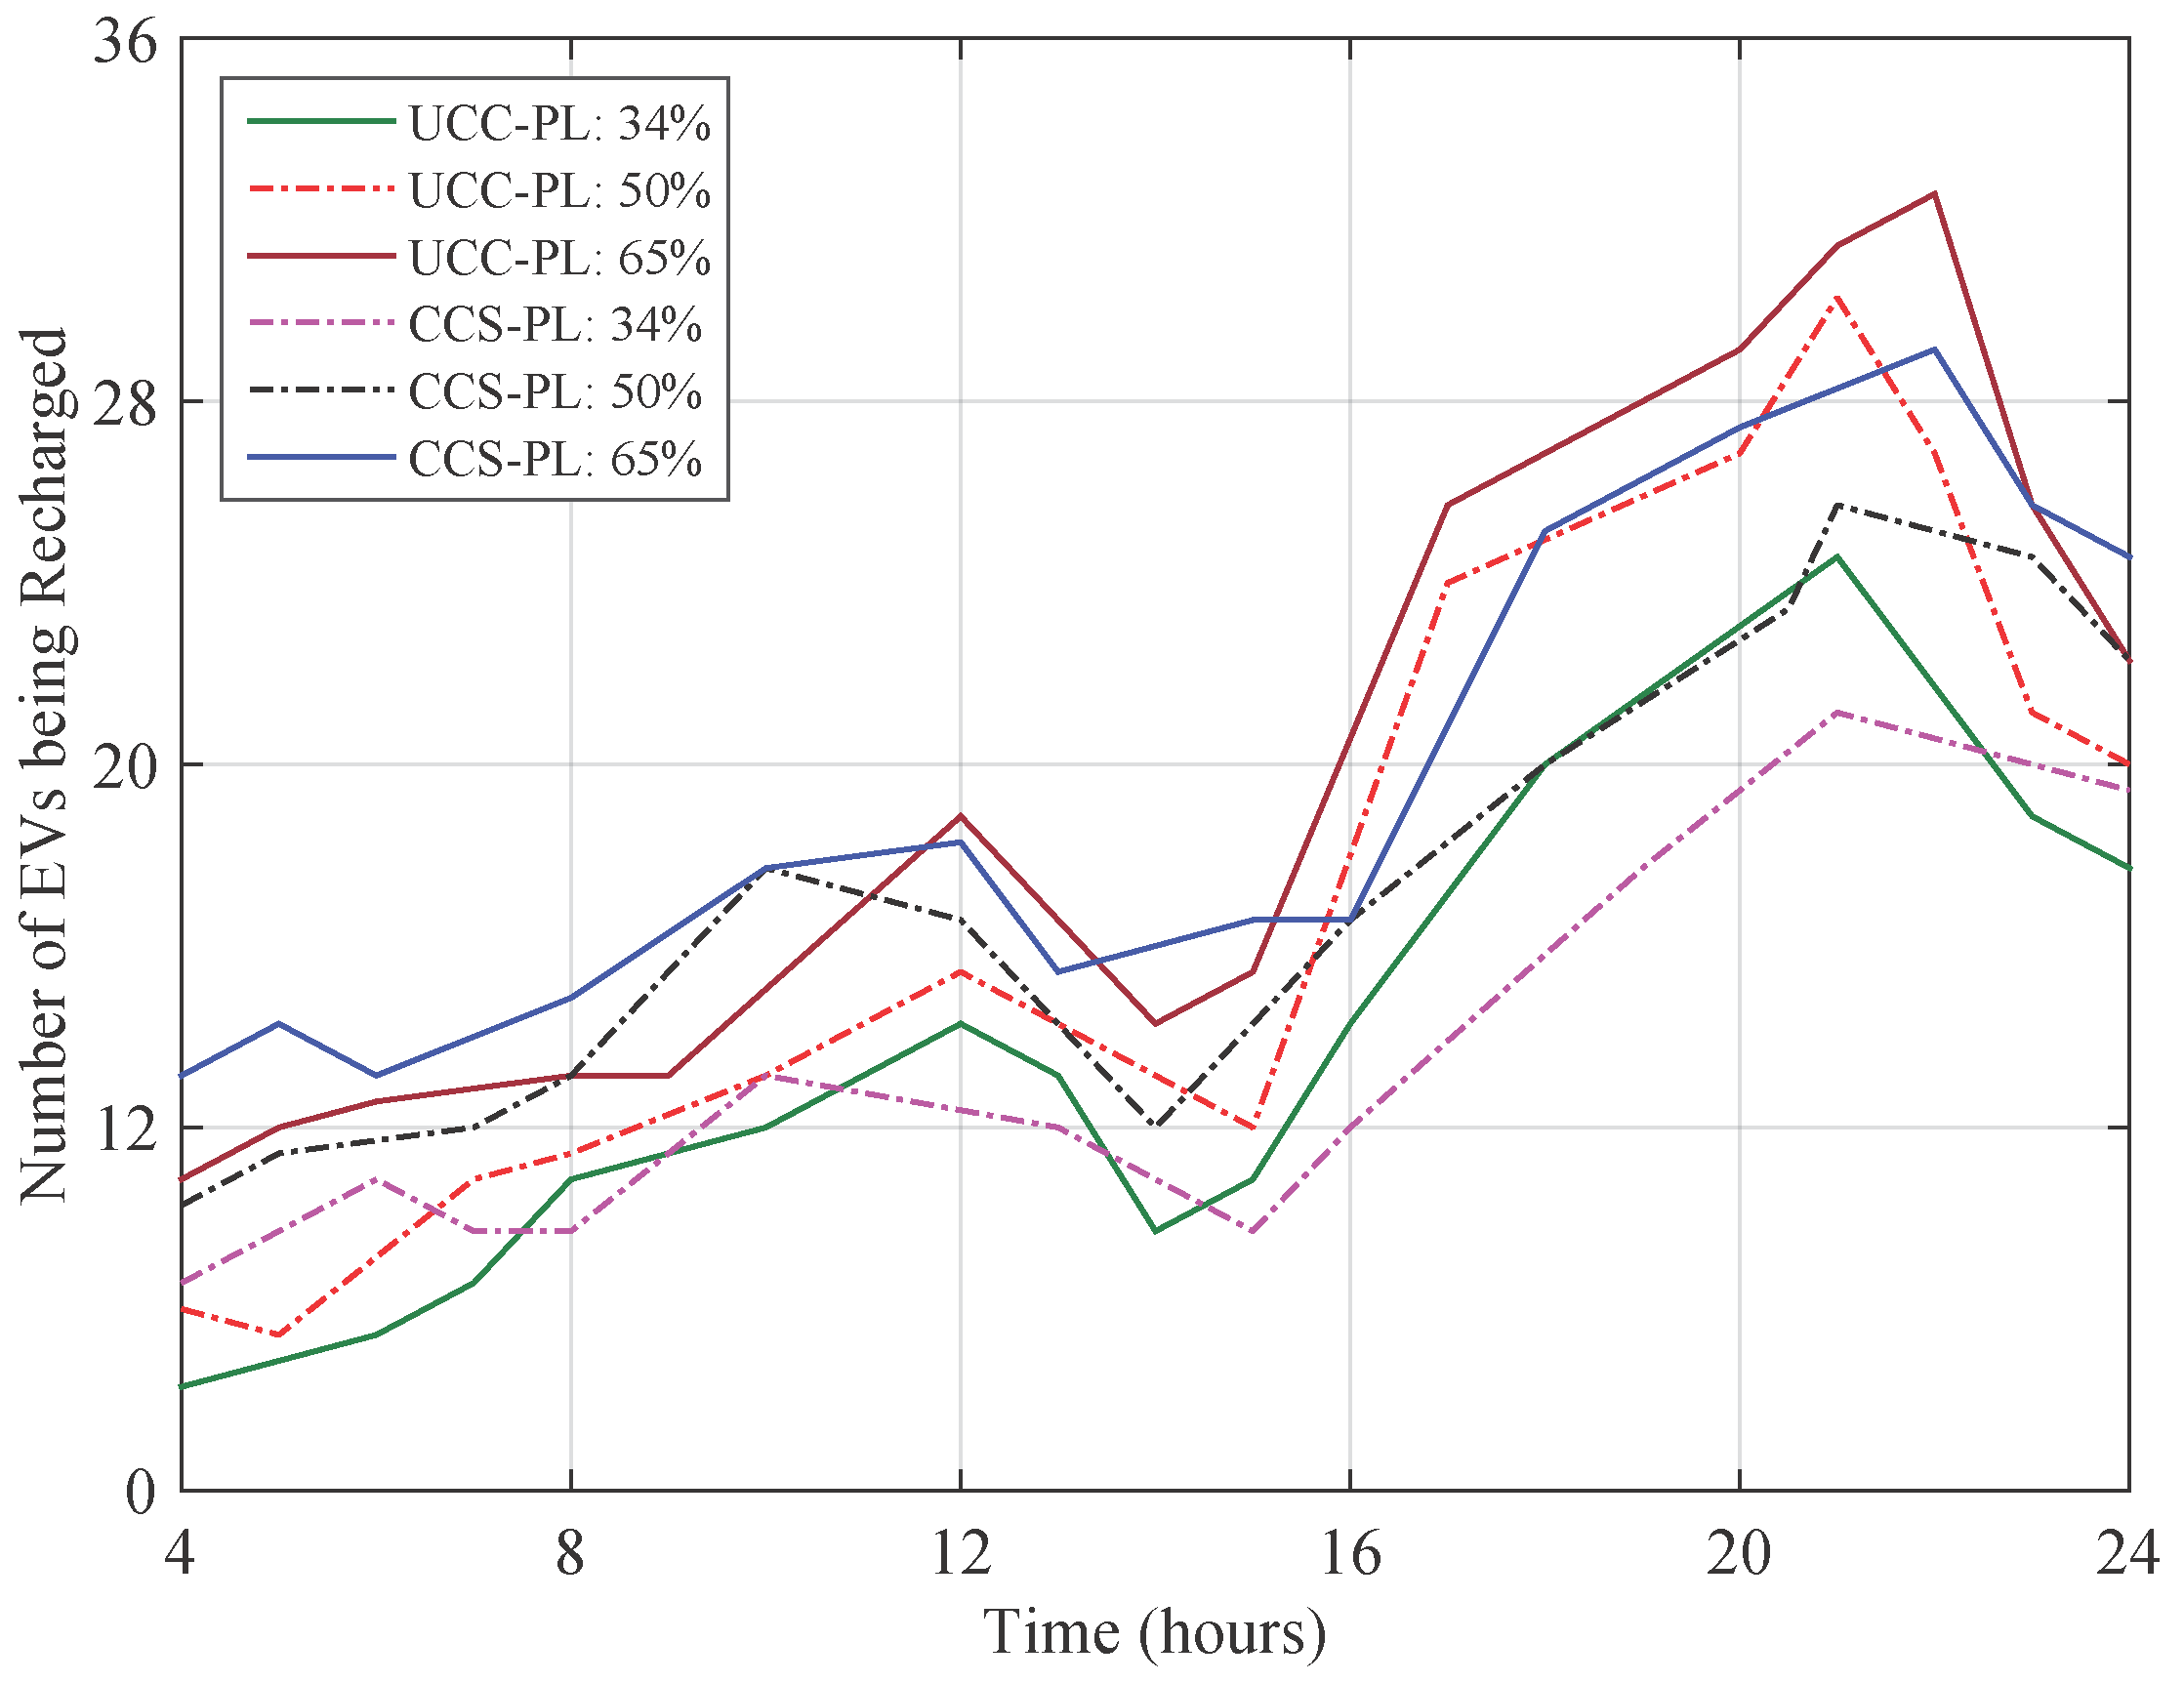
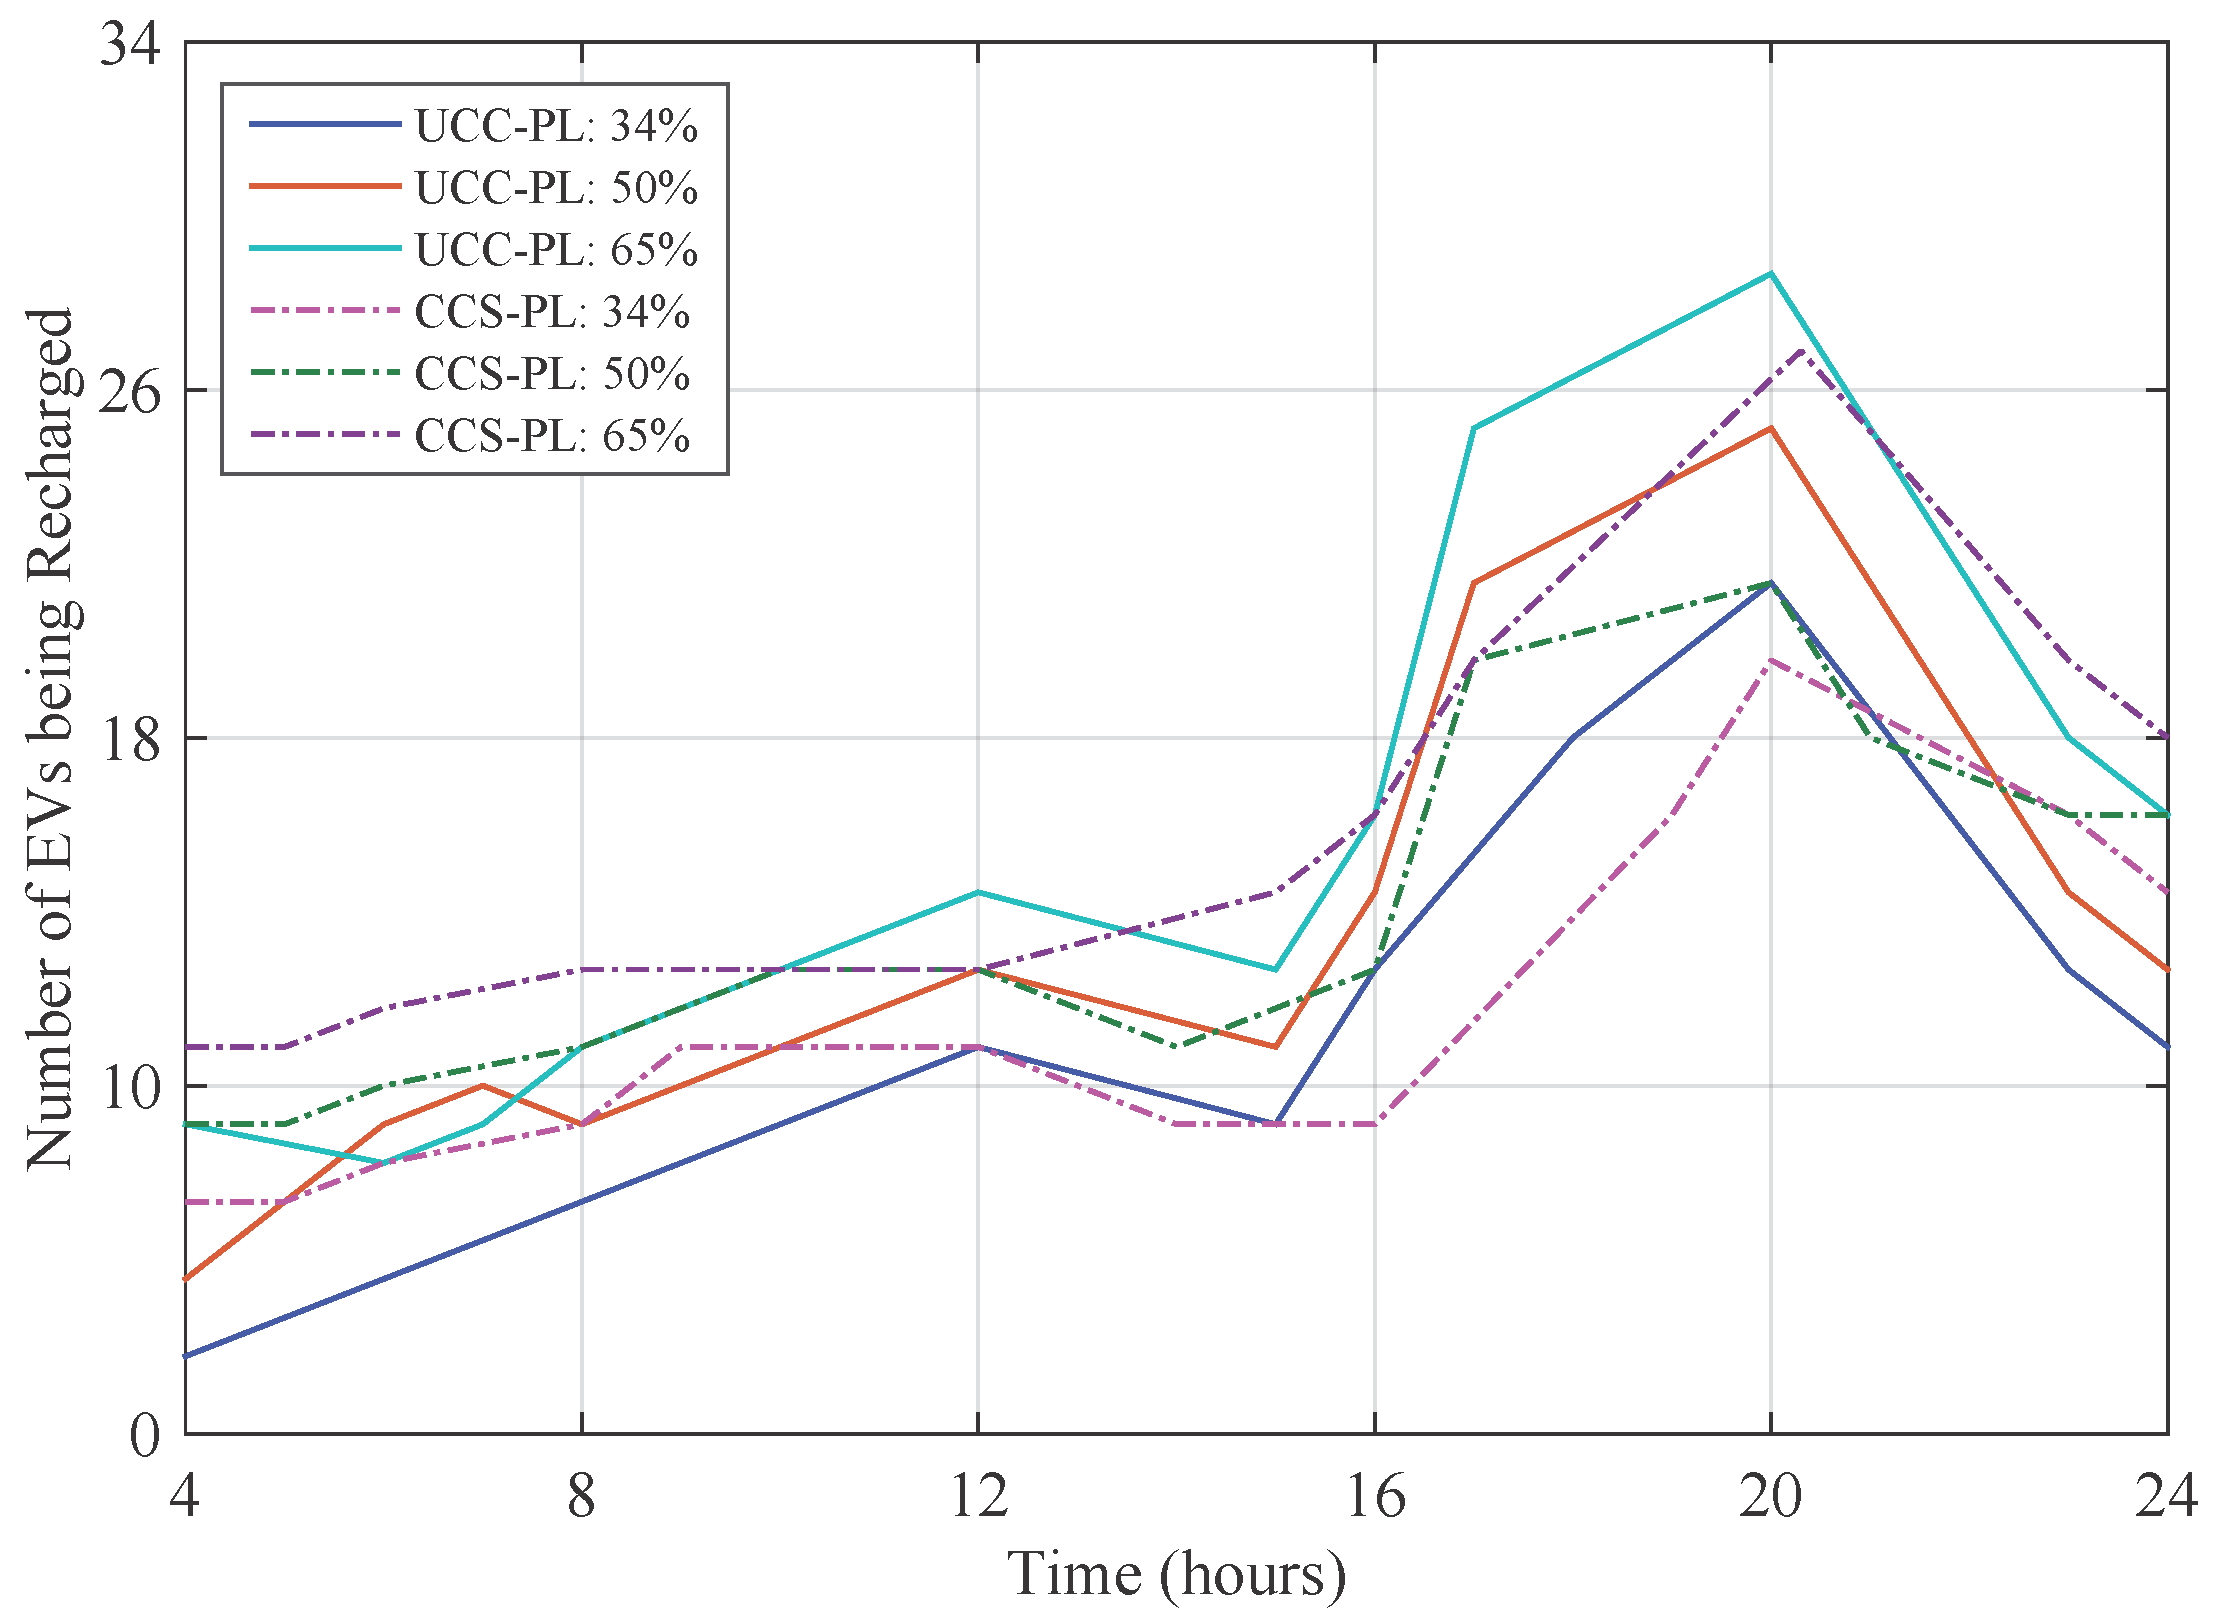
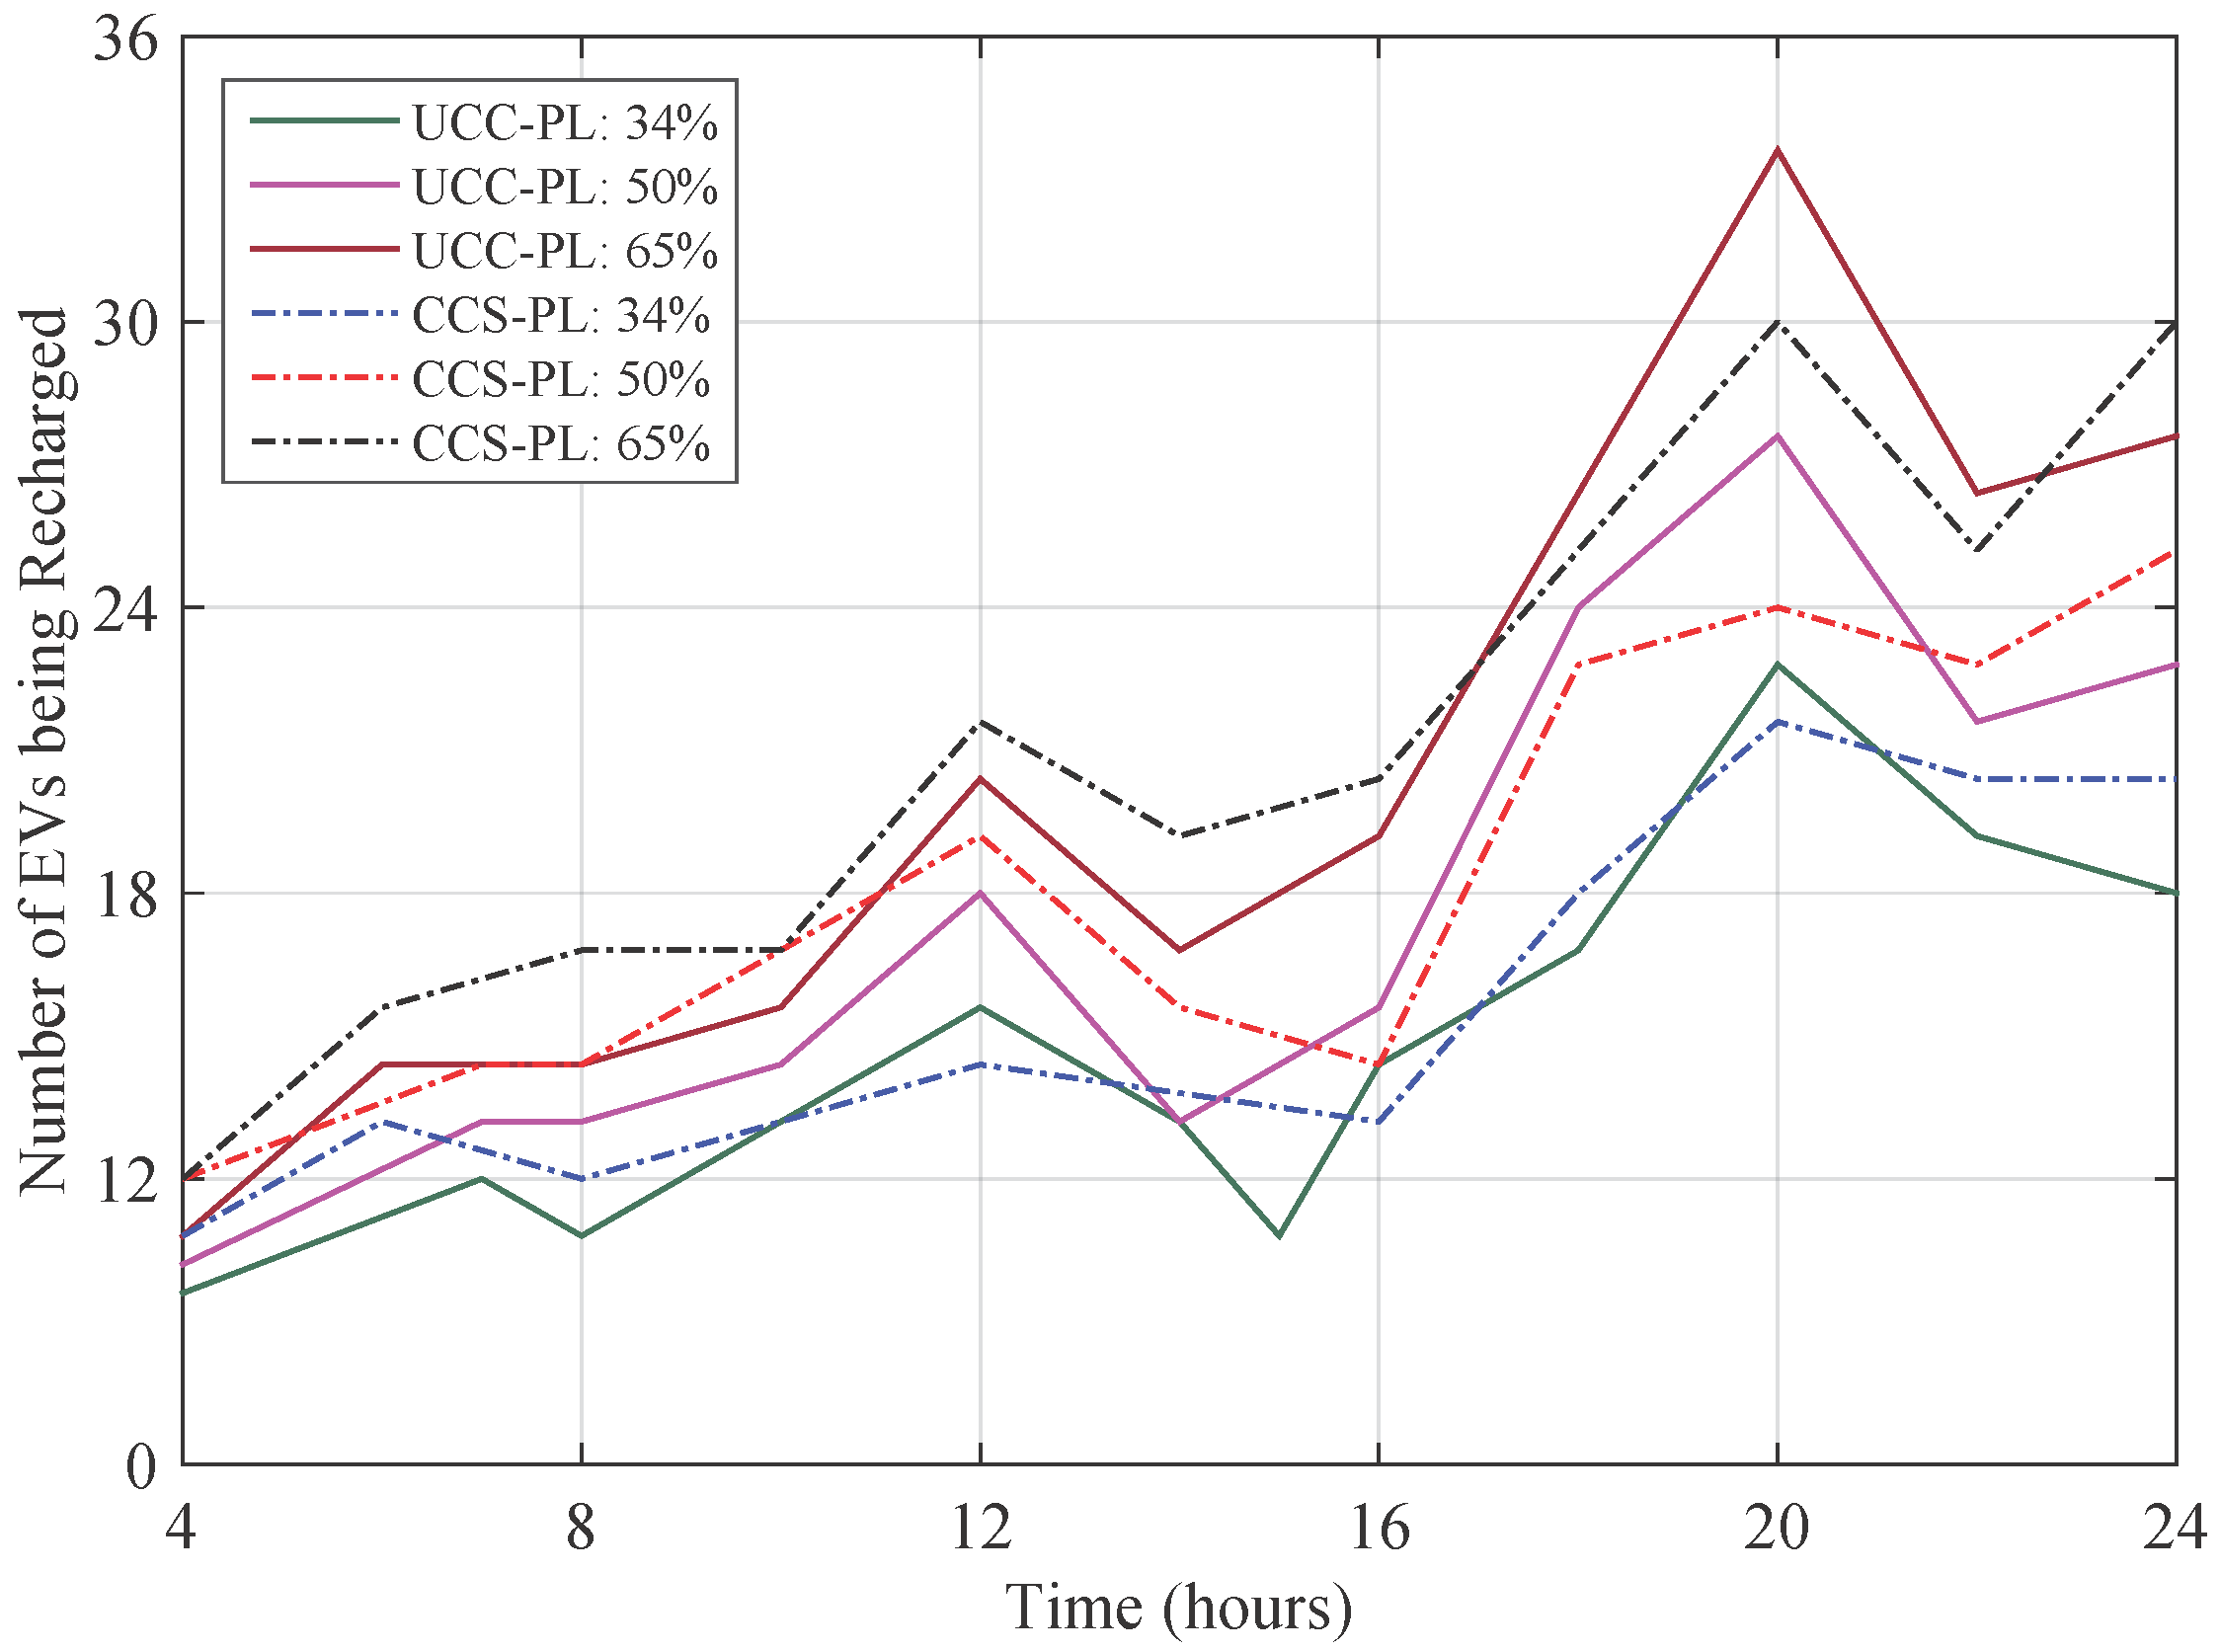
Results of the EV charging pattern that corresponds to the load pattern, for the two cases, under two EV charging schemes including uncontrolled charging (UCC) and controlled charging scheme (CCS) for three different penetration levels (PL) of 34%, 50% and 65% are obtained and presented in this section. As stated in the
Section 7, the EV charging pattern is simulated for three different months, for weekdays and weekends, including March, August and December, to observe seasonal effects of spring, summer and winter respectively while taking into account different ambient temperatures and activity behaviour of individuals. Form the results shown in
Figure 9,
Figure 10,
Figure 11 and
Figure 12, it may be observed that frequency of EV charging events per day and thus power consumption by EVs is higher on weekends as compared to that of weekdays.
However, the charging pattern is different, as charging peaks during weekend occur at late hours in the evening from the hours 19:00 to 21:00, contrary to the peaks in weekday that occurs mostly between hours 18:00 to 20:00. This variation may be supported with a probability that usually people return home a bit early during working days and prefer to plug-in their cars for recharging so that their EV battery is fully charged on time. Whereas, during weekends many people drive longer daily trips than normal routine and return home at late hours but in this case, number of charging events are a bit high in the morning time as compared to that of weekday. On the other hand, a charging pattern in August shows that overall charging trend of EVs is higher than that of March and December because of relatively high ambient temperature and longer holiday and leisure trips. Thus, effects of considering trip-type and its purpose appear to be salient in determining charging pattern that the consumption varies from weekend to week day, and month March to months August and December.
In Case II with charging power of 3.7 kW under controlled charging scheme, it is seen that the number of charging events at time t are less than that of uncontrolled charging and also the load is little shifted to regular off-peak hours. It may be illustrated based on two important facts: charging time/duration of EVs with relatively higher charging power is reduced by almost two hours. Thus the charging is finished earlier and probability of coincidence of several EVs to be recharged simultaneously is reduced and secondly EV drivers show flexibility to charge their cars depending on current price of electricity in accordance with peak and off-peak hours. Flexibility of a car owner to whether postpone his/her charging need is dependent on the trip-type and its purpose and it has been given due consideration in the presented model. On the other hand, charging at higher power causes an increase in load variation due to the stochastic behavior of individual.
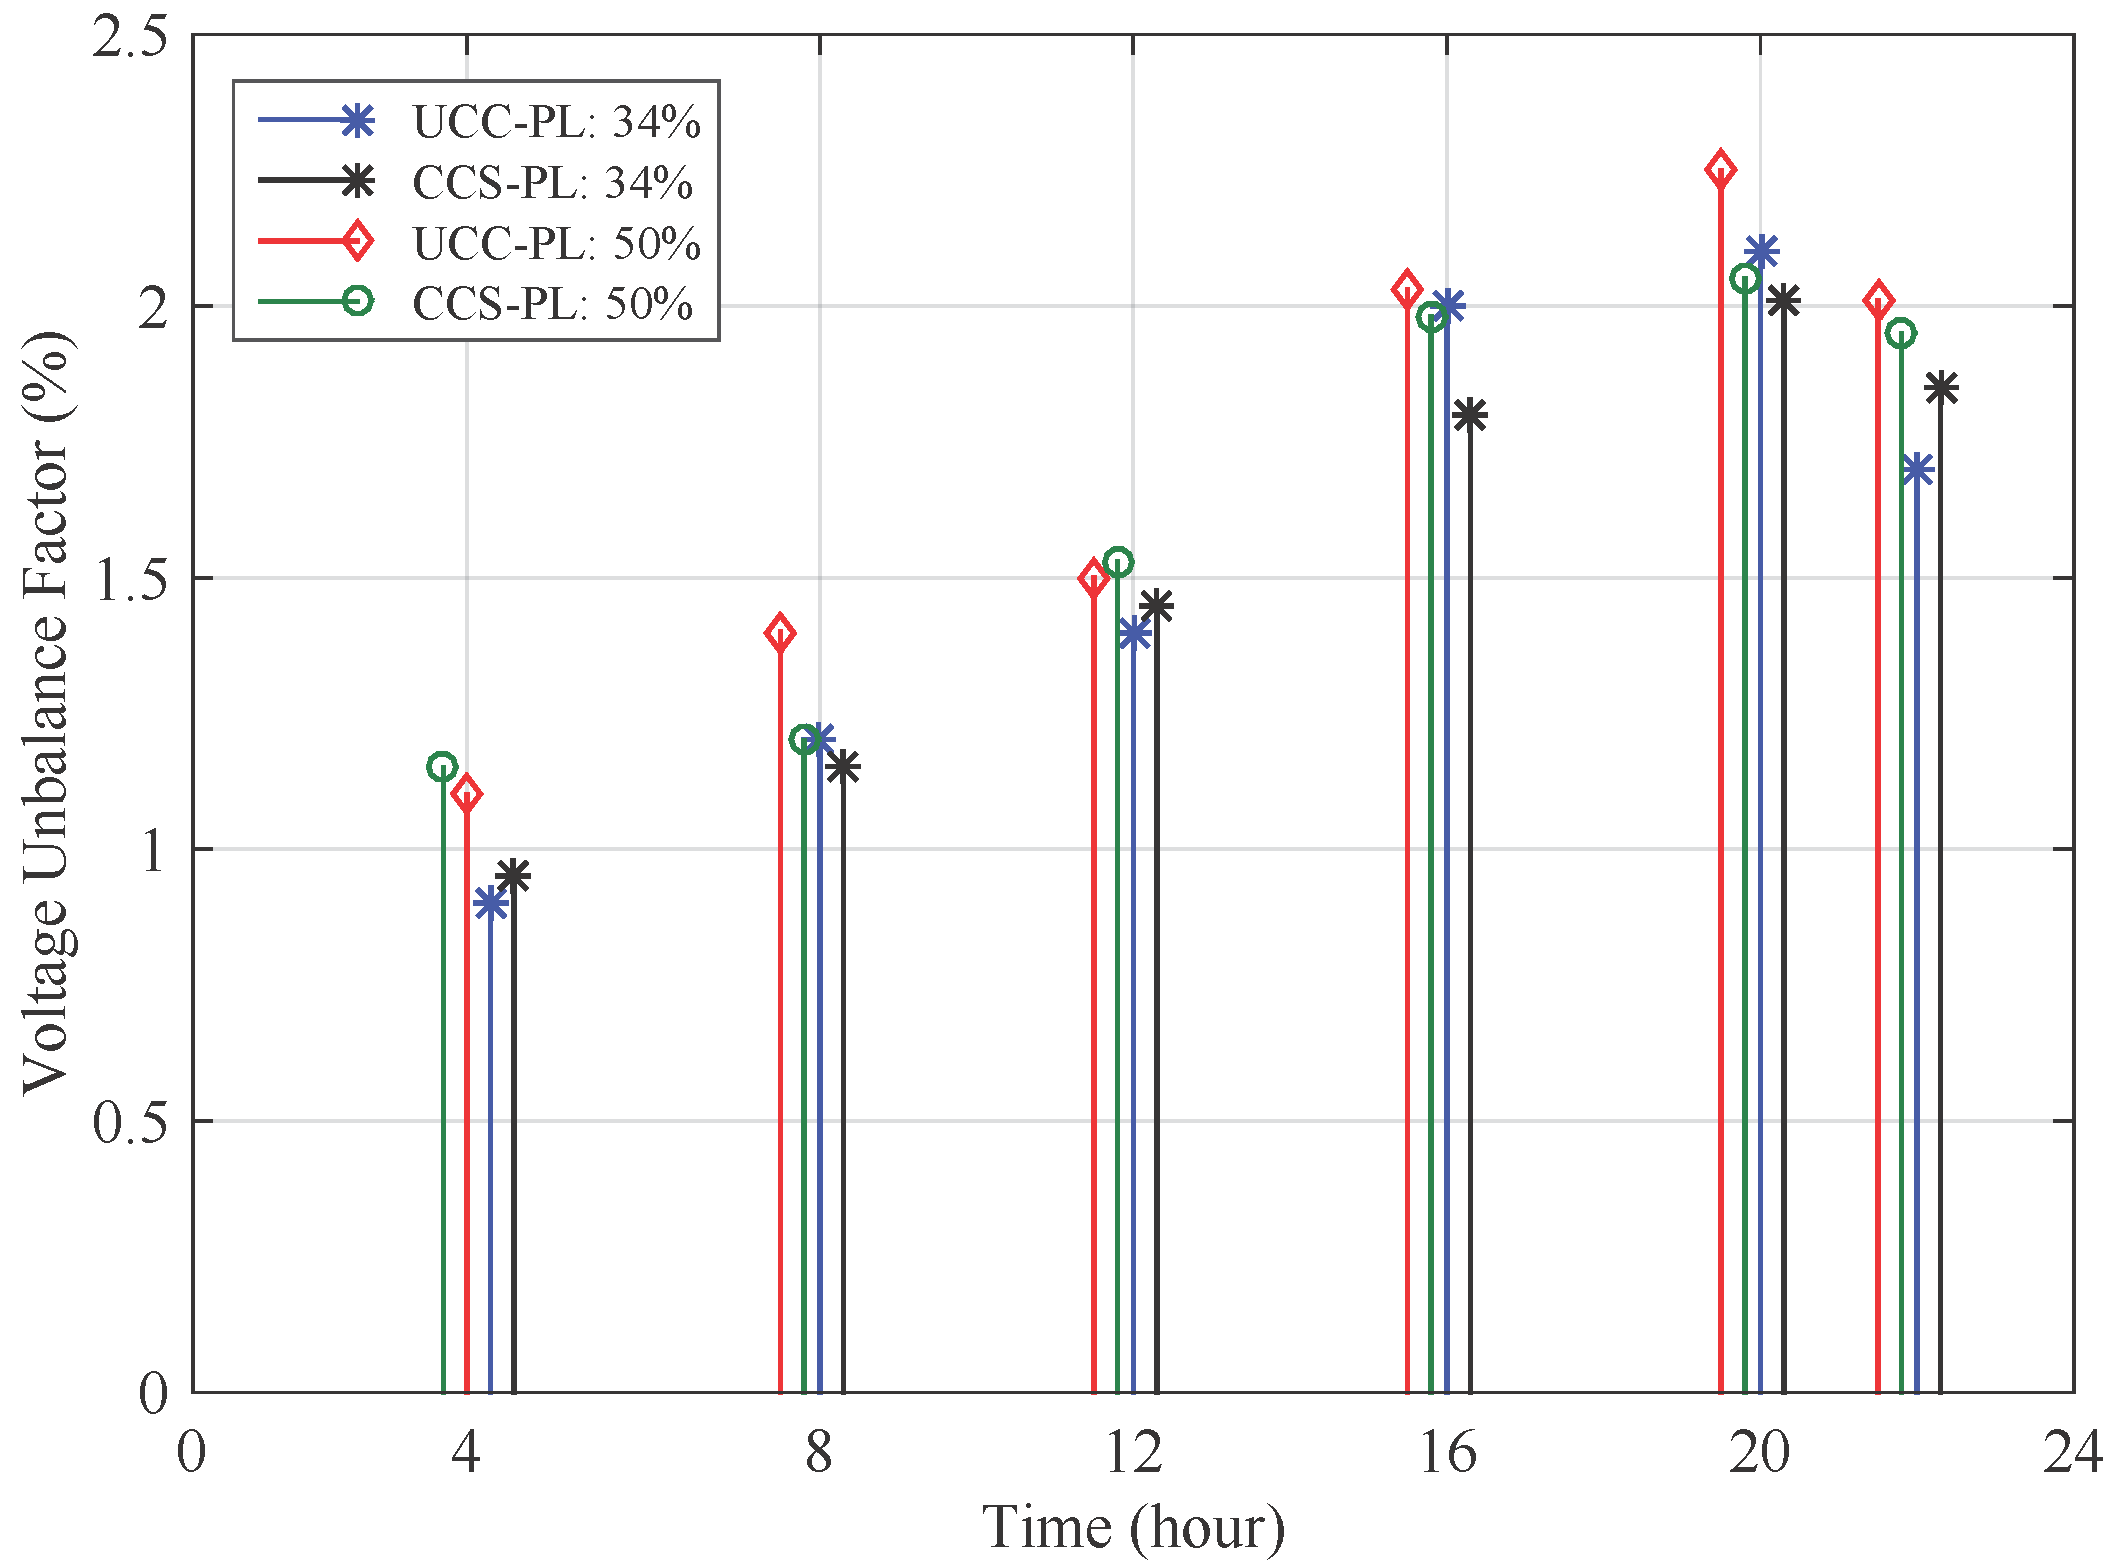
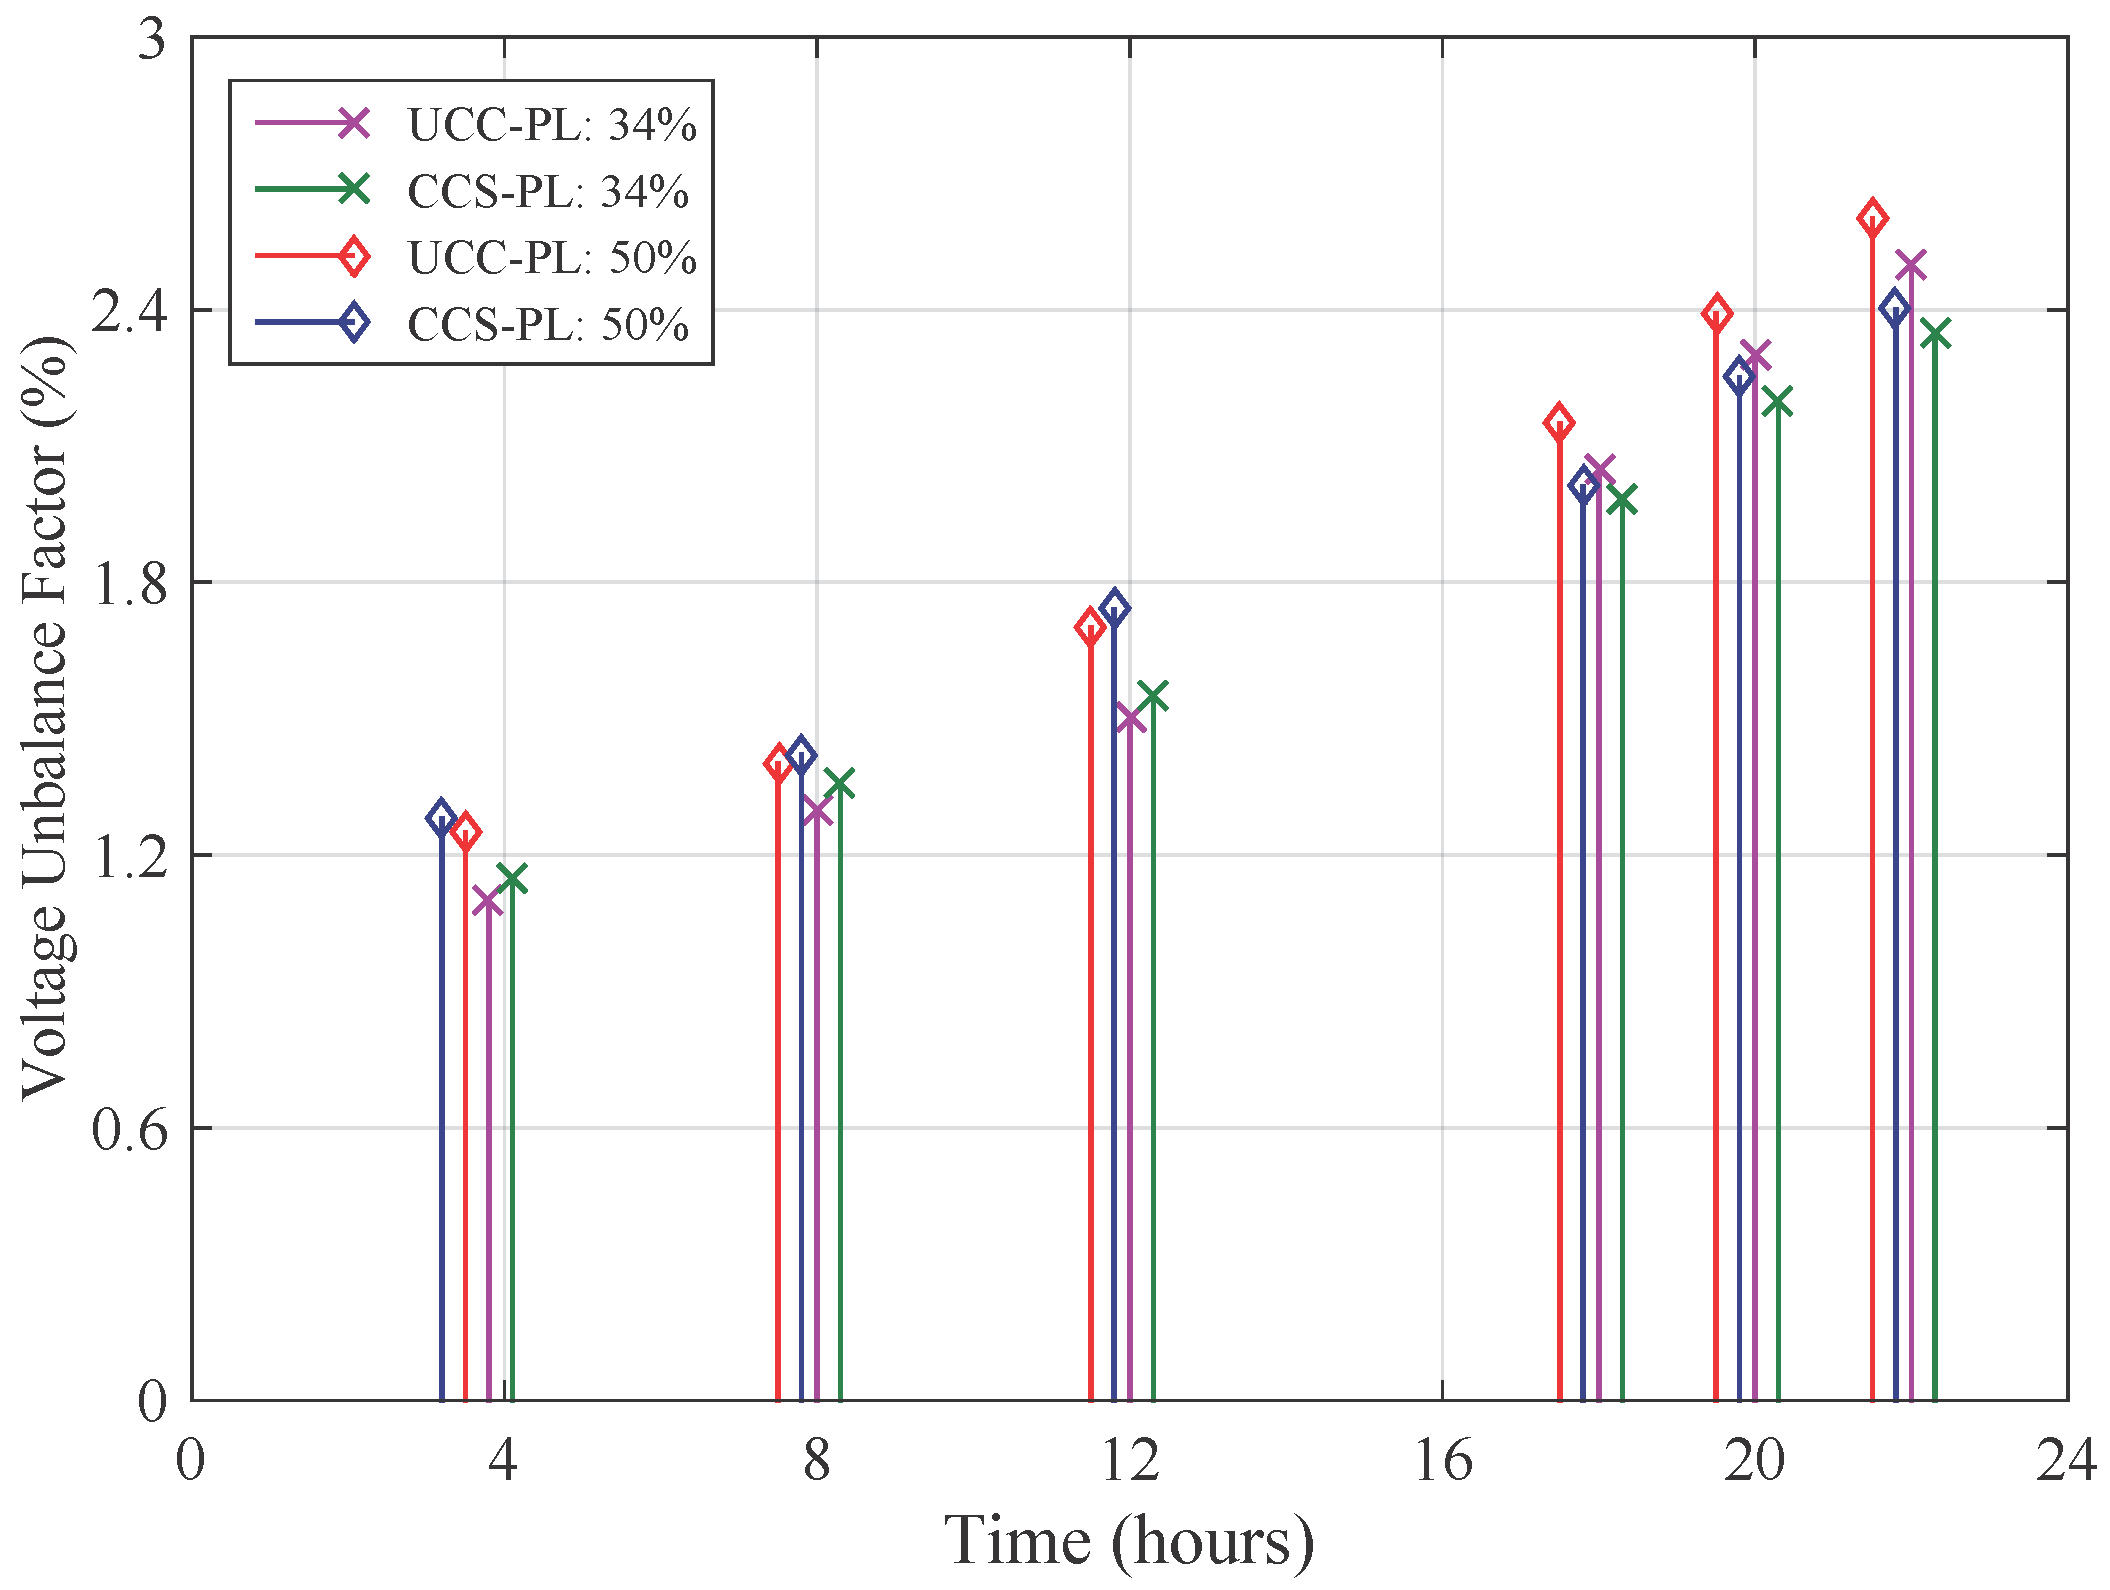
In this paper, voltage unbalance factor (VUF) is studied and computed under different EV penetration levels of unequal single-phase EV charging. VUF is set to 2% and each phase of the three-phase system is subjected to bear different uneven amounts (percentage of load on each phase) of EVs’ load to determine the latter’s value that can cause VUF to exceed a limit of 2%. Having computed the VUF values at different EV penetration levels and then distribution of uneven load on each phase, it is observed that an unacceptable VU appears at
of only 34%, when the latter is distributed on the three phases in the following manner: phase ‘a’ bears 59% load of EV charging, phase ‘b’ stands with 25% of load and only 16% of load is subjected to phase ‘c’. The voltage unbalance factor in percent [VUF (%)] obtained at node R15 of the residential feeder in the months of March and Aug. are shown in
Figure 13 and
Figure 14 respectively. VUF (%) is recorded at the above mentioned EV penetration levels under uncontrolled charging (UCC) and controlled charging scheme (CCS). It may be observed that results of VUF are found to be consistent with EV charging pattern, i.e., during the hours of higher EV charging load, the greater value of VUF is appeared.
The results demonstrate and reveal that an uneven EV charging load causes the voltage unbalance to go beyond allowable limit, when penetration level of EVs is above 34% and obviously it increases with an increase in EV penetration level . It has also been observed that an uneven scenario of EV charging changes on different load buses of the system depending on the loading conditions before addition of EVs load. For instance, node R15 is identified to be more vulnerable to voltage unbalance index, whereas, node R11 can bear an of 40% with the same uneven charging scenario (59%, 25% and 16% load on phase a, b and c, respectively). In this wake, node R7 is found to be the most optimal location for bearing high of 45% while keeping the VUF within its allowed limit of 2%. However, a safe operation of further EV charging would be possible, if amount of uneven charging load on each phase is reduced.
It is important to note that the presented results solely project effect of EVs’ integration in the system and amount of voltage unbalance on the bus, before EV connection, is kept within normal permissible range. It may be seen that an uncontrolled EV charging may pose serious negative impact on the load bus rather than a controlled charging scheme which could be less detrimental to the system.
The proposed model is worked out and tested without loss of generality. The presented model has been validated with diverse statistics in terms of light-duty vehicle fleet with two types of vehicle class (car, van), such as given in manuscript. Given the same modelling approach and EV penetration levels along with the factors explained in the manuscript, it is found that the results are not pointedly changed, rather they reflect nearly the same validation. Thus, the presented probabilistic model in independent of the statistics without loss of generality. Additionally, the PDF parameters for different trips types were also changed to an allowable extent (keeping in view the analogous relationship between trip types and purpose of trip based on their mutual properties). Importantly, the state transition probabilities are average values based on the taken time-use data of residents as given in [
27] and these mainly depend on housing and day type. It has been observed that trip-types with relatively small distance covered are inclined by Lognormal PDF due to its low mean values and the trips with large distance covered are suitably fitted with Weibull PDF because of their flexibility to incline with PDFs types. The presented results have been validated with diversified statistics, and it is found that the results are consistent. Moreover, it also becomes obvious that the obtained results demonstrate the realistic pattern of a community life. The same point has been elaborated in the manuscript as well.
9. Distinctive Features of the Adopted Approach and Case Study
In this paper, a probabilistic charging pattern of all EVs in a distribution system is carried out using following realistic factors: EV penetration level in the study network, class of EVs (car, van), EV battery capacity, state of charge (SOC) of battery at time t, EV driving habits, type of trip in view of different trip purposes such as schooling, commuting, holiday trip, mileage, vehicle battery capacity, charging need and charging time (plug-in moment), recharging frequency per day, usage diversity and dynamic charging price factor under controlled and uncontrolled charging in accordance with peak and off-peak hours, i.e., these are categorized based on grid loading conditions and corresponding variable electricity price. In this regard, it is worth noting that the number of charging events may not be simply computed based on number of EVs in a distribution network zone rather it depends on activity pattern of an individual and the related iterations.
In most of the relevant works [
32,
33,
34,
35,
36,
37,
38,
39], a fleet of EVs is assigned the same all-electric range and the equivalent amount of energy in EV batteries. In this way, energy consumption is appraised based on simplified assumptions such as EV charging frequency is considered once a day in the morning or twice a day in morning and evening. Such simplified assumptions may lead to unrealistic results. Authors in [
40,
41] have reported a few techniques for timequantification of single diode photovoltaic models and enhanced techniques for maximum power point tracking (MPPT) which may be interested for readers. The consumption of electric energy is often assessed without taking into account the stochastic EV travel patterns. For instance, authors in [
33,
34,
38,
39] assume that all vehicles set off with completely charged batteries and return home with the usable energy exhausted. Some EVs may not travel on a day, or they might travel less than their available electric range and consume only a fraction of the battery energy, which leads to an overestimation of energy consumption. Additionally, while estimating power consumption, some works use models for representation of situations which are unlikely to occur. In this wake, authors in [
32] state that off-peak electricity is spent by the whole EV fleet, while in reality, some vehicles may be in motion, and others might be unable to obtain more energy from the power grid. Reference [
34] considers that all EVs are plugged-in for charging simultaneously either at 5 p.m. or 10 p.m. The scenarios of uncontrolled charging presented in [
30] state that all EVs would leave home between hours 8 a.m. and 9 a.m., and return between hours 6 p.m. and 9 p.m. Evidently, these simplified assumptions fail to take account of real-world travel patterns, and thus the rationality of those results remain questionable. In this paper, the activity pattern of an EV user and corresponding travel pattern is used to generate EV charging pattern while taking into account the most realistic factors as explained in the manuscript.
To the authors’ knowledge, it has been found that sufficient historical data related to EVs’ charging pattern is not available so an MCS based probabilistic model is developed using transportation survey data. The probabilistic model is developed using survey data taken from American Time Use Survey 2009 (ATUS). The ATUS survey data is a rigorous estimation based on annual average data on how individuals of age 15 and over spend their time during a day. Statistics based on the ATUS are subject to both sampling and non-sampling error. The sample estimation and its standard error can be used to construct approximate confidence intervals, or ranges of values that include the true population value with known probabilities. The ATUS data also are affected by a non-sampling error, which is the average difference between population and sample values for samples generated by a given process. The ATUS presents an actual data related to activity pattern of residents/users and is considered to have fact-based values. In order to be more realistic and detailed, the presented model uses categorical distribution function and is divided into five stages, and these are explained in detail in the above section. In our modest opinion, the presented case studies cover a broad range of relevant factors encountering most of the stochastic features of residents/EV users.
10. Conclusions
In this paper, a stochastic method is adopted that takes into account residential energy-consuming activity based household load profile while all kind of realistic factors that may affect loading pattern of EV charging in a distribution network. The obtained results are based on trip-type activity dependent EV charging pattern that demonstrate that the latter is different for dissimilar seasons represented by the month of March, August and December and it demonstrates the effect of changing activity pattern of EV users and ambient conditions. Furthermore, effect of considering uncontrolled and controlled EV charging schemes with other factors, described in
Section 7, appears to be salient in determining the charging pattern. Then, voltage unbalance factor (VUF) is studied and computed under different EV penetration levels of unequal single-phase EV charging. It is observed that an unacceptable VU appears at
of only 34%, when the latter is distributed on the three phases in the following manner: phase ‘a’ bears 58% load of EV charging, phase ‘b’ stands with 25% of load and only 17% of load is subjected to phase ‘c’. VUF is quantified at multiples load buses of the network, where, node R15 is identified to be more vulnerable to voltage unbalance index, whereas, node R11 can bear an
of 40% with the same uneven charging scenario (59%, 25% and 16% load on phase a, b and c, respectively). In this wake, node R7 is found to be the most optimal location for bearing high
of up to 45%, while keeping the VUF within its allowed limit of 2%. However, a safe operation of further EV charging may be possible, if the amount of uneven charging load on each phase is reduced.


