Peak Forces on Wave Energy Linear Generators in Tsunami and Extreme Waves


1
Department of Engineering Sciences, Uppsala University, SE-752 21 Uppsala, Sweden
2
Center for Natural Disaster Science (CNDS), Villavägen 16, SE-752 36 Uppsala, Sweden
*
Author to whom correspondence should be addressed.
Energies 2017, 10(9), 1323; https://doi.org/10.3390/en10091323
Submission received: 30 June 2017
/
Revised: 8 August 2017
/
Accepted: 24 August 2017
/
Published: 2 September 2017
(This article belongs to the Special Issue Wave Energy Potential, Behavior and Extraction)
Abstract
:The focus of this paper is the survivability of wave energy converters (WECs) in extreme waves and tsunamis, using realistic WEC parameters. The impact of a generator damping factor has been studied, and the peak forces plotted as a function of wave height. The paper shows that an increased damping decreases the force in the endstop hit, which is in agreement with earlier studies. However, when analyzing this in more detail, we can show that friction damping and velocity dependent generator damping affect the performance of the device differently, and that friction can have a latching effect on devices in tsunami waves, leading to higher peak forces. In addition, we study the impact of different line lengths, and find that longer line lengths reduce the endstop forces in extreme regular waves, but on the contrary increase the forces in tsunami waves due to the different fluid velocity fields.
1. Introduction
In order for wave energy to be a viable energy option, the survivability of wave energy converters (WECs) in harsh offshore environments must be guaranteed. The peak forces that will occur in storms and other extreme wave events, such as tsunami waves, must be studied in the design process of a wave power plant. Wave tank testing can be carried out to analyze the behavior in extreme waves, but it is expensive and time-consuming. Full scale offshore testing is even more expensive, and although it is necessary for evaluation of a WECs performance before commercialization, it does not offer the controlled environment and the possibility to repeat the same wave conditions needed to evaluate the impact of specific parameters. Computational fluid dynamics (CFD) modeling offers a complement to physical experiments, and allows the user to study specific parameters individually in predefined conditions. The turbulent flow around a WEC in high sea states can be approximated with Reynolds Average Navier-Stokes (RANS) equations together with a turbulence model [1], and the surface can be tracked with the volume of fluid (VOF) method. Several CFD models of different wave power concepts have been developed and verified in recent years [2,3]. In [4], wave load of breaking waves on an overtopping device was studied in a physical wave flume, and in [5], the results were reproduced with good agreement using a RANS-VOF model. In [6,7] a point-absorbing WEC with linear-elastic mooring, moving in six degrees of freedom, was modeled showing good agreement with wave tank experiments, and in reference [8], another point-absorber device was modeled both fixed and freely floating. In [9,10], RANS-VOF models are verified with physical wave tank data and the peak forces of WECs with limited stroke length were studied. In [9], a model was verified with physical experiments where frictional PTO-damping, assumed constant, was used. The model was then used to study the effect of wave height, H, on peak forces in irregular waves, finding a nonlinear, , relation for a moderate sea state and one frictional PTO-damping. In [10], the influence of the frictional damping on the peak forces for moderate and extreme waves was studied using two RANS-VOF models, one linear model and physical wave tank experiments. The four cases of no damping, low, medium and high frictional damping were studied, and two buoy geometries were compared. The magnitude of the peak forces was seen to decrease with increased friction. No trends were fitted to the results, but studying the figures, linear trends could be suggested. It should be noted that the response of a device in an extreme wave depends on the load history as well as the surface elevation [11], and if the peak forces are plotted as function of wave height, a scattered result is expected.
In this paper, a RANS-VOF model, previously verified with physical wave tank experiment [10], is used to study the dynamical behavior and the forces on the WEC developed at Uppsala University [12]. Ultimately, the PTO-damping should be optimized both to minimize the peak forces in the connection line and maximize the energy absorption, across all sea states at the location of the device. In this paper, the response to periodic waves with constant wave period has been studied. It should be noted that the response is expected to depend on the wave period, and the results in this paper should be considered as a first step to understand the dynamical behavior of this device. Both frictional damping, assumed constant, , and linear generator damping, , are studied. The WEC concept consists of a linear generator at the seabed that is directly driven by a point-absorbing buoy floating at the surface. A mooring line connects the buoy with the translator that is moving vertically inside the linear generator at the seabed. The translator has a limited stroke length, and endstop springs are installed to dampen the motion in both the upper and lower endstop. A peak force will occur in the connection line when the upper endstop spring is hit, and if the wave is high enough to fully compress the enstop spring, a second peak force is expected, corresponding to the elasticity of the connection line.
Much work, both theoretical [13,14,15,16] and experimental [17,18,19], has been accomplished to maximize the power absorption and increase the force in the connection line for this type of WEC. An optimal WEC with high power output and high survivability will have high mean forces and low peak forces. The energy absorption can be increased by optimizing the generator damping to the sea state, as well as the buoy geometry and size. For the generators at the Lysekil testsite on the Swedish west coast, WEC prototypes have been operated offshore with generator damping approximated around 10 to 40 kNs/m [20]. Linear theory has been used to optimize generator damping coefficient to the seastate [21,22,23], and it was seen that a higher generator damping, around 50–100 kNs/m dependent on buoy size, could increase the energy absorption.
Further, in the physical wave tank experiments presented in [24], and in [10], it was shown that the peak forces can be decreased by an increased generator damping. In reference [25], RANS-VOF simulations were used to numerically study the peak forces of the endstop hits. The peak forces were seen to level out even for increased wave amplitude when the buoy was overtopped by the waves, but only if the generator damping was high enough to keep the translator from hitting the upper endstop spring. Those results suggest that an increased generator damping would lead to both a higher mean power and lower peak forces for prototypes at the Lysekil site. However, it should be noticed that in these mentioned works, both in the physical and numerical modeling of the generator damping, the translator-stator overlap, the part of the stator winding covered by the translator, was assumed to be full during the full stroke length. In reference [26,27], the line force was measured onshore for the total stroke length of a linear generator, including the decreased line force during the partial translator-stator overlap. This decreased line force would allow the buoy and the translator to accelerate just before hitting the endstop, which would increase the peak force of the endstop hit. To account for this important physical property, this is included in the RANS-VOF model used in this paper, and the influence of a decreasing translator-stator overlap on the endstop forces of the WEC is studied. From the mentioned studies, it is clear that the generator damping, the friction, the partial translator-stator overlap and the length of the connection line all influence the experienced line forces, which affect the survivability of the device. In this paper, all these parameters are included and their effect studied in detail. Further; the forces and dynamics are studied when the WEC is impacted by high regular waves and compared with the impact of a tsunami wave. Both frictional damping, assumed to have constant magnitude, , and linear generator damping, , are studied in this paper. The influence of line length on peak forces is modelled and compared for regular waves and tsunami waves.
2. Method
2.1. Governing Equations
The open-source software OpenFOAM v2.4.0 was used for all the simulations in this paper. The Reynolds Averaged Navier-Stokes equations (RANS) approach was used with an RNG turbulence model. The two-phase Navier-Stokes solver interDyMFoam was used, where the equations for the air and the water is written assuming a single fluid mixture:
where is the fluid velocity and is the grid velocity, is the mixture density and p is the pressure. is the viscous stress tensor where is the mixture viscosity and is the strain tensor. is the force from a rigid body. The volume of fluid (VOF) method uses a scalar field to track the two fluids (water and air, respectively) at the surface boundary. A volume of only water is represented by , only air by , and values in between represents mixtures. The parameter is solved from a transport equation.
The fluid properties in the mixture is expressed using .
where is a fluid property such as or .
2.2. Numerical Implementation
2.2.1. Numerical Wavetank
The simulation domain forming the wavetank was 300 m long, 75 m high and had a width of 60 m. The water depth was 26 m to resemble the depth at the Lysekil test site. A mesh resolution study was performed and is presented in Figure 1. The force in the connection line is presented as deviation from the result of the finest mesh, and it is seen to converge with increased mesh resolution. The same mesh was used in [28]. According to this, the domain was discretized using 1,988,000 hexahedral mesh element; the mesh is seen in Figure 2. Each background mesh element had a side length of 2.5 m, which was refined to 0.625 m in a 25 m high box around the water surface. In the vicinity of the buoy, each mesh element was further refined to 0.078 m.
2.2.2. Incident Regular Wave
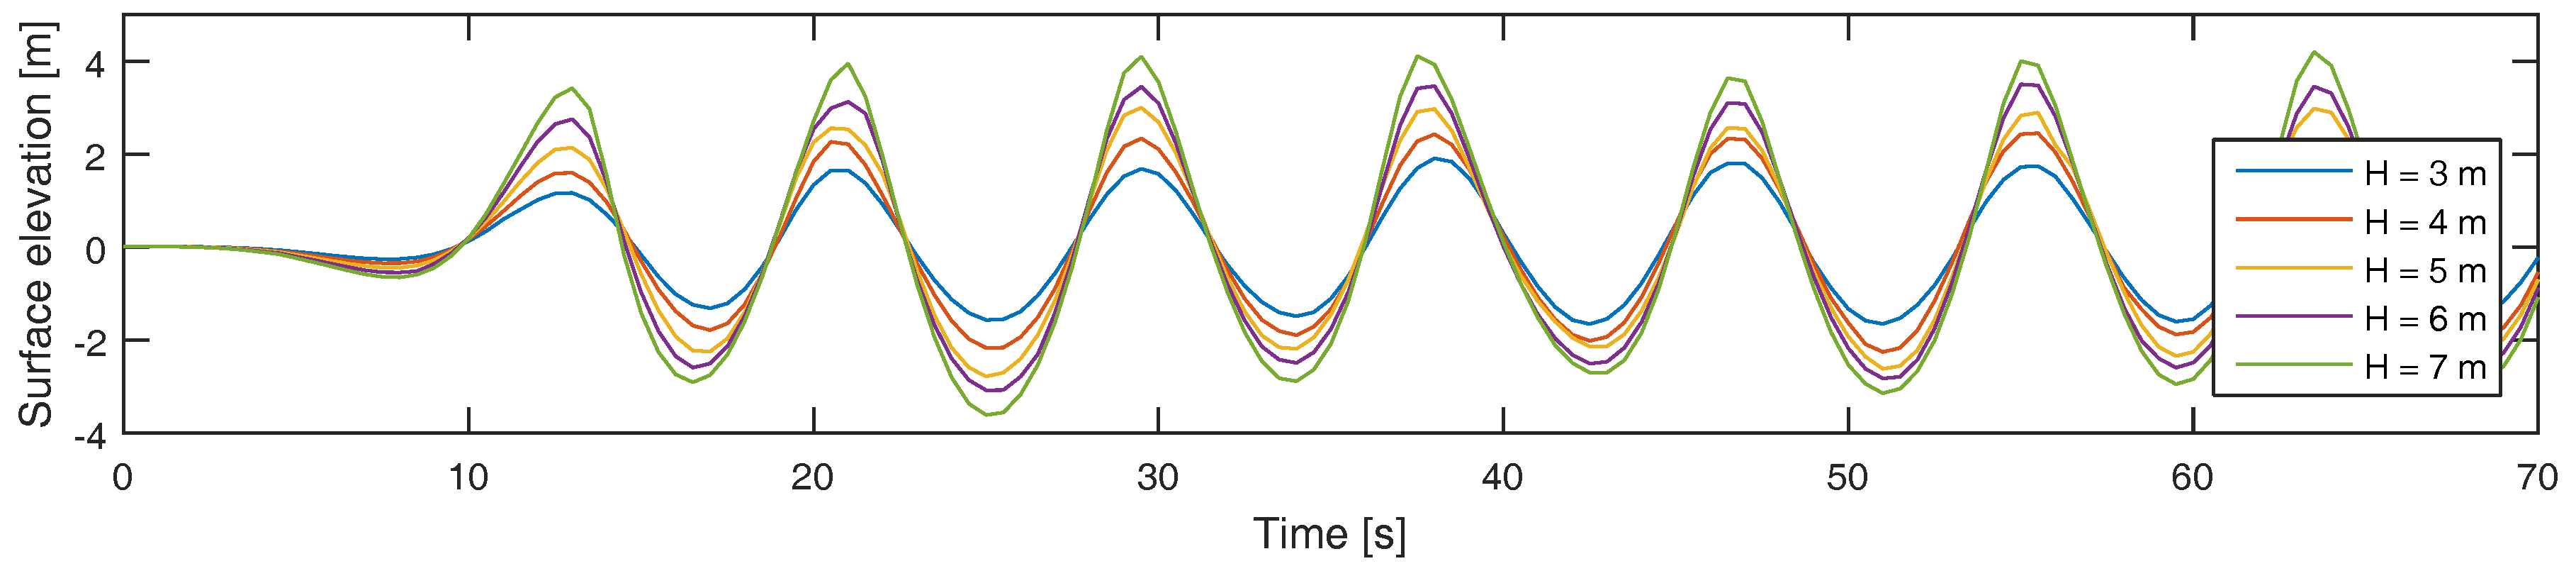
The regular waves in the model were generated and absorbed using the library waves2foam, using relaxation zones to eliminate wave reflections from boundaries and internally [29]. Relaxation zones of 100 m were placed at the inlet and outlet boundaries. The 5th order Stokes wave generator of the waves2foam library was used to implement the regular waves. To study the WEC behavior in regular waves corresponding to highly energetic sea states at the Lysekil testsite, a constant wave period of 8.5 s and wave heights in the range 3 m to 7 m were chosen. These regular waves carry the same energy as irregular waves with significant wave heights of 4.2 to 9.9 m. This corresponds to the most extreme sea states measured at the Lysekil offshore site [30].
2.2.3. Incident Tsunami Wave
While a deep water wave mainly affects the surface and the fluid velocity decreases with depth, a tsunami wave affects the speed and pressure of the whole water column [31]. The dam-break approach is commonly used to simulate tsunami waves [32,33], and was chosen for the tsunami simulations in this paper. The simulation domain was elongated with 300 m, and an 8 m high water volume was placed on top of the initially still water surface, as seen in Figure 3. The water volume had the same width as the numerical wave tank, and a length of 230 m. The WEC was placed 120 m downstream the initial water volume. The water volume was released as the simulation started, and formed a propagating wave with an amplitude of 6.3 m. The initial conditions were chosen for the tsunami wave to be comparable with a storm induced extreme wave at the Lysekil research site. A relaxation zone of 20 m was placed at the outlet boundary. Since this is too short to eliminate all reflections, the simulations were terminated before reflections occurred.
2.3. The WEC Model
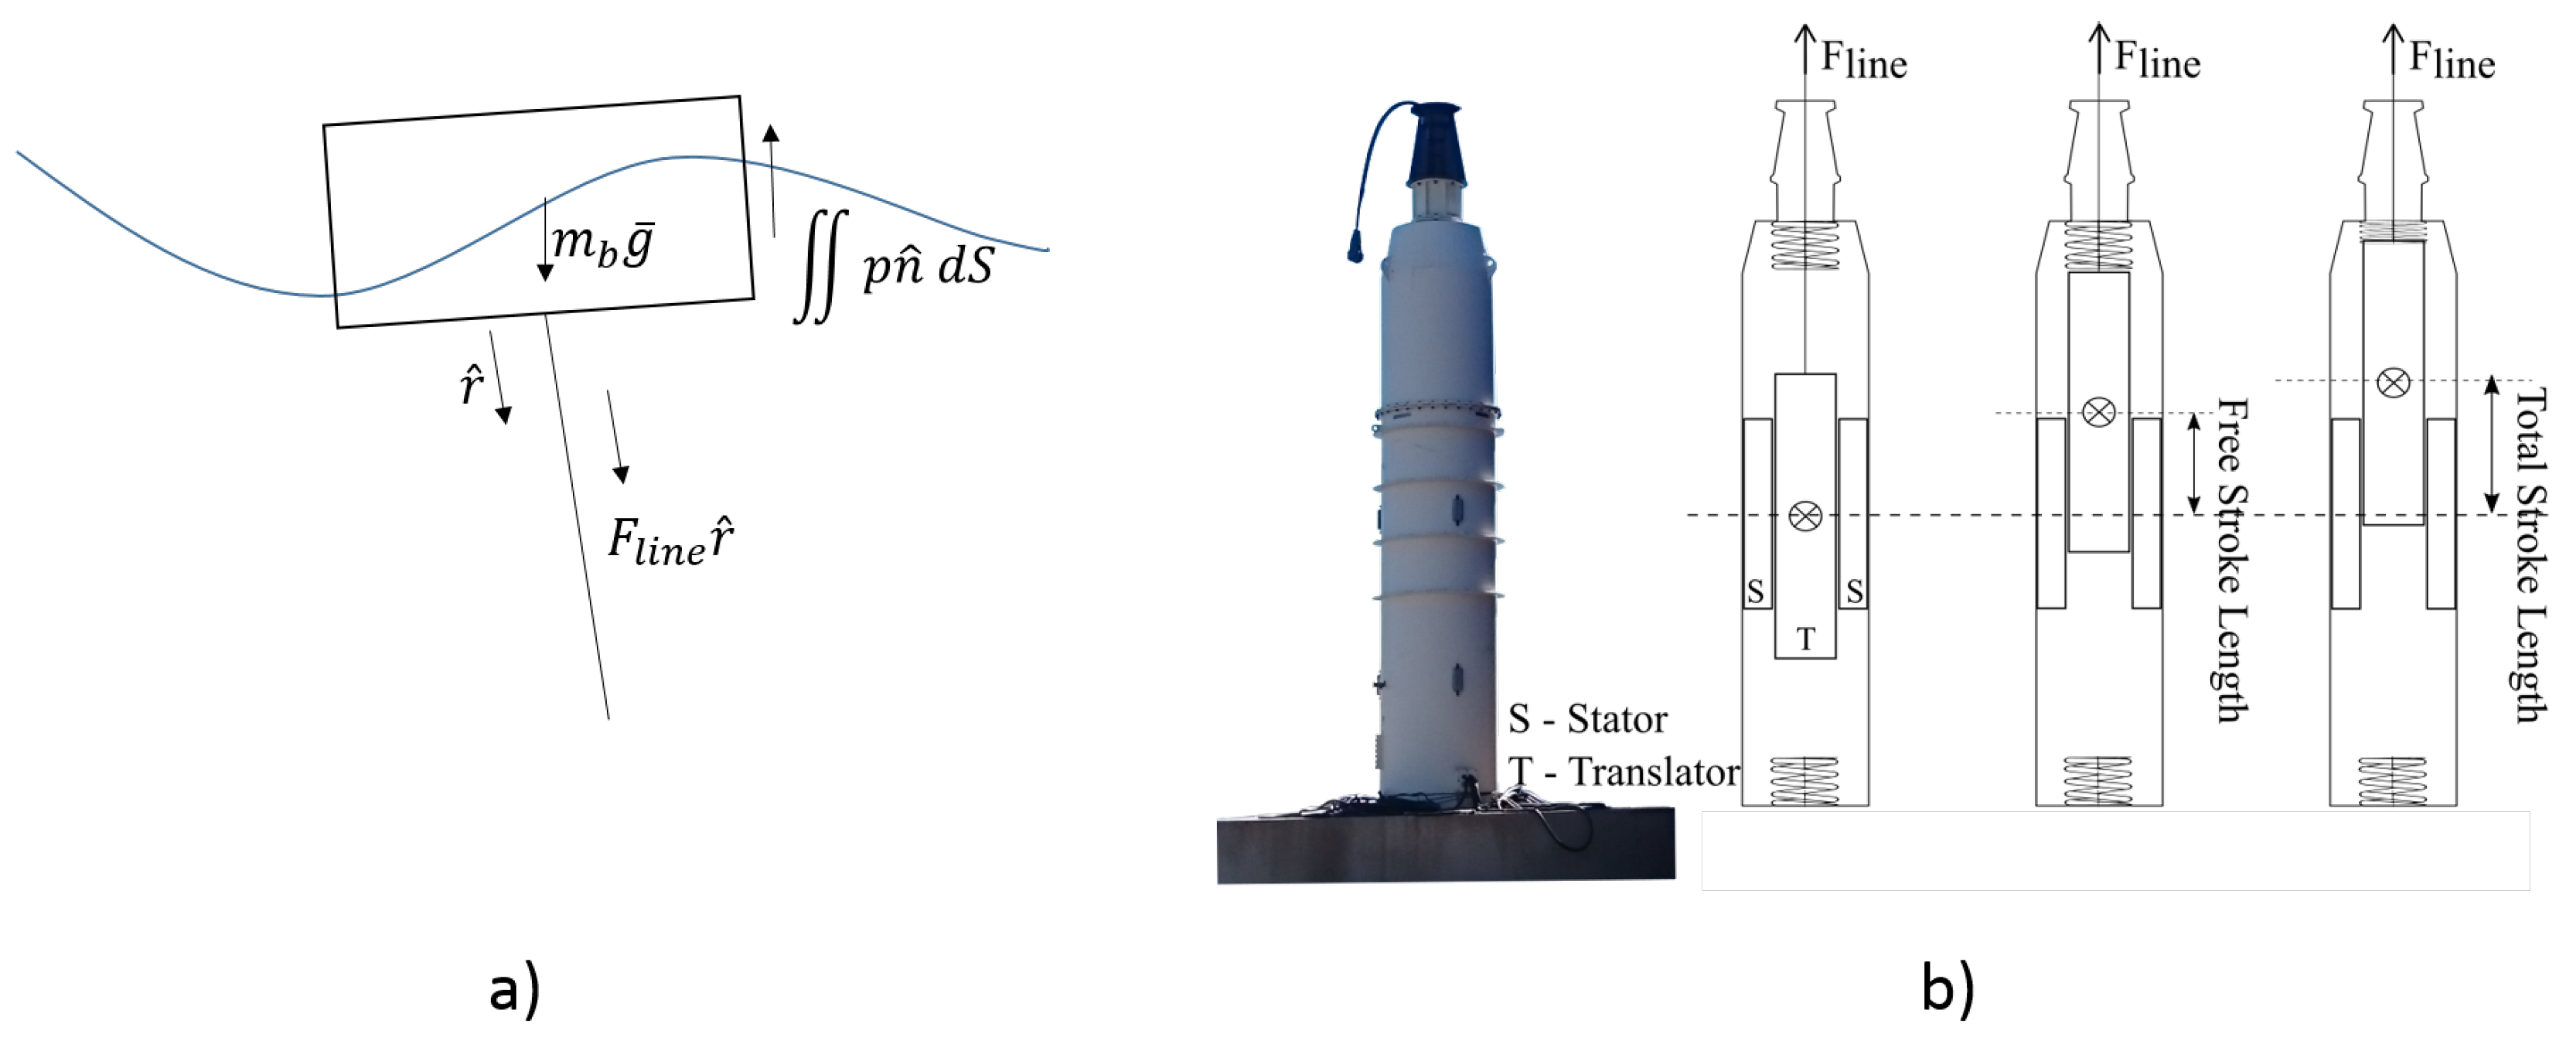
The WEC model used in this paper has previously been validated with physical wave tank data, with good agreement, in reference [10,25]. The buoy of the WEC was modeled as a floating rigid body in the wavetank, moving in six degrees of freedom, moored to a fixed position at the seabed. The unit vector points from the buoy position to the anchoring position. The linear generator was modeled as a restraining force in the mooring line, see Figure 4a. The OpenFOAM solver sixDoFRigidBodyMotion solves for the force and the torque acting on the buoy by integrating the fluid pressure over the surface area. The restraints from the generator added on the buoy are called in this paper, and are all directed along the vector , see Figure 4. The total force acting on the body, , is then together with and the mass of the buoy, and the equation of motion of the WEC modeled in OpenFOAM is:
where and are the mass of the buoy and of the translator and is the position vector of the buoy. The restraining forces are the gravity force on the translator , the electromagnetic damping in the generator simplified as , and frictional loss, . The generator damping and friction forces are directed in the opposite direction of the translator movement. As seen in Figure 4b, the translator-stator overlap is not full during the whole stroke length, and the force factor must be multiplied with , where the factor is the fraction of the stator that is overlapped with translator, and c is a factor 2 [27]. When the translator hits the upper endstop spring, a restraining endstop spring force is added; , where is the length of r at still water and the translator stands in the middle position. is the free stroke length, seen in Figure 4b. If the endstop spring gets fully compressed, a second endstop force is added, corresponding to the elasticity of the connection line; , where is the total stroke length, seen in Figure 4b. The Heaviside functions and define when the endstop spring is hit and when it is fully compressed, and depend on the length of the the vector as:
When the translator stands on the bottom of the WEC, the line is slack and is set to zero using the Heaviside function . The total restraining force is described by:
If becomes a positive number, the line would slack and is set to zero. The WEC parameters used in the model are found in Table 1.
3. Results
3.1. Peak Forces as a Function of Wave Height
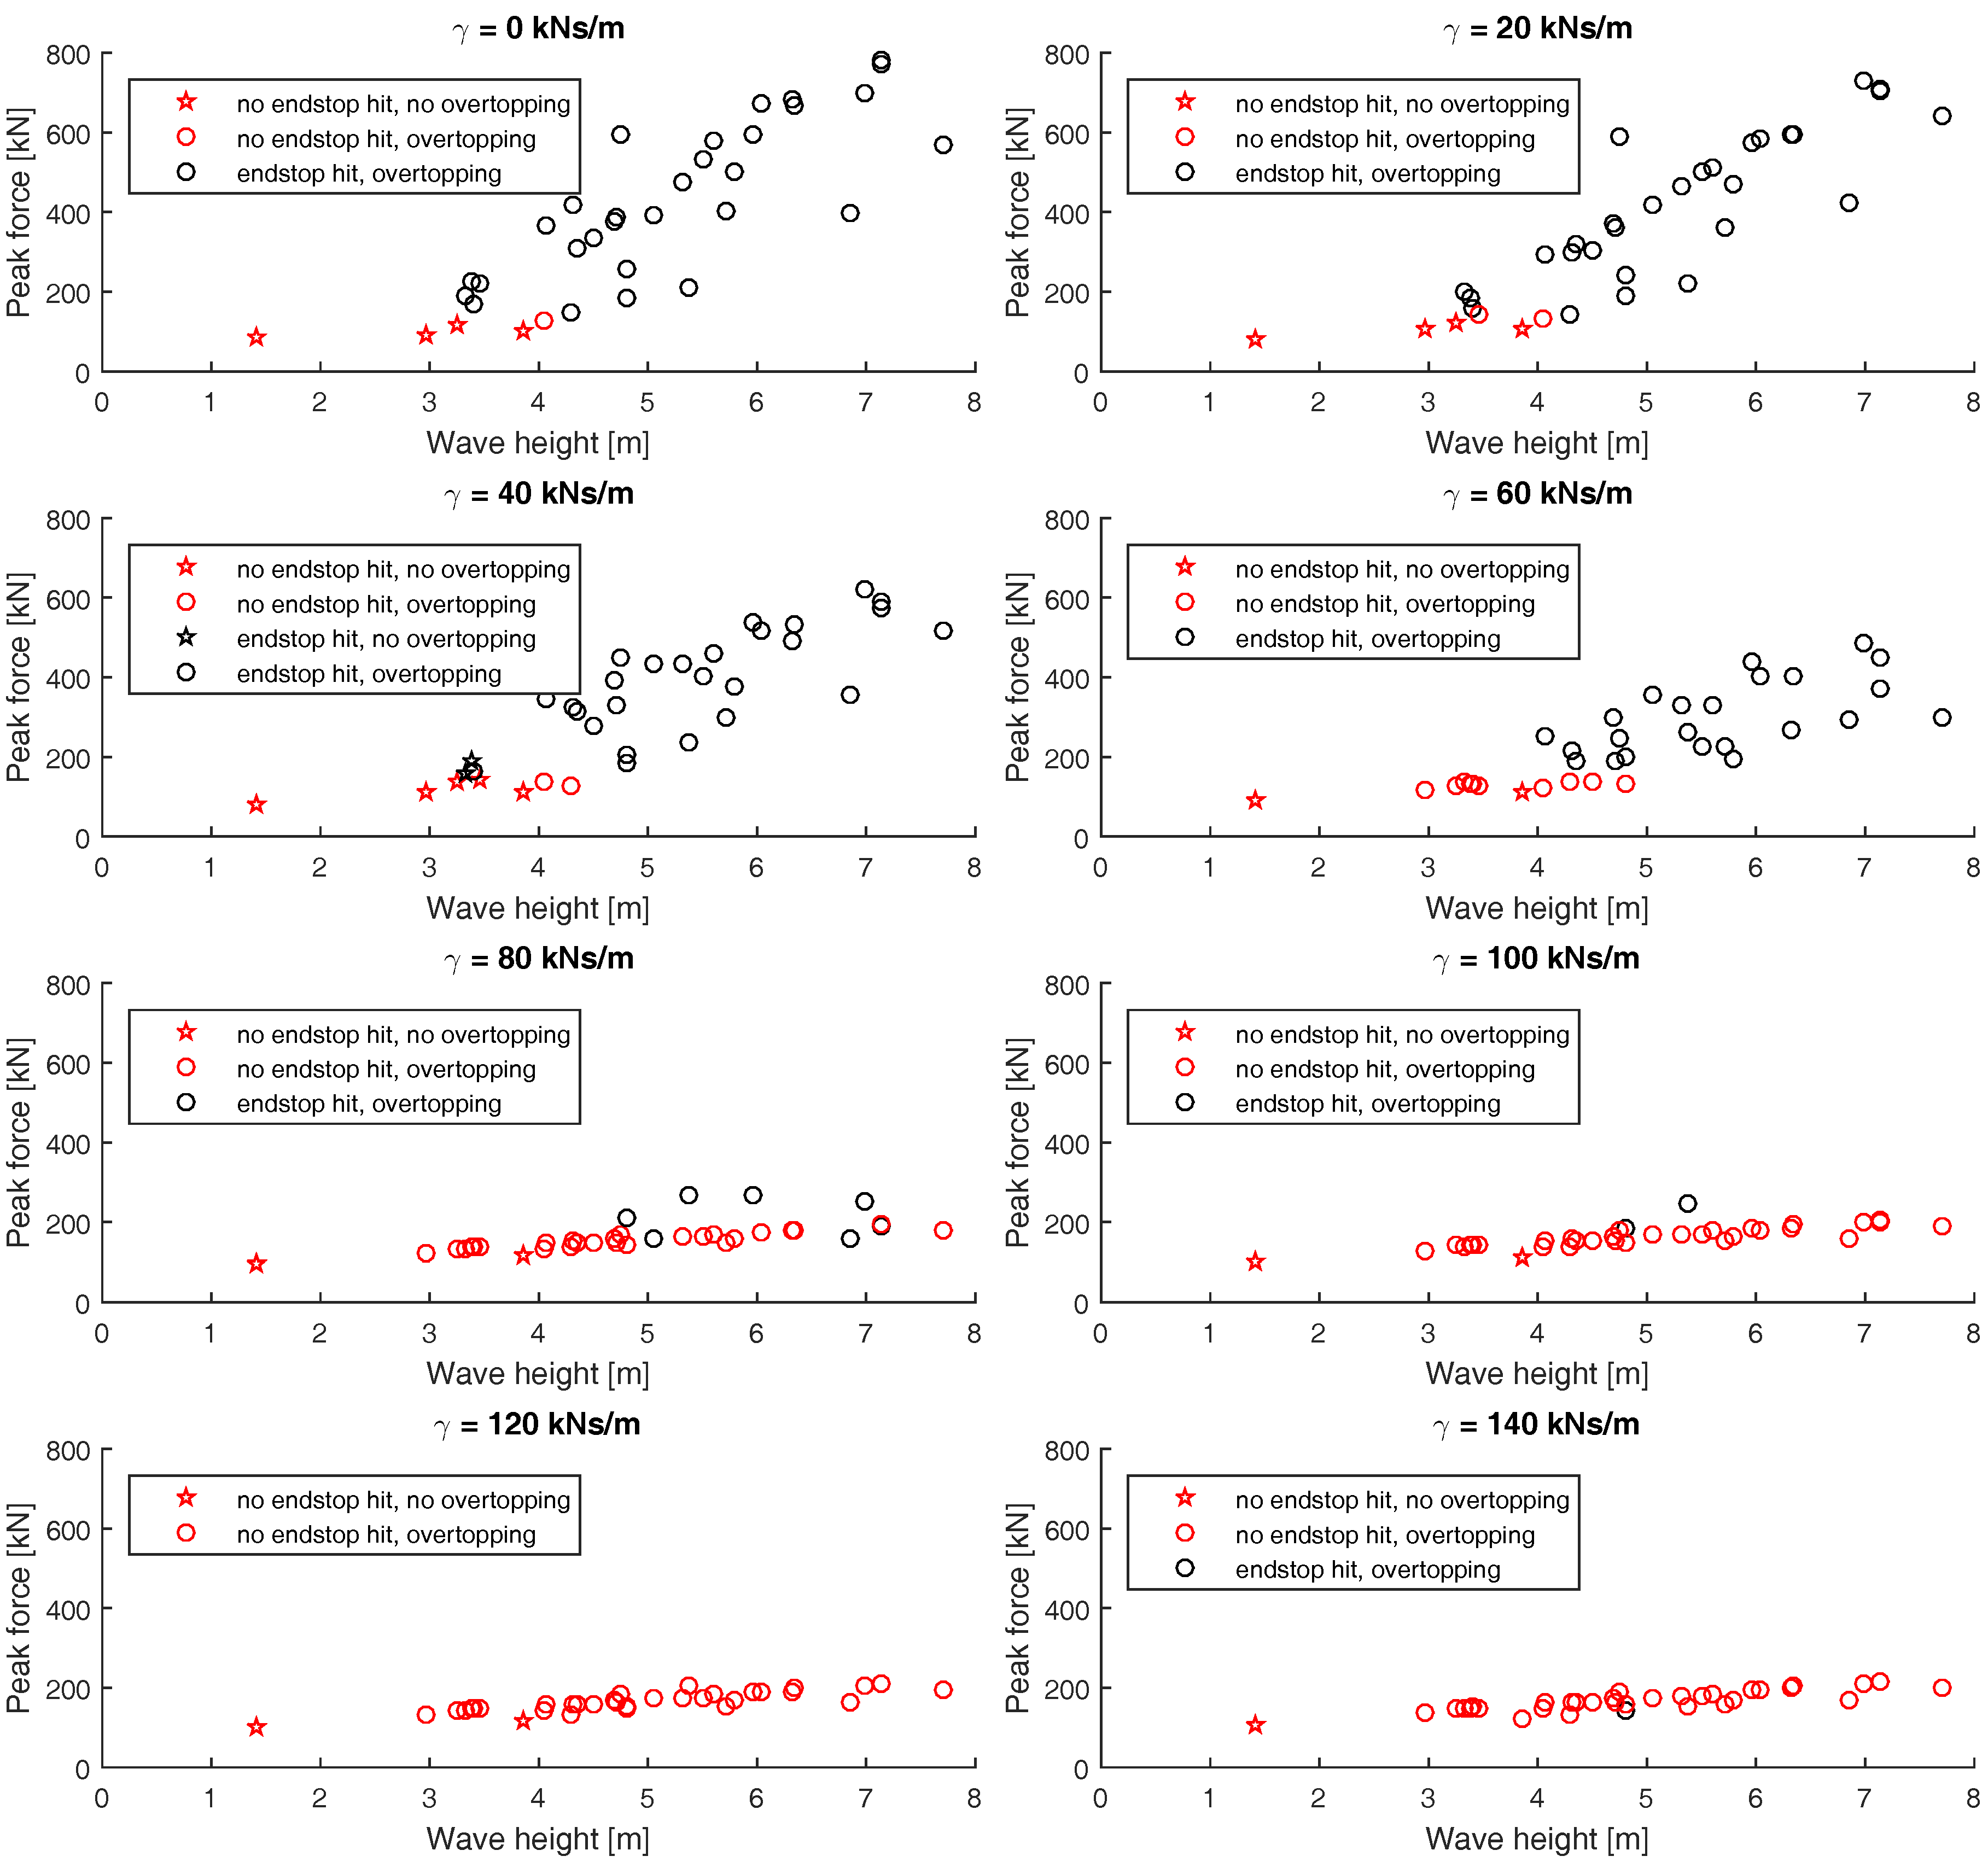
To study the impact of endstop hits and overtopping waves on peak forces, incident periodic waves with a constant wave period of 8.5 s were simulated, and the peak forces in the connection line were plotted as functions of corresponding wave height. Five incident waves of increasing heights were used; the surface elevations at the position of the WEC are seen in Figure 5, and the wave steepness (kA), of the waves are found in Table 2. This was repeated for eight levels of generator damping, ranging from kNs/m, to kNs/m with a constant increase of 20 kNs/m. Using potential linear flow theory and assuming an infinite stroke length, the optimum linear damping at this wave period was found to be 103 kNs/m. The friction was constant in all cases, kN, chosen as the measured friction of the WEC in reference [26]. In Figure 6, the resulting peak forces are plotted as a function of wave height. If all peak forces are considered, both linear and quadratic fits would be possible because of the scattering in the result. However, if only the peaks when the endstop spring is fully compressed are considered (corresponding to black markers in Figure 6), the resulting peak forces seem to increase linearly with wave height. However, the result is still scattered.
For damping factors between kNs/m and kNs/m, the peak forces decrease with increased generator damping , but further increased damping does not decrease the peak forces. This can be understood when the endstop hits are studied separately. If the endstop is hit (a black marker in the figure), a higher wave height results in a higher peak force. Increasing the generator damping slows down the translator, and the peak force decreases. However, when the generator damping is further increased, for higher than 80 kNs/m in this parametric study, the generator is strong enough to keep the translator from hitting the upper endstop, as indicated by the red markers in the figure. When the endstop is not hit, the highest force in the connection line depends on the strength of the generator instead of the force of the endstop hit, and since a higher means a stronger generator, , the line force increase with increased . The reason behind this phenomenon is further explained by Figure 7, where the total force in the connection line is decomposed and the magnitude of , , and are shown for three levels of generator damping, as the WEC is impacted by a wave with H = 6 m. The total line force is a sum of these forces and the gravitational force of the translator weight. The position and speed of the translator are also shown. It is seen that for = 60 kNs/m and = 80 kNs/m, the peak force in the total connection line force mainly corresponds to a sum of the spring force and the endstop force . The translator speed decreases with increased , which explains why decreases with increased ; the impuls energy when the translator hits the upper endstop depends directly on the speed and the mass of the translator. For the higher damping of = 100 kNs/m, the generator is strong enough to slow down the translator enough to keep it from fully compress the upper endstop spring, as can be seen from the translator position in Figure 7. Since the endstop is not hit, = 0 and the highest force in the connection line does instead correspond to . Further increased generator damping cannot decrease the , and the total force in the connection line will increase again. However, it should be noted that the increased line force due to increased is desired as it can be converted to electricity, in contrast to the damaging force of the endstop hit.
3.2. The Impact of Friction on the Survivability in Extreme Waves
Although it was seen in the physical experiments in [24] that peak forces were reduced by a high friction, it is possible that a low friction could have a latching effect, which would influence the force in the connection line. To study the impact of friction on survivability in extreme waves, both a high regular wave and a tsunami wave were modeled. Five levels of friction were studied for each wave. A friction of kN was the experimental friction measured in [26] and is considered low, and it was also the friction used in Section 3.1. The theoretical case of no friction was included for comparison. Higher friction than 35 kN is not considered relevant, since it would significantly increase the wear inside the generator. The generator damping factor was set to kNs/m for all simulated cases in this section, a value that has been used at the Lysekil test site [20].
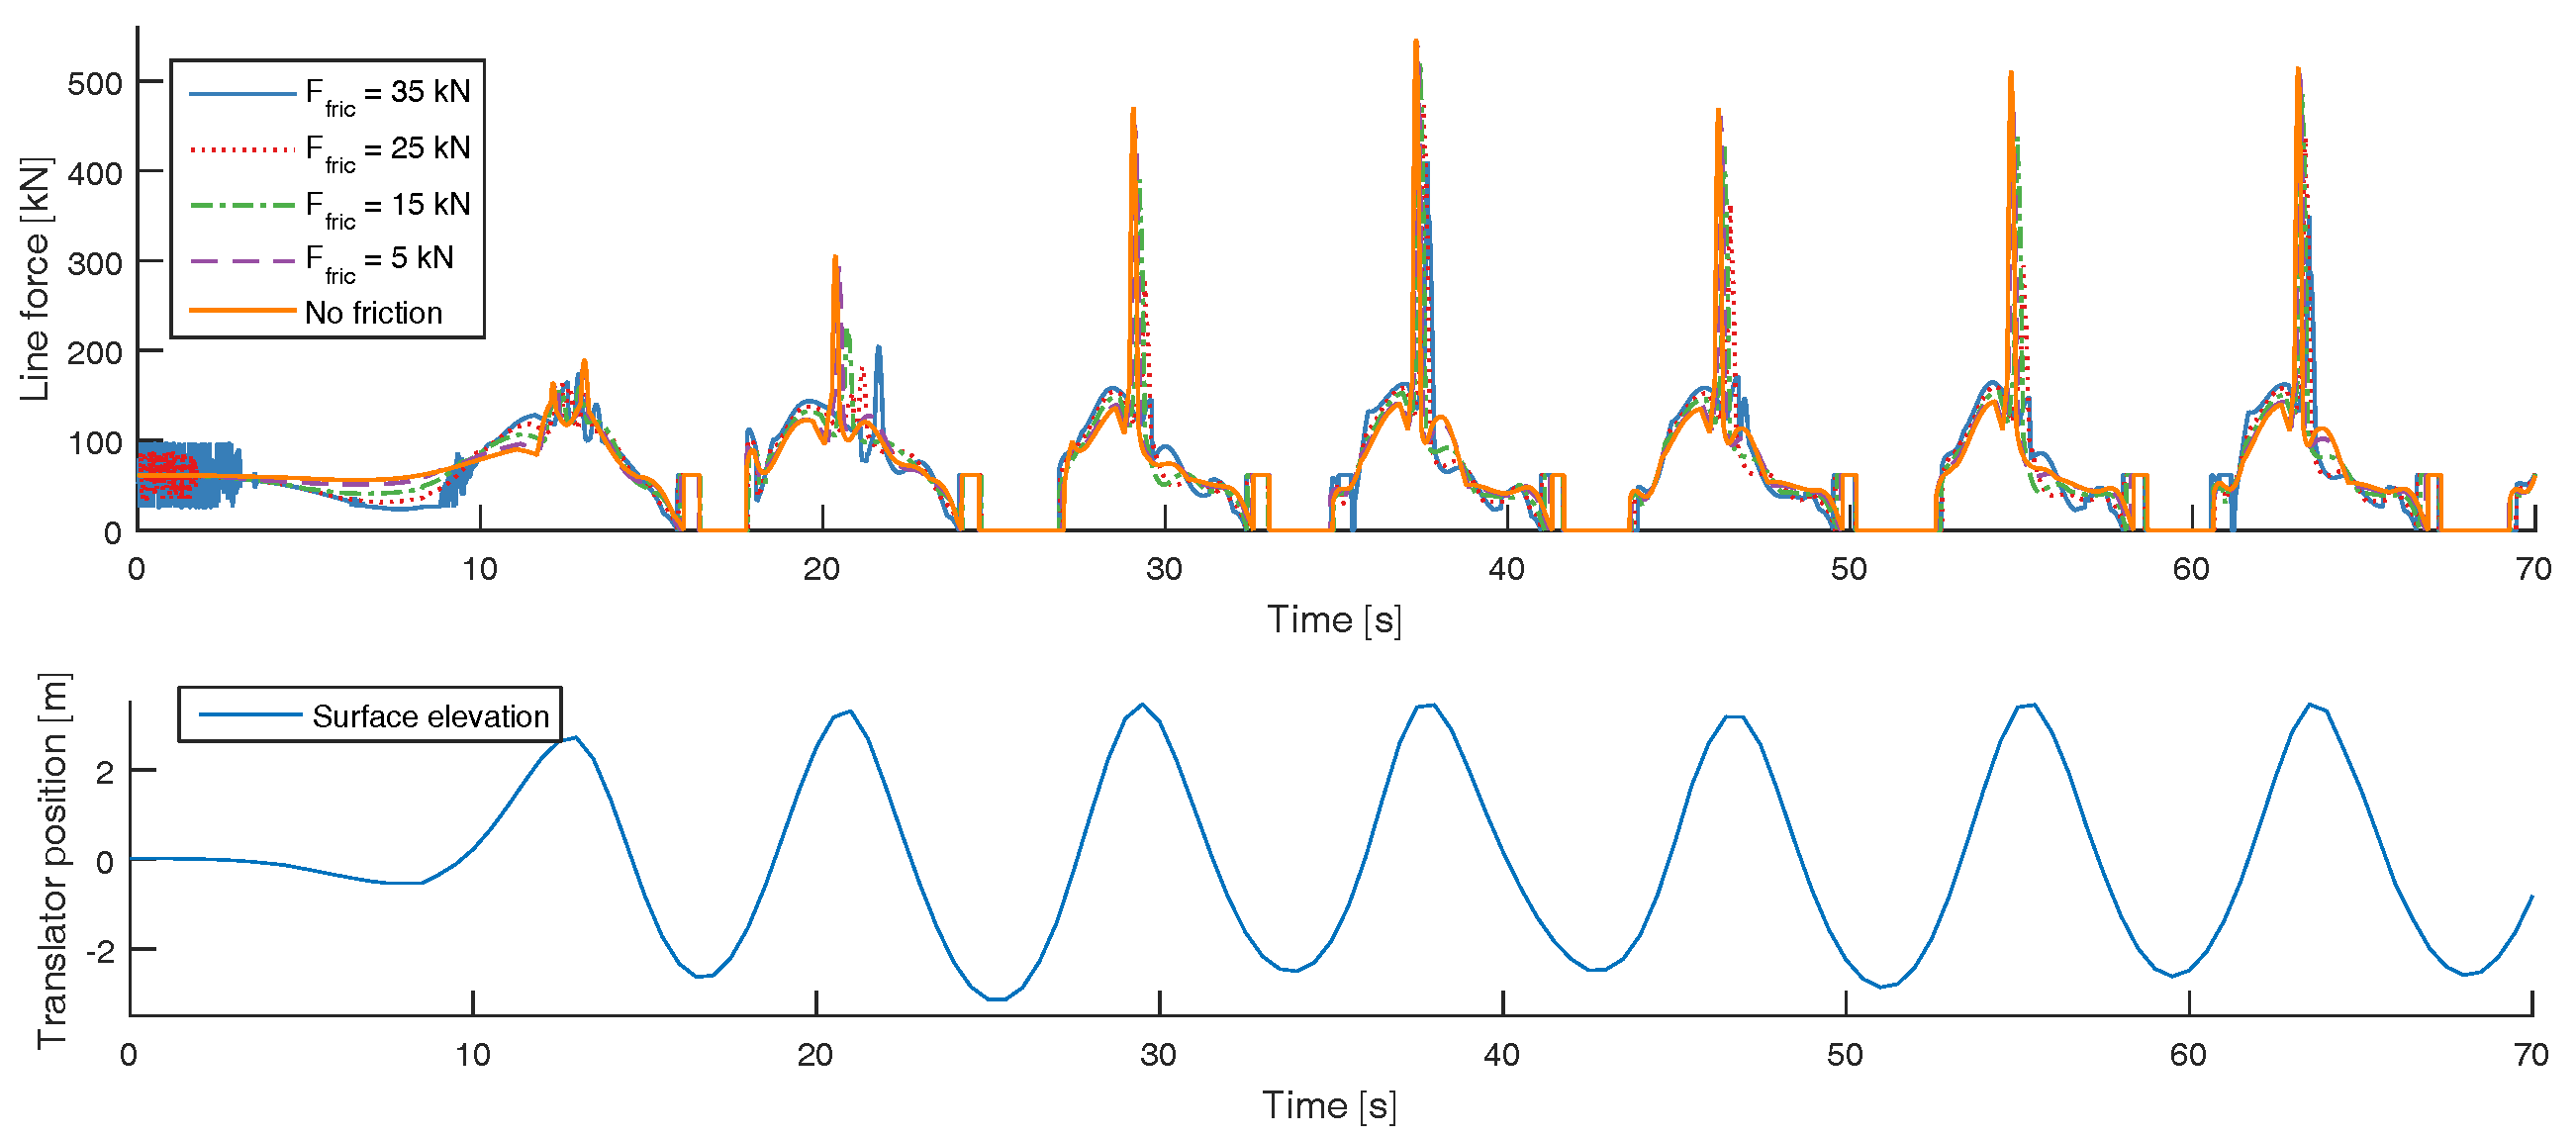
In Figure 8, the line force is seen when the WEC was impacted by a regular wave with a height of 6.5 m and a wave period of 8.5 s. For comparison, the highest single wave statistically appearing on average once per 100 years at the Lysekil test site is 6.2 m [30]. The simulation was run for 70 s, which resulted in 7 wave peaks. The transient first two peaks in the front of the wave train are followed by periodic waves. No friction resulted in the highest peak force for all wave peaks. For the periodic wave peaks, peak three to seven, the highest friction resulted in the lowest peak forces, and decreasing the friction increased the peak force. However, for the two first wave peaks, the lowest peak force was achieved for the second highest friction, not the highest friction.
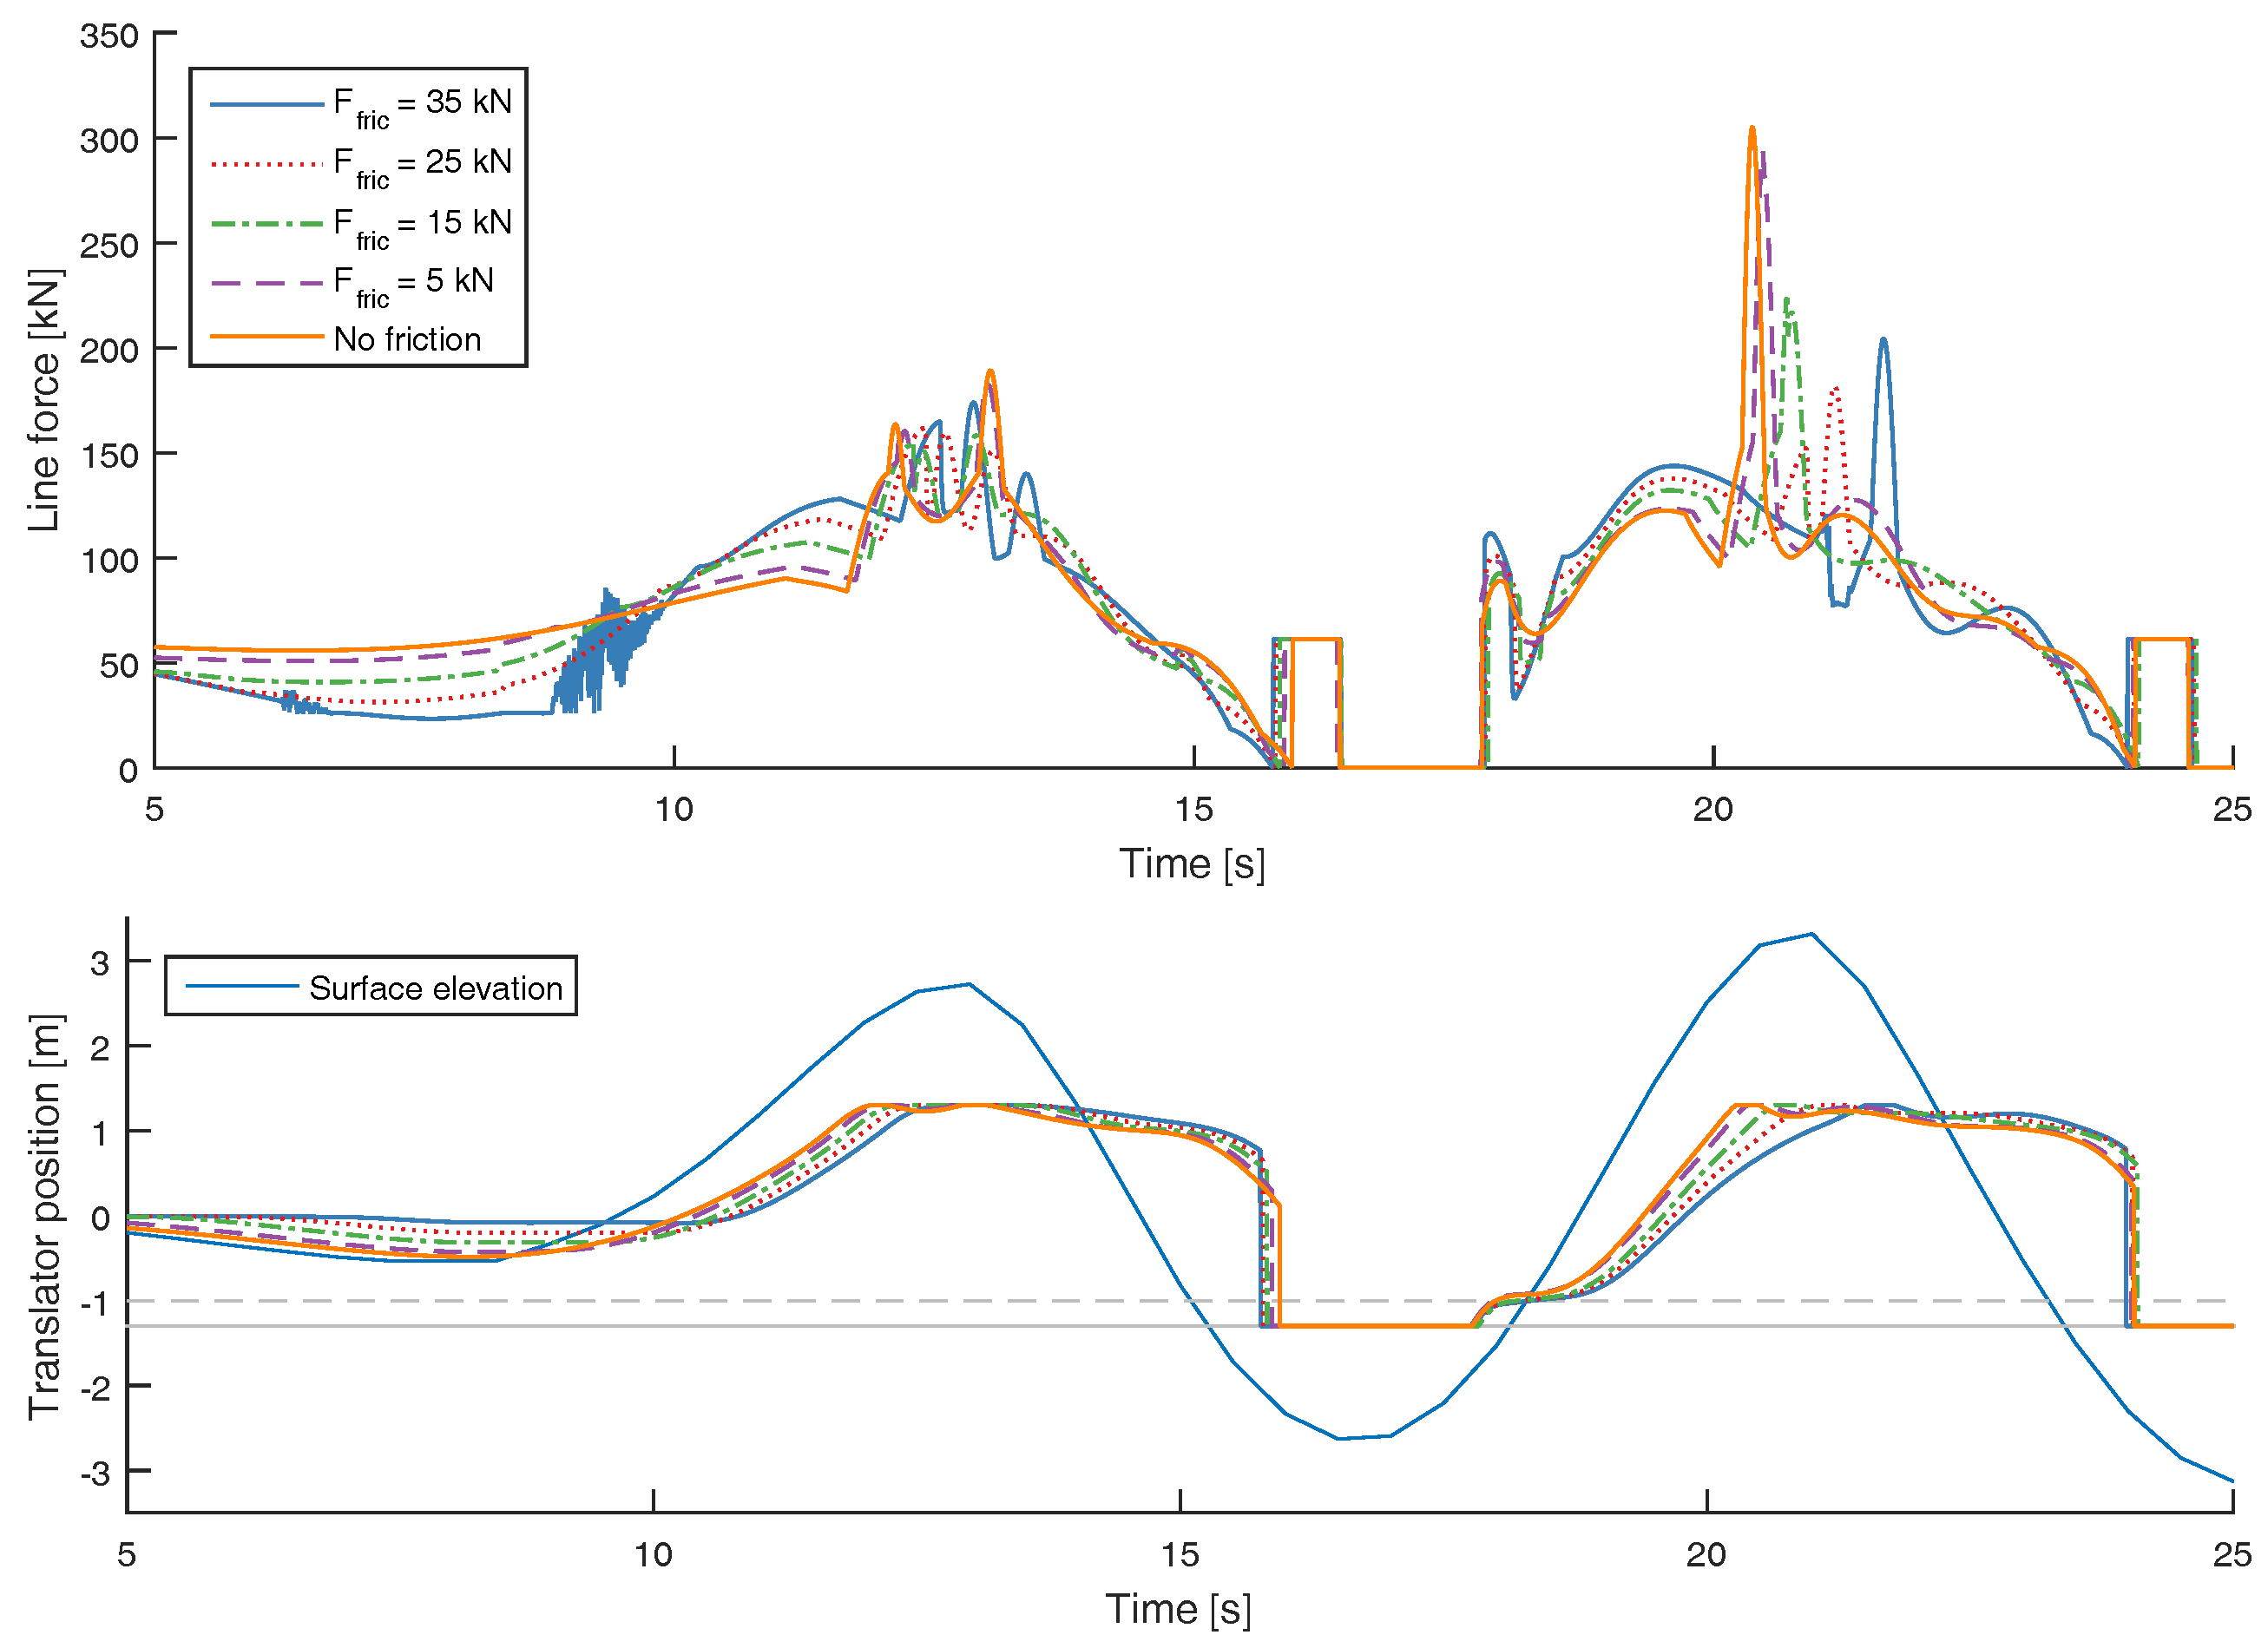
In Figure 9, a zoom of the line force of the first two peaks is seen together with the surface elevation of the wave and the translator position. The horizontal solid line represents the total stroke length of the WEC, when the translator stands on the bottom and the line slacks. The dashed horizontal line represents the lower endstop spring. It should be noted that the surface elevation is measured right above the anchoring position of the WEC. The buoy moves in six degrees of freedom and it can have large surge excursions. Studying the translator position, it can be seen that the friction is delaying the translator motion, and increases the phase shift between the buoy and the wave. The translator is more delayed by the highest friction in the second wave peak than in the first, but for peak three to seven, the delay was once again lower. The force of a wave on a buoy varies with this phase shift, and this is assumed to contribute to why the highest friction did not result in the lowest peak force for the first two wave peaks.
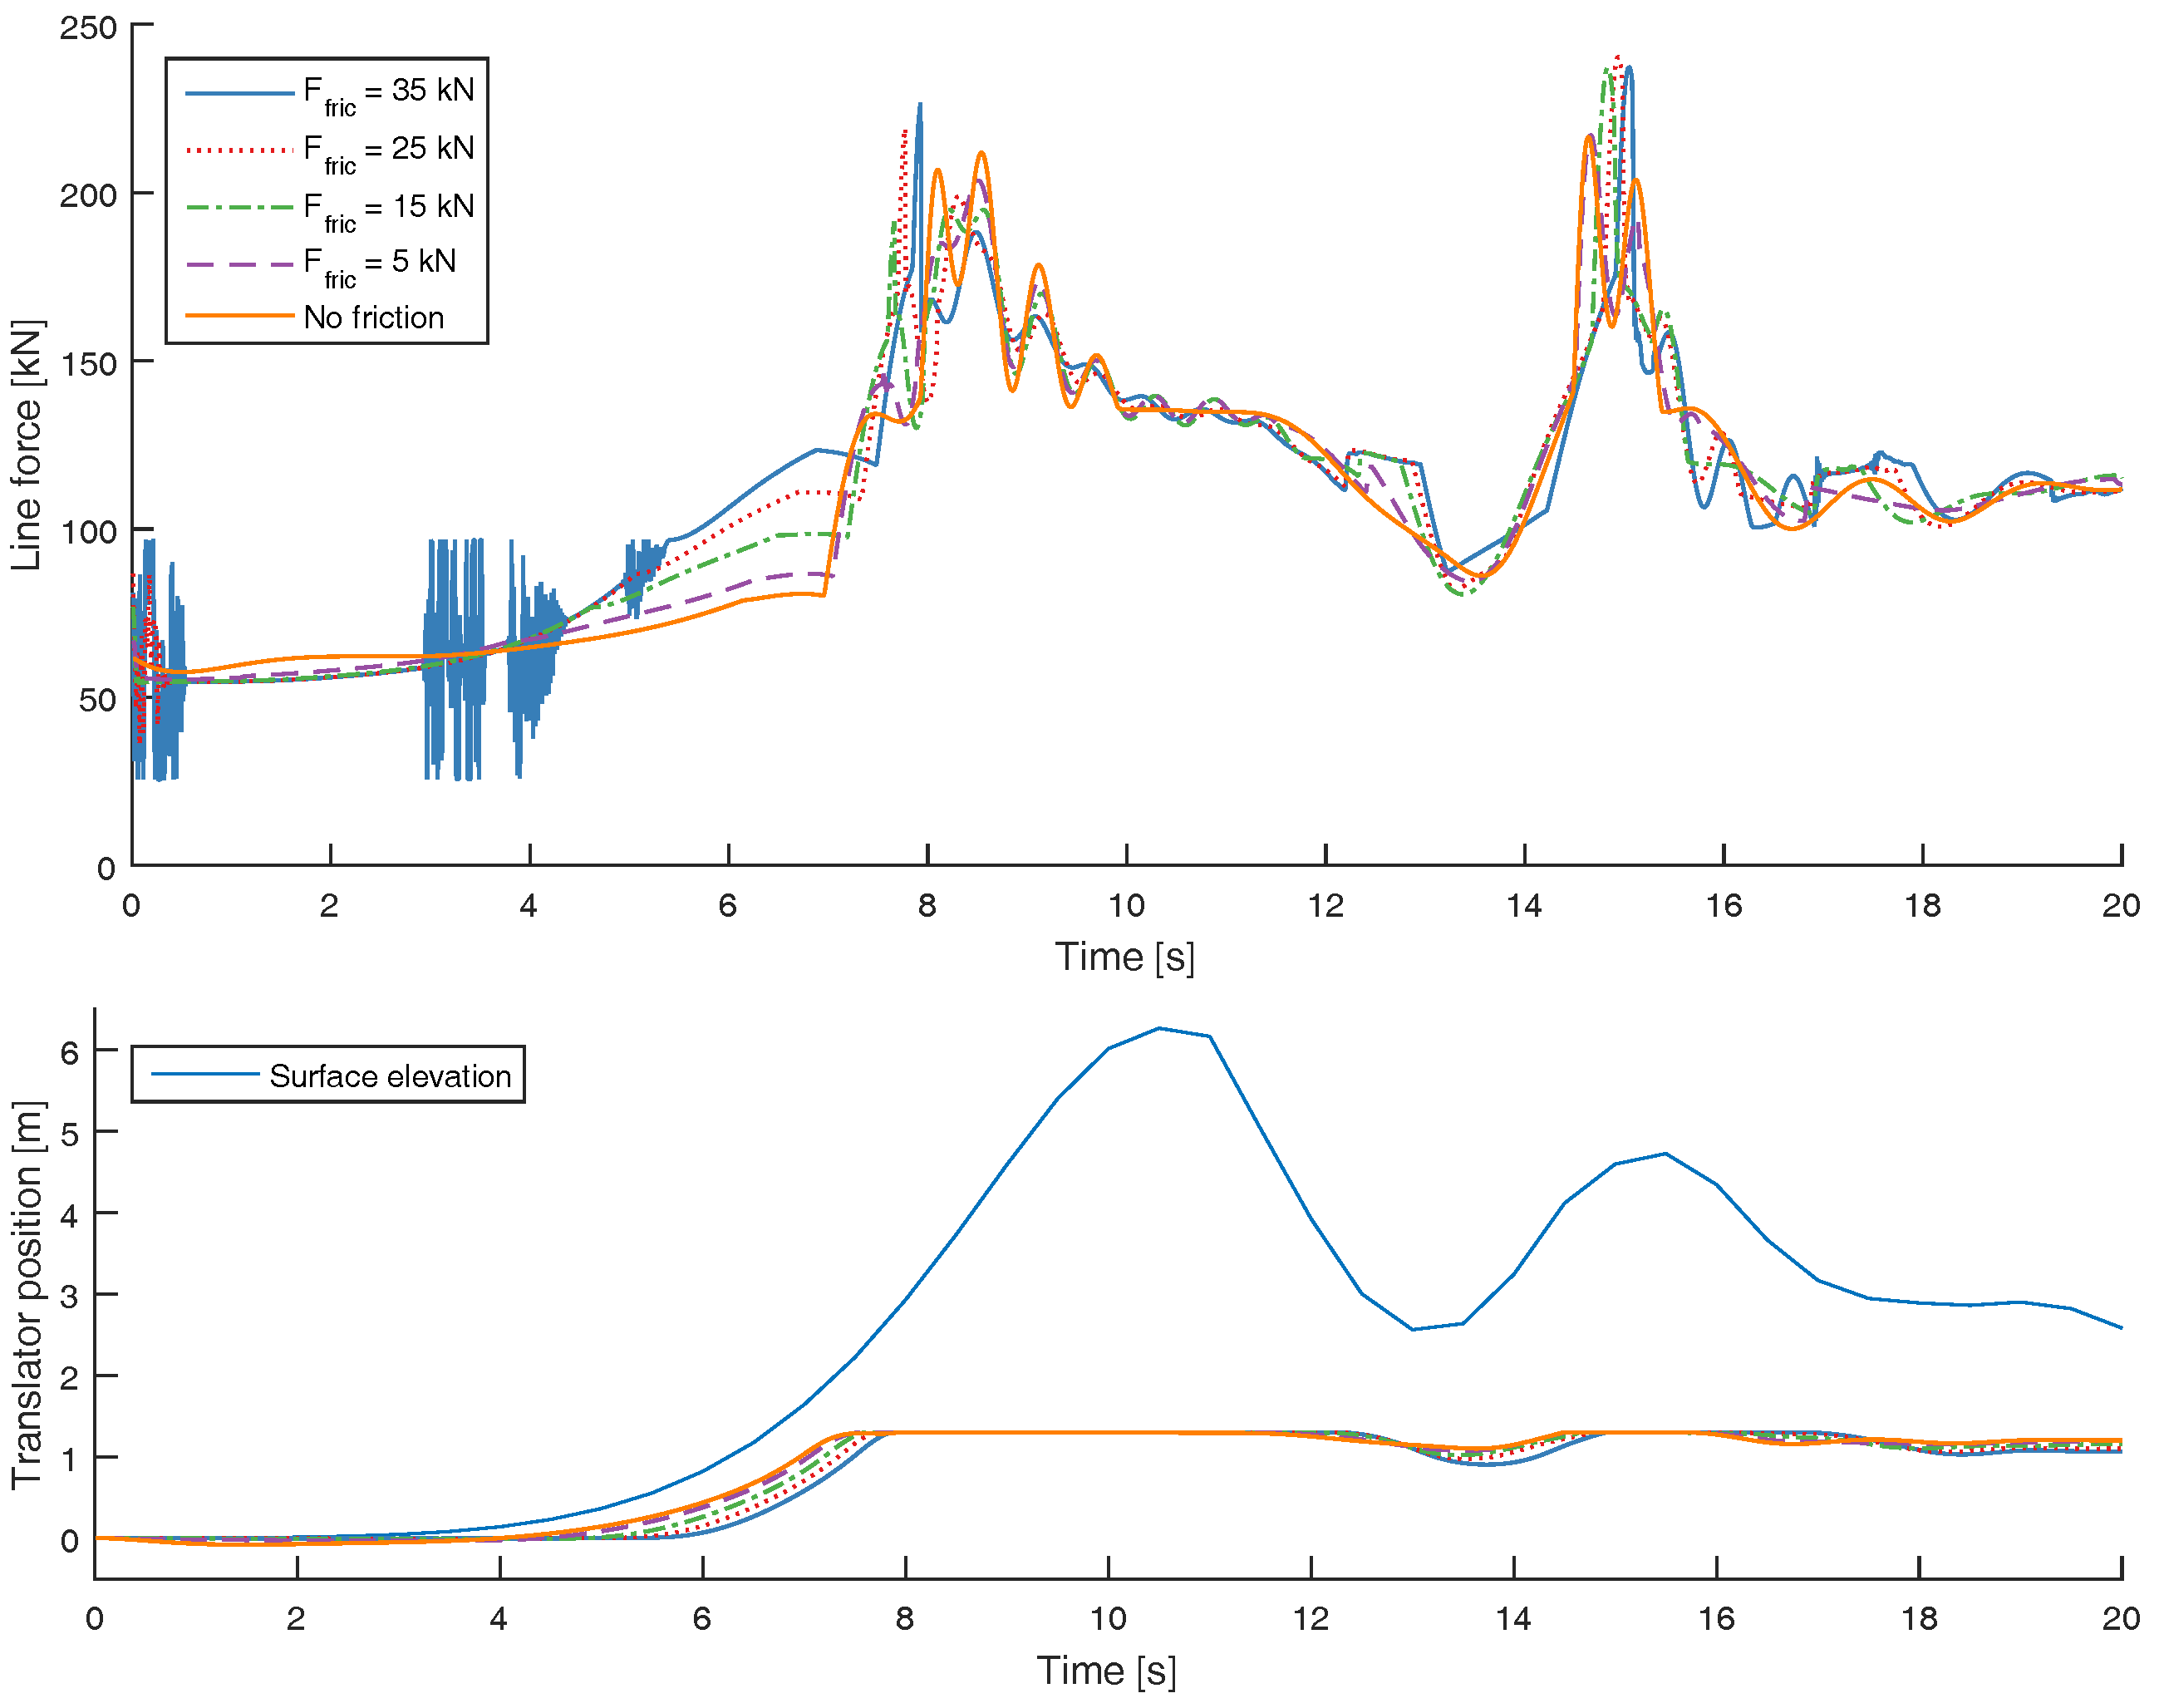
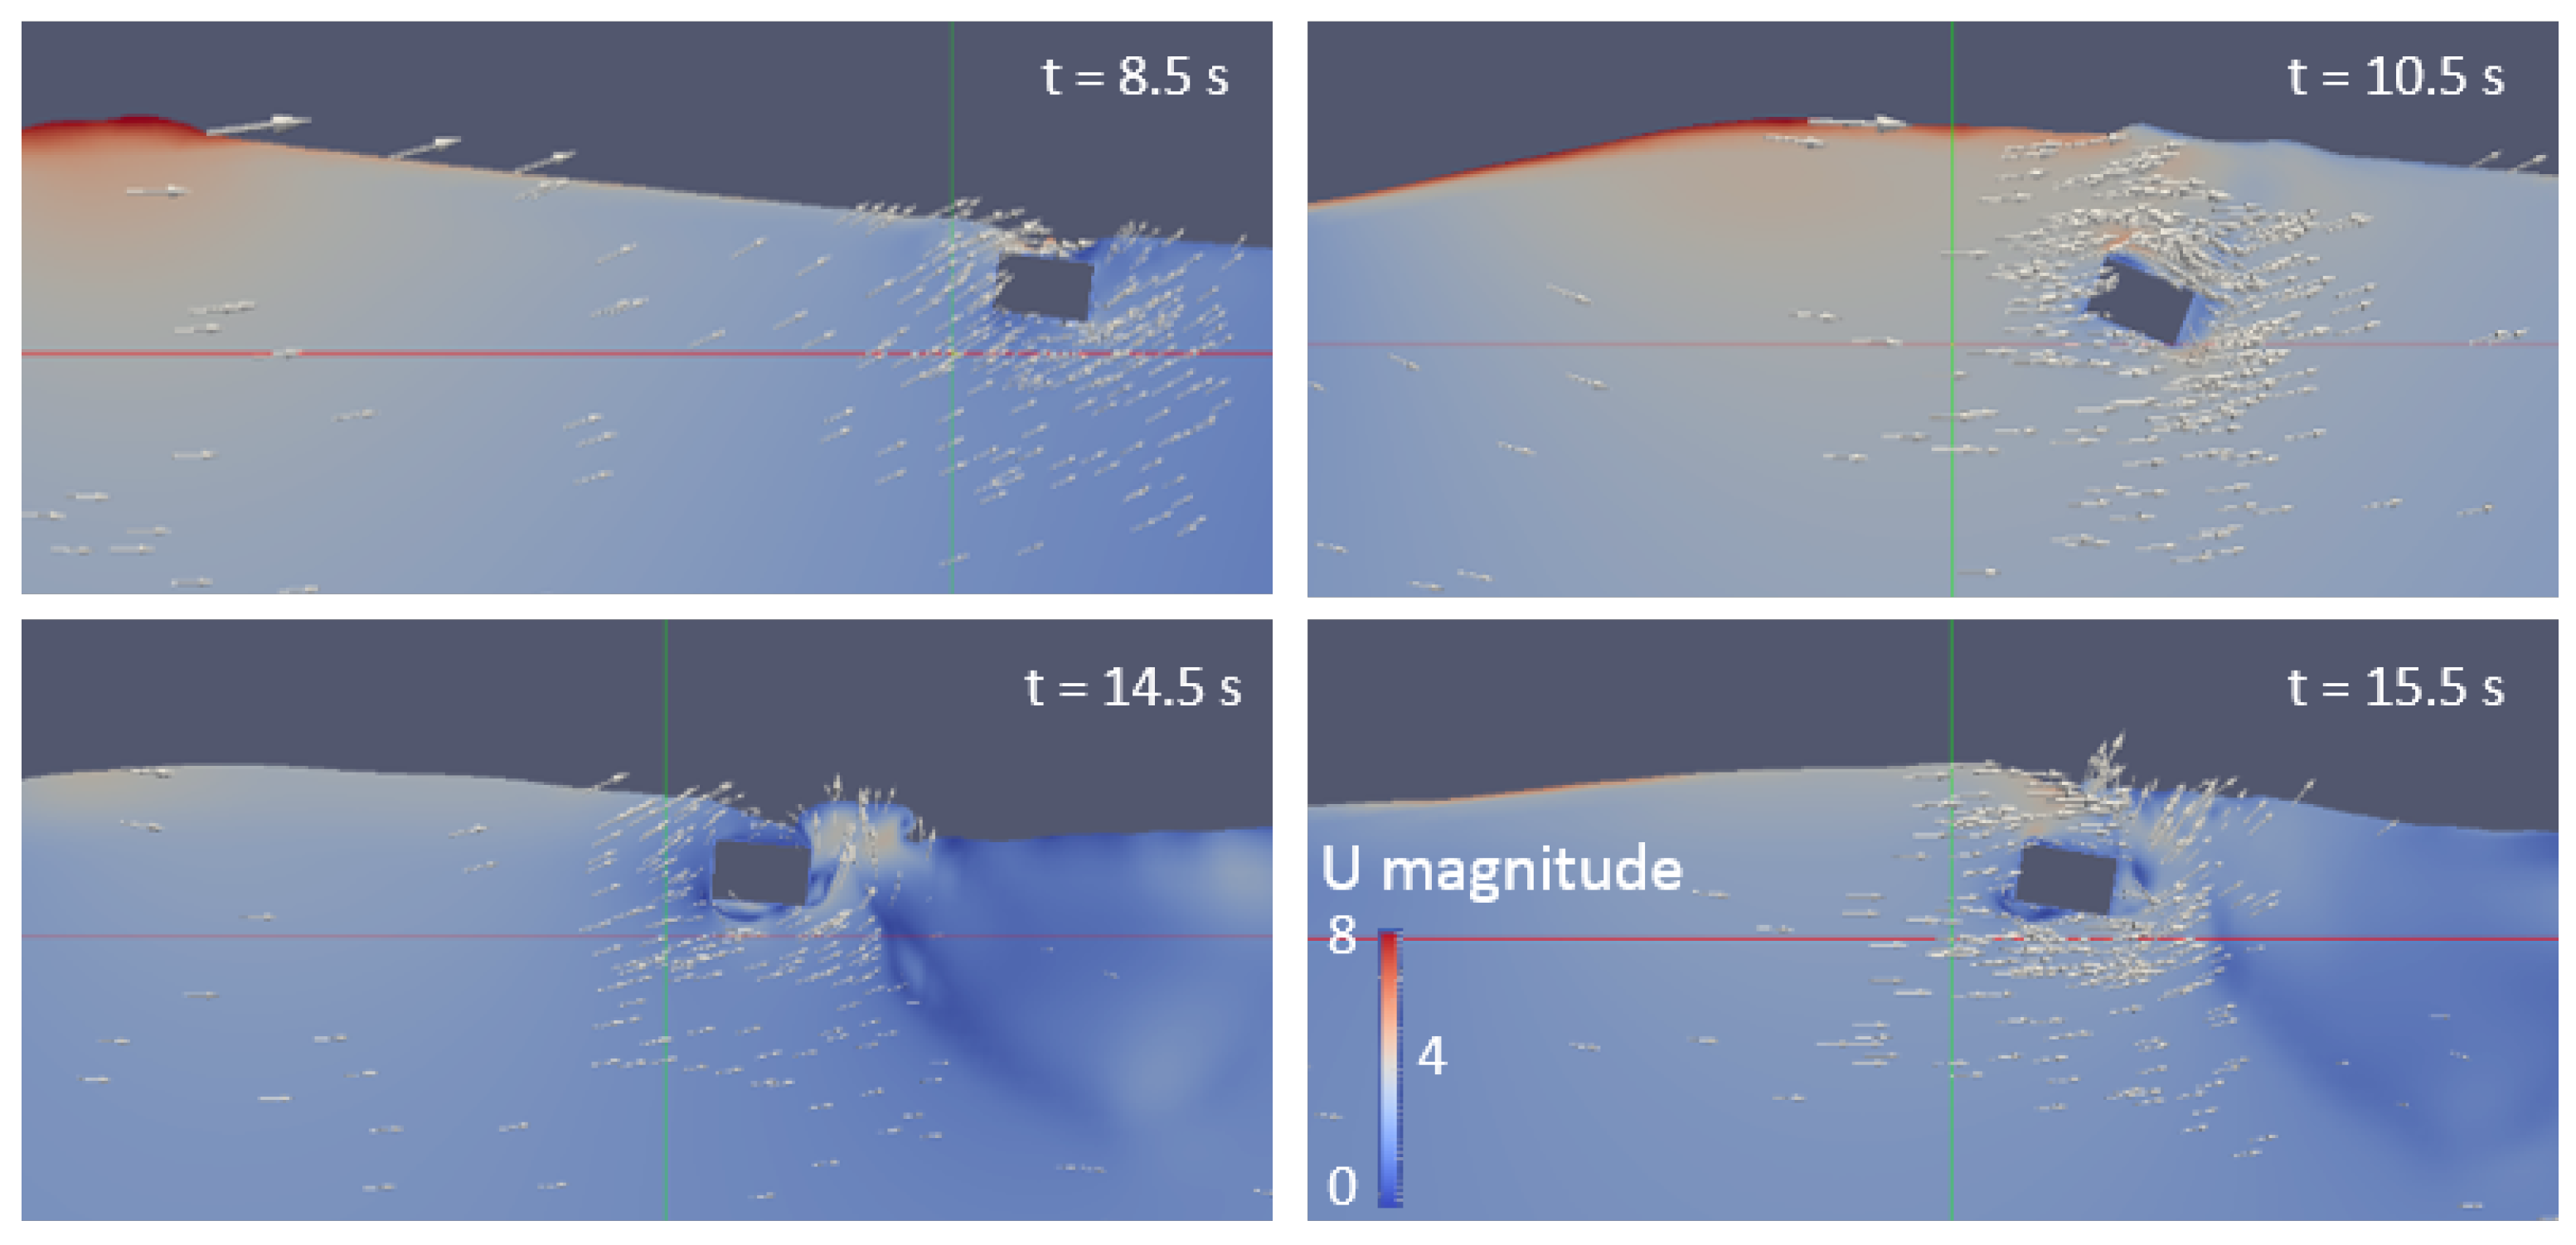
The line force and the translator position during the tsunami event is seen in Figure 10. This tsunami event, modeled with the dam break approach, has two wave peaks; one leading peak of 6.3 m, and a second peak of 4.7 m. Multiple wave peaks are a result of that the dam-break approach has been used with the wet bed condition. In Figure 11, the water velocity in the vicinity of the buoy is seen as the WEC was impacted by the first and the second tsunami peaks, and during the peak forces. At the current depth of 26 m, the wave front of the tsunami did not evolve to be very steep, but when the turbulent bore propagated over the WEC, the buoy was already submerged. The peak force in the connection line occurred before the wave peak. This is in contrast with the periodic wave, where the peak force occurred at the same time or after the wave peak. In the first wave peak of the tsunami, the highest peak force occurred for the highest level of friction, and in contrast with the results of the periodic wave, the endstop force decreased with decreased friction and was lowest for 5 kN of friction. This can be seen as a consequence of the fact that the translator motion is delayed by the friction, which gives a latching effect and increases the phase shift between the buoy and the wave, which increases the endstop force. The endstop force of the second, lower, wave peak is actually higher than of the leading wave peak. This can be understood from the fact that for a tsunami wave, the water velocity is high, and does not only depend on the current wave height. Comparing the water velocity surrounding the buoy at the times of the peak forces, t = 8.5 s and t = 14.5 s in Figure 11, it is seen that the water velocity is comparable, which explains why the peak forces of the wave peaks are comparable despite the different wave heights; when the buoy is submerged, the magnitude of the line force depends more on the surrounding water velocity than the wave height. In the second wave peak as well as for the first, a friction force of 5 kN resulted in the lowest peak force, and the second lowest peak force occurred when no friction was applied. Higher friction resulted in higher endstop force.
Even though an increased friction decreased the peak forces when the WEC was impacted by periodic waves, as expected, an increased friction did not result in an increased survivability for the tsunami wave event. This deviant behavior was also seen in the transient at the front of the regular wave train.
3.3. Endstop Forces Decrease with Increased Damping for Periodic Waves
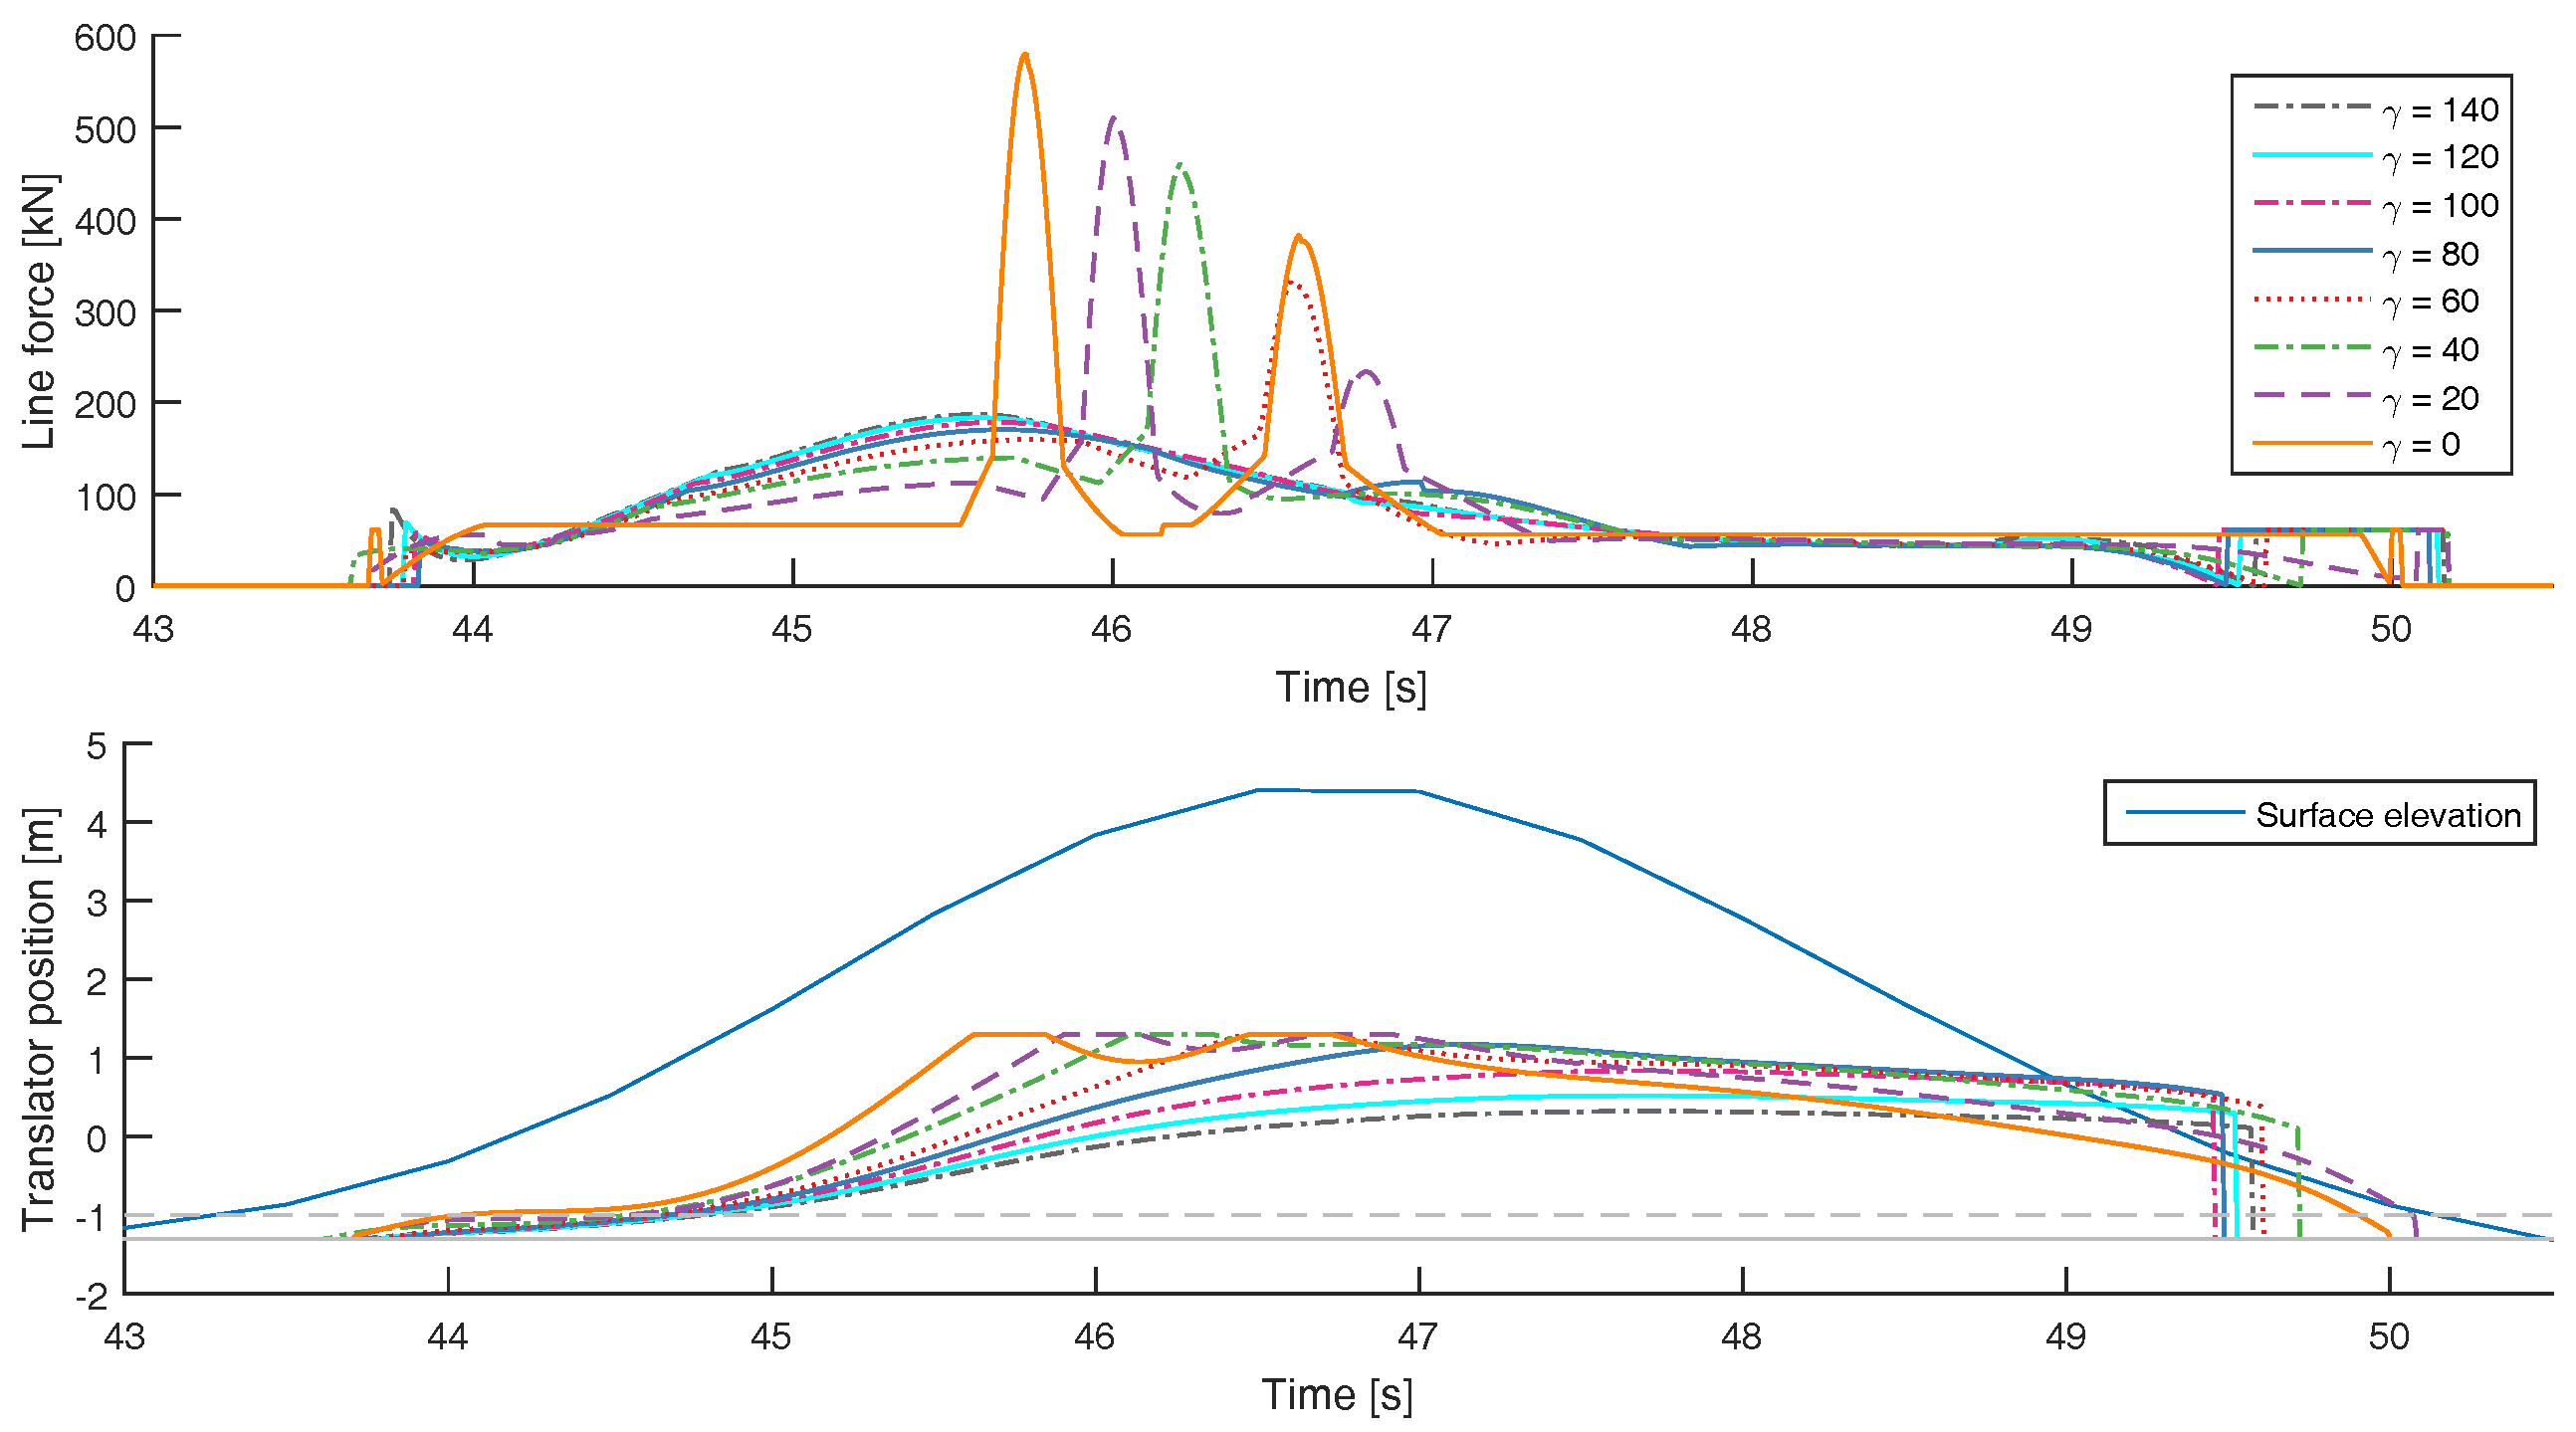
As seen from Section 3.1, the damping of the generator has a large effect on the behavior of the device. To study this in more detail, we looked at the line forces in the time domain, and compared speed dependent generator damping with frictional damping. When all the periodic waves are studied, peak three to seven for all regular waves, it is seen that the endstop forces decrease with increased damping, both speed dependent generator dampings, , as in Section 3.1, and for constant frictional dampings, , as in Section 3.2. In Figure 12, the line force is shown in the time domain for one wave peak from the study in Section 3.1, comparing the impact of different levels of . The incident wave height was 5.7 m, and is the fifth wave peak of the second highest incident wave in Figure 5. It is confirmed that if the endstop was hit, seen as a sharp peak, then an increased damping factor resulted in a decreased peak force. However, once the damping was high enough to prevent the translator from hitting the endstop, further increased damping did not reduce the line force further, but instead increased it. For this specific wave peak, endstop hits were prevented for kNs/m or higher.
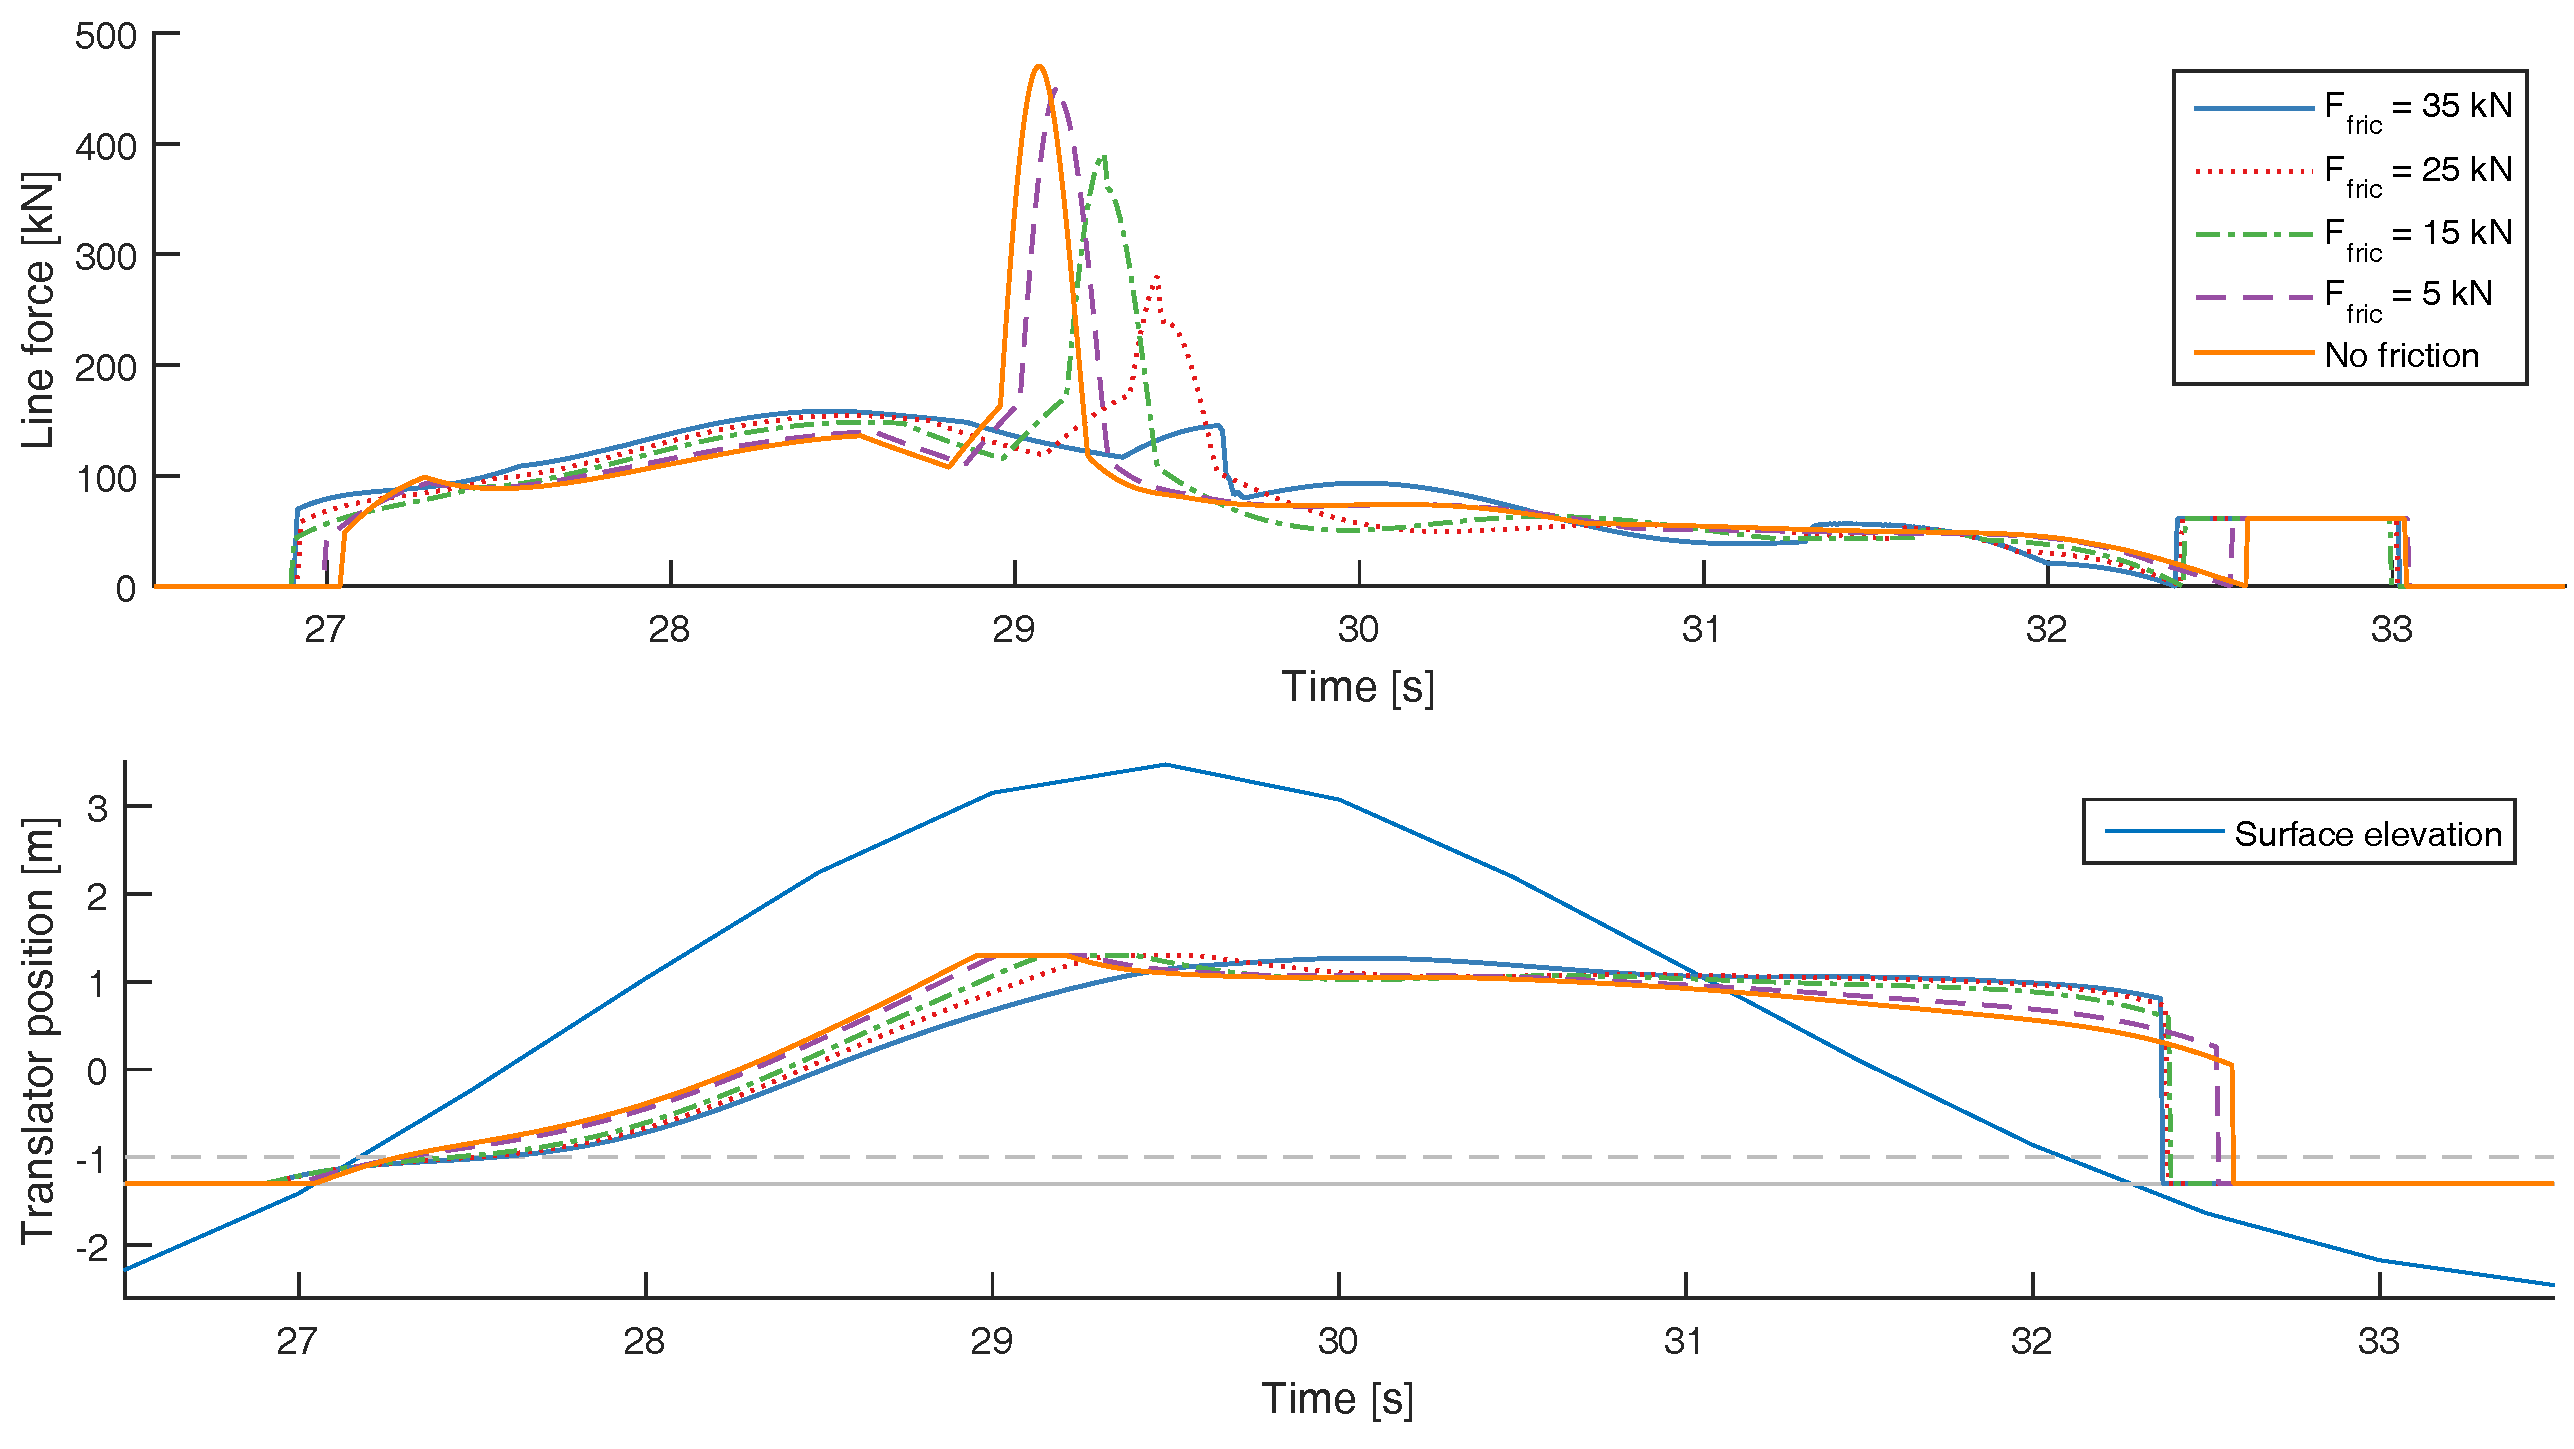
The same behavior, decreased peak forces with increased damping, was seen for the constant, frictional, damping. In Figure 13, the line force and translator position of the third wave peak in Section 3.2 is shown, comparing the different levels of frictional damping. It is seen that for this periodic wave, the friction decreased the speed of the translator which reduced the force when the translator hits the endstop. The same behavior was seen for all the periodic waves in Section 3.2. That increasing the damping decreases the peak forces was also confirmed by the physical wave tank experiment performed in reference [24], were the influence of high frictional damping on the wave loads on a WEC in extreme waves was studied in a 1:20 scaled experiment. In Figure 14, reprinted with permission from reference [24], the line force is seen when a WEC was impacted by a regular wave with a height of 5.7 m and a period time of 10.7 s. A focused extreme wave was embedded and hit the WEC at t = 134 s. All values of Figure 14 are presented in 1:1 scale. In the left plot, a low frictional damping of 18 kN was applied. In the plot in the middle, a medium frictional damping of 59 kN was applied, and in the figure to the right, a high damping of 83 kN was applied. Increased damping decreased the force of the endstop hit, both for the high regular waves and for the embedded extreme wave.
3.4. Influence of Line Length on Endstop Peak Force
Another possible factor for the survivability is the length of the connection line. An incorrect line length could be a consequence of the changing tide or incorrect calibrations during deployment. A tsunami event could also start with a withdrawal of the waterline and a decreased water level. In this section, the regular wave and the tsunami event were modeled for six different line lengths, comparing the magnitude of the endstop hits and the translator and buoy motion. The water depth was the same for all simulations, and the length of the connection line was altered.
In Figure 15, the line force and the translator position is shown together with the heave and surge motion of the buoy. It can be seen that a too short line (both the 0.5 m and the 1 m too short cases), increased the endstop force slightly. Studying the translator motion, it is seen that the endstop was hit earlier and that the endstop spring was fully compressed for a longer time with a shorter connection line. When the length of the connection line was instead increased, the force of the endstop hits decreased, and the duration of the endstop was shorter. For the line that was 2 m too long, the endstop was not hit at all. The heave motion of the buoy decreased with a shorter line, and increased with a longer line, since the translator motion was restricted by the upper endstop. The surge motion on the other hand did not increase with a longer line, but did decrease and got slightly delayed. The surge motion was influenced by the restricted heave motion; when the translator stayed in the upper endstop, the buoy could not move in positive heave direction, and was instead forced to move in surge and in negative heave direction.
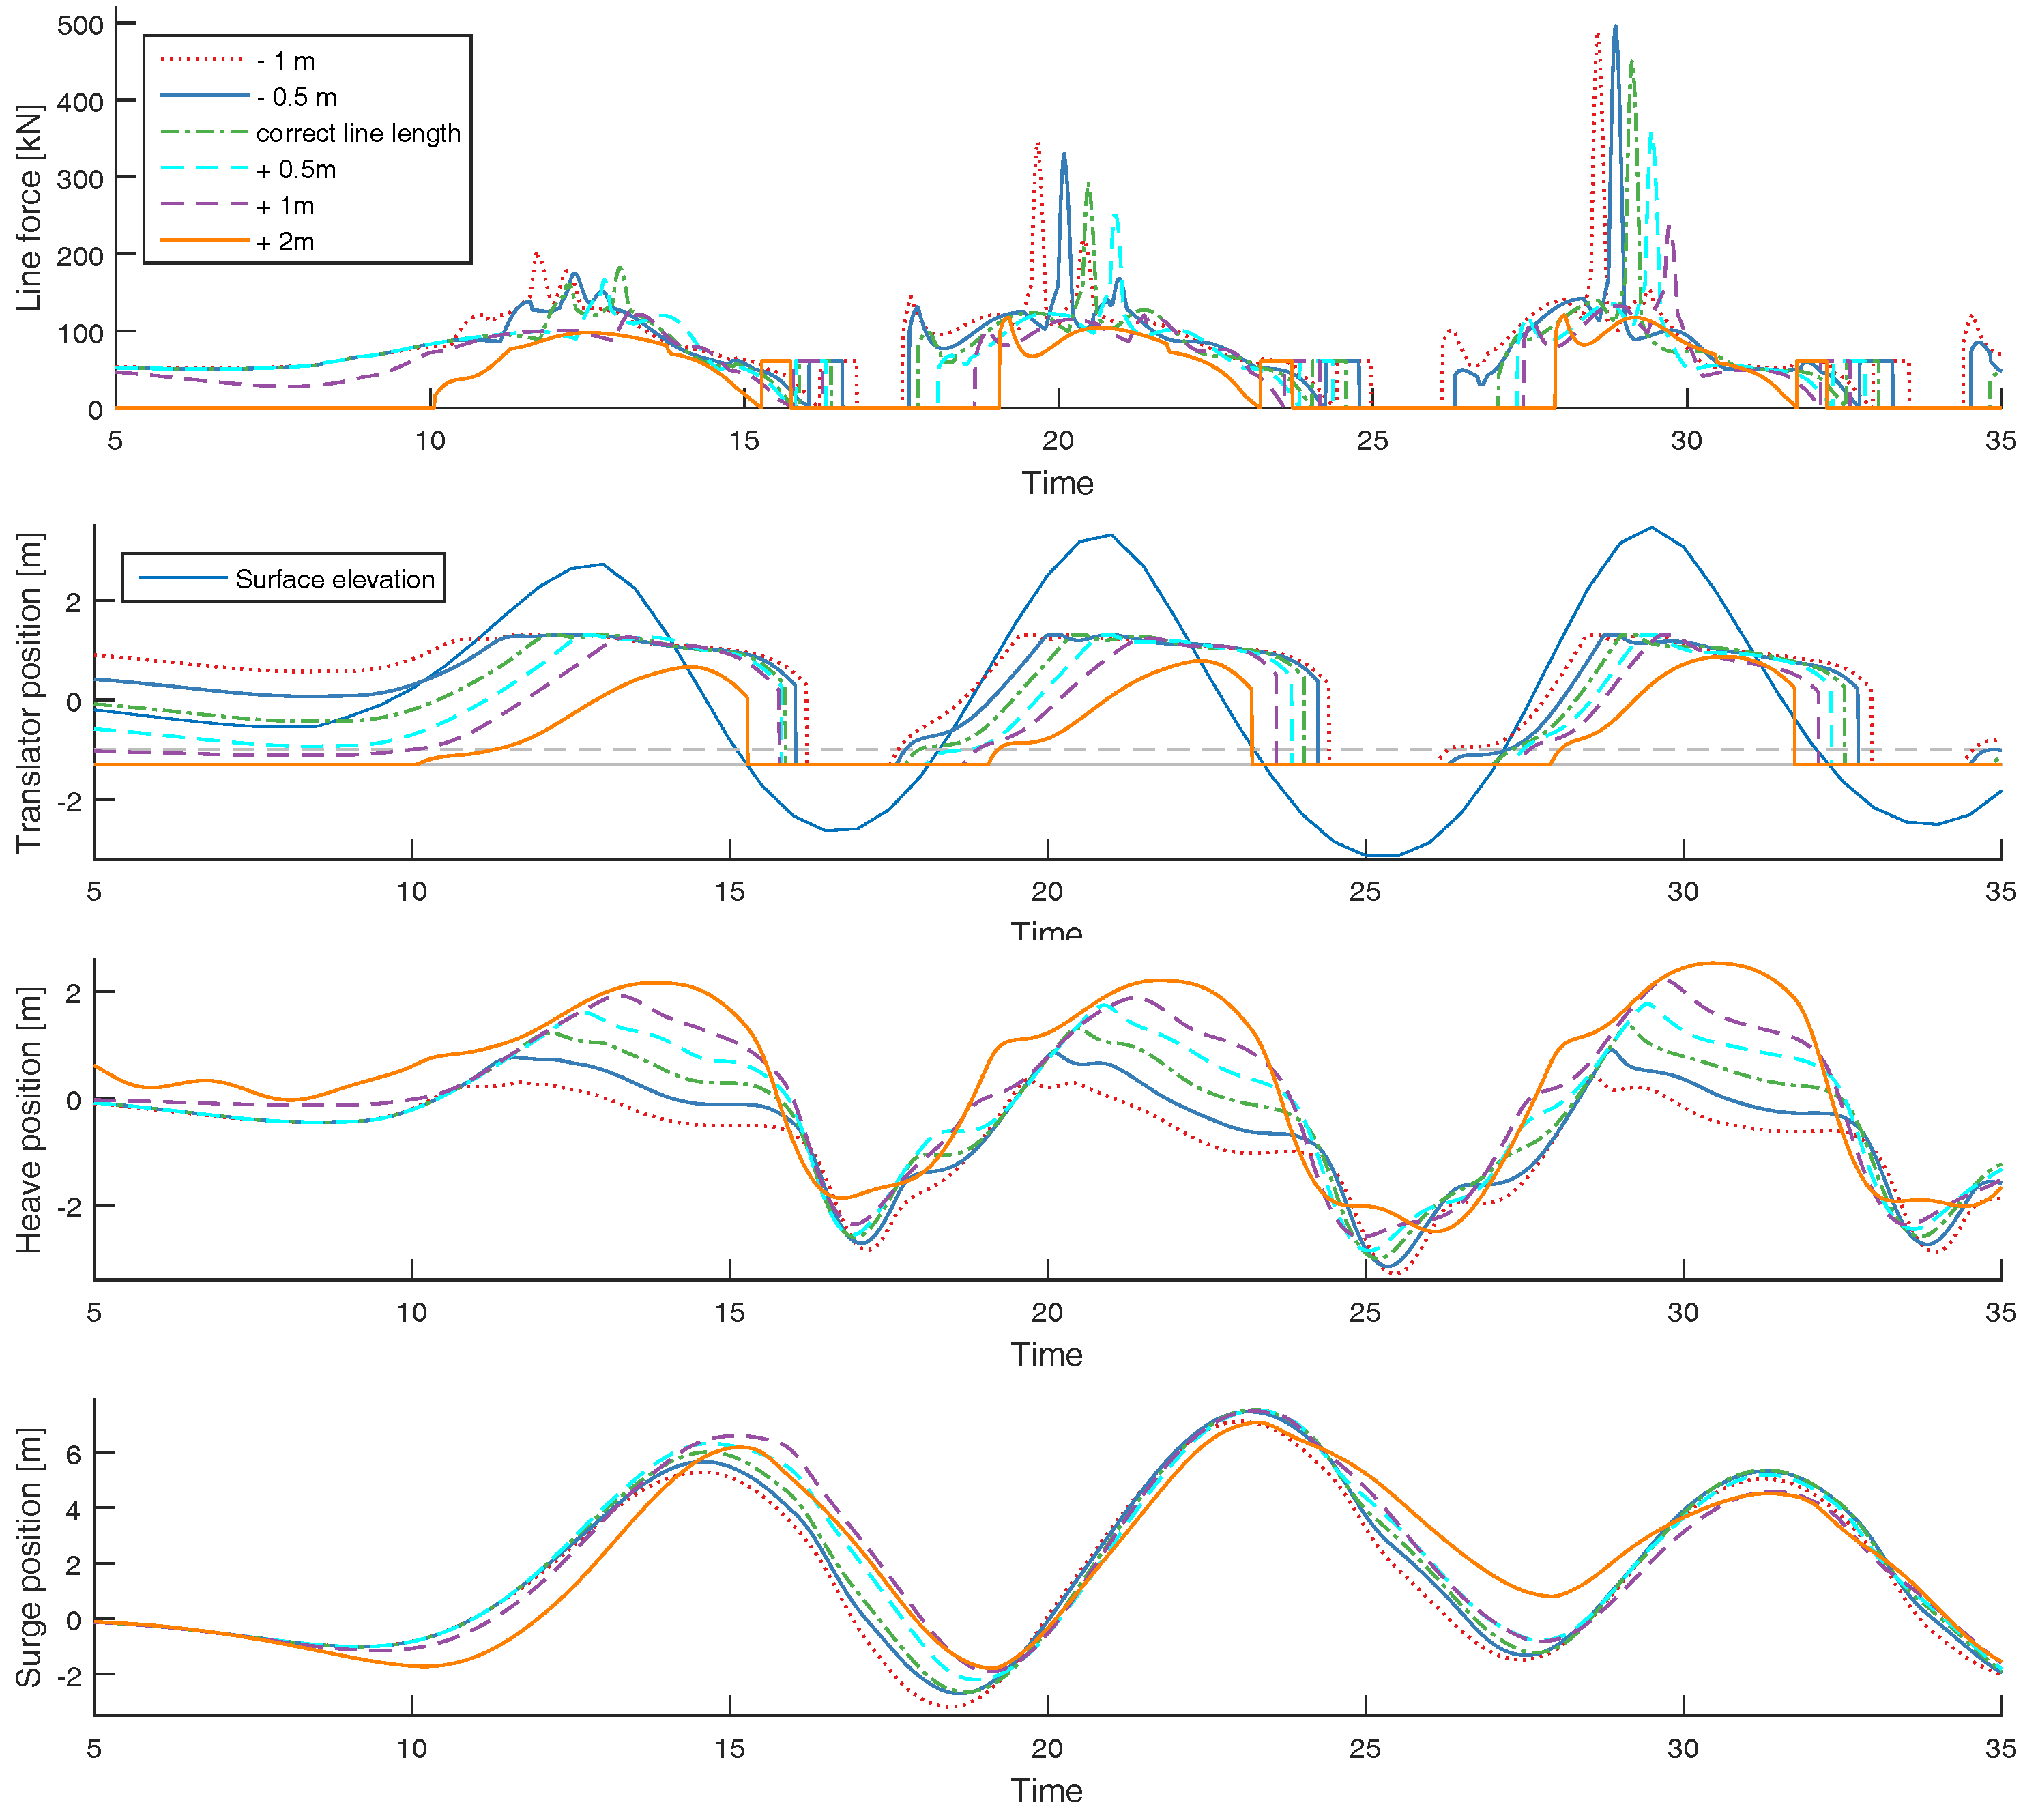
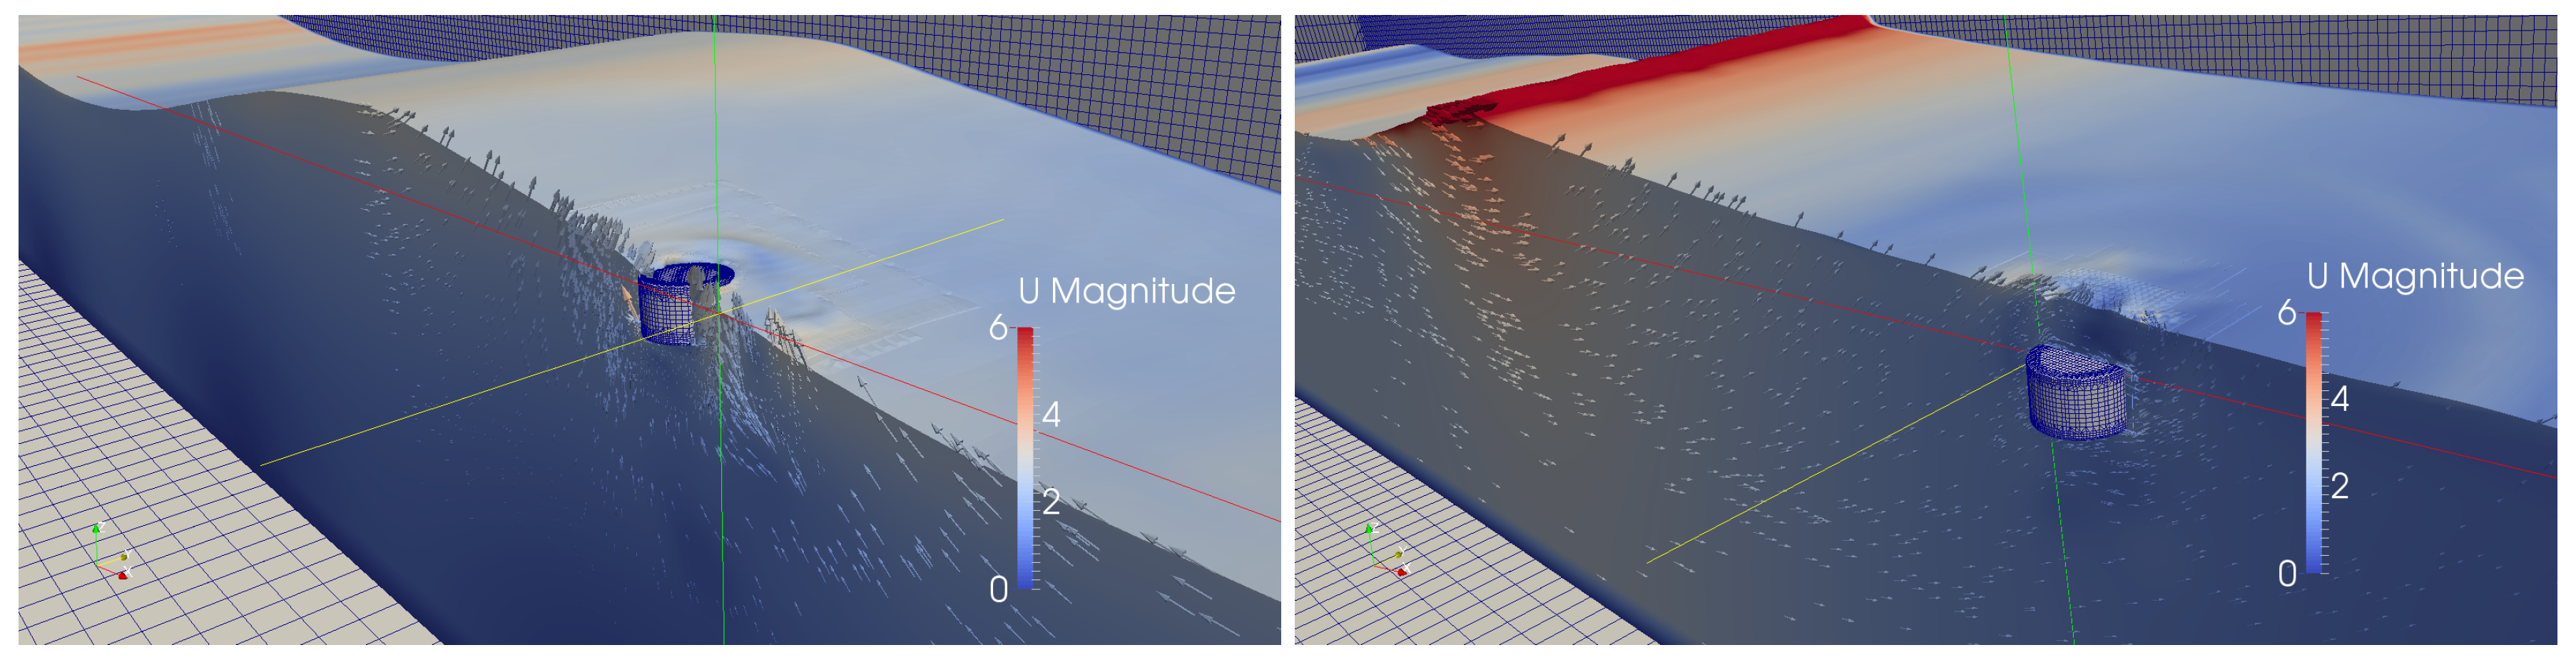
The influence of line length when the WEC was hit by a tsunami wave event was also studied, and is shown in Figure 16. In contrast with the line length study with the regular wave, the magnitude of the peak forces increased with an increased line length. This can again be understood when comparing the different fluid velocity fields of the regular and tsunami waves, shown in Figure 17. Figure 17 shows the WEC with a 2 m to short line, for both the regular wave (left) and the tsunami wave (right), at the time of an endstop hit, t = 19 s for the regular wave and t = 7 s for the tsunami. Although the regular wave had the same wave height as the tsunami amplitude, the velocity fields differed significantly. The surface of the regular wave was smooth, while the tsunami wave had two stages; first a smooth surface elevation, followed by a turbulent bore. If the length of the connection line was correct or too short, the buoy got submerged by the smooth surface rise, and the turbulent bore propagated over the deeply submerged buoy. However, if the line length was too long, the buoy did not get submerged before the bore hit the WEC, and the buoy was hit by the bore and thus impacted by a higher force. The motion in heave followed the same pattern for the tsunami as for the regular wave; an increased line length increased the heave motion, which followed from the restricted translator motion. However, in contrast with the regular wave, the surge motion for the tsunami wave increased for an increased line length, which is explained by the difference between the velocity fields. The velocity of the water in a regular deep water wave follows a circular pattern which results in an oscillating surge motion of the buoy, as seen in Figure 15. The velocity field of a tsunami wave has a horizontal forward speed, and the current drags the buoy forward in the surge direction.
4. Discussion
The focus of this paper is the survivability of a point-absorbing WEC in extreme waves and tsunamis, using realistic parameters. The WEC parameters were chosen as suitable parameters for a WEC deployed at the Lysekil test site, Sweden [26], and the studied wave heights chosen to correspond to the wave climate at the Lysekil test site. A previously verified OpenFOAM model has been used to study the peak forces of endstop hits, and different parameters that can influence the survivability, namely: generator damping, friction damping, wave height, line length and wave type (high regular waves and tsunami waves). In addition, the paper has analyzed how overtopping waves and endstop hits affect the peak forces, which is of highest relevance for linear generators with limited stroke length. This study is an extension of the study in reference [25]. In reference [25], three levels of was used; no damping, a low damping at kNs/m and a medium damping at kNs/m. The endstop spring was longer and never got fully compressed, which it was in this paper. Reference [25] focused on the influence of overtopping waves, and it was seen that the overtopping did not influence the peak forces unless the generator damping was high enough to keep the translator from hitting the upper endstop spring. In this paper, a larger range of different and higher generator damping values was studied in higher waves, high enough to fully compress the upper endstop spring. It was seen that the force of the endstop hits, when the spring was fully compressed, increased with increasing wave heights and decreased with increased . It was also seen that if was high enough to prevent an endstop hit, the peak force was significantly lower, but then again increasing with further increased . However, it should be noted that this increased line force is expected and wanted as it can be converted to electricity in the generator, in contrast with the damaging peak force of the endstop hit.
In this paper, the decreasing PTO damping of a decreasing translator-stator overlap was included in the model. When the translator-stator overlap decreases, the PTO damping decreases and the translator can accelerate. It was suspected that this decreased damping when the stator moved closer to the endstop could affect the behavior with decreased peak forces with increased . However, this was not seen, and it was concluded that an increased will decrease the peak force of the endstop hit, regardless of the translator-stator overlap.
The influence of a constant damping, such as friction, was also studied, both for a regular extreme wave and for a tsunami wave. For periodic waves, peak three to seven in Figure 8, increased friction decreased the peak force of the endstop hit. This is confirmed by the physical wave tank experiments presented in reference [24] and reprinted in Figure 14. It is concluded that for periodic waves, increased damping decreases the peak forces of endstop hits. This is valid for both constant damping, , as in Figure 13 and Figure 14, and for linear generator damping, , as in Figure 12. However, if the waves are increasing in strength, like the two first wave peaks of Figure 8, and for the tsunami event in Figure 10, the friction can result in a latching effect and actually increase the force of the endstop hit instead of decreasing it. It is possible that this effect could occur for irregular waves as well, and should be considered in the design process of a WEC.
The influence of line length on survivability was also studied, and big differences were seen when the regular wave was compared with the tsunami wave. For the regular wave, an increased line length had a positive effect for the survivability; the peak forces of the endstop hits decreased, and for the longest line (2 m too long), the translator never hit the upper endstop. The surge motion decreased with increased line length, showing that for the correct or the too short line length, the surge motion is increased by the restricted translator motion; when the translator stands still at the upper endstop, the buoy is forced to move in the surge and negative heave direction. Since the 2 m too long line is the only studied length where the translator does not hit the upper endstop and the motion is unrestricted by the endstop, it can not be concluded how a further increased line length would affect the survivability. It was also seen that the WEC was more vulnerable to incorrect line length for the tsunami event. In contrast to the regular wave, the peak forces during the tsunami wave increased with increased line length, and the longest line resulted in significantly higher peak forces than a line of correct line length. The regular wave and the tsunami wave were comparable considering amplitude, but the velocity fields differed significantly. The surface of the regular wave was smooth, while the tsunami wave had two stages; an initial smooth surface elevation, followed by a turbulent bore. If the length of the connection line was correct or too short, the buoy got submerged by the initial smooth surface rise, and the turbulent bore propagated over the deeply submerged buoy. However, if the line was too long, the buoy was instead impacted by the turbulent bore, and the peak force increased. Although a 2 m or more too long line does not seem likely during normal operating conditions, it is possible that a tsunami wave event starts with a decreasing water level, and it is important to know that the consequences of the line length on survivability are significant.
This paper has only studied one wave period, and it should be noted that the response of a WEC will be dependent on wave period as well. The survivablility must be studied across all seastates at the deployment site, and the results in this paper should only be considered as a first step towards understanding the response of the studied WEC in extreme waves.
5. Conclusions
A previously verified OpenFOAM model has been used to study the survivability of a point-absorbing WEC in extreme waves and for a tsunami wave event, using realistic WEC parameters. It was concluded that:
- For periodic waves, it was seen that both increased linear damping, , and increased constant damping , decreased the force of the endstop hits. This corresponds well with established experimental results.
- If the incident wave was not periodic, for the tsunami event or the transient waves at the front of the regular wave train, it was seen that increased friction could result in a latching effect and actually increase the force of the endstop hit instead of decreasing it. It is possible that this effect could also occur for irregular waves during normal operating conditions.
- Due to the differences in fluid velocity fields, the WEC was more vulnerable to a too long line length when impacted by a tsunami wave than by a regular wave. For a regular wave, an increased line length resulted in lower endstop forces and decreased surge motion. For the tsunami wave on the other hand, an increased line length resulted in significantly higher endstop forces.
Acknowledgments
This research is supported by the Centre for Natural Disaster Science (CNDS), the Swedish Research Council (VR, grant Number 2015-04657). The computations were performed on resources provided by the Swedish National Infrastructure for Computing (SNIC) at UPPMAX.
Author Contributions
Linnea Sjökvist and Malin Göteman conceived and designed the numerical experiments. Linnea Sjökvist performed the numerical experiment, analyzed the data and wrote the paper.
Conflicts of Interest
The authors declare no conflict of interest.
Abbreviations
The following abbreviations are used in this manuscript:
| WEC | Wave Energy Converter |
| CFD | Computational Fluid Dynamics |
| RANS | Reynolds Average Navier-Stokes |
| VOF | Volume of Fluid |
| PTO | Power Take Off |
References
- Wolgamot, H.; Fitzgerald, C. Nonlinear hydrodynamic and real fluid effects on wave energy converters. Proc. IMechE Part A J. Power Energy 2015, 229, 772–794. [Google Scholar] [CrossRef]
- Day, A.; Babarit, A.; Fontaine, A.; He, Y.; Kraskowski, M.; Murai, M.; Penesis, I.; Salvatore, F.; Shin, H. Hydrodynamic modeling of marine renewable energy devices: A state of the art review. Ocean Eng. 2015, 108, 46–69. [Google Scholar] [CrossRef] [Green Version]
- Palm, J.; Eskilsson, C.; Paredes, G.; Bergdahl, L. Coupled mooring Analysis for Floating Wave Energy Converters Using CFD: Formulation and Validation. Int. J. Mar. Energy 2016, 16, 83–99. [Google Scholar] [CrossRef]
- Buccino, M.; Vicinanza, D.; Salerno, D.; Banfi, D.; Calabrese, M. Nature and magnitude of wave loadings at Seawave Slotcone Generators. Ocean Eng. 2015, 95, 34–58. [Google Scholar] [CrossRef]
- Buccino, M.; Dentale, F.; Salerno, D.; Contestabile, P.; Calabrese, M. The use of CFD in the analysis of wave loadings acting on Seawave Slotcone Generators. Sustainability 2017, 8, 1255. [Google Scholar] [CrossRef]
- Ransley, E. Survivability of Wave Energy Converter and Mooring Coupled 525 System Using CFD. Ph.D. Thesis, Plymouth University, Plymouth, UK, 2015. [Google Scholar]
- Ransley, E.; Greaves, D.; Raby, A.; Simmonds, D.; Hann, M. Survivability of wave energy converters using CFD. Renew. Energy 2017, 109, 235–247. [Google Scholar] [CrossRef]
- Ransley, E.; Greaves, D.; Raby, A.; Simmonds, D.; Hann, M.; Jakobsen, M.; Kramer, M. RANS-VOF modelling of the wavestar point absorber. Renew. Energy 2017, 109, 49–65. [Google Scholar] [CrossRef]
- Chen, W.; Dolguntseva, I.; Savin, A.; Zhang, Y.; Li, W.; Svensson, O.; Leijon, M. Numerical modelling of a point-absorbing wave energy converter in irregular and extreme waves. Appl. Ocean Res. 2017, 63, 90–105. [Google Scholar] [CrossRef]
- Sjökvist, L.; Wu, J.; Ransley, E.; Engström, J.; Eriksson, M.; Göteman, M. Numerical models for the motion and forces of point-absorbing wave energy converters in extreme waves. Ocean Eng. 2017. accepted. [Google Scholar]
- Hann, M.; Greaves, D.; Raby, A. Snatch loading of a single taut moored floating wave energy converter due to focussed wave groups. Ocean Eng. 2015, 96, 258–271. [Google Scholar] [CrossRef]
- Waters, R.; Stålberg, M.; Danielsson, O.; Svensson, O.; Gustafsson, S.; Strömstedt, E.; Eriksson, M.; Leijon, M. Experimental Results from Sea Trials of an Offshore Wave Energy System. Appl. Phys. Lett. 2007, 90, 034105. [Google Scholar] [CrossRef]
- Engström, E. Hydrodynamic Modelling for a Point Absorbing Wave Energy Converter. Ph.D. Thesis, Uppsala University, Uppsala, Sweden, 2011. [Google Scholar]
- Eriksson, M.; Isberg, J.; Leijon, M. Hydrodynamic modelling of a direct drive wave energy converter. Int. J. Eng. Sci. 2005, 43, 1377–1387. [Google Scholar] [CrossRef]
- Pastor, J.; Liu, Y. Power absorption modeling and optimization of a point absorbing wave energy converter using numerical method. ASME J. Energy Resour. Technol. 2014, 136, 021207. [Google Scholar] [CrossRef]
- Pastor, J.; Liu, Y. Wave climate resource analysis for deployment of wave energy conversion technology. Sustainability 2016, 8, 1321. [Google Scholar] [CrossRef]
- Waters, R. Energy from Ocean Waves. Ph.D. Thesis, Uppsala University, Uppsala, Sweden, 2008. [Google Scholar]
- Rahm, M. Ocean Wave Energy. Ph.D. Thesis, Uppsala University, Uppsala, Sweden, 2010. [Google Scholar]
- Ekström, R. Offshore Marine Substation for Grid-Connection of Wave Power Farms—An Experimental Approach. Ph.D. Thesis, Uppsala University, Uppsala, Sweden, 2010. [Google Scholar]
- Stålberg, M.; Waters, R.; Danielsson, O.; Leijon, M. Influence of Generator Damping on Peak Power for a Direct Drive Wave Energy Converter. J. Offshore Mech. Arct. Eng. 2008, 130. [Google Scholar] [CrossRef]
- Sjökvist, L.; Krishna, R.; Castellucci, V.; Hagnestål, A.; Rahm, M.; Leijon, M. On the optimization of point absorber buoys. J. Mar. Sci. Eng. 2014, 2, 477–492. [Google Scholar] [CrossRef]
- Hong, Y. Numerical Modelling and Mechanical Studies on a Point Absorber Type Wave Energy Converter. Ph.D. Thesis, Uppsala University, Uppsala, Sweden, 2016. [Google Scholar]
- Li, W.; Isberg, J.; Engström, J.; Waters, R.; Leijon, M. Parametric Study of tge Power Absorbtion for a Linear Generator Wave Energy Converter. J. Ocean Wind Energy 2015, 2, 248–252. [Google Scholar] [CrossRef]
- Göteman, M.; Engström, J.; Eriksson, M.; Leijon, M.; Hann, M.; Ransley, E.; Greaves, D. Wave loads on a point-absorbing wave energy device in extreme waves. J. Ocean Wind Energy 2015, 2, 176–181. [Google Scholar] [CrossRef]
- Sjökvist, L.; Göteman, M. The effect of overtopping waves on peak forces on a point absorbing WEC. In Proceedings of the Asian Wave and Tidal Energy Conference Series AWTEC, Singapore, 24–28 October 2016. [Google Scholar]
- Ulvgård, L.; Sjökvist, L.; Göteman, M.; Leijon, M. Line Force and Damping at Full and Partial Stator Overlap in a Linear Generator for Wave Power. J. Mar. Sci. Eng. 2016, 4, 81. [Google Scholar] [CrossRef]
- Frost, A.; Ulvgård, L.; Sjökvist, L.; Leijon, M. Experimental study of generator damping at partial stator overlap in a linear generator for wave power. In Proceedings of the European Wave and Tidal Energy Conference Series EWTEC, Cork, Ireland, 27 August–1 September 2017. [Google Scholar]
- Sjökvist, L.; Göteman, M. Peak Forces on a Point Absorbing Wave Energy Converter Induced by Tsunami Waves. Renew. Energy 2017. under review. [Google Scholar]
- Jacobsen, N.G.; Fuhrman, D.; Fredsøe, J. A wave generation toolbox for the open-source CFD library: OpenFOAM. Int. J. Numer. Methods Fluids 2012, 70, 1073–1088. [Google Scholar] [CrossRef]
- Waters, R.; Engström, J.; Isberg, J.; Leijon, M. Wave Climate off the Swedish West Coast. Renew. Energy 2009, 34, 1600–1606. [Google Scholar] [CrossRef]
- Mei, C.; Stiassnie, M.; Yue, D. Theory and Applications of Ocean Surface Waves, Part 1: Linear Aspects; World Scientific Publishing Co., Pte. Ltd.: Singapore, 2005. [Google Scholar]
- Douglas, S.; Nistor, I. On the effect of bed condition on the development of tsunami-induces loading on structures using OpenFOAM. Nat. Hazards 2015, 76, 1335–1356. [Google Scholar] [CrossRef]
- Madsen, P.; Furman, D.; Shäffer, H. On the solitary wave paradigm for tsunamis. J. Geophys. Res. 2008, 113. [Google Scholar] [CrossRef]
Figure 1.
Convergence of the force in the connection line for increasing mesh resolution.
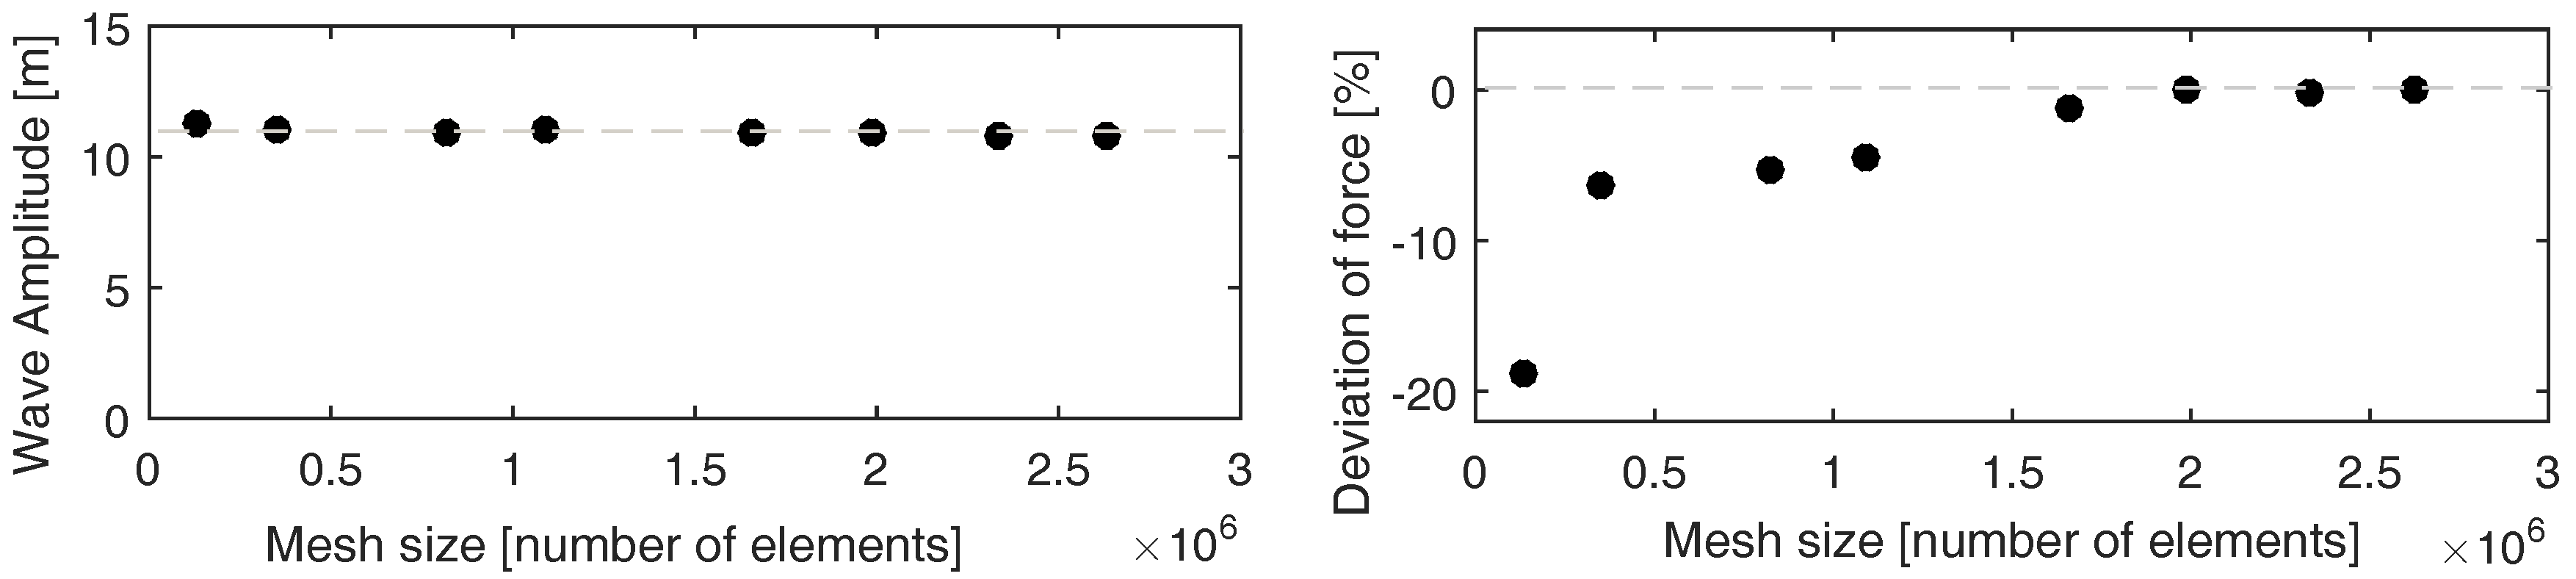
Figure 2.
The mesh is refined in a box surrounding the surface, and further refined in the vicinity of the buoy. The color represents the scalar field . Blue represents (air), while red represents (water).
Figure 2.
The mesh is refined in a box surrounding the surface, and further refined in the vicinity of the buoy. The color represents the scalar field . Blue represents (air), while red represents (water).
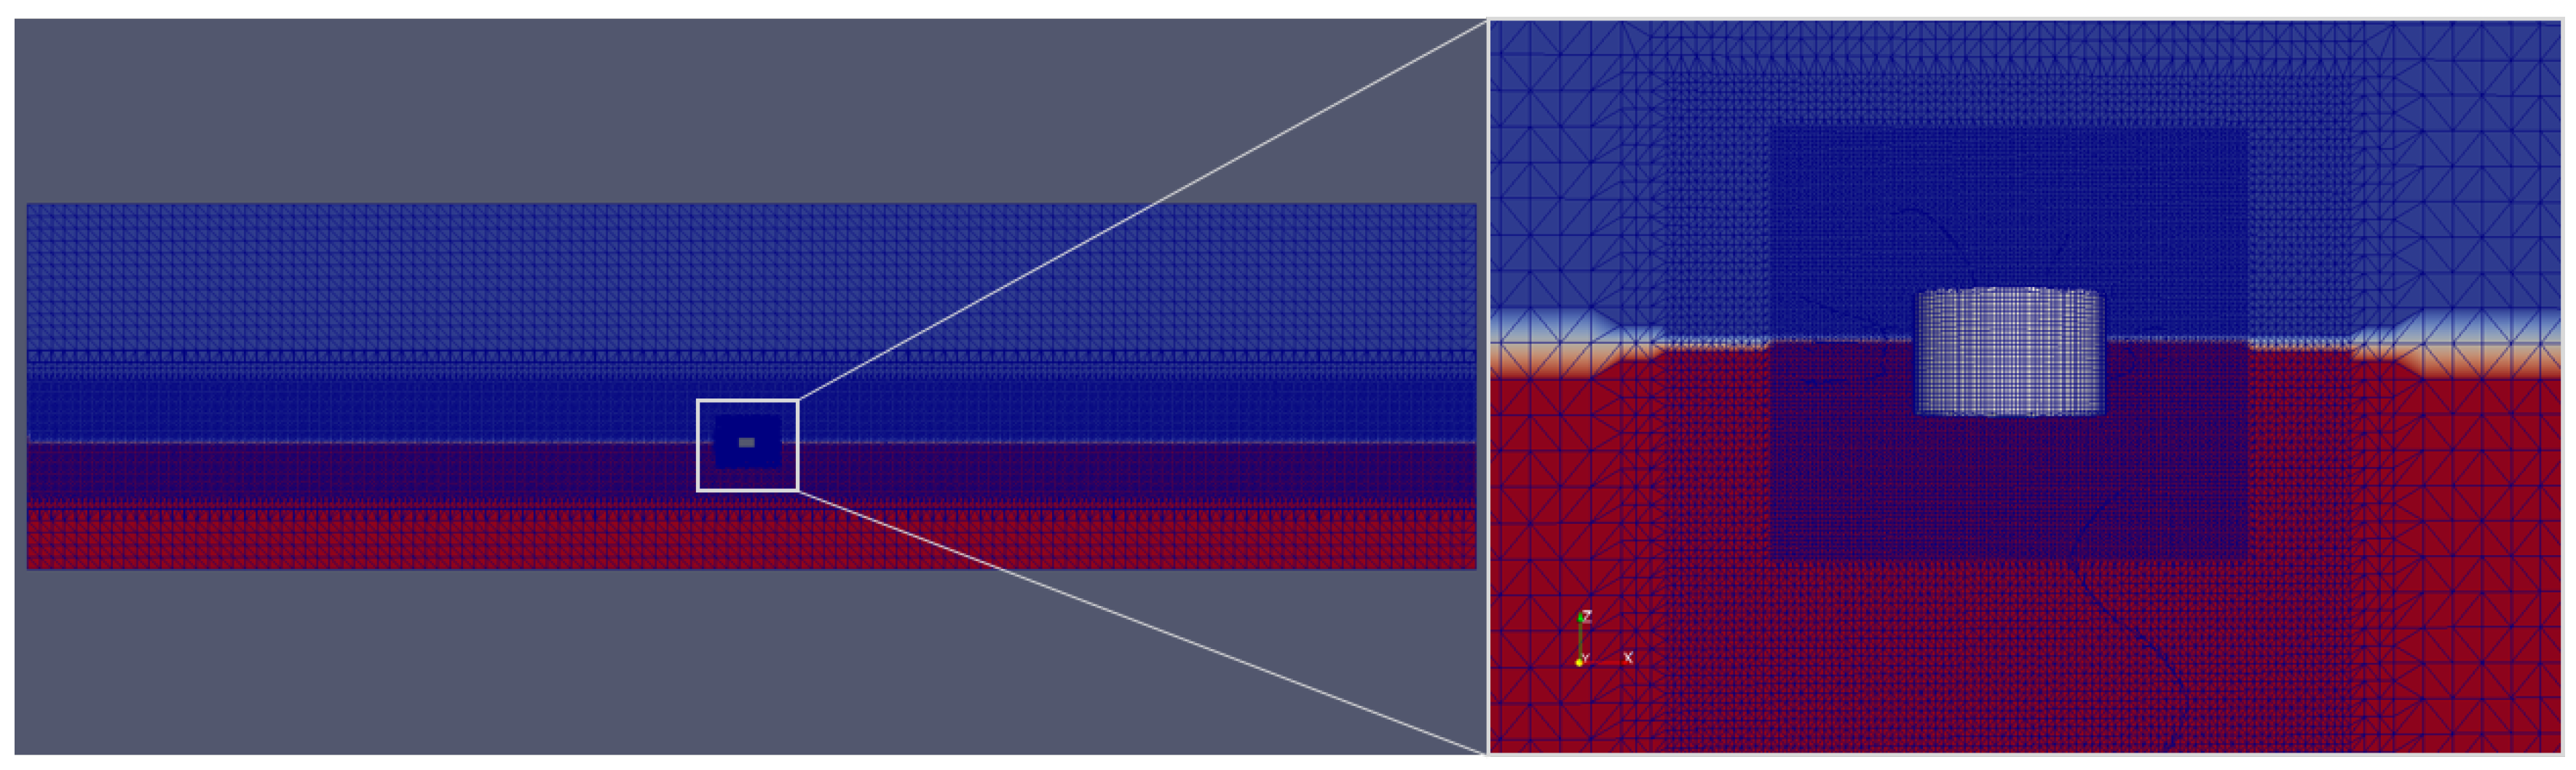
Figure 3.
For the dam-break approach, the simulation domain is elongated and a water volume is placed on top of the initially still water surface.
Figure 3.
For the dam-break approach, the simulation domain is elongated and a water volume is placed on top of the initially still water surface.

Figure 4.
(a) The WEC is modeled as a floating buoy, restrained by a force in the connection line. The force is directed along a vector pointing at the fixed anchoring position; (b) The generator has a limited stroke length. It is also seen that the translator-stator overlap is not full during the whole stroke length.

Figure 5.
Surface elevation of the modeled incident waves. The wave period was 8.5 s, and five different wave heights were simulated.
Figure 5.
Surface elevation of the modeled incident waves. The wave period was 8.5 s, and five different wave heights were simulated.

Figure 6.
The peak forces plotted as a function of wave height. The peak forces decrease with increasing generator damping for damping factors up to kNs/m. For higher , the generator is strong enough to keep the translator from hitting the upper endstop and the peak forces are not further reduced.
Figure 6.
The peak forces plotted as a function of wave height. The peak forces decrease with increasing generator damping for damping factors up to kNs/m. For higher , the generator is strong enough to keep the translator from hitting the upper endstop and the peak forces are not further reduced.

Figure 7.
The total force in the connection line is a sum of of , , , and the gravitational force. The line force is compared for three levels of generator damping . The corresponding translator position and speed are also seen. The surface elevation of the incident wave is seen together with the translator position. The horizontal dashed and solid lines mark the free and the total stroke length, respectively.
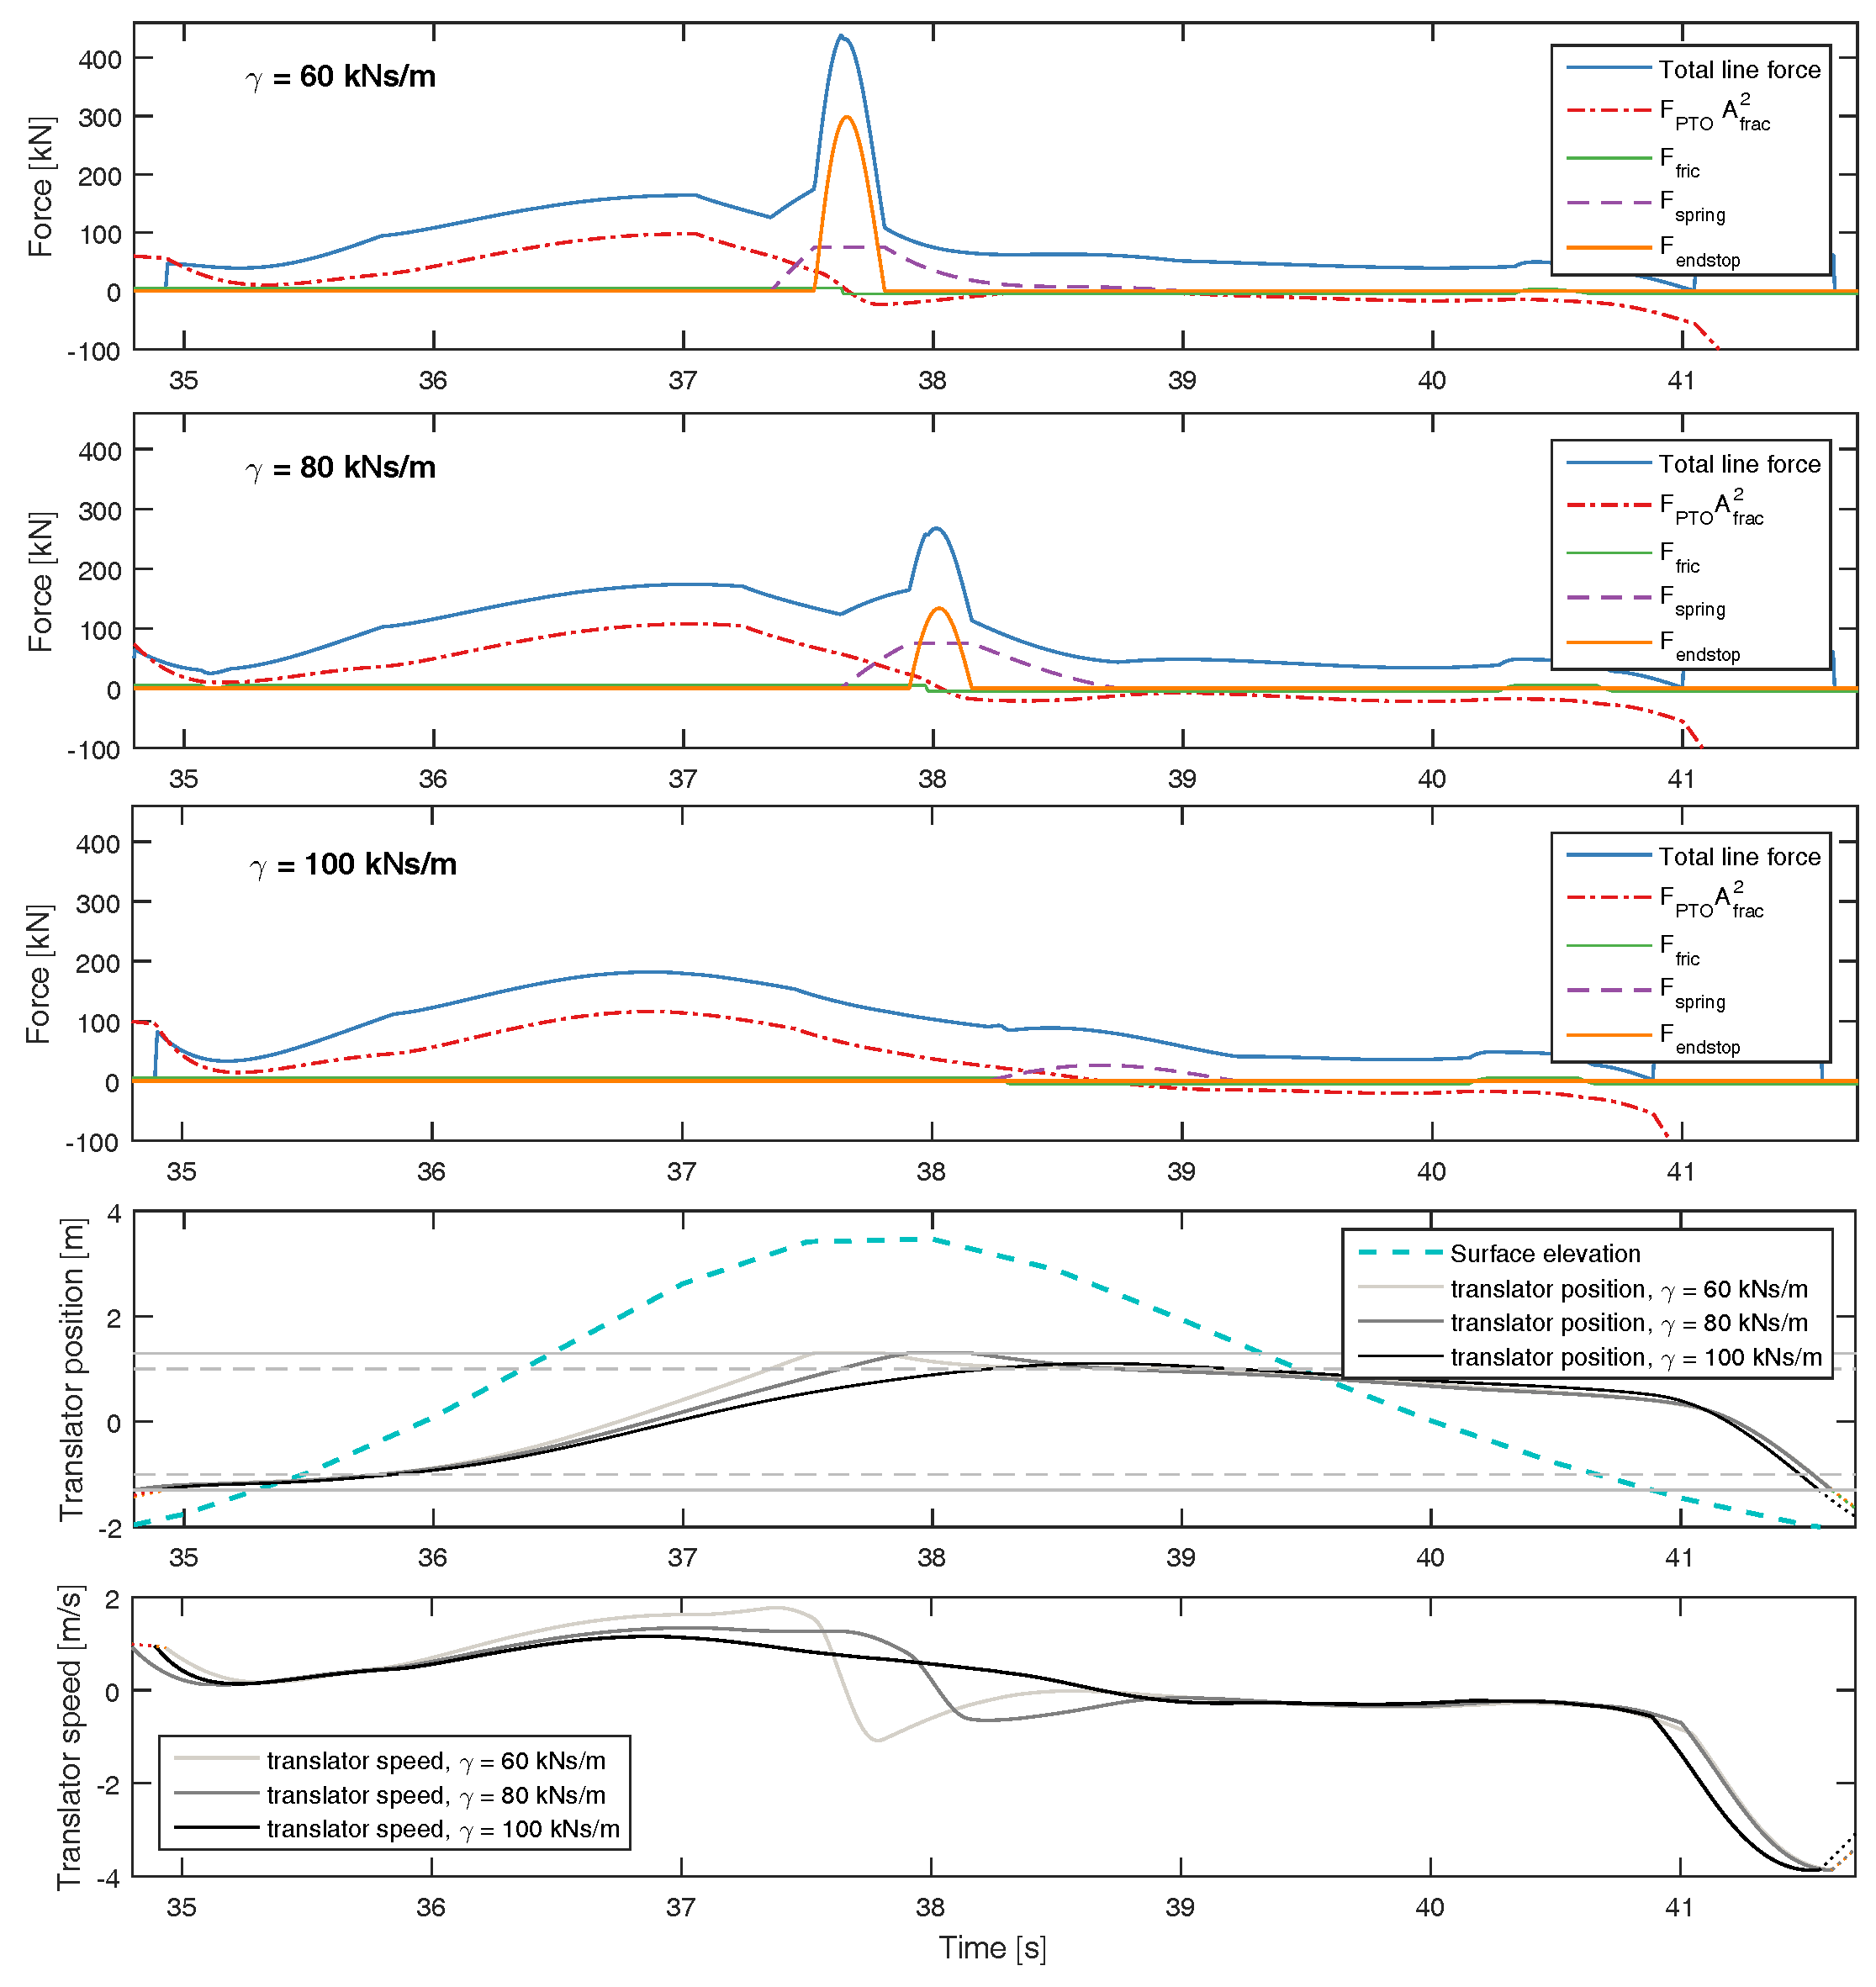
Figure 8.
The force in the connection line when the WEC is impacted by a high regular wave. Five levels of friction are compared.
Figure 8.
The force in the connection line when the WEC is impacted by a high regular wave. Five levels of friction are compared.

Figure 9.
This is a zoom of Figure 8. The WEC is impacted by a high regular wave. The solid horizontal line marks the bottom of the generator, and the dashed horizontal line marks the lower endstop spring.
Figure 9.
This is a zoom of Figure 8. The WEC is impacted by a high regular wave. The solid horizontal line marks the bottom of the generator, and the dashed horizontal line marks the lower endstop spring.

Figure 10.
The force in the connection line and the translator position when the WEC is impacted by a tsunami event. Five levels of friction are compared.
Figure 10.
The force in the connection line and the translator position when the WEC is impacted by a tsunami event. Five levels of friction are compared.

Figure 11.
The WEC impacted by the tsunami wave. The figure shows the four main events: The first peak force occurred at t = 8.5 s, one second before the first wave peak propagated over the WEC at t = 10.5 s. The second peak force occurred at t = 14.5 s, one second before the second wave peak at t = 15.5 s. The origin marks the initial position of the buoy.

Figure 12.
The line force and the translator position when the WEC is impacted by a high periodic wave, comparing the influence of generator damping factor . Increasing the generator damping decreases the force of the endstop hits. For kNs/m or higher, endstop hits were prevented.
Figure 12.
The line force and the translator position when the WEC is impacted by a high periodic wave, comparing the influence of generator damping factor . Increasing the generator damping decreases the force of the endstop hits. For kNs/m or higher, endstop hits were prevented.

Figure 13.
The line force and translator position for different levels of frictional damping. This figure shows the third wave peak of Figure 8. The generator damping factor is constant at kNs/m. The force of the endstop hit is reduced by an increased friction.
Figure 13.
The line force and translator position for different levels of frictional damping. This figure shows the third wave peak of Figure 8. The generator damping factor is constant at kNs/m. The force of the endstop hit is reduced by an increased friction.

Figure 14.
This figure is reprinted with permission from reference [24]. In a physical wave tank experiment, the line force of a WEC was studied when different levels of frictional damping were applied. The incident wave had a height of 5.7 m and an embedded focused extreme wave hit the WEC at t = 134 s. Three levels of friction was applied: 18 kN (left), 59 kN (middle), and 83 kN (right). The force in the endstop hits decrease with increased damping.
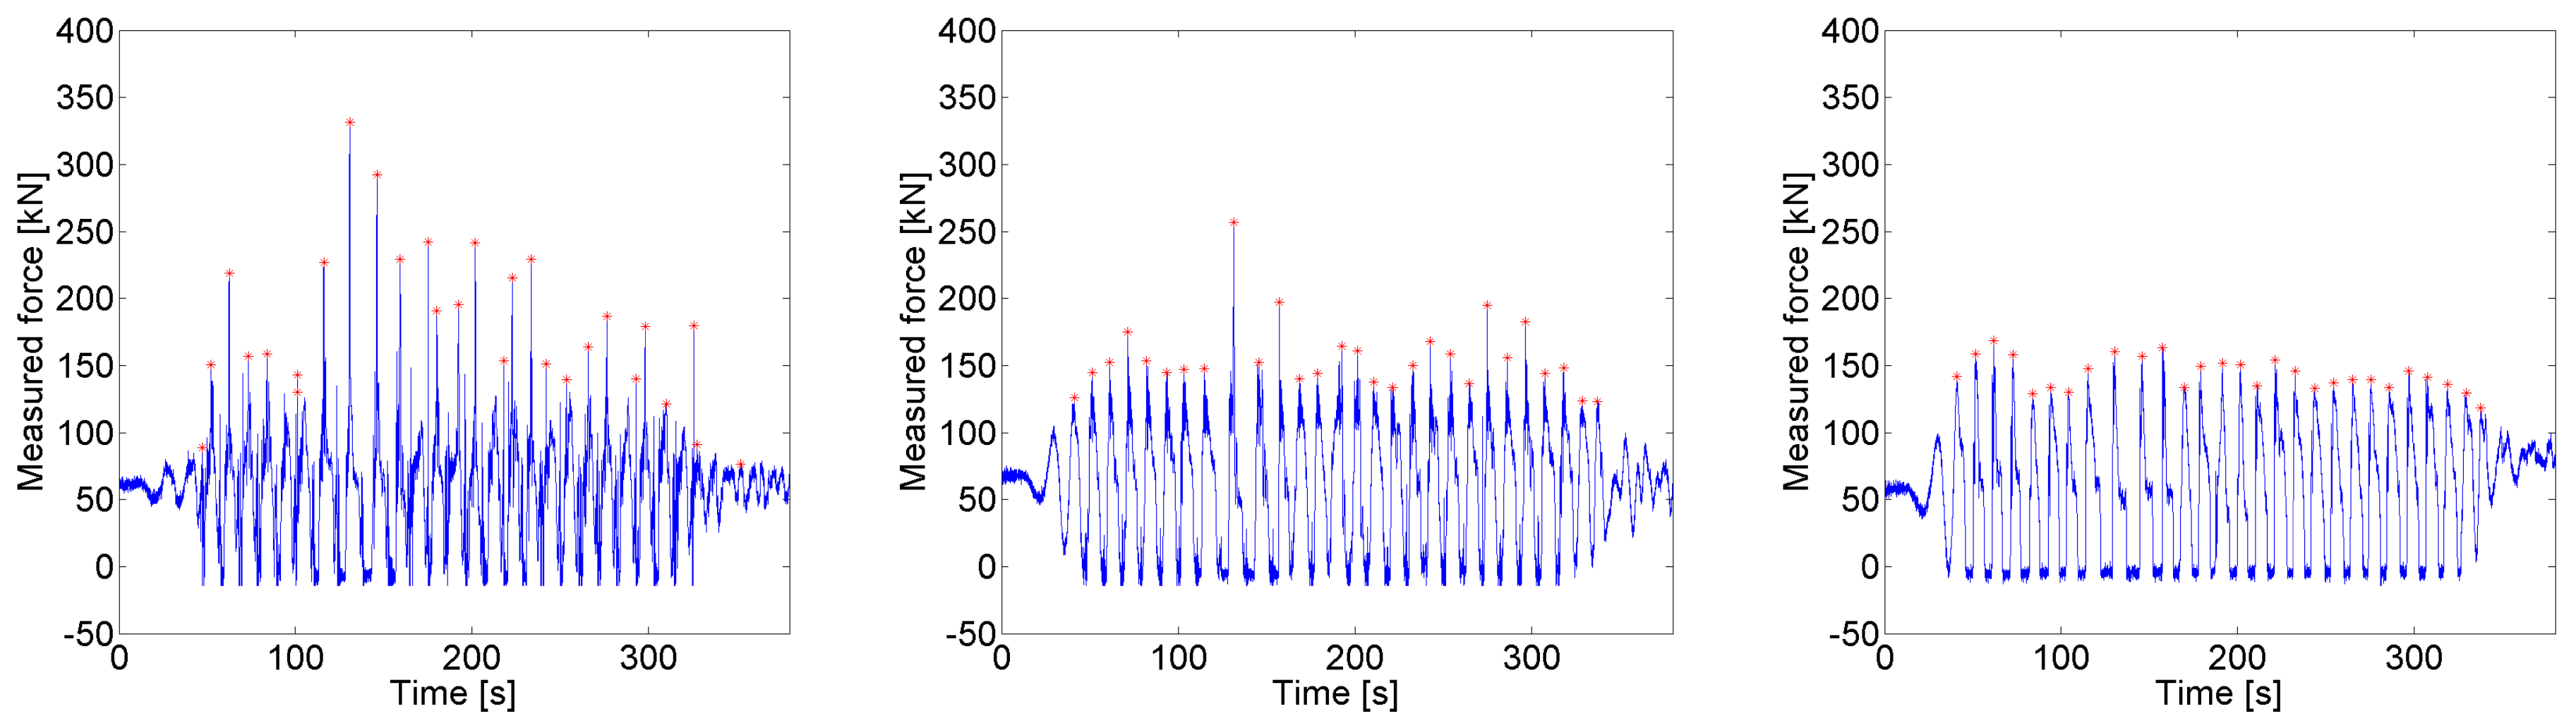
Figure 15.
A regular wave was modeled, comparing the influence of different line lengths. The generator damping factor was kNs/m and the friction was set to = 5 kN.
Figure 15.
A regular wave was modeled, comparing the influence of different line lengths. The generator damping factor was kNs/m and the friction was set to = 5 kN.

Figure 16.
Line force, translator position and buoy position when the WEC is impacted by a tsunami wave. The influence of line length is compared.
Figure 16.
Line force, translator position and buoy position when the WEC is impacted by a tsunami wave. The influence of line length is compared.
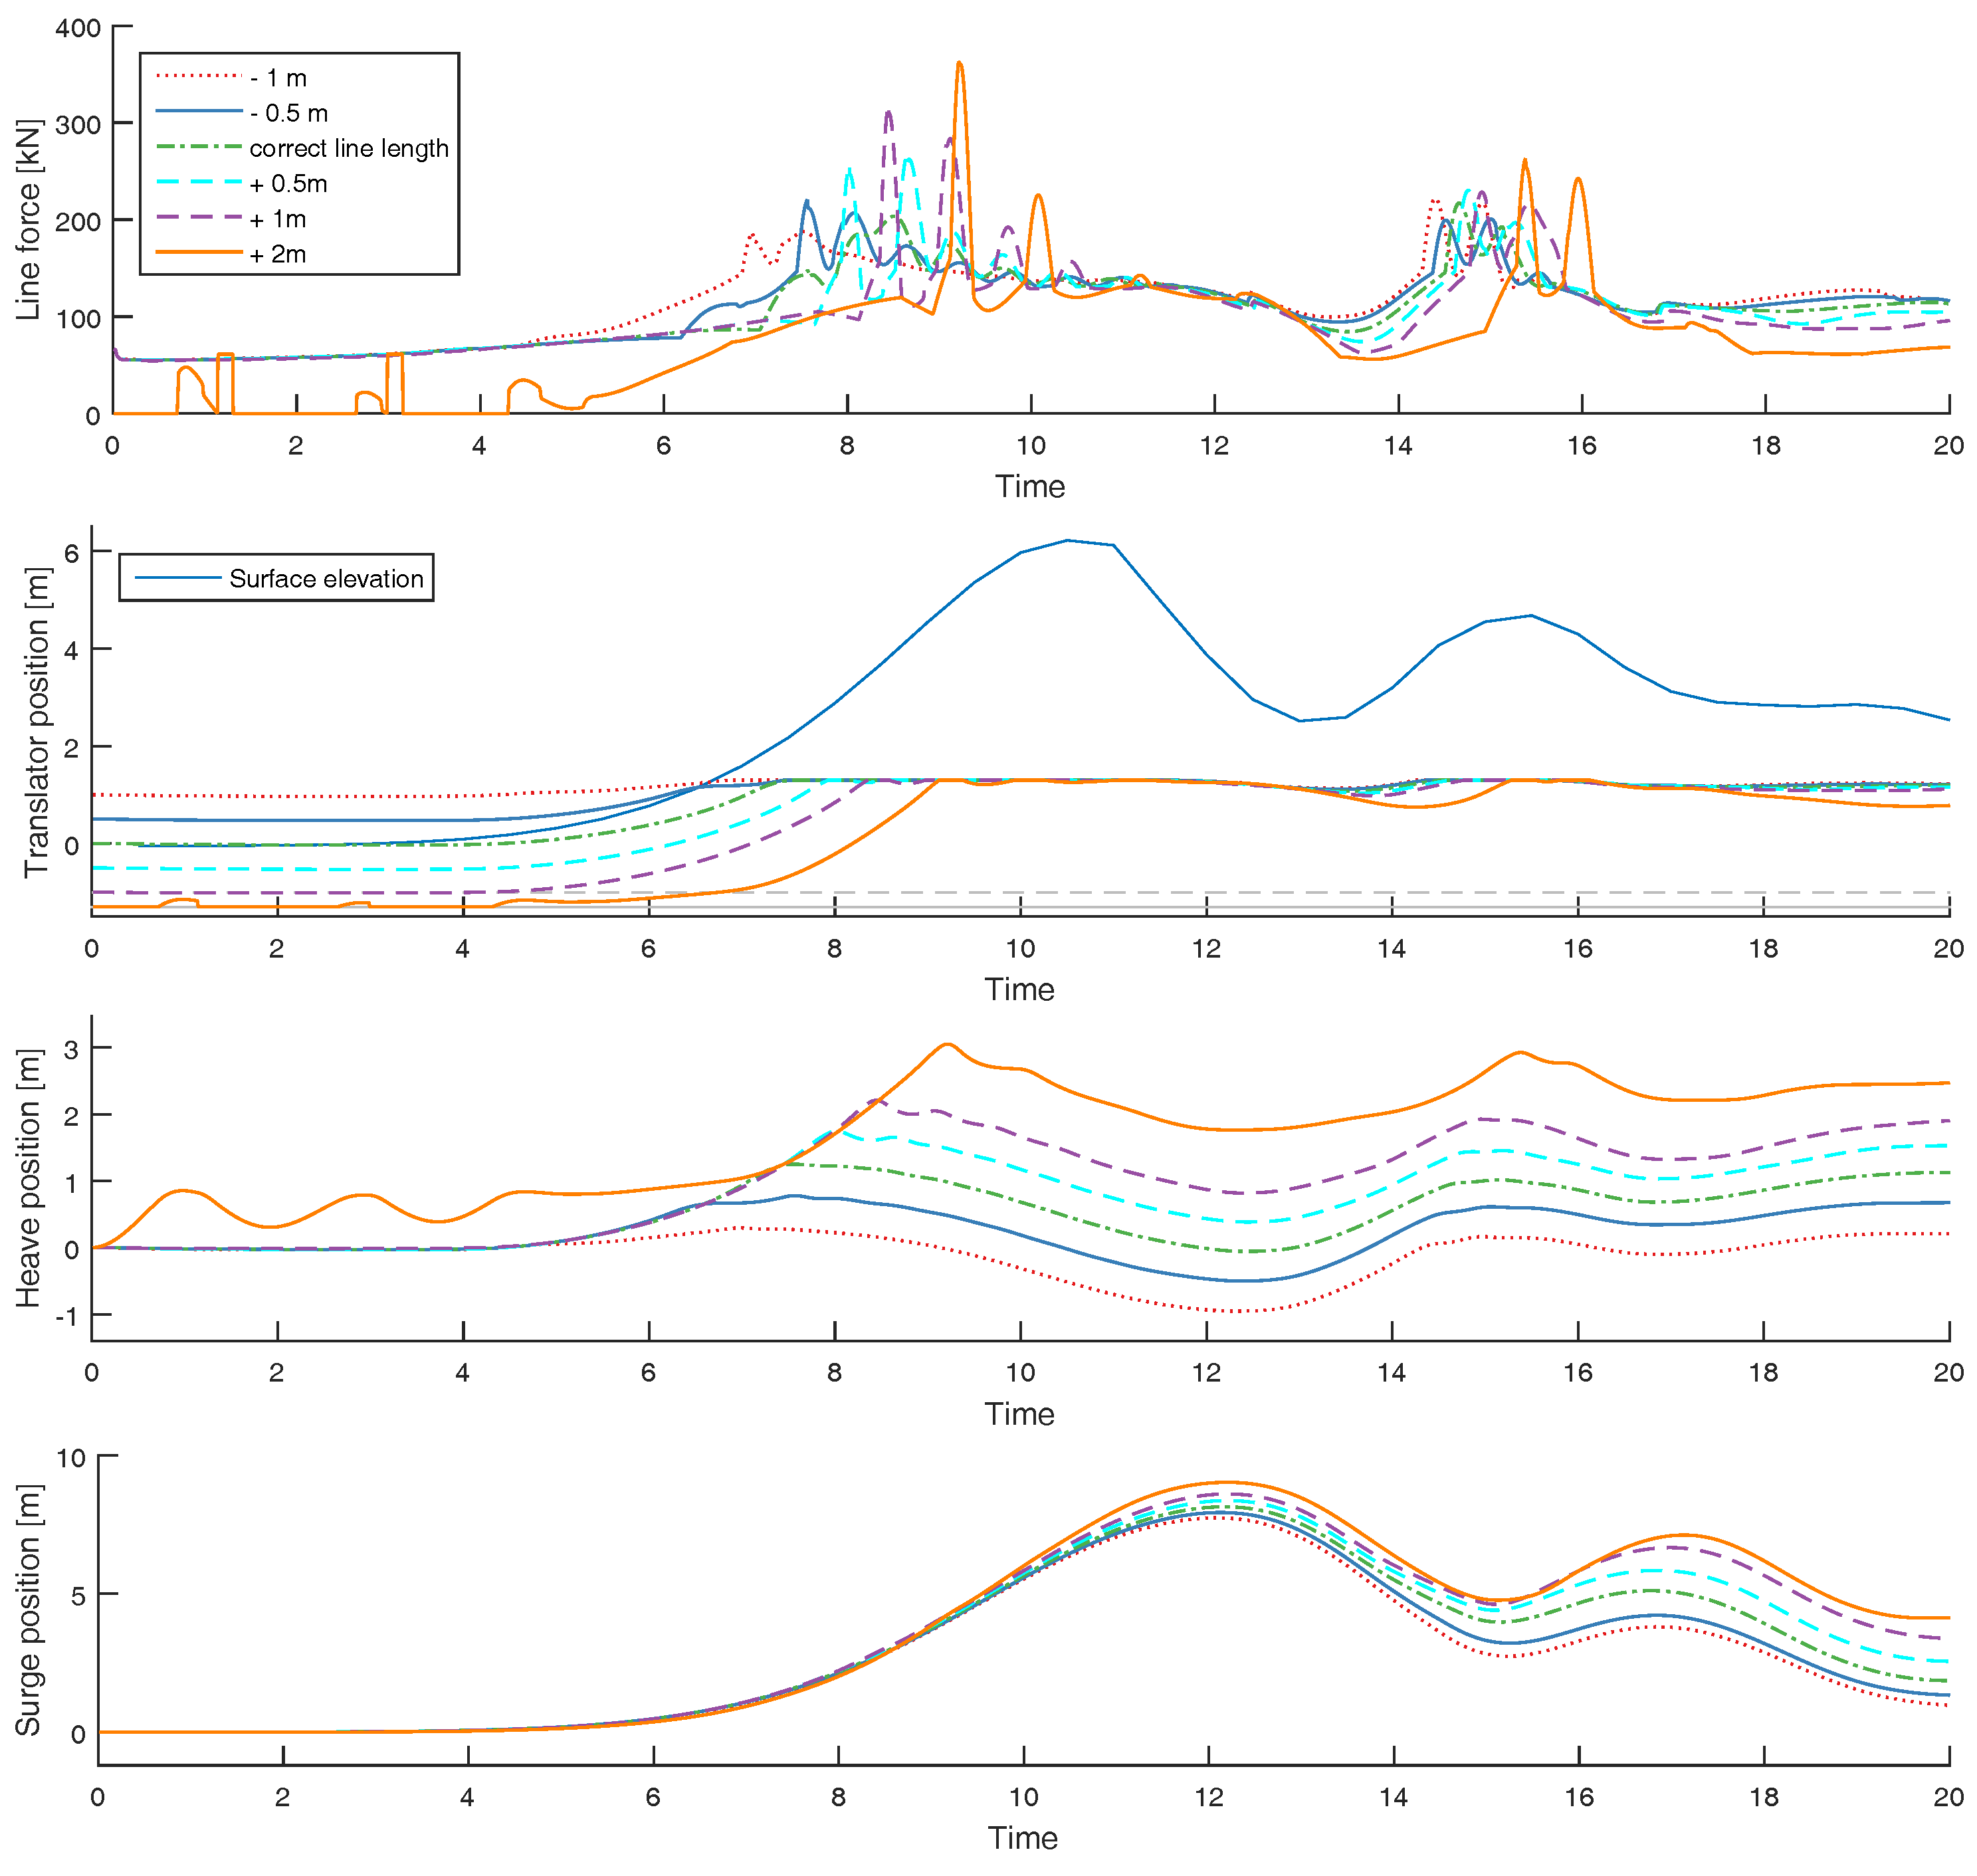
Figure 17.
The WEC impacted by a regular wave (left), and by a tsunami wave (right). The incident waves are traveling from the left to the right in the figures. The connection line length is modelled as too short in those simulations. The origin marks the original position of the buoy in still water.


Table 1.
WEC parameters.
| Parameter | Abbrevation | Value |
|---|---|---|
| Buoy radius | 1.7 m | |
| Buoy height | 2.1 m | |
| Buoy mass | 5700 kg | |
| Translator mass | 6500 kg | |
| Translator height | 3 m | |
| Stator height | 2 m | |
| Free stroke length up/down | 1 m | |
| Total stroke length up/down | 1.25 m | |
| Endstop spring constant | 250 kN/m | |
| Spring constant corresponding to line elasticity | 2600 kN/m |
Table 2.
Wave steepness.
| Wave Height | 3 m | 4 m | 5 m | 6 m | 7 m |
| Wave Steepness (kA) | 0.08 | 0.11 | 0.14 | 0.17 | 0.19 |
© 2017 by the authors. Licensee MDPI, Basel, Switzerland. This article is an open access article distributed under the terms and conditions of the Creative Commons Attribution (CC BY) license (http://creativecommons.org/licenses/by/4.0/).
Share and Cite
MDPI and ACS Style
Sjökvist, L.; Göteman, M. Peak Forces on Wave Energy Linear Generators in Tsunami and Extreme Waves. Energies 2017, 10, 1323. https://doi.org/10.3390/en10091323
AMA Style
Sjökvist L, Göteman M. Peak Forces on Wave Energy Linear Generators in Tsunami and Extreme Waves. Energies. 2017; 10(9):1323. https://doi.org/10.3390/en10091323
Chicago/Turabian StyleSjökvist, Linnea, and Malin Göteman. 2017. "Peak Forces on Wave Energy Linear Generators in Tsunami and Extreme Waves" Energies 10, no. 9: 1323. https://doi.org/10.3390/en10091323
Note that from the first issue of 2016, this journal uses article numbers instead of page numbers. See further details here.