One-Step Self-Assembly Synthesis α-Fe2O3 with Carbon-Coated Nanoparticles for Stabilized and Enhanced Supercapacitors Electrode


State Key Laboratory of Advanced Technology for Material Synthesis and Processing, Wuhan University of Technology, Wuhan 430070, Hubei, China
*
Author to whom correspondence should be addressed.
Energies 2017, 10(9), 1296; https://doi.org/10.3390/en10091296
Submission received: 16 June 2017
/
Revised: 26 August 2017
/
Accepted: 28 August 2017
/
Published: 30 August 2017
(This article belongs to the Section D: Energy Storage and Application)
Abstract
:A cocoon-like α-Fe2O3 nanocomposite with a novel carbon-coated structure was synthesized via a simple one-step hydrothermal self-assembly method and employed as supercapacitor electrode material. It was observed from electrochemical measurements that the obtained α-Fe2O3@C electrode showed a good specific capacitance (406.9 Fg−1 at 0.5 Ag−1) and excellent cycling stability, with 90.7% specific capacitance retained after 2000 cycles at high current density of 10 Ag−1. These impressive results, presented here, demonstrated that α-Fe2O3@C could be a promising alternative material for application in high energy density storage.
1. Introduction
With the development of the economy, environmental pressure has been increasing, and it is very urgent to develop a new, low cost, environmentally friendly alternative energy source and energy storage system [1,2,3,4]. Supercapacitors are considered to be a promising candidate material for energy storage because of their advantages of high power density, excellent rate capacitance, long cycle life, and so on [5,6,7]. The supercapacitor can be classified into two categories: electric double-layer capacitors and pseudocapacitors. The charge storage capacitance in the double-layer capacitors is derived from the electrostatic forces based on the electrical double layers. While it is derived from the rapid Faraday oxidation-reduction reaction in the pseudocapacitors [8]. Electrode material is the main factor in determining the performance of supercapacitors [9]. Due to the varied oxidation states for efficient redox charge transfer and high theoretical specific capacitance, transition metal oxides have been considered to be one of the most attractive electrode materials for supercapacitors [10,11]. Hematite (Fe2O3), a typical transition metal oxide, has attracted a lot of attention for application in supercapacitors due to its low cost, environmental friendliness, and many other advantages [12,13,14]. However, Fe2O3 electrode material also exhibits some serious disadvantages, such as poor electrical conductivity and large volume change, impeding their commercial applications [15]. Carbon-based materials, thanks to their high electrical conductivity, excellent chemical stability, and superior mechanical properties, can be composited with Fe2O3 to overcome the above-mentioned shortcomings and improve electrochemical property in supercapacitors [16,17]. The coating carbon can increase the electronic conductivity of the matrix material and function as a structural buffering layer to cushion the mechanical stress caused by the large volume change during the cycling process. The coating carbon is able to improve the electrical conductivity of the matrix material and also plays as a constraint layer to buffer the cycle of large volume expansion in the charge and discharge process.
In this work, α-Fe2O3 with a novel carbon-coated structure nanoparticle composite was fabricated via a facile one-step self-assembly synthesis method and employed as electrode for supercapacitors. The α-Fe2O3@C nanoparticles exhibited excellent charge storage properties in terms of high capacitance, superior rate capability, and good cyclic stability. This unique structure is conducive to getting over the above-mentioned shortcomings of Fe2O3. As a result, the performance of composite materials as supercapacitors electrode could be enhanced to some extent. Therefore, the cocoon-like α-Fe2O3 nanoparticles with a novel carbon-coated structure have great potential for practical application in the energy storage field.
2. Experimental Section
2.1. Synthesis of α-Fe2O3@C Composite
All of the chemicals were analytical grade and used as received. At first, 0.06 mol Ferric chloride (FeCl3·6H2O) was dissolved in distilled water to form saturated FeCl3 solution. Then, the saturated FeCl3 solution was slowly dropped into 100 mL boiling deionized water under continuous magnetic stirring. In this process, Fe3+-containing solution was hydrolyzed to Fe(OH)3 colloid with negative charge and presented evident Tyndall phenomenon. After several minutes, 10 mL Poly dimethyl diallyl ammonium chloride ((C8H16ClN)n, Mw < 100,000, 35 wt %, Aladdin) (PDDA) solution was gradually added into the homogeneous colloid solution with the assist of magnetic stirring continuously for 3 h. The mixture of the two solutions was then sealed in Teflon-lined stainless steel autoclave at 180 °C for 12 h and cooled down to room temperature. PDDA solution is a type of polycation electrolytes with positive charge. Negatively charged Fe(OH)3 colloidal precursors and positively charged organics were self-assembled under the action of Vander Waals molecular force in the hydrothermally reaction procedure. In the boiling water, Fe3+ solution was hydrolyzed into Fe(OH)3 colloid. Then, the colloidal particles were decomposed into Fe2O3 in the subsequent hydrothermal reaction. The relevant chemical reactions are shown as follows:
Fe3+ + 3H2O→Fe(OH)3 + 3H+
2Fe(OH)3→Fe2O3 + 3H2O
The resulting suspension solution was centrifuged, and then the precipitate was washed with distilled water and anhydrous ethanol. Finally, the collected precipitate was dried at 80 °C in air followed by carbonization at 350 °C for 2 h under highly pure nitrogen (N2) to obtain α-Fe2O3@C composite powder samples.
2.2. Materials Characterization
The structure of the material was examined by X-ray diffraction (XRD, D8 Advance, Bruker AXS, Karlsruhe, Germany) with Cu Kα radiation (λ = 1.5406 Å) in the range from 5–80°. The X-ray photoelectron spectroscopy (XPS, ESCALAB 250Xi, Thermo Fisher Scientific, Waltham, MA, USA) was conducted with X-ray instrument with an Al Kα = 300.0 eV excitation source.
The morphology of the active as-prepared sample was examined by field emission scanning electron microscope (FESEM, Zeiss Ultra Plus, ZEISS, Oberkochen, Germany) and transmission electron microscopy (TEM, JEM 2100F, JEOL, Tokyo, Japan). The element mapping images were obtained on an energy dispersive X-ray spectrometry (EDS, Oxford Instruments, Abingdon, UK). Thermogravimetric analysis-Differential scanning calorimetry (TG-DSC, STA449F3, NETZSCH, Selb, Germany) was conducted in air from room temperature to 1000 °C with heating rate of 10 °C/min.
Raman spectra (INVIA, Renishaw Co. Ltd., Gloucestershire, UK) were analyzed with 632.5 nm argon ion laser from 100 to 1800 cm−1. Fourier transform infra-red (FTIR) spectra (Nexus, Thermo Nicolet, Madison, WI, USA) were conducted in the spectral ranges of 400–4000 cm−1. The specific surface areas of samples were recorded using nitrogen adsorption-desorption isotherms via Brunauer-Emmett-Teller (BET, ASAP 2020M, Micromeritics Instrument, Norcross, GA, USA) analysis at 77 K.
2.3. Electrochemical Measurements
All electrochemical measurements were performed on a CHI660E electrochemical workstation in a typical three-electrode system, with platinum foil and Hg/HgO as the counter electrode and reference electrode, respectively, and the electrolyte was 6 M KOH aqueous solution. The electrochemical impedance spectroscopy (EIS) measurements were carried out on an electrochemical workstation (CHI660E, Chenhua Co. Ltd., Shanghai, China), and the frequency of AC impedance ranges from 0.01–106 Hz with 5 mV amplitude.
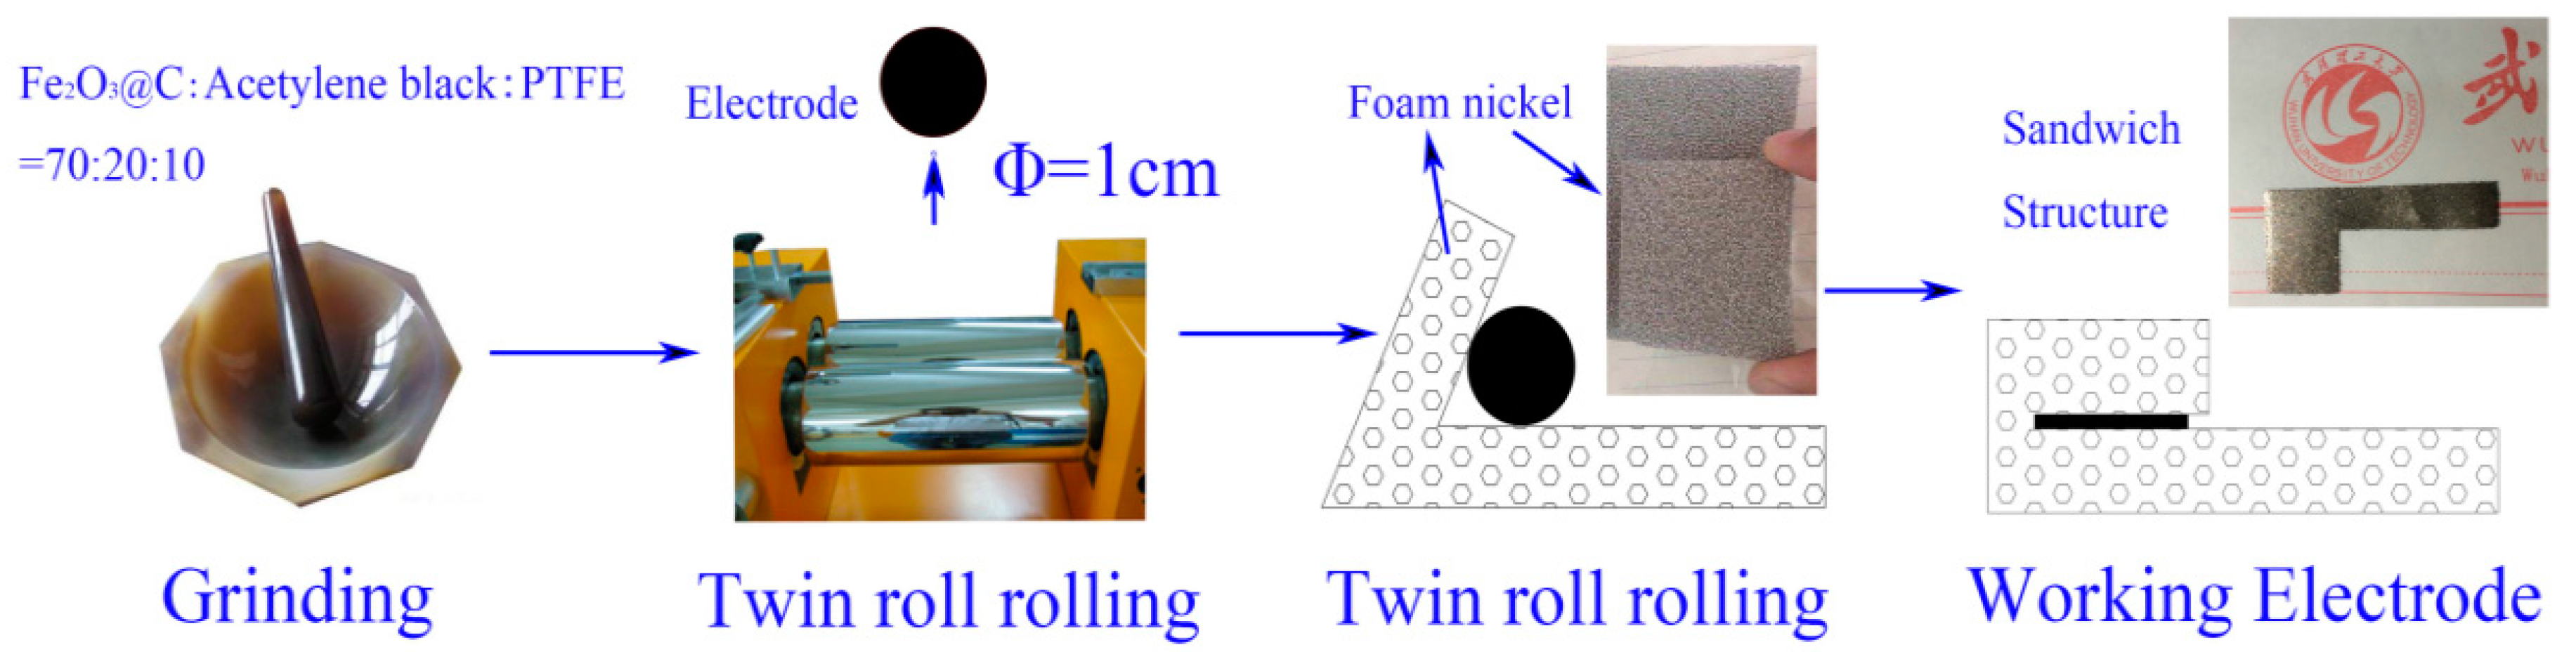
The working electrode consisted of as-prepared α-Fe2O3@C sample, acetylene black and polytetrafluoroethylene (PTFE) solution in a weight ratio of 70:20:10. The mixture was ground into a mash and then pressed into a sheet by a double roller press and punched into small disks with diameter of 1.0 cm. The disks were wrapped in nickel foam by rolling to form a sandwich structure and used as the working electrode. Each working electrode contained about 2.5 mg α-Fe2O3@C active material. The preparation process of sandwich structures working electrode was schematic illustrated in Figure 1. Compared with electrode prepared via conventional method in which the slurry was directly coated on the nickel foam, the electrode with the sandwich structure prepared by this method was harder to fall off.
3. Results and Discussion
XRD patterns of α-Fe2O3@C samples before and after calcination in N2 are shown in Figure 2. After calcination, the crystal phase of the samples almost remained unchanged. All obvious diffraction peaks were matched well with the standard α-Fe2O3 card (JCPDS No. 33-0664). No impurities phases have been detected and the sample is hexagonal phase α-Fe2O3 crystalline structure. No carbon phase peaks have been detected, which indicates that the coated carbon is amorphous. The carbonization temperature under 350 °C is not enough to lead to organic matter graphitization, so the coated carbon layer in this case is in the form of amorphous condition.
As shown in Figure 3a, six Raman scattering peaks are observed at 200–600 cm−1 referring to typical hematite [18], which indicates that the iron oxide precursor has been successfully synthesized by a one-step hydrothermal self-assembly process. The D band is associated with disorder carbon, resulting from various types of defects, while G band is associated with the E2g mode of the crystalline graphite [3]. The intensity ratio of D peak and G peak is used to characterize the degree of graphitization of carbon. After calcination, the relative intensity of D peak and G peak is enhanced due to carbonation of organic matter during the calcination process under the high purity N2. The peaks appeared at ~1320 cm−1 and ~1580 cm−1 are ascribed to the disordered (D) and graphitic (G) band, respectively. Compared with D peak, the intensity of G peak is very weak, indicating that the coated carbon is mainly in an amorphous state. This result is consistent with the XRD analysis of Figure 2.
From Figure 3b, there is a broad absorption peak located at in ~3430 cm−1 corresponding to the stretching vibration of hydroxyl (–OH) mode of crystallized water or physically adsorbed water on the material surface. The intensity of this peak decreases after calcination, which result from the loss of some crystalline water caused by the calcination process. The absorption peaks appearing at the ~480 and ~580 cm−1 correspond to the Fe–O vibrational mode of typical hematite [19,20]. In the fingerprint peak part (~800–1700 cm−1), the absorption peaks located at 1126, 1432, and 1630 cm−1 are attributed to the C–C, C–O, and C=C groups of carbon, respectively [21]. The peaks at 1036 cm−1 and 880 cm−1 are attributed to the characteristic breathing mode of residual organic matter [22]. After calcination, the relative absorption peak intensity becomes larger. All the above-mentioned absorption bands are matched well with spectroscopic characterizations of typical hematite and amorphous carbon structures, indicating the successful formation of α-Fe2O3@C composite via one-step self-assembly method. This result is in agreement with the XRD and Raman analysis results presented above.
As shown in Figure 4, the α-Fe2O3@C sample presents uniform cocoon-like oval spheres with small particle size of ~500 nm in diameter and ~1 µm in length. The particles are distributed evenly without agglomeration. It is worth noting that α-Fe2O3@C sample clearly reveals its hollow pore structure on the surface (Figure 4c), which can effectively buffer the volume change of Fe2O3. This pore structure provides a high specific surface and more active sites and increases the electronic conduction for energy storage [23].
TEM was employed to further investigate the microstructures of the α-Fe2O3@C sample. As shown in Figure 4d, there is a light colored coating layer in the edge of the cocoon-like oval ball. With clear lattice fringes, the α-Fe2O3@C samples present typical crystalline structure of α-Fe2O3. While, no lattice fringes are observed in the coating layer of the edge of α-Fe2O3, indicating that the coating layer is amorphous carbon. The uniform and continuous coating layer has a thickness of a few nanometers (Figure 4e).
The HRTEM images (Figure 4f) display a set of parallel fringes with the space separation of 0.22 nm, corresponding to the (113) plane of crystalline α-Fe2O3 (JCPDS No. 33-0664). The selected area electron diffraction (SAED) image (the insert in Figure 4f) indicates that the α-Fe2O3@C sample has a perfect crystal structure. In the α-Fe2O3@C nanocomposites, the carbon coating layer not only serves as a conductive network but also prevents iron oxide particles from volume variation, which is crucial in improving the performance of Fe2O3 electrode [24].
The EDS element mapping of the α-Fe2O3@C sample was also studied. In order to avoid carbon pollution, the powder samples were ultrasonically dispersed in an ethanol solution, dropping on aluminum foil for test. The Fe, O and C elements are found and distributed evenly in the surface of cocoon-like nanospheres (Figure 5b). The signal of C comes from the carbon-coated layers formed during the calcination process with the organic material PDDA, demonstrating that carbon is successfully coated on the Fe2O3 surfaces. As shown in Figure 5f, the Al peak is derived from aluminum foil, and the carbon weight fraction in α-Fe2O3@C sample was about 4.09%. The quality ratio of iron and oxygen element is 66.33% and 29.58%, respectively, agreeing well with the composition ratio of iron oxide.
In order to determine the weight fraction of carbon coated in the α-Fe2O3@C sample more accurately, TG-DSC analysis was conducted. As shown in Figure S1, the carbon quality content in α-Fe2O3@C sample was about 3.91%, which was almost the same as the result of EDS elemental analysis in Figure 5f. These analyses indicate that carbon has been ideally grown on the surface of Fe2O3 and the amount of the coating carbon is about 4.0%.
The XPS analysis was further employed to determine the chemical compositions and bonding conditions of α-Fe2O3@C nanoparticle composite. One can observe clearly the peaks of Fe2p at ~720 eV, C1s peak at 285.0 eV and O1s peak at 530.5 eV from the full-range XPS survey (Figure 6a). The high-resolution spectra of Fe2p, O1s and C1s were plotted in Figure 6b–d, respectively. The Fe2p1/2 and Fe2p3/2 peaks were observed at 710.8 eV and 724.4 eV, respectively, with the binding energy deference is 13.6 eV. There are two typical satellite peaks (719.3 and 732.3 eV) near the main peak, indicating that iron exists as a trivalent form of Fe3+ [25,26,27].
In Figure 6c, the O1s binding energy is 530.0 eV, corresponding to the typical binding energy of Fe–O bonding, while the peak at 531.3 eV is assigned to C–O, C=O, and O=C–O bonds [28,29]. In Figure 6d, C1s peak can be best fit with four components which is matched well with C sp2 (C=C, 284.1 eV), C sp3 (C–C, 284.6 eV), C–O (285.7 eV), and C=O (288.5 eV) [30]. The C sp2 and C sp3 peaks represent graphitized carbon and amorphous carbon, respectively [31]. The C sp3 peak content is 77.9%, indicating that the coating carbon on α-Fe2O3 surface mainly exists in the form of amorphous carbon.
The specific surface area of the nanoparticles samples was calculated by the BET method with Nitrogen adsorption-desorption isotherms. The Nitrogen adsorption-desorption isotherms of α-Fe2O3@C composite exhibit type IV characteristics, which indicate the presence of mesoporous in the sample [32]. As shown in Figure 7, the corresponding pore size distributions are estimated by the Barrett-Joyner-Halenda (BJH) method. The average pore diameters and pore volume are estimated to be ~17 nm and ~0.0001 cm3 g−1 nm−1, respectively, indicating that the α-Fe2O3@C composite has a mesoporous structure. During the carbonization process of organic matter PDDA, the organic matter can be used as pore-forming agent to increase the pore size by the generation of bubbles [33]. The BET specific area of α-Fe2O3@C sample is ~4.66 m2 g−1. A large surface area can increase the contact area of electrolyte/electrode and reduce the current density per unit surface area during the electrode reaction process [34]. Moreover, the large specific area and pore diameter can promote the diffusion and mass transfer of the electrolyte. The internal pores of the electrode material can be used as active sites for charge storage, improving the capacitance properties of the electrode material [35,36].
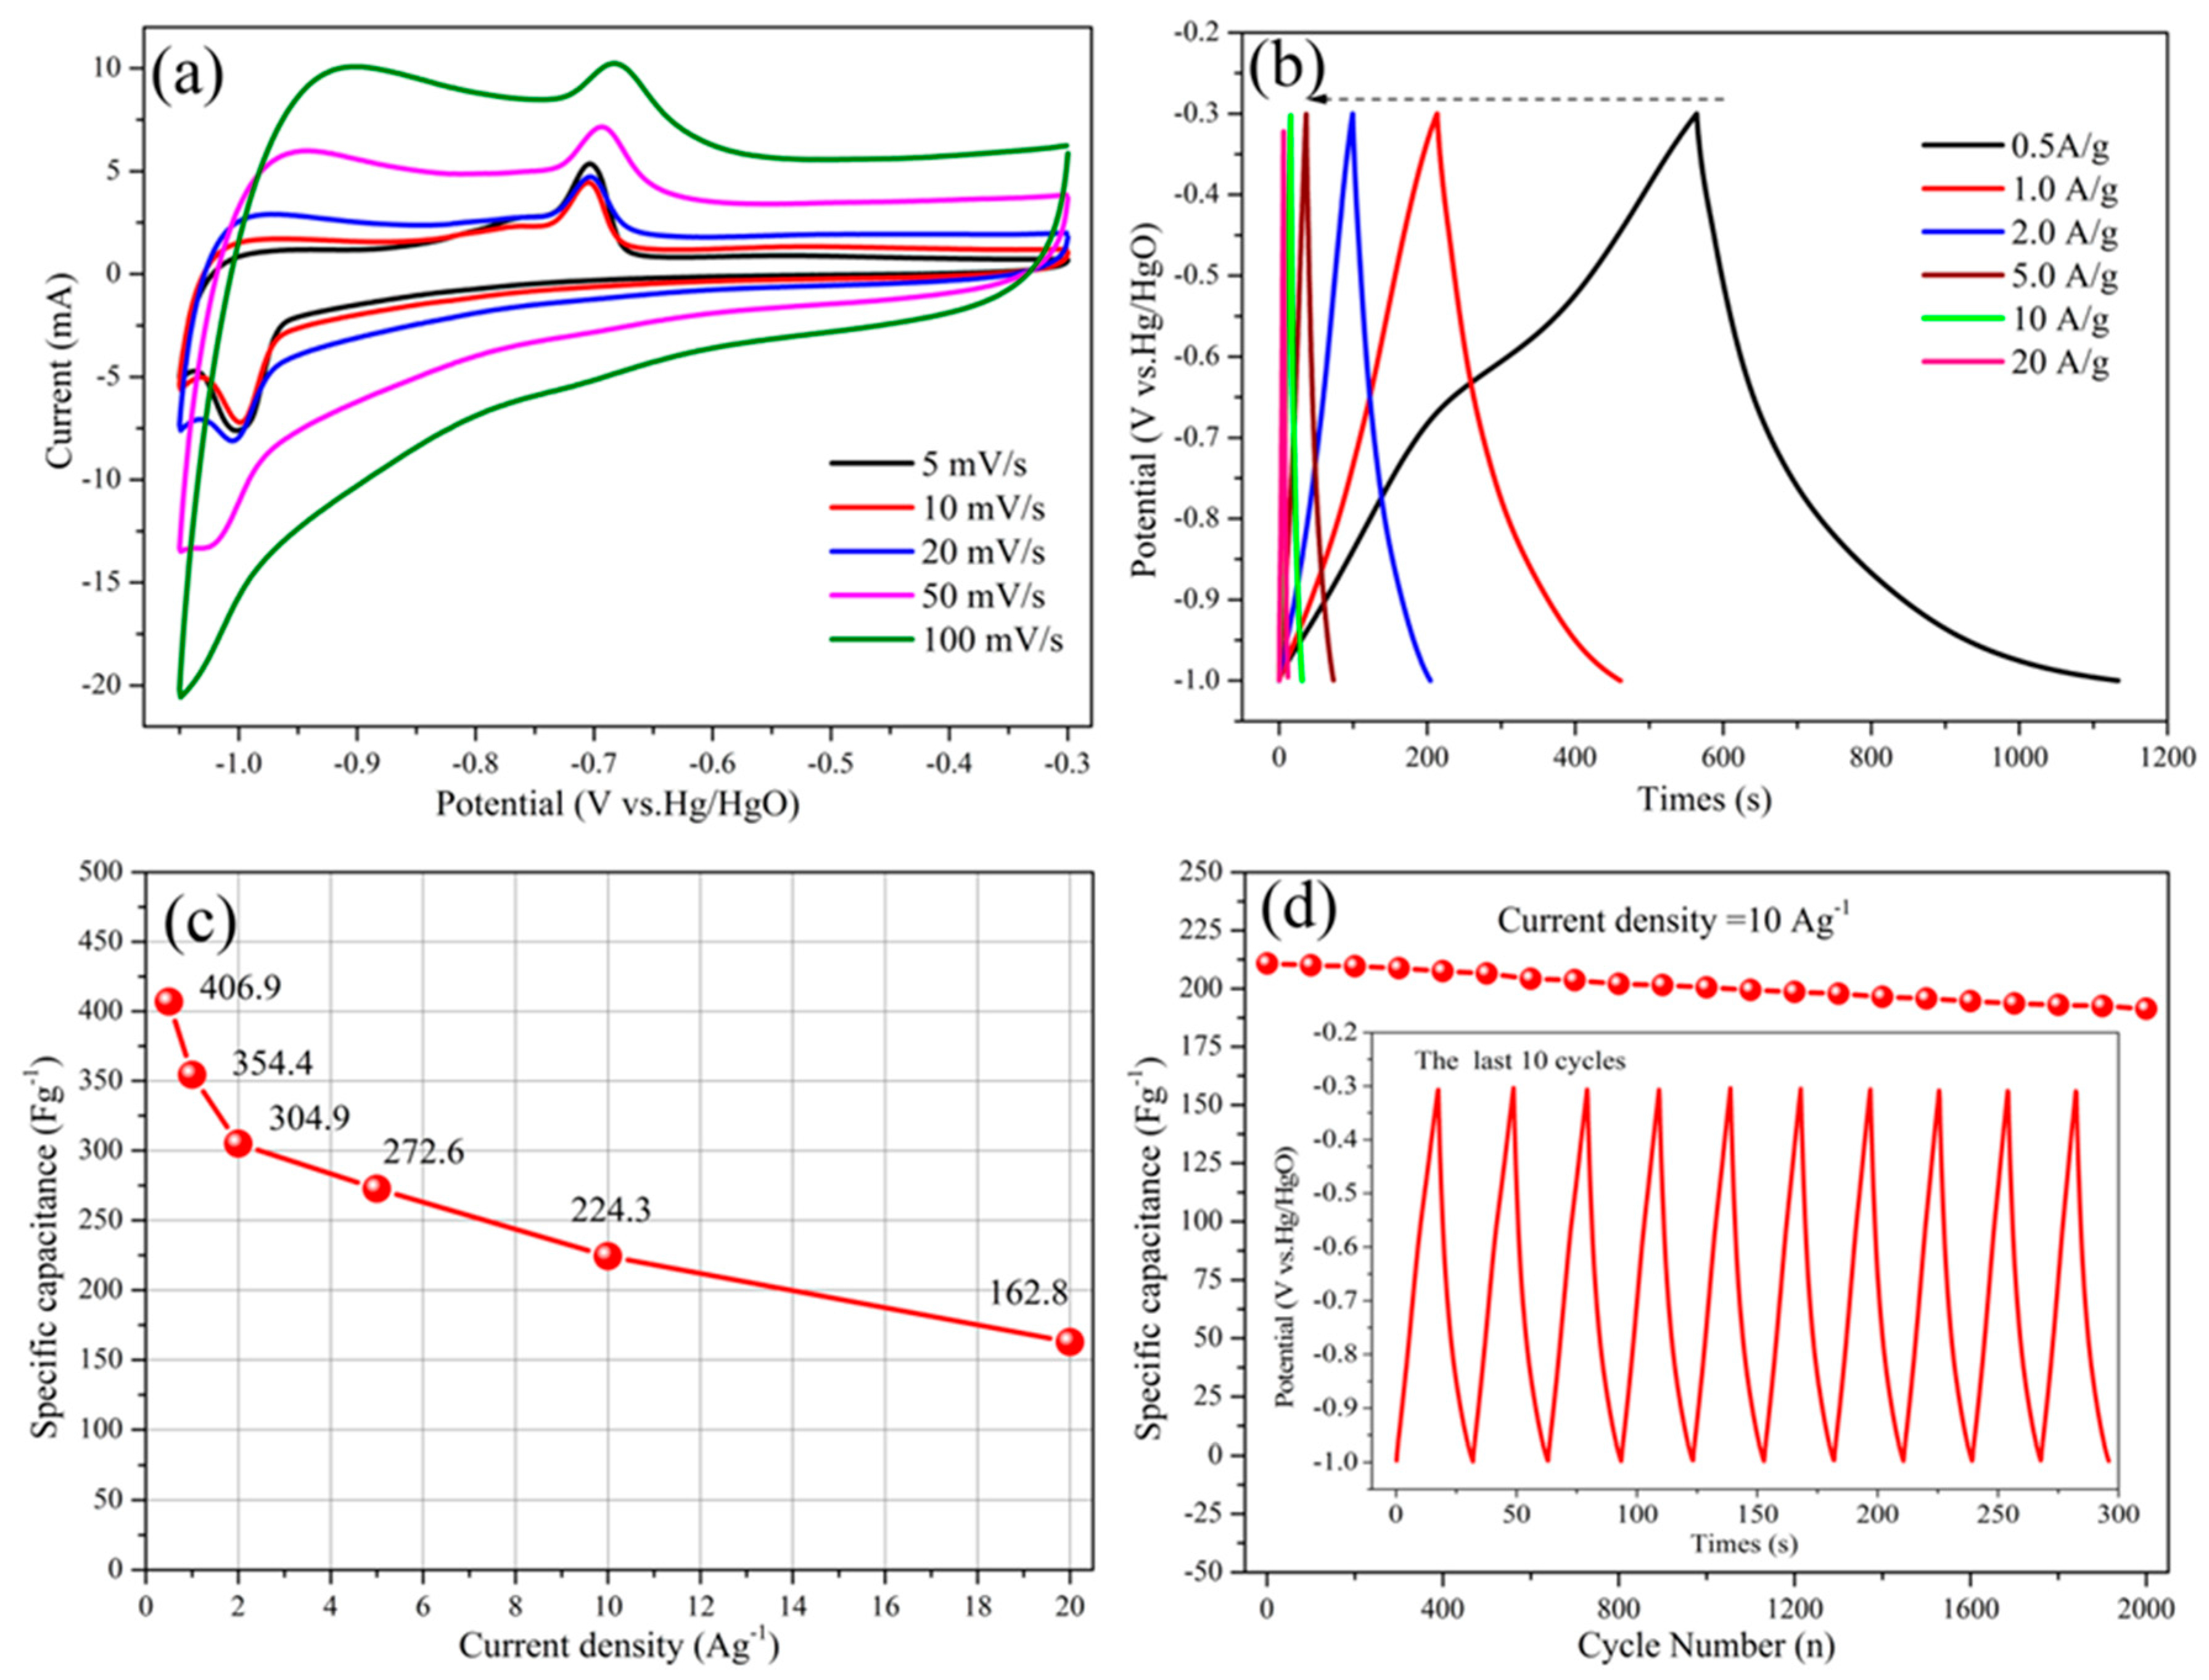
To evaluate the properties of the α-Fe2O3@C sample as supercapacitors electrodes, we performed CV (−1.05–(−0.3 V)) and galvanostatic charge-discharge (−1.0–(−0.3 V)) measurements. According to the Randles Sevcik equation [37,38], if taking the peak current values of CV curves and plotting logarithm of peak current values versus logarithm of scan rate, the slope is ~0.75, indicating that the α-Fe2O3@C mainly shows double-layer capacitance and pseudocapacitive behavior. Therefore, this system could be described as a supercapacitor.
The CV curves of α-Fe2O3@C exhibit a pair of typical redox peak, indicating good faradaic reactions at the electrode surface with the pseudocapacitance charging mechanism. The anodic oxidation peak corresponds to the oxidation of Fe2+ to Fe3+ and the cathodic peak corresponds to the reduction of Fe3+ to Fe2+ [39,40]. With the scanning rate increasing, the potential difference between the anodic and the cathodic peak in the CV curve does not change too much. This indicates a good electrochemical reversibility of α-Fe2O3@C electrode material, which results from the kinetics of the interfacial faradaic redox reactions as well as the rapid electron transport [41].
As can be seen from Figure 8b, the discharge branch consists of two parts. The voltage drops quickly at the beginning of the discharge curve and is then followed by a slow decay, which is related to the capacitance and internal resistance of the electrode [42]. For the Fe2O3@C electrode, there is a combination of and Faraday capacitance and electric double layer capacitance, with a Faraday charge transfer and associated with electric double-layer charge transfer, resulting in longer discharge duration.
The mass specific capacitances (C) were calculated by equation C = (I × Δt)/(m × ΔV) where I is the constant discharge current (A), Δt is the discharging time (s), m is the mass of active electrode material α-Fe2O3@C (g), and ΔV is the voltage drop upon discharging (V). The value of capacitances are 406.9, 354.4, 304.9, 272.6, 224.3, and 162.8 Fg−1 at current densities of 0.5, 1.0, 2.0, 5.0, 10.0, and 20.0 Ag−1, respectively.
The cycling life is an important indicator of the performance of supercapacitors, therefore the cycling stability of α-Fe2O3@C was investigated by repeating the charge-discharge tests at a high current density of 10 Ag−1 for 2000 cycles. It is found that after 2000 cycles, the specific capacitance of α-Fe2O3@C electrode material is 191.3 Fg−1 by remaining 90.7% of its initial specific capacitance (210.8 Fg−1). In addition, the last 10 charge-discharge cycles at a current density of 10 Ag−1 demonstrate a stable and reversible characteristic without obvious downward trend. This may be due to the sandwich structure of α-Fe2O3@C electrode. The electrode material is not easy to fall off, and both sides of the Ni foam current collector are easy to charge conduction.
According to the literature [43], nickel foam also has a certain specific capacitance. In order to avoid the interference of Ni foam, CV (−1.0–(−0.3 V)) and galvanostatic charge–discharges (−1.0–(−0.3 V)) were performed in a three-electrode cell equipped with a piece of Ni foam (1 cm × 1 cm) as working electrode (without any active electrode material loaded on this Ni foam). The results were shown in Figure S2. The values of capacitances of blank Ni foam are 1.17, 0.94, and 0.81 Fg−1 at current densities of 0.1, 0.2, and 0.5 Ag-1, respectively. The specific capacitance of the blank Ni foam is rather small, indicating that the excellent specific capacitance performance is mainly derived from the α-Fe2O3@C electrode material.
Table 1 summarizes some results of Fe2O3-based material used as supercapacitor electrodes in recent reports. It is also noted that our result in this paper exhibits higher specific capacitance than those reported in the literature at the corresponding current density. This excellent capacitive performance may be due to the fact that this unique carbon coating structure maintains the rapid transmission of electrolyte ions and electrons across the electrode, which efficiently utilizes pseudo-layers and double-layer capacitance to effectively improve the electrochemical performance of Fe2O3 electrode material [44,45]. This outstanding capacitance performance enables the α-Fe2O3@C nanocomposites to be promising electrode materials for next-generation energy storage and conversion devices.
The EIS behaviors of Fe2O3@C sandwich structure working electrode were further investigated (Figure S3). The Nyquist plots in the high frequency region show low internal resistance with a small equivalent series resistance (<0.1 Ω, the inset of Figure S3), due to the carbon coating improves the conductivity of the Fe2O3 material. In the low frequency region, the Nyquist plots exhibit a straight line, representing the diffusion limited electron transfer process of Fe2O3@C electrode.
As shown in Figure S4a,b, the nickel foam has a homogeneous porous structure, which facilitates the separation of the electrolyte and electrons. The pore size is about 200 nm. Before the cycling, the Fe2O3@C nanospheres, acetylene black and polytetrafluoroethylene (PTFE) are evenly distributed. The linear object is the binder (PTFE). After the cycling, the Fe2O3@C nanospheres morphology remain intact, with no significant expansion and rupture, which is due to the protective effect of carbon coating. Generally, the structure of Fe2O3 particles will break and collapse during the cycling process. The morphology and structure of Fe2O3@C sample were almost unchanged and still maintained the cocoon-shaped oval spherical structure. This further illustrated that the carbon coating can effectively buffer the volume expansion of Fe2O3 material to maintain structural stability and improve electrical properties [53].
4. Conclusions
In conclusion, we have successfully synthesized cocoon-like α-Fe2O3@C nanocomposites with a novel carbon-coated core-shell structure via a simple one-step hydrothermal self-assembly method and employed it as supercapacitor electrode material. The coating carbon layer improves the conductivity of α-Fe2O3 and also buffers its volume change during cycling. The porous structure of α-Fe2O3@C provides more active sites for charge storage, which effectively enhance the specific capacitance, cycling stability, and rate performance of α-Fe2O3. This one-step synthesis method is simple and efficient. It is suited for the large-scale production of other carbon-coated metal oxide materials. This cocoon-like α-Fe2O3 nanoparticle with a novel carbon-coated structure has potential for energy storage applications.
Supplementary Materials
Supplementary materials can be found at www.mdpi.com/1996-1073/10/8/1296/s1.
Acknowledgments
This work was financially supported by the National High Technology Research and Development Program of China (863 Project 2012A053402), the National Key Research and Development Program of China (No. 2016YFB0101200), and the National Natural Science Foundation of China (51472187).
Author Contributions
Yizhi Yan was responsible for experiment, total article structure design, and writing; Haolin Tang and Mu Pan contributed to the article revision and the funding support; Fan Wu and Rui Wang provided lots of comments in the process of revision.
Conflicts of Interest
The authors declare no conflict of interest.
References
- Wang, G.; Zhang, L.; Zhang, J. A review of electrode materials for electrochemical supercapacitors. Chem. Soc. Rev. 2012, 41, 797–828. [Google Scholar] [CrossRef] [PubMed]
- Nithya, V.D.; Arul, N.S. Review on α-Fe2O3 based negative electrode for high performance supercapacitors. J. Power Sources 2016, 327, 297–318. [Google Scholar] [CrossRef]
- Xiong, G.; Meng, C.; Reifenberger, R.G.; Irazoqui, P.P.; Fisher, T.S. Graphitic Petal Electrodes for All-Solid-State Flexible Supercapacitors. Adv. Energy Mater. 2013, 4, 1300515. [Google Scholar] [CrossRef]
- Xiang, D.; Yin, L.; Wang, C.; Zhang, L. High electrochemical performance of RuO2–Fe2O3 nanoparticles embedded ordered mesoporous carbon as a supercapacitor electrode material. Energy 2016, 106, 103–111. [Google Scholar] [CrossRef]
- Peng, X.; Peng, L.; Wu, C.; Xie, Y. Two dimensional nanomaterials for flexible supercapacitors. Chem. Soc. Rev. 2014, 43, 3303–3323. [Google Scholar] [CrossRef] [PubMed]
- Shivakumara, S.; Penki, T.R.; Munichandraiah, N. High specific surface area α-Fe2O3 nanostructures as high performance electrode material for supercapacitors. Mater. Lett. 2014, 131, 100–103. [Google Scholar] [CrossRef]
- Lin, F.; Li, X.; Zhao, Y.; Yang, Z. Control Strategies with Dynamic Threshold Adjustment for Supercapacitor Energy Storage System Considering the Train and Substation Characteristics in Urban Rail Transit. Energies 2016, 9, 257. [Google Scholar] [CrossRef]
- Baughman, R.H.; Zakhidov, A.A.; De Heer, W.A. Carbon Nanotubes—The Route Toward Applications. Science 2002, 297, 787–792. [Google Scholar] [CrossRef] [PubMed]
- Wu, Z.S.; Zhou, G.; Yin, L.C.; Ren, W.; Li, F.; Cheng, H.-M. Graphene/metal oxide composite electrode materials for energy storage. Nano Energy 2012, 1, 107–131. [Google Scholar] [CrossRef]
- Nan, H.; Yu, L.; Ma, W.; Geng, B.; Zhang, X. Flexible superior electrode architectures based on three-dimensional porous spinous α-Fe2O3 with a high performance as a supercapacitor. Dalton Trans. 2015, 44, 9581–9587. [Google Scholar] [CrossRef] [PubMed]
- Zheng, X.; Han, Z.; Chai, F.; Qu, F.; Xia, H.; Wu, X. Flexible heterostructured supercapacitor electrodes based on α-Fe2O3 nanosheets with excellent electrochemical performances. Dalton Trans. 2016, 45, 12862–12870. [Google Scholar] [CrossRef] [PubMed]
- Wang, Z.; Liu, C.J. Preparation and application of iron oxide/graphene based composites for electrochemical energy storage and energy conversion devices: Current status and perspective. Nano Energy 2015, 11, 277–293. [Google Scholar] [CrossRef]
- Wang, L.; Yang, H.; Liu, X.; Zeng, R.; Li, M.; Huang, Y.; Hu, X. Constructing Hierarchical Tectorum-like α-Fe2O3/PPy Nanoarrays on Carbon Cloth for Solid-State Asymmetric Supercapacitors. Angew. Chem. Int. Ed. 2017, 129, 1125–1130. [Google Scholar] [CrossRef]
- Yang, X.; Sun, H.; Zhang, L.; Zhao, L.; Lian, J.; Jiang, Q. High Efficient Photo-Fenton Catalyst of α-Fe2O3/MoS2 Hierarchical Nanoheterostructures: Reutilization for Supercapacitors. Sci. Rep. 2016, 6, 31591. [Google Scholar] [CrossRef] [PubMed]
- Liu, S.; Sun, S.; You, X. Inorganic nanostructured materials for high performance electrochemical supercapacitors. Nanoscale 2014, 6, 2037–2045. [Google Scholar] [CrossRef] [PubMed]
- Gao, Y.; Wu, D.; Wang, T.; Jia, D.; Xia, W.; Lv, Y.; Cao, Y.; Tan, Y.; Liu, P. One-step solvothermal synthesis of quasi-hexagonal Fe2O3 nanoplates/graphene composite as high performance electrode material for supercapacitor. Electrochim. Acta 2016, 191, 275–283. [Google Scholar] [CrossRef]
- Liu, H.D.; Zhang, J.L.; Xu, D.D.; Huang, L.H.; Tan, S.Z.; Mai, W.J. Easy one-step hydrothermal synthesis of nitrogen-doped reduced graphene oxide/iron oxide hybrid as efficient supercapacitor material. J. Solid State Electrochem. 2014, 19, 135–144. [Google Scholar] [CrossRef]
- Yu, W.; Zhang, L.; Hou, P.; Li, F.; Liu, C.; Cheng, H. High Reversible Lithium Storage Capacity and Structural Changes of Fe2O3 Nanoparticles Confined inside Carbon Nanotubes. Adv. Energy Mater. 2016, 6, 1501755. [Google Scholar] [CrossRef]
- Wang, S.; Hu, L.; Hu, Y.; Jiao, S. Conductive polyaniline capped Fe2O3 composite anode for high rate lithium ion batteries. Mater. Chem. Phys. 2014, 146, 289–294. [Google Scholar] [CrossRef]
- Xu, L.; Xia, J.; Xu, H.; Yin, S.; Wang, K.; Huang, L.; Wang, L.; Li, H. Reactable ionic liquid assisted solvothermal synthesis of graphite-like C3N4 hybridized α-Fe2O3 hollow microspheres with enhanced supercapacitive performance. J. Power Sources 2014, 245, 866–874. [Google Scholar] [CrossRef]
- Shou, Q.; Cheng, J.; Zhang, L.; Nelson, B.J.; Zhang, X. Synthesis and characterization of a nanocomposite of goethite nanorods and reduced graphene oxide for electrochemical capacitors. J. Solid State Chem. 2012, 185, 191–197. [Google Scholar] [CrossRef]
- Xiang, Q.; Yu, J.; Jaroniec, M. Preparation and Enhanced Visible-Light Photocatalytic H2-Production Activity of Graphene/C3N4 Composites. J. Phys. Chem. C 2011, 115, 7355–7363. [Google Scholar] [CrossRef]
- Meher, S.K.; Justin, P.; Rao, G.R. Microwave-mediated synthesis for improved morphology and pseudocapacitance performance of nickel oxide. ACS Appl. Mater. Interfaces 2011, 3, 2063–2073. [Google Scholar] [CrossRef] [PubMed]
- Dong, X.; Li, L.; Zhao, C.; Liu, H.-K.; Guo, Z. Controllable synthesis of RGO/FexOy nanocomposites as high-performance anode materials for lithium ion batteries. J. Mater. Chem. A 2014, 2, 9844–9850. [Google Scholar] [CrossRef]
- Cao, K.; Jiao, L.; Liu, H.; Liu, Y.; Wang, Y.; Guo, Z.; Yuan, H. 3D Hierarchical Porous α-Fe2O3 Nanosheets for High-Performance Lithium-Ion Batteries. Adv. Energy Mater. 2014, 5, 1401421. [Google Scholar] [CrossRef]
- Sun, Z.; Yuan, H.; Liu, Z.; Han, B.; Zhang, X. A Highly Efficient Chemical Sensor Material for H2S: α-Fe2O3 Nanotubes Fabricated Using Carbon Nanotube Templates. Adv. Mater. 2005, 17, 2993–2997. [Google Scholar] [CrossRef]
- Wang, X.; Zhang, M.; Liu, E.; He, F.; Shi, C.; He, C.; Li, J.; Zhao, N. Three-dimensional core-shell Fe2O3@carbon/carbon cloth as binder-free anode for the high-performance lithium-ion batteries. Appl. Surf. Sci. 2016, 390, 350–356. [Google Scholar] [CrossRef]
- Ma, C.; Zhang, W.; He, Y.S.; Gong, Q.; Che, H.; Ma, Z.F. Carbon coated SnO2 nanoparticles anchored on CNT as a superior anode material for lithium-ion batteries. Nanoscale 2016, 8, 4121–4126. [Google Scholar] [CrossRef] [PubMed]
- Guo, Q.; Qin, X. Flower-like SnO2 nanoparticles grown on graphene as anode materials for lithium-ion batteries. J. Solid State Electrochem. 2013, 18, 1031–1039. [Google Scholar] [CrossRef]
- Subramaniyam, C.M.; Islam, M.M.; Akhter, T.; Cardillo, D.; Konstantinov, K.; Liu, H.K.; Dou, S.X. A chemically modified graphene oxide wrapped porous hematite nano-architecture as a high rate lithium-ion battery anode material. RSC Adv. 2016, 6, 82698–82706. [Google Scholar] [CrossRef]
- Hu, J.; Zheng, J.; Tian, L.; Duan, Y.; Lin, L.; Cui, S.; Peng, H.; Liu, T.; Guo, H.; Wang, X.; et al. A core-shell nanohollow-γ-Fe2O3@graphene hybrid prepared through the Kirkendall process as a high performance anode material for lithium ion batteries. Chem. Commun. 2015, 51, 7855–7858. [Google Scholar] [CrossRef] [PubMed]
- Wang, H.; Xu, Z.; Yi, H.; Wei, H.; Guo, Z.; Wang, X. One-step preparation of single-crystalline Fe2O3 particles/graphene composite hydrogels as high performance anode materials for supercapacitors. Nano Energy 2014, 7, 86–96. [Google Scholar] [CrossRef]
- Qin, X.; Zhang, H.; Wu, J.; Chu, X.; He, Y.-B.; Han, C.; Miao, C.; Wang, S.; Li, B.; Kang, F. Fe3O4 nanoparticles encapsulated in electrospun porous carbon fibers with a compact shell as high-performance anode for lithium ion batteries. Carbon 2015, 87, 347–356. [Google Scholar] [CrossRef]
- Huang, Y.; Lin, Z.; Zheng, M.; Wang, T.; Yang, J.; Yuan, F.; Lu, X.; Liu, L.; Sun, D. Amorphous Fe2O3 nanoshells coated on carbonized bacterial cellulose nanofibers as a flexible anode for high-performance lithium ion batteries. J. Power Sources 2016, 307, 649–656. [Google Scholar] [CrossRef]
- Li, Y.; Zhu, C.; Lu, T.; Guo, Z.; Zhang, D.; Ma, J.; Zhu, S. Simple fabrication of a Fe2O3/carbon composite for use in a high-performance lithium ion battery. Carbon 2013, 52, 565–573. [Google Scholar] [CrossRef]
- Mai, L.Q.; Yang, F.; Zhao, Y.L.; Xu, X.; Xu, L.; Luo, Y.Z. Hierarchical MnMoO4/CoMoO4 heterostructured nanowires with enhanced supercapacitor performance. Nat. Commun. 2011, 2. [Google Scholar] [CrossRef] [PubMed]
- Kant, R. Theory for staircase voltammetry and linear scan voltammetry on fractal electrodes: Emergence of anomalous Randles-Sevcik behavior. Electrochim. Acta 2013, 111, 223–233. [Google Scholar]
- Mundinamani, S.P.; Rabinal, M.K. Molecular modification of highly degenerate semiconductor as an active electrode to enhance the performance of supercapacitors. Mater. Res. Express 2014, 1, 045508. [Google Scholar] [CrossRef]
- Nie, G.; Lu, X.; Lei, J.; Jiang, Z.; Wang, C. Electrospun V2O5-doped α-Fe2O3 composite nanotubes with tunable ferromagnetism for high-performance supercapacitor electrodes. J. Mater. Chem. A 2014, 2, 15495–15501. [Google Scholar] [CrossRef]
- Nie, G.; Lu, X.; Chi, M.; Zhu, Y.; Yang, Z.; Song, N.; Wang, C. Hierarchical α-Fe2O3@MnO2 core-shell nanotubes as electrode materials for high-performance supercapacitors. Electrochim. Acta 2017, 231, 36–43. [Google Scholar] [CrossRef]
- Li, J.J.; Liu, M.C.; Kong, L.B.; Wang, D.; Hu, Y.M.; Han, W.; Kang, L. Advanced asymmetric supercapacitors based on Ni3(PO4)2@GO and Fe2O3@GO electrodes with high specific capacitance and high energy density. RSC Adv. 2015, 5, 41721–41728. [Google Scholar] [CrossRef]
- Tian, W.; Wang, X.; Zhi, C.; Zhai, T.; Liu, D.; Zhang, C.; Golberg, D.; Bando, Y. Ni(OH)2 nanosheet@Fe2O3 nanowire hybrid composite arrays for high-performance supercapacitor electrodes. Nano Energy 2013, 2, 754–763. [Google Scholar] [CrossRef]
- Xing, W.; Qiao, S.; Wu, X.; Gao, X.; Zhou, J.; Zhuo, S.; Hartono, S.B.; Hulicova-Jurcakova, D. Exaggerated capacitance using electrochemically active nickel foam as current collector in electrochemical measurement. J. Power Sources 2011, 196, 4123–4127. [Google Scholar] [CrossRef]
- Zhu, X.; Zhu, Y.; Murali, S.; Stoller, M.D.; Ruoff, R.S. Nanostructured Reduced Graphene Oxide/Fe2O3 Composite As a High-Performance Anode Material for Lithium Ion Batteries. ACS Nano 2011, 5, 3333–3338. [Google Scholar] [CrossRef] [PubMed]
- Fan, Z.; Yan, J.; Zhi, L.; Zhang, Q.; Wei, T.; Feng, J.; Zhang, M.; Qian, W.; Wei, F. A three-dimensional carbon nanotube/graphene sandwich and its application as electrode in supercapacitors. Adv. Mater. 2010, 22, 3723–3728. [Google Scholar] [CrossRef] [PubMed]
- Wang, D.; Li, Y.; Wang, Q.; Wang, T. Nanostructured Fe2O3-graphene composite as a novel electrode material for supercapacitors. J. Solid State Electrochem. 2011, 16, 2095–2102. [Google Scholar] [CrossRef]
- Shivakumara, S.; Penki, T.R.; Munichandraiah, N. Preparation and electrochemical performance of porous hematite (α-Fe2O3) nanostructures as supercapacitor electrode material. J. Solid State Electrochem. 2013, 18, 1057–1066. [Google Scholar] [CrossRef]
- Zhao, P.; Li, W.; Wang, G.; Yu, B.; Li, X.; Bai, J.; Ren, Z. Facile hydrothermal fabrication of nitrogen-doped graphene/Fe2O3 composites as high performance electrode materials for supercapacitor. J. Alloys Compd. 2014, 604, 87–93. [Google Scholar] [CrossRef]
- Li, J.; Zhang, W.; Zan, G.; Wu, Q. A high-performance dual-function material: Self-assembled super long α-Fe2O3 hollow tubes with multiple heteroatom (C-, N- and S-) doping. Dalton Trans. 2016, 45, 12790–12799. [Google Scholar] [CrossRef] [PubMed]
- Liu, L.; Lang, J.; Zhang, P.; Hu, B.; Yan, X. Facile Synthesis of Fe2O3 Nano-Dots@Nitrogen-Doped Graphene for Supercapacitor Electrode with Ultralong Cycle Life in KOH Electrolyte. ACS Appl. Mater. Interfaces 2016, 8, 9335–9344. [Google Scholar] [CrossRef] [PubMed]
- Zhang, M.; Sha, J.; Miao, X.; Liu, E.; Shi, C.; Li, J.; He, C.; Li, Q.; Zhao, N. Three-dimensional graphene anchored Fe2O3@C core-shell nanoparticles as supercapacitor electrodes. J. Alloys Compd. 2017, 696, 956–963. [Google Scholar] [CrossRef]
- Nathan, D.M.G.T.; Boby, S.J.M. Hydrothermal preparation of hematite nanotubes/reduced graphene oxide nanocomposites as electrode material for high performance supercapacitors. J. Alloys Compd. 2017, 700, 67–74. [Google Scholar] [CrossRef]
- Wang, D.; Dong, H.; Zhang, H.; Zhang, Y.; Xu, Y.; Zhao, C.; Sun, Y.; Zhou, N. Enabling a High Performance of Mesoporous α-Fe2O3 Anodes by Building a Conformal Coating of Cyclized-PAN Network. ACS Appl. Mater. Interfaces 2016, 8, 19524–19532. [Google Scholar] [CrossRef] [PubMed]
Figure 1.
Schematic illustration of preparation of sandwich structure working electrode.

Figure 2.
X-ray diffraction (XRD) patterns of α-Fe2O3@C nanoparticle composite before and after calcination.
Figure 2.
X-ray diffraction (XRD) patterns of α-Fe2O3@C nanoparticle composite before and after calcination.
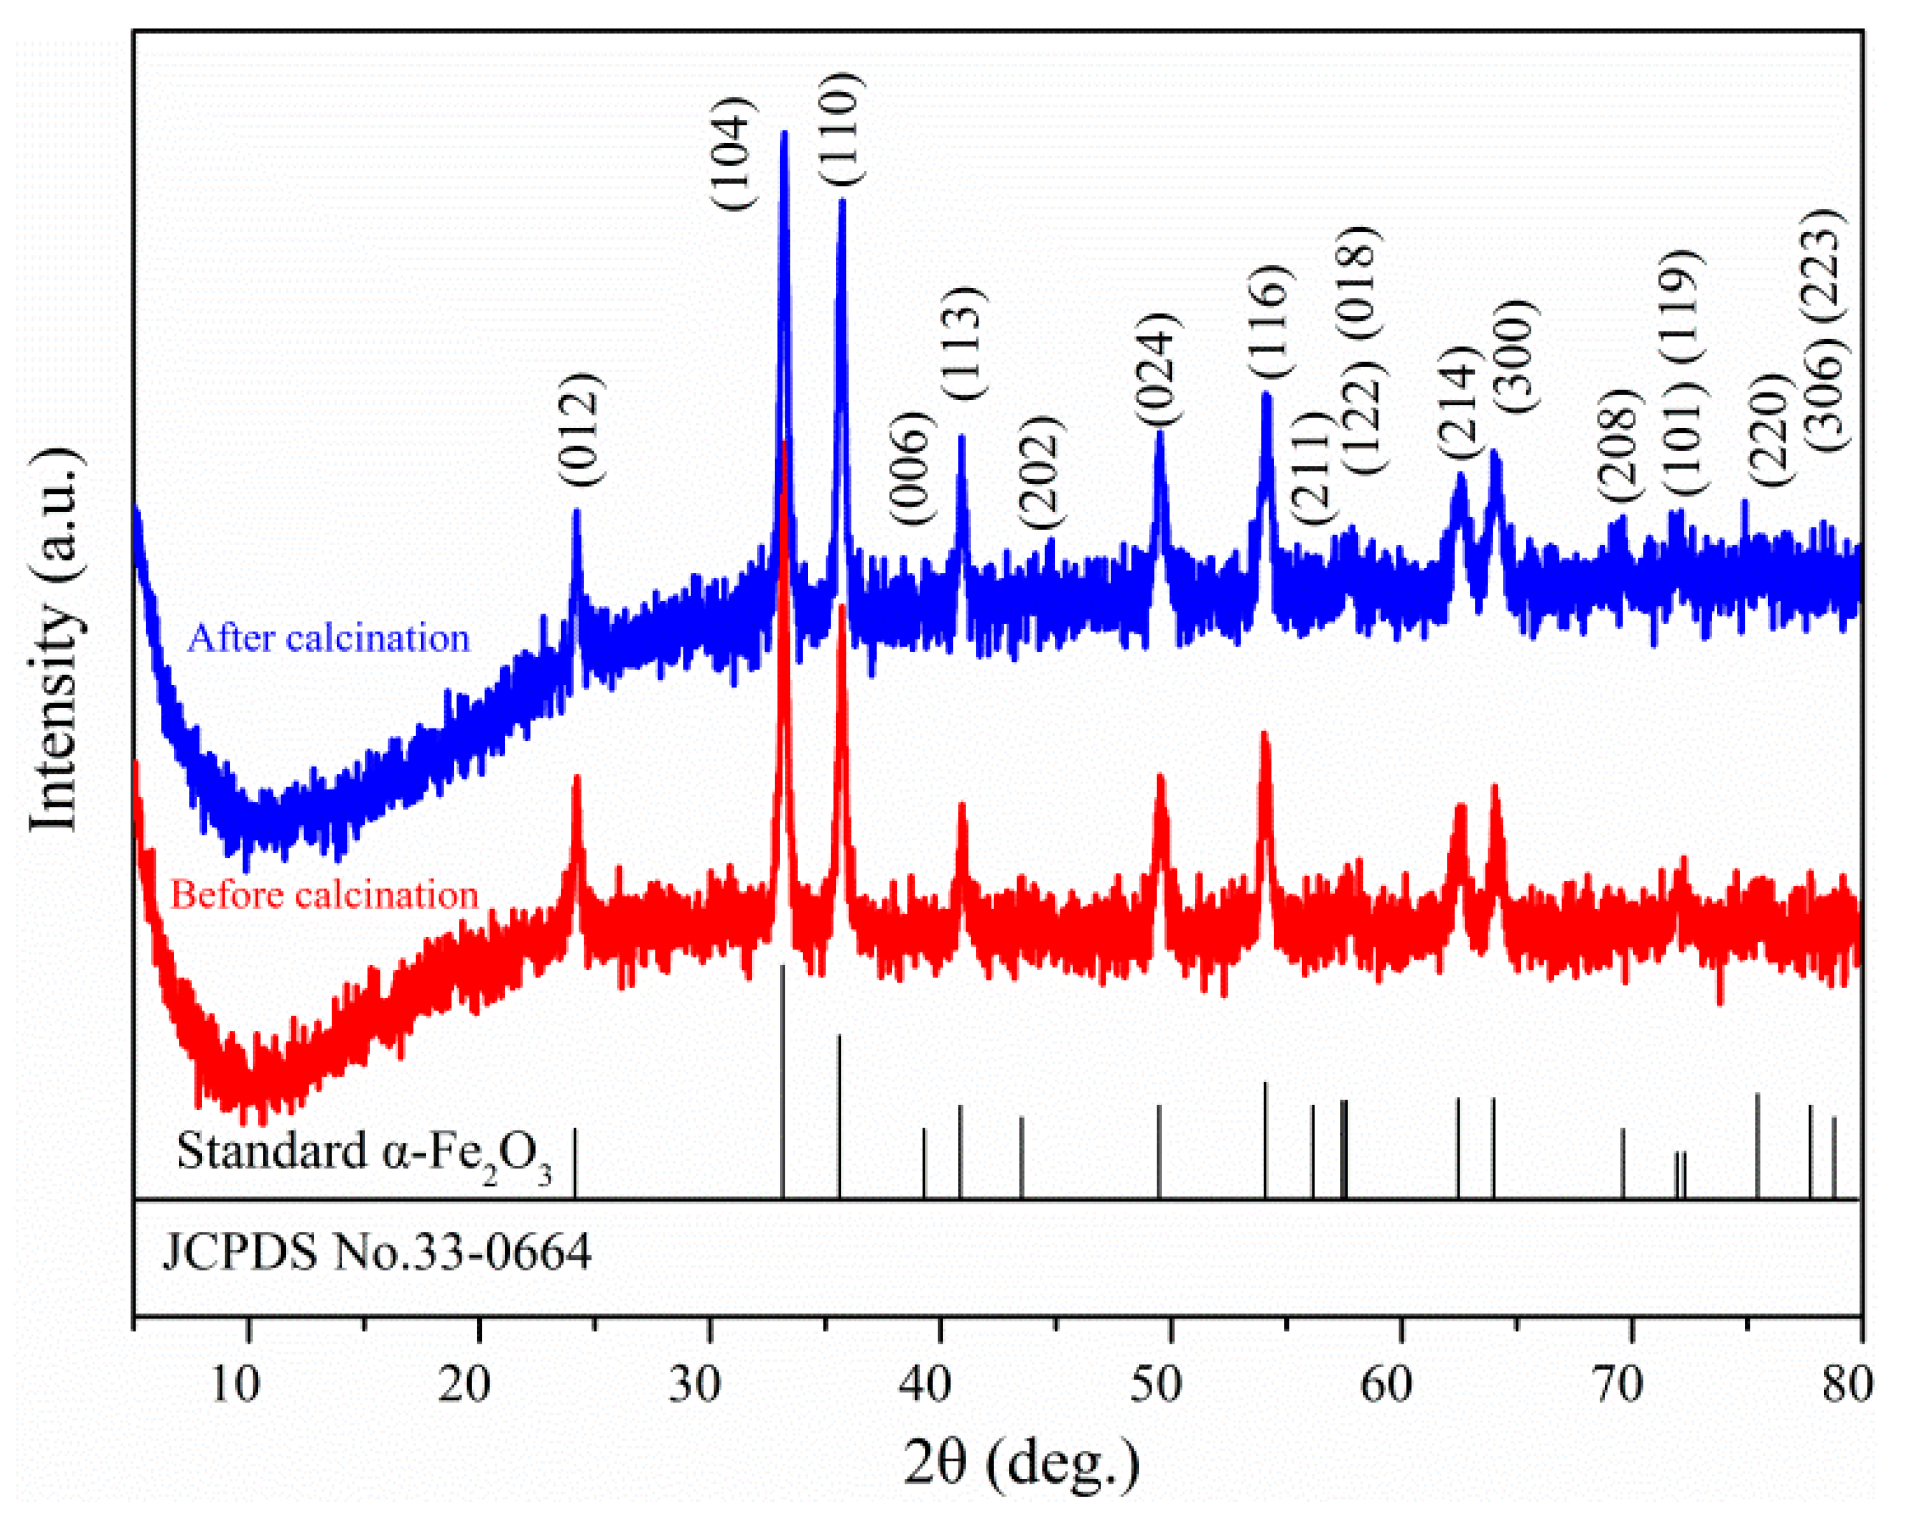
Figure 3.
(a) Raman spectrums and (b) FTIR of α-Fe2O3@C nanoparticle composite before and after calcination.
Figure 3.
(a) Raman spectrums and (b) FTIR of α-Fe2O3@C nanoparticle composite before and after calcination.
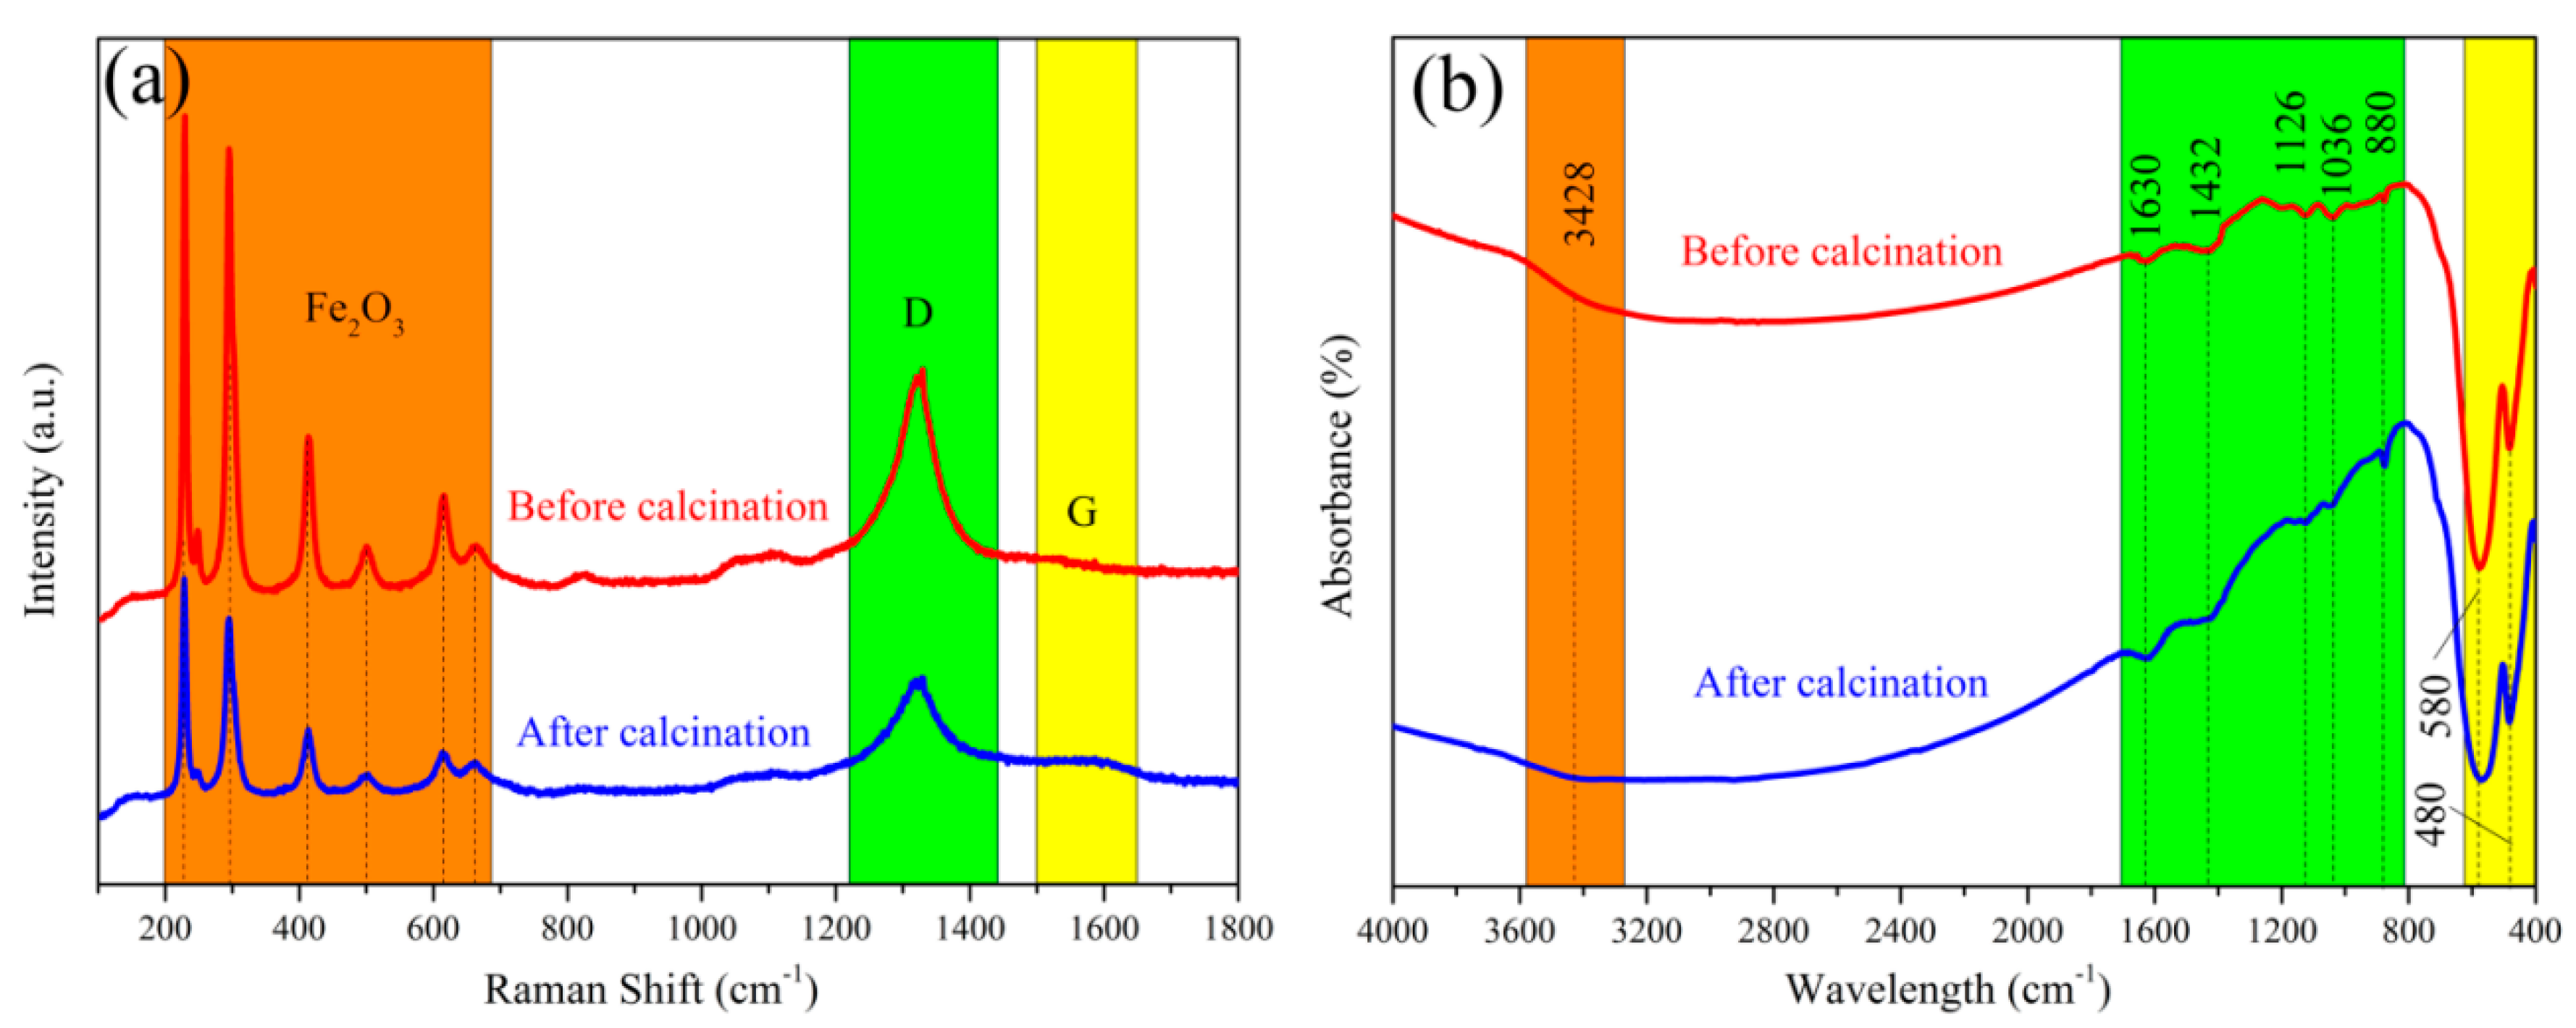
Figure 4.
(a–c) field scanning electron microscopy (FESEM) and (d–f) transmission electron microscopy (TEM) images of α-Fe2O3@C nanoparticle composite. The insert is the selected area electron diffraction (SAED) image.
Figure 4.
(a–c) field scanning electron microscopy (FESEM) and (d–f) transmission electron microscopy (TEM) images of α-Fe2O3@C nanoparticle composite. The insert is the selected area electron diffraction (SAED) image.
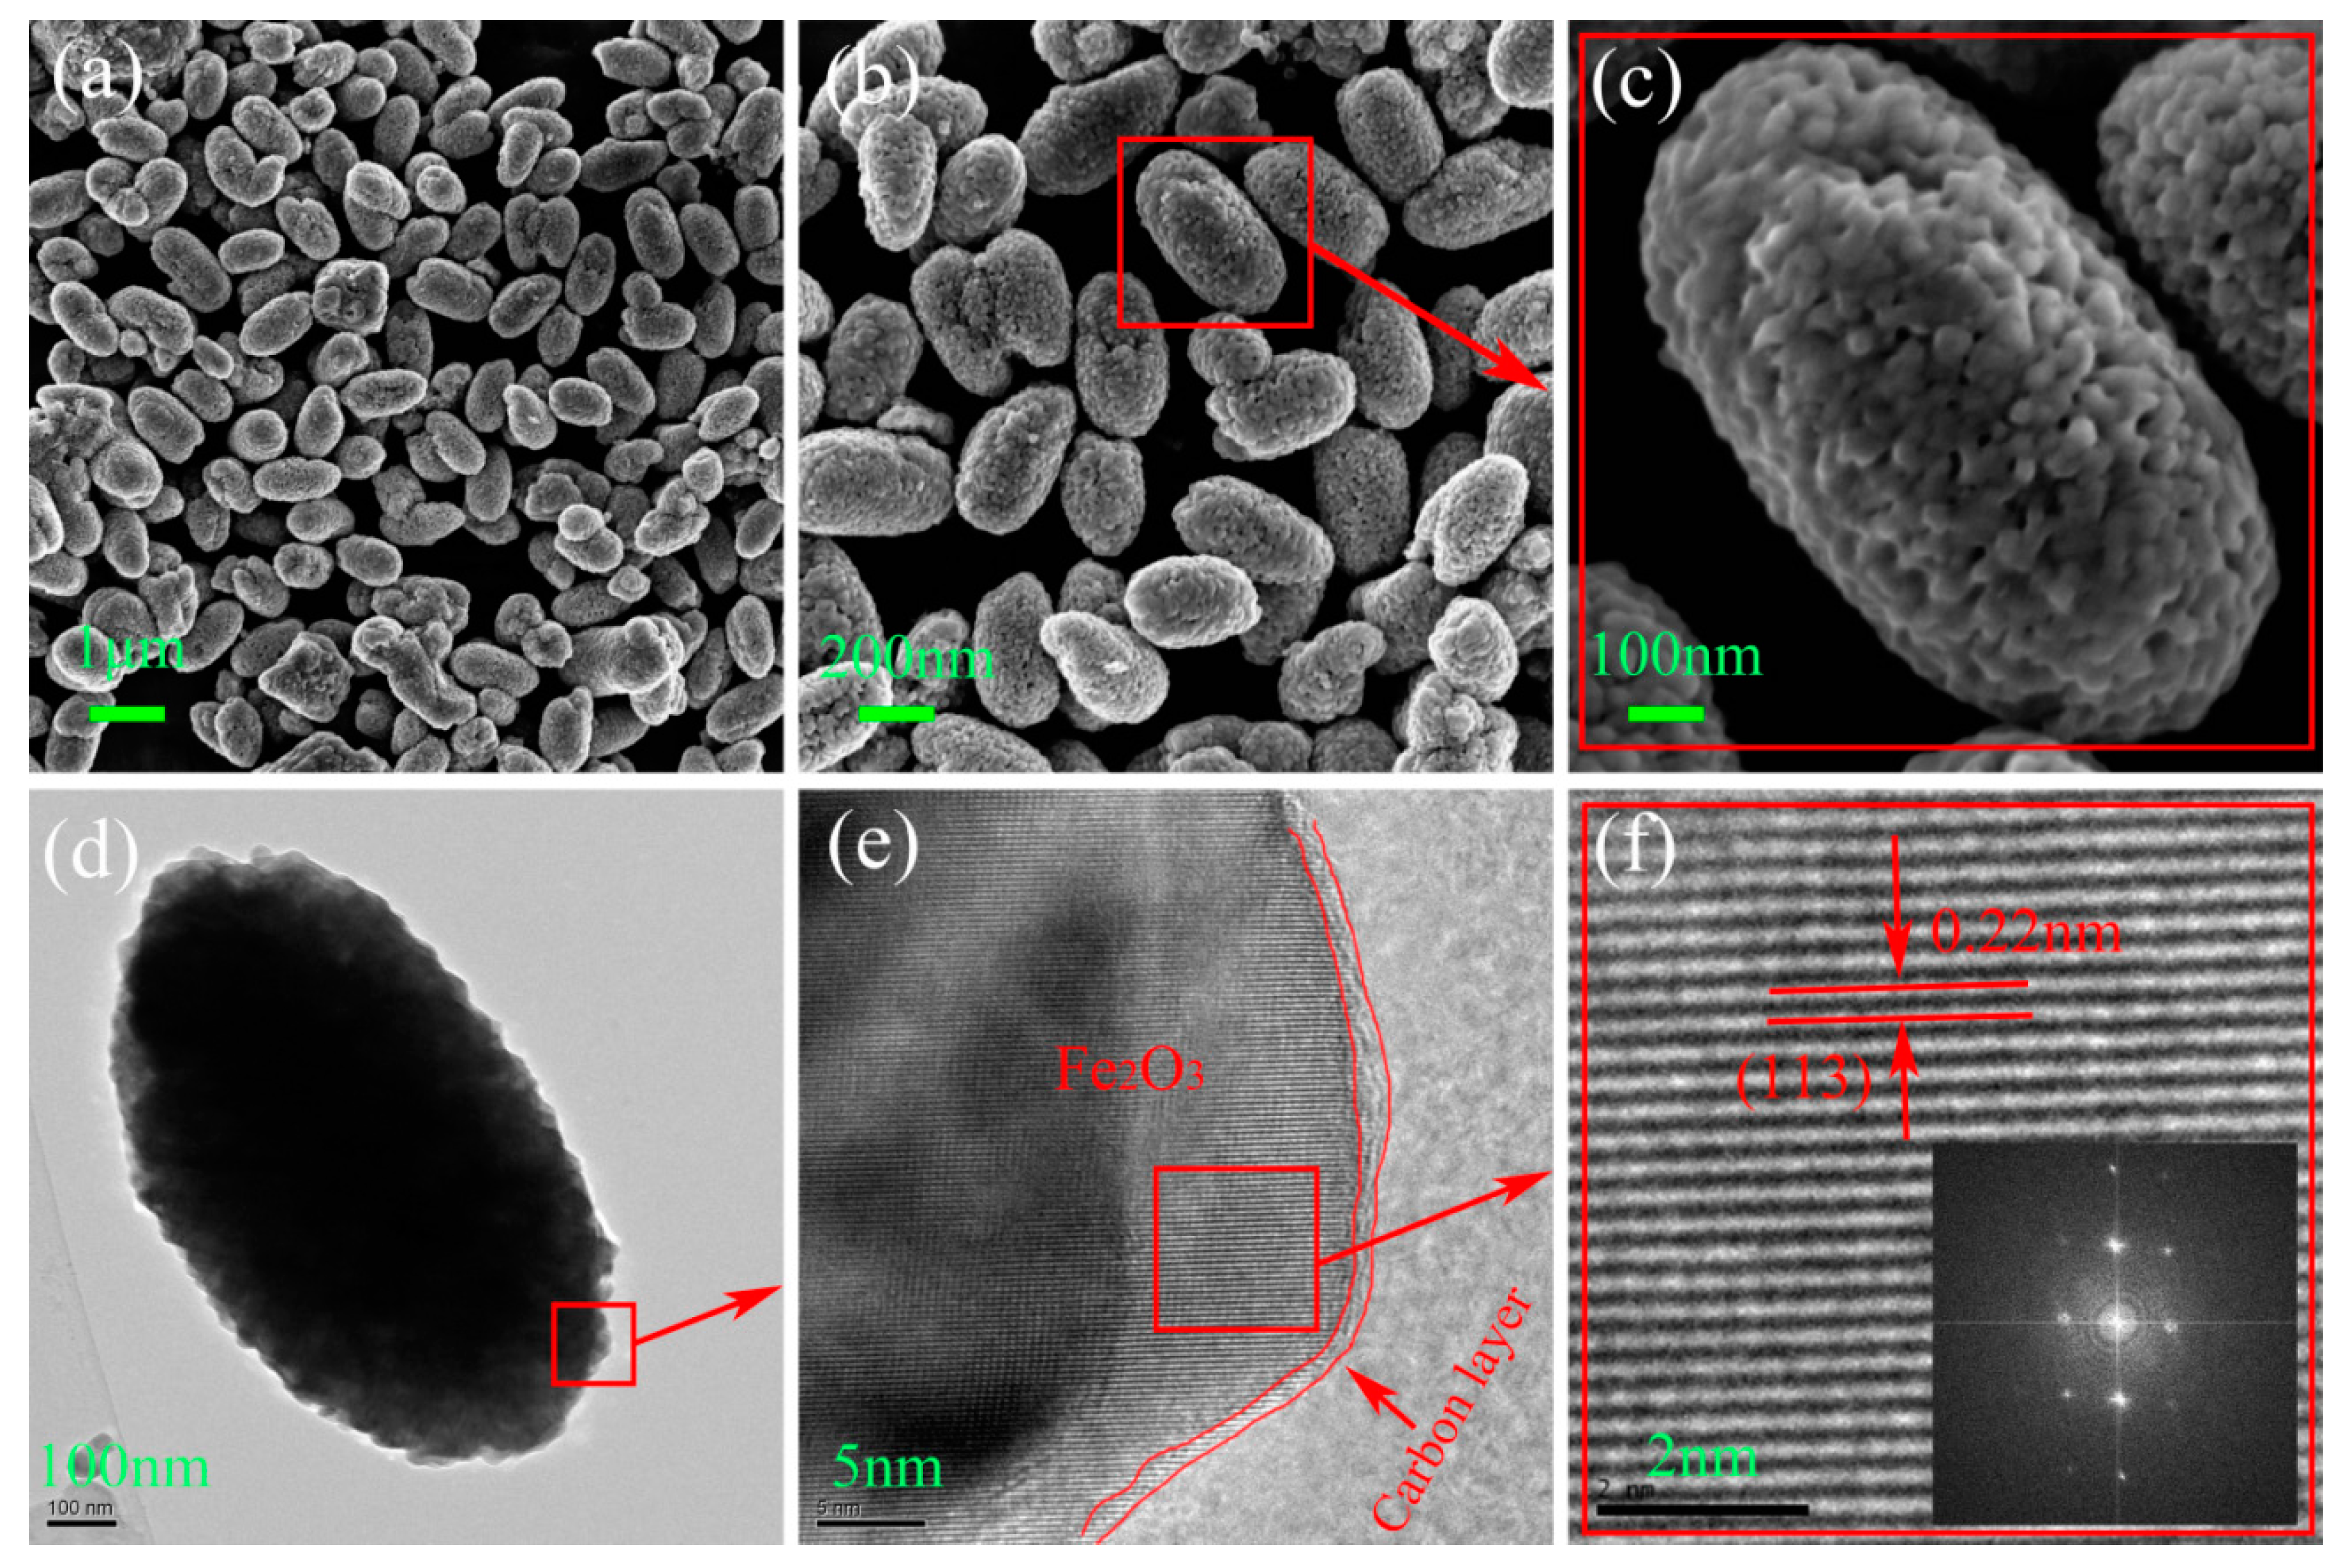
Figure 5.
Energy dispersive X-ray spectrometry (EDS) element mapping of α-Fe2O3@C nanoparticle composite. (a) The original FESEM images; (b) the total element mapping; (c) the Fe Kα1 mapping; (d) the O Kα1 mapping; (e) the C Kα1 mapping; (f) the EDS spectra of α-Fe2O3@C nanoparticle.
Figure 5.
Energy dispersive X-ray spectrometry (EDS) element mapping of α-Fe2O3@C nanoparticle composite. (a) The original FESEM images; (b) the total element mapping; (c) the Fe Kα1 mapping; (d) the O Kα1 mapping; (e) the C Kα1 mapping; (f) the EDS spectra of α-Fe2O3@C nanoparticle.
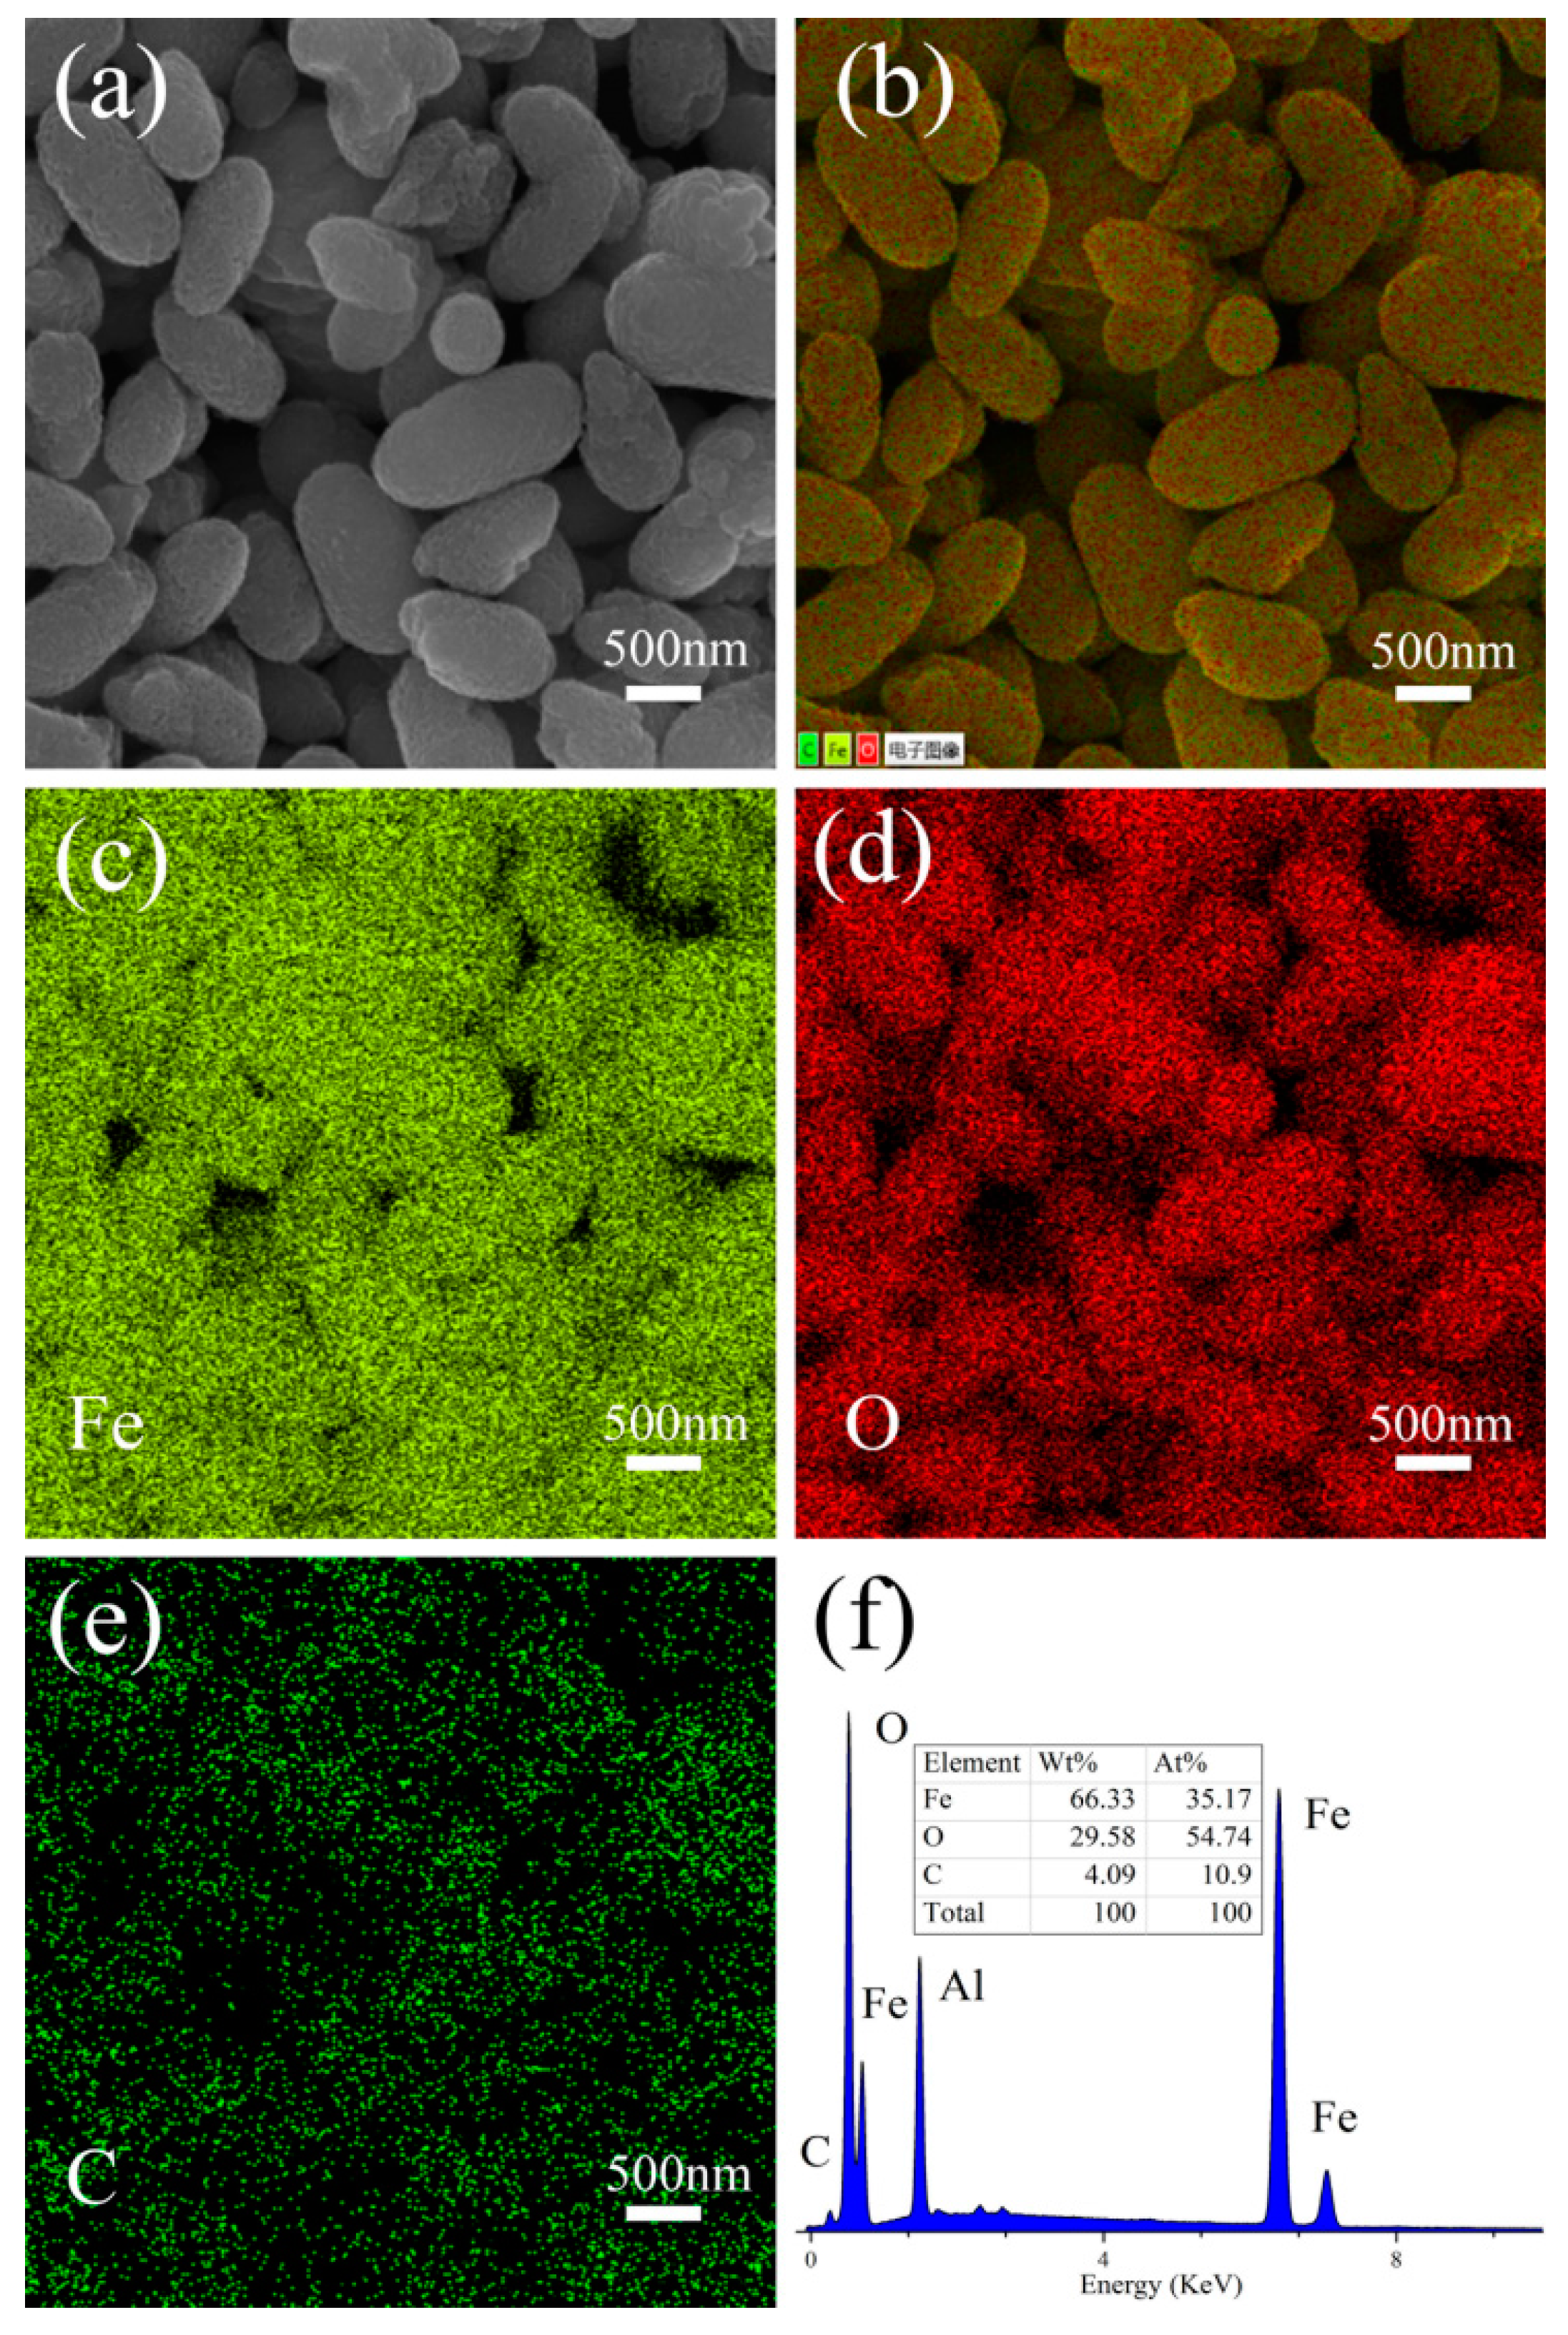
Figure 6.
X-ray photoelectron spectroscopy (XPS) spectrum of α-Fe2O3@C nanoparticle composite. (a) The full-range XPS survey and the high-resolution spectrum of (b) Fe2p, (c) O1s and (d) C1s.
Figure 6.
X-ray photoelectron spectroscopy (XPS) spectrum of α-Fe2O3@C nanoparticle composite. (a) The full-range XPS survey and the high-resolution spectrum of (b) Fe2p, (c) O1s and (d) C1s.
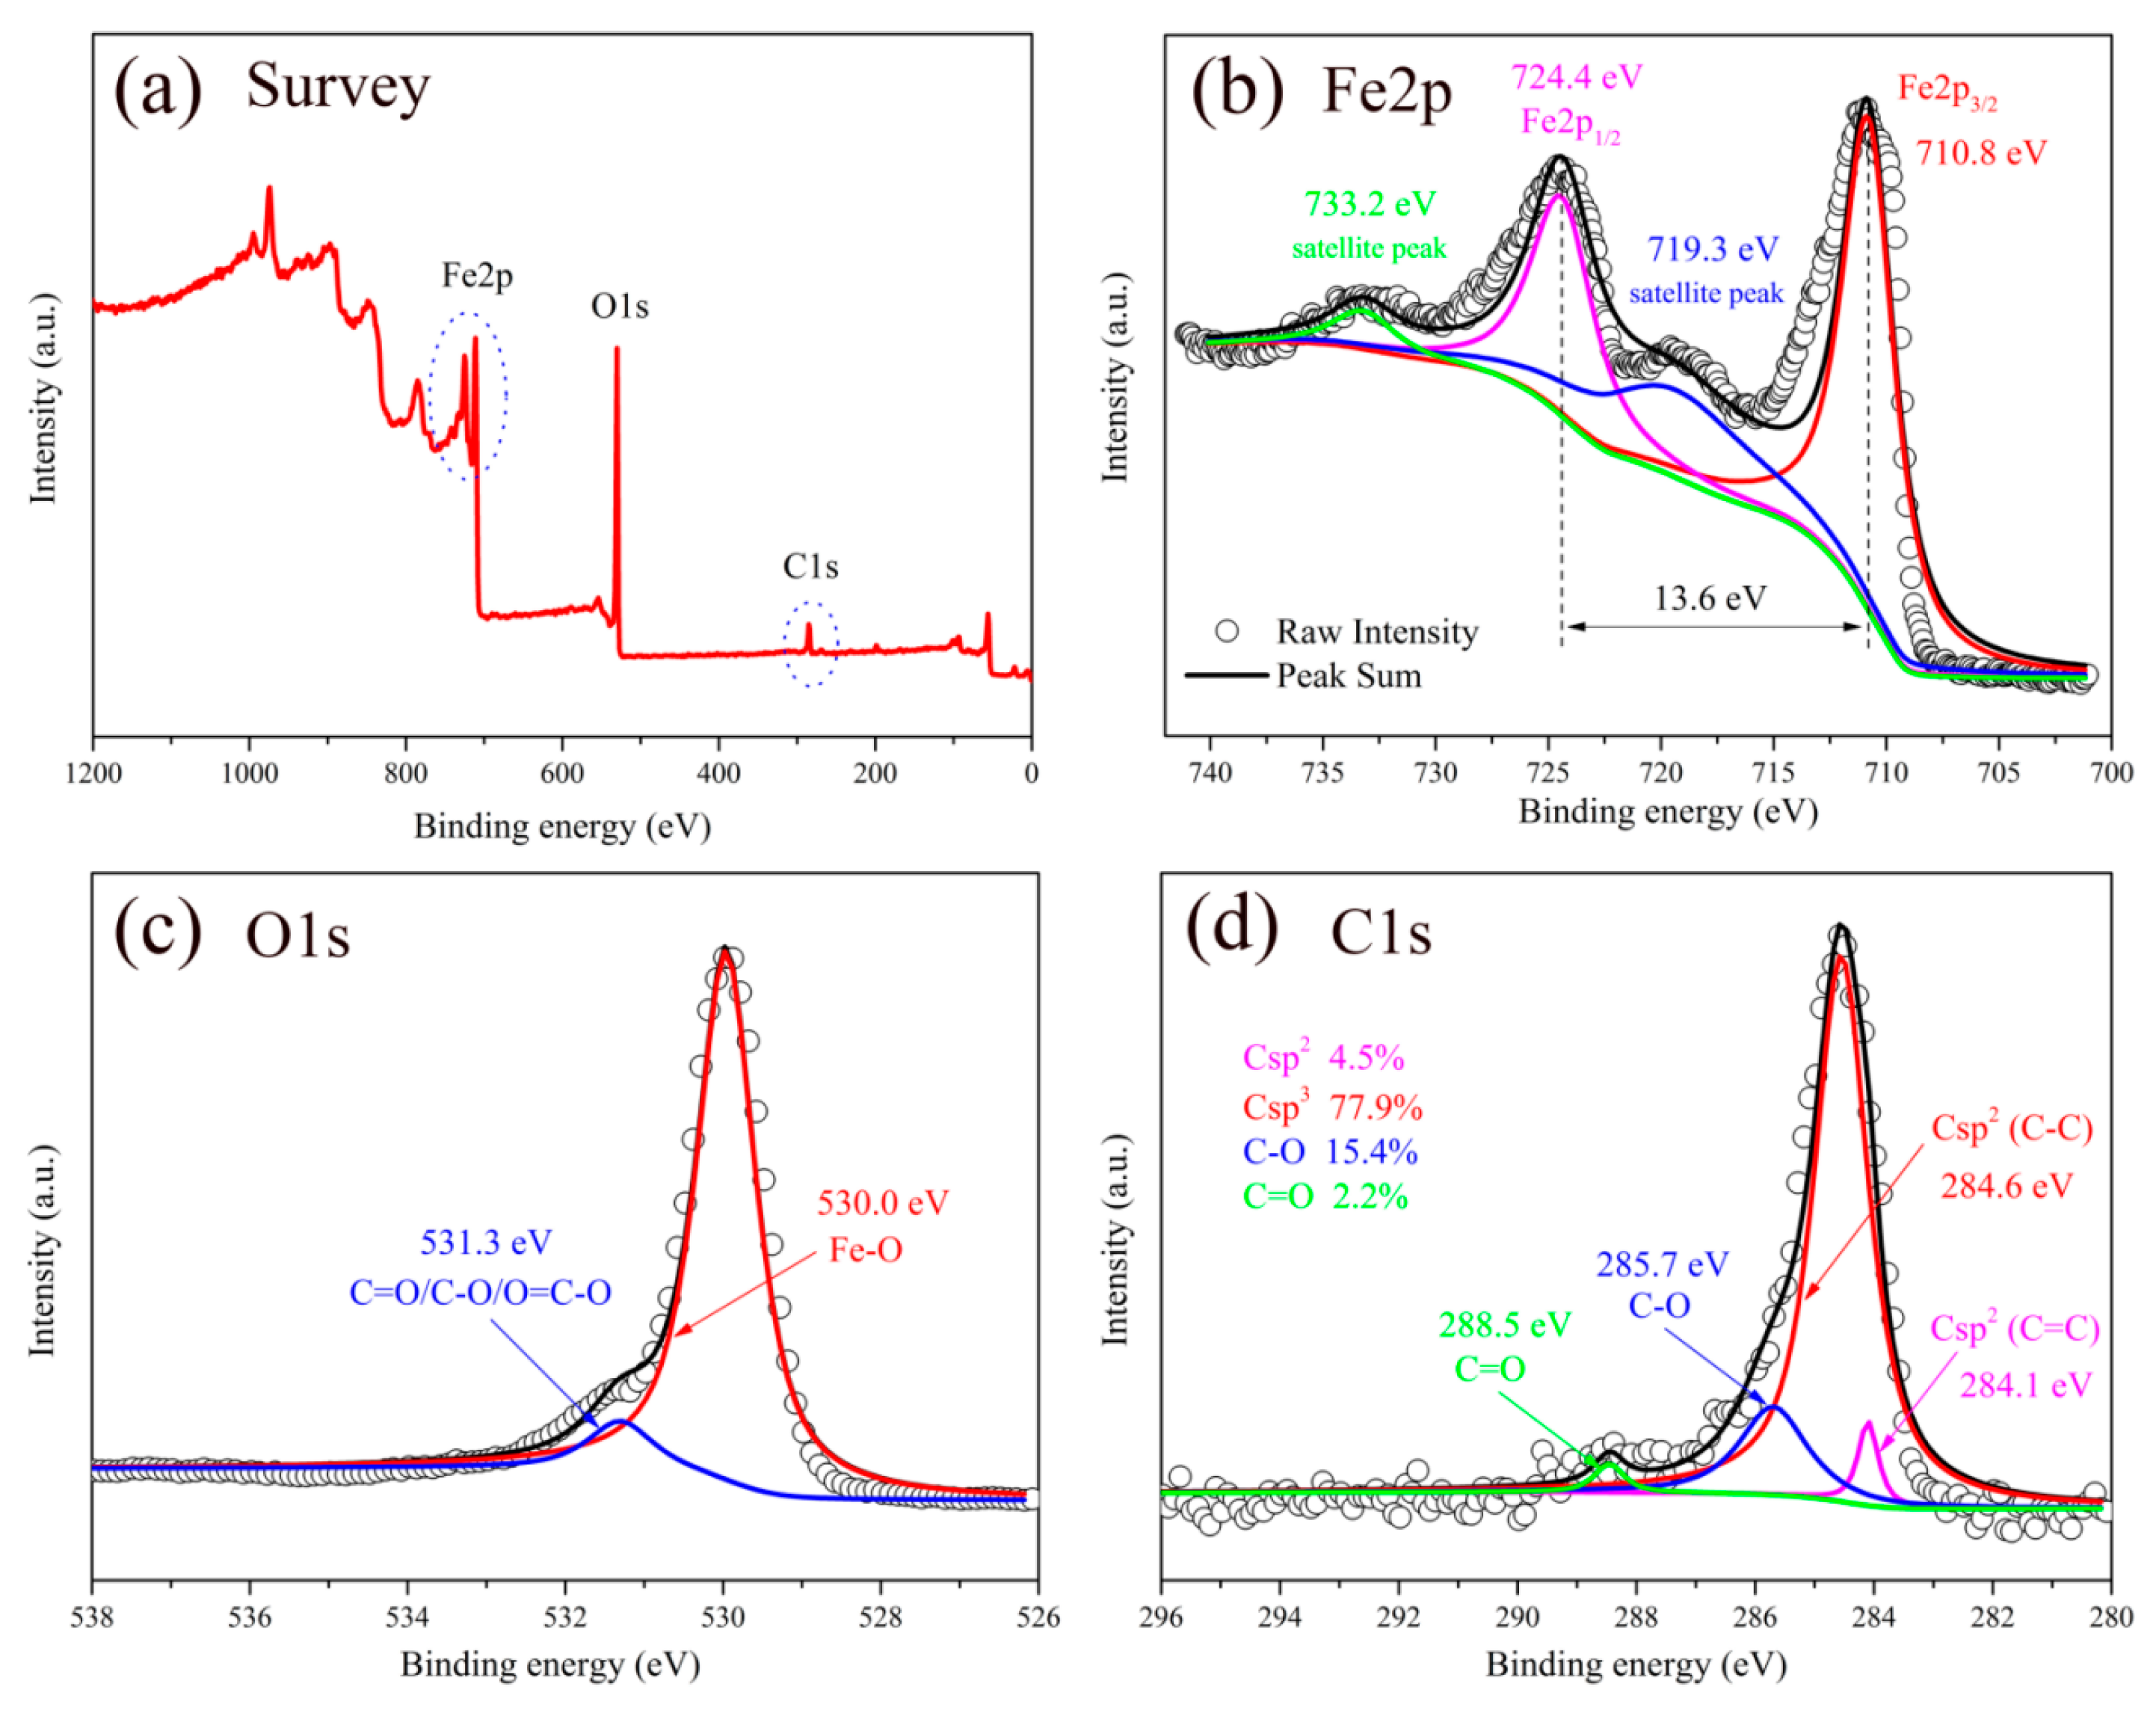
Figure 7.
N2 adsorption-desorption isotherm of α-Fe2O3@C nanoparticle composite. The insert is BJH pore size distribution.
Figure 7.
N2 adsorption-desorption isotherm of α-Fe2O3@C nanoparticle composite. The insert is BJH pore size distribution.

Figure 8.
(a) CV curves of α-Fe2O3@C electrodes at different scan rate; (b) charge-discharge curves of α-Fe2O3@C electrodes at different current density; (c) the specific capacitance of α-Fe2O3@C electrodes at different current densities; (d) cycling stability of α-Fe2O3@C electrodes at the current density of 10 Ag−1, the insert is the last 10 charge-discharge cycles.

Table 1.
Comparison of Fe2O3-based electrode reported in recent literature using three-electrode system for supercapacitor applications.
Table 1.
Comparison of Fe2O3-based electrode reported in recent literature using three-electrode system for supercapacitor applications.
| Fe2O3-Based Electrode | Synthesis Method | Electrolyte | Potential Range (V) | Specific Capacitance (Fg−1)/(Ag−1) | Reference (year) |
|---|---|---|---|---|---|
| Fe2O3-graphene | solution-based hydrothermal | 2 M KOH | −0.85–0 | 151.8/1.0 94/16 | [46] (2012) |
| Porous α-Fe2O3 | Sol-gel route | 0.5 M Na2SO3 | −0.8–0 | 193/1.0 90/5.0 | [47] (2013) |
| g-C3N4/α-Fe2O3 | ionic liquid assisted solvothermal | 2.5 M Li2SO4 | −1–0 | 260/0.5 87/5.0 | [20] (2014) |
| N-doped grphene/Fe2O3 | hydrothermal | 1 M Na2SO4 | −0.85–(−0.1) | 260.1/2.0 145.1/5.0 | [48] (2014) |
| N-rGO/Fe2O3 | hydrothermal | 1 M KOH | −1~0 | 268.4/2.0 137/5.0 | [17] (2015) |
| α-Fe2O3 | Template method | 6 M KOH | −1.2–(−0.5) | 330/0.5 | [49] (2016) |
| Fe2O3 NDs@N-graphene | one-pot solvothermal | 2 M KOH | −1.0–0 | 274/1.0 201/5.0 | [50] (2016) |
| Fe2O3@MnO2 | two-step method | 3 M KOH | −0.4–0.4 | 289.9/1.0 118.3/5.0 | [40] (2017) |
| Fe2O3@C-rGO | hydrothermal | 1 M Na2SO4 | −0.5–0.5 | 211.4/0.5 177.2/20 | [51] (2017) |
| α-Fe2O3 NTs/rGO | hydrothermal | 1 M Na2SO4 | −0.8–0 | 262/1.0 196.3/5.0 | [52] (2017) |
| Fe2O3@C | hydrothermal self-assembly | 6 M KOH | −1.0–(−0.3) | 304.9/2.0 162.8/20 | This work |
© 2017 by the authors. Licensee MDPI, Basel, Switzerland. This article is an open access article distributed under the terms and conditions of the Creative Commons Attribution (CC BY) license (http://creativecommons.org/licenses/by/4.0/).
Share and Cite
MDPI and ACS Style
Yan, Y.; Tang, H.; Wu, F.; Wang, R.; Pan, M. One-Step Self-Assembly Synthesis α-Fe2O3 with Carbon-Coated Nanoparticles for Stabilized and Enhanced Supercapacitors Electrode. Energies 2017, 10, 1296. https://doi.org/10.3390/en10091296
AMA Style
Yan Y, Tang H, Wu F, Wang R, Pan M. One-Step Self-Assembly Synthesis α-Fe2O3 with Carbon-Coated Nanoparticles for Stabilized and Enhanced Supercapacitors Electrode. Energies. 2017; 10(9):1296. https://doi.org/10.3390/en10091296
Chicago/Turabian StyleYan, Yizhi, Haolin Tang, Fan Wu, Rui Wang, and Mu Pan. 2017. "One-Step Self-Assembly Synthesis α-Fe2O3 with Carbon-Coated Nanoparticles for Stabilized and Enhanced Supercapacitors Electrode" Energies 10, no. 9: 1296. https://doi.org/10.3390/en10091296
Note that from the first issue of 2016, this journal uses article numbers instead of page numbers. See further details here.