Chemical Looping Combustion of Hematite Ore with Methane and Steam in a Fluidized Bed Reactor

National Energy Technology Laboratory, 3610 Collins Ferry Road, Morgantown, WV 26505, USA
*
Author to whom correspondence should be addressed.
Energies 2017, 10(8), 1179; https://doi.org/10.3390/en10081179
Submission received: 2 June 2017
/
Revised: 25 July 2017
/
Accepted: 2 August 2017
/
Published: 10 August 2017
(This article belongs to the Section I: Energy Fundamentals and Conversion)
Abstract
:Chemical looping combustion is considered an indirect method of oxidizing a carbonaceous fuel, utilizing a metal oxide oxygen carrier to provide oxygen to the fuel. The advantage is the significantly reduced energy penalty for separating out the CO2 for reuse or sequestration in a carbon-constrained world. One of the major issues with chemical looping combustion is the cost of the oxygen carrier. Hematite ore is a proposed oxygen carrier due to its high strength and resistance to mechanical attrition, but its reactivity is rather poor compared to tailored oxygen carriers. This problem is further exacerbated by methane cracking, the subsequent deposition of carbon and the inability to transfer oxygen at a sufficient rate from the core of the particle to the surface for fuel conversion to CO2. Oxygen needs to be readily available at the surface to prevent methane cracking. The purpose of this work was to demonstrate the use of steam to overcome this issue and improve the conversion of the natural gas to CO2, as well as to provide data for computational fluid dynamics (CFD) validation. The steam will gasify the deposited carbon to promote the methane conversion. This work studies the performance of hematite ore with methane and steam mixtures in a 5 cm fluidized bed up to approximately 140 kPa. Results show an increased conversion of methane in the presence of steam (from 20–45% without steam to 60–95%) up to a certain point, where performance decreases. Adding steam allows the methane conversion to carbon dioxide to be similar to the overall methane conversion; it also helped to prevent carbon accumulation from occurring on the particle. In general, the addition of steam to the feed gas increased the methane conversion. Furthermore, the addition of steam caused the steam methane reforming reaction to form more hydrogen and carbon monoxide at higher steam and methane concentrations, which was not completely converted at higher concentrations and at these residence times.
1. Introduction
According to the Intergovernmental Panel on Climate Change, the unprecedented rate of global warming in the past few centuries is due to anthropogenic greenhouse gas emissions, and these emissions need to be curtailed to prevent a further increase in temperature [1]. While developments in solar and wind power generation are occurring, there is still a need for baseload power on the electric grid, which cannot be attained using only renewable technologies. Thus, there will be a need for baseload plants, which in the United States are mainly based on fossil fuel technology. A proposed solution for utilizing baseload fossil fuel plants under a carbon-constrained scenario is carbon capture and sequestration. Examples of technologies are categorized into post-combustion, pre-combustion, and oxy-combustion capture [2,3].
One example of an oxy-combustion technology being pursued is chemical looping combustion, as shown in Figure 1. Chemical looping combustion splits the conventional combustion reaction into two steps, thereby resulting in a separate stream of carbon dioxide flue gas that is free of nitrogen. Instead of directly burning the fuel in the presence of air, oxidation of the fossil fuel occurs using a metal oxide oxygen carrier in what is known as a fuel reactor. If the reaction is complete, the resulting flue gas is composed entirely of carbon dioxide and steam. The resulting reduced metal oxide is sent to a second reactor, called the air reactor, which oxidizes the reduced metal oxide using air. The oxidation of the reduced metal oxide is exothermic, and the energy from this reaction can be recuperated to produce electricity as in a traditional steam cycle.
Originally, chemical looping combustion was designed as a more efficient combustion power plant, proposed by Ishida et al. [4]. The original design incorporated reduction and oxidation of metal oxides at high pressure so that gas turbines could be used, in the form of a combined cycle type power plant. However, in recent years, research has focused more on atmospheric pressure systems because of the operational challenges of solids circulation at high pressure, as CO2 separation has a minimal energy penalty even at atmospheric pressure. In addition to using the chemical looping scheme for combustion, the scheme has been proposed as a method to produce syngas [5], hydrogen [6], maleic anhydride [7], methanol [8], and sulfuric acid [9].
The design of the fuel reactor is critical for chemical looping combustion, as it must convert the fuel completely to CO2 and steam with a reasonable residence time. The simplest configuration uses a fixed bed which is cycled between oxidation states, such as that described by Kimball et al. [10]. The advantage of cycling fixed beds is the simplicity of its design, as there is no need for hot solids transport, minimizing the mechanical attrition of the oxygen carrier. However, the transient nature of the reaction with the oxygen carrier requires that there be multiple fixed beds cycled in a proper sequence to get a continuous stream of CO2 of consistent quality. Another fuel reactor design incorporates a fluidized bed, either in the form of a dense phase bubbling fluidized bed or a circulating fluidized bed [11], which allows for continuous production of CO2, and the design mimics that of circulating fluidized bed combustion of coal. A disadvantage of bubbling fluidized beds and circulating fluidized beds are that reactant fuel tends to bypass contact with the solids through bubbles. The countercurrent moving bed fuel reactor attempts to overcome this by causing the bed to be more like a plug flow reactor [12]. Detailed reviews of the various fuel reactor and system designs have been published elsewhere [13].
One of the main technical challenges to commercializing chemical looping combustion is the cost of the makeup oxygen carrier, since it is expected that the carrier will undergo chemical and mechanical stress, subsequently degrading during the process [14,15]. Thus, it is proposed to use low-cost oxygen carriers over manufactured oxygen carriers tailored for high conversion of fuel. An example of a low-cost carrier is hematite ore, which is also high in mechanical strength. The challenge with using hematite ore is its low reactivity with fossil fuels, such as natural gas. One proposed solution is to inject steam into the natural gas feed to improve the conversion. This also has the effect of suppressing carbon deposition on the particle, preventing carbon carryover into the air reactor and subsequent loss of carbon capture.
Compared to the direct reduction of carbon monoxide or hydrogen, the reduction of iron oxide is complicated, with many potential reactions occurring on the surface of the carrier and perhaps in the gas phase. The following list of reactions is possible with hematite ore as the oxygen carrier. The reaction of iron-(III) to iron-(II,III) with methane, hydrogen, and carbon monoxide is
3Fe2O3 (s) + CH4 → 2Fe3O4 (s) + CO + 2H2
3Fe2O3 (s) + H2 → 2Fe3O4 (s) + H2O
3Fe2O3 (s) + CO → 2Fe3O4 (s) + CO2
The reaction of iron-(II,III) to iron-(II) with natural gas, hydrogen, and carbon monoxide is
Fe3O4 (s) + CH4 ⇌ 3FeO (s) + CO + 2H2
Fe3O4 (s) + H2 ⇌ 3FeO (s) + H2O
Fe3O4 (s) + CO ⇌ 3FeO (s) + CO2
In addition to the reducing gases reacting with lattice oxygen in the hematite ore, the following gaseous phase reactions can occur, such as reforming methane with steam or CO2:
and the water-gas shift reaction
H2O + CH4 ⇌ 3H2 + CO
CO2 + CH4 ⇌ 2H2 + 2CO
CO + H2O ⇌ CO2 + H2
As surface oxygen becomes depleted on the particle, methane cracking can occur, causing the formation of solid carbon on the surface and gaseous hydrogen. Additionally, if carbon monoxide is present, the Boudouard reaction can occur. Thus, the reactions for carbon deposition on the particle are:
CH4 ⇌ C (s) + 2H2
2CO ⇌ CO2 + C (s)
In addition, steam helps to gasify the deposited carbon.
H2O + C (s) ⇌ CO + H2
Iron oxide has been extensively studied with methane, isothermally in thermogravimetric analyzers [16,17,18,19,20,21,22,23,24], in fixed bed reactors [25,26,27,28,29], and in fluidized bed reactors [30,31,32,33,34]. Cabello et al. [19] studied the kinetics of methane reduction for an iron-oxide/alumina oxygen carrier in a thermogravimetric analyzer. They identified two steps in the reduction process, with the first step being the phase-boundary (reaction) controlled near the beginning of reduction, and the second step being limiting gas diffusion, through the iron–aluminum spinel shell that forms as reduction of the outer layer proceeds. Using the grain model combined with the unreactive shrinking core model for the individual grains, they found that the reduction reaction order with methane was 0.25 with an activation energy of 66 kJ/mol. Similarly, Nasr and Plucknett [20] studied a raw hematite material (around 98% Fe2O3) in a thermogravimetric analyzer (TGA) and found a similar reaction mechanism. However, they used a crystal phase-change model (i.e., Avrami-Erofe’ev) to capture the reaction kinetics throughout the entire reduction due to the phase change of rhombohedral hematite changing to cubic magnetite during reduction. The activation energy determined from experiments was higher (around 215 kJ/mol) than for the tailored and highly reactive carrier studied by Cabello et al., most likely due to the lower reactivity of raw hematite. Luo et al. [21] studied a raw hematite ore (around 82% Fe2O3) in addition to two tailored oxygen carriers. The reaction of methane with raw hematite was determined to be phase-boundary controlled only. Ksepko et al. [24] studied a Sinai ore and found that the reduction reaction with methane had an effective activation energy around 35.3 kJ/mol, which is lower than reported for other ores; this was probably due to the presence of manganese oxides, which can produce an oxygen uncoupling effect. They also indicated that the reduction data fit to a Jander’s diffusion model, indicating that the slow step is the diffusion of iron ions through the outer shell. Monazam et al. [17] also studied a raw hematite, determining that the reaction rate was both phase-boundary and nucleation rate controlled, in a parallel fashion, with the rate exponent for methane concentration being 0.636 for the controlled reaction rate and around one for the controlled nucleation. An ilmenite ore has been tested with carbon monoxide as a reducing gas at up to eight bar of partial pressure (51 bar total pressure) by Ridha et al. [35]. They found that increasing the carbon monoxide partial pressure had no effect on the morphology and that calcination caused the formation of rutile and ferric pseudobrookite with a simultaneous decrease in ilmenite [35].
While TGA experiments are important for carrier screening and fundamental mechanism deduction, the conditions are not realistic for determining operational feasibility, such as in a fluidized bed, where there may be mass transfer limitations between the bubble and emulsion that limit the conversion of reactant gases. Breault et al. [34] studied the reduction of a raw hematite ore in a 5 cm fluidized bed using methane to determine the effect of cycle time on pretreated and untreated hematite ore. Their work determined that heating the carrier to a higher temperature in air than the temperature for reduction–oxidation reactions allowed for the carrier grain structure to stabilize, therefore enabling a consistent surface area and conversion results over all the redox cycles. Siriwardane et al. [30] also studied a raw hematite ore and found similar conversions for unmodified hematite, but found that the addition of magnesium oxide increased the methane conversion by around 20 percentage points.
On the other hand, there seems to be a dearth of literature regarding the reaction kinetics of steam with oxygen carriers in fluidized beds. This paper attempts to bridge that gap by adding steam as part of the reactant gas to observe the effect on conversion during the reduction reaction. Thus, the purpose of the work is to fill the data gap in the literature on the chemical looping combustion of iron oxygen carriers with methane in the presence of steam and provide useful data for further modeling, such as CFD simulations. A 5 cm small fluidized bed reactor, used in previous studies such as Breault et al. [34] and Siriwardane et al. [30], was used for reducing a raw hematite oxygen carrier over multiple cycles and under different conditions. A partial trial matrix consisting of the effects of reaction temperature, methane and steam concentrations was developed to explore the design space. An ordinary least squares analysis was performed to ascertain general (qualitative) trends of the methane conversion and oxygen carrier conversion on the changing independent parameters.
2. Experimental Methods
Reduction and oxidation of the hematite ore was performed in a small fluidized bed as shown in Figure 2. The setup consists of a Hastelloy tube 5 cm in diameter, with four bubble caps at the bottom. Each bubble cap consists of a modified bolt with three holes drilled underneath the head of the bolt; the holes have a drilled diameter of approximately 1.19 mm (3/64 inches). The reactor consists of three sections: the plenum, where the gases enter through the bubblecaps, the fluidized bed, which is the raw hematite material, and the freeboard region, which expands at a region higher up to minimize the loss of oxygen carrier. The reactor consists of an outer shell which contains the plenum and an interchangeable liner which holds the bed material. The reactant gases are premixed upstream and introduced into the plenum, namely nitrogen, methane, argon, and air, which are controlled using mass flow controllers from Alicat Scientific. The maximum flows for nitrogen, methane, and argon are 20 standard liters per minute (SLPM) with accurate control down to 0.1 SLPM, and the maximum flow for air is 100 SLPM with accurate control down to 0.5 SLPM. The steam comes from a vaporizer system from Brooks Instruments. The natural gas consisted of a tank of ultra-high purity (UHP) methane (99.999%). The water, nitrogen and air were provided in house. Data collected included reactor temperature, static plenum pressure, bed differential pressure, gaseous flow rates in, and gas analysis data (mass spectrometer, non-disperse infrared). Gas composition was measured using a mass spectrometer from Thermofisher Scientific (Prima BT) and non-disperse infrared analyzers from Siemens (Ultramat 23). Gases exit from the reactor and enter a filter, where fines are collected. The outlet contains a large needle valve that allows the system to have enough back pressure for the sample to flow to the mass spectrometer.
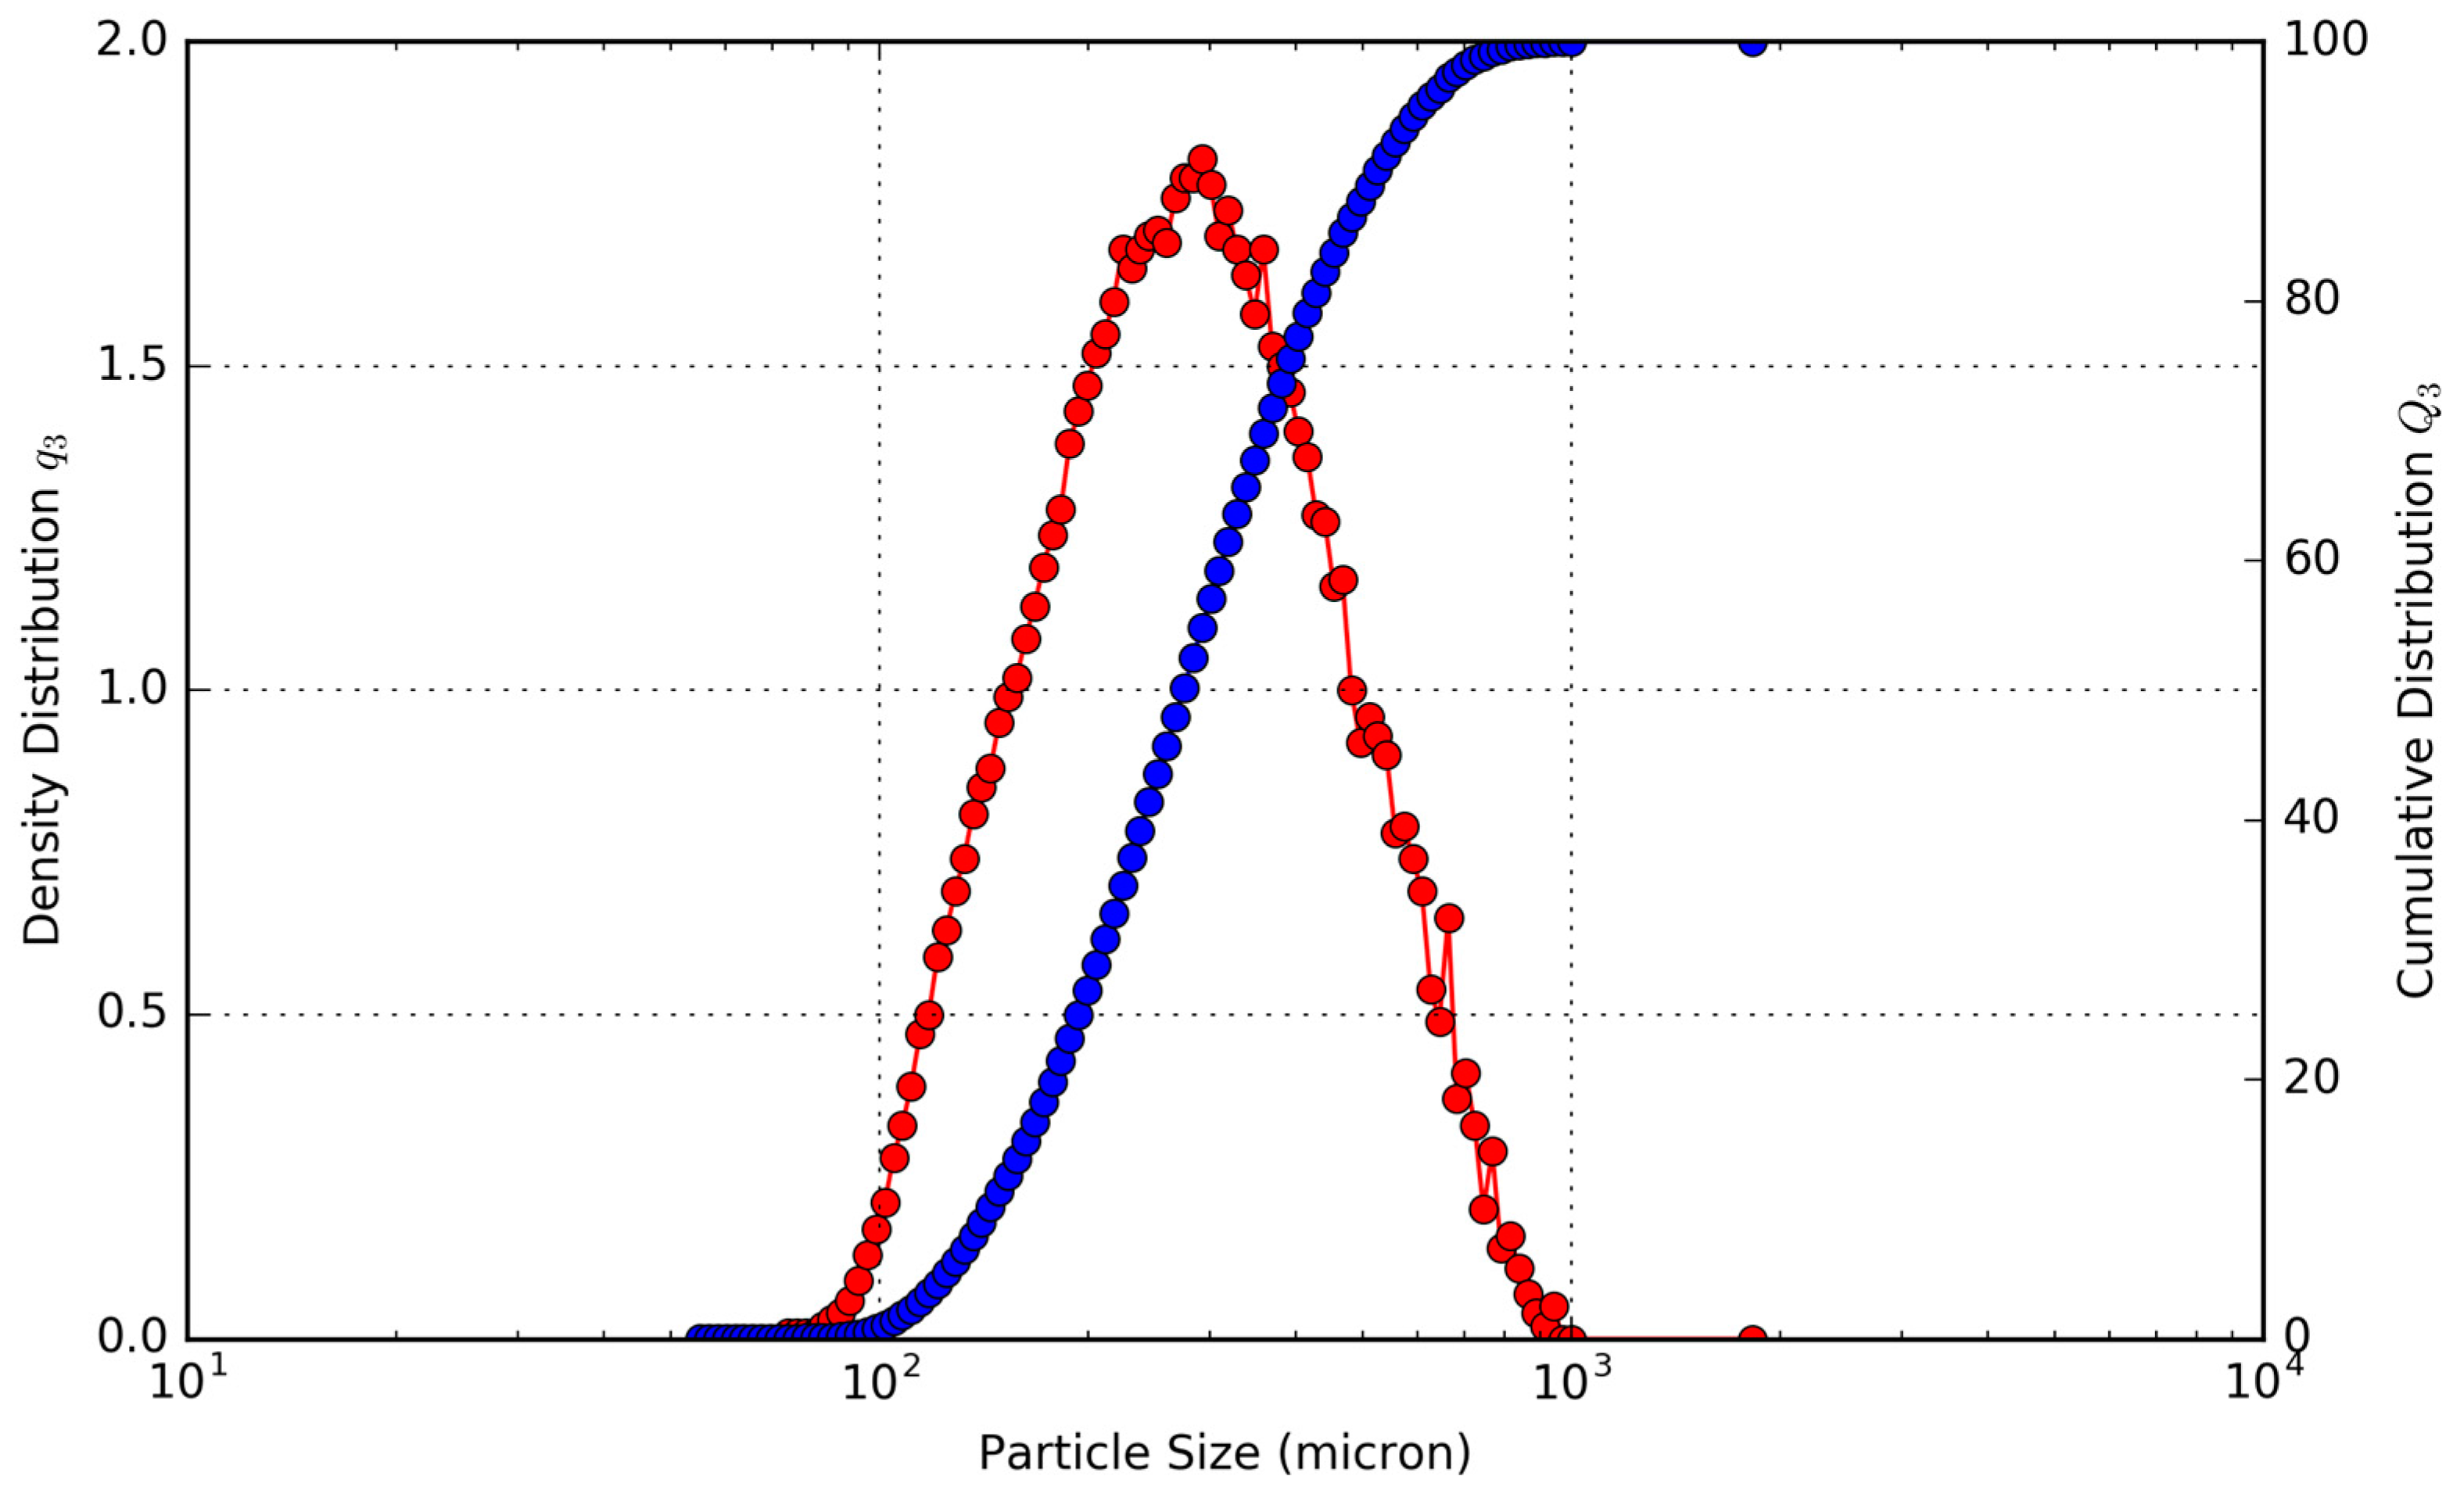
A raw hematite ore was procured from Cliffs Natural Resources, which was taken from Wabush mine in Newfoundland, Canada. The hydrodynamic and chemical properties of the particle are shown in Table 1. The particle size distribution, shown in Figure 3, was measured using the image analysis sensor QICPIC from Sympatec. Figure 3 shows that 50% of the particles were greater than 238 μm. The material was also not completely round, with an average sphericity of 0.876. The composition of the material, as shown in Table 1 and determined using X-ray fluorescence (XRF), was mostly iron oxide, with smaller amounts of silica and manganese oxide. The minimum fluidization was determined experimentally at room temperature in a 6.35 cm diameter fluidized bed by observing the bed pressure drop curve. The particle density was measured with helium pycnometry. Additionally, before this test, the material was calcined at 950 °C in air under fluidization conditions (around 3 Umf) for 1 h.
The purpose of the testing was to determine the effects of steam on the kinetics of natural gas conversion with hematite ore, and the test was focused on exploring the design space. The three main variables tested in the campaign were the temperature, the methane concentration, and the steam concentration. For this test, the gas velocity (and corresponding total gas inlet flow rate) were set to be constant, namely at three times the minimum fluidization velocity of 9.87 cm/s at temperature. The solids inventory was also set to be constant at 1000 g for this testing. The resulting experimental test matrix is laid out in Table 2. Since the campaign was focused on exploring the design space, the matrix was a partial test matrix, with certain parameters selected to discover general trends over the design space using limited resources. Another reason for the incomplete test matrix was to avoid the test points where carbon deposition was expected to occur, namely at high temperature (for forward Reaction 10) and low temperature (for forward Reaction 11). To prevent making conclusions based on variables that change as time progresses through the test, the test matrix was randomized. However, for trials that included replication, the replicates were artificially selected to be at the beginning, the middle, and near the end of the test campaign to ascertain the effects of time on the variables.
The test campaign consisted of cycling reducing and oxidizing gases on a constant inventory of material over a period of cycles, with different reduction feed gas conditions for each cycle to ascertain parametric effects. The reaction cycle consisted of a reduction cycle, with premixed methane, nitrogen, argon, and sometimes steam. The reduction cycle was then followed by a nitrogen purge of 15 L of reactor volume. After the nitrogen purge, oxidation occurred, whereby a mixture of nitrogen and air was added such that the oxygen concentration was around 5 vol %; this value was chosen to ensure that the temperature of the material did not go above the calcining temperature of 950 °C. Previous work showed that the calcining temperature affects the kinetics of reduction [34]. Finally, a second nitrogen purge of 15 L was implemented after the oxidation cycle to clear out the remaining oxygen. The length of the reduction cycle was set to be 300 s (occasionally longer due to operator error). The oxidation time was 15 min after oxygen breakthrough occurred, namely when the oxygen reads a steady 5 vol % for 15 min. Due to the design of the unit, the pressure was operated slightly above one atmosphere, between 2.6 and 5.4 psig measured in the plenum. Additionally, the flow to the mass spectrometer was measured using the rapid multi-sampler. If the flow was below 50 cm3/min, the data were thrown out, since there were significant delays in the concentration measurements.
The performance of the carrier was ascertained by analyzing parameters such as the species molar flow rates out (), methane conversion (, ), and the integrated molar oxygen carrier conversion ().
The known flow of argon into the system was used for calculating the molar flow rates of each gaseous species. The total flow of product gas on a dry basis was calculated by dividing the known flow rate of argon into the system by the argon tracer measurement from the mass spectrometer:
The corresponding product species i were then calculated using the product of the total flow and the measurement from the mass spectrometer:
Three conversion parameters were deduced from the gas analysis for each experiment. The natural gas conversion was calculated in two ways. The first natural gas conversion value was based on the disappearance of natural gas, namely:
This value gives a general conversion value, where the methane can be converted to one of the gaseous species or to solid carbon. The second natural gas conversion value was based on the conversion of natural gas to carbon dioxide, or:
The second conversion value helps to determine the effectiveness of the hematite for carbon capture, since the production and isolation of pure CO2 is the main goal of chemical looping combustion. The amount of oxygen consumed can be deduced via measurement of the product gases that contain oxygen, namely carbon dioxide, carbon monoxide, and steam. However, since the water drops out before it reaches the mass spectrometer and the continuous IR analyzers, the oxygen consumption needed to be deduced from an assumed hydrogen balance. Starting with the mole balance of oxygen, the amount of oxygen stripped from the hematite is:
Since the steam out is not directly measured, an element balance on hydrogen will be used to ascertain this value indirectly. The hydrogen entering the system from both the steam and the natural gas should be equal to the hydrogen, the natural gas, and the unknown steam leaving the system:
The oxygen consumption rate is then:
If the total oxygen in the bed of oxygen carrier is:
Then the rate of oxygen carrier conversion is:
This can be integrated from the start time to a selected end time for each trial to ascertain the oxygen carrier conversion:
The solids residence time in a 50 kWth unit using the same raw hematite material was around 200 s [36]. Thus, 200 s was chosen to be a representative value for integration. Additionally, the mass of the bed was 1000 g and the iron oxide content by weight () was 86.6% from Table 2.
To check that the results were valid, and to monitor for coking on the hematite, the gaseous carbon balance was calculated by:
If the measurement system is perfectly accurate, the carbon balance should be unity. Tests with steam showed a carbon element closure of 97.78 ± 4.01%, unless carbon deposition was occurring on the carrier, which was predominant when steam was not added to the system. Tests without steam showed a carbon balance closure of 72.90 ± 6.53%. The quantity of carbon deposited on the oxygen carrier was determined by integrating the flowrate of CO2 exiting the reactor during the oxidation cycle:
where is the time of oxidation. The carbon dioxide flow rate was determined from Equations (13) and (14), but the flow rate of argon into the reactor for Equation (13) was assumed to be 0.9 vol % of the air flow rate in, according to the natural composition of argon in atmospheric air.
3. Results
A summary of the overall results is tabulated in Table 3. The table shows the target bed temperature, feed natural gas mole percent and steam mole percent, but the actual values deviate slightly from the target, and these values are shown next to the target columns. During the experiment, the temperatures were around 10–20 °C higher due to the offset of the heater controller. For simplicity, most of the plots presented later in this paper use the actual values unless otherwise noted.
Since solids are not being continuously added and taken away as in a circulating system, the transient concentration and conversion curves are important for observing the changes in the oxygen carrier as a function of time. The transient curves for the extreme conditions of steam, methane, and temperature are shown in Figure 4. The effect of the presence of steam in the feed gas mixed with methane can be noted. For these two trials, the set point temperature was 900 °C and the set point methane concentration in the feed gas was 10 vol %. However, the steam set point was 0 vol % and 30 vol % for Figure 4a,b, respectively. Thus, the conditions were the same except for the presence of steam in the feed gas. The CO2 concentration in the trial without steam started out high and began to drop as the carbon began to deposit onto the hematite. On the other hand, the CO2 concentration for the steam trial held relatively constant, although the CO2 dropped slowly due to the formation of lower oxidation states of iron oxide (Fe3O4, FeO), which have slower kinetics with methane and reaction products (CO, H2) [37,38]. Additionally, the overall methane conversion was similar for both trials, ending up around 70%, but for the trial without steam, the methane conversion to carbon dioxide deviated significantly after a period of around 30 s. The effect of steam can also be seen in the carbon balance, which hovered around one hundred percent for the steam trial, however for the steam-free trial, while it started out with a gaseous carbon balance of one hundred percent (slightly above due to instrument error), the carbon balance decreased drastically as the carbon deposits on the hematite dropped below 60% near the end of the reduction period. This indicated that the remaining percentage of methane (up to around 40%) being fed to the fluidized bed was depositing on the oxygen carrier. This transient effect of the deposition of carbon is a result of the gradual formation of wüstite and elemental iron as the reaction progresses, where the deeply reduced iron helps to catalyze the formation of carbon depositions on the particle, and oxygen transported out of the grain lattice has a much slower reaction [28,29].
From the transient curves, the deposited carbon can be measured during the oxidation cycle. When air is added to the fluidized bed, the carbon deposited on the particle reacts with the air to produce CO2. As can be seen, the trial without steam produces a high concentration peak of carbon dioxide, while the reduction trial with steam produces no measurable carbon dioxide, as shown in Figure 4. The oxidation breakthrough—which occurred when the oxygen concentration reached 5%—for the steam trial occurred later than the trial without steam since (1) the reduction steps were longer, and (2) the rate of oxygen carrier conversion was higher with steam than without steam. Using the known argon composition from the known flow rate of air into the reactor as a tracer to calculate the molar flow rates (Equations (1), (2) and (12)), the total moles of carbon burned off the carrier can be measured by integration during the oxidation cycle; a plot of the total carbon deposited as a function of temperature, steam concentration, and methane concentration is shown in Figure 5. The plot shows that for steam feed concentrations of 15 and 30 vol %, the moles of carbon are negligible (less than 3 millimoles), regardless of steam concentration. Meanwhile, for trials without steam, the amount of carbon increased as the methane concentration feed increased from 5 vol % to 10 vol %.
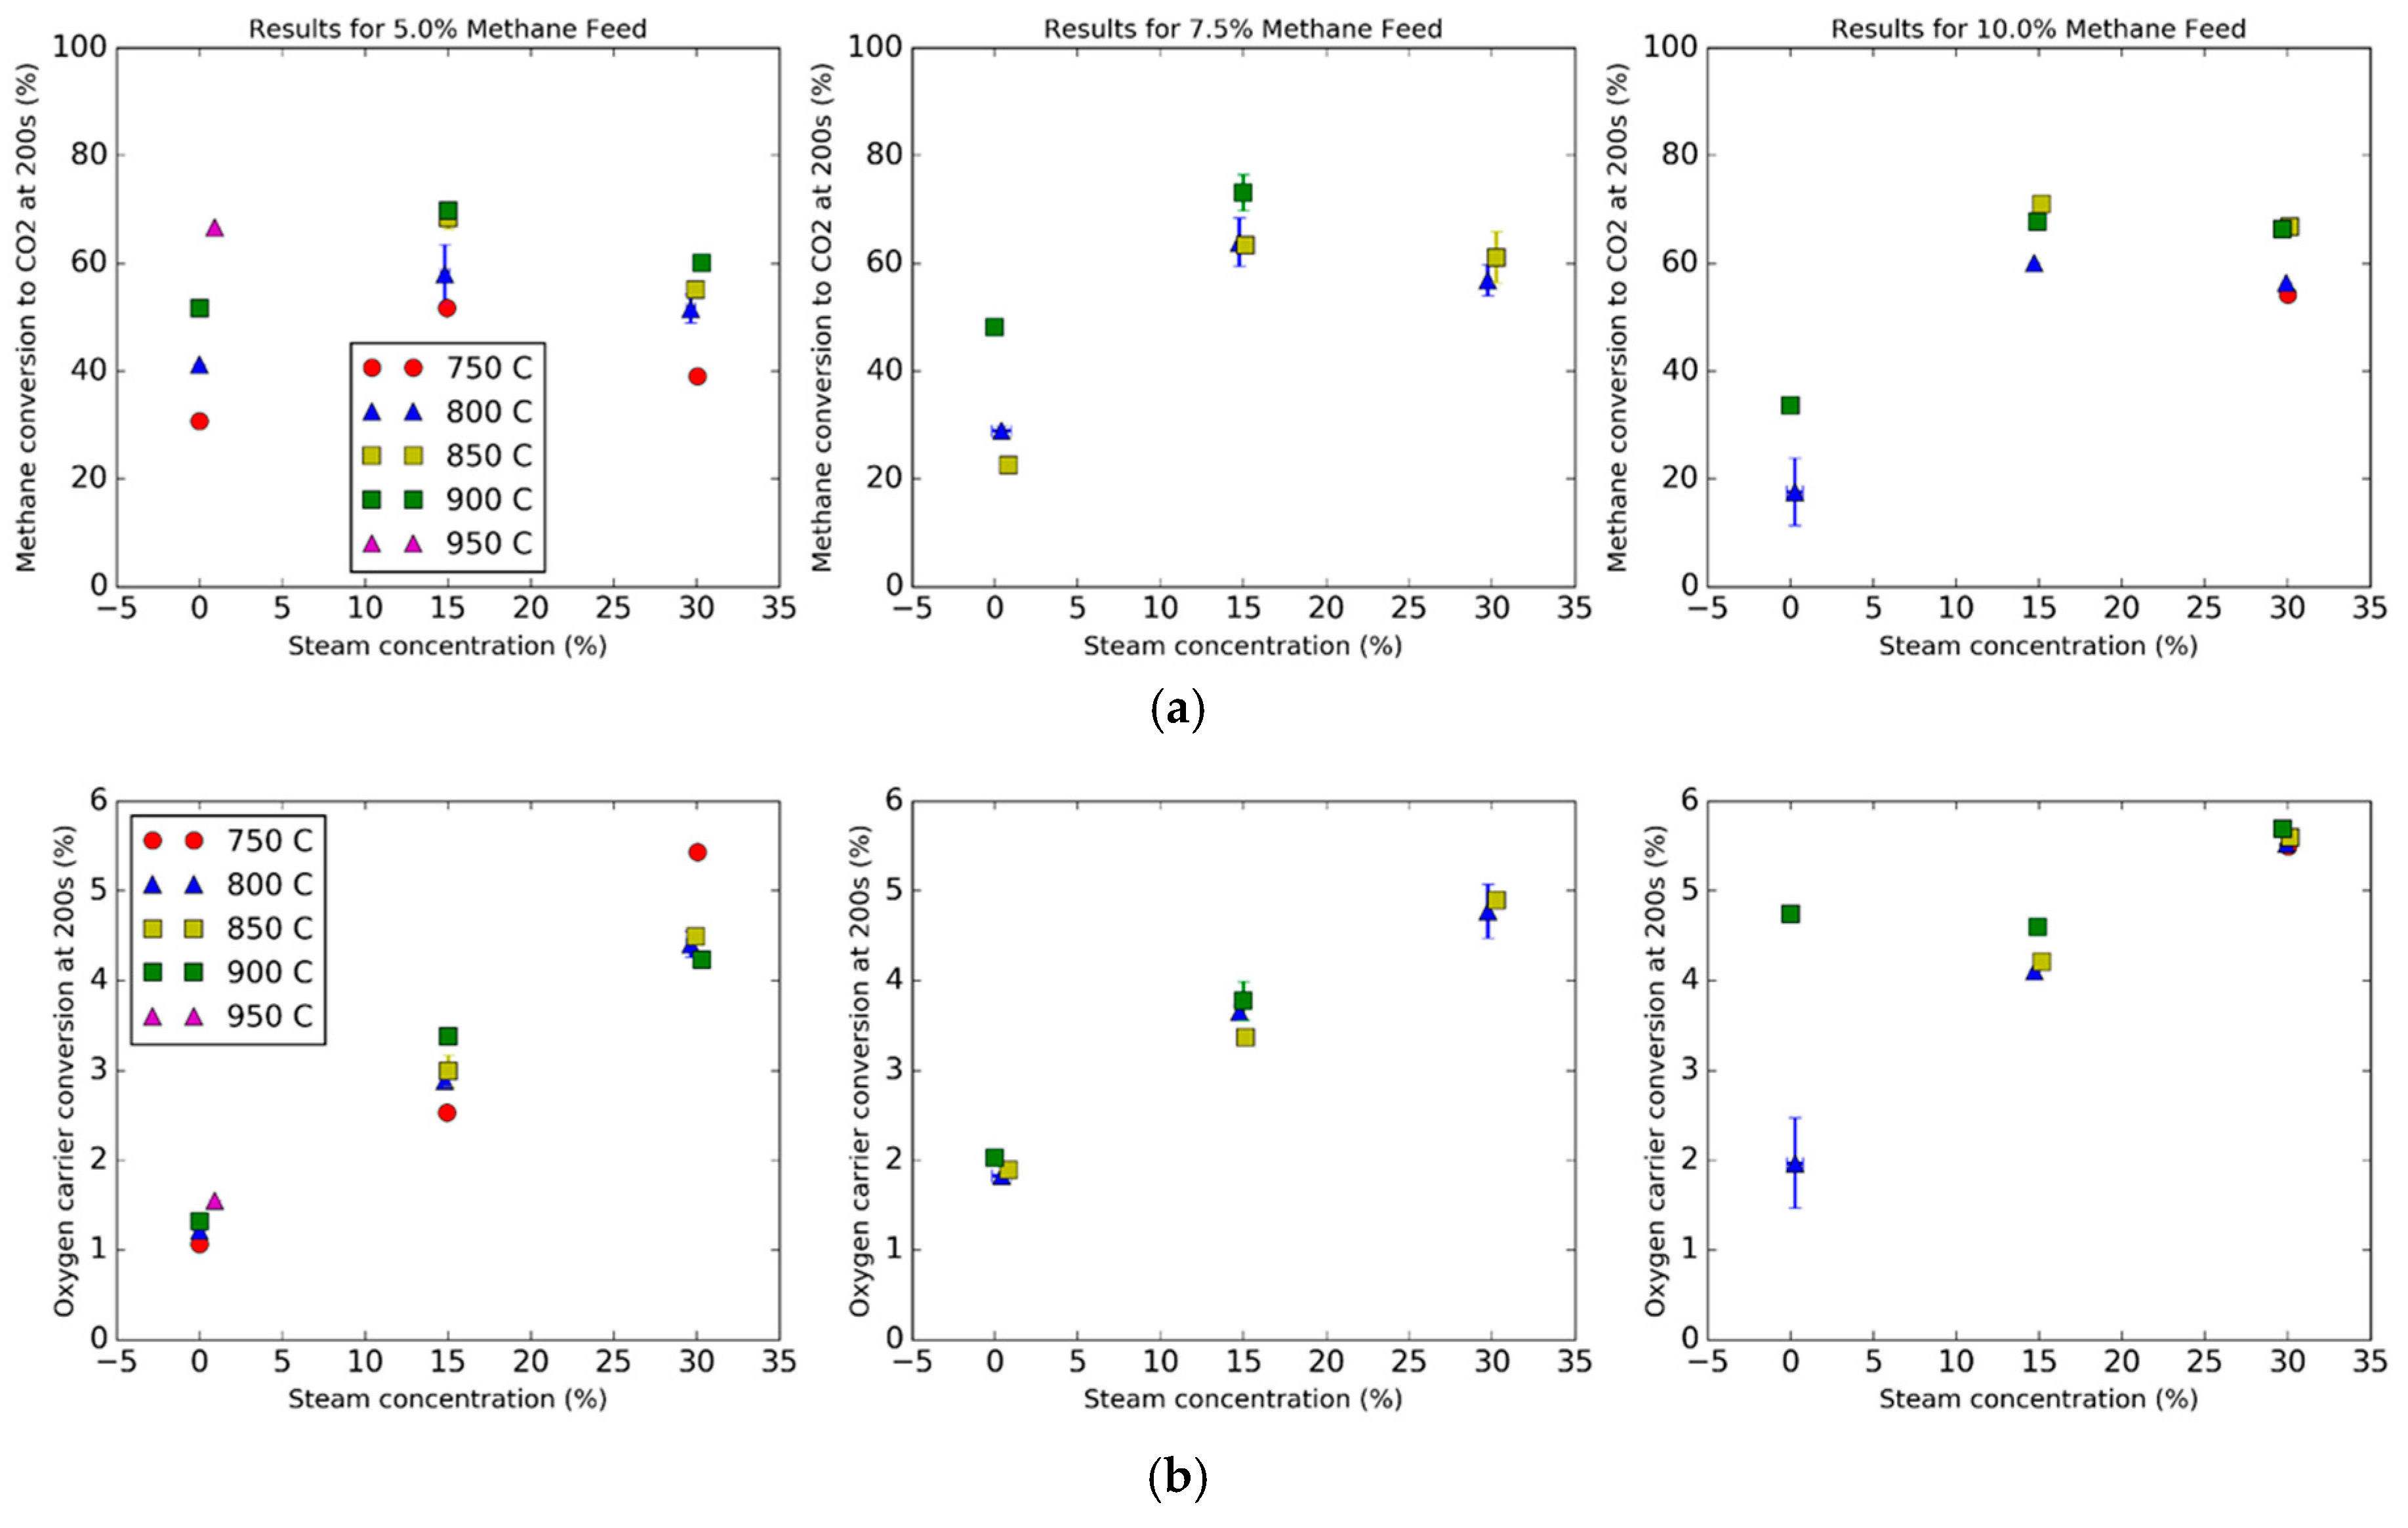
Conversions of the natural gas and the oxygen carrier as a function of steam and methane concentrations are plotted in Figure 6, where Figure 6a consists of the methane conversion and Figure 6b consists of the oxygen carrier conversion. For all trials, the conversions are measured at 200 s after the feed of natural gas begins for consistency. The methane conversion is an instantaneous value of the flows (cross reference Equation (16)), while the oxygen carrier conversion is an integrated value from the time of initiation to 200 s (cross reference Equation (22)). For trials that consist of replicates, error bars are added, which represent plus or minus one standard deviation. Figure 6a shows the effects of the addition of steam for trials with 5%, 7.5% and 10% methane fed into the feed gas. Some general trends are as follows. For constant steam concentrations for the 5% methane feed, the increase in temperature resulted in slightly higher conversions for all three steam concentrations. This temperature pattern was unfortunately not exactly repeated for the other methane concentrations, perhaps due to limits of instrument accuracy. This may be because it takes several cycles to activate the carrier, so the kinetics may change with the cycle number [32]. However, a trend that is consistent across all three methane concentrations is the dramatic increase in conversion from 0 to 15% steam and a slight decrease in conversion from 15% to 30% steam. The dramatic increase in conversion from 0 to 15% steam concentration is in part due to (1) the steam-methane reforming reaction (Reaction 7) and the water–gas shift reaction (Reaction 9) producing more hydrogen, and (2) the suppression of carbon deposition, resulting in a greater molar flow rate of CO2 instead of carbon on the particle.
The decrease in conversion from 15% to 30% steam concentration could be due to several effects. First, the steam methane reforming reaction creating more hydrogen and carbon monoxide via Reaction 7. Second, the water–gas shift reaction will also form more hydrogen from carbon monoxide. While the kinetics of hydrogen and carbon monoxide directly reacting with hematite are faster than with methane, the steam reforming reaction produces hydrogen and carbon monoxide exceeding what the bed of oxygen carrier can oxidize, since the oxygen from the grain lattice cannot get to the surface fast enough.
A surprising result was found in regards to the effect of steam on the oxygen utilization. Figure 6b shows that the addition of steam caused an increase in the oxygen carrier conversion. Normally, a greater steam concentration in the feed should shift the equilibrium of Reaction 2 towards the reactant side, resulting in less reduction of the oxygen carrier. However, the direct reaction of methane and hematite was rather slow, and adding more steam shifted the steam methane reforming reaction (Reaction 7) to the product side, causing more of the methane to convert to hydrogen and carbon monoxide, thus reducing the oxygen carrier further.
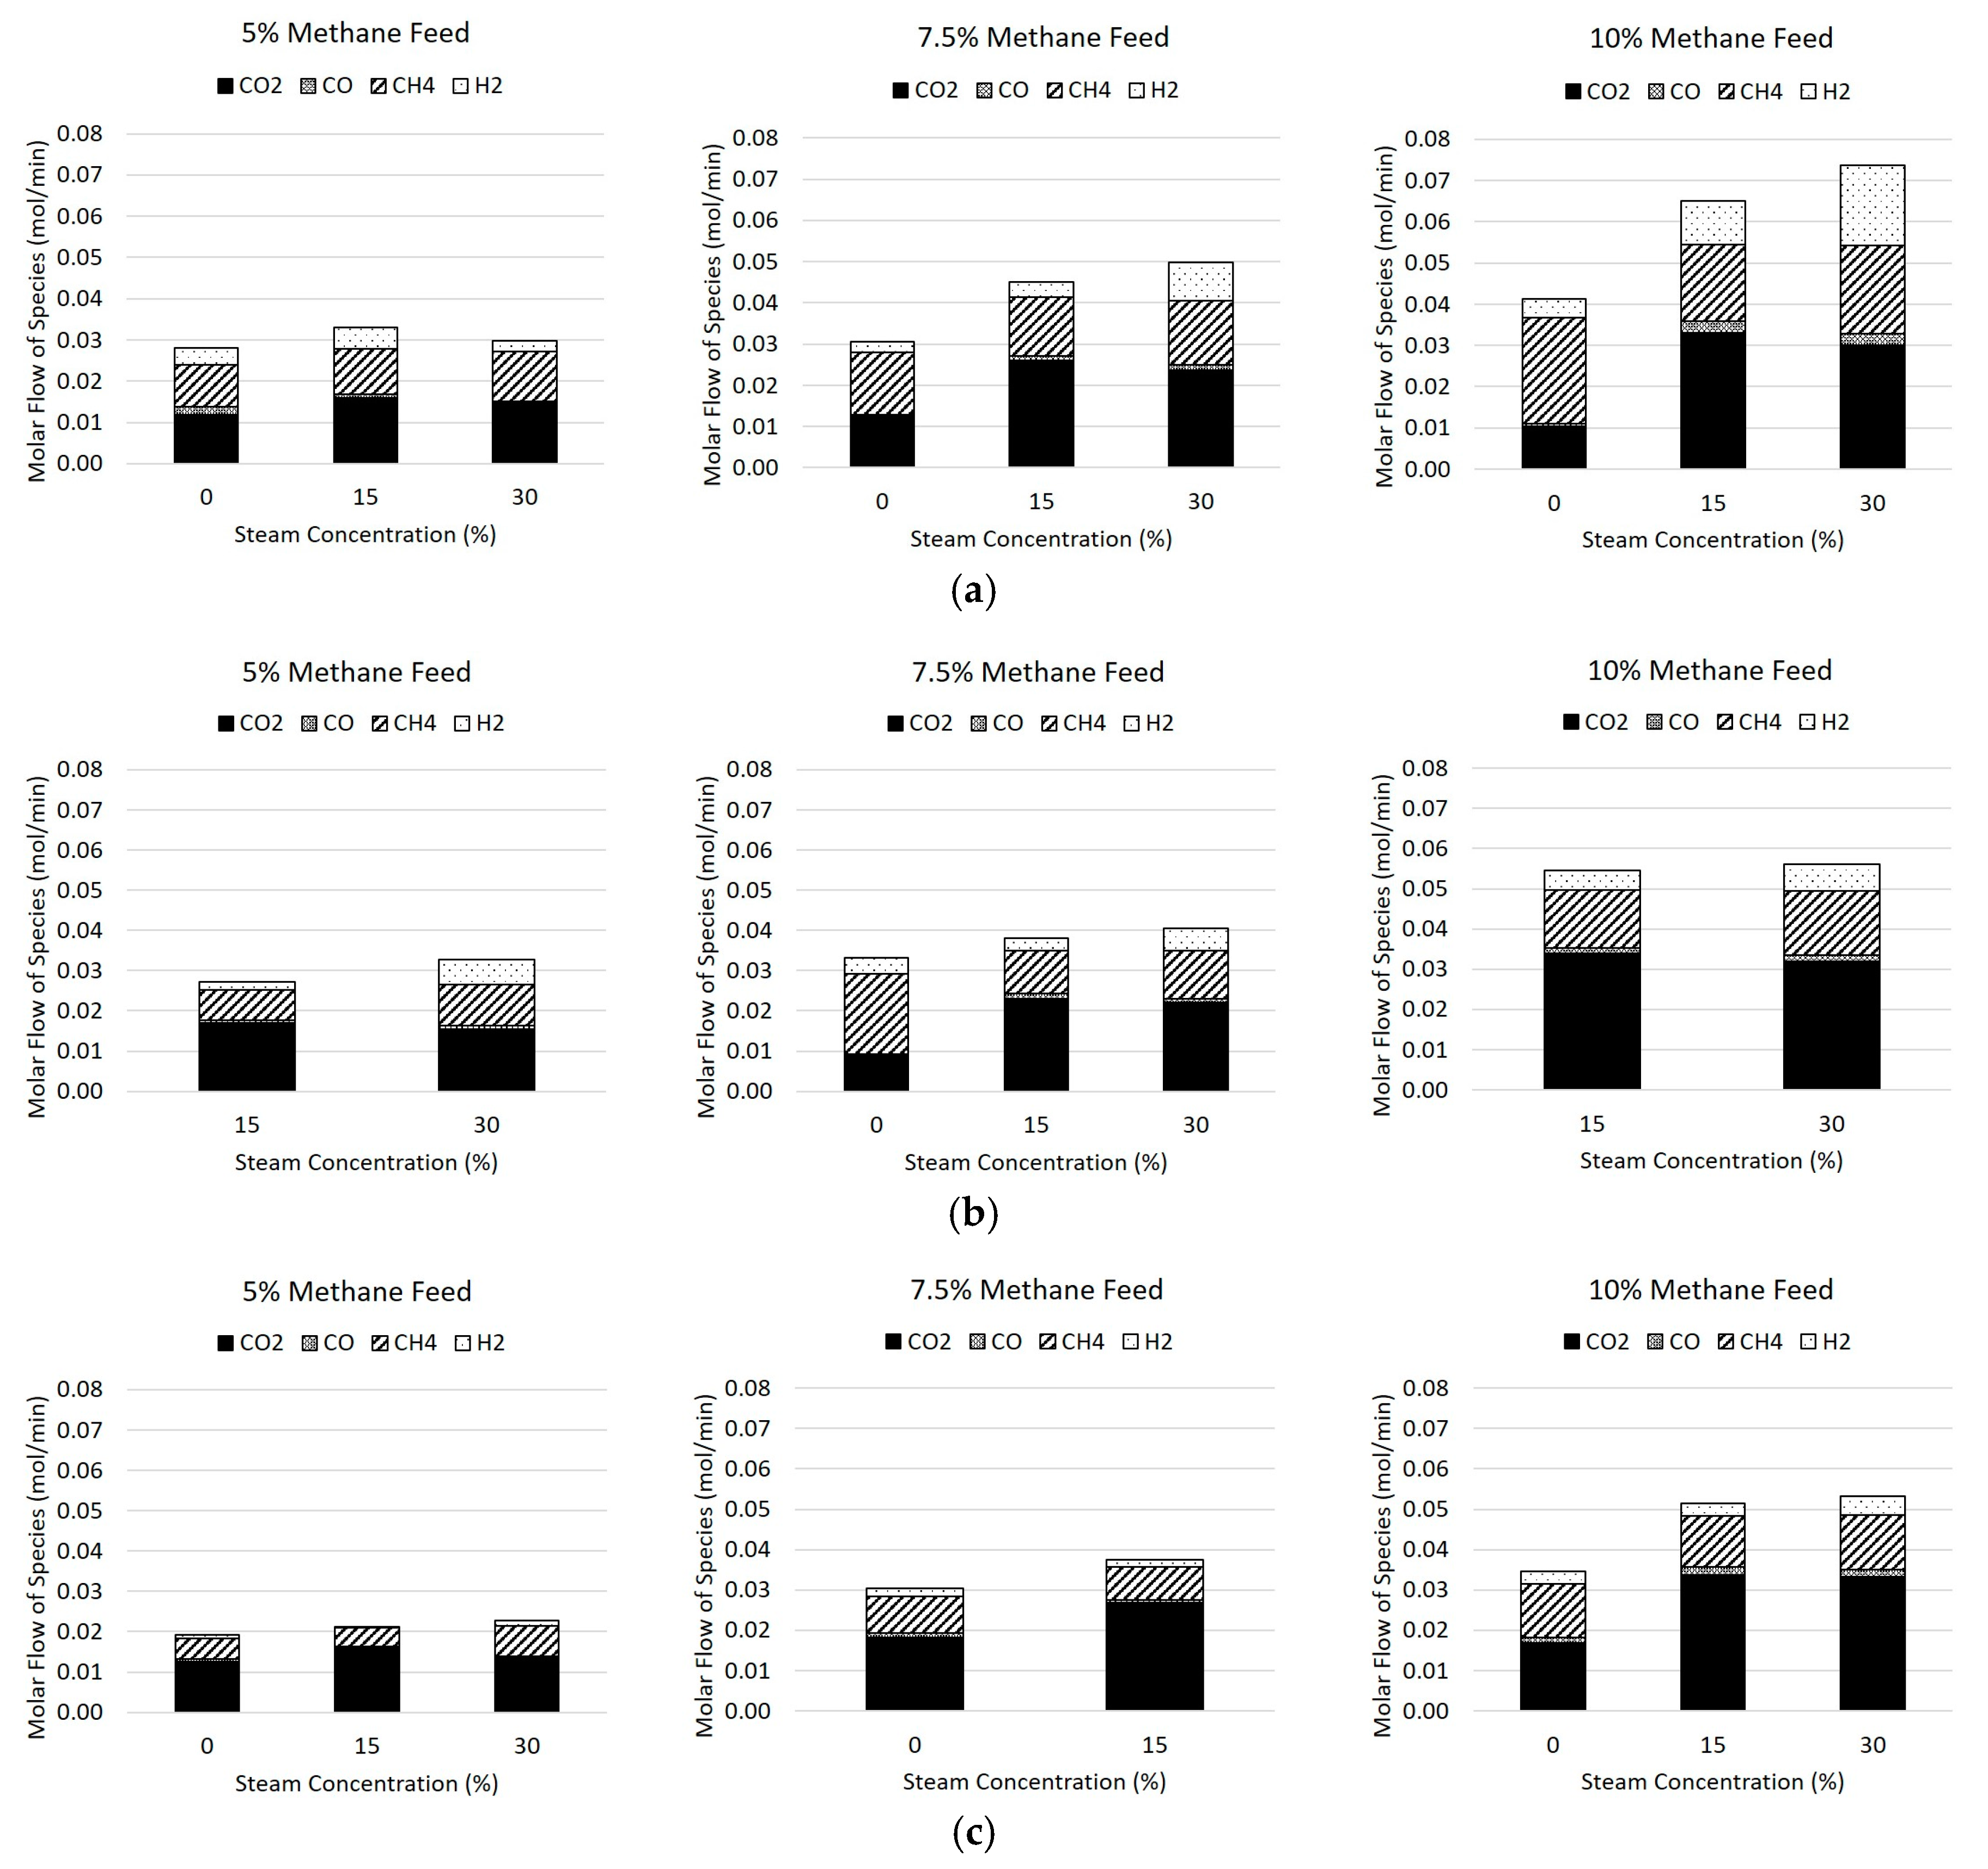
The molar flow rates of the product species in the flue gas are reported in Table 4 and Figure 7, where Figure 7a shows the flows at 800 °C, Figure 7b shows the flows at 850 °C, and Figure 7c shows the flows at 900 °C. The inert gases of nitrogen and argon were excluded from the plot for clarity, as well as the steam produced. The two major non-condensable products were carbon dioxide, followed by methane, and the minor species are hydrogen and carbon monoxide, with hydrogen being more prevalent of the minor species due to the stoichiometry of Reactions 1, 4, and 7. It can be seen in general that the increase of methane and steam to the feed gas caused an increase of both hydrogen and carbon monoxide at 800 °C, but this effect was diminished as the temperature increased due to the fast kinetics of hydrogen with the hematite.
4. Discussion
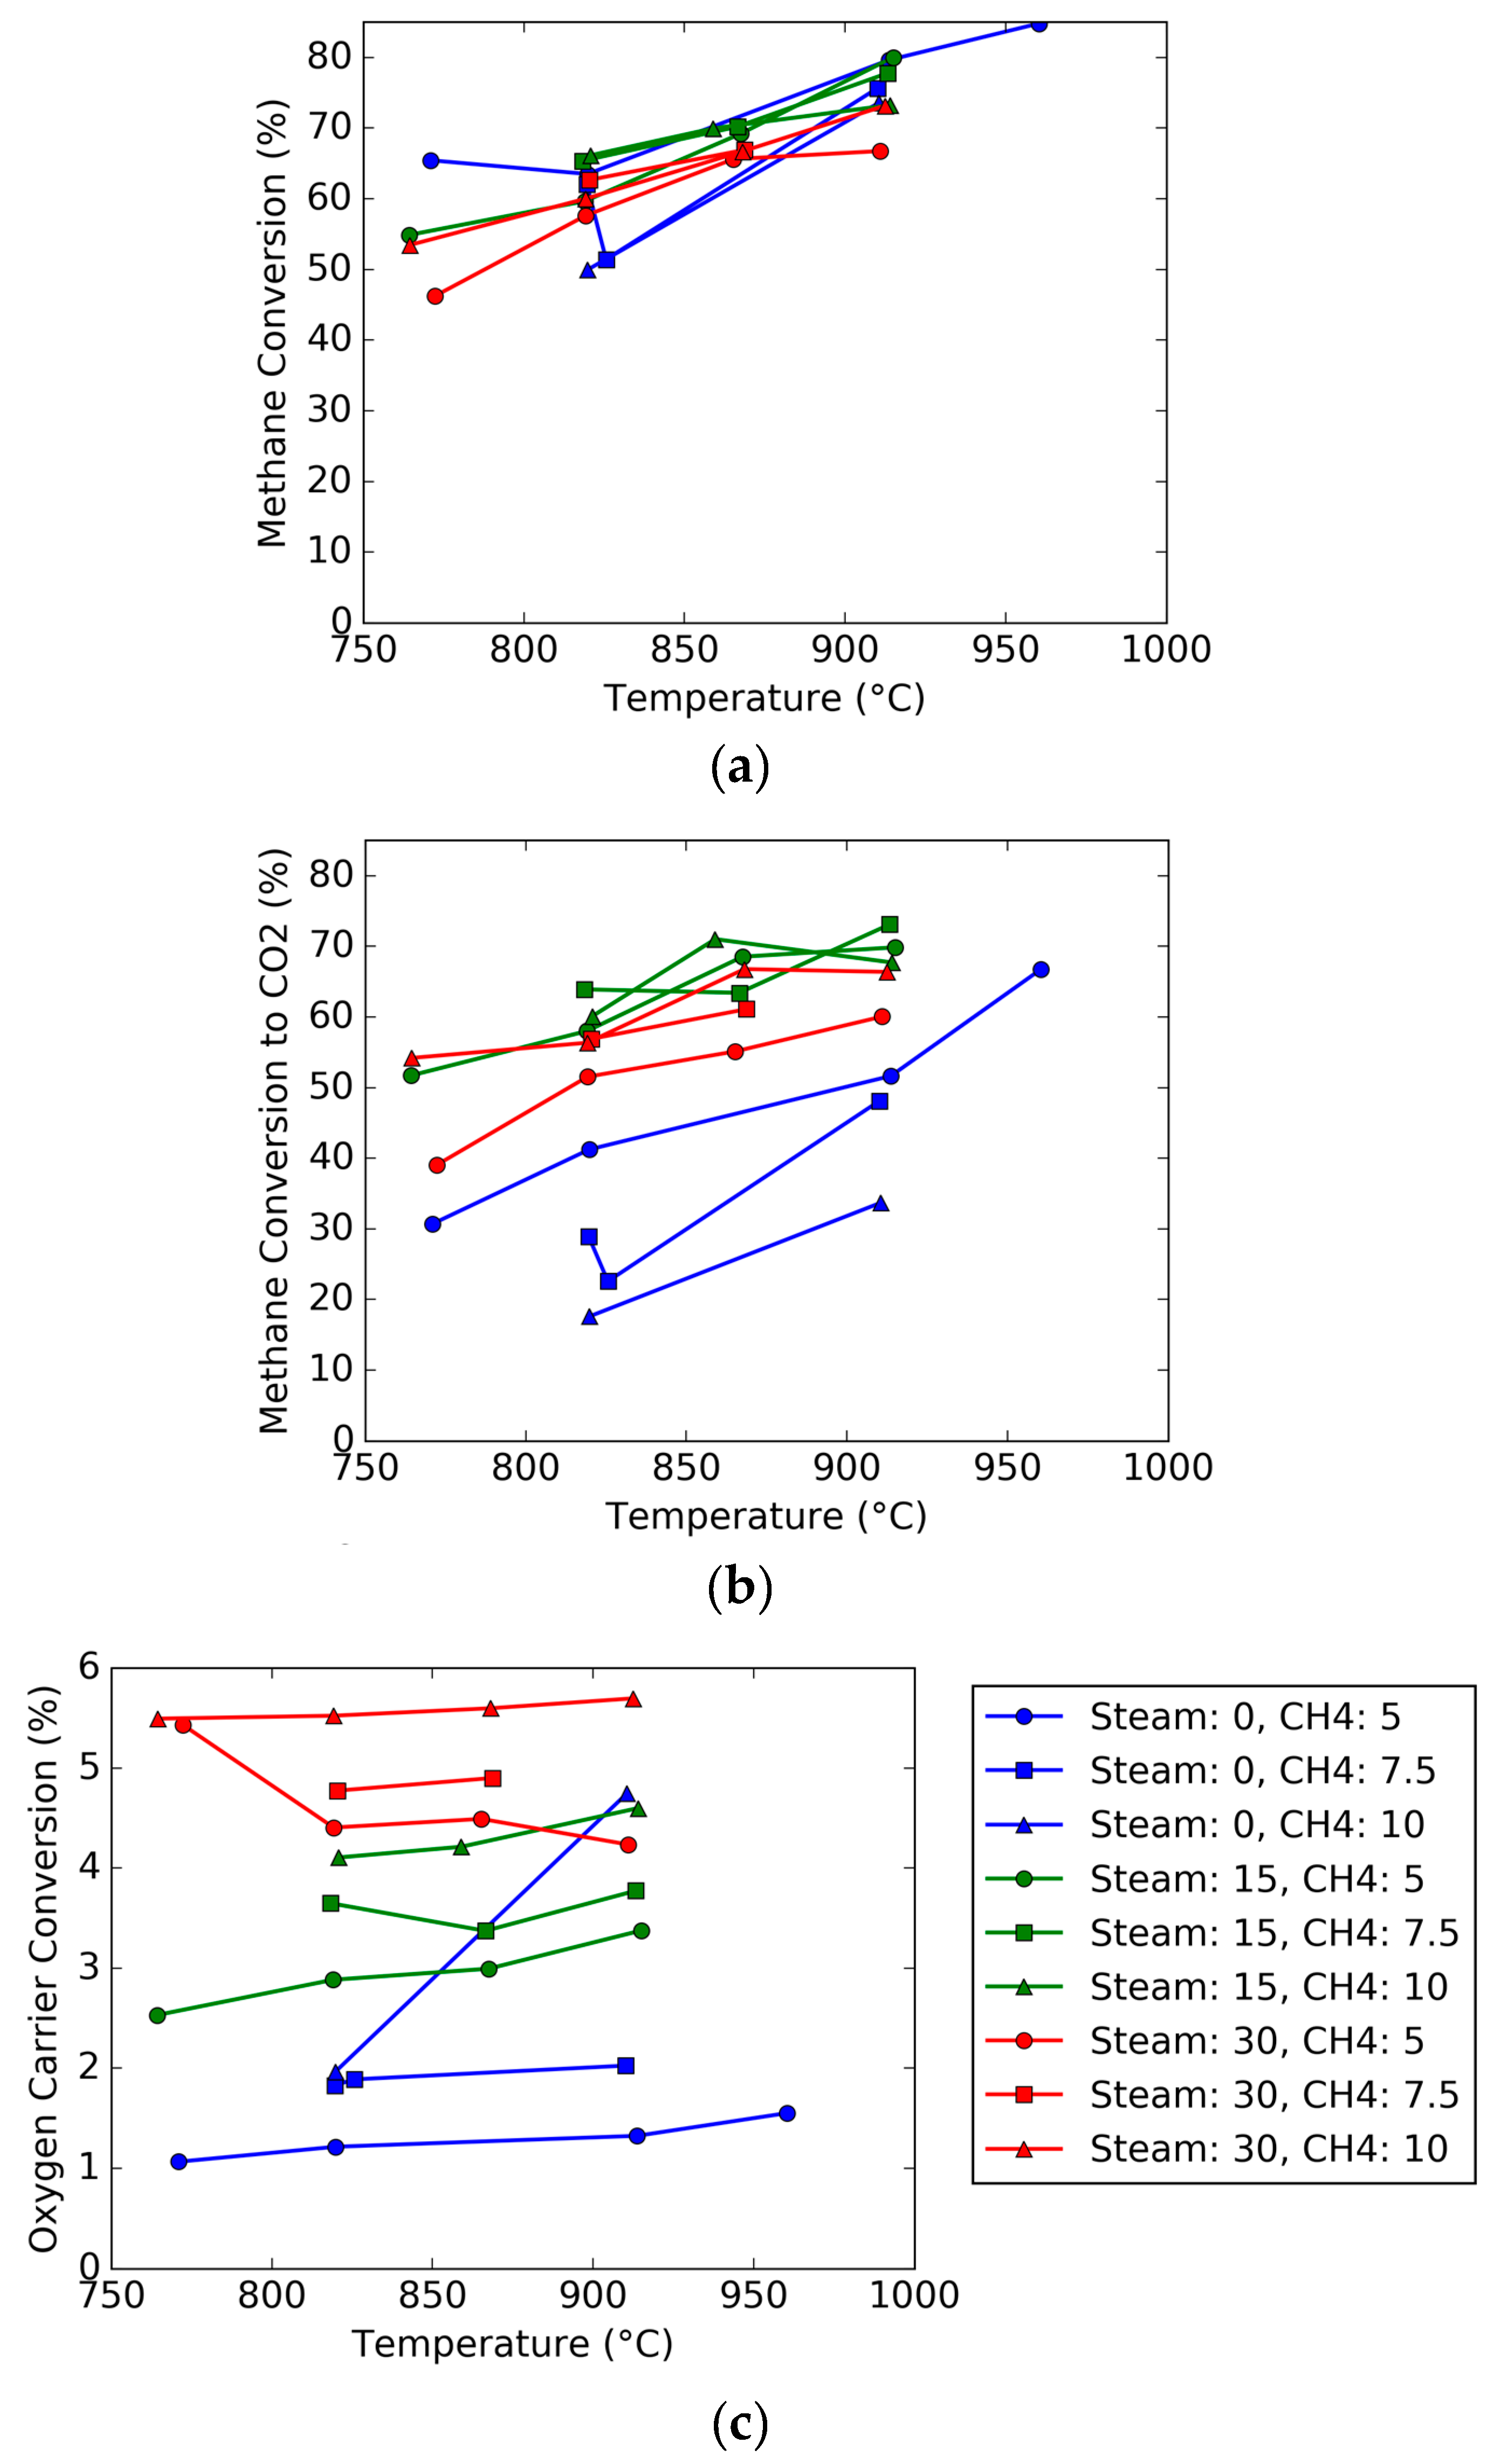
To observe the effect of temperature, the conversion of methane and oxygen carriers were plotted as a function of temperature, as shown in Figure 8. As can be seen, the majority of the plots show a positive correlation between temperature and conversion, with occasional exceptions. For the overall methane conversion, the values for different methane and steam feeds as a function of temperature mostly overlap due to the conversion of methane to different products (carbon deposition, production of hydrogen or carbon monoxide, or carbon dioxide). It can be noted that the CO2 specific conversion for all trials is less than the overall methane conversion, particularly for the trials without steam. For the conversion to CO2, adding more methane drops the conversion, but the effect is mitigated as more steam is added to the system. As seen in previous plots, increasing the steam to 15 vol % improves conversion significantly but it drops slightly as the steam concentration increases to 30 vol %. The oxygen carrier conversion is also plotted as a function of temperature, and the oxygen carrier conversion is not as strong of a function as the gas conversion, but is highly dependent on the feed gas. Like the trends ascertained from Figure 6, the addition of more steam and methane to the feed gas causes the oxygen carrier conversion to increase.
To complete the analysis, a multivariable ordinary least squares regression was performed on the dataset to determine which variables had greater effects than others and what variables are statistically significant. The dependent variables chosen were methane conversion to carbon dioxide and the oxygen carrier conversion, and the independent variables selected for the analysis were the reactor temperature, pressure, inlet steam concentration, and inlet methane concentration. Additionally, dual interaction terms were chosen. Each of the independent variables were coded to allow for direct comparison of the magnitude of the coefficients to represent the strength of the effect on the conversion. The regression equation chosen to fit the independent variable (where O or ) at 200 s was:
where are the fit regression coefficients, and the prime symbol (’) indicates that the independent variables are coded, where the lowest value is indicated by −1 and the highest value is 1. The uncoded variables can be converted to coded variables using the following equation:
where and of the set of independent parameter data. The resulting best-fit parameters are listed in Table 5, Table 6, Table 7 and Table 8 in addition to the goodness of fit parameters. Assuming alpha is chosen as 0.10, the primary variables that are most significant are the temperature, pressure, and steam concentration. Running the analysis with the statistically insignificant variables dropped, the resulting linear regressions for the methane conversion and the oxygen carrier conversion at 200 s are:
The coefficient of determination for Equation (27) is 81.3% and for Equation (28) is 95.5%. Equation (15) shows that the largest effect on the conversion in the test runs was the interaction between the pressure and steam concentration, followed by the effects of temperature and pressure. The positive effect of pressure and temperature on the conversion should be expected, since increasing the temperature increases the kinetic rate constant, and increasing the pressure causes the partial pressure of the species to increase. Increasing the steam concentration in the feed also causes an increase in conversion, as this should cause Reaction 7 to shift to the right, causing carbon monoxide and hydrogen to form quicker than methane cracking. Reactions 9 and 12 also cause the conversion to carbon dioxide to increase. Carbon monoxide and hydrogen react faster than methane would directly with hematite. For the oxygen carrier conversion, the parameter with the greatest effect was the concentration of the steam in the feed, followed by the methane concentration in the feed, and the interaction between the temperature and the methane and steam concentrations. Alone, neither temperature nor pressure seemed to cause a statistically significant effect on the oxygen carrier conversion. It should be noted that Equations (15) and (16) are not intended to rigorously model all the effects including hydrodynamics; rather, it is intended to provide a qualitative understanding of parameters for the analysis of data. It should also be cautioned that the detailed results may not be relevant for a reactor in a different regime than a bubbling fluid bed. However, results could still be relevant for the design of a bubbling fluidized bed fuel reactor operating near the hydrodynamic conditions presented in this work.
It should not be surprising that, for the 0 vol %–15 vol % steam trials, an increase in pressure causes the conversion to increase due to an increase in the steam partial pressure. However, for higher steam concentrations, the compound effect of pressure and steam complicates the analysis, since increasing the steam concentration causes the plenum pressure to be lower. Additionally, the steam condenses from the line before exiting through the outlet needle valve, causing there to be less pressure drop across it when higher steam concentrations are used. Thus, more controlled experiments in the future need to be performed that consider this anomaly. This is probably the reason that the pressure and steam concentration interaction parameter are of the greatest magnitude: to nullify the effect of lower system pressure when the steam concentration in the feed is highest.
The methane conversion results of the steam-free trials are lower than the results from Breault et al. [34], which ranged from 40% to 53% at 200 s after a start of reaction at 800 °C, 10% methane concentration in the feed, and a total gas flow of 6 SLPM. The gas flow in the present study is twice as high, resulting in less conversion of the methane. The results were similar to that from Siriwardane et al. [30] at the same temperature (800 °C), although trials from their work were performed with a larger inventory of hematite and a lower gas velocity (1.2 times the minimum fluidization velocity of the material instead of three times the minimum fluidization velocity). The results from a 50 kWth pilot chemical looping reactor however are lower than those measured in this work, the former which were around 10%–20% methane conversion to CO2 [33]; however, the results from this unit are not with steam in the feed gas.
While there is a significant cost advantage to using raw minerals such as hematite ore, one of the risks associated with using an unsupported raw mineral as an oxygen carrier is sintering and defluidization of the material. Sintering of raw iron-based minerals has been observed by Schwebel et al. under fixed bed conditions during oxidation due to the high degree of reduction in fixed beds [39]. In the present testing, sintering and defluidization were not observed, as the material was not reduced significantly and the oxidation reaction rate was tempered by decreasing the oxygen feed to 5 vol%. However, the same material exhibited minor agglomeration in a 50 kWth unit between the bubble caps of the air reactor fluidized bed, but this did not hinder the operation of the unit, as it was able to be operated for 13 h under chemical looping conditions and two days of circulation at high temperature (800 °C–1000 °C) [33,36]. The same hematite ore was tested, albeit coated with MgO to improve the reactivity with natural gas, by Siriwardane et al. [30], in a 5-cm fluidized bed and did not exhibit agglomeration or sintering. Thus, if the extent of the reduction of raw hematite is low and the temperatures are kept under control, such as in circulating units, it is expected that the mineral can be used without concern of major agglomeration.
5. Conclusions
A raw hematite was thermally treated or stabilized at 950 °C and tested in a small 5 cm fluidized bed reactor in the range of 750 °C–900 °C at three times the minimum fluidization velocity using methane as the reducing gas. A comparison between trials with steam in the methane feed gas and without steam was performed, with the intent of observing the effect on methane and oxygen carrier conversions. Overall, adding steam to the reactant gas helped to keep the methane conversion to carbon dioxide similar in value to the overall methane conversion and prevent carbon deposition from occurring on the particle. In general, the addition of steam to the feed gas increased the methane conversion. Furthermore, the addition of steam caused the steam methane reforming reaction to form more hydrogen and carbon monoxide at higher steam and methane concentrations, which were not completely converted at higher concentrations. While the reduction kinetics of hydrogen and carbon monoxide with iron oxide should be fast once they are formed from steam methane reforming, their lack of conversion at higher concentrations may be indicative of mass transfer limitations between the bubble and the wake in the fluidized bed. This indicates that if steam were to be used in large quantities, caution should be used in scaling up, since steam may cause the formation of hydrogen and carbon monoxide that may bypass contact with the carrier. Steam also caused an increase in oxygen carrier conversion, which is surprising since steam shifts the reaction between the reducing gas and the oxygen carrier to the reactant side. More detailed and controlled testing can help provide insight into the methane conversion mechanism in the presence of a high amount of steam.
Acknowledgments
This work was funded by the U.S. Department of Energy’s Advanced Combustion Program. The authors would also like to acknowledge the hard work and dedication of William Grimes who assisted in operating the unit. The authors would like to thank Jinichiro Nakano and Anna Nakano for performing the analysis on the hematite composition.
Author Contributions
Samuel Bayham, Ronald Breault, and Justin Weber conceived and designed the experiments, which includes the test matrix. Ronald Breault is the principal investigator for the project, providing the main goals and objectives for the experiments. Samuel Bayham oversaw the day-to-day operation of the 5-cm fluidized bed reactor operated by a technician. Samuel Bayham analyzed the data, with Justin Weber providing help with programming in Python for data analysis. Samuel Bayham wrote the paper, with edits from Ronald Breault.
Conflicts of Interest
The authors declare no conflict of interest.
Disclaimer
The U.S. Department of Energy, NETL contributions to this paper were prepared as an account of work sponsored by an agency of the United States Government. Neither the United States Government nor any agency thereof, nor any of their employees, makes any warranty, express or implied, or assumes any legal liability or responsibility for the accuracy, completeness, or usefulness of any information, apparatus, product, or process disclosed, or represents that its use would not infringe privately owned rights. Reference herein to any specific commercial product, process, or service by trade name, trademark, manufacturer, or otherwise does not necessarily constitute or imply its endorsement, recommendation, or favoring by the United States Government or any agency thereof. The views and opinions of authors expressed herein do not necessarily state or reflect those of the United States Government or any agency thereof.
Nomenclature
| Mass fraction of Fe2O3 in the hematite | |
| Mass of solids in the fluidized bed | |
| Molecular weight of species i | |
| Moles of carbon deposited on the material | |
| Molar flowrate of atomic carbon in | |
| Molar flowrate of atomic carbon out | |
| Molar flowrate in of species i | |
| Molar flowrate out of species i | |
| Molar rate of atomic oxygen consumption | |
| Moles of atomic oxygen in the fluidized bed | |
| P | Pressure |
| t | Time |
| T | Temperature |
| Minimum and maximum values of independent variable x. | |
| Mole fraction in of species i | |
| Mole fraction out of species i | |
| Overall methane conversion | |
| Methane conversion to carbon dioxide | |
| Oxygen carrier conversion | |
| Best-fit regression coefficients for linear least squares analysis | |
| Carbon balance number | |
| Chosen time | |
| Time for complete oxidation |
References
- International Panel on Climate Change. Climate Change 2014: Synthesis Report. Contribution of Working Groups I, II and III to the Fifth Assessment Report of the Intergovernmental Panel on Climate Change; Pachauri, R.K., Meyer, L.A., Eds.; IPCC: Geneva, Switzerland, 2014. [Google Scholar]
- Rubin, E.S.; Davison, J.E.; Herzog, H.J. The cost of CO2 capture and storage. Int. J. Greenh. Gas Control 2015, 40, 378–400. [Google Scholar] [CrossRef]
- Porter, R.T.J.; Fairweather, M.; Kolster, C.; Mac Dowell, N.; Shah, N.; Woolley, R.M. Cost and performance of some carbon capture technology options for producing different quality CO2 product streams. Int. J. Greenh. Gas Control 2017, 57, 185–195. [Google Scholar] [CrossRef]
- Ishida, M.; Zheng, D.; Akehata, T. Evaluation of a chemical-looping-combustion power-generation system by graphic exergy analysis. Energy 1987, 12, 147–154. [Google Scholar] [CrossRef]
- Ryden, M.; Lyngfelt, A.; Mattisson, T. Synthesis gas generation by chemical-looping reforming in a continuously operating laboratory reactor. Fuel 2006, 85, 1631–1641. [Google Scholar] [CrossRef]
- Khan, M.N.; Shamin, T. Techno-economic assessment of a plant based on a three reactor chemical looping reforming system. Int. J. Hydrogen Energy 2016, 41, 22677–22688. [Google Scholar] [CrossRef]
- Contractor, R.M. Dupont’s CFB technology for maleic anhydride. Chem. Eng. Sci. 1999, 54, 5627–5632. [Google Scholar] [CrossRef]
- Spallina, V.; Marinello, B.; Gallucci, F.; Romano, M.C.; Van Sint Annaland, M. Chemical looping reforming in packed-bed reactors: Modeling experimental validation and large-scale reactor design. Fuel Process. Technol. 2017, 156, 156–170. [Google Scholar] [CrossRef]
- García-Labiano, F.; de Diego, L.F.; Cabello, A.; Gayán, P.; Abad, A.; Adánez, J.; Sprachmann, G. Sulphuric acid production via Chemical Looping Combustion of elemental sulphur. Appl. Energy 2016, 178, 736–745. [Google Scholar] [CrossRef]
- Kimball, E.; Hamers, H.P.; Cobden, P.; Gallucci, F.; van Sint Annaland, M. Operation of fixed-bed chemical looping combustion. Energy Procedia 2013, 37, 575–579. [Google Scholar] [CrossRef]
- Strohle, J.; Orth, M.; Epple, B. Design and operation of a 1 MWth chemical looping plant. Appl. Energy 2014, 113, 1490–1495. [Google Scholar] [CrossRef]
- Ku, Y.; Wu, H.-C.; Chiu, P.-C.; Tseng, Y.-H.; Kuo, Y.-L. Methane combustion by moving bed fuel reactor with Fe2O3/Al2O3 oxygen carriers. Appl. Energy 2014, 113, 1909–1915. [Google Scholar] [CrossRef]
- Zeng, L.; Tong, A.; Kathe, M.; Bayham, S.; Fan, L.-S. Iron oxide looping for natural gas conversion in a countercurrent moving bed reactor. Appl. Energy 2015, 157, 338–347. [Google Scholar] [CrossRef]
- Bayham, S.C.; Breault, R.; Monazam, E. Particulate solid attrition in CFB systems—An assessment for emerging technologies. Powder Technol. 2016, 302, 42–62. [Google Scholar] [CrossRef]
- Cabello, A.; Gayán, P.; García-Labiano, F.; de Diego, L.F.; Abad, A.; Adánez, J. On the attrition evaluation of oxygen carriers in chemical looping combustion. Fuel Process. Technol. 2016, 148, 188–197. [Google Scholar] [CrossRef]
- Garcia-Labiano, F.; Adanez, J.; de Diego, L.F.; Gayan, P.; Abad, A. Effect of pressure on the behavior of copper-, iron-, and nickel-based oxygen carriers for chemical-looping combustion. Energy Fuels 2006, 20, 26–33. [Google Scholar] [CrossRef]
- Monazam, E.R.; Breault, R.W.; Siriwardane, R.; Richards, G.; Carpenter, S. Kinetics of the reduction of hematite (Fe2O3) by methane (CH4) during chemical looping combustion: A global mechanism. Chem. Eng. J. 2013, 232, 478–487. [Google Scholar] [CrossRef]
- Jeong, M.H.; Lee, D.H.; Bae, J.W. Reduction and oxidation kinetics of different phases of iron oxides. Int. J. Hydrogen Energy 2015, 40, 2613–2620. [Google Scholar] [CrossRef]
- Cabello, A.; Abad, A.; Garcia-Labiano, F.; Gayan, P.; de Diego, L.F.; Adanez, J. Kinetic determination of a highly reactive impregnated Fe2O3/Al2O3 oxygen carrier for use in gas-fueled chemical looping combustion. Chem. Eng. J. 2014, 285, 265–280. [Google Scholar] [CrossRef]
- Nasr, S.; Plucknett, K.P. Kinetics of iron ore reduction by methane for chemical looping combustion. Energy Fuels 2014, 28, 1387–1395. [Google Scholar] [CrossRef]
- Luo, M.; Wang, S.; Wang, L.; Lv, M. Reduction kinetics of iron-based oxygen carriers using methane for chemical looping combustion. J. Power Sources 2014, 270, 434–440. [Google Scholar] [CrossRef]
- Ghosh, D.; Roy, A.K.; Ghosh, A. Reduction of ferric oxide pellets with methane. ISIJ Int. 1986, 26, 186–193. [Google Scholar] [CrossRef]
- Mattisson, T.; Lyngfelt, A.; Cho, P. The use of iron oxide as an oxygen carrier in chemical-looping combustion of methane with inherent separation of CO2. Fuel 2001, 80, 1953–1962. [Google Scholar] [CrossRef]
- Ksepko, E.; Babinski, P.; Nalbandian, L. The redox reaction kinetics of Sinai ore for chemical looping combustion applications. Appl. Energy 2017, 190, 1258–1274. [Google Scholar] [CrossRef]
- Hou, B.; Zhang, H.; Li, H.; Zhu, Q. Determination of the intrinsic kinetics of iron oxide reduced by carbon monoxide in an isothermal differential micro-packed bed. Chin. J. Chem. Eng. 2015, 23, 974–980. [Google Scholar] [CrossRef]
- Palacios, P.; Toledo, M.; Cabrera, M. Iron ore reduction by methane partial oxidation in a porous media. Int. J. Hydrogen Energy 2015, 40, 9621–9633. [Google Scholar] [CrossRef]
- Pans, M.A.; Gayan, P.; de Diego, L.F.; Garcia-Labiano, F.; Abad, A.; Adanez, J. Performance of a low-cost iron ore as an oxygen carrier for chemical looping combustion of gaseous fuels. Chem. Eng. Res. Des. 2015, 93, 736–746. [Google Scholar] [CrossRef]
- Breault, R.W.; Monazam, E.R.; Carpenter, J.T. Analysis of hematite re-oxidation in the chemical looping process. Appl. Energy 2015, 157, 174–182. [Google Scholar] [CrossRef]
- Breault, R.W.; Monazam, E.R. Fixed bed reduction of hematite under alternating reduction and oxidation cycles. Appl. Energy 2015, 145, 180–190. [Google Scholar] [CrossRef]
- Siriwardane, R.; Tian, H.; Miller, D.; Richards, G. Fluidized bed testing of commercially prepared MgO-promoted hematite and CuO–Fe2O3 mixed metal oxide oxygen carriers for methane and coal chemical looping combustion. Appl. Energy 2015, 157, 348–357. [Google Scholar] [CrossRef]
- Abad, A.; Mattisson, T.; Lyngfelt, A.; Johnasson, M. The use of iron oxide as oxygen carrier in a chemical-looping reactor. Fuel 2007, 86, 1021–1035. [Google Scholar] [CrossRef]
- Cho, P.; Mattisson, T.; Lyngfelt, A. Comparison of iron-, nickel-, copper- and manganese-based oxygen carriers for chemical-looping combustion. Fuel 2004, 83, 1215–1225. [Google Scholar] [CrossRef]
- Weber, J.; Straub, D.; Bayham, S.; Breault, R.W. Operating experience of a 50 kWth methane chemical looping reactor. In Proceedings of the Fluidization XV, Montebello, QC, Canada, 22–27 May 2016. [Google Scholar]
- Breault, R.W.; Yarrington, C.S.; Weber, J.M. The effect of thermal treatment of hematite ore for chemical looping combustion of methane. J. Energy Resour. Technol. 2015, 138, 042202. [Google Scholar] [CrossRef]
- Ridha, F.N.; Duchesne, M.A.; Lu, X.; Lu, D.Y.; Filippou, D.; Hughes, R.W. Characterization of an ilmenite ore for pressurized chemical looping combustion. Appl. Energy 2016, 163, 323–333. [Google Scholar] [CrossRef]
- Bayham, S.; Weber, J.; Straub, D.; Breault, R. Performance of a raw hematite and a manufactured copper-iron oxygen carrier in a 50-kW natural gas chemical looping system. In Proceedings of the 12th International Conference on Fluidized Bed Technology, Krakow, Poland, 23–26 May 2017; pp. 917–924. [Google Scholar]
- Mattisson, T.; Johansson, M.; Lyngfelt, A. Multicycle reduction and oxidation of different types of iron oxide particles application to chemical-looping combustion. Energy Fuels 2004, 18, 628–637. [Google Scholar] [CrossRef]
- Siriwardane, R.; Tian, H.; Simonyi, T.; Poston, J. Synergetic effects of mixed copper-iron oxides oxygen carriers in chemical looping combustion. Fuel 2013, 108, 319–333. [Google Scholar] [CrossRef]
- Schwebel, G.L.; Filippou, D.; Hudon, G.; Tworkowski, M.; Gipperich, A.; Krumm, W. Experimental comparison of two different ilmenites in fluidzed bed and fixed bed chemical-looping combustion. Appl. Energy 2014, 213, 1902–1908. [Google Scholar] [CrossRef]
Figure 1.
Chemical looping combustion concept.
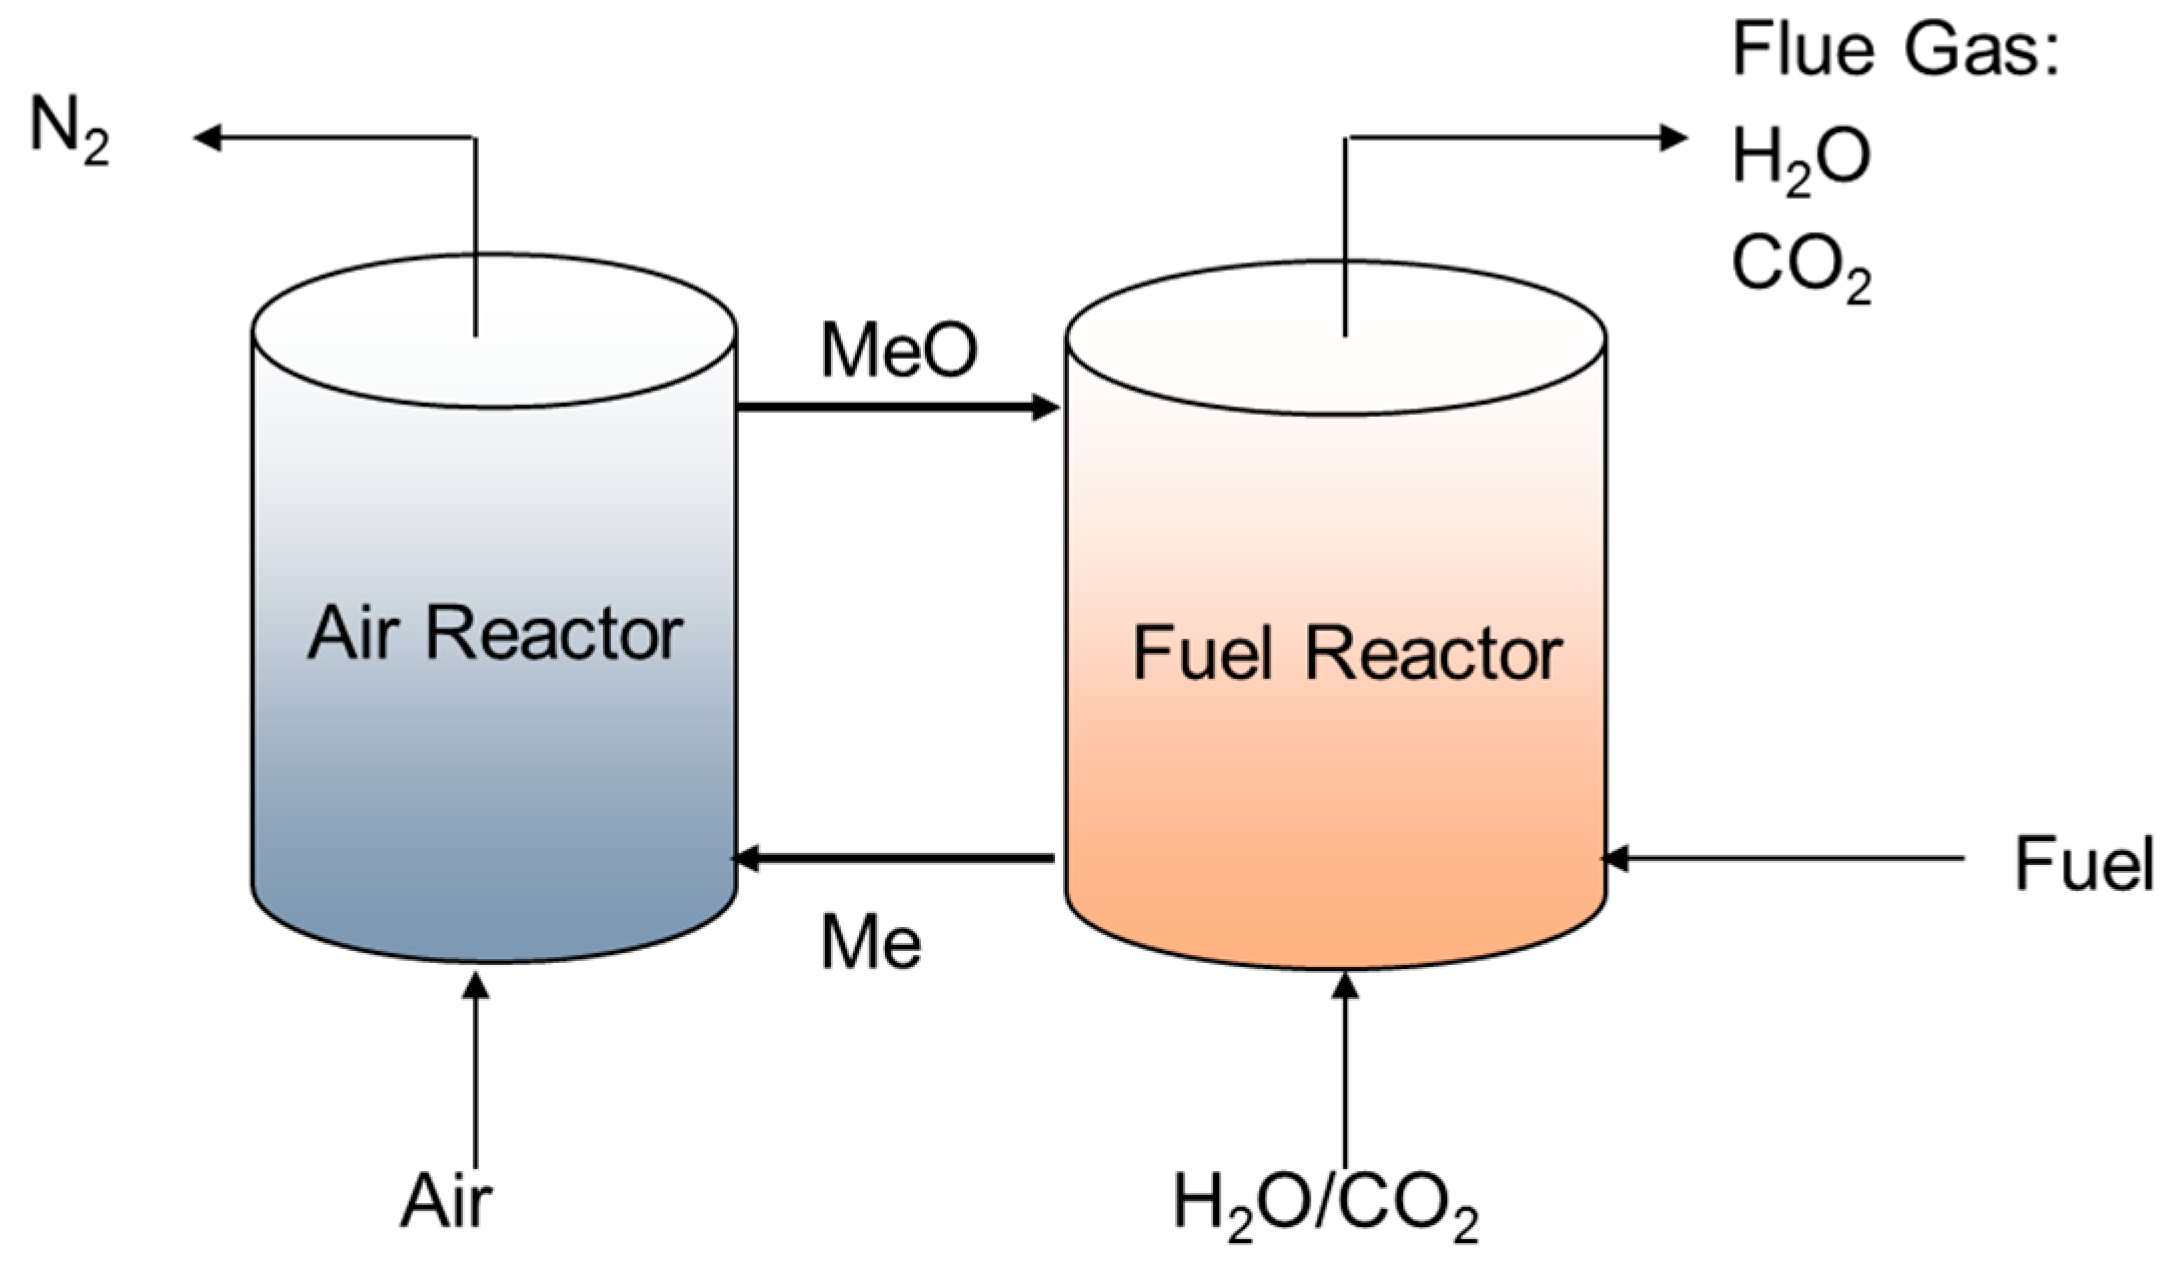
Figure 2.
Experimental setup of the 5 cm small fluidized bed reactor.
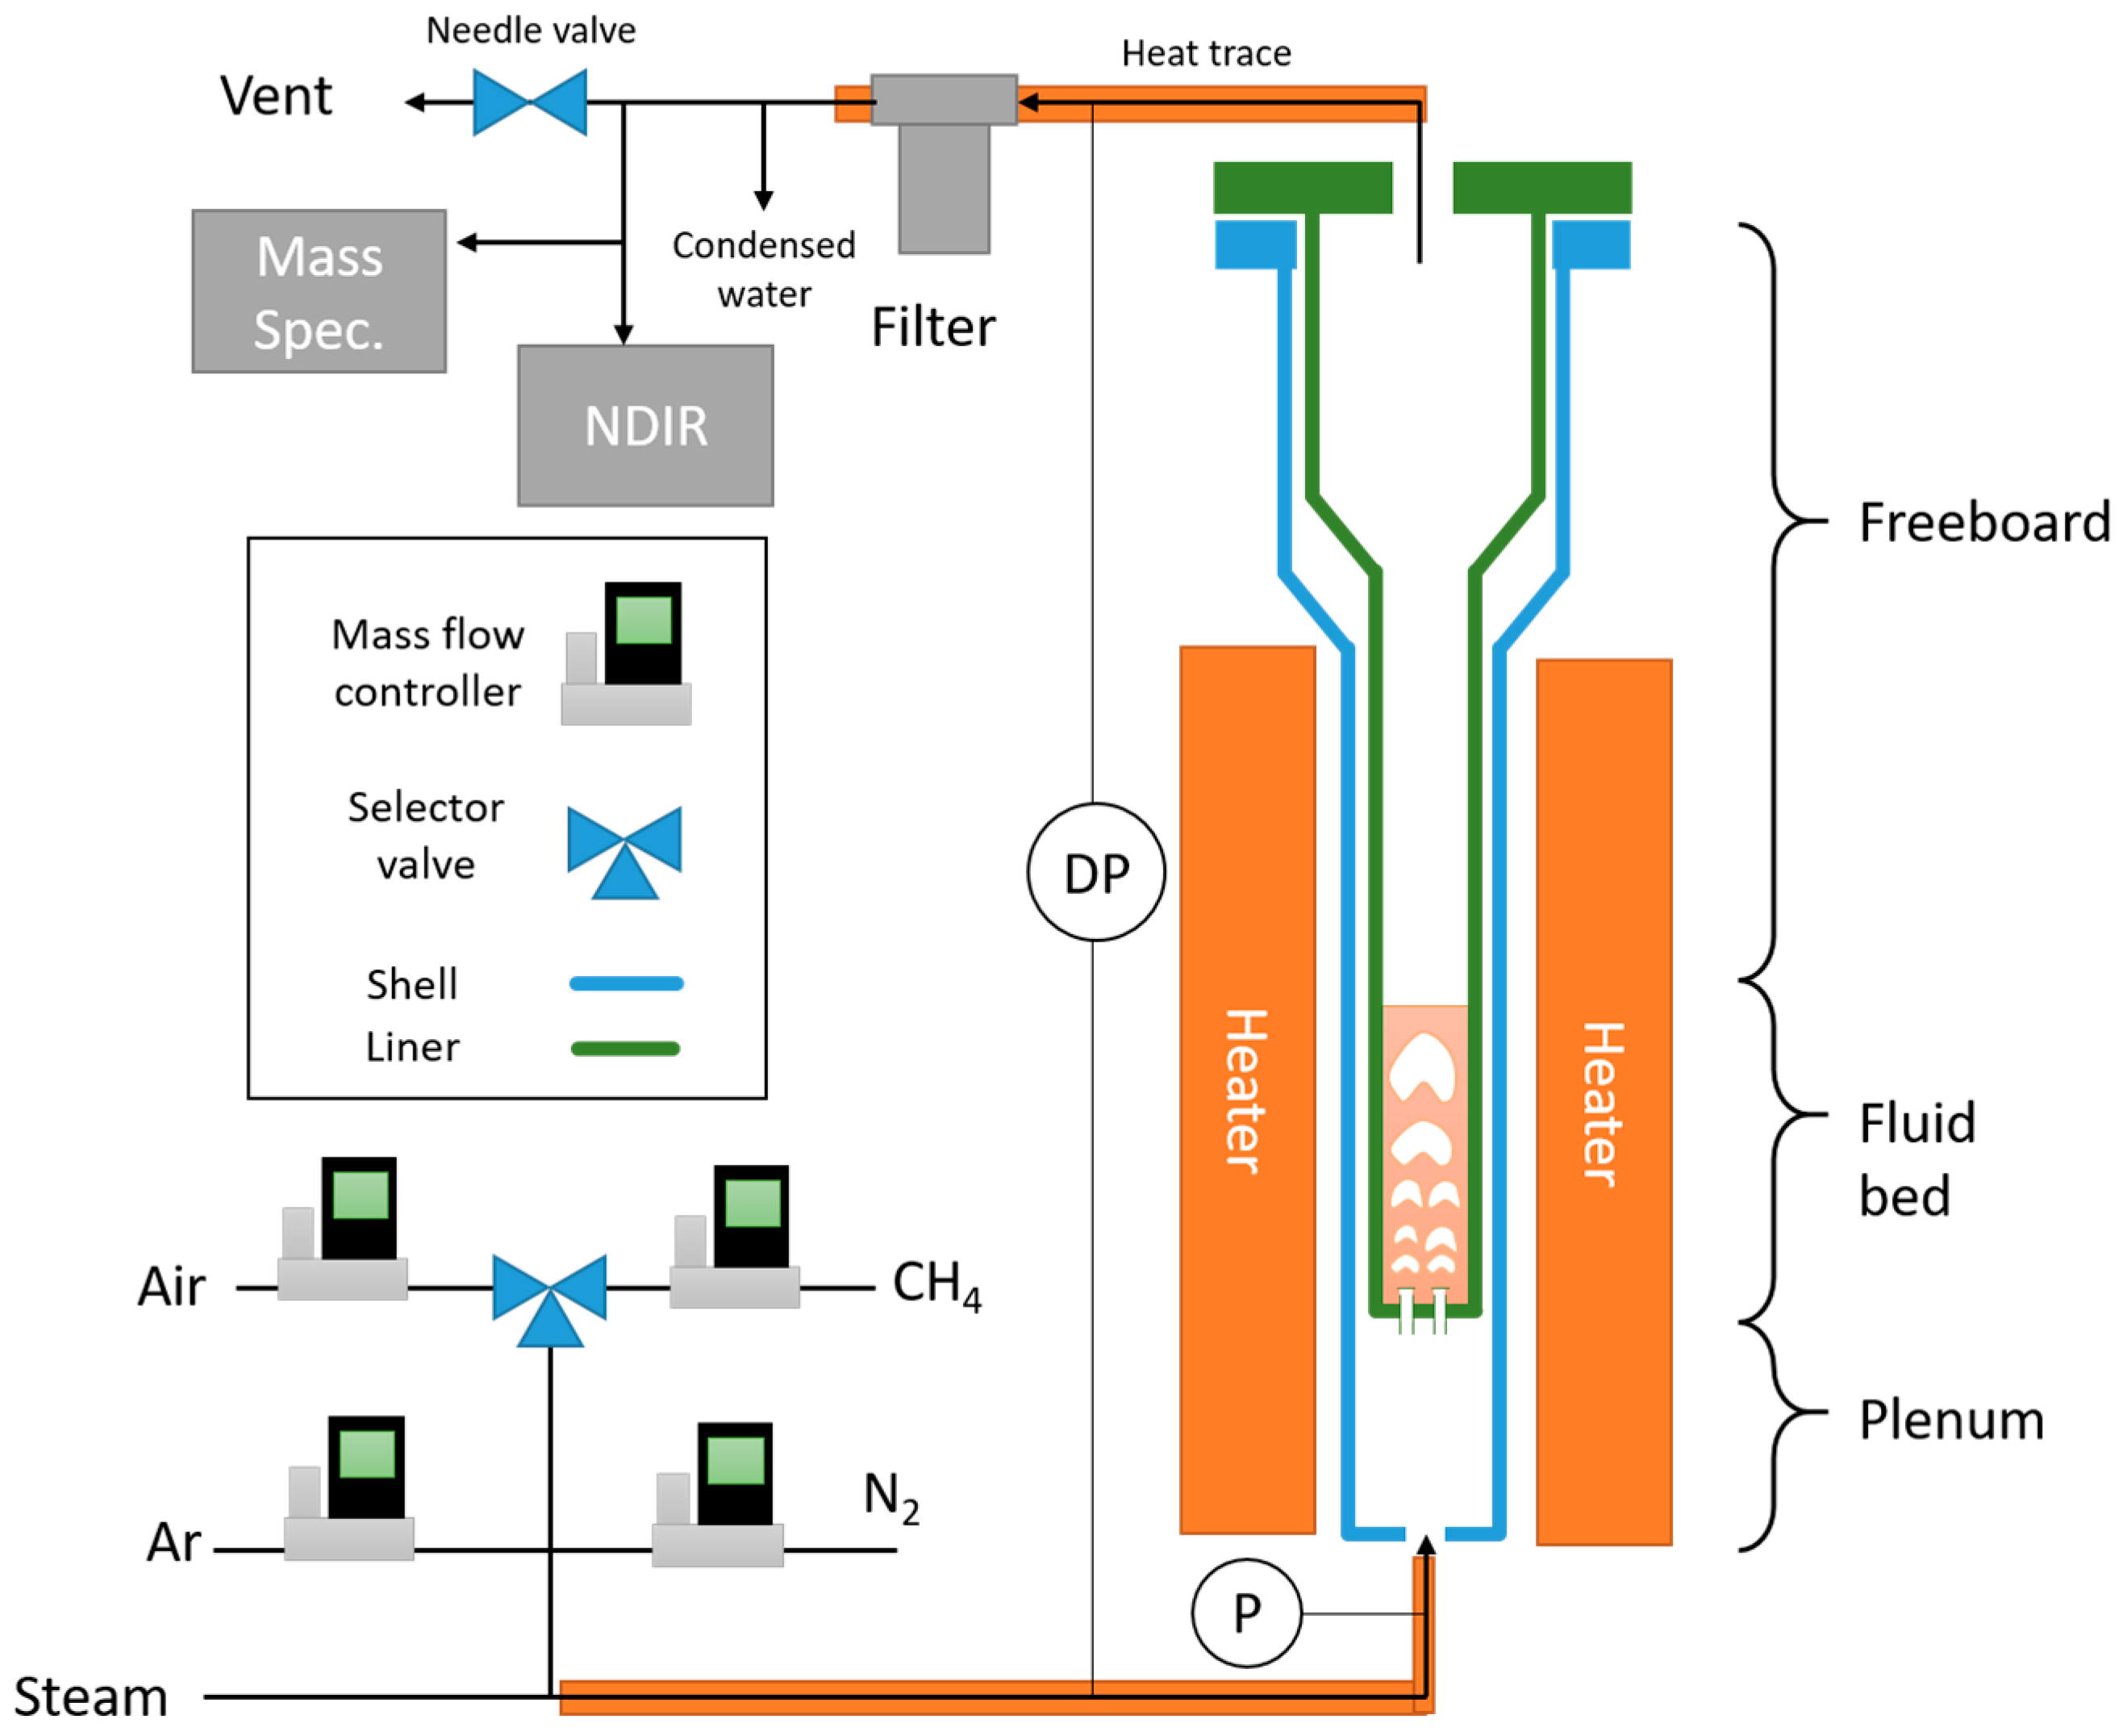
Figure 3.
Particle size distribution of the hematite ore used in this study.
Figure 4.
Transient reduction and oxidation characteristics of hematite without (a) and with (b) steam. This corresponds to trial numbers 11 and 30 from Table 3.
Figure 4.
Transient reduction and oxidation characteristics of hematite without (a) and with (b) steam. This corresponds to trial numbers 11 and 30 from Table 3.
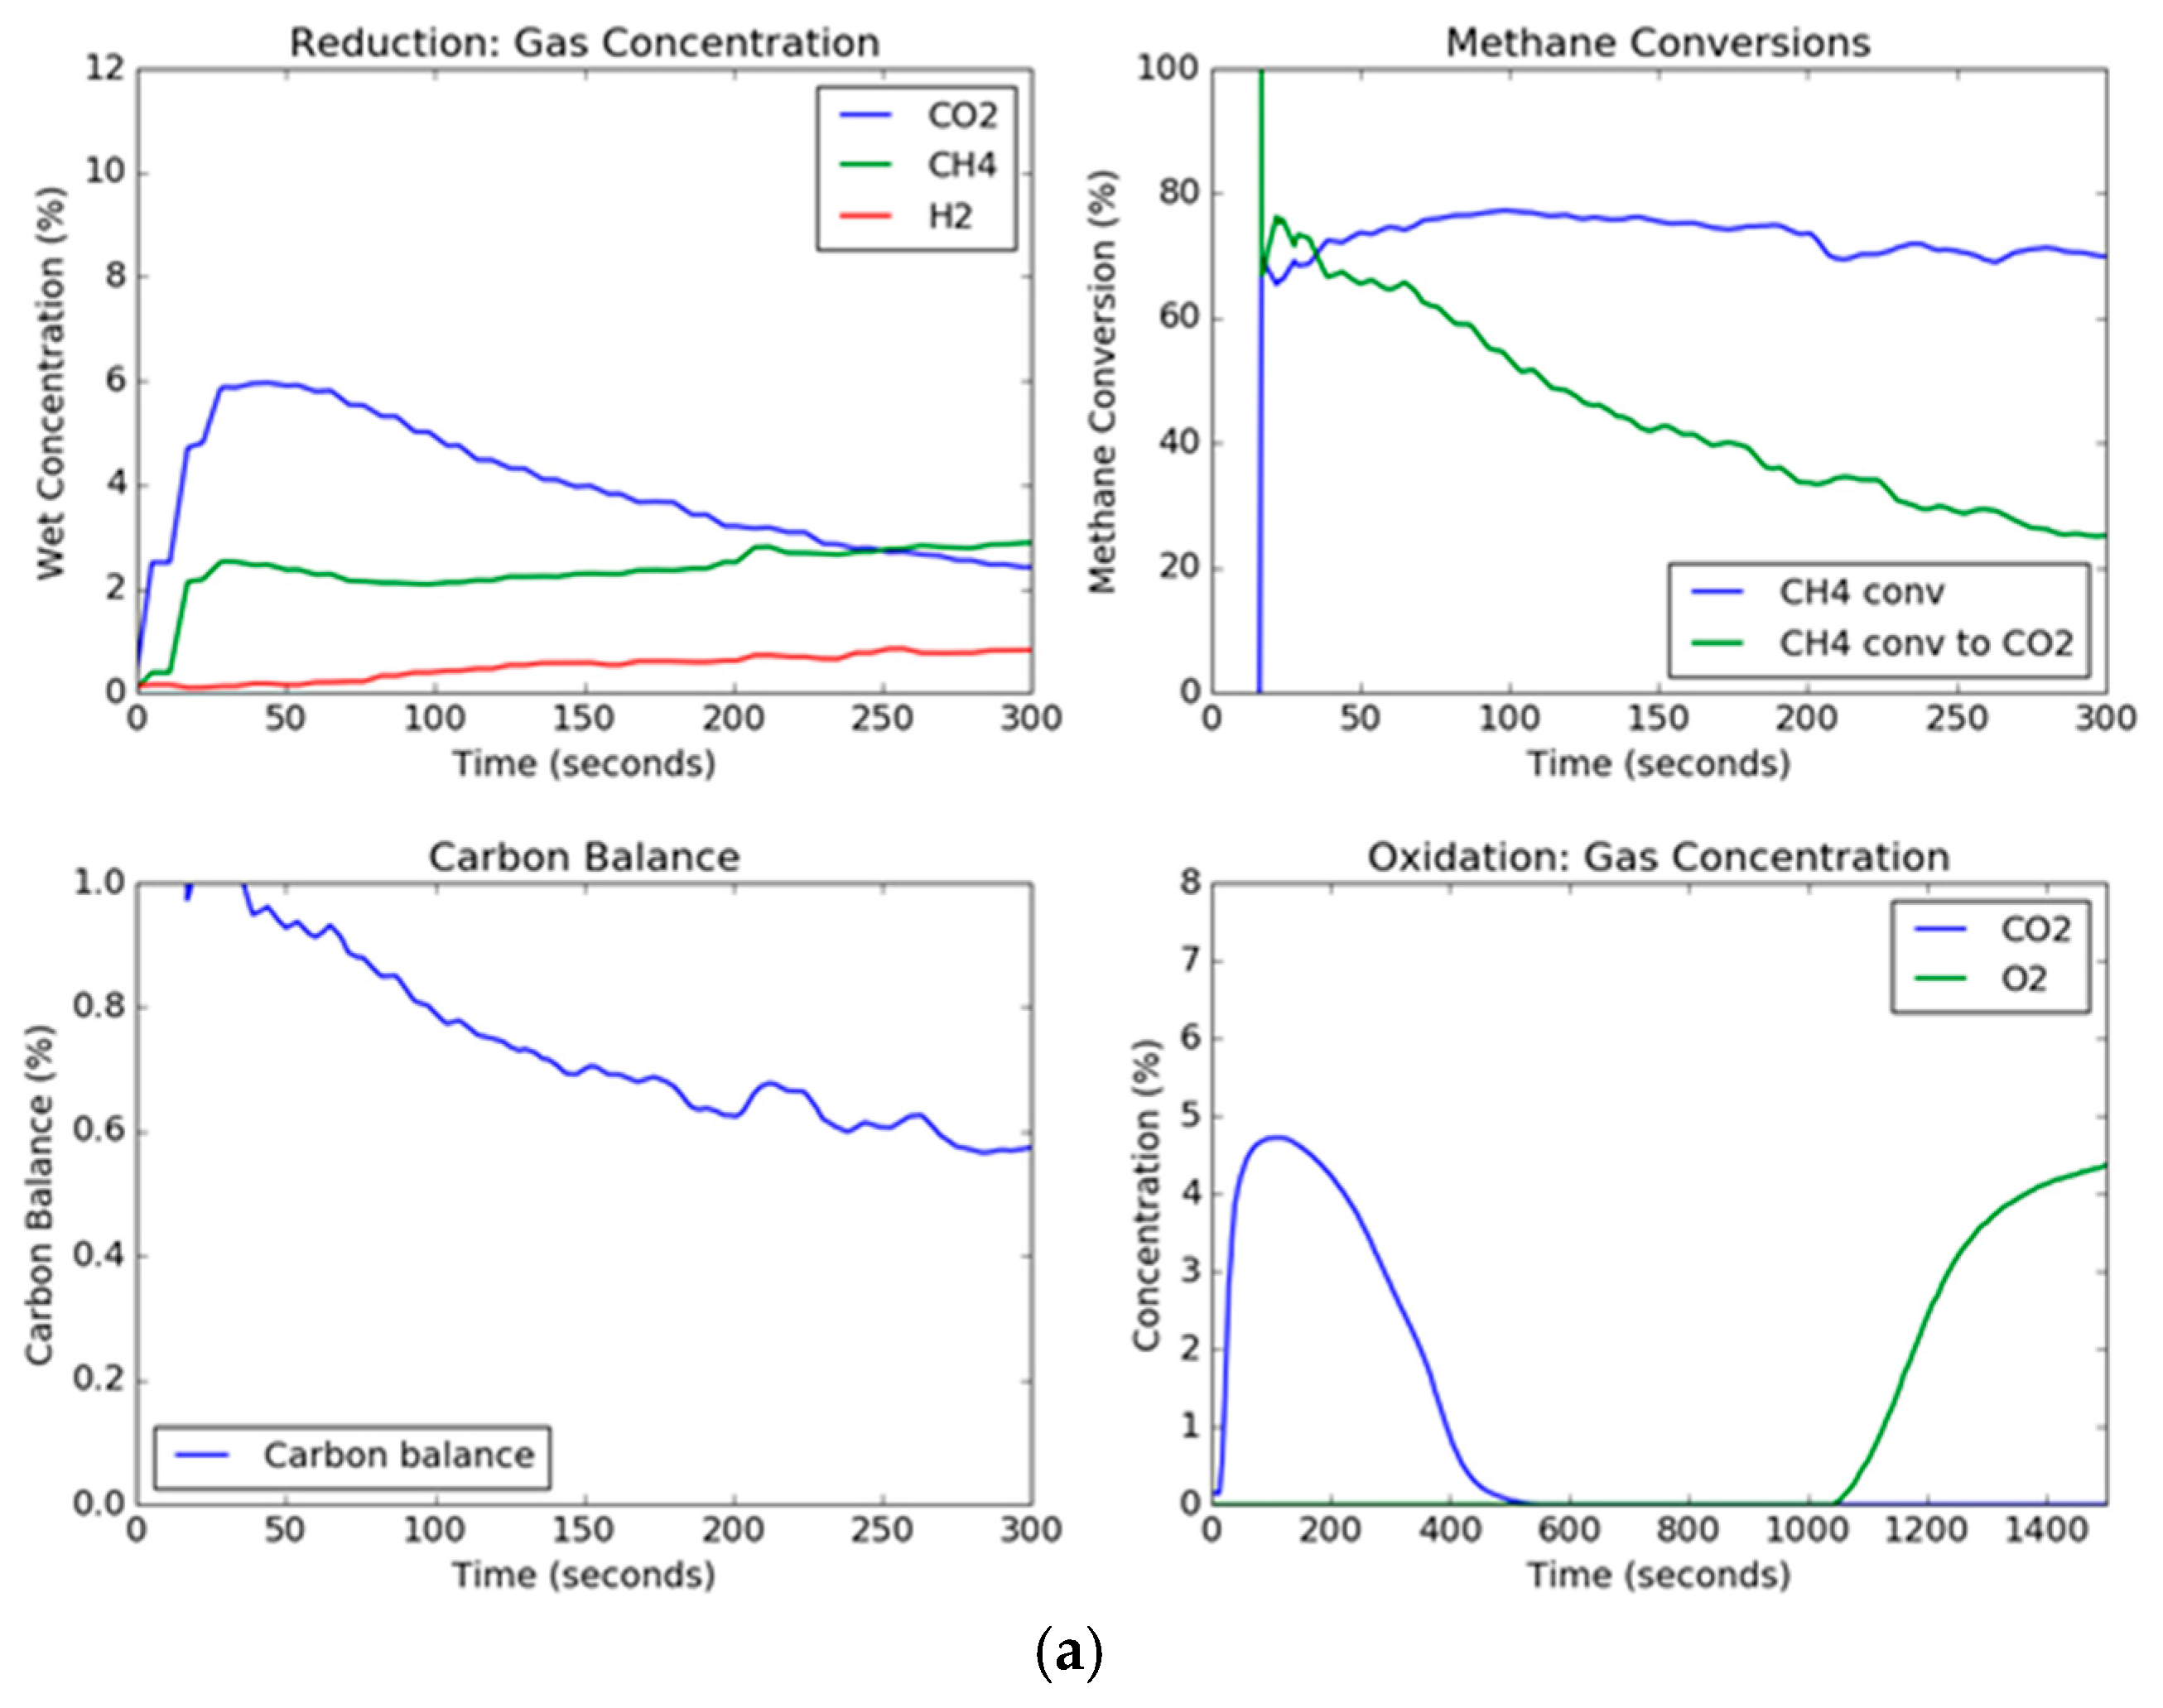
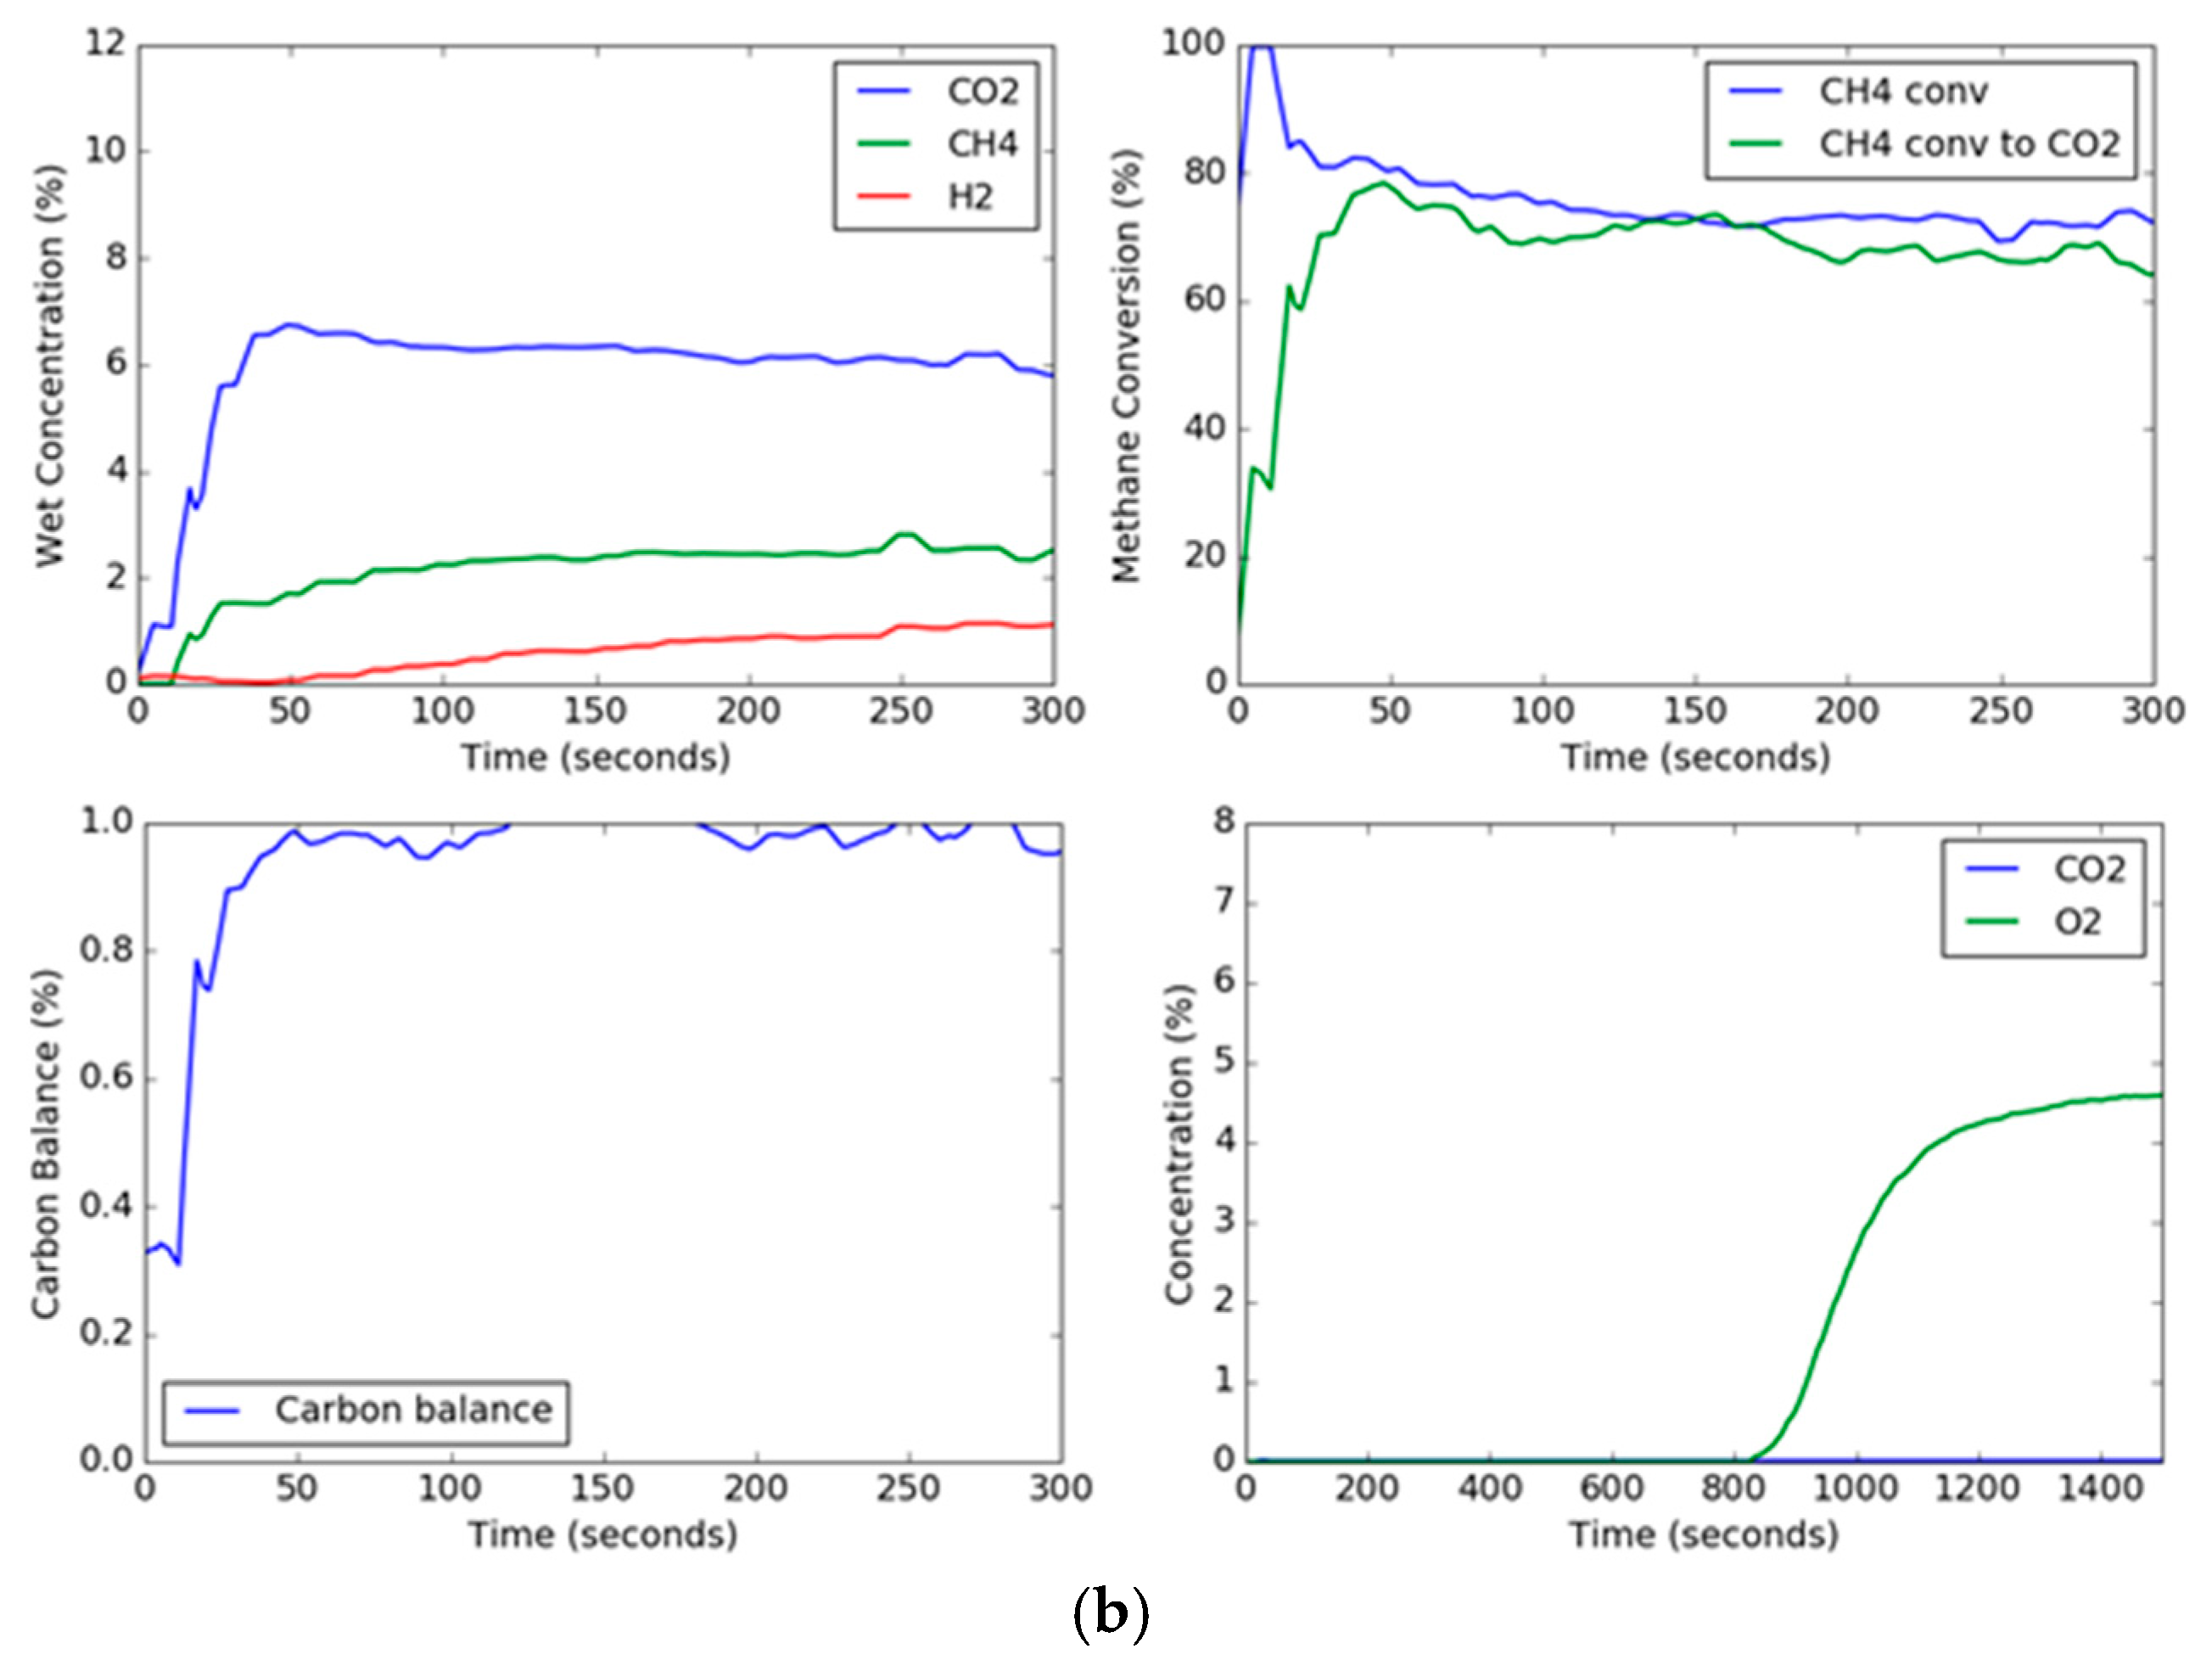
Figure 5.
Total carbon deposited on the oxygen carrier during the reduction periods.
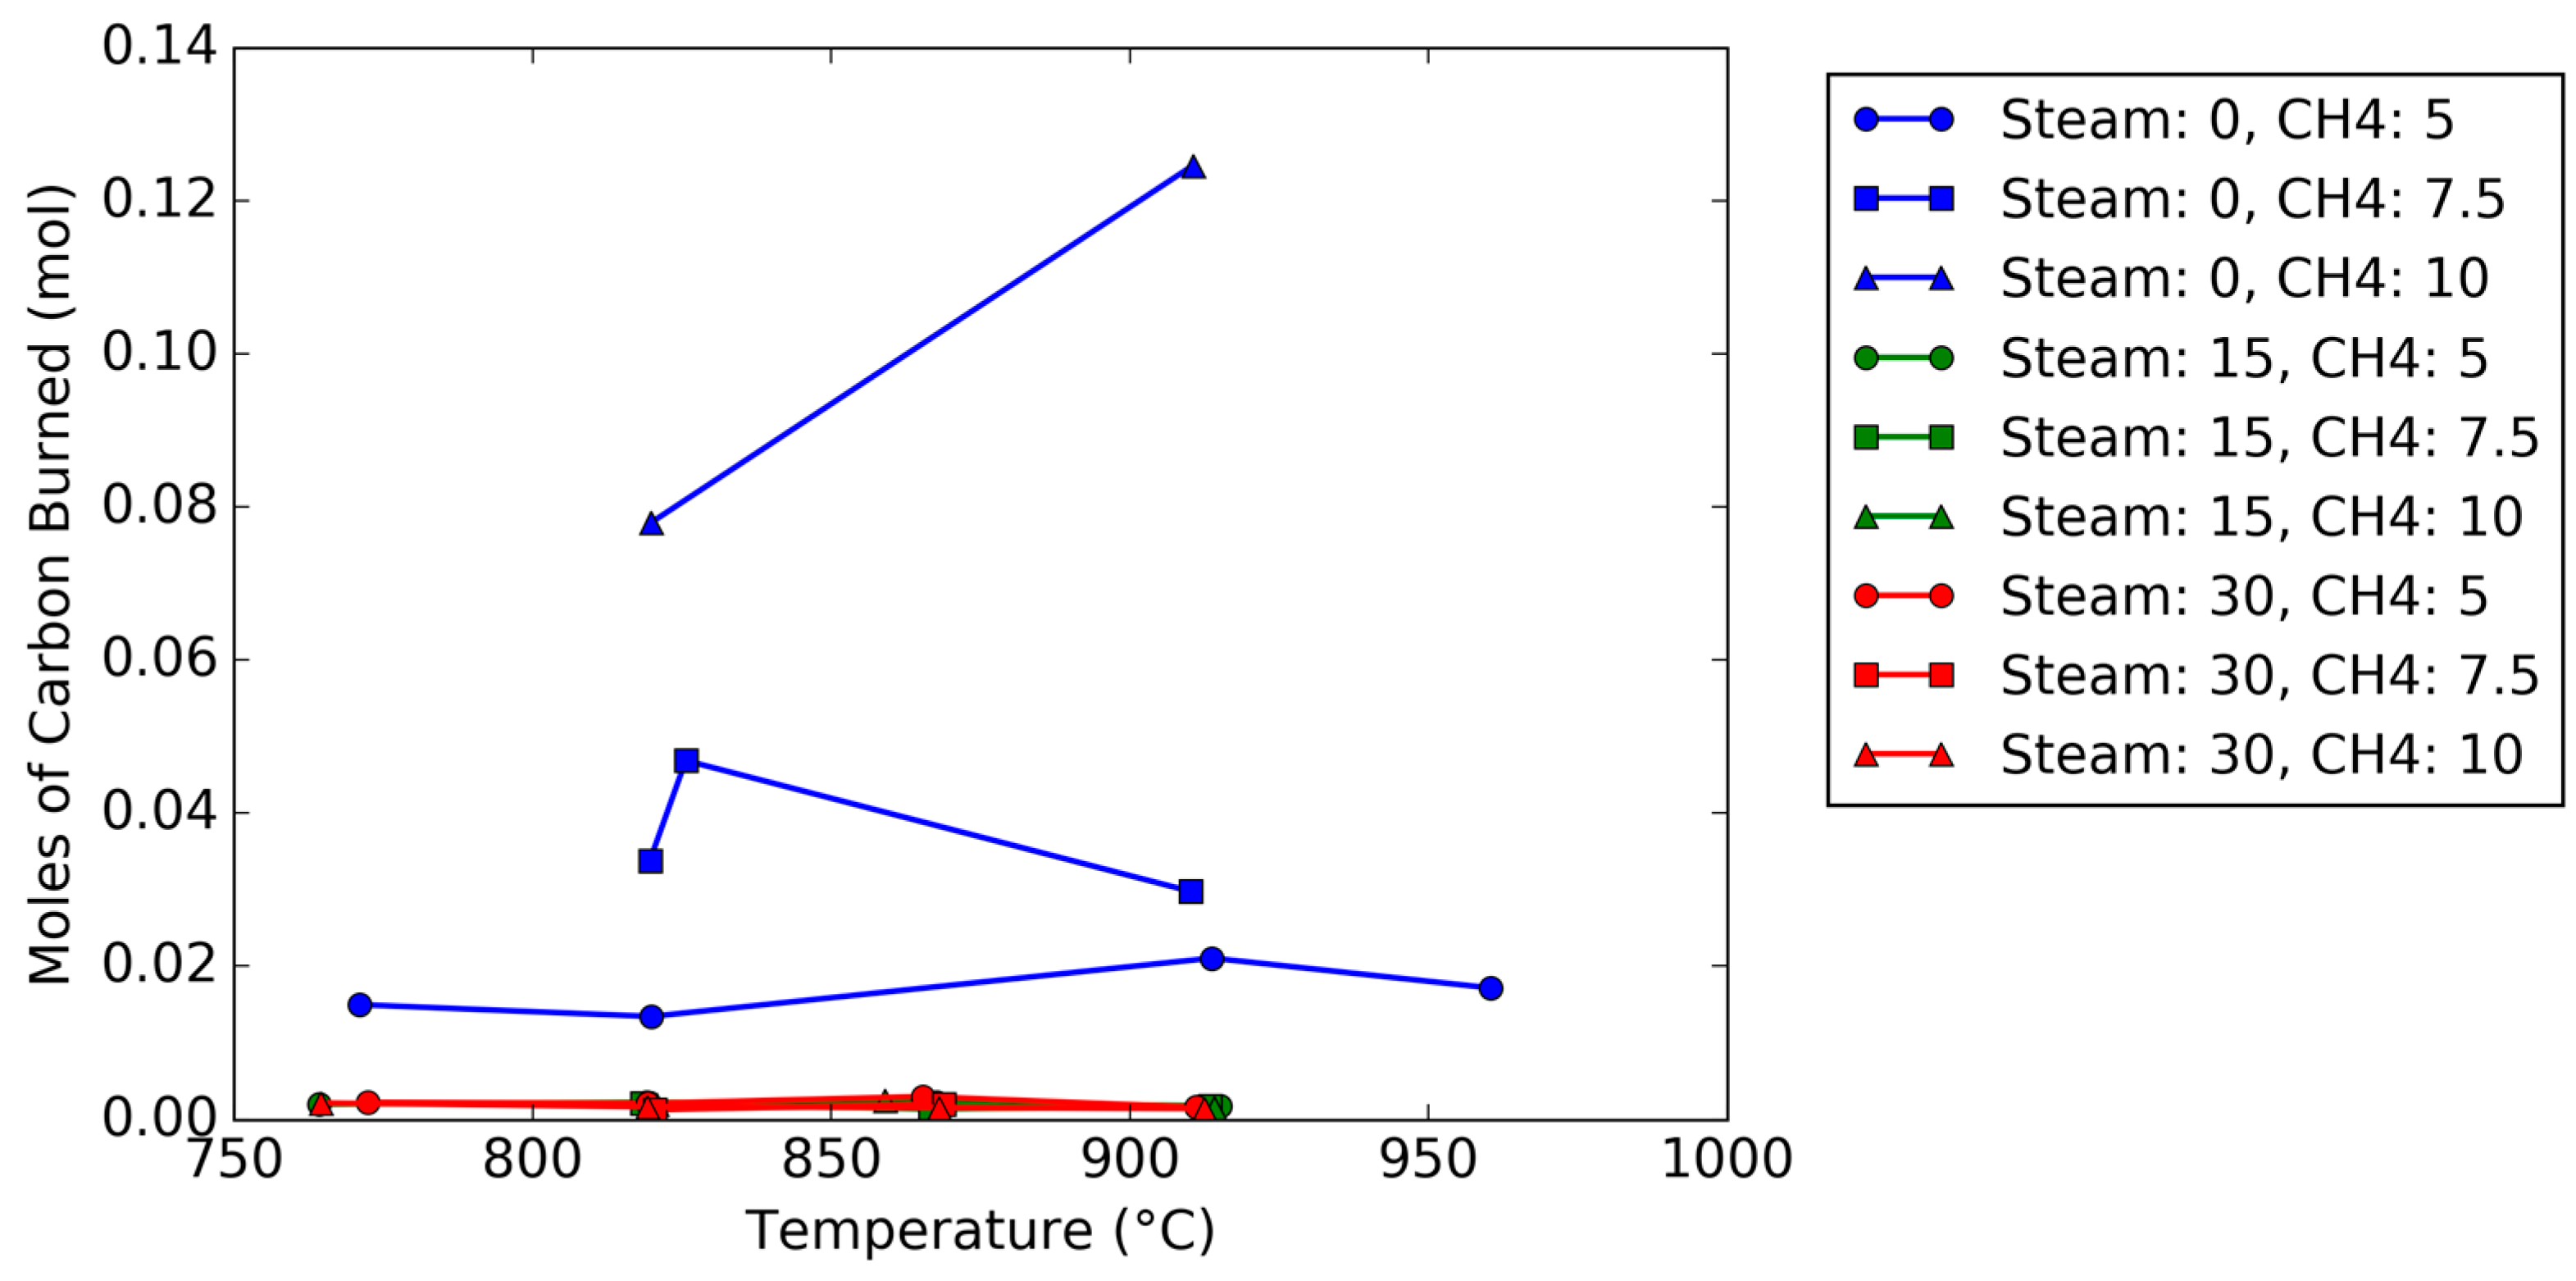
Figure 6.
Conversions during reduction at 200 s based on concentrations and temperatures. (a) methane conversion to CO2; and (b) oxygen carrier conversion. Bars indicate one standard deviation for trials with replicates.
Figure 6.
Conversions during reduction at 200 s based on concentrations and temperatures. (a) methane conversion to CO2; and (b) oxygen carrier conversion. Bars indicate one standard deviation for trials with replicates.
Figure 7.
Molar flowrates in the flue gas of CO2, CH4, CO, and H2 at 200 s for trials at (a) 800 °C, (b) 850 °C, and (c) 900 °C.
Figure 7.
Molar flowrates in the flue gas of CO2, CH4, CO, and H2 at 200 s for trials at (a) 800 °C, (b) 850 °C, and (c) 900 °C.

Figure 8.
Effect of temperature on the (a) overall methane conversion (b) methane conversion to CO2 , (c) oxygen carrier conversion .
Figure 8.
Effect of temperature on the (a) overall methane conversion (b) methane conversion to CO2 , (c) oxygen carrier conversion .

Table 1.
Properties of the hematite oxygen carrier.
| Property | Value | Unit |
|---|---|---|
| Particle density | 4.9 | g/cm3 |
| Sauter mean diameter | 210 | µm |
| D50 | 238 | µm |
| Sphericity | 0.876 | - |
| Minimum fluidization velocity (at 850 °C) | 9.87 | cm/s |
| Fe2O3 | 86.6 | wt. % |
| MnO | 3.4 | wt. % |
| SiO2 | 10.0 | wt. % |
Table 2.
List of parameters for fluidized bed tests.
| Temperature (°C) | CH4 (% in Feed) | Steam (% in Feed) |
|---|---|---|
| 750 | 5 | 0, 15, 30 |
| 800 | 5, 7.5, 10 | 0, 15, 30 |
| 850 | 5, 7.5, 10 | 15, 30, 50 |
| 900 | 5, 7.5, 10 | 0, 15, 30, 50 |
| 950 | 5 | 0 |
Table 3.
Overall results of the hematite testing.
| Target Parameters | Actual Parameters | Results at 200 s Time | |||||||||
|---|---|---|---|---|---|---|---|---|---|---|---|
| Temperature (°C) | (vol %) | (vol %) | Mean Temperature (°C) | (vol %) | (vol %) | Total Flow in (SLPM) | Plenum Pressure (psig) | Order | |||
| 750 | 5 | 0 | 771 | 5.2 | 0 | 12.3 | 65.45 | 30.69 | 1.07 | 4.9 | 13 |
| 750 | 5 | 15 | 764 | 5.1 | 14.9 | 12.2 | 54.87 | 51.7 | 2.53 | 4.89 | 36 |
| 750 | 5 | 30 | 772 | 5 | 30.1 | 12.2 | 46.23 | 39.04 | 5.43 | 4.25 | 44 |
| 750 | 10 | 30 | 765 | 9.9 | 30 | 12.2 | 53.47 | 54.19 | 5.49 | 4.58 | 37 |
| 800 | 5 | 0 | 820 | 5.3 | 0 | 11.9 | 63.51 | 41.24 | 1.22 | 4.55 | 6 |
| 800 | 5 | 15 | 818 | 5.3 | 14.6 | 11.8 | 58.77 | 54.11 | 2.94 | 4.12 | 8 |
| 800 | 5 | 15 | 821 | 5.3 | 15 | 11.7 | 60.58 | 61.91 | 2.83 | 4.82 | 49 |
| 800 | 5 | 30 | 820 | 5.3 | 29.6 | 11.9 | 56.63 | 48.49 | 4.48 | 3.67 | 16 |
| 800 | 5 | 30 | 815 | 5.4 | 29.4 | 11.9 | 58.46 | 52.81 | 4.24 | 4.07 | 46 |
| 800 | 5 | 30 | 822 | 5.4 | 30 | 11.8 | 57.79 | 53.3 | 4.5 | 4.17 | 53 |
| 800 | 7.5 | 0 | 819 | 7.6 | 0.8 | 11.9 | 64.08 | 29.51 | 1.83 | 5.2 | 22 |
| 800 | 7.5 | 0 | 820 | 7.6 | 0 | 11.7 | 59.93 | 28.31 | 1.83 | 5.44 | 50 |
| 800 | 7.5 | 15 | 811 | 7.6 | 14.8 | 11.8 | 65.67 | 67.55 | 3.69 | 4.53 | 38 |
| 800 | 7.5 | 15 | 824 | 7.6 | 14.7 | 11.8 | 65.89 | 65.22 | 3.69 | 4.42 | 40 |
| 800 | 7.5 | 15 | 821 | 7.7 | 14.8 | 11.8 | 64.53 | 58.93 | 3.56 | 4.94 | 55 |
| 800 | 7.5 | 30 | 819 | 7.5 | 29.7 | 11.8 | 60.76 | 58.96 | 4.99 | 4.15 | 25 |
| 800 | 7.5 | 30 | 821 | 7.9 | 29.7 | 11.8 | 64.57 | 54.82 | 4.56 | 4.11 | 26 |
| 800 | 10 | 0 | 820 | 10.1 | 0 | 11.9 | 39.74 | 10.7 | 1.39 | 4.65 | 15 |
| 800 | 10 | 0 | 820 | 10.4 | 0.8 | 11.8 | 57.37 | 19.21 | 2.18 | 5.08 | 21 |
| 800 | 10 | 0 | 820 | 10.3 | 0 | 11.8 | 52.72 | 22.87 | 2.33 | 5.21 | 54 |
| 800 | 10 | 15 | 821 | 10.4 | 14.7 | 11.8 | 66.14 | 60.11 | 4.11 | 4.87 | 28 |
| 800 | 10 | 30 | 819 | 10.2 | 29.9 | 11.7 | 60 | 56.35 | 5.52 | 3.73 | 9 |
| 850 | 5 | 15 | 866 | 4 | 15.5 | 10.8 | 70.28 | 70.86 | 2.81 | 3.76 | 17 |
| 850 | 5 | 15 | 869 | 5.4 | 14.8 | 11.4 | 67.05 | 66.61 | 3.16 | 4.4 | 27 |
| 850 | 5 | 15 | 868 | 5.5 | 14.8 | 11.3 | 70.33 | 68.1 | 3.01 | 4.56 | 34 |
| 850 | 5 | 30 | 865 | 5.3 | 30 | 11.2 | 65.62 | 55.12 | 4.49 | 3.55 | 4 |
| 850 | 5 | 50 | 866 | 5.7 | 48.5 | 11.4 | 48.21 | 36.2 | 6.26 | 2.88 | 7 |
| 850 | 7.5 | 0 | 826 | 7.8 | 0.8 | 11.9 | 51.44 | 22.58 | 1.89 | 5 | 20 |
| 850 | 7.5 | 15 | 866 | 7.4 | 15.1 | 11.1 | 70.2 | 63.41 | 3.37 | 4.61 | 48 |
| 850 | 7.5 | 30 | 868 | 7.4 | 30.1 | 11.1 | 65.59 | 55.76 | 4.93 | 3.27 | 5 |
| 850 | 7.5 | 30 | 868 | 7.3 | 30.4 | 11 | 67.51 | 62.86 | 4.82 | 3.9 | 32 |
| 850 | 7.5 | 30 | 871 | 7.3 | 30.4 | 11 | 67.67 | 64.69 | 4.95 | 3.8 | 45 |
| 850 | 10 | 15 | 859 | 9.7 | 15.2 | 11.1 | 69.96 | 71.01 | 4.21 | 4.35 | 39 |
| 850 | 10 | 30 | 868 | 9.6 | 30.1 | 11.1 | 66.71 | 66.78 | 5.6 | 4.09 | 33 |
| 900 | 5 | 0 | 914 | 5.1 | 0 | 10.8 | 79.64 | 51.64 | 1.32 | 4.15 | 12 |
| 900 | 5 | 15 | 915 | 4.9 | 15 | 10.7 | 80.03 | 69.85 | 3.38 | 4.12 | 41 |
| 900 | 5 | 30 | 911 | 4.8 | 30.3 | 10.6 | 66.76 | 60.05 | 4.23 | 2.62 | 14 |
| 900 | 7.5 | 0 | 910 | 7.6 | 0 | 10.8 | 75.66 | 48.11 | 2.03 | 4.19 | 10 |
| 900 | 7.5 | 15 | 915 | 7.7 | 15 | 10.7 | 77.61 | 76.88 | 4.01 | 3.93 | 29 |
| 900 | 7.5 | 15 | 913 | 7.6 | 15 | 10.7 | 77.75 | 72.06 | 3.73 | 4.29 | 42 |
| 900 | 7.5 | 15 | 912 | 7.7 | 15 | 10.6 | 78.02 | 70.35 | 3.59 | 4.61 | 51 |
| 900 | 10 | 0 | 911 | 10.6 | 0 | 10.7 | 73.57 | 33.69 | 4.74 | 4.15 | 11 |
| 900 | 10 | 15 | 914 | 10.4 | 14.9 | 10.8 | 73.26 | 67.7 | 4.6 | 4.51 | 47 |
| 900 | 10 | 30 | 913 | 10.5 | 29.7 | 10.8 | 73.18 | 66.37 | 5.7 | 3.94 | 30 |
| 900 | 10 | 50 | 912 | 10.1 | 49.5 | 10.8 | 76.34 | 69.96 | 7.89 | 3.33 | 31 |
| 950 | 5 | 0 | 960 | 4.9 | 0.9 | 10.5 | 84.8 | 66.72 | 1.55 | 4.49 | 23 |
Table 4.
Overall results of the hematite testing.
| Target Parameters | Molar Flow Rates | ||||||
|---|---|---|---|---|---|---|---|
| Temperature (°C) | (vol %) | (vol %) | (mol/min) | (mol/min) | (mol/min) | (mol/min) | Order |
| 750 | 5 | 0 | 0.0088 | 0.0099 | 0.0012 | 0.0034 | 13 |
| 750 | 5 | 15 | 0.0141 | 0.0123 | 0.0004 | 0.0021 | 36 |
| 750 | 5 | 30 | 0.0109 | 0.0150 | 0.0004 | 0.0042 | 44 |
| 750 | 10 | 30 | 0.0294 | 0.0254 | 0.0011 | 0.0097 | 37 |
| 800 | 5 | 0 | 0.0119 | 0.0102 | 0.0018 | 0.0042 | 6 |
| 800 | 5 | 15 | 0.0150 | 0.0113 | 0.0015 | 0.0086 | 8 |
| 800 | 5 | 15 | 0.0167 | 0.0106 | 0.0006 | 0.0019 | 49 |
| 800 | 5 | 30 | 0.0142 | 0.0124 | 0.0004 | 0.0033 | 16 |
| 800 | 5 | 30 | 0.0153 | 0.0121 | 0.0004 | 0.0029 | 46 |
| 800 | 5 | 30 | 0.0148 | 0.0114 | 0.0004 | 0.0015 | 53 |
| 800 | 7.5 | 0 | 0.0132 | 0.0143 | 0.0000 | 0.0029 | 22 |
| 800 | 7.5 | 0 | 0.0116 | 0.0159 | 0.0008 | 0.0024 | 50 |
| 800 | 7.5 | 15 | 0.0271 | 0.0135 | 0.0009 | 0.0041 | 38 |
| 800 | 7.5 | 15 | 0.0261 | 0.0137 | 0.0013 | 0.0045 | 40 |
| 800 | 7.5 | 15 | 0.0250 | 0.0152 | 0.0012 | 0.0029 | 55 |
| 800 | 7.5 | 30 | 0.0240 | 0.0160 | 0.0016 | 0.0109 | 25 |
| 800 | 7.5 | 30 | 0.0232 | 0.0151 | 0.0011 | 0.0076 | 26 |
| 800 | 10 | 0 | 0.0058 | 0.0324 | 0.0007 | 0.0054 | 15 |
| 800 | 10 | 0 | 0.0119 | 0.0217 | 0.0000 | 0.0049 | 21 |
| 800 | 10 | 0 | 0.0135 | 0.0234 | 0.0010 | 0.0031 | 54 |
| 800 | 10 | 15 | 0.0330 | 0.0185 | 0.0029 | 0.0105 | 28 |
| 800 | 10 | 30 | 0.0301 | 0.0214 | 0.0028 | 0.0195 | 9 |
| 850 | 5 | 15 | 0.0138 | 0.0058 | 0.0004 | 0.0021 | 17 |
| 850 | 5 | 15 | 0.0183 | 0.0090 | 0.0007 | 0.0024 | 27 |
| 850 | 5 | 15 | 0.0190 | 0.0082 | 0.0007 | 0.0014 | 34 |
| 850 | 5 | 30 | 0.0154 | 0.0102 | 0.0009 | 0.0062 | 4 |
| 850 | 5 | 50 | 0.0111 | 0.0133 | 0.0002 | 0.0004 | 7 |
| 850 | 7.5 | 0 | 0.0093 | 0.0199 | 0.0000 | 0.0041 | 20 |
| 850 | 7.5 | 15 | 0.0229 | 0.0107 | 0.0014 | 0.0030 | 48 |
| 850 | 7.5 | 30 | 0.0207 | 0.0125 | 0.0015 | 0.0091 | 5 |
| 850 | 7.5 | 30 | 0.0224 | 0.0116 | 0.0010 | 0.0042 | 32 |
| 850 | 7.5 | 30 | 0.0230 | 0.0115 | 0.0007 | 0.0033 | 45 |
| 850 | 10 | 15 | 0.0339 | 0.0144 | 0.0014 | 0.0049 | 39 |
| 850 | 10 | 30 | 0.0319 | 0.0159 | 0.0016 | 0.0067 | 33 |
| 900 | 5 | 0 | 0.0126 | 0.0050 | 0.0007 | 0.0009 | 12 |
| 900 | 5 | 15 | 0.0161 | 0.0047 | 0.0003 | 0.0001 | 41 |
| 900 | 5 | 30 | 0.0137 | 0.0075 | 0.0001 | 0.0014 | 14 |
| 900 | 7.5 | 0 | 0.0183 | 0.0090 | 0.0010 | 0.0022 | 10 |
| 900 | 7.5 | 15 | 0.0284 | 0.0083 | 0.0005 | 0.0017 | 29 |
| 900 | 7.5 | 15 | 0.0263 | 0.0082 | 0.0010 | 0.0018 | 42 |
| 900 | 7.5 | 15 | 0.0257 | 0.0080 | 0.0008 | 0.0015 | 51 |
| 900 | 10 | 0 | 0.0169 | 0.0133 | 0.0012 | 0.0033 | 11 |
| 900 | 10 | 15 | 0.0337 | 0.0126 | 0.0020 | 0.0032 | 47 |
| 900 | 10 | 30 | 0.0334 | 0.0135 | 0.0016 | 0.0047 | 30 |
| 900 | 10 | 50 | 0.0351 | 0.0103 | 0.0016 | 0.0002 | 31 |
| 950 | 5 | 0 | 0.0154 | 0.0035 | 0.0000 | 0.0007 | 23 |
Table 5.
Overall goodness-of-fit parameters for ordinary least squares regression results for methane conversion to carbon ().
Table 5.
Overall goodness-of-fit parameters for ordinary least squares regression results for methane conversion to carbon ().
| Parameter | Value |
|---|---|
| R-squared | 83.0% |
| Adj. R-squared | 78.1% |
| F-statistic | 17.05 |
| Prob ( F-statistic) | 1.16 × 10⁻¹⁰ |
| No. Observations | 46 |
| Degrees of Freedom: Residuals | 35 |
| Degrees of Freedom: Model | 10 |
| Condition Number | 12.3 |
Table 6.
Individual coefficients and errors for ordinary least squares regression results for methane conversion to carbon ().
Table 6.
Individual coefficients and errors for ordinary least squares regression results for methane conversion to carbon ().
| Independent Variables | Coefficient | Standard Error | t | p > |t| | 95.0% Confidence Interval | ||
|---|---|---|---|---|---|---|---|
| Intercept | 0.6571 | 0.019 | 34.693 | 0.000 | 0.619 | 0.696 | |
| T’ | 0.2522 | 0.044 | 5.783 | 0.000 | 0.164 | 0.341 | |
| P’ | 0.2511 | 0.057 | 4.425 | 0.000 | 0.136 | 0.366 | |
| 0.1826 | 0.039 | 4.717 | 0.000 | 0.104 | 0.261 | ||
| −0.0357 | 0.025 | −1.433 | 0.161 | −0.086 | 0.015 | ||
| −0.0273 | 0.100 | −0.272 | 0.787 | −0.231 | 0.176 | ||
| 0.1485 | 0.071 | 2.092 | 0.044 | 0.004 | 0.293 | ||
| −0.0409 | 0.052 | −0.786 | 0.437 | −0.147 | 0.065 | ||
| 0.4316 | 0.066 | 6.536 | 0.000 | 0.298 | 0.566 | ||
| 0.0573 | 0.090 | 0.634 | 0.530 | −0.126 | 0.241 | ||
| 0.1056 | 0.059 | 1.782 | 0.083 | −0.015 | 0.226 | ||
Table 7.
Overall goodness-of-fit parameters for ordinary least squares regression results for oxygen carrier conversion ().
Table 7.
Overall goodness-of-fit parameters for ordinary least squares regression results for oxygen carrier conversion ().
| Parameter | Value |
|---|---|
| R-squared | 95.9% |
| Adj. R-squared | 94.7% |
| F-statistic | 81.1 |
| Prob (F-statistic) | 3.50 × 10⁻²¹ |
| No. Observations | 46 |
| Degrees of Freedom: Residuals | 35 |
| Degrees of Freedom: Model | 10 |
| Condition Number | 12.3 |
Table 8.
Individual coefficients and errors for ordinary least squares regression results for oxygen carrier conversion ().
Table 8.
Individual coefficients and errors for ordinary least squares regression results for oxygen carrier conversion ().
| Independent Variables | Coefficient | Standard Error | t | p > |t| | 95.0% Confidence Interval | ||
|---|---|---|---|---|---|---|---|
| Intercept | 0.0443 | 0.001 | 51.240 | 0.000 | 0.043 | 0.046 | |
| T’ | 0.0015 | 0.002 | 0.763 | 0.451 | −0.003 | 0.006 | |
| P’ | −0.0007 | 0.003 | −0.283 | 0.779 | −0.006 | 0.005 | |
| 0.0243 | 0.002 | 13.757 | 0.000 | 0.021 | 0.028 | ||
| 0.0089 | 0.001 | 7.788 | 0.000 | 0.007 | 0.011 | ||
| −0.0074 | 0.005 | −1.606 | 0.117 | −0.017 | 0.002 | ||
| −0.0100 | 0.003 | −3.076 | 0.004 | −0.017 | −0.003 | ||
| 0.0067 | 0.002 | 2.825 | 0.008 | 0.002 | 0.012 | ||
| 0.0013 | 0.003 | 0.422 | 0.675 | −0.005 | 0.007 | ||
| −0.0017 | 0.004 | −0.401 | 0.691 | −0.010 | 0.007 | ||
| −0.0018 | 0.003 | −0.662 | 0.512 | −0.007 | 0.004 | ||
© 2017 by the authors. Licensee MDPI, Basel, Switzerland. This article is an open access article distributed under the terms and conditions of the Creative Commons Attribution (CC BY) license (http://creativecommons.org/licenses/by/4.0/).
Share and Cite
MDPI and ACS Style
Bayham, S.; Breault, R.; Weber, J. Chemical Looping Combustion of Hematite Ore with Methane and Steam in a Fluidized Bed Reactor. Energies 2017, 10, 1179. https://doi.org/10.3390/en10081179
AMA Style
Bayham S, Breault R, Weber J. Chemical Looping Combustion of Hematite Ore with Methane and Steam in a Fluidized Bed Reactor. Energies. 2017; 10(8):1179. https://doi.org/10.3390/en10081179
Chicago/Turabian StyleBayham, Samuel, Ronald Breault, and Justin Weber. 2017. "Chemical Looping Combustion of Hematite Ore with Methane and Steam in a Fluidized Bed Reactor" Energies 10, no. 8: 1179. https://doi.org/10.3390/en10081179
Note that from the first issue of 2016, this journal uses article numbers instead of page numbers. See further details here.