A Techno-Economic Study of an Entirely Renewable Energy-Based Power Supply for North America for 2030 Conditions


Department of Electrical Engineering, School of Energy Systems, Lappeenranta University of Technology, Skinnarilankatu 34, Lappeenranta 53850, Finland
*
Author to whom correspondence should be addressed.
Energies 2017, 10(8), 1171; https://doi.org/10.3390/en10081171
Submission received: 29 June 2017
/
Revised: 23 July 2017
/
Accepted: 3 August 2017
/
Published: 9 August 2017
(This article belongs to the Special Issue Sustainable Energy Technologies)
Abstract
:In this study power generation and demand are matched through a least-cost mix of renewable energy (RE) resources and storage technologies for North America by 2030. The study is performed using an hourly resolved model based on a linear optimization algorithm. The geographical, technical and economic potentials of different forms of RE resources enable the option of building a super grid between different North American regions. North America (including the U.S., Canada and Mexico in this paper), is divided into 20 sub-regions based on their population, demand, area and electricity grid structure. Four scenarios have been evaluated: region-wide, country-wide, area-wide and an integrated scenario. The levelised cost of electricity is found to be quite attractive in such a system, with the range from 63 €/MWhel in a decentralized case and 42 €/MWhel in a more centralized and integrated scenario. Electrical grid interconnections significantly reduce the storage requirement and overall cost of the energy system. Among all RE resources, wind and solar PV are found to be the least-cost options and hence the main contributors to fossil fuel substitution. The results clearly show that a 100% RE-based system is feasible and a real policy option at a modest cost. However, such a tremendous transition will not be possible in a short time if policy-makers, energy investors and other relevant organizations do not support the proposed system.
1. Introduction
Over the past few decades, global population has increased and living standards have advanced dramatically in many parts of the world. Consequently, energy demand is increasing, particularly in the Organization for Economic Cooperation and Development (OECD) countries due to their high economic development and advanced lifestyle. In fact, although the U.S. has less than 5% of the world’s population [1], it consumes as much as 25% of the global primary energy used [2]. Increasing world population will lead to several formidable challenges, such as climate change, a greater gap between energy demand and supply, and depletion of fossil fuel resources. Phasing out nuclear and fossil fuels is unlikely to be generally acceptable, but eliminating greenhouse gas emissions, known also as the “net zero emissions” target by mid-21st century agreed at Conference of the Parties (COP21) in Paris, clearly guides the pathway towards sustainability [3].
The technical, geographical and economic potentials of various forms of renewable energy (RE) resources in North America enable a lucrative “super grid” connection between the continent’s regional energy systems to obtain synergy effects and make a 100% RE supply possible [4,5,6,7]. North America’s wealth of RE resources are comprised of solar energy, wind energy, hydropower, geothermal, biomass and waste-to-energy resources. As the cost of RE technologies begins to compete with that of conventional forms of energy, a transition to an entirely RE-based system has become more feasible. This is reflected in the significant growth of the North American solar photovoltaic (PV) and wind markets in recent years [8,9]. The U.S. is the country with the largest solar potential in North America and by the end of 2015 it harnessed a fraction of the solar resource via 26 GW of installed PV capacity [10]. The growth is also driven by the fact that solar PV is the least costly power source in an increasing number of states [11]. By the end of 2015, the total solar PV installed capacity in North America was 28 GW [10,12].
It is expected that the costs of solar PV and wind energy will further decrease in the coming years, while the installed capacities will increase substantially. However, reduction of cost and increase of installed capacities mainly depend on the defined target and goals. The International Energy Agency (IEA) projected in its World Energy Outlook report [13] that the installed capacity of PV in North America will reach around 100 GW by 2030. In the New Policies Scenario, solar PV is expected to be a key low-carbon technology in many regions of the world, exceeding 1000 GW of installed capacity globally by 2040. This is one of the most conservative projections for solar PV [14]. The Fraunhofer Institute for Solar Energy System (ISE) [15] in the Average Value Scenario estimated that the installed capacity of PV will reach 2016 GW globally by 2030. In this report, the levelised cost of electricity (LCOE) predicted for solar PV is around 45–70 €/MWh by 2030. However, the latest report of International Renewable Energy Agency (IRENA) [16] has shown that LCOE for solar PV will drop by 59% compared to the year 2015 and become 44 €/MWh by 2025. The U.S. Dollar to Euro foreign exchange rate is assumed to be 1.35 in this paper, as this represents the long-term averaged value. In contrast, already in the year 2016 several PV projects had been contracted for prices well below 37 €/MWh, for instance in Mexico [17] and Peru [18]. The financial analysts of Lazard mentioned utility-scale PV projects in 2015 being possible at a cost level of 37–43 €/MWh and a further decline to 32–34 €/MWh in 2017 was expected [19]. As a result, different institutes, organizations and agencies forecast the future of RE resources according to their visions, but reality is progressing very fast and typically faster than the expectations and forecasts.
Renewable energy policy has been largely driven in the U.S. by supply security concerns on the federal level, and economic activity and greenhouse gas mitigation concerns on the state level [20]. Recently, the U.S. federal and some state governments have supported extending many forms of renewable power generation. On the federal level, reducing the dependence on oil imports is crucial. Renewables can help to meet this independence as part of the strategy. The national energy strategy of the U.S. has been classified as an “all-of-the-above strategy” [20]. The key goals being highlighted in this strategy are generating more electricity from RE resources, consuming less oil while holding electricity consumption constant, achieving significant economic and energy security benefits, reducing carbon emissions in the energy sector and as a consequence tackling the challenges posed by climate change [20].
Canada is a world leader in the production and consumption of RE. In the electricity sector, hydropower is the largest RE source in Canada, accounting for around 60% of electricity generation in the country. Other sources of RE, such as biomass, wind, tidal and solar contribute to increasing the share of renewables to over 63% [21]. Therefore, over 63% of Canada’s electricity generation does not emit greenhouse gases. The rest of the required power comes from nuclear, with almost 14%, and fossil fuels, with 22% of the total share [21]. Increasing the use of RE for electricity generation is mainly because of a number of policy initiatives undertaken by provincial and federal governments. All provinces across Canada have been increasing the use of RE through a number of initiatives, including feed-in tariff programs, legislated renewable portfolio standards and offset programs acquired through requests for proposals [21]. The role of wind energy in contributing to emission reduction targets is remarkable. For instance, Alberta and Saskatchewan consider wind energy as an important element to achieve the objective of reducing greenhouse gas intensity of the provinces’ electricity sectors. The Alberta government has set a target to provide 30% of Alberta’s electricity by wind, hydro and solar energy by 2030 [22]. In other provinces commitments have been made for dramatic reductions across the wider economy, mostly by electrification with zero-carbon electricity.
Canada and the United States trade electricity across their shared border and renewables play a key role in this trade. Provinces that have significant hydropower resources, such as Quebec, Newfoundland & Labrador, Manitoba, British Columbia and Yukon are the major net exporters of electricity. Recently, Manitoba exported more than one-fourth of its electricity production into the U.S. Midwest [21].
According to IRENA [23], Mexico has a target of 25% electricity from clean energy sources by 2018, 35% by 2024, 40% by 2035 and 50% by 2050. IRENA defines clean energy to include renewables, nuclear energy, cogeneration, fossil fuels with carbon capture and storage (CCS) and other low-carbon technologies. However, nuclear energy and fossil fuels with CCS have not proven to be a source of clean energy. Coal based CCS would still emit smog and heavy metals causing local health problems [24] and the CO2 extraction with less than 90% efficiency is too low for a net zero emission world. Meanwhile, nuclear energy violates all sustainability criteria, due to the exposure to nuclear accidents, hazardous nuclear waste, nuclear weapons proliferation and nuclear terrorism attack [25]. In addition, there is an enormous liability insurance subsidy [26]. The Special Programme for the use of RE (PEAER), in 2014, set a target of almost 24 GW of RE capacity by 2018, including hydropower (13 GW), wind (≈9 GW), geothermal (1 GW), bioenergy (≈0.8 GW) and solar (0.6 GW) [23]. Solar PV has proven to be a least cost source of electricity according to results of tenders in 2016, with 40.5 USD/MWh for more capacities greater than 1 GW [17]. The recent evolution of RE policy in Mexico was driven by the Law for the Use of Renewable Energies and Financing the Energy Transition, which was published on 28 November 2008. The goal was to encourage the use of RE and clean technologies for electricity generation.
Different scenarios of energy systems, based on an entirely sustainable energy system or high shares of RE, have already been discussed for several countries and regions. Integrated Canada-U.S. power sector modelling has already been reported by Martinez et al. [27] and the results drive the implementation of an integrated power system.
This study aims to design a cost competitive and optimal 100% RE power system for North America, considering the high potential of RE on the continent and taking into account the following points:
- the power transmission system and electricity trade of different sub-regions of North America;
- an optimal energy system design taking into account available RE resources within the region;
- synergistic effects among different resources and sub-regions leading to higher efficiency of the power sector.
2. Materials and Methodology
Coherent technical analyses of how a fossil fuels-based system can be substituted by a 100% RE system require computer programmes and respective computational optimization. Several models have been designed and developed to simulate 100% RE system for different regions across the world [5,28,29,30,31]. According to Connolly et al. [31], there are three general types of energy models available for analyses of the integration of RE into different energy systems. These are named the simulation, scenario and equilibrium model. A simulation model seeks to match the supply and demand in a given energy system. This model is operated in an hourly basis over a 1-year time step. A scenario model simulates the energy system in a 1-year time step and combines the annually calculated results into a scenario of 20–50 years. Finally, an equilibrium model can be utilized to explain the behaviour of demand, supply and prices for the whole economy or part of an economy with several markets. It is quite time-consuming to design and create new programmes for each and every analysis; therefore, existing relevant programmes are preferable. In this study, an hourly resolved model, called the LUT energy system model, based on Matlab software (R2016b) [32] and the Mosek ApS optimizer [33] is used. This model has been introduced and applied to several regions so far [14,34,35,36,37,38,39], and a detailed description of the model can be found in those studies. The model is based on a multi-node approach that is composed of power generation and storage technologies, the current installed capacities of RE conversion technologies and different operation modes of these technologies. All the mentioned parameters are used to supply the electricity demand of power, water desalination and non-energetic industrial gas sectors.
The target function of this model is to minimize the total annual energy system cost entirely based on a mix of RE resources and storage technologies for North America. Matching power generation and demand is considered as one of the model restrictions. The target year is set to 2030 to better understand the cost-competitiveness of this system considering such a dramatic change in a short period of time, from a system mostly based on fossil fuels today towards a 100% RE system in the mid-term future. However, this paper only explores and specifies the potential of RE resources, the final cost of the system and the role of prosumers in such a transition. Therefore, the countries’ targets and visions are outside the scope of this paper. It is not the intention of this paper to describe an energy transition till the year 2030, but how a 100% RE system would be configured for the technical and financial assumptions for the year 2030.
The financial assumptions for capital expenditures (capex), operational expenditures (opex) and lifetimes of all technologies are presented in the Supplementary Materials (Table S1). Weighted average cost of capital (WACC) is assumed to be 7% for all scenarios. However, 4% WACC is set for residential PV self-consumption because of lower financial return requirements. The technical assumptions related to efficiency numbers for generation and storage technologies, power to energy ratios for storage technologies, and power losses in high voltage direct current (HVDC) power lines and converters are given in the Supplementary Materials (Tables S2–S4, respectively). Electricity prices in residential, commercial and industrial sectors for the U.S.’s regions are taken from [40,41,42], for Canada’s regions are taken from [43,44,45,46,47,48,49] and for Mexico’s regions are collected from [50,51,52]. The electricity price for a country is assumed to be applicable for all the regions within the same country. The current electricity prices are extrapolated to the year 2030 according to Gerlach et al. [53]. The regional grid electricity costs are provided in the Supplementary Materials (Table S5). The excess electricity generation produced by solar PV prosumers, that cannot be self-consumed, is considered to be sold to the grid with a price of 2 €cents/kWh in 2030.
The hourly resolved model is computed based on Equation (1):
where h is hours of a year, t is technology, tech is all modelled technologies, Egen is electricity generation, Eimp,r is electricity imports for region r, stor is storage technologies, Estor,disch is electricity from discharging storage, Edemand is electricity demand, Eexp,r is electricity exports for region r, Estor,ch is electricity for charging storage and Ecurt is curtailed excess energy.
The main target of the energy system optimization is to minimize the total annual energy system cost. It is determined as the sum of the annual costs of installed capacities of the various technologies, costs of energy generation and generation ramping (Equation (2)):
where t and tech are energy generation, storage and transmission technologies, r and reg are sub-regions, CAPEXt is capital expenditures for technology t, crft is capital recovery factor for technology t, OPEXfixt is fixed operational expenditures for technology t, instCapt,r is installed capacity for technology t and region r, OPEXvart is variable operational expenditures for technology t, Egen,t,r is annual electricity generation by technology t in region r, rampCostt is cost of ramping of technology t and totRampt,r is sum of power ramping values during the year for the technology t and region r. For the integrated scenario, non-energetic industrial gas and desalinated water demand are also added to the model.
The system also considers the electricity self-generated and self-consumed (prosumers) in the three sectors: residential, commercial and industrial. This can be carried out by installing respective capacities of rooftop solar PV systems and lithium-ion batteries. The model flow diagram listing all the input data, energy system model parameters and model output data is illustrated in Figure 1. Technical and financial assumptions are presented in the Supplementary Materials of this paper.
2.1. Input Data and Resource Potential
The historical data for wind speed and solar irradiation are taken from a NASA database [54,55] and the German Aerospace Centre [56]. The spatial resolution of the data is 0.45° × 0.45° and the time resolution is on an hourly basis. In addition, the feed-in profile for hydropower is made based on the daily resolved water flow data for the year 2005 [57]. IEA data [13] are used to calculate the compound average annual growth rate of natural gas consumption in the industrial sector, while gas demand for the electricity generation, residential and transportation sectors are excluded from this study. Water demand is computed based on future water stress and water demand projections [58]. It is assumed that seawater reverse osmosis (SWRO) desalination is used to cover water stress greater than 50%. Water transportation costs are also considered in the analyses, which are described in Caldera et al. [59]. Annual non-energetic industrial gas demand and water demand are presented in the Supplementary Materials (Table S11).
Geothermal potential for the region is calculated based on the surface heat flow data [60,61] and surface ambient temperature for the year 2005. The spatial resolution considered for this analysis is 0.45° × 0.45°. For nodes with a lack of surface heat flow data, the extrapolation of existing heat flow data was applied. Then, temperature and heat potentials of the middle depth point of each 1 km thick layer, between depths of 1 km and 10 km [62,63,64] are derived globally. The evaluated geothermal resource potential for North America is presented in the Supplementary Materials (Table S6). Geothermal data is considered only for electricity generation in the energy system model. For the given assumptions and real data, an optimal temperature, well depth and consequently LCOE are determined for all considered regions. It is assumed that only 25% of the determined potential can be used as an upper resource limit. The total geothermal potential for North America is calculated using the weighted average formula considering the rule: 0–10% of the best surface area of a region is weighted by 0.3, 10–20% of the best surface area is weighted by 0.2, 30–40% of the best surface area is weighted by 0.1 and the same assumption (0.1) for 40–50% of the best surface area. It should be noted that areas with LCOE higher than 100 €/MWh are excluded from the final results.
The potential for biomass and waste-to-energy resources are collected from German Biomass Research Centre [65]. All bio-based by-products and waste are divided into three different components: solid waste, solid biomass and biogas. Solid biomass includes wood, straw and coconut residues; solid wastes consists of municipal solid waste and industrial used wood; biogas is comprised of excrement, municipal biowaste and bagasse. The biomass costs are calculated using data from IEA [66] and Intergovernmental Panel on Climate Change (IPCC) [67]. A 50 €/ton gate fee for waste incineration is assumed to calculate the solid fuel cost. The results for regional biomass potential and costs are provided in the Supplementary Materials (Tables S6 and S7, respectively). Various waste and residue component shares lead to price differences between countries. All the input data are provided in the Supplementary Materials.
2.2. Applied Technologies
The applied technologies in the North American energy system model are the following:
- Technologies converting renewable resources into electricity that are used in this model are as follows: solar PV (single-axis tracking plants, ground-mounted and distributed rooftop systems), onshore wind turbines, concentrating solar thermal power (CSP), hydropower (run-of-river and dam), geothermal energy, biomass plants (solid biomass and biogas) and waste-to-energy power plants.
- Energy storage technologies are lithium-ion batteries, thermal energy storage (TES), pumped hydro storage (PHS), adiabatic compressed air energy storage (A-CAES) and power-to-gas (PtG) technology. PtG includes synthetic natural gas (SNG) with the respective synthesis technologies: methanation, water electrolysis, gas storage, CO2 scrubbing from air and both combined and open cycle gas turbines (CCGT, OCGT). Additionally, there is a 48 h biogas buffer storage and a part of the biogas can be upgraded to biomethane and injected into the gas storage.
- The energy sector bridging technologies enable additional flexibility to the energy system and consequently reduce the overall cost. PtG is a bridging technology in the energy model for production of gas for the industrial sector. The role of PtG is different as an energy sector bridging technology compared to a storage technology for the electricity sector. The second bridging technology is SWRO desalination, which connects the water sector to the electricity sector.
- The power transmission technologies have two levels: electric power distribution and transmission through the sub-regions. They are generally based on standard alternating current (AC) grids, which are not part of the model, and inter-regional transmission grids modelled by applying HVDC technology. Power losses in the HVDC grids includes two major components: length dependent electricity losses of the power lines and losses in the converter stations at the interconnection with the AC grid, as shown in Table S4 in the Supplementary Materials.
The full model block diagram is shown in Figure 2. Variable RE technologies, especially solar and wind energy, are not dispatchable due to their intermittent nature. Flexibility options are required for a balanced and optimal energy system. The main options to provide reliability and flexibility into the energy system can be classified as follows: storage of energy and reuse when the demand is higher than generation (e.g., batteries), demand side management (e.g., PtG or SWRO desalination), generation management (e.g., biomass plants or hydro dams), and interconnected transmission grids between different regions and energy shifted in location (e.g., HVDC transmission).
3. Scenario Assumptions
3.1. Regions Subdivision and Grid Structure
The three North American countries, including the U.S., Canada and Mexico, were clustered into 20 sub-regions. The subdivision and grid configuration of North America’s sub-regions are delineated in Figure 3.
Four scenarios are discussed for the future energy system development in North America:
- Region-wide energy system, where all the sub-regions cover their demand through their own generation (no HVDC grid interconnections);
- Country-wide energy system, where the sub-regions are interconnected by HVDC grids and excess electricity of the regions can be transferred to the neighbouring regions within the borders of countries;
- Area-wide energy system, where the country-wide energy system is interconnected by power transmission lines;
- Integrated scenario has the same structure as the area-wide energy system scenario, but with additional non-energetic industrial gas and SWRO desalination demand. RE together with PtG technology are considered for electricity generation and storage, as well as energy sector bridging technologies to cover industrial gas and water desalination demand.
3.2. Feed-In for Solar and Wind Energy
The hourly resolution profiles for solar PV (single-axis tracking and optimally tilted), CSP and wind energy are calculated according to Bogdanov and Breyer [34,35]. The aggregated profiles of solar PV (single-axis tracking and optimally tilted), CSP solar field and wind energy normalized to maximum capacity averaged for North America are presented in Figure 4. The average full load hours (FLH) for the above mentioned technologies are calculated similar to geothermal and provided in the Supplementary Materials (Table S8). The hourly resolution profile for hydropower is calculated according to the historical weather data for precipitation for the year 2005.
3.3. Limits for Minimum and Maximum Installed Capacities for all Energy Technologies
Lower limits of installed capacities are taken from Farfan and Breyer [12] and upper limits are calculated according to Bogdanov and Breyer [35]. Lower limits on the current installed capacities (by the end of 2014) in North American sub-regions are given in the Supplementary Materials (Table S9) and the corresponding upper limits of RE capacities are summarized in the Supplementary Materials (Table S10). For all other technologies, upper limits are not allocated. However, for biogas, solid biomass residues and waste-to-energy plants it is assumed, due to energy efficiency reasons, that the existing and specified amount of the fuel is used during the year.
3.4. Load Profile
The electrical load profiles for sub-regions are computed as the total demand of regions based on synthetic load data generated using the multiple linear regression model presented in Equation (3) [68]:
where load is the synthetic load demand, x is the time in hours for the whole year, a is the amplitude, b is the frequency, c is the phase shift, d is the additional ordinate offset, n is the extent of sine (between 1 and 2) and i indicates the number of sine functions.
Figure 5 illustrates the area-aggregated demand of all North American sub-regions. Current electricity demand is collected from local sources [69,70,71], and the electricity demand growth rate by the year 2030 is calculated using IEA data [13]. According to the IEA [13], the electricity demand is set to continue growing by 0.9% per annum in North America by 2030. The annual electricity growth rate is applied for the hourly load profile to compute and generate the new load profile for the projected year. Solar PV self-consumption prosumers decrease the residual load demand significantly in the energy system. This is shown in Figure 5 (right). The total electricity demand and the peak load decrease by 20% and 9%, respectively.
4. Results
Each scenario is modelled and optimised under given constraints to find the least-cost energy system configuration. Therefore, the final results include hourly RE-based electricity generation, storage charging and discharging, electricity exchange between sub-regions, and curtailment. The key financial results of the modelled scenarios are presented in Table 1. The results include LCOE (including PV self-consumption and the centralized system), levelised cost of electricity for primary generation (LCOE primary), levelised cost of curtailment (LCOC), levelised cost of storage (LCOS), levelised cost of transmission (LCOT), total annualized cost, total capital expenditures, total RE capacity and total primary electricity generation.
From Table 1, it can be seen that the integration benefit is significant in both electricity cost and annual expenditures due to connection of different regions via HVDC transmission lines. In the area-wide scenario, electricity cost of the system plunges by about 16% compared to the region-wide scenario. Grid utilization declines the primary energy installed capacities by 18% and by 5% in terms of generated electricity with reference to the region-wide scenario. Grid utilization leads to a considerable reduction of storage utilization (Table 2), especially A-CAES, whereas cost of transmission is relatively small compared to a downfall in primary generation and storage costs. Curtailment costs drop by half in comparison to energy storage costs in the case of wider grid utilization, leading to a reduction of about 25% in the area-wide scenario in comparison with the region-wide scenario. However, excess energy does not have a significant impact on the total cost. The power line capacities for the electricity trade between the sub-regions for the area-wide scenario are shown in the Supplementary Materials (Figure S7 and Table S15).
A further decrease in LCOE of 16% can be achieved via non-energetic industrial gas and SWRO desalination sector integration in contrast to the area-wide scenario. This cost reduction can be explained by a decrease in storage cost by 58% since water desalination and industrial gas sectors reduce the long-term storage requirement, providing further flexibility to the energy system. Primary electricity generation cost declined by 6% in the integrated scenario compared to the area-wide scenario. The reason for this reduction could be an improvement in the flexibility of the system and using cost competitive wind and solar electricity as shown in Table 2. For the case of biogas, 32% of biogas in the area-wide scenario is re-allocated from electricity generation in the power sector to the industrial gas sector in the integrated scenario.
The LCOE components and the import/export share in the region-wide, country-wide, area-wide and integrated scenarios are delineated in the Supplementary Materials (Table S12). The share of electricity exports is considered as the ratio of net electricity exports to the primary electricity generation of a sub-region. At the same time, the share of electricity imports is defined as the ratio of electricity imports to the electricity demand. The area average values are calculated based on sub-regional data weighted by the electricity demand.
Concerning the total installed capacities, the installed PV capacity decreased by 32% from the region-wide to area-wide scenario while the installed capacities of wind increased by 9% from the region-wide to area-wide scenario. The reason for the increase in the installed capacity of wind is that the LCOE for wind energy in some sub-regions is lower than solar PV. Therefore, the system prefers to install wind rather than PV single-axis tracking and exchange this electricity with neighbouring regions via power lines. In addition, the wind resource is at a really excellent level in several parts of North America, particularly in the US-C, US-MW, US-TX, CA-E, CA-W, the west part of US-AK and the east part of US-NW. In the integrated scenario, installed capacities of PV and wind increase due to the additional demands of industrial gas and seawater desalination. High shares of solar PV and wind energy are mainly because of their lower costs among all RE resources in the region. It should be mentioned that a rapid cost reduction of solar PV technology and battery storage is assumed in the next 15 years. The share of PV single-axis tracking and PV self-consumption of the total solar PV installed capacity for the region-wide scenario are 56% and 43%, respectively. However, the share of installed capacity of PV single-axis tracking in the area-wide scenario decreases to 35%, while the share of PV self-consumption increases to 63% of the total installed capacity of PV. Compared to all the available RE resources in the region, PV and wind seem to be financially more attractive technologies due to the excellent availability of the respective resources.
The grid interconnection decreases the need for energy storage. Installed capacities of batteries, A-CAES, PtG, PHS and gas turbines decrease with interconnection of the regions as summarized in Table 2, whereas the share of heat storage increases by 325% in the integrated scenario due to storage of additional usable heat generated in the system, however on a very low level.
A division of regions into net importers and exporters can be observed for the area-wide scenario and the integrated scenario, which are presented in Figure 6. Sub-regions with the best renewable resources are net exporters and the others are net importers. In the region-wide scenario, all the individual sub-regions of North America need to match their own demand using their own RE. The regions can import or export electricity depending on their demand and generation. The differences between the demand and production are mainly due to import, export and storage losses. For the integrated scenario, the difference is due to the energy consumption for SNG production. The net importer regions in North America are US-Mid-Atlantics, US-Tennessee Valley Authority, US-New England & New York, US-Gulf, US-Carolinas, US-Southern, US-California, US-Southwest, Northwest Mexico, Central Mexico and North Mexico. The net exporter regions are East Canada, US-Midwest, US-Central, US-Northwest, US-Texas and West Canada. In comparing net importer and exporter regions, US-Alaska and South Mexico have almost equal imports and exports. Due to a high electricity demand for additional desalination and SNG production, the integrated scenario tends to increase the electricity generation between the regions to fulfil the increased demand. Hourly resolved profiles for the net exporting region, East Canada, the net importing region, the US-Mid-Atlantics, and the balancing region, South Mexico, are presented in the Supplementary Materials (Figures S1–S3, respectively). The direction and amount of electricity trade among the interconnected regions for the year 2030 are presented in Figure 7. As can be seen, the US-New England & New York region has the largest power exchange with 1185 TWh, where East Canada provides 59% of the total power exchange to US-New England & New York while the remaining 41% is transferred to the US-Mid-Atlantics through US-New England & New York. Hence, the US-New England & New York region is an intermediate between East Canada and the US-Mid-Atlantics for electricity trade.
Figure 8 gives an overview of the installed capacities for RE generation and storage for all sub-regions in the region-wide, area-wide and integrated scenarios. In the region-wide and area-wide scenarios, the share of solar PV dominates the system for most of the sub-regions, except for northern sub-regions such as Eastern Canada, Western Canada, US-Alaska, US-Midwest and US-Central, where excellent FLH of the wind resource lead to an increase of the share of wind energy among other RE resources. Solar PV comprises of 56% of total RE resources in the region-wide scenario. Among all sub-regions, Northwest Mexico and US-Southern have the highest amount with 74% and 70% of the total share, respectively. In the area-wide scenario the share of solar PV still remains the highest despite decreasing by 10% in comparison to the region-wide scenario. It is noteworthy that the share of wind energy increases by 10% in the area-wide scenario. In the integrated scenario, solar PV stayed the main energy source in some regions, while the share of wind energy increased significantly. It was found that 48% of RE resources comes from wind energy in the integrated scenario, followed by solar PV by 45%, hydropower by 5% and the rest of resources by 2%.
Despite the fact that hydropower is one of the main energy resources in Canada and accounts for 32% and 36% for Eastern Canada and Western Canada in the region-wide scenario, respectively, it does not have a significant role in other sub-regions. It should be noted that hydropower has the highest share with 36% among all RE resources in Western Canada, following by solar PV and wind energy in the region-wide and area-wide scenarios. However, the share of hydro declines in the integrated scenario to 17%. It can be explained by the fact that when the demand for water desalination and industrial gas are added to the integrated scenario, wind energy is the most cost-competitive option compared to other resources. Therefore, the model prefers to use more wind energy in the system. On the other hand, US-Tennessee Valley Authority has only a 4% share of hydropower in the region-wide scenario, while the rate increases in the area-wide and integrated scenario by 10% and 14%, respectively. A state of charge profile for hydro dams is shown in the Supplementary Materials (Figure S5). As can be seen, the highest filling state of hydro reservoirs is in the summer months of a year.
The interconnection of the sub-regions via HVDC transmission lines decreases the installed capacities of PV by 32%, as shown in Figure 8 and Table 2, from the region-wide to the area-wide scenario. In the case of the integrated scenario, installed capacities for PV and wind increase significantly by 44% and 81% compared to the area-wide scenario, respectively, due to the higher demand for electricity and increased system flexibility. PV self-consumption plays a key role in North America due to high enough electricity prices. PV self-generation covers 75%, 80% and 82% of residential, commercial and industrial prosumer demand, respectively. An overview of PV self-consumption is provided in the Supplementary Materials (Table S13).
The interconnected HVDC transmission grid, together with the RE generation and demand, significantly influence the requirement of total storage capacity, but also change with the need of different storage technologies for the energy system in the whole region. The throughputs of the battery system, A-CAES and gas storage decrease by 58%, 100% and 32%, respectively, from the region-wide to the area-wide scenario. Therefore, A-CAES storage technology experienced the highest decline in comparison to other storage technologies, which had been already observed in other regions in the world [37] while the need for PHS technology increased from 7.9 TWhel to 8.4 TWhel in the area-wide scenario. The installation of HVDC lines leads to a reduction of the storage technology utilization as the transmitted electricity is lower in cost in many cases than storage options. Installed capacities of batteries, PHS, A-CAES, heat storage, PtG and gas turbines decrease due to the expansion of the grid. The storage discharge capacities, annual throughput of storage and full load cycles per year are provided in the Supplementary Materials (Table S14). State of charge profile diagrams for the area-wide scenario for battery, PHS, gas storage and A-CAES are given in the Supplementary Materials (Figure S4).
Electricity generation, demand, storage charging and discharging, grid utilization and curtailment curves for the area-wide scenario are illustrated in the Supplementary Materials (Figure S6). A storage curve for all hours of a year is shown by a black line and is calculated based on generation minus load. Electricity generation is more than demand in North America for about 5000 h of the year. The excess electricity can be stored in energy storage technologies and used when the demand increases. The reason for high electricity generation can be attributed to the inflexibility of energy sources, due to the high share of solar and wind energy. The higher share of solar and wind resources can be justified by higher solar irradiation and wind speed during these hours of the year in North America. Consequently, flexibility options are required in order to have a well-balanced and an optimally structured energy system. Hydro dams, biogas, biomass, geothermal energy and discharge of energy storage technologies are among the options that provide flexibility to the system. As observed for the other hours of the year, the inflexible electricity generation options plummet. This is because the electricity demand reduces and there is a need for flexible electricity generation options, discharge of energy storage technologies and utilization of the grid. There is curtailment in about 1000 h of the year, but for all the other hours the HVDC lines enable the export of the electricity from the best RE producing sub-regions to other sub-regions of remaining demand or due to charging of storage.
The grid utilization profile for North America can be found in the Supplementary Materials (Figure S7). It can be observed that the grid utilization is distributed among different hours of a day. However, it is mostly used in the morning and evening hours. The least hours of electricity transmission are between 10 am and 15 pm, particularly in the first half of the year. This can be explained by seasonal variation in North America. When solar irradiation is at its maximum, grid utilization is at its minimum. The capacities and utilization of the transmission lines between different regions are shown in the Supplementary Materials (Table S15). The largest interconnected electrical grid capacity is from Eastern Canada to US-New England & New York with 90 GW. The second largest one is from US-New England & New York to US-Mid-Atlantics with 65 GW.
The key findings of the integrated scenario energy system from generation to demand are depicted by an energy flow diagram (Figure 9). The diagram is comprised of the primary RE resources, the energy storage technologies, HVDC transmission grids, total demand of each sector and system losses. Power, desalination and industrial gas are the three sectors considered for the integrated scenario. The recovered usable heat and system losses can be explained as the difference between primary electricity generation and final electricity demand. The difference includes heat produced by biogas, biomass and waste-to-energy power plants, curtailed electricity, heat generated from electrolysers for transforming power-to-hydrogen, transforming hydrogen-to-methane in the methanation process and producing power from the methane in gas turbines. Efficiency losses lead to battery storage, PHS, A-CAES and HVDC transmission grid losses. The energy flow diagrams for the area-wide and region-wide scenarios are enumerated in the Supplementary Materials (Figure S8).
5. Discussion
5.1. Interpretation of Findings
The electricity cost is decreased remarkably in the RE-based system due to installation of a HVDC transmission grid. Similar HVDC grid interconnection impact on electricity cost has also been observed in other studies carried out with the same criteria [14,34,35,36,37,38,39]. The total LCOE in North America declined from 63 €/MWh for the region-wide scenario to 53 €/MWh for the area-wide scenario and to 42 €/MWh for the integrated scenario. By comparing with the region-wide scenario, it can be highlighted that regions such as US-Southern, US-Midwest and US-California experienced the highest reduction of total LCOE in the area-wide scenario, by around 17%. In contrast, the total LCOE rose in some regions such as US-Tennessee Valley Authority, US-New England & New York and US-Mid-Atlantics from region-wide to area-wide scenario, by 16%, 12% and 8%, respectively. This can be justified on the basis that in these three regions the electricity cost is lower when they are independent. However, in most of the regions HVDC grid interconnection leads to a decrease in the cost of electricity.
The total annual system cost decreased from 388 b€ in the region-wide scenario to 321 b€ in the area-wide scenario. The total capex requirements dropped substantially from 3502 b€ for the region-wide scenario to 2945 b€ for the area-wide scenario. However, the total annualized cost and the total capex increased drastically for the integrated scenario by 498 b€ and 4668 b€, respectively, to cover the excess electricity needed for industrial gas and water desalination sectors. Additional costs incurred due to HVDC transmission grid infrastructure in the area-wide scenario are compensated by a significant decline in installed capacities of electricity generation and energy storage. This is due to lower cost of power transmission compared to energy storage, lower efficiency losses and access to low cost electricity generation in other sub-regions. It should be noted that the HVDC transmission grid may not cover the electricity supply in rural areas in Mexico, since RE-based mini-grid applications based on PV systems, small wind power and micro-hydro plants might be a more suitable solution together with grid extension [72,73,74,75,76].
PV technologies followed by wind energy account for the largest share of installed capacities for a 100% RE energy based system in the region-wide and the area-wide scenarios. The reason is that these technologies have well distributed FLH all over North America and are the least-cost RE technologies in most of the cases. In comparison, the share of wind energy increased in the integrated scenario by 48% of total installed capacity, followed by PV by 45%. However, an increase in the share of wind could be inverted again after 2030, since the learning curve of PV continues [77], in particular in combination with batteries [78,79]. On the other hand, the learning curve of wind is not so sharp, i.e., the share of PV is expected to grow year by year. Such an effect had been found for instance for the case of Ukraine [80], Saudi Arabia [81], Iran [82] and India [83]. In addition, the installation of small and utility-scale PV plants is already profitable in several countries and PV electricity generation cost is forecasted to further decrease [84].
5.2. The Benefits of Sectors Integration
The integrated scenario focuses on the integration to cover current non-energetic natural gas demand in the industrial sector (the gas demand for heat generation and residential use are not considered in this study) by flexible generation of SNG and renewable water demand by SWRO desalination. North America has sufficient RE resources to cover additional electricity demand to produce 2134 TWhth (218 bcm) of SNG and 84 billion m3 of renewable water. Nonetheless, expected growth in electricity demand stimulates a rise in electricity cost due to inconvenient distribution and profiles of RE generation. Additional generation of electricity to cover 4246 TWhel for gas synthesis and SWRO desalination promotes a supplementary installation of RE capacities of 1850 GW of PV and 1980 GW of wind energy. Furthermore, there is a noticeable increase in electrolyser units of about 388 GW (+719%) and a significant reduction in CCGT capacities of about 94 GW (−91%). This can be explained by flexibility provided by CCGT in the area-wide scenario on the supply side to be substituted by flexibility of electrolysers in the integrated scenario on the demand side.
In addition, the system generates excess heat as a by-product of different processes such as biogas and biomass CHP plants, waste-to-energy incinerators and gas turbines, as well as excess electrical energy which can be curtailed or converted to usable heat and stored in heat storage. The usable heat amount varies from 498 TWhth (7% of total generated electricity) per year for the area-wide scenario up to 735 TWhth (10% of total generated electricity) for the region-wide scenario. The amount of usable heat in the integrated scenario is 828 TWhth, which is noticeably larger than for the area-wide scenario because of higher losses in gas turbines, methanation and electrolysis. Totally, the estimation of the integration benefit for the electricity, industrial gas and water sectors is around 56 b€ of the annual system cost (Figure 10). An additional reduction of 774 TWh and 208 TWh can be seen in electricity generation and curtailed electricity, respectively. Further, the cost of desalinated water is affordable at 1.1 €/m3. The electricity cost decreases by 21% to 42 €/MWh for the integrated scenario in comparison to the area-wide scenario.
5.3. A Comparison Between the Analysed Scenarios and a Business as Usual Scenario
Many researchers, energy experts and decision-makers might argue that the LCOE based on the current energy system is much lower than a transition to a 100% RE-based system. Therefore, a brief review on this argument is necessary to better evaluate and introduce a 100% RE system as a viable alternative in the mid-term future. As such, a business as usual (BAU) scenario was analysed for the year 2030 based on the Current Policies Scenario published by the IEA in World Energy Outlook (WEO) 2014 [85] and presented in a more comprehensive way by the Greenpeace report [86]. The mix of installed capacities and respective costs for the BAU scenario are provided in Table 3.
To calculate the LCOE of the BAU scenario, two components are taken into consideration. For the first case (LCOEBAU), CO2 emission cost is excluded from the calculated cost. However, in the second setting (LCOEBAU-CO2), a 59.8 €/tCO2 [87] emission cost is considered. The costs of electricity transmission were not included in the final cost of the system mainly because AC grid costs and electricity distribution are not found in the literature. Consequently, in order to compare LCOE of the BAU and 100% RE scenarios, LCOT is excluded from the total LCOE for the country-wide and the area-wide energy system scenarios. It should be noted that the costs of all resources, including fossil fuels, RE and nuclear energy, are based on the cost projection in this study, as shown in Table 3.
Figure 11 presents the results for LCOEBAU and LCOEBAU-CO2 compared to the LCOE of the 100% RE scenarios for the power sector only in North America. The calculated LCOEBAU and LCOEBAU-CO2 are 59 €/MWhel and 82 €/MWhel, respectively. LCOEBAU is 10% and 16% more expensive than the country-wide and area-wide scenario, respectively. However, the highly decentralised region-wide scenario is slightly more costly than LCOEBAU, which can be justified by the fact that regions are independent and there is no interconnection between regions, thus the final cost of the system is modestly higher. As a result, a 100% RE power system is lower in cost in most cases for a significant increase in the electricity demand of North America by 2030. This indicates that even under a no CO2 emission cost policy a fully sustainable energy system would be an attractive alternative. On top of that, if CO2 emission costs were considered, LCOE in the region-wide, country-wide and area-wide scenarios are considerably lower than LCOEBAU-CO2, ranging from a lower cost of 25% to 40% as demonstrated in Figure 11.
It is important to highlight that there are more major and minor parameters that can influence the total cost when discussing a radical change in the energy system. In addition to the financial benefits of RE, there are more advantages that can be categorized as emission reduction, the improvement of socio-economic aspects, a vast and unlimited energy supply, securing access to freshwater resources even in arid and semi-arid areas, environmental protection, more jobs and other economic benefits to regional areas. Considering all the above-mentioned factors, the LCOE of BAU scenarios would increase further and 100% RE scenarios experience much lower costs.
5.4. Comparison of Our Results with Other Studies
A study carried out by IRENA [88] reveals that doubling the share of RE in the U.S. by 2030 is achievable due to the best wind, solar, geothermal, hydro and biomass resources in the country. Apart from that, the U.S. has a vibrant culture of innovation, plentiful financing opportunities, and a highly skilled labour force for making possible a transition from a conventional energy system towards a sustainable energy system. Solar PV is considered as a main RE resource in the country and it is expected that 135 GW of solar PV would be installed by 2030. A rapid reduction in the price of solar PV technologies has also been discussed and LCOEs of 33–41 €/MWh for utility-scale and 63–74 €/MWh for rooftop installations are anticipated for the year 2030 in the IRENA study. However, the study assumes higher costs than listed in this research, and also in comparison to others [19]. In comparison to solar PV, onshore wind seems to have a better potential to become a leader of RE resources in the U.S. with installed capacity of 314 GW by 2030, according to IRENA [88]. The LCOE for wind energy is assumed to become 37–44 €/MWh.
A high share of RE resources for the energy sectors has been studied and planned for different states and cities of the US, such as Washington State, Hawaii and San Francisco. Hawaii has set a target for achieving an RE goal of 100% by 2045 [89]. In other words, Hawaii should be running only on electricity produced by RE resources in 30 years. Nevertheless, 70% of electricity in the state was generated by oil in 2013, and coal accounted for 14% of total electricity production [90]. In addition to breaking away from fossil fuels, policymakers want to save money, which is currently spent on importing fossil fuels every year. San Francisco has a goal to achieve a 100% renewable electricity supply community wide by 2030 [91]. A study carried out by Jacobson et al. [92] analysed the potential and consequences of Washington State’s use of wind, water and solar (WWS) to produce electricity and electrolytic hydrogen for 100% of its all-purpose energy in different sectors by 2050. The study shows that an 80–85% conversion can be achieved by 2030. Even more, they expected to experience a reduction in power demand by around 40% due to electrification plus modest efficiency measures. A similar approach has been studied for each of the 50 United States [5]. The results show that US all-purpose load would be met with 30.9% onshore wind, 19.1% offshore wind, 30.7% utility-scale PV, 7.2% rooftop PV, 7.3% CSP with storage, 3% hydroelectric, 1.25% geothermal, 0.37% wave power and 0.14% tidal power. As a result, a 100% renewable energy is a real policy option for North America and is not wishful thinking anymore. Grid interconnection will also enable an easier transition to a fully sustainable energy system in the mid-term future.
The findings for a North American 100% RE-based energy system clearly reveal that the potential of the region for RE generation, in particular for solar and wind energy, is quite high. By applying this system to the region, not only North America can fulfil all electricity demand in the region itself, but also it could potentially export the rest of the production to other continents. The result of a reasonably low LCOE in all the considered scenarios for the year 2030 combined with better RE policies and carbon-free development plans can intensify the development of a renewable powered energy system in the region in the coming years. Several studies have been already discussed about various alternatives to reduce the production of fossil fuels and to achieve a low carbon based energy system [93,94]. Some studies, such as IEA [13], have mostly addressed non-renewable options, such as nuclear energy, coal and natural gas based CCS. However, the LCOE values of the addressed alternatives are high compared to our findings, which are listed as follows: Levy 1 and 2 nuclear reactors in Florida are estimated to be 108–136 €/MWh by 2023 [95], the future cost of nuclear power is assessed to be at least 76 €/MWh and possibly 117 €/MWh in France [96], 112 €/MWh for new nuclear in the U.K. and Czech Republic by 2023 [93], 112 €/MWh for gas CCS (considered for 2019 in the U.K.) [93] and 126 €/MWh for coal CCS (presumed for 2019 in the U.K.) [93]. With respect to coal power plants with CCS, the Kemper plant, the leading U.S. “clean coal” project, was found to be unprofitable and uncompetitive under current conditions in the energy market [97]. Moreover, a report published by the European Commission [98] discusses the low probability of CCS technology being commercially available before the year 2030. The findings for Europe are assumed to be also valid for North America in the mid-term. In addition, several studies for 100% RE by 2050, such as WWF [99] and Greenpeace [86], state that nuclear fission produced dangerous waste that remains extremely toxic for many years and it cannot be stored safely anywhere in the world. Consequently, these studies have assumed a phase-out of nuclear energy due to sustainability reasons. Dittmar [100] also points out that the financial and human research and development resources spent for nuclear fusion cannot solve the energy problems in the world and even worse these resources are not available for research of pathways towards a low cost energy future.
The 100% renewable resource-based energy system options for North America demonstrated and described in this paper seem to be substantially cost-effective (about 63–67% lower cost) than the other alternatives, when comparing the integrated scenario with nuclear energy and CCS technology, both of which have still further drawbacks. These include nuclear melt-down risk, nuclear terrorism risk, unsolved nuclear waste disposal, nuclear weapons proliferation, remaining CO2 emissions of power plants with CCS technology, a diminishing conventional energy resource base and high health cost due to heavy metal emissions of coal fired power plants [24].
6. Conclusions
This study analyses the technical and economic feasibility for North America to convert the energy infrastructure into an energy system powered solely by solar PV, wind energy, hydropower and other RE resources. The study is based on technical and financial assumptions for the year 2030. Existing RE technologies can generate sufficient energy not only to cover all electricity demand in North America for the year 2030 on a cost level of 42–63 €/MWhel, but also to potentially export the additional electricity to other countries. In addition, the electricity demand, gas demand and clean water demand can be supplied by electricity generation based on RE resources as well. PtG and SWRO desalination technologies are used to provide renewable synthetic natural gas and clean water supply powered by 100% RE system. The advantage regarding the use of RE for electricity generation has been discussed through four scenarios; the region-wide, country-wide, area-wide and integrated scenarios.
Extreme dependency on fossil fuel resources to generate electricity, rather low prices of the non-renewable resources and high share of nuclear power lead to a low share of RE in the region today, especially in the U.S. and Mexico. However, the ‘net zero’ greenhouse gas emissions agreed at COP21 in Paris clearly guides the pathway towards sustainability. In order to cut the dependency of the North American power sector on fossil fuels, variable RE technologies are taken into consideration for a 100% RE-based power system. In the cost competitive RE mix presented in this study, solar PV dominates the energy system in the electricity sector by 45–56% of total RE share, depending on the defined scenarios, in most sub-regions of North America. This is followed by wind energy with 29–48% of total RE share. For all the considered scenarios, solar PV technology has the highest installed capacities in most of the sub-regions; however, for the integrated scenario the role of PV decreases in sub-regions where wind sites are the least cost technology and high potential of wind resources are available. It is important to note that an increase in the share of wind could be inverted again after 2030, since the learning curve of PV continues, in particular in combination with batteries. However, the learning curve of wind is not so sharp, i.e., the share of PV is expected to grow year by year.
Heat generated as a by-product of electricity, synthetic natural gas generation and curtailed electricity conversion can cover up to 828 TWhth of heat demand. The HVDC transmission power lines play a substantial role in the energy system since interconnected power transmission enables a significant cost reduction, a significant reduction of primary generation capacities and a cut-off of storage utilization. A remarkable decline can be seen in the case of A-CAES, where the need for storage dropped dramatically in the area-wide scenario and the integrated scenario by around 100%. It was found that industrial SNG generation in the integrated scenario substituted SNG storage as seasonal storage for the electricity sector. SNG production is used instead of gas turbines in the case of energy deficit for the integrated scenario, adding a major source of flexibility to the system.
Based on the presented results, current barriers to implement a 100% RE-based system are neither technical nor economic for the applied year, since it is proven that a fully sustainable power system is quite competitive and lower in cost compared to BAU scenarios, with or without considering CO2 emission costs. As such, main obstacles would be political and social. Nuclear energy and fossil fuels are profitable for many energy investors across the world and those investors voice a strong opposition to a transition to a fully RE-based power system. In addition, most people are not completely aware of the potential of RE resources in their countries and how they will benefit from them. More detailed analysis is needed to overcome the aforementioned challenges.
Supplementary Materials
The following are available online at www.mdpi.com/1996-1073/10/8/1171/s1, Figure S1: Hourly generation profile for a net exporter region, Eastern Canada, Figure S2: Hourly generation profile for a net importer region, US-Mid-Atlantics, Figure S3: Hourly generation profile for Southern Mexico, an example of a balancing region, Figure S4: Aggregated yearly state-of-charge for storage in area-wide scenario, battery (top left), PHS (top right), gas storage (bottom left) and A-CAES (bottom right), Figure S5: State-of-charge for hydro dams in the area-wide scenario, Figure S6: Electricity generation curves for a whole year for area-wide scenario for North America, Figure S7: Profile for interregional electricity trade between regions with the absolute numbers (left) and with power line utilisation (right) for area-wide scenario for North America, Figure S8: Energy flow of the system for the region-wide scenario (top) and the area-wide scenario (bottom) in 2030, Table S1: Financial assumptions for energy system components, Table S2: Efficiencies and energy to power ratio of storage technologies, Table S3: Efficiency assumptions for energy system components for the year 2030, Table S4: Efficiency assumptions for HVDC transmission, Table S5: Regional end-user grid electricity costs for the year 2030. For the sub-regions, electricity costs are the weighted average of all cities within the sub-region, Table S6: Regional biomass potentials and geothermal energy potentials, Table S7: Regional biomass costs, calculated based on biomass source mixes in the region. Solid wastes cost are based on an assumption of 50 €/ton gate fee paid to the MSW incinerator, Table S8: Average full load hours (FLH) and LCOE for single-axis tracking PV, optimally tilted PV, solar CSP and wind power plants in North America by 2030, Table S9: Lower limits of installed capacities in North America sub-regions, Table S10: Upper limits on installable capacities in the North America in units of GWth for CSP and GWel for all other technologies, Table S11: Annual industrial gas demand and water demand for the year 2030, Table S12: Total LCOE components in all sub-regions of North America, Table S13: Prosumer electricity costs, installed capacities and electricity utilization in North America, Table S14: Overview on storage capacities, throughput and full cycles per year for the four scenarios in North America, Table S15: Electricity transmission line parameters for the area-wide scenario for North America.
Acknowledgments
The authors gratefully acknowledge the public financing of Tekes (Finnish Funding Agency for Innovation) for the ‘Neo-Carbon Energy’ project under the number 40101/14. The authors would like to thank Michael Child and Upeksha Caldera for their valuable feedback and proofreading.
Author Contributions
Arman Aghahosseini carried out the research, including collecting the input data, implementing the energy system modelling, generating and analysing the results, visualising the figures, and writing the manuscript. Dmitrii Bogdanov did the coding for the model used in this research. Christian Breyer framed the research questions and scope of the work, checked the results, facilitated discussions, and reviewed the manuscript.
Conflicts of Interest
The authors declare no conflict of interest. The founding sponsors had no role in the design of the study; in the collection, analyses, or interpretation of data; in the writing of the manuscript, and in the decision to publish the results.
Abbreviations
| AC | alternating current |
| A-CAES | adiabatic compressed air energy storage |
| b€ | billion euro |
| BAU | business as usual |
| capex | capital expenditures |
| CCGT | combined cycle gas turbines |
| CCS | carbon capture and storage |
| COP21 | 21st yearly session of the Conference of the Parties/Paris Agreement |
| CSP | concentrating solar thermal power |
| DBFZ | German Biomass Research Centre |
| FLH | full load hours |
| GT | gas turbine |
| GW | gigawatt |
| GWh | gigawatt hour |
| HHB | hot heat burner |
| HVDC | high voltage direct current |
| ICE | internal combustion engine |
| IEA | International Energy Agency |
| IPCC | Intergovernmental Panel on Climate Change |
| IRENA | International Renewable Energy Agency |
| ISE | Fraunhofer institute for solar energy system |
| km2 | square kilometre |
| LCOC | levelised cost of curtailment |
| LCOE | levelised cost of electricity |
| LCOG | levelised cost of gas |
| LCOS | levelised cost of storage |
| LCOT | levelised cost of transmission |
| LCOW | levelised cost of water |
| m3 | cubic meter |
| MWh | megawatt hour |
| OCGT | open cycle gas turbines |
| OECD | Organization for Economic Cooperation and Development |
| opex | operational expenditures |
| PEAER | Special Programme for the use of RE |
| PHS | pumped hydro energy storage |
| PtG | power-to-gas |
| PtH | power-to-heat |
| PV | photovoltaic |
| RE | renewable energy |
| RoR | Run-of-River |
| SNG | synthetic natural gas |
| ST | steam turbine |
| SWRO | seawater reverse osmosis |
| TES | thermal energy storage |
| TWh | terawatt hour |
| UN | United Nations |
| USD | United States Dollar |
| WACC | weighted average cost of capital |
| € | euro |
| Subscripts | |
| el | Electric units |
| th | Thermal units |
| th, a | Thermal units, annual |
References
- United Nations. Probabilistic Population Projections Based on the World Population Prospects: The 2015 Revision; Population Division, DESA: New York, NY, USA, 2015. [Google Scholar]
- International Energy Agency (IEA). Key World Energy Statistics; International Energy Agency: Paris, France, 2015. [Google Scholar]
- United Nations Framework Convention on Climate Change (UNFCCC). Adoption of the Paris Agreement—Proposal by the President; UNFCCC: Paris, France, 2015. [Google Scholar]
- Fthenakis, V.; Mason, J.E.; Zweibel, K. The technical, geographical, and economic feasibility for solar energy to supply the energy needs of the US. Energy Policy 2009, 37, 387–399. [Google Scholar] [CrossRef]
- Jacobson, M.Z.; Delucchi, M.A.; Bazouin, G.; Bauer, Z.A.; Heavey, C.C.; Fisher, E.; Morris, S.B.; Piekutowski, D.J.; Vencill, T.A.; Yeskoo, T.W. 100% clean and renewable wind, water, and sunlight (WWS) all-sector energy roadmaps for the 50 United States. Energy Environ. Sci. 2015, 8, 2093–2117. [Google Scholar] [CrossRef]
- Jacobson, M.Z.; Delucchi, M.A.; Cameron, M.A.; Frew, B.A. Low-cost solution to the grid reliability problem with 100% penetration of intermittent wind, water, and solar for all purposes. Proc. Natl. Acad. Sci. USA 2015, 112, 15060–15065. [Google Scholar] [CrossRef] [PubMed]
- MacDonald, A.E.; Clack, C.T.; Alexander, A.; Dunbar, A.; Wilczak, J.; Xie, Y. Future cost-competitive electricity systems and their impact on US CO2 emissions. Nat. Clim. Chang. 2016, 6, 526–531. [Google Scholar] [CrossRef]
- REN21. Renewables 2016 Global Status Report, Paris, France. 2016. Available online: http://www.ren21.net/wp-content/uploads/2016/06/GSR_2016_Full_Report_REN21.pdf (accessed on 4 August 2017).
- The U.S. Solar Market Nearly Doubled in 2016 to 14.6 GW. PV-Magazine, 15 February 2017. Available online: www.pv-magazine.com/2017/02/15/the-u-s-solar-market-nearly-doubled-in-2016-to-14-6-gw/ (accessed on 1 June 2016).
- Werner, C.; Gerlach, A.; Breyer, C.; Masson, G. Global Photovoltaics in 2015—Analysis of Current Solar Energy Markets and Hidden Growth Regions. In Proceedings of the 32nd EU PVSEC, Munich, Germany, 20–24 June 2016. [Google Scholar]
- Makyhoun, M.; Edge, R.; Esch, N. Utility Solar Market Snapshots; Sustained Growth in 2014; Solar Electric Power Association (SEPA): Washington, DC, USA, 2015. [Google Scholar]
- Farfan, J.; Breyer, C. Structural changes of global power generation capacity towards sustainability and the risk of stranded investments supported by a sustainability indicator. J. Clean. Prod. 2017, 141, 370–384. [Google Scholar] [CrossRef]
- International Energy Agency (IEA). World Energy Outlook 2015; IEA Publishing: Paris, France, 2015. [Google Scholar]
- Breyer, C.; Bogdanov, D.; Gulagi, A.; Aghahosseini, A.; Barbosa, L.S.N.S.; Koskinen, O.; Barasa, M.; Caldera, U.; Afanasyeva, S.; Child, M.; et al. On the role of solar photovoltaics in global energy transition scenarios. Prog. Photovolt. Res. Appl. 2017, 25, 727–745. [Google Scholar] [CrossRef]
- Kost, C.; Mayer, J.N.; Thomsen, J.; Hartmann, N.; Senkpiel, C.; Philipps, S.; Nold, S.; Lude, S.; Saad, N.; Schlegl, T. Levelized Cost of Electricity Renewable Energy Technologies; Techno-Economic Assessment of Energy Technologies; Fraunhofer ISE: Freiburg, Germany, 2013. [Google Scholar]
- International Renewable Energy Agency (IRENA). The Power to Change: Solar and Wind Cost Reduction Potential to 2025; International Renewable Energy Agency: Abu Dhabi, UAE, 2016. [Google Scholar]
- Mexico Awards More Than 1 GW of Solar at US$40.50/MWh. PV-Magazine, 30 March 2016. Available online: www.pv-magazine.com/2016/03/30/mexico-awards-more-than-1-gw-of-solar-at-us40-50mwh_100023944/ (accessed on 16 June 2016).
- Peru Awards 185 MW of Solar PV at US$48/MWh. PV-Magazine, 17 February 2016. Available online: www.pv-magazine.com/2016/02/17/peru-awards-185-mw-of-solar-pv-at-us48mwh_100023273/ (accessed on 16 June 2016).
- Lazard. Lazard’s Levelized Cost of Energy Analysis—Version 9.0; Lazard: New York, NY, USA, 2016. [Google Scholar]
- Council of Economic Advisers, the All-of-the-Above Energy Strategy as a Path to Sustainable Economic Growth, Executive Office of the President of the United States. 2014. Available online: https://obamawhitehouse.archives.gov/sites/default/files/docs/aota_energy_strategy_as_a_path_to_sustainable_economic_growth.pdf (accessed on 1 June 2016).
- Canada—A global leader in renewable energy, enhancing collaboration on renewable energy technologies, Yellowknife. In Proceedings of the Energy and Mines Ministers’ Conference, Yellowknife, NT, Canada, 25–27 August 2013.
- Alberta Government Sets Target of 30% of Eletricity Generated by Renewables by 2030. CBC News, 14 September 2016. Available online: www.cbc.ca/news/canada/calgary/alberta-target-2030-renewable-energy-electricity-1.3761787 (accessed on 17 July 2016).
- International Renewable Energy Agency (IRENA). Renewable Energy Policy Brief Mexico; International Renewable Energy Agency (IRENA): Abu Dhabi, UAE, 2015. [Google Scholar]
- Epstein, P.R.; Buonocore, J.J.; Eckerle, K.; Hendryx, M.; Stout, B.M.; Heinberg, R.; Clapp, R.W.; May, B.; Reinhart, N.L.; Ahern, M.M.; et al. Full cost accounting for the life cycle of coal. Ann. N. Y. Acad. Sci. 2011, 1219, 73–98. [Google Scholar] [CrossRef] [PubMed]
- Greenpeace International. Nuclear Power: A Dangerous Waste of Time; Greenpeace International: Amsterdam, The Netherlands, 2009. [Google Scholar]
- Guenther, B.; Karau, T.; Kastner, E.-M.; Warmuth, W. Berechnung Einer Risikoadaequaten Versicherungspraemie Zur Deckung Der Haftpflichtrisiken, Die Aus Dem Betrieb von Kernkraftwerken Resultieren; Versicherungsforen: Leipzig, Germany, 2011. [Google Scholar]
- Martinez, A.; Eurek, K.; Mai, T.; Perry, A. Integrated Canada-US Power Sector Modeling with the Regional Energy Deployment System (ReEDS), Contract; Report No. TP-6A20-56724; National Renewable Energy Laboratory (NREL): Golden, CO, USA, 2013; Volume 303, 50p.
- Child, M.; Breyer, C. Vision and initial feasibility analysis of a recarbonised Finnish energy system for 2050. Renew. Sustain. Energy Rev. 2016, 66, 517–536. [Google Scholar] [CrossRef]
- Child, M.; Nordling, A.; Breyer, C. Scenarios for a sustainable energy system in the Åland Islands in 2030. Energy Convers. Manag. 2017, 137, 49–60. [Google Scholar] [CrossRef]
- Gils, H.C.; Simon, S. Carbon neutral archipelago—100% renewable energy supply for the Canary Islands. Appl. Energy 2017, 188, 342–355. [Google Scholar] [CrossRef]
- Connolly, D.; Lund, H.; Mathiesen, B.V.; Leahy, M. A review of computer tools for analysing the integration of renewable energy into various energy systems. Appl. Energy 2010, 87, 1059–1082. [Google Scholar] [CrossRef]
- MATLAB and Statistics Toolbox Release 2016b; The MathWorks, Inc.: Natick, MA, USA, 2016.
- Mosek ApS. The MOSEK Optimization Toolbox for MATLAB Manual, version 7.1, revision 28; Mosek ApS: Copenhagen, Denmark, 2015. [Google Scholar]
- Bogdanov, D.; Breyer, C. Eurasian Super Grid for 100% Renewable Energy power supply: Generation and storage technologies in the cost optimal mix. In Proceedings of the ISES Solar World Congress 2015, Daegu, Korea, 8–12 November 2015. [Google Scholar]
- Bogdanov, D.; Breyer, C. North-East Asian Super Grid for 100% Renewable Energy supply: Optimal mix of energy technologies for electricity, gas and heat supply options. Energy Convers. Manag. 2016, 112, 176–190. [Google Scholar] [CrossRef]
- Gulagi, A.; Bogdanov, D.; Breyer, C. Southeast Asia and the Pacific Rim Super Grid for 100% Renewable Energy Power Supply. Energies 2017, 10, 583. [Google Scholar] [CrossRef]
- Gulagi, A.; Aghahosseini, A.; Bogdanov, D.; Breyer, C. Comparison of the potential role of adiabatic compressed air energy storage (A-CAES) for a fully sustainable energy system in a region of significant and low seasonal variations. In Proceedings of the 10th International Renewable Energy Storage Conference, Düsseldorf, Germany, 15–17 March 2016. [Google Scholar]
- Barbosa, L.S.N.S.; Bogdanov, D.; Vainikka, P.; Breyer, C. Hydro, wind and solar power as a base for a 100% renewable energy supply for South and Central America. PLoS ONE 2017, 12, e0173820. [Google Scholar] [CrossRef] [PubMed]
- Aghahosseini, A.; Bogdanov, D.; Ghorbani, N.; Breyer, C. Analysis of 100% renewable energy for Iran in 2030: Integrating solar PV, wind energy and storage. Int. J. Environ. Sci. Technol. 2017, 1–20. [Google Scholar] [CrossRef]
- U.S. Energy Information Administration (EIA). Utility Bundled Retail Sales—Commercial. Data from Forms EIA-861-Schedules 4A & 4D and EIA-861S; U.S. Energy Information Administration (EIA): Washington, DC, USA, 2014.
- U.S. Energy Information Administration (EIA). Utility Bundled Retail Sales—Residential. Data from Forms EIA-861-Schedules 4A & 4D and EIA-861S; U.S. Energy Information Administration (EIA): Washington, DC, USA, 2014.
- U.S. Energy Information Administration (EIA). Utility Bundled Retail Sales—Industrial. Data from Forms EIA-861-Schedules 4A & 4D and EIA-861S; U.S. Energy Information Administration (EIA): Washington, DC, USA, 2014.
- Northwest Territories Power Corporation, Residential Electrical Rates for Northwest Territories. 2016. Available online: www.ntpc.com/customer-service/residential-service/what-is-my-power-rate (accessed on 22 March 2016).
- Government of the Northwest Territories, A Review of Electricity Regulation, Rates and Subsidy Programs in the Northwest Territories. 2008. Available online: www.pws.gov.nt.ca/pdf/Energy/Electrical%20Review%20Discussion%20Paper.pdf (accessed on 22 March 2016).
- CBC News, Electricity in Nunavut. 2011. Available online: www.cbc.ca/news/canada/electricity-in-nunavut-1.1042217 (accessed on 25 March 2016).
- The Yukon Electrical Company Limited, Industrial Primary. 2011. Available online: www.yukonenergy.ca/media/site_documents/1024_39%20Industrial%20Primary.pdf (accessed on 23 March 2016).
- The Yukon Electrical Company Limited, Residential Service, Hydro, Non-Government. 2011. Available online: www.yukonenergy.ca/media/site_documents/1038_1160%20Residential%20Service%20Hydro,%20Non-Government.pdf (accessed on 23 March 2016).
- The Yukon Electrical Company Limited, Wholesale Primary (YEC). 2011. Available online: www.yukonenergy.ca/media/site_documents/1046_42%20Wholesale%20Primary.pdf (accessed on 23 March 2016).
- Hydro Québec. Comparison of Electricity Prices in Major North American Cities; Hydro Québec: Montréal, QC, Canada, 2015. [Google Scholar]
- Comision Federal De Electricidad (CFE). Tarifas Para el Suministro y Venta de Energía Eléctrica (2015–2016). 2016. Available online: http://app.cfe.gob.mx/Aplicaciones/CCFE/Tarifas/Tarifas/tarifas_casa.asp (accessed on 25 March 2016).
- Comision Federal De Electricidad (CFE). Tarifas Para el Suministro y Venta de Energía Eléctrica (2015–2016). 2016. Available online: http://app.cfe.gob.mx/Aplicaciones/CCFE/Tarifas/Tarifas/tarifas_negocio.asp (accessed on 26 March 2016).
- Comision Federal De Electricidad (CFE). Tarifas Para el Suministro y Venta de Energía Eléctrica (2015–2016). 2016. Available online: http://app.cfe.gob.mx/Aplicaciones/CCFE/Tarifas/Tarifas/tarifas_industria.asp (accessed on 27 March 2016).
- Gerlach, A.; Werner, Ch.; Breyer, C. Impact of Financing Cost on Global Grid-Parity Dynamics till 2030. In Proceedings of the 29th EU PVSEC, Amsterdam, The Netherlands, 22–26 September 2014. [Google Scholar]
- Stackhouse, P.W.; Whitlock, C.H. (Eds.) Surface Meteorology and Solar Energy (SSE) Release 6.0, NASA SSE 6.0, Earth Science Enterprise Program; National Aeronautic and Space Administration (NASA): Langley, VA, USA, 2008.
- Stackhouse, P.W.; Whitlock, C.H. (Eds.) Surface Meteorology and Solar Energy (SSE) Release 6.0 Methodology, NASA SSE 6.0, Earth Science Enterprise Program; National Aeronautic and Space Administration (NASA): Langley, VA, USA, 2009.
- Stetter, D. Enhancement of the REMix Energy System Model: Global Renewable Energy Potentials Optimized Power Plant Siting and Scenario Validation. Ph.D. Thesis, Faculty of Energy-, Process- and Bio-Engineering, University of Stuttgart, Stuttgart, Germany, December 2012. [Google Scholar]
- Verzano, K. Climate Change Impacts on Flood Related Hydrological Processes: Further Development and Application of a Global Scale Hydrological Model, Reports on Earth System Science, 71, Max-Planck-Institut für Meteorologie, Hamburg. Ph.D. Thesis, Faculty of Electrical Engineering and Computer Science, University of Kassel, Kassel, Germany, July 2009. [Google Scholar]
- Luck, M.; Landis, M.; Gassert, F. Aqueduct Water Stress Projections: Decadal Projections of Water Supply and Demand Using CMIP5 GCMs; World Resources Institute: Washington, DC, USA, 2015. [Google Scholar]
- Caldera, U.; Bogdanov, D.; Breyer, C. Local cost of seawater RO desalination based on solar PV and wind energy—A global estimate. Desalination 2016, 385, 207–216. [Google Scholar] [CrossRef]
- American Association of Petroleum Geologists (AAPG). Global Heat Flow Database; American Association of Petroleum Geologists: Tulsa, OK, USA, 2015. [Google Scholar]
- International Association of Seismology and Physics of the Earth’s Interior (IASPEI). The International Heat Flow Commission; IHFC Database; International Association of Seismology and Physics of the Earth’s Interior: Boulder, CO, USA, 2015. [Google Scholar]
- Chamorro, C.R.; García-Cuesta, J.L.; Mondéjar, M.E.; Pérez-Madrazo, A. An estimation of the enhanced geothermal systems potential for the Iberian Peninsula. Renew. Energy 2014, 66, 1–14. [Google Scholar] [CrossRef]
- Chamorro, C.R.; García-Cuesta, J.L.; Mondéjar, M.E.; Pérez-Madrazo, A. Enhanced geothermal systems in Europe: An estimation and comparison of the technical and sustainable potentials. Energy 2014, 65, 250–263. [Google Scholar] [CrossRef]
- Huenges, E. Geothermal Energy Systems, Exploration, Development and Utilization, 2nd ed.; Wiley: Weinheim, Germany, 2012. [Google Scholar]
- German Biomass Research Centre. Regionale und Globale Räumliche Verteilung von Biomassepotenzialen; German Biomass Research Centre: Leipzig, German, 2009. [Google Scholar]
- International Energy Agency (IEA). Technology Roadmap—Bioenergy for Heat and Power; IEA Publications: Paris, France, 2012. [Google Scholar]
- Intergovernmental Panel on Climate Change (IPCC). Special Report on RE Sources and CC Mitigation; Intergovernmental Panel on Climate Change: Geneva, Switzerland, 2011. [Google Scholar]
- Toktarova, A.; Bogdanov, D.; Breyer, C. Long-Term Load Forecasting in High Resolution for All Countries Globally; 2017; submitted for publication. [Google Scholar]
- Statistics Canada, Report on Energy Supply and Demand in Canada, Catalogue No. 57-003-x. 2013. Available online: www.statcan.gc.ca/pub/57-003-x/57-003-x2015002-eng.pdf (accessed on 24 April 2016).
- SENER. Balance Nacional de Energia; Secretaria De Energia: Mexico City, Mexico, 2014. Available online: www.gob.mx/cms/uploads/attachment/file/44353/Balance_Nacional_de_Energ_a_2014.pdf (accessed on 02 February 2016).
- U.S. Energy Information Administration (EIA). Electric Power Annual 2013; U.S. Energy Information Administration: Washington, DC, USA, 2015.
- Breyer, C.; Werner, C.; Rolland, S.; Adelmann, P. Off-Grid Photovoltaic Applications in Regions of Low Electrification: High Demand, Fast Financial Amortization and Large Market Potential. In Proceedings of the 26th EU PVSEC, Hamburg, Germany, 5–9 September 2011. [Google Scholar]
- Breyer, C.; Gaudchau, E.; Gerlach, A.-K.; Hlusiak, M.; Cader, C.; Bertheau, P.; Wasgindt, V. PV-Based Mini-Grids for Electrification in Developing Countries—An Overview on Market Potentials and Business Models. A Study of the Reiner Lemoine Institut gGmbH on Behalf of the Cdw Stiftungsverbund gGmbH. 11 December 2012. Available online: https://goo.gl/VyvTaK (accessed on 4 August 2017).
- Molyneaux, L.; Wagner, L.; Foster, J. Rural electrification in India: Galilee Basin coal versus decentralised renewable energy micro grids. Renew. Energy 2016, 89, 422–436. [Google Scholar] [CrossRef]
- Yadoo, A.; Cruickshank, H. The role for low carbon electrification technologies in poverty reduction and climate change strategies: A focus on renewable energy mini-grids with case studies in Nepal, Peru and Kenya. Energy Policy 2012, 42, 591–602. [Google Scholar] [CrossRef]
- Sen, R.; Bhattacharyya, S.C. Off-grid electricity generation with renewable energy technologies in India: An application of HOMER. Renew. Energy 2014, 62, 388–398. [Google Scholar] [CrossRef]
- Fraunhofer ISE, Current and Future Cost of Photovoltaics. Long-Term Scenarios for Market Development, System Prices and LCOE of Utility-Scale PV Systems, Study on Behalf of Agora Energiewende, Freiburg and Berlin. 2015. Available online: www.agora-energiewende.de/fileadmin/Projekte/2014/Kosten-Photovoltaik-2050/AgoraEnergiewende_Current_and_Future_Cost_of_PV_Feb2015_web.pdf (accessed on 12 Feburary 2016).
- Hoffmann, W. Importance and evidence for cost effective electricity storage. In Proceedings of the 29th EU PVSEC, Amsterdam, The Netherlands, 22–26 September 2014. [Google Scholar]
- Nykvist, B.; Nilsson, M. Rapidly falling costs of battery packs for electric vehicles. Nat. Clim. Chang. 2015, 5, 329–332. [Google Scholar] [CrossRef]
- Child, M.; Breyer, C.; Bogdanov, D.; Fell, H.J. The role of storage technologies for the transition to a 100% renewable energy system in Ukraine. In Proceedings of the 11th International Renewable Energy Storage Conference, Düsseldorf, Germany, 14–16 March 2017. [Google Scholar]
- Caldera, U.; Bogdanov, D.; Afanasyeva, S.; Breyer, C. Integration of reverse osmosis seawater desalination in the power sector, based on PV and wind energy, for the Kingdom of Saudi Arabia. In Proceedings of the 32nd EU PVSEC, Munich, Germany, 20–24 June 2016. [Google Scholar]
- Ghorbani, N.; Aghahosseini, A.; Breyer, C. Transition to a 100% renewable energy system and the role of storage technologies: A case study of Iran. In Proceedings of the 11th International Renewable Energy Storage Conference, Düsseldorf, Germany, 14–16 March 2017. [Google Scholar]
- Gulagi, A.; Bogdanov, D.; Breyer, C. The Demand for Storage Technologies in Energy Transition Pathways Towards 100% Renewable Energy for India. In Proceedings of the 11th International Renewable Energy Storage Conference, Düsseldorf, Germany, 14–16 March 2017. [Google Scholar]
- Breyer, C.; Gerlach, A. Global Overview on Grid-Parity. Prog. Photovolt. Res. Appl. 2013, 21, 121–136. [Google Scholar] [CrossRef]
- International Energy Agency (IEA). World Energy Outlook 2014; IEA Publishing: Paris, France, 2014. [Google Scholar]
- Teske, S.; Sawyer, S.; Schäfer, O.; Pregger, T.; Simon, S.; Naegler, T.; Schmid, S.; Özdemir, E.D.; Pagenkopf, J.; Kleiner, F.; et al. Energy [R]evolution—A Sustainable World Energy Outlook 2015, Greenpeace International, GWEC and SolarPowerEurope, 5th ed.; Greenpeace: Amsterdam, The Netherlands, 2015. [Google Scholar]
- Bloomberg New Energy Finance (BNEF). New Energy Outlook 2015; Bloomberg New Energy Finance: London, UK, 2015. [Google Scholar]
- International Renewable Energy Agency (IRENA). Renewable Energy Prospects: United States of America, REmap 2030 Analysi; IRENA: Abu Dhabi, UAE, 2015. [Google Scholar]
- Clean Technica, 100% Renewable Energy Goal for Hawaii: Governor Signs Bill, the US. 2015. Available online: http://cleantechnica.com/2015/06/11/100-renewable-energy-goal-hawaii-governor-signs-bill/ (accessed on 10 June 2016).
- DBEDT Hawaii State Energy Office, Hawaii Energy Facts & Figures, Hawaii, the US. 2015. Available online: www.energy.hawaii.gov (accessed on 2 January 2016).
- Go 100% Renewable Energy, San Francisco—100% Renewable Power by 2030, the US. 2016. Available online: www.go100percent.org/cms/index.php?id=77&tx_ttnews[tt_news]=79&cHash=064a35afc66d04fe0785cee33ef04ba0 (accessed on 15 June 2016).
- Jacobson, M.Z.; Delucchi, M.A.; Bazouin, G.; Dvorak, M.J.; Arghandeh, R.; Bauer, Z.A.; Cotte, A.; de Moor, G.M.; Goldner, E.G.; Heier, C.; et al. A 100% wind, water, sunlight (WWS) all-sector energy plan for Washington State. Renew. Energy 2016, 86, 75–88. [Google Scholar] [CrossRef]
- Agora Energiewende. Comparing the Cost of Low-Carbon Technologies: What Is the Cheapest Option? Report by Prognos AG on Behalf of Agora Energiewende. 2014, pp. 10–13. Available online: www.prognos.com/fileadmin/pdf/publikationsdatenbank/140417_Prognos_Agora_Analysis_Decarbonisationtechnologies_EN.pdf (accessed on 20 February 2016).
- Tokimatsu, K.; Yasuoka, R.; Nishio, M. Global zero emissions scenarios: The role of biomass energy with carbon capture and storage by forested land use. Appl. Energy 2017, 185, 1899–1906. [Google Scholar] [CrossRef]
- Chang, M.; White, D.; Hausman, E.; Hughes, N.; Biewald, B. Big Risks, Better Alternatives. Prepared for the Union of Concerned Scientists; Synapse Energy Economics, Inc.: Cambridge, MA, USA, 2011. [Google Scholar]
- Boccard, N. The cost of nuclear electricity: France after Fukushima. Energy Policy 2014, 66, 450–461. [Google Scholar] [CrossRef]
- Zegart, D. Kemper: Leading US ‘Clean Coal’ Project Admits It can’t Afford to Burn Coal; Greenpeace Energydesk: Amsterdam, The Netherlands, 2017. [Google Scholar]
- European Commission. Integration of Renewable Energy in Europe. Study Prepared by KEMA Consulting, DNV GL—Energy, Imperial College and NERA Economic Consulting on Behalf of DG Energy; European Commission: Brussels, Belgium, 2014; pp. 7, 8, 54. [Google Scholar]
- World Wide Fund for Nature (WWF). The Energy Report: 100% Renewable Energy by 2050; World Wide Fund for Nature: Gland, Switzerland, 2011. [Google Scholar]
- Dittmar, M. Nuclear energy: Status and future limitations. Energy 2012, 37, 35–40. [Google Scholar] [CrossRef]
Figure 1.
Model flow chart for energy system modelling.

Figure 2.
Block diagram of the energy system model [14] for North America. Abbreviations: ST: steam turbine; PtH: power-to-heat done by heating rod; ICE: internal combustion engine; GT: gas turbine and HHB: hot heat burner.
Figure 2.
Block diagram of the energy system model [14] for North America. Abbreviations: ST: steam turbine; PtH: power-to-heat done by heating rod; ICE: internal combustion engine; GT: gas turbine and HHB: hot heat burner.

Figure 3.
The figure represents North American sub-regions, including the U.S., Canada and Mexico, and HVDC transmission lines configuration. This region is divided into 20 sub-regions: U.S.-New England & New York (US-NENY), U.S.-Mid-Atlantics (US-MA), U.S.-Carolinas (US-CAR), U.S.-Southern (US-S), U.S.-Tennessee Valley Authority (US-TVA), U.S.-Midwest (US-MW), U.S.-Central (US-C), U.S.-Texas (US-TX), U.S.-Southwest (US-SW), U.S.-Northwest (US-NW), U.S.-California (US-CA), U.S.-Alaska (US-AK), U.S.-Hawaii (US-HI), U.S.-Gulf (US-GU), West Canada (CA-W), East Canada (CA-E), Northwest Mexico (MX-NW), North Mexico (MX-N), Central Mexico (MX-C) and South Mexico (MX-S). Behrmann Cylindrical Projection is used for all the maps in order to compress the northern part of Canada which is not the main discussion in this study.

Figure 4.
Aggregated hourly resolution profiles for optimally tilted PV (a), single-axis tracking PV (b), CSP solar field (c) and wind power plant (d) in North America. The UTC time is assumed based on the weighted average of all countries.
Figure 4.
Aggregated hourly resolution profiles for optimally tilted PV (a), single-axis tracking PV (b), CSP solar field (c) and wind power plant (d) in North America. The UTC time is assumed based on the weighted average of all countries.
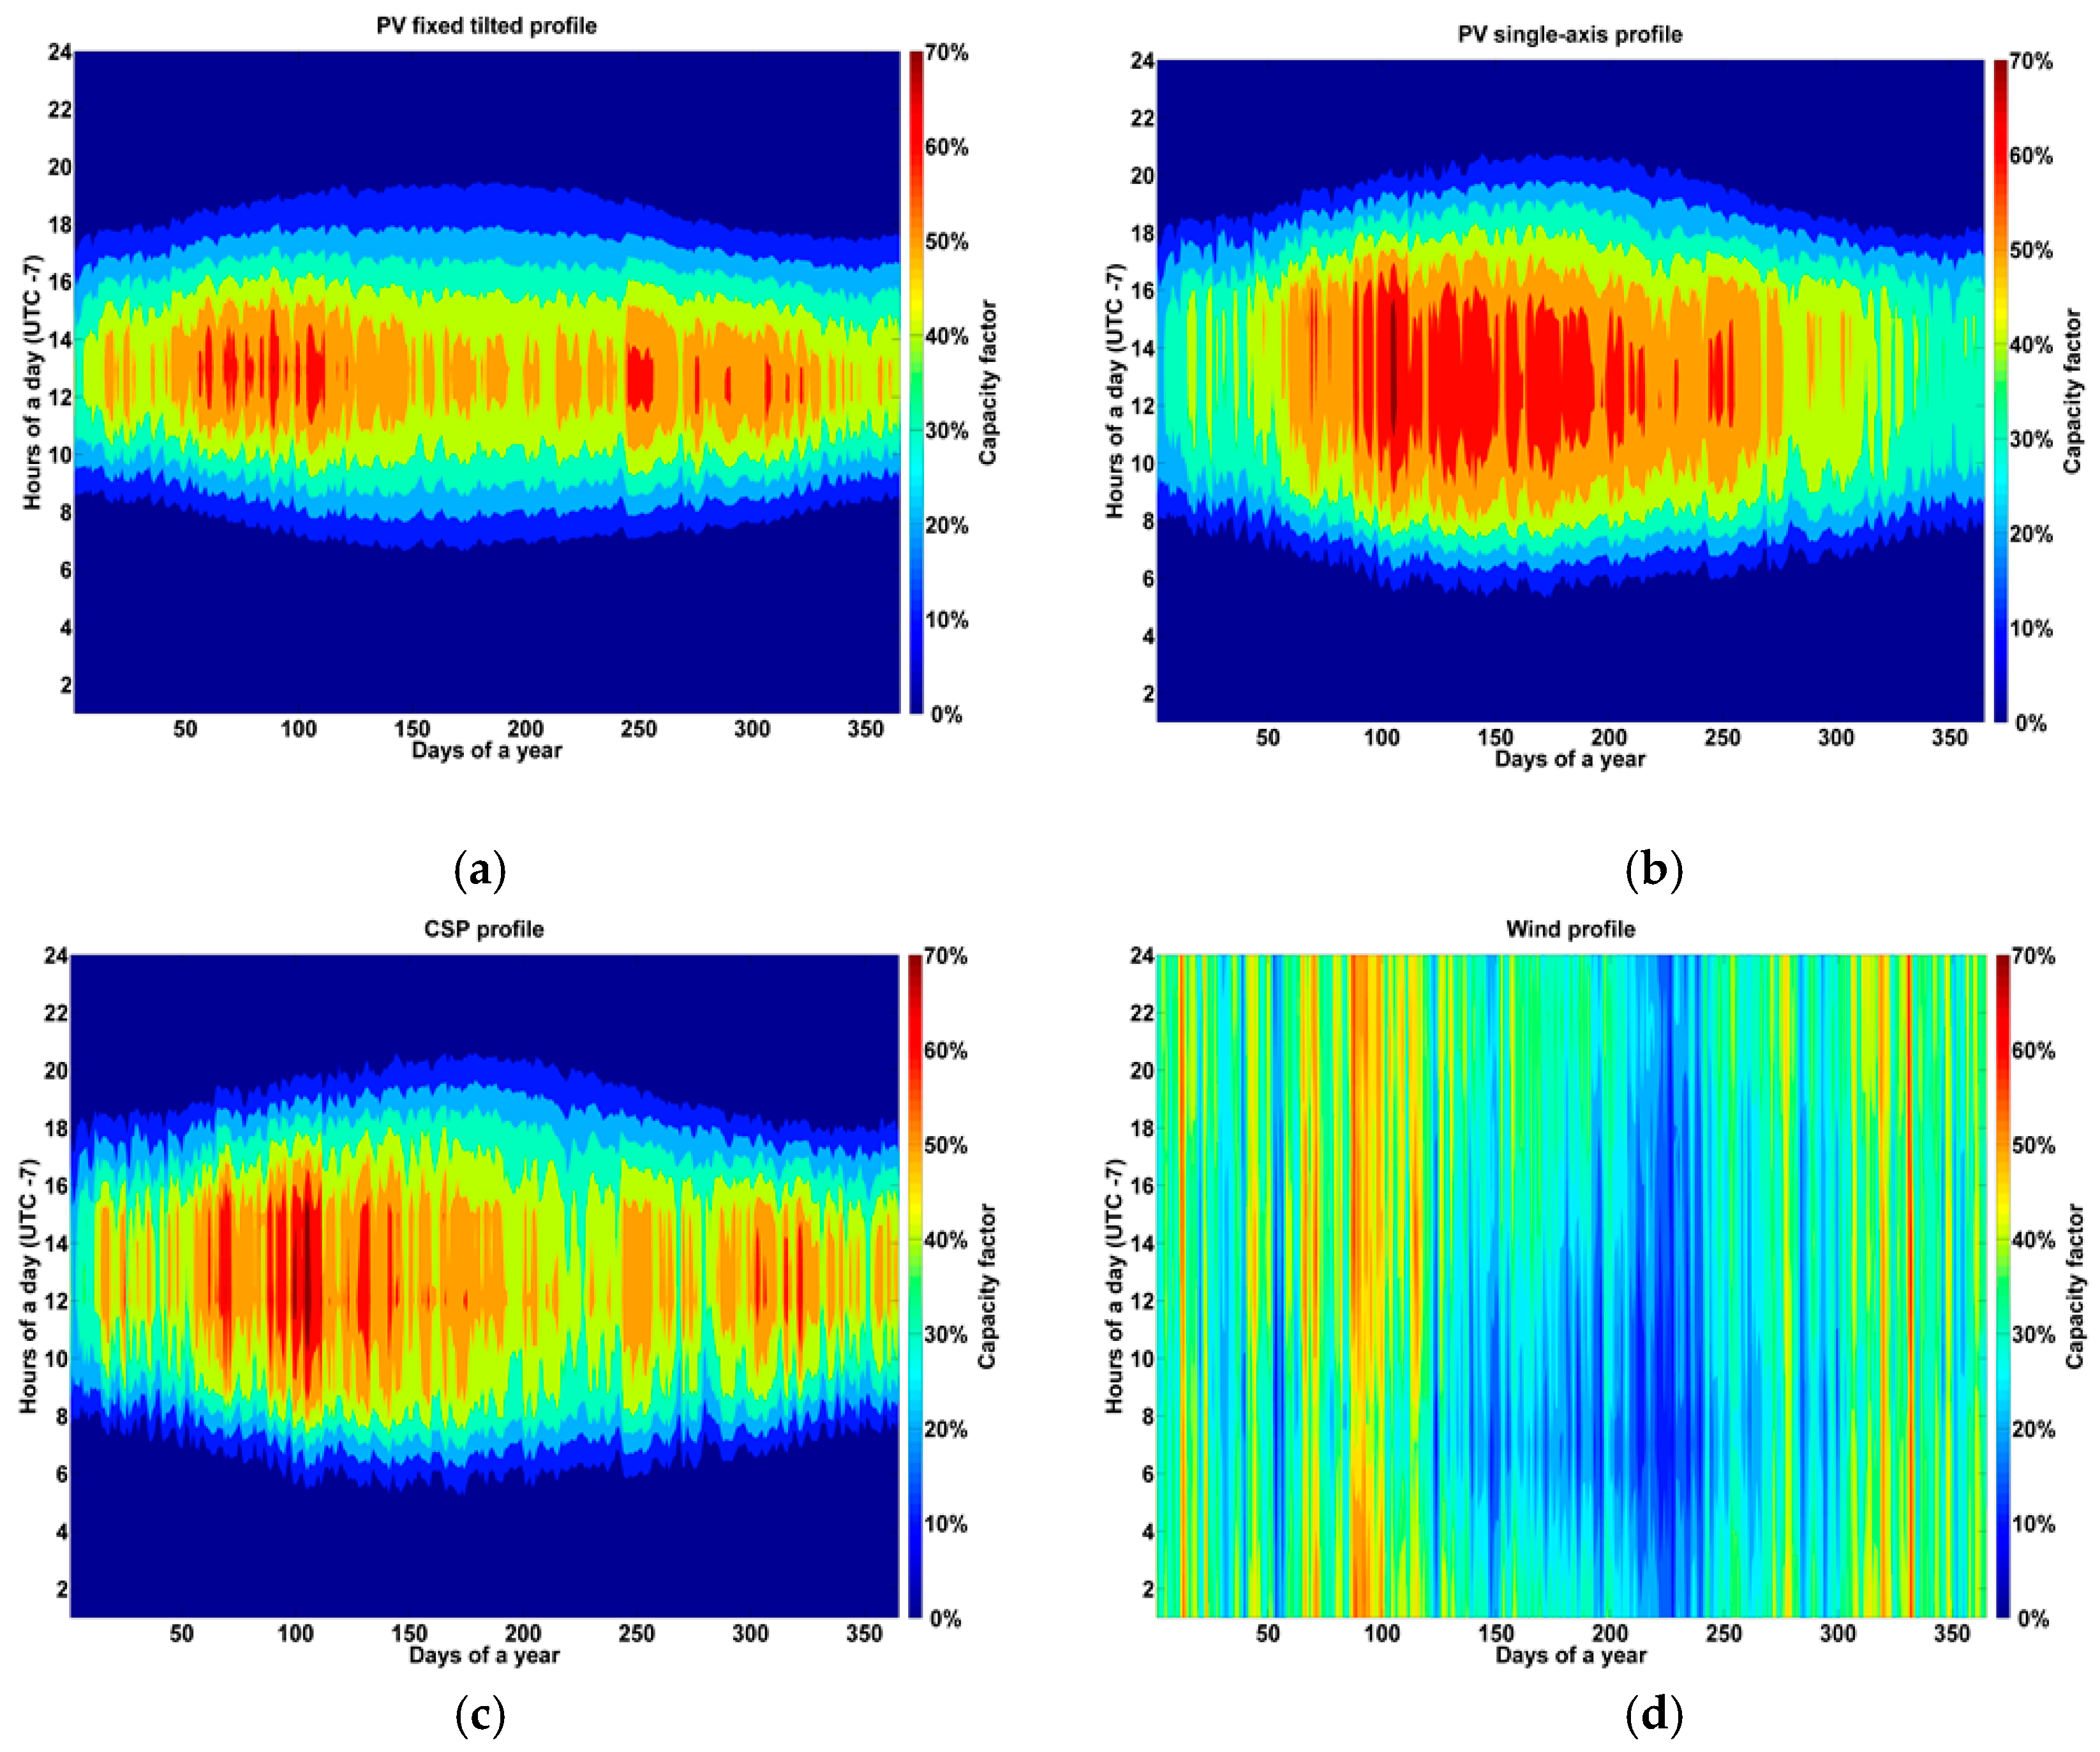
Figure 5.
Aggregated load profile (a) and system load profile with the impact of prosumers (b) for the year 2030 in North America.
Figure 5.
Aggregated load profile (a) and system load profile with the impact of prosumers (b) for the year 2030 in North America.

Figure 6.
Annual import and export of electricity for the area-wide scenario.

Figure 7.
Energy trade among 20 sub-regions for the year 2030 (in units of TWh). The ribbon colour illustrates the amount of transmitted electricity from one region to another. Exporter regions have the same colour as the ribbon colour (e.g., 266 TWh electricity exports from the US-MW to the US-TVA).

Figure 8.
Installed capacities of RE resources (a) and storage capacities (b) for region-wide (top), area-wide (centre) and integrated (bottom) scenarios for North America.
Figure 8.
Installed capacities of RE resources (a) and storage capacities (b) for region-wide (top), area-wide (centre) and integrated (bottom) scenarios for North America.

Figure 9.
Energy system flow diagram for the integrated scenario.

Figure 10.
A comparison of the integrated sectors and independent sectors for both the total annual cost (a) and the total electricity generation from RE resources (b).
Figure 10.
A comparison of the integrated sectors and independent sectors for both the total annual cost (a) and the total electricity generation from RE resources (b).

Figure 11.
Comparison of LCOEBAU (a) and LCOEBAU-CO2 (b) to region-wide, country-wide and area-wide scenarios.
Figure 11.
Comparison of LCOEBAU (a) and LCOEBAU-CO2 (b) to region-wide, country-wide and area-wide scenarios.


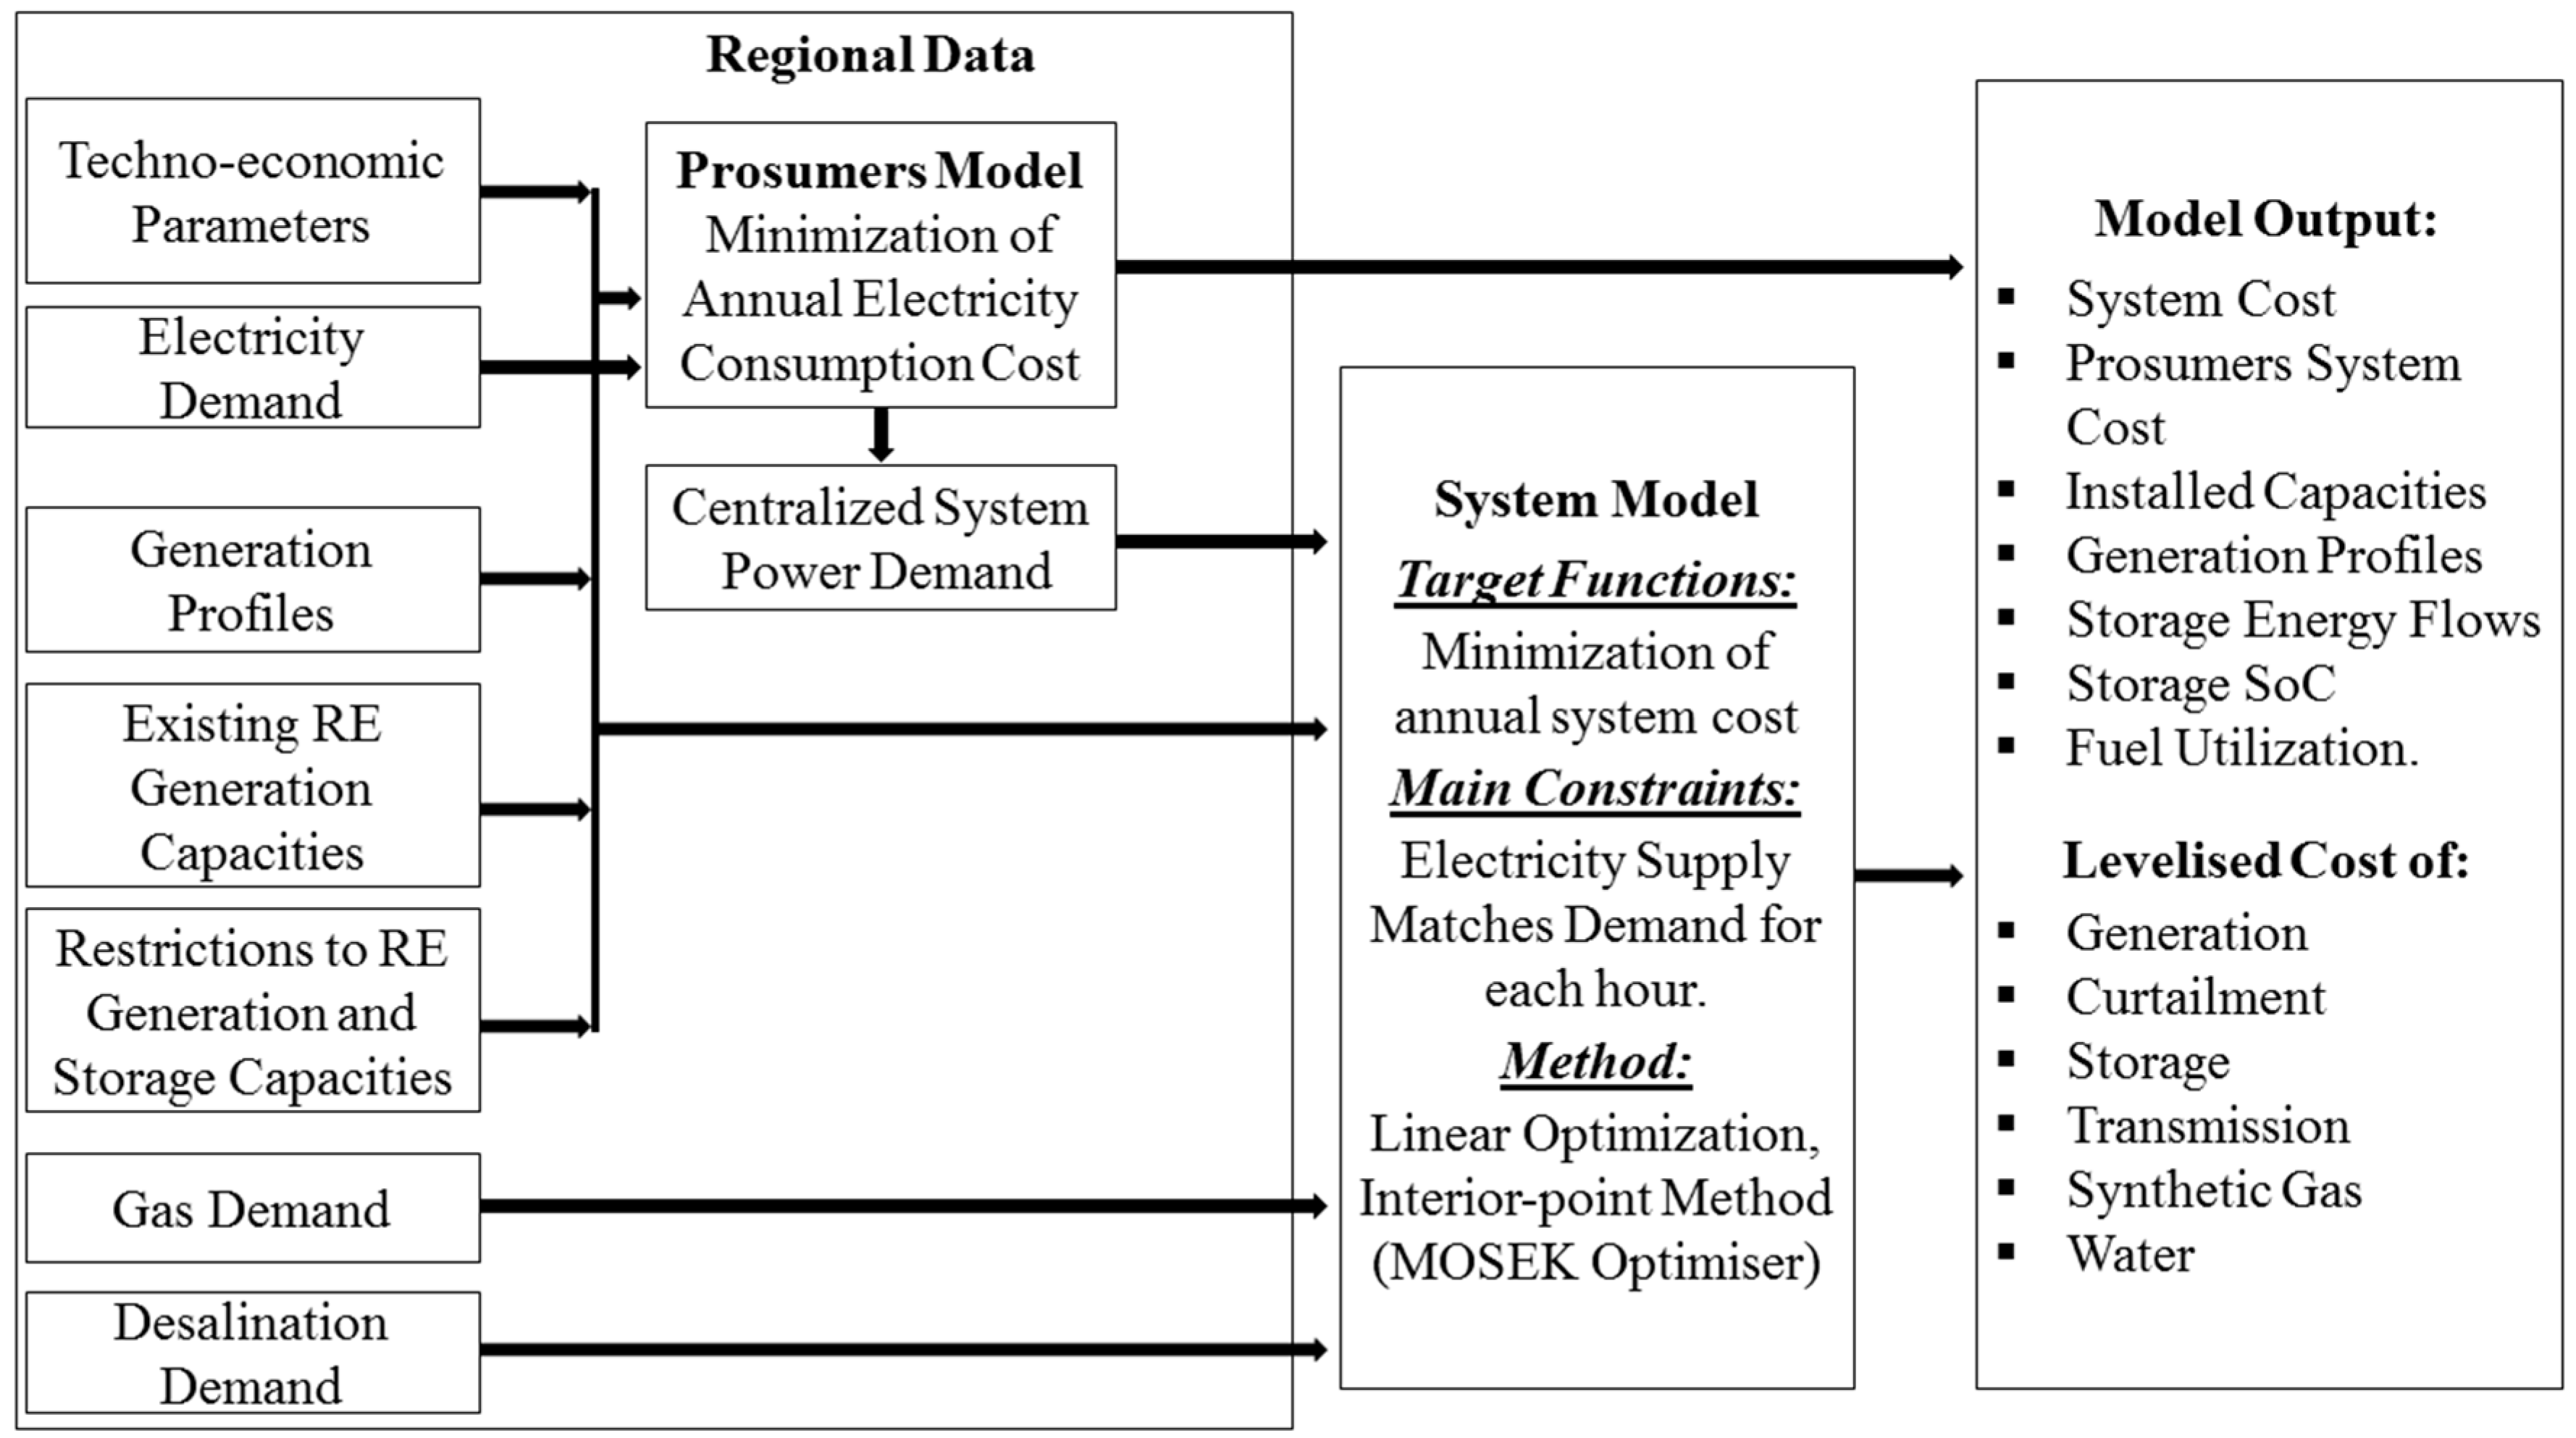
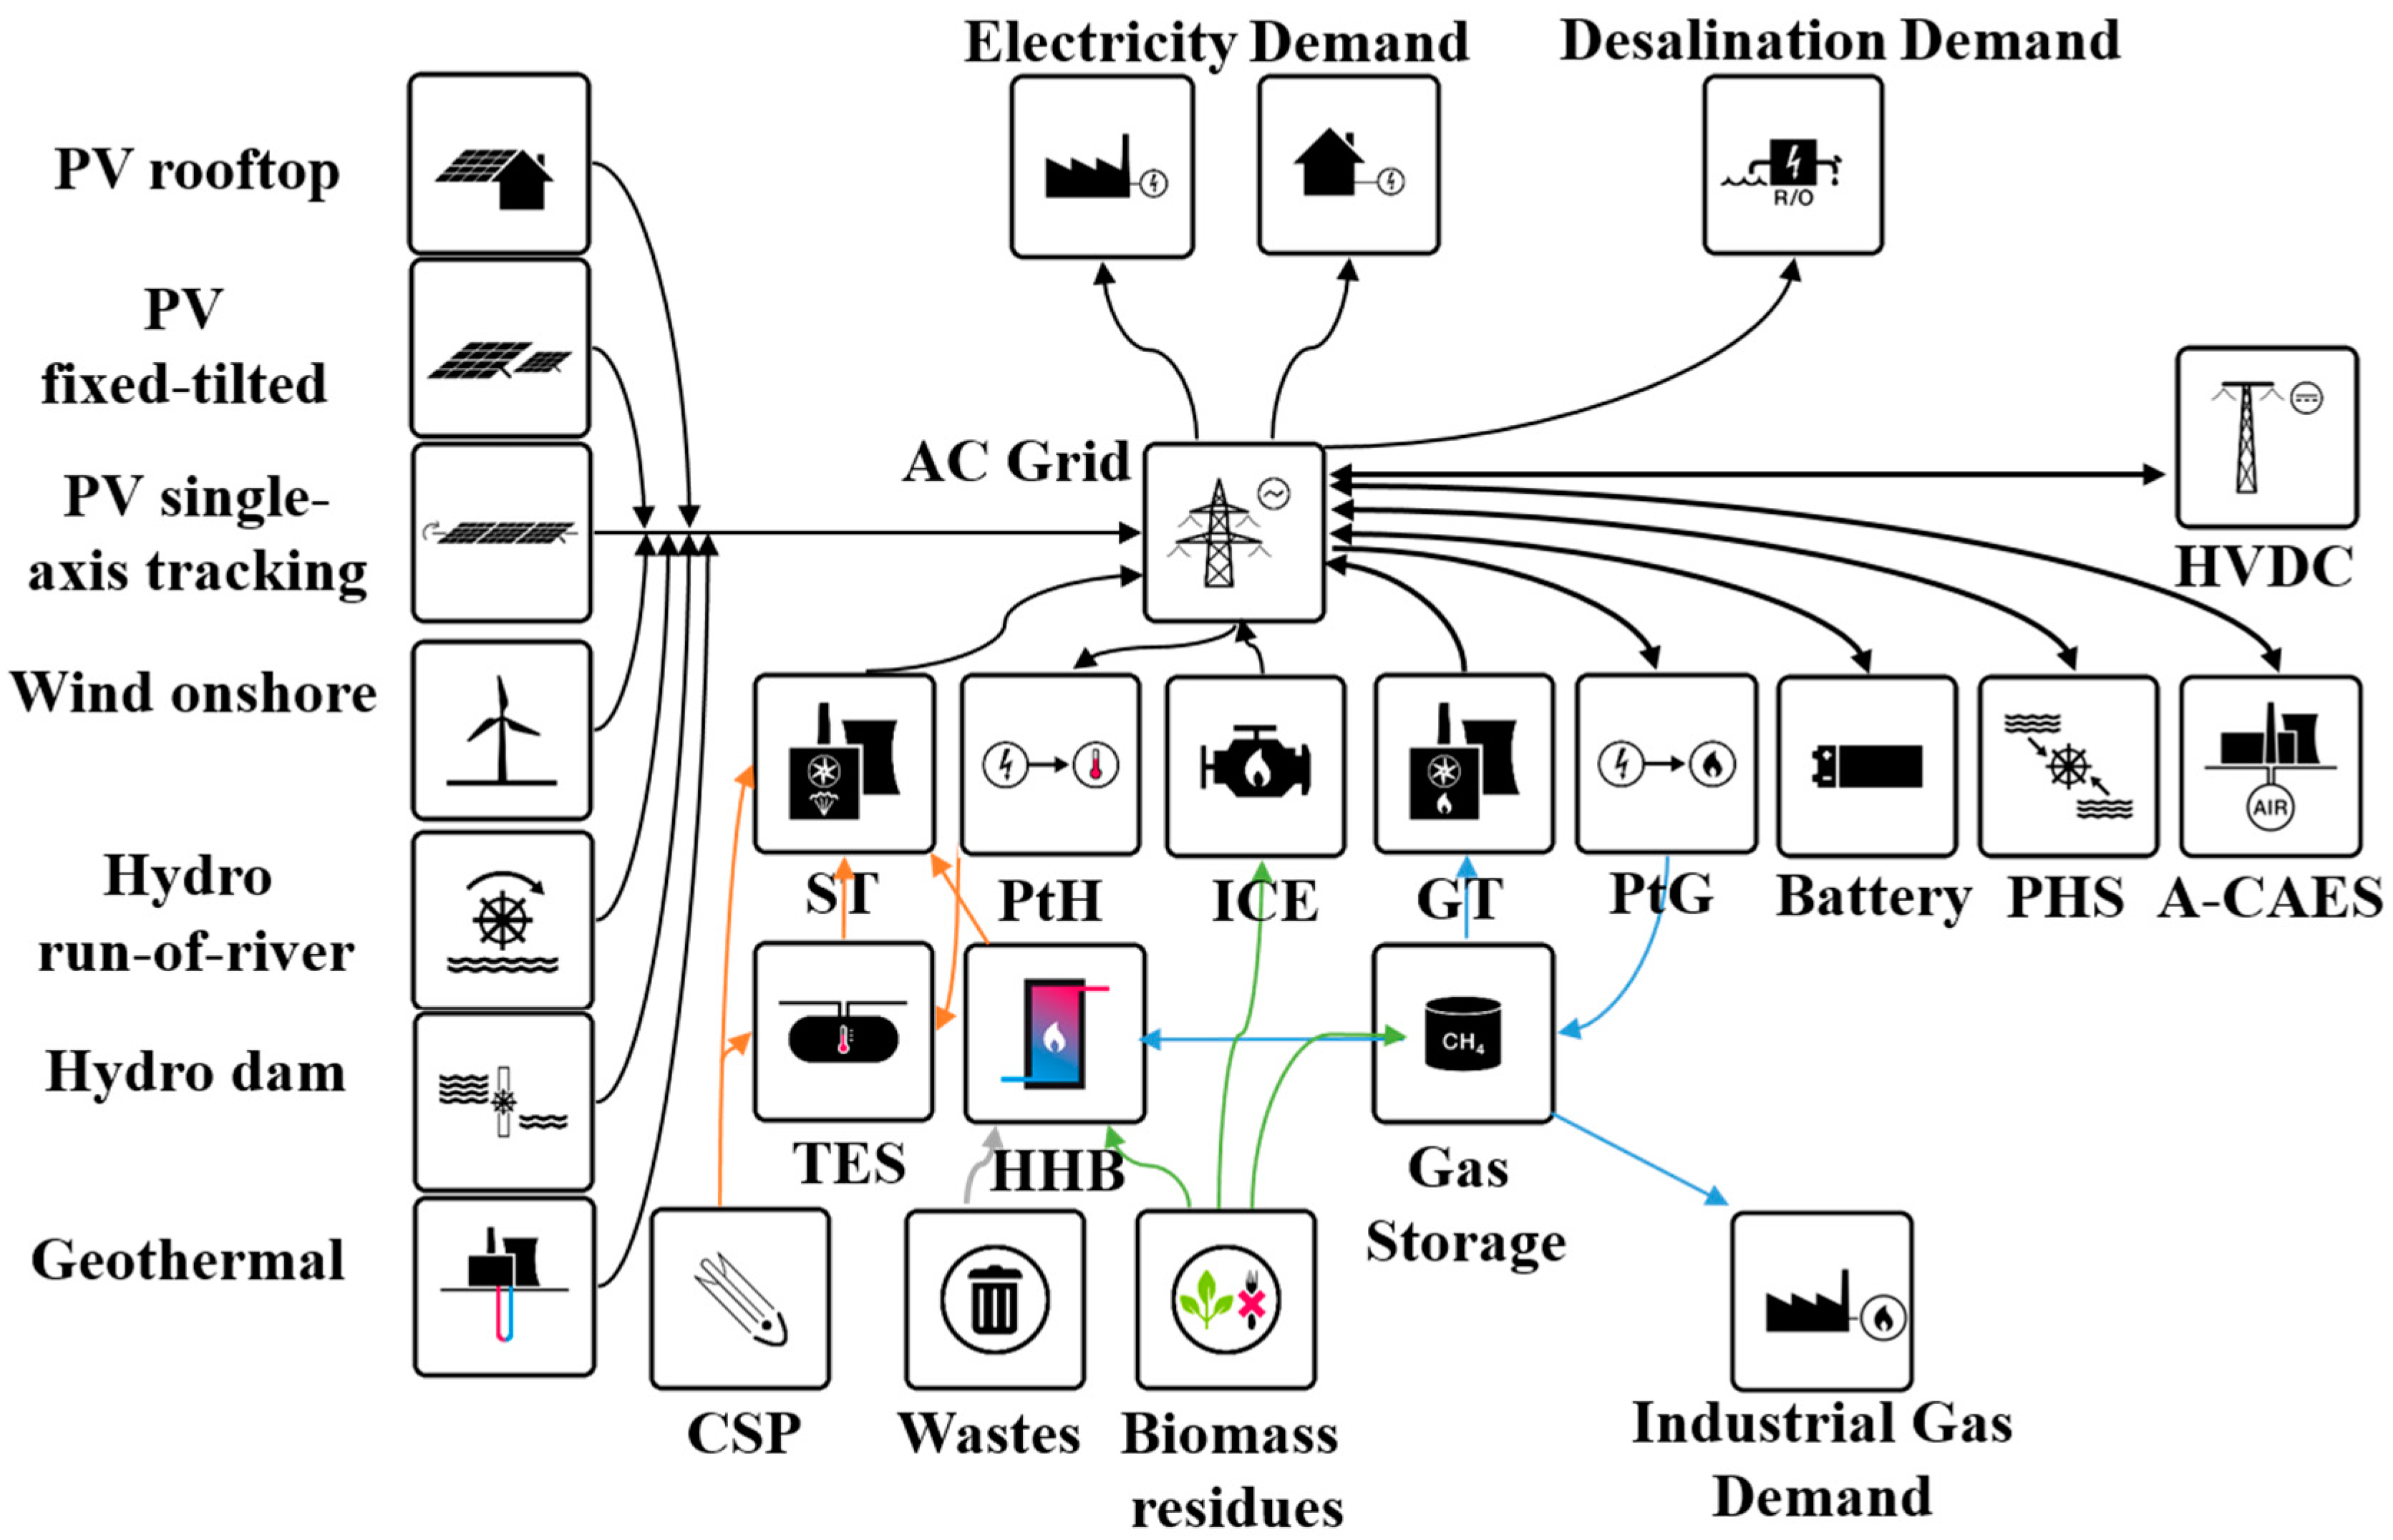
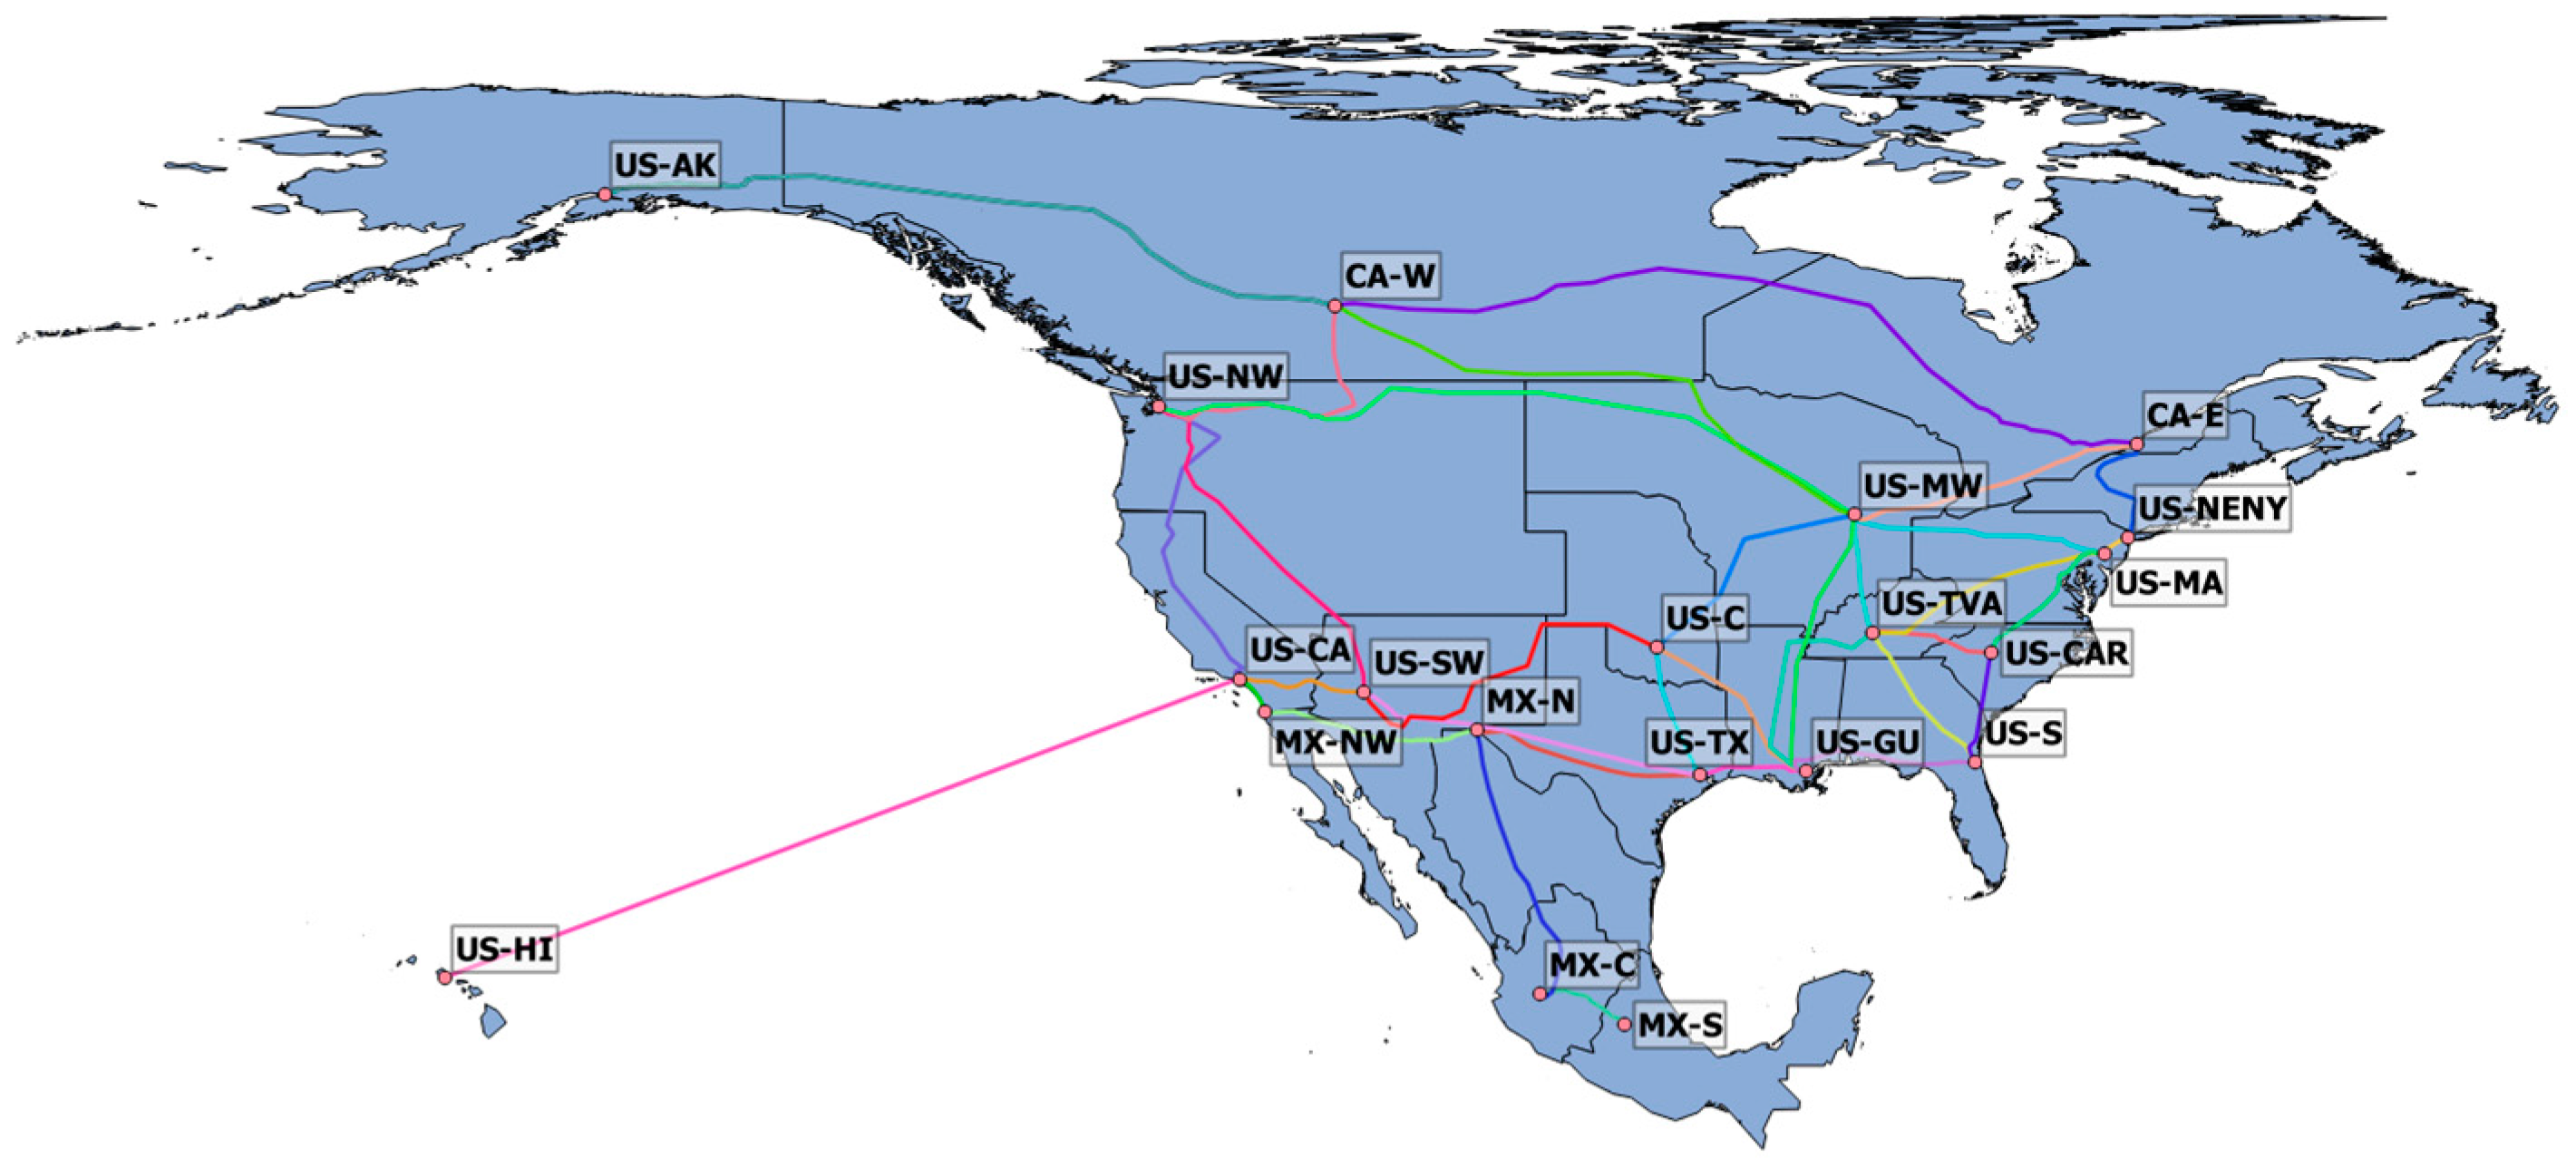
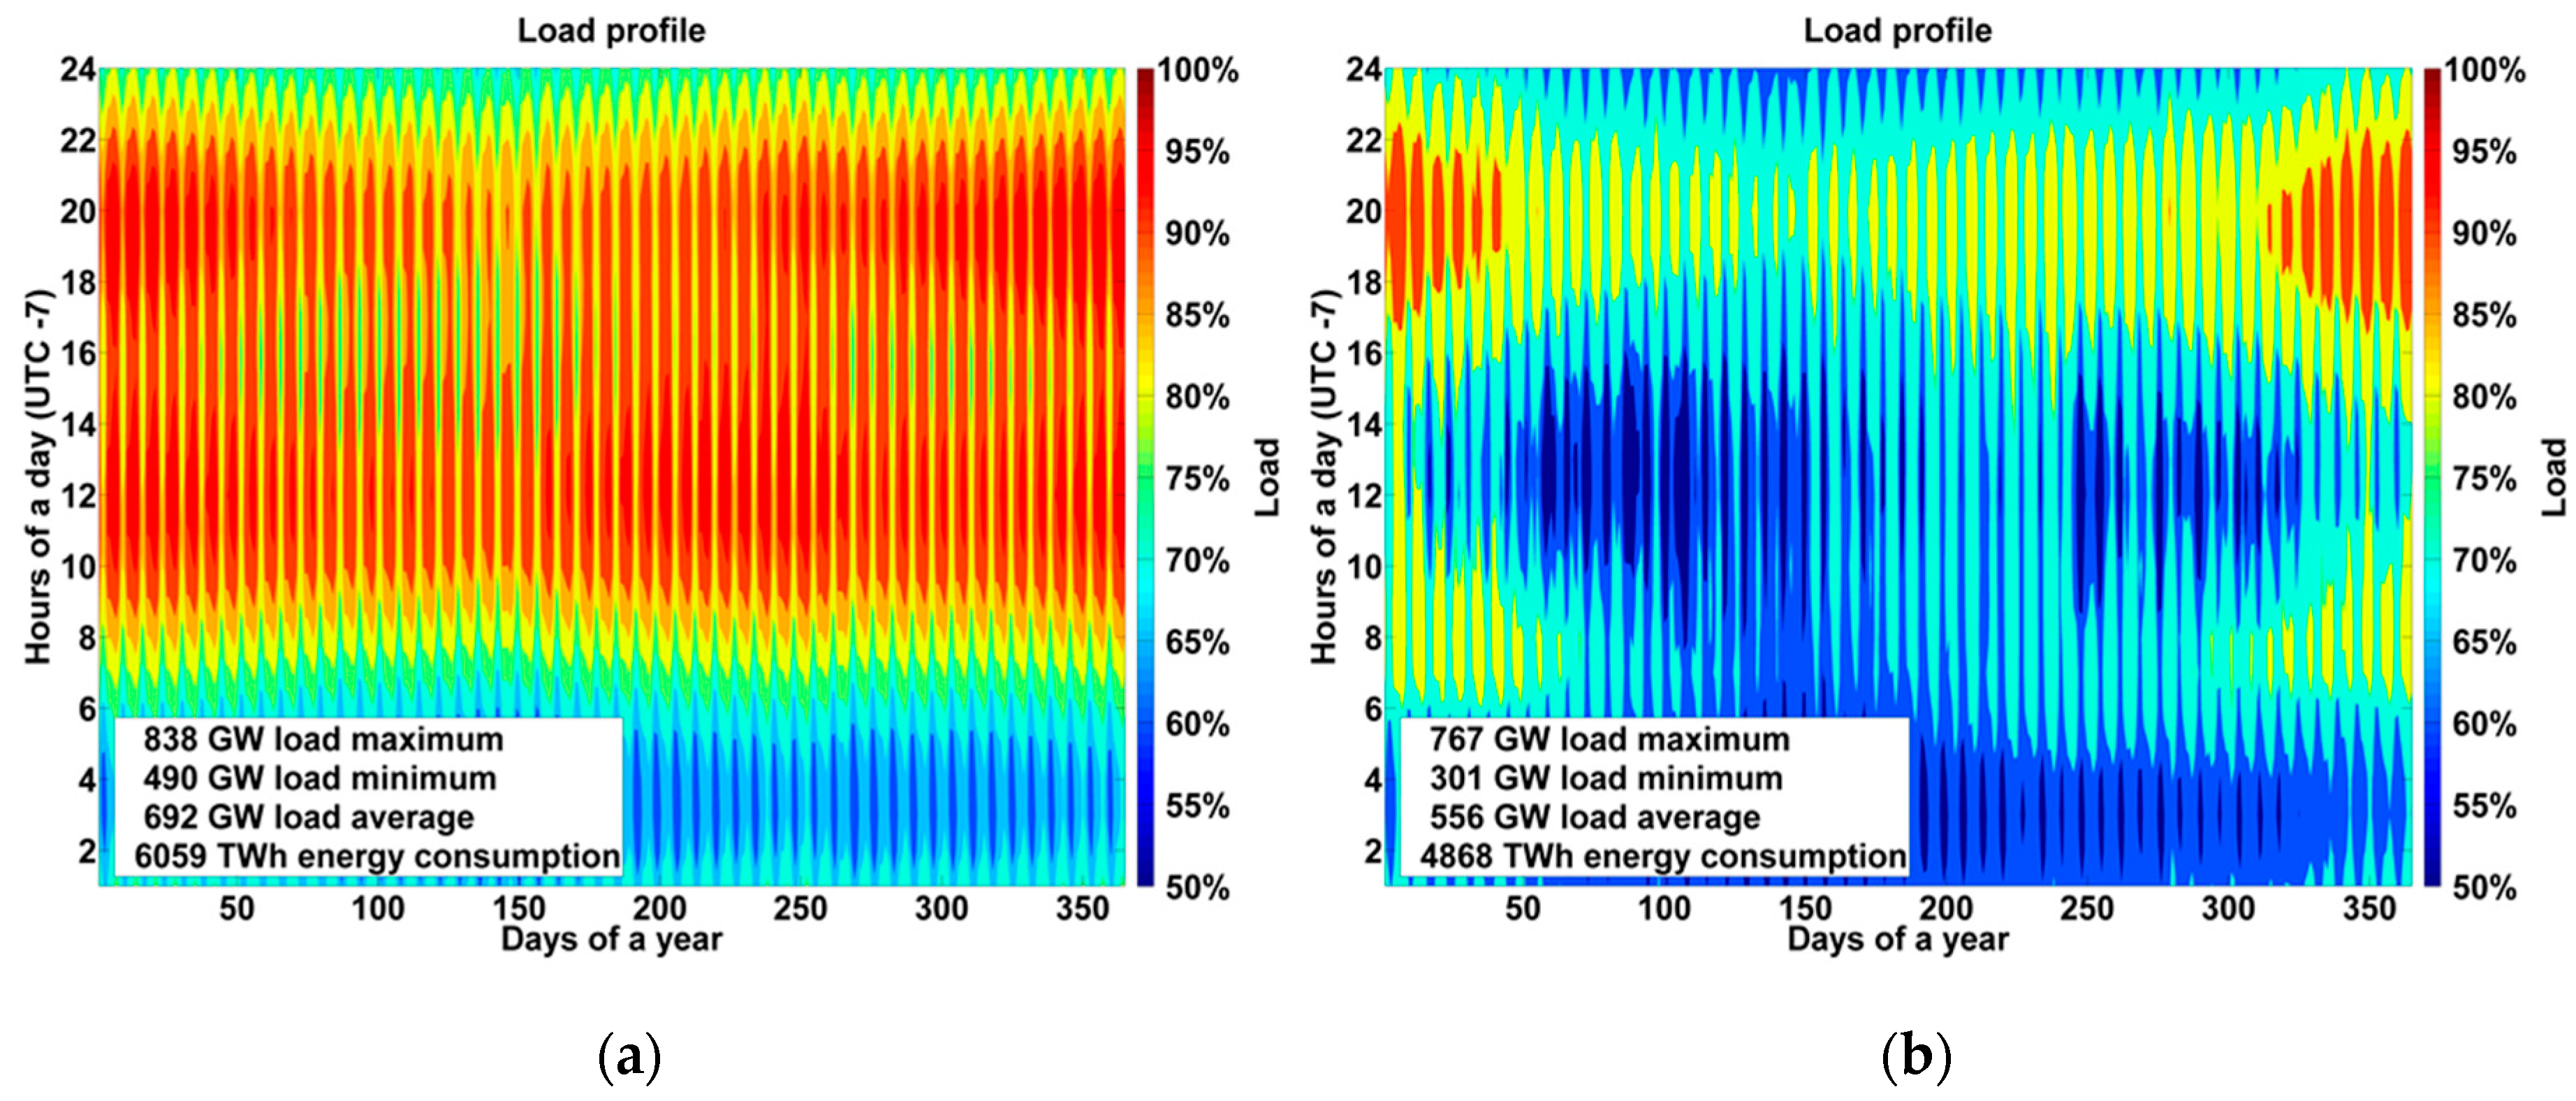
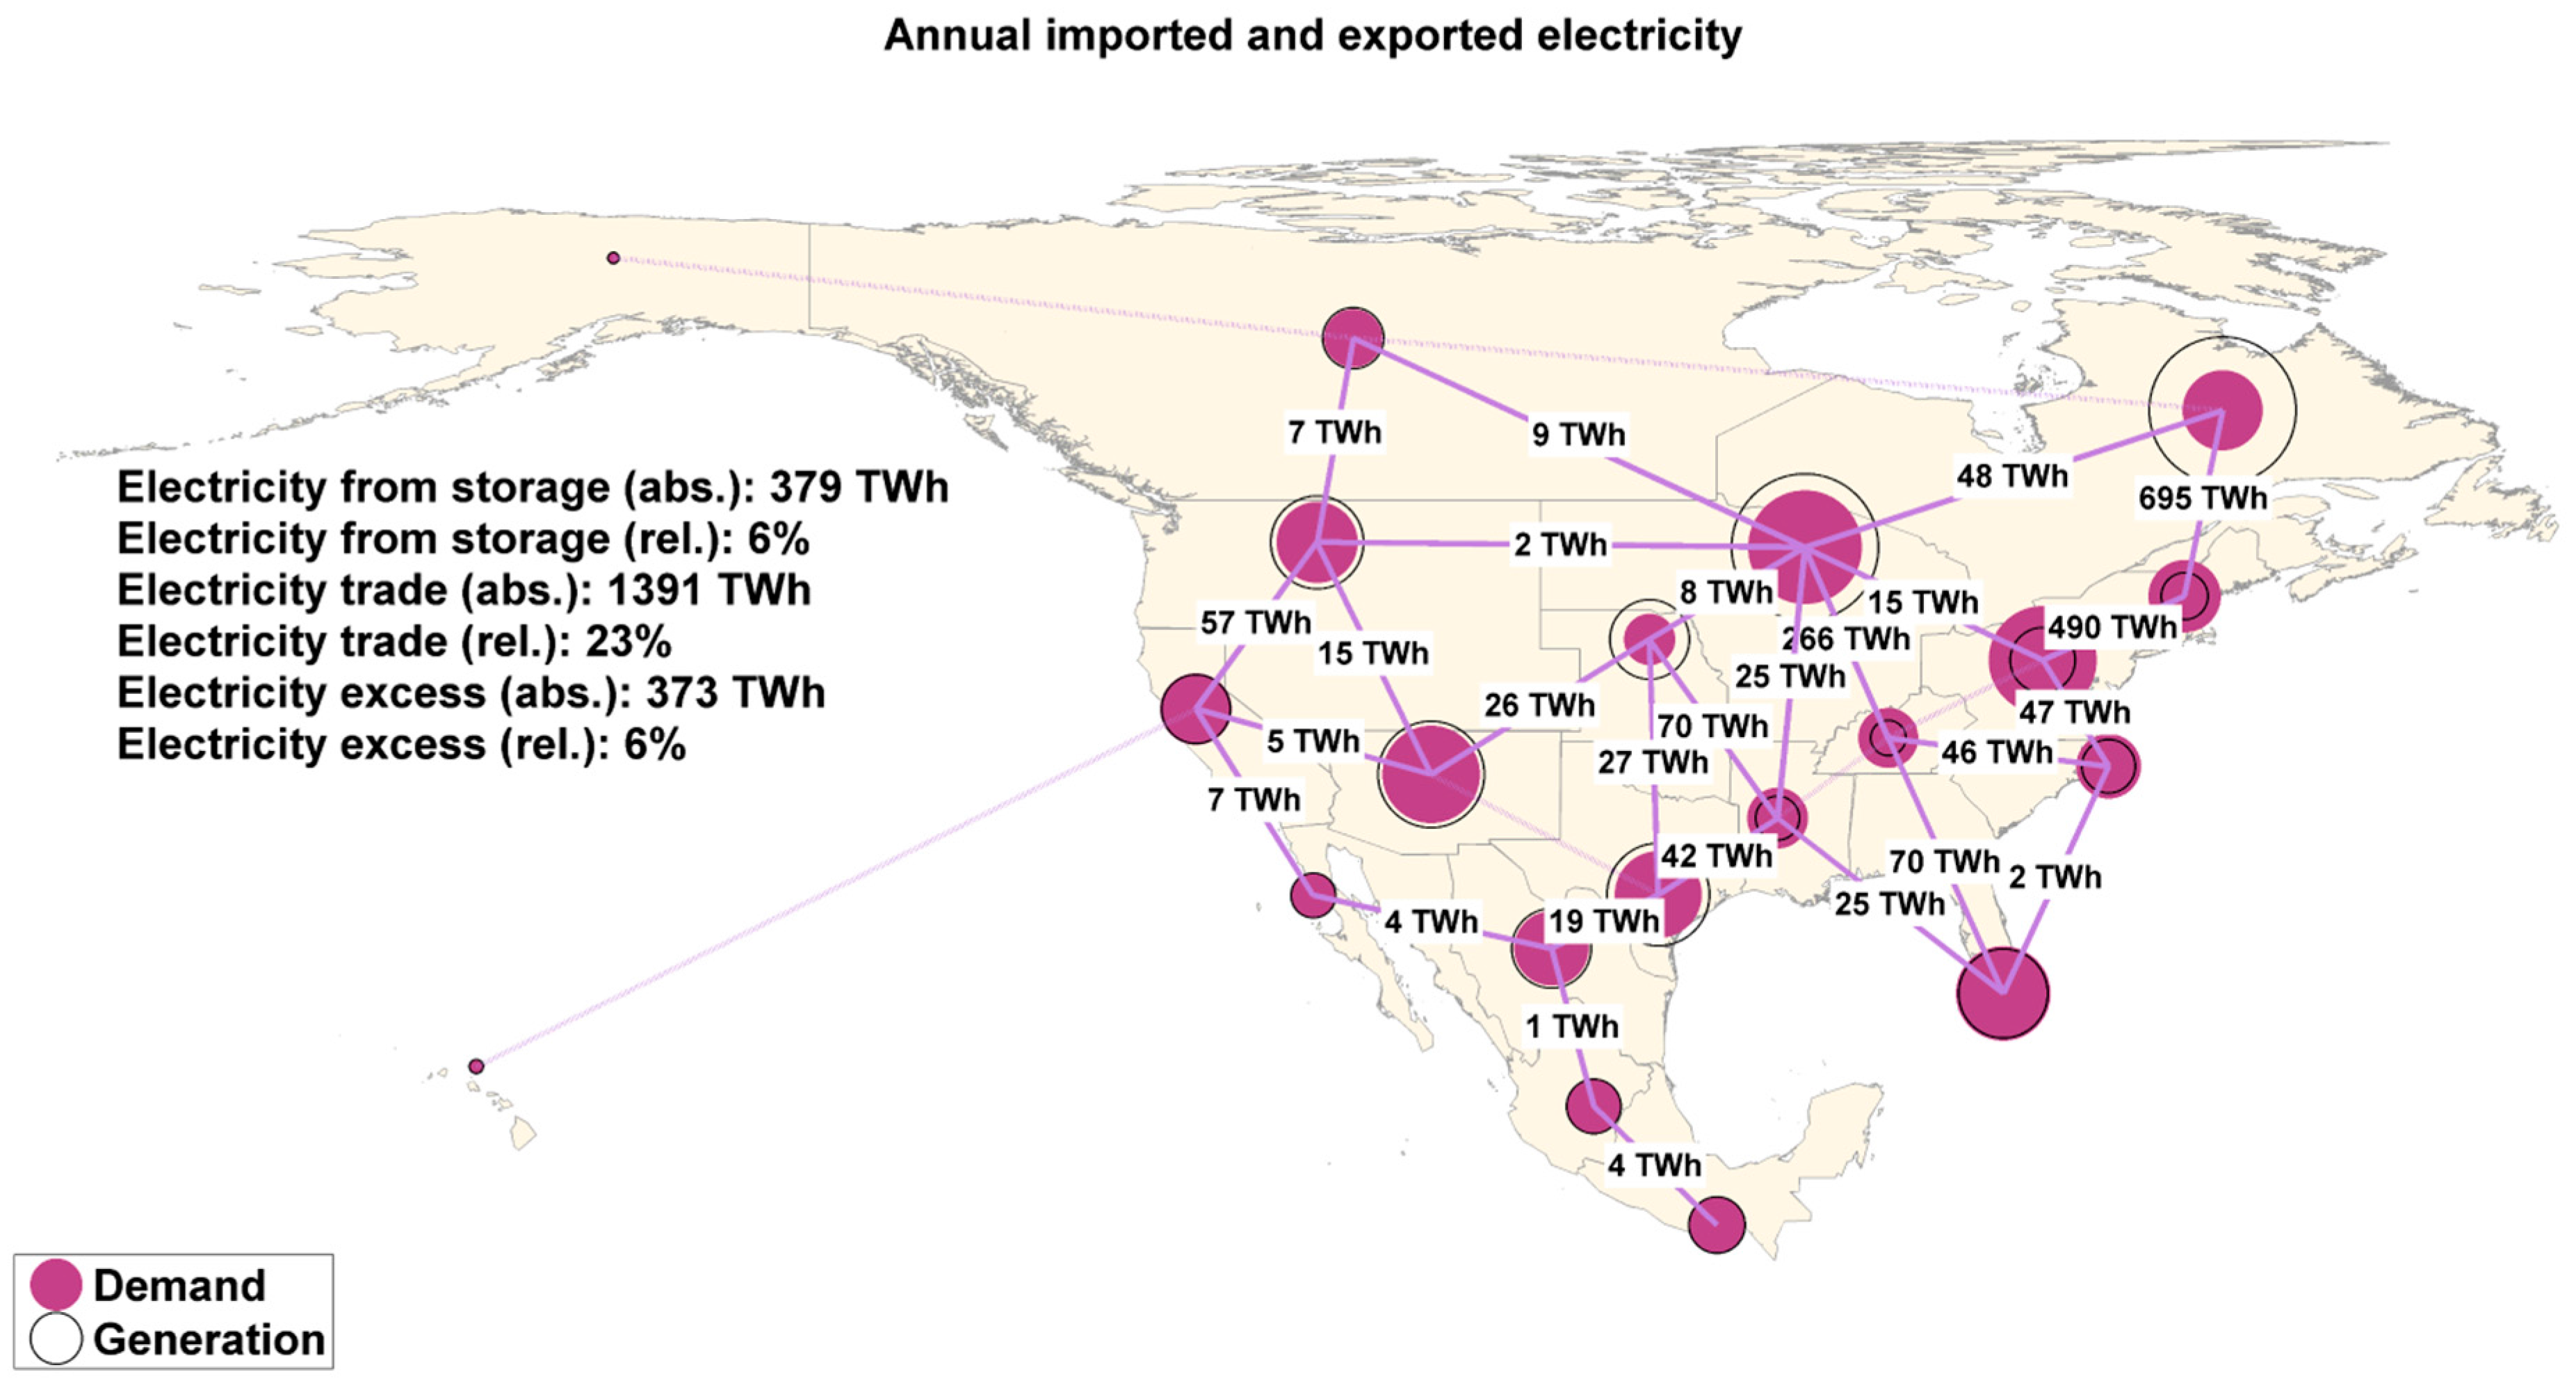
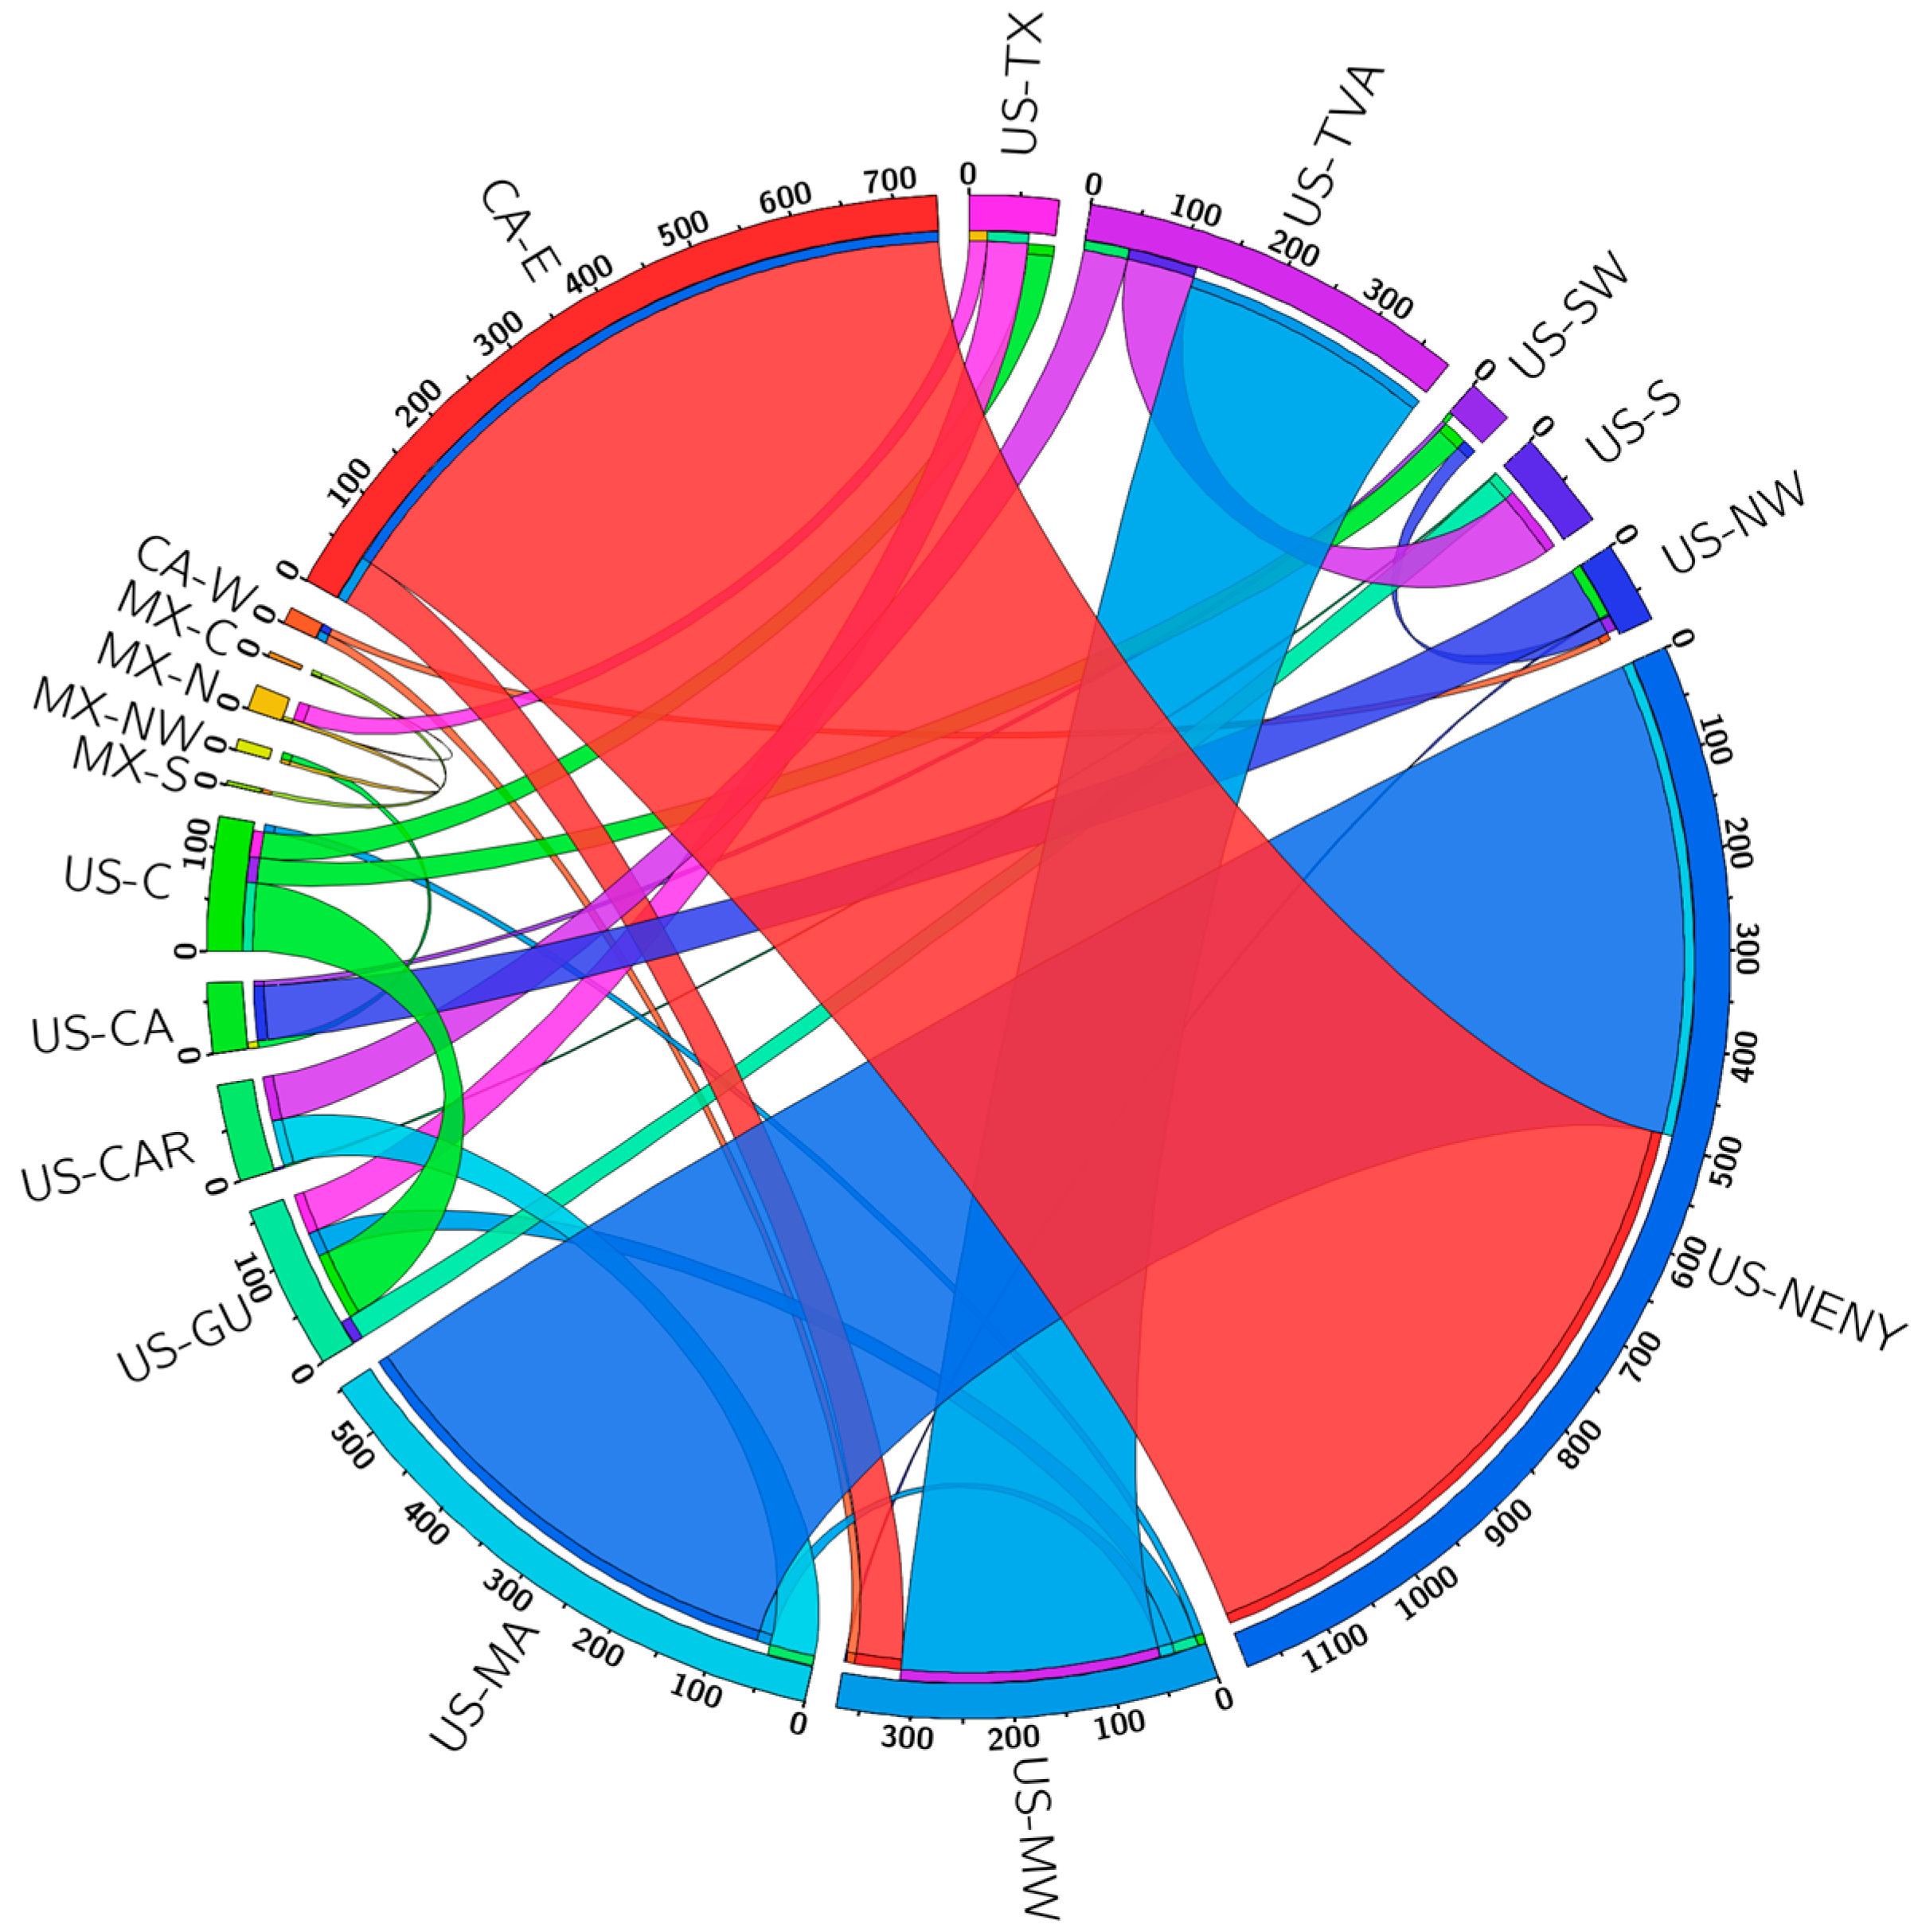
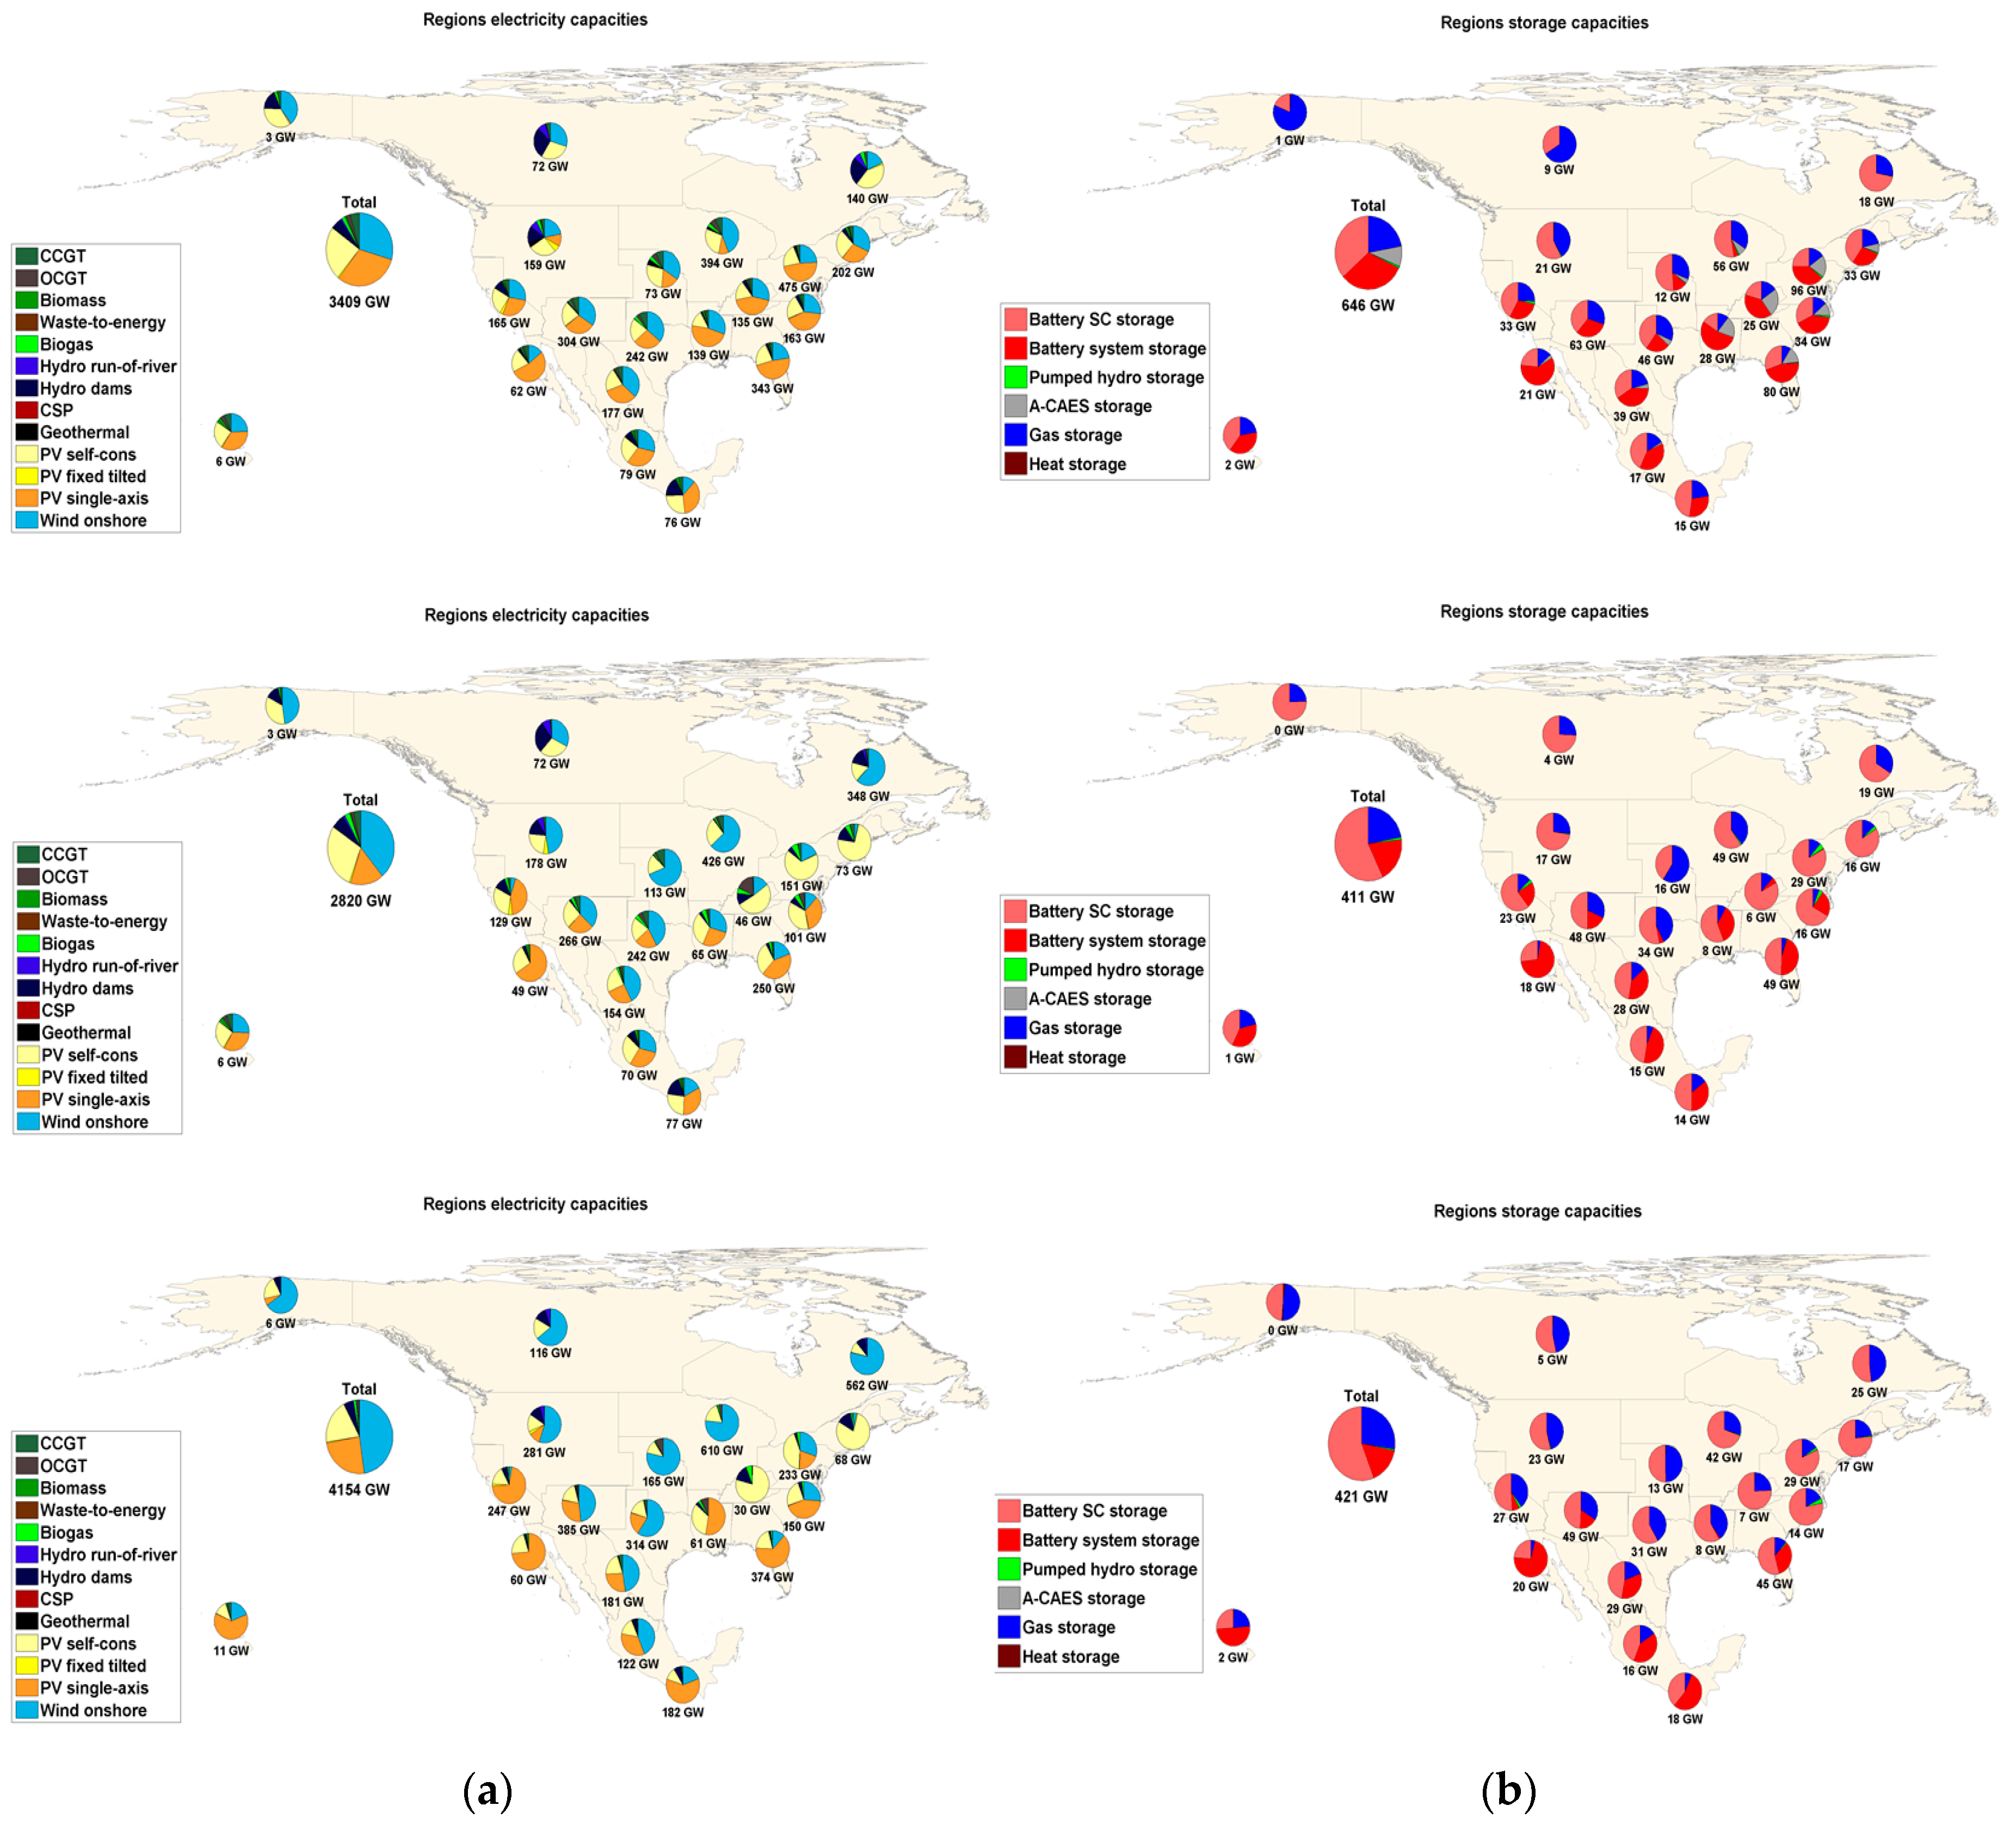
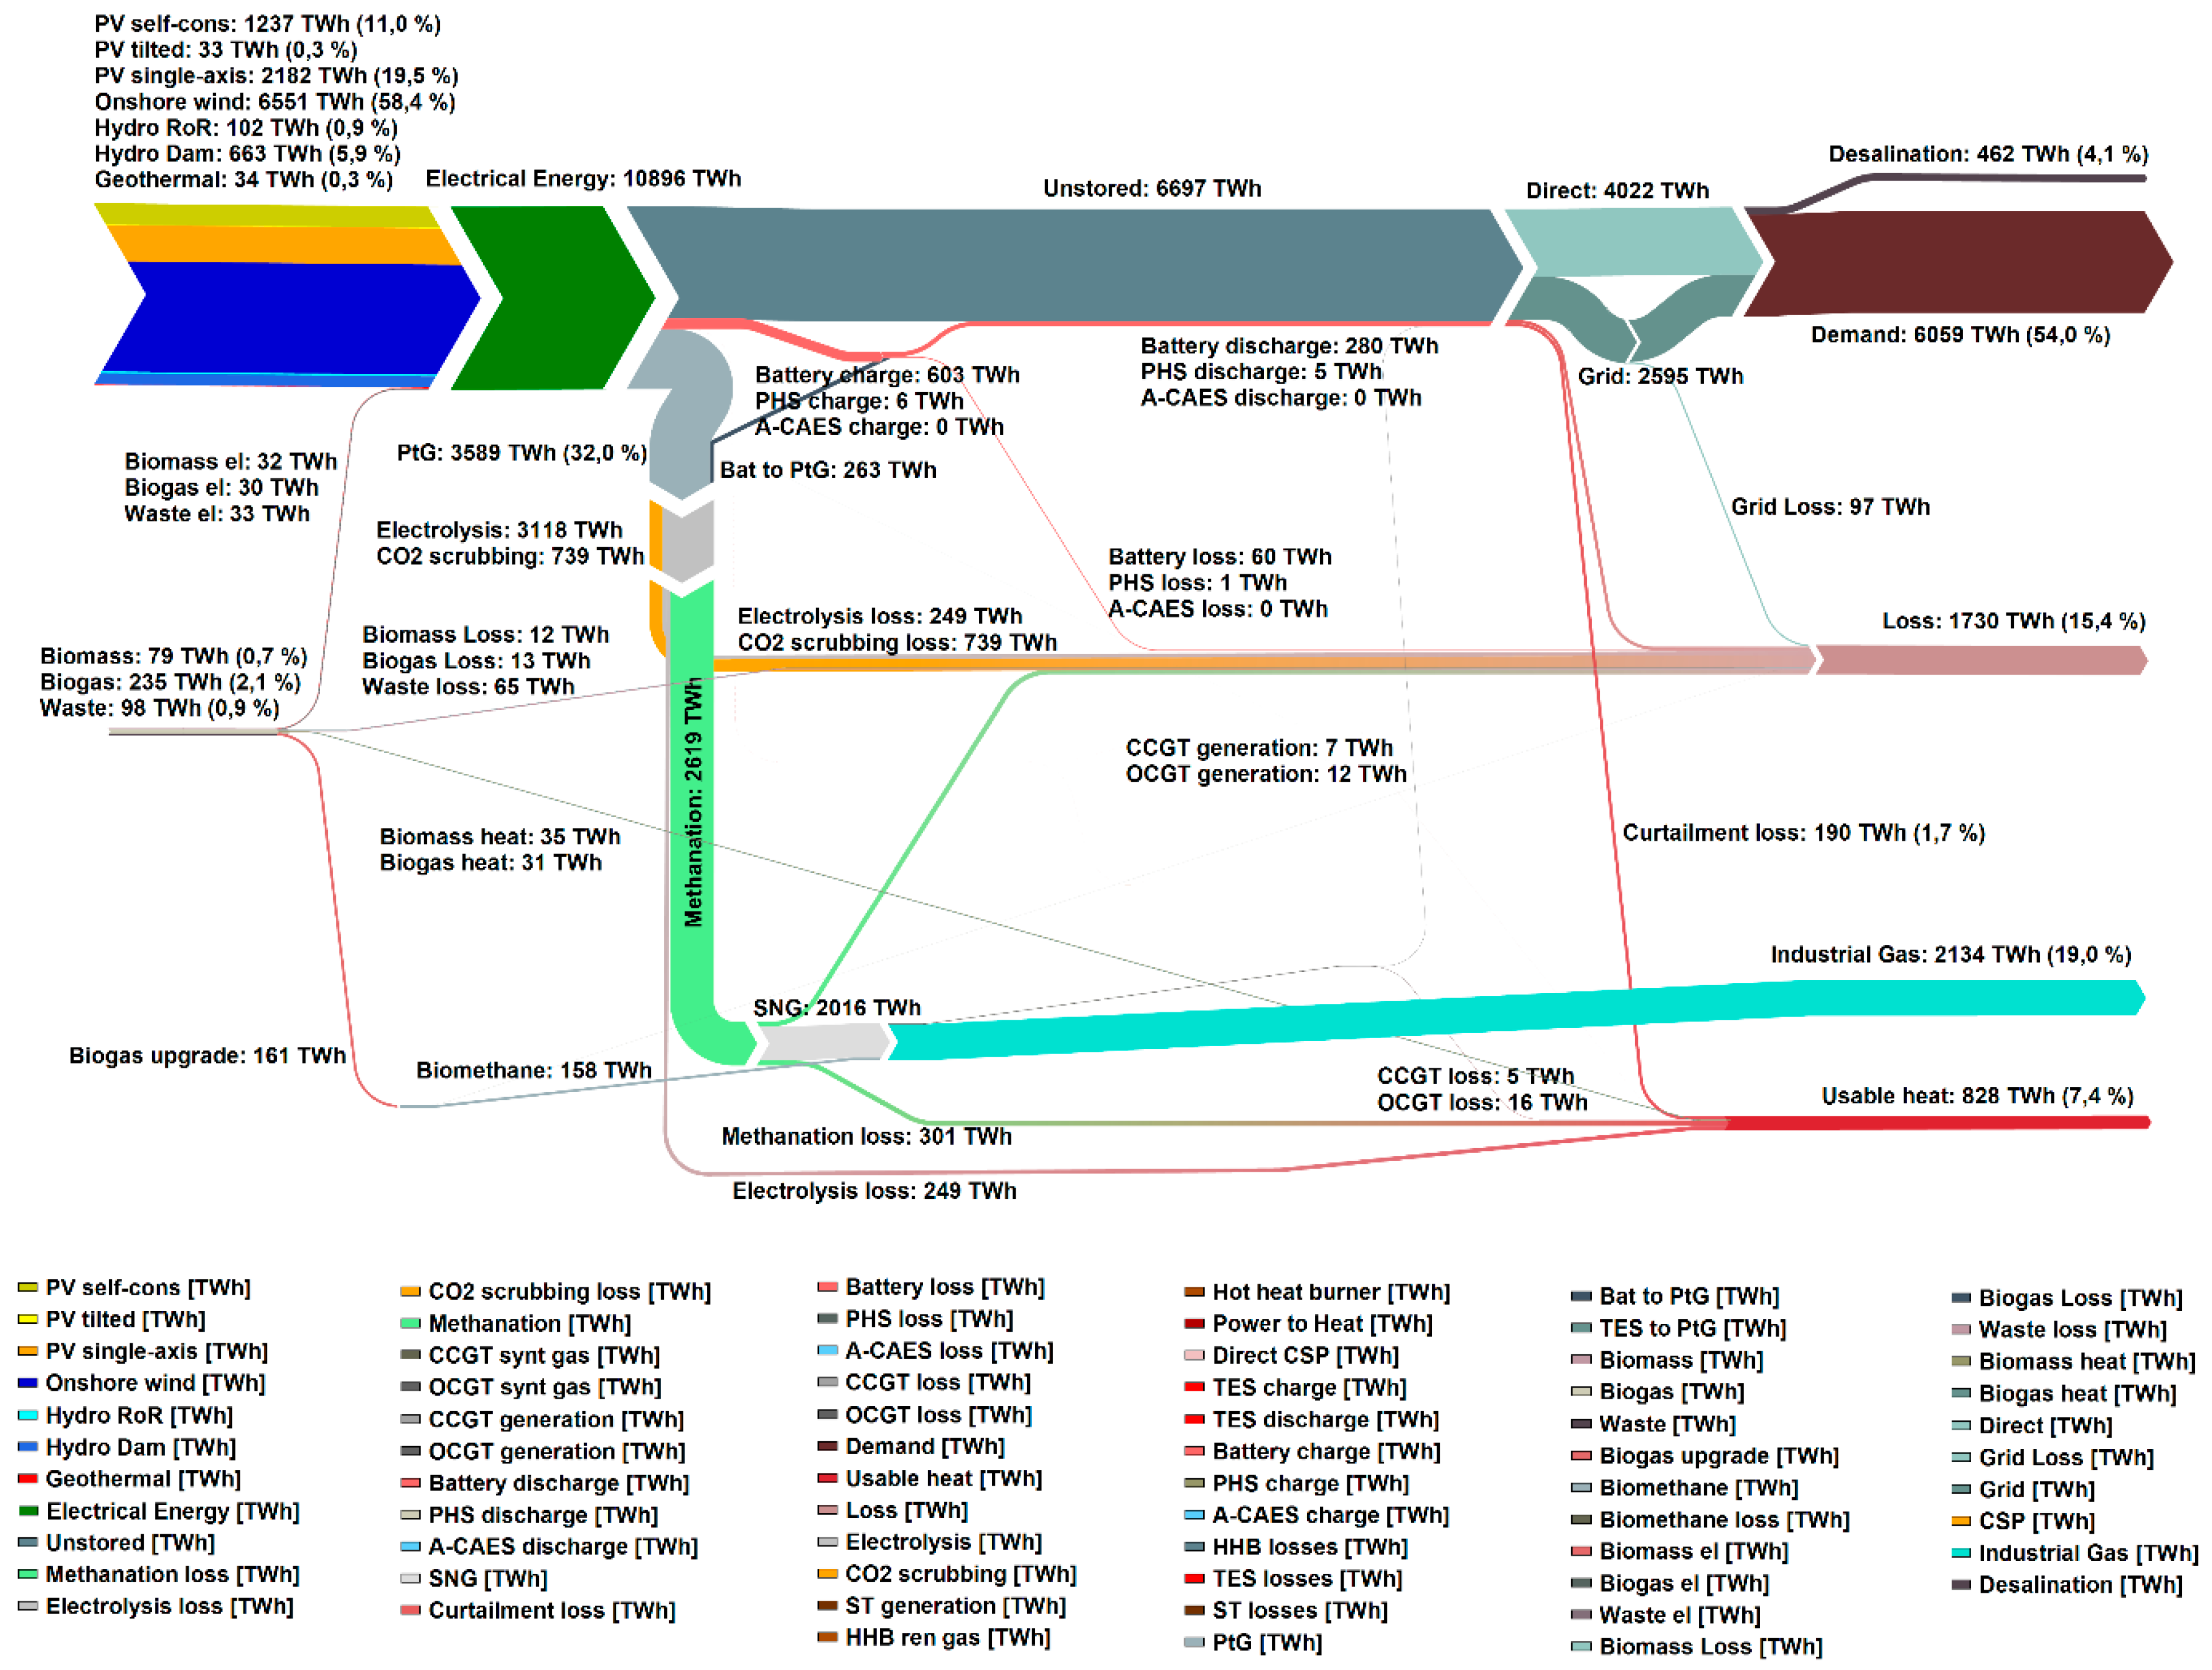
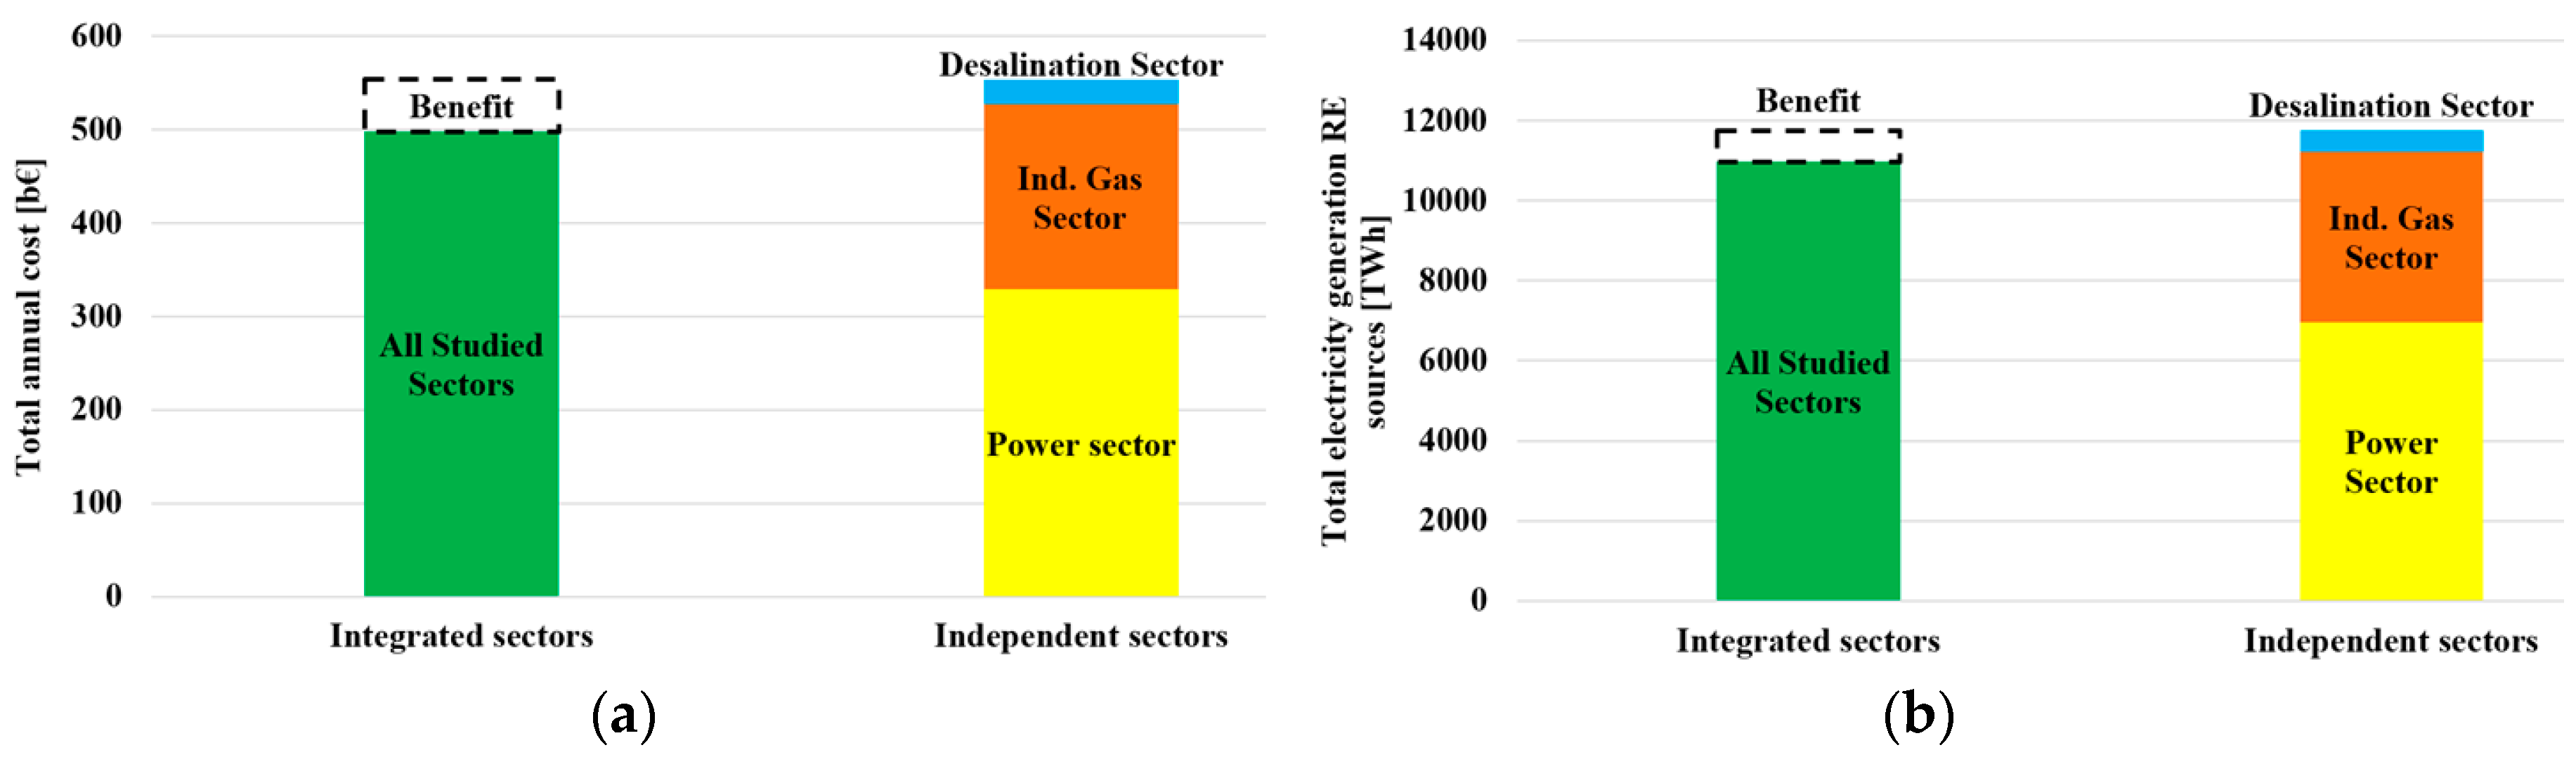
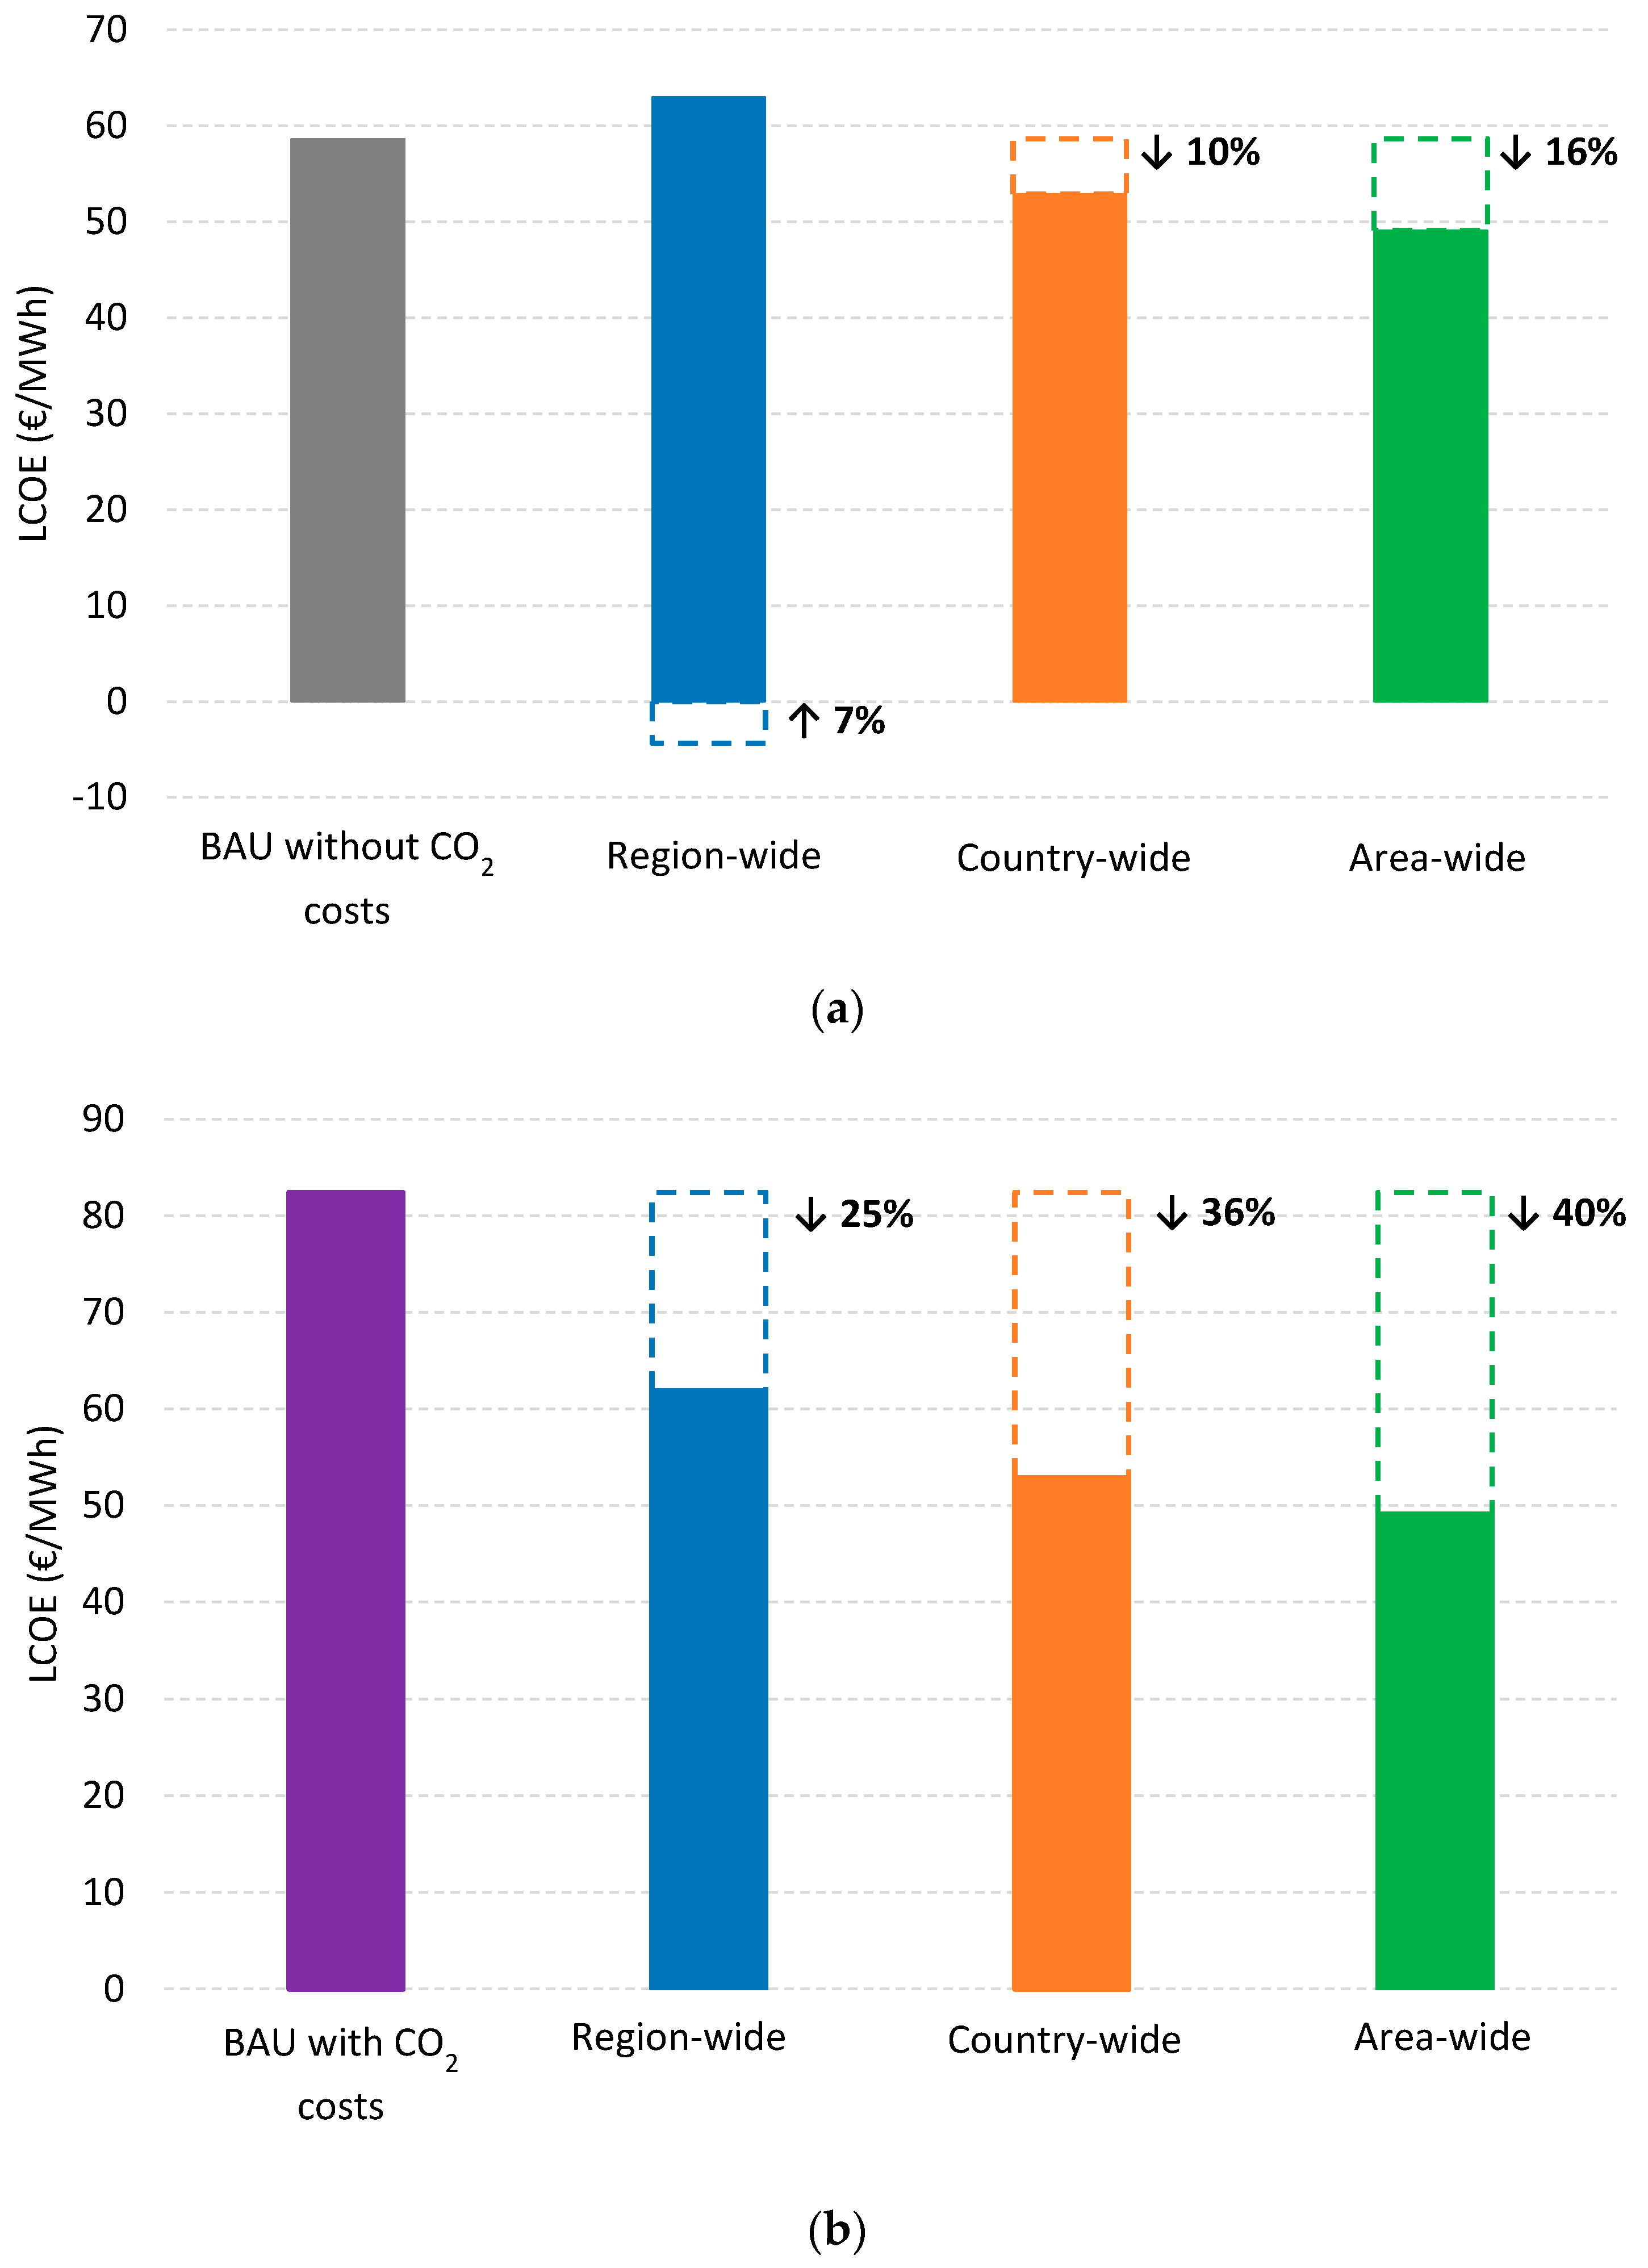
Table 1.
Key financial results for the four analysed scenarios applied for North America.
| Considered Scenarios | Total LCOE [€/MWh] | LCOE Primary [€/MWh] | LCOC [€/MWh] | LCOS [€/MWh] | LCOT [€/MWh] | Total Ann. Cost [b€] | Total CAPEX [b€] | RE Capacities [GW] | Generated Electricity [TWh] |
|---|---|---|---|---|---|---|---|---|---|
| Region-wide | 63 | 37 | 3 | 23 | 0 | 388 | 3502 | 3354 | 7207 |
| Country-wide | 56 | 36 | 2 | 15 | 3 | 341 | 3114 | 2941 | 7062 |
| Area-wide | 53 | 35 | 2 | 12 | 4 | 321 | 2945 | 2760 | 6861 |
| Integrated scenario | 42 | 33 | 1 | 5 | 3 | 498 | 4668 | 4152 | 10,975 |
Table 2.
Results on the installed RE technologies and energy storage capacities for the four defined scenarios.
Table 2.
Results on the installed RE technologies and energy storage capacities for the four defined scenarios.
| Technology | Unit | Region-Wide Scenario | Country-Wide Scenario | Area-Wide Scenario | Integrated Scenario |
|---|---|---|---|---|---|
| PV self-consumption | [GW] | 812 | 812 | 812 | 812 |
| PV optimally tilted | [GW] | 21 | 21 | 21 | 20 |
| PV single-axis tracking | [GW] | 1062 | 566 | 454 | 1018 |
| PV total | [GW] | 1895 | 1399 | 1286 | 1850 |
| CSP | [GW] | 0 | 0 | 0 | 0 |
| Wind energy | [GW] | 1005 | 1134 | 1097 | 1980 |
| Biomass power plants | [GW] | 22 | 14 | 8 | 4 |
| MSW incinerator | [GW] | 4 | 4 | 4 | 4 |
| Biogas power plants | [GW] | 52 | 68 | 68 | 46 |
| Geothermal power | [GW] | 19 | 5 | 5 | 5 |
| Hydro Run-of-River | [GW] | 29 | 29 | 29 | 26 |
| Hydro dams | [GW] | 158 | 168 | 178 | 178 |
| Battery PV self-consumption | [GWh] | 1411 | 1411 | 1411 | 1411 |
| Battery System | [GWh] | 1234 | 593 | 483 | 402 |
| Battery total | [GWh] | 2645 | 2004 | 1894 | 1813 |
| PHS | [GWh] | 35 | 35 | 35 | 25 |
| A-CAES | [GWh] | 5822 | 186 | 1 | 5 |
| Heat storage | [GWh] | 0 | 1 | 0 | 2 |
| PtG electrolysers | [GWel] | 114 | 84 | 54 | 442 |
| CCGT | [GW] | 159 | 133 | 103 | 9 |
| OCGT | [GW] | 65 | 77 | 42 | 55 |
| Steam Turbine | [GW] | 0 | 0 | 0 | 0 |
Table 3.
Total installed electricity capacities for the BAU scenario in 2030, taken from WEO [85] and Energy [R]evolution scenario [86], and the cost of all technologies assumed as presented in this study. The cost of solar PV is based on weighted average of all considered technologies and installed capacities in the country-wide scenario.
| Technology | Installed Capacity [GW] | Capex [€/kW] | Opex [€/kW] | LCOE [€/MWh] |
|---|---|---|---|---|
| Solar PV | 70 | 731 | 11 | 47 |
| CSP | 9 | 327 | 8 | 11 |
| Wind energy | 144 | 1000 | 20 | 38 |
| Biomass power plants | 31 | 2500 | 175 | 70 |
| Geothermal power | 7 | 4470 | 80 | 59 |
| Hydro Run-of-River | 41 | 2560 | 105 | 82 |
| Hydro dams | 176 | 1650 | 66 | 52 |
| Gas-fired power plants | 625 | 675 | 18 | 86 |
| Oil power plants | 30 | 500 | 10 | 491 |
| Diesel-fired power plants | 10 | 310 | 6 | 187 |
| Coal power plants | 349 | 1500 | 20 | 23 |
| Nuclear power plants | 123 | 5000 | 200 | 81 |
© 2017 by the authors. Licensee MDPI, Basel, Switzerland. This article is an open access article distributed under the terms and conditions of the Creative Commons Attribution (CC BY) license (http://creativecommons.org/licenses/by/4.0/).
Share and Cite
MDPI and ACS Style
Aghahosseini, A.; Bogdanov, D.; Breyer, C. A Techno-Economic Study of an Entirely Renewable Energy-Based Power Supply for North America for 2030 Conditions. Energies 2017, 10, 1171. https://doi.org/10.3390/en10081171
AMA Style
Aghahosseini A, Bogdanov D, Breyer C. A Techno-Economic Study of an Entirely Renewable Energy-Based Power Supply for North America for 2030 Conditions. Energies. 2017; 10(8):1171. https://doi.org/10.3390/en10081171
Chicago/Turabian StyleAghahosseini, Arman, Dmitrii Bogdanov, and Christian Breyer. 2017. "A Techno-Economic Study of an Entirely Renewable Energy-Based Power Supply for North America for 2030 Conditions" Energies 10, no. 8: 1171. https://doi.org/10.3390/en10081171
Note that from the first issue of 2016, this journal uses article numbers instead of page numbers. See further details here.