Optimal Planning of Charging for Plug-In Electric Vehicles Focusing on Users’ Benefits

1
National Active Distribution Network Technology Research Center, Beijing Jiaotong University, Beijing 100044, China
2
Department of Electrical and Computer Engineering, University of Denver, Denver, CO 80210, USA
*
Author to whom correspondence should be addressed.
Energies 2017, 10(7), 952; https://doi.org/10.3390/en10070952
Submission received: 15 June 2017
/
Revised: 2 July 2017
/
Accepted: 3 July 2017
/
Published: 9 July 2017
(This article belongs to the Special Issue Energy Management, Control, and System Architectures for Electric Vehicle Applications)
Abstract
:Many electric vehicles’ (EVs) charging strategies were proposed to optimize the operations of the power grid, while few focus on users’ benefits from the viewpoint of EV users. However, low participation is always a problem of those strategies since EV users also need a charging strategy to serve their needs and interests. This paper proposes a method focusing on EV users’ benefits that reduce the cost of battery capacity degradation, electricity cost, and waiting time for different situations. A cost model of battery capacity degradation under different state of charge (SOC) ranges is developed based on experimental data to estimate the cost of battery degradation. The simulation results show that the appropriate planning of the SOC range reduces 80% of the cost of battery degradation, and the queuing theory also reduces over 60% of the waiting time in the busy situations. Those works can also become a premise of charging management to increase the participation. The proposed strategy focusing on EV users’ benefits would not give negative impacts on the power grid, and the grid load is also optimized by an artificial fish swarm algorithm (AFSA) in the solution space of the charging time restricted by EV users’ benefits.
1. Introduction
The penetration and the market scale of electric vehicles (EVs) have been increasing for the last couple of years. Electric vehicles will hopefully substitute conventional fossil fuel vehicles to alleviate environmental pollution due to carbon emission reduction [1].
It is commonly accepted that large-scale EV integration can cause a technical challenge for grid stability [2,3,4,5]. Numerous studies have been performed toward controlling EVs’ charging behaviors in various ways to mitigate the negative impacts on the power grid [6,7]. A centralized charging strategy with an aggregated EV charging model was developed to flatten the daily load curve in [8,9], developing an energy management system to perform peak-load shifting by utilizing EVs, used EV batteries, and photovoltaicpanels. A new coil design set with a special arrangement which is effective for dynamic charging of EVs has been proposed to maintain a nearly uniform coupling factor and negligible power transfer fluctuation in [10]. A method which manages the EVs’ charging demand for minimizing the distribution network line loss was proposed in [11]. In order to incentivize EV users to participate in charging management strategies, many charging strategies with pricing mechanisms for electricity to shift EV charging times have been proposed [12,13]. References [14,15,16] put forward a transactive control method which applies market mechanisms to engage self-interested responsive loads to flatten the daily load curve in the power grid. However, these methods can be an obstacle to the EVs’ promotion because the high charging cost would make the cheap refuel cost no more an advantage of EVs. Some put forward strategies to coordinate EV charging demand and grid operation through decreasing the charging costs and resolving the overloading of transformers [17]. A dynamic environmental dispatch model, which coordinates EVs with wind farms and thermal plants to reduce the system operating costs, CO2 emission, and EV users’ cost is proposed in [18]. The decrease in queue time is also treated as a benefit, especially for motivating EV users in specific situations, such as shopping areas and highways [17,18,19]. Nevertheless, few of those took the cost of battery capacity degradation into account, although such a cost is a non-negligible part of EVs’ total operating costs. The battery is one of the most important parts of the EV and the price of the battery is almost half of the EV price. The batteries’ useful life is greatly affected by different methods of charging and discharging. Many experiments and studies have been performed focusing on the Li-ion battery, but these achievements were not applied in the field of charging management. A battery capacity fading model, which can simulate the battery degradation dynamics in various operating conditions was developed in [20]. The authors of [21] proposed a novel fusion prognostic model, in which the time series prediction model is adopted, and implemented a particle filter algorithm for predicting Li-ion battery life. The CALCE (Center for Advanced Life Cycle Engineering) Battery Group from the University of Maryland quantified the effect of partial cycling on lithium-ion battery capacity fade by means of cycling tests operating on graphite/LiCoO2 pouch cells under diverse state of charge (SOC) ranges, and then developed a model of the battery capacity degradation under partial cycling conditions [22]. Plenty of research efforts have been devoted to study the contributing factors to battery capacity fade. The value of used batteries, which is an important factor to derive the cost of battery capacity degradation, is analyzed in [23,24]. Since the operating SOC range is the most controllable factor, it should be incorporated in the charging planning for reducing EV users’ total operating costs. Furthermore, EV users are likely to pay more attention to the waiting time compared to the operating costs in the aforementioned specific situations [17,19,25,26]. An intention-aware routing system was developed to calculate a routing policy that minimizes their expected journey time in [27]. A planning method based on the queuing theory was proposed to determine the capacity of each EV charging station and minimize the sum of the waiting cost and the charger cost in [28].
This study focuses on EV users’ benefits reducing the total operating costs, including the cost of battery degradation and the electricity cost in regular routes, such as working areas, and reducing the queue time for charging in irregular routes, such as shopping areas. After maximizing EV users’ benefits, the power grid operation is further optimized considering the constraints which occur in the process of maximizing EV users’ benefits. A newly-developed cost model of battery capacity degradation is used to estimate the cost of the battery capacity degradation of individual charging and to determine the operating SOC range in the charging planning, which is the contribution of this paper because the cost model of battery capacity degradation or the cost of battery fade for individual charging with detailed calculation has not been proposed or discussed. The queueing theory is then applied to reduce the waiting time in irregular routes. An artificial fish swarm algorithm is adopted to optimize the grid load. The main contributions of this paper are summarized below: (a) a cost model of battery capacity degradation is developed to estimate the battery costs of charging; (b) the cost of battery capacity fade of charging is significantly reduced by planning the charging SOC range; (c) simulation results prove that the grid load curve can be optimized by scheduling EVs with the constraints which occur in the process of maximizing EV users’ benefits; and (d) the waiting time for getting into charging stations in busy areas is reduced by applying a method of queuing theory which combines different charging stations’ queues into one according to queuing theory.
The remainder of this paper is organized as follows: Section 2 briefly describes the proposed planning method; Section 3 presents the proposed model, algorithm and their formulation process; Case studies in actual situations in a metropolitan area of China with the proposed methodology are performed in Section 4; and, finally, the paper is concluded in Section 5.
2. Methodology Description
EV users drive their cars for many different purposes every day. In this paper, all those various routes are classified into two types, which are regular routes, including trips to working areas, universities, etc. and irregular routes, including trips to shopping malls, hospital, etc. In this way, the different demands and benefits of these two types of trips can be fulfilled by our optimal planning. The overall structure of the optimal planning is shown in Figure 1.
For regular routes, the costs of battery capacity degradation and electricity costs are regarded as the users’ benefits. The cost of battery capacity degradation is calculated by the proposed cost model of battery degradation based on the experiment data, and the electricity cost is calculated by the Time of Use (TOU) tariff for EVs in Beijing. After managing the EVs’ mean SOC, charging SOC range (ΔSOC), and charging time slot to ensure that EV users’ can achieve their lowest costs, the grid load curve is then optimized by an artificial fish swarm algorithm in the time horizon restricted by the EV users’ benefits. For irregular routes, the waiting time and costs of battery degradation are considered as main benefits of EV users since the destinations are usually busy areas, such as shopping malls. To reduce users’ waiting times for charging, queuing theory is adopted. Similarly, a cost model of battery degradation is applied to manage the EVs’ SOC range to reduce the costs of battery degradation. Meanwhile, limiting the amount of charging electricity also contributes to reducing the waiting time.
3. Problem Formulation and Transformation
3.1. Cost Model of Battery Capacity Fade
The battery is one of the most important parts of an electric vehicle. The price of an EV’s battery is nearly half of the price of an EV. However, the battery’s useful life is limited. It is no longer competent to run a vehicle when the capacity has faded to 80% of the initial battery capacity [29]. Therefore, estimating the cost of battery capacity degradation is necessary, and then we can obtain the actual total operating cost of EVs instead of considering the electricity cost only. In this section, the battery capacity degradation affected by different charging behaviors (especially different SOC ranges) is analyzed and a cost model of battery capacity fade is developed.
3.1.1. Battery Capacity Degradation Analysis
Battery capacity fading mechanism is extremely complex and affected by many factors [30]. In this part, we only discuss the effect of different SOC ranges, which is the most controllable contributing factor to battery capacity degradation for EV users.
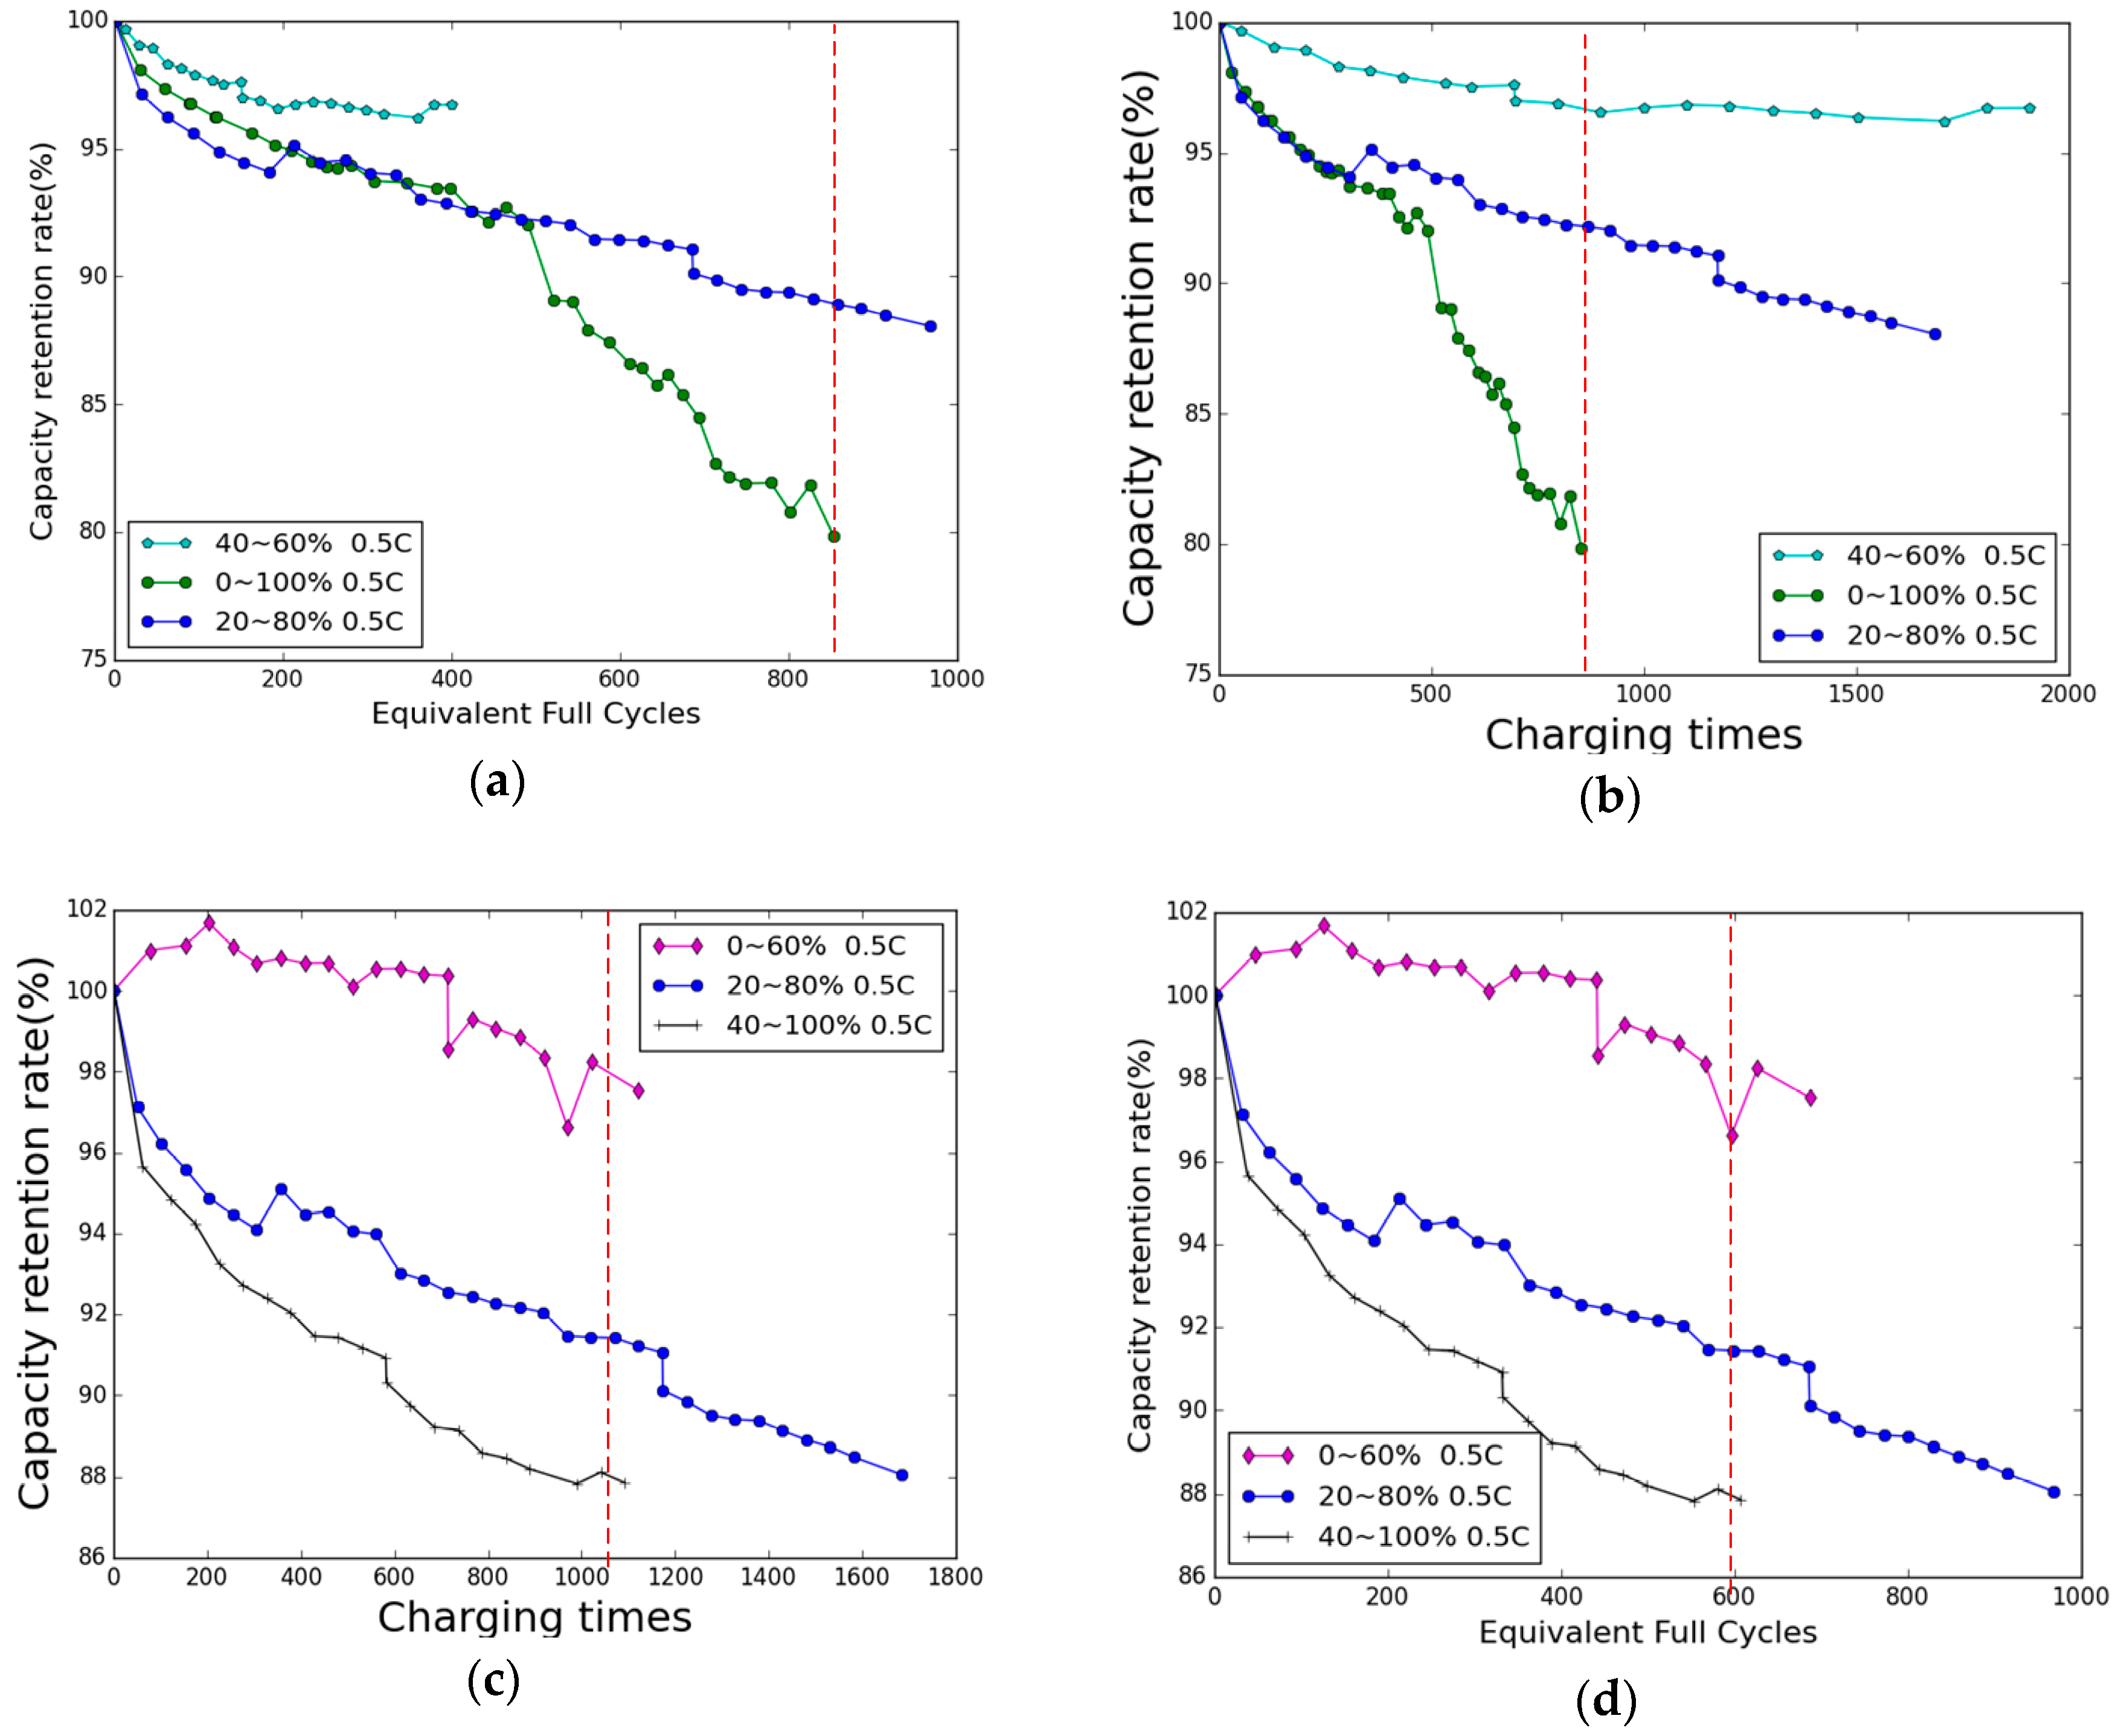
The experimental data of partial charge-discharge cycling on Li-ion battery capacity degradation by means of cycling tests conducted on graphite/LiCoO2 pouch cells under different SOC ranges and charge/discharge currents, which is experimentalized and collected by the CALCE battery group at the University of Maryland [31], is adopted in our research. We only focus on the data collected when the batteries are cycled at a current rate of 0.5 C corresponding to level 1 charging. The capacity degradation results for different SOC ranges are shown in Figure 2.
The capacity retention rate indicates the battery degradation. The equivalent full cycles have been used for assessing the cycle life performance of the cells. The number of equivalent full cycles is defined as the number of times that the cumulative charge or discharge energy of battery cycling in a specific SOC range equals to a full cycle energy. For instance, if a battery cycles at the SOC range of 40–60% for five times, these five cycles can be regarded as one equivalent full cycle since the cumulative charge or discharge energy equals to a full cycle energy. It is a unified standard widely used in battery studies, and the actual cycle life performance of the battery cells can be assessed in this way. It is important to note that there is no data missing, although the 40–60% curve in Figure 2a is shorter than the others. The reason is that cells cycling at 40–60% SOC need more time for one equivalent cycle since there is a rest period of at least 30 min after every charge and discharge step. However, the existing data is enough to reveal the capacity fading trend. For EV users, they care more about the battery capacity degradation of individual charging. Thus, the cost model of battery capacity degradation should be built with the number of charging times, as well. The equivalent full cycles (EFC) can be transferred to charging times by Equation (1):
where ΔSOC denotes the difference between the max and the minimum SOC of the operating SOC range as mentioned above. Then we can obtain the capacity retention rate versus charging times, which is shown in Figure 2b.
Charging times = EFC/ΔSOC
3.1.2. Cost of Battery Capacity Degradation Modeling
To estimate the varying costs of battery capacity degradation due to different operating SOC ranges in the overall operating costs, a cost model of battery degradation is necessary. A power law model of capacity loss for batteries under partial or full cycling conditions using the results of the same dataset mentioned before is developed by the curve fitting of MATLAB (The MathWorks, Inc., Natick, MA, USA) in [22]. The mean SOC, ΔSOC, and EFC are three independent variables of the model, and the capacity retention rate (CRR) is the dependent variable. The model is presented in Equation (2) [22]:
where SOCmean denotes the mean SOC of the operating SOC range, and ΔSOC means the difference between the maximum and the minimum SOC of the operating SOC range. The number of EFC can be easily derived by this model:
It is important to note that batteries are no longer competent for EVs when the capacity fades to 80% of the original capacity, so a battery’s useful life is from 100% to 80% of the original capacity. The battery cost can be measured by this degradation range. Given that used battery can be sold and reused, the cost of each percent degradation can be calculated by Equation (4):
where denotes a one percent capacity degradation cost of batteries, denotes the battery capacity, denotes the price of new battery, and denotes the price of used battery. The battery resale price model in [23] is adopted in this paper and is given by:
where is the lifetime of EV battery, is the annual depreciation rate in percentage and is set as 20%, and DR is discount rate which is set as 6%. In this case, the battery cost of individual charging can be calculated in Equation (6):
where denotes the battery cost of every time charging, denotes the number of charging times that an EV ever got through, and (100 − CRR) denotes the percentage of capacity degradation. Then the cost model of battery degradation, which reflects the cost of battery capacity degradation of one time charging for a certain SOC range, can be achieved by combining Equations (1), (3), (4), and (6):
It is necessary to mention that the result of this cost model is a rough value. Since the battery capacity fading mechanism is an extremely complex chemical process, we cannot achieve an accurate result with existing technologies. However, this model is sufficient to help EV users evaluate and reduce the cost of battery capacity degradation in the overall operating cost.
For the purpose of reducing costs of battery capacity degradation, the mean SOC and ΔSOC should be managed beforehand according to the cost model above. Generally, the mean SOC and ΔSOC should be arranged as small as possible to achieve a low cost of battery degradation according to the cost model.
3.2. Electricity Cost
For the EV users, the electricity cost of charging is the main cost, conventionally. In order to evaluate the total charging cost, the electricity cost must be taken into account. Most places around the world adopt peak-valley time of use (TOU) price. Then the electricity cost of charging can be calculated by Equations (8)–(10):
where is the electricity to charge, is the SOC range to charge, indicates the charging power, denotes the charging cost of electricity, denotes the TOU price at charging time t, and denotes the duration of charging.
In this paper, we adopt the Beijing peak-valley TOU charging price as an example for simulation results. The details are shown in Figure 3 and Equation (11):
After setting the SOC range for charging, the optimal charging start time and charging duration should be found to achieve the lowest electricity costs restricted by the EVs’ arrival time and departure time.
3.3. Grid Load Curve Optimization
Now that the users’ benefits have been maximized, the load demand on grid should be considered. The artificial fish swarm algorithm (AFSA) is applied to optimize the distribution network load curve in the restricted SOC range and charging time scope. The objective function and constraints are shown in Equations (12) and (13):
where is charging start time of an EV, denotes an EV’s arrival time, and indicates the departure time. The first two constraints restrict the charging time horizon, and the third constraint is to ensure that EVs always keep the SOC over 10% for unpredictable situations. The flowchart of AFSA is shown in Figure 4 and the following are the procedures:
- Step 1.
- Initialize the parameters visual distance, step length, population size, crowded degree, and iteration times. The visual distance and step values will decrease as the number of iterations increases. A group of artificial fish M is generated randomly in the water, and the information contained in each fish is a charging start time matrix U of all EVs. Each artificial fish here represents a charging start time scheme for all EVs.
- Step 2.
- Calculate the food concentration of each fish’s position, record the best result on the bulletin board. The food concentration (i.e., the variance of distribution network) load is calculated based on the objective function.
- Step 3.
- Artificial fishes move one step by performing one of the four kinds of behavior, which are cluster behavior, following behavior, foraging behavior, and random behavior, according to their situation.
- Step 4.
- Calculate the food concentration of each fish’s new position. Record the best result to the bulletin board if it is better than the old one.
- Step 5.
- If the ending condition is met, finish the algorithm. If not, go to step 3.
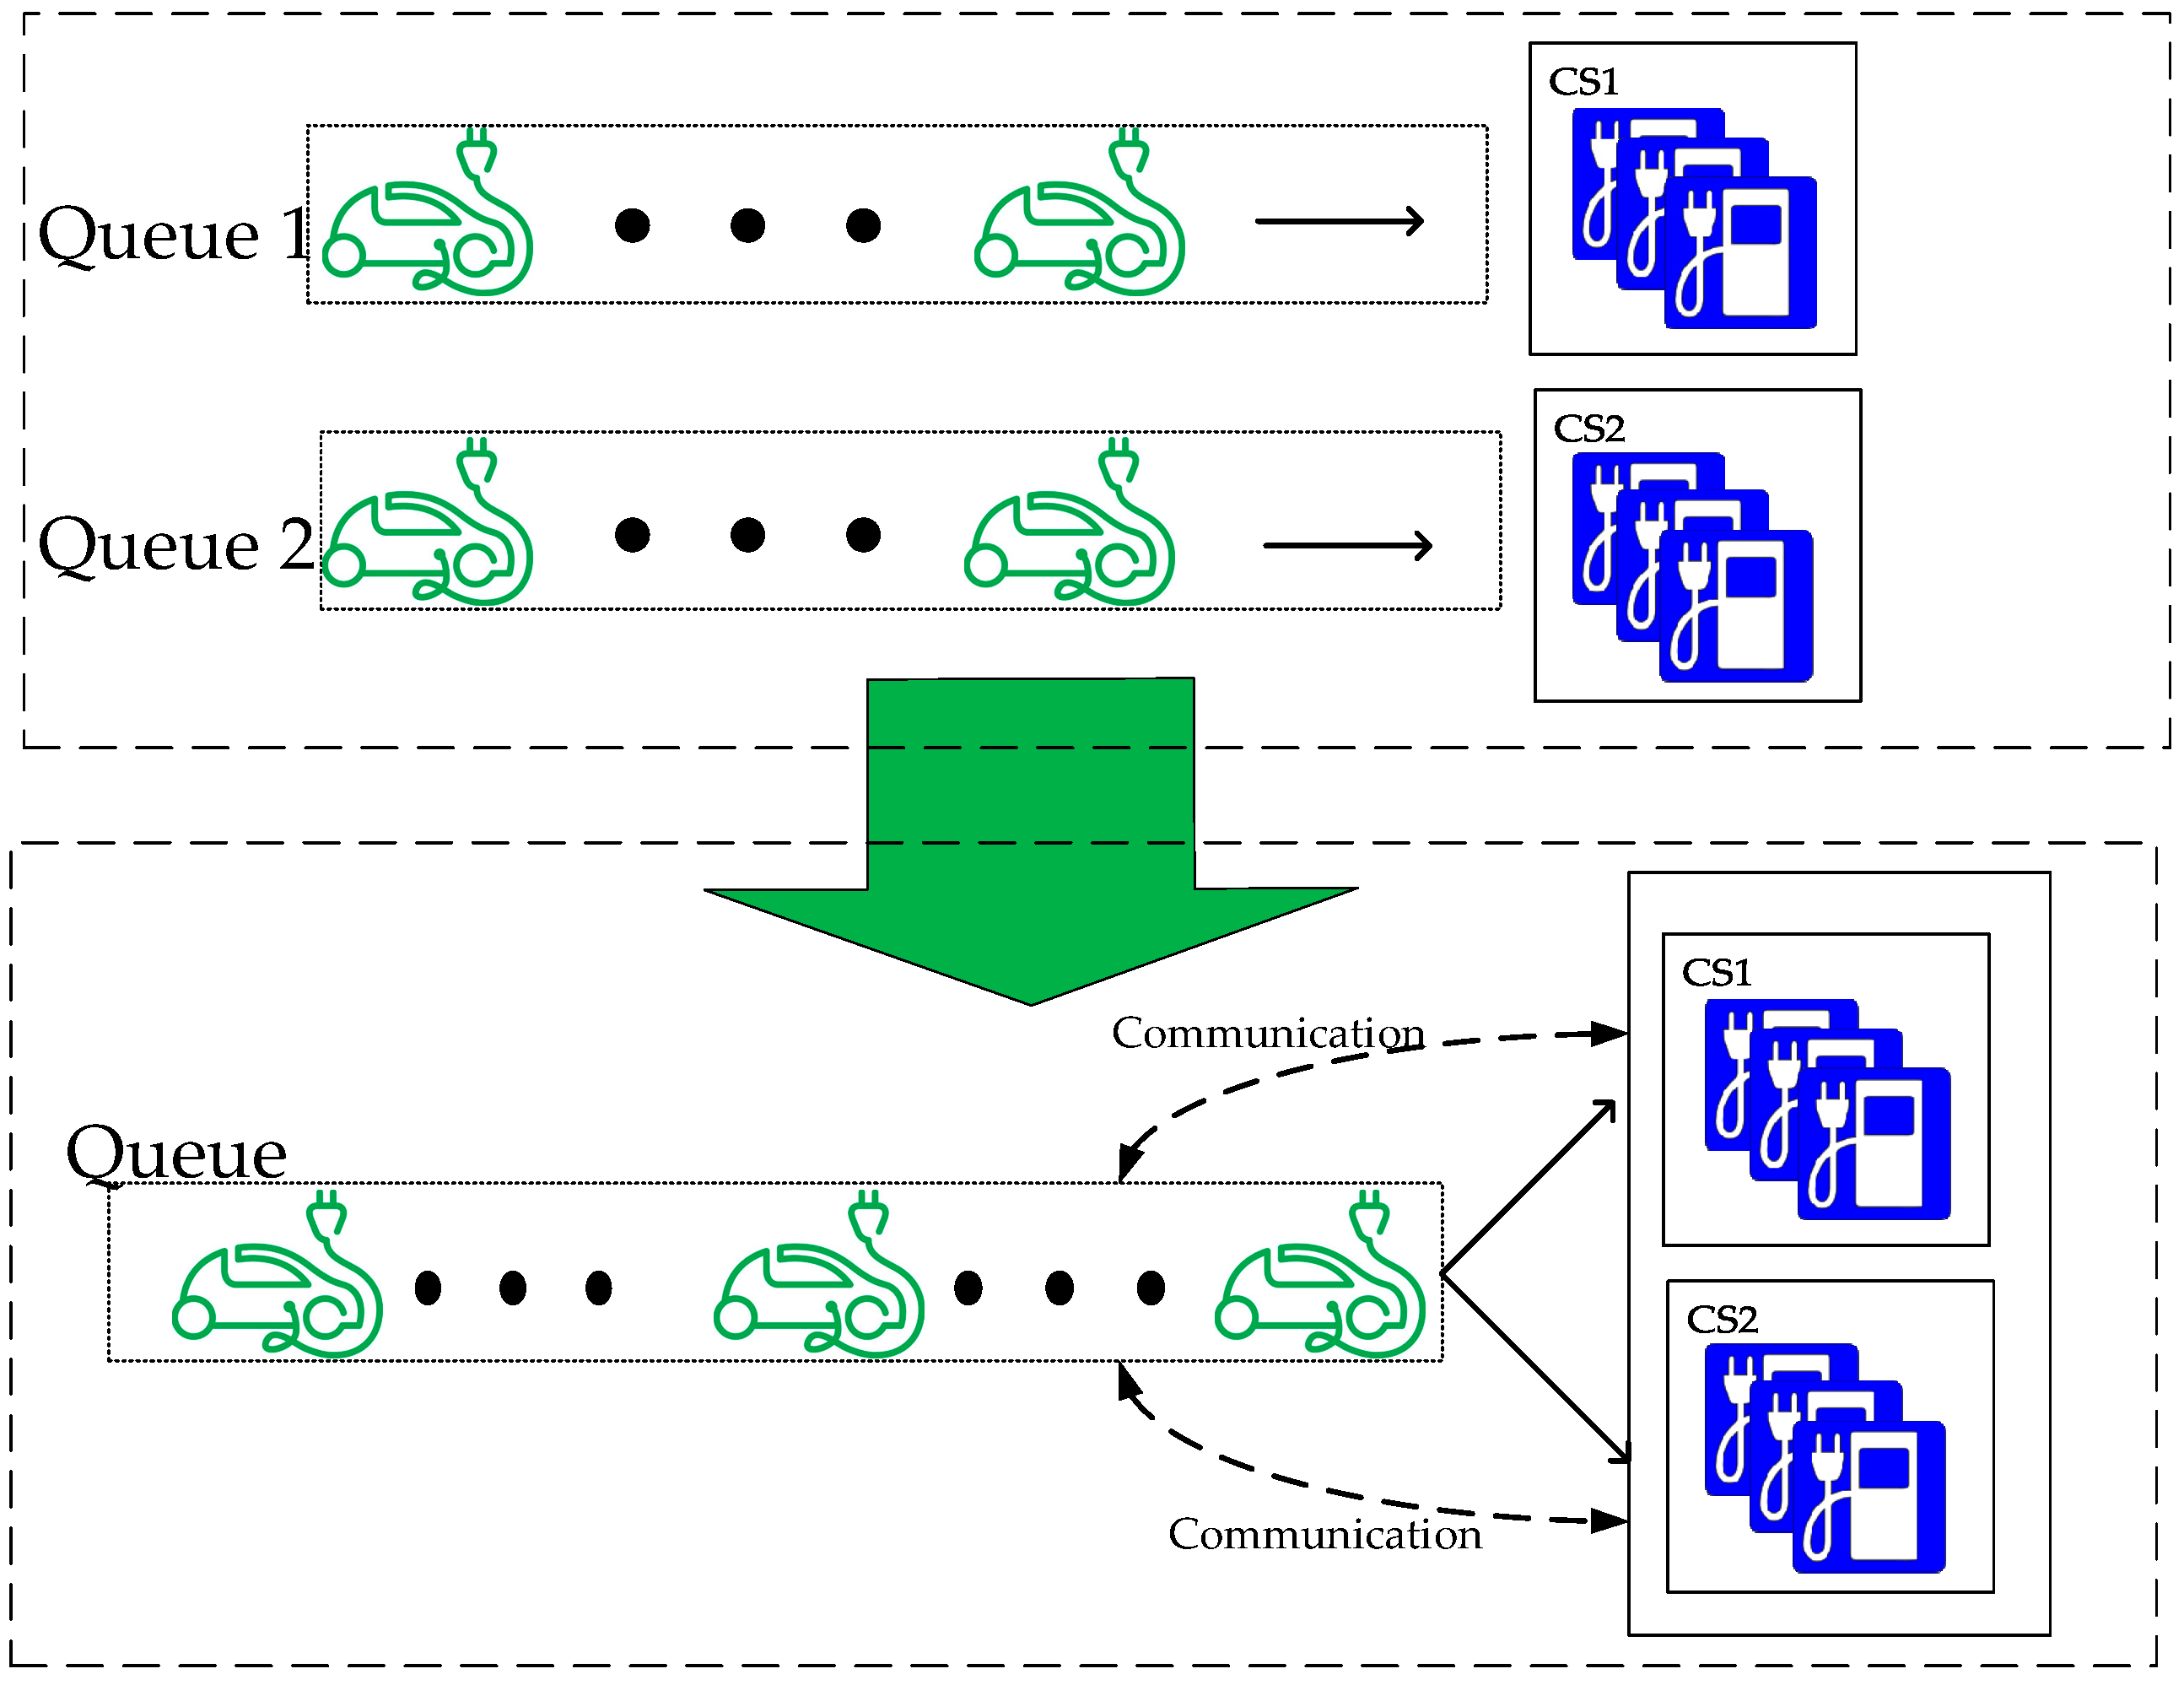
3.4. Queuing Theory for Busy Areas
For irregular routes, especially those in busy areas, waiting time is another primary consideration of EV users, since the time of trips for shopping or emergencies are always limited. The queuing theory is adopted to solve this problem. The queuing model for charging stations are built to analyze their status and calculate the waiting time for EV drivers. When an EV enters the area, and begins to choose a charging station, the driver could get information, such as the waiting time of nearby charging stations from communication devices and make a choice. Consequently, queues for several charging stations in the area are combined into one queue, virtually. The method is shown in Figure 5.
In this way, the EV drivers can avoid lining up in the same charging station so that the average waiting time of all EV users can be reduced. Planning the charging SOC range according to the cost model of battery degradation and drivers’ next destinations can also reduce the waiting time since the electricity quantity to charge and charging duration are restricted. The waiting time of EVs for each charging station can be calculated by Equations (14)–(16):
where denotes the waiting time of the i-th EV for charging station j, indicates the charging start time of EV i at charging station j, is the arrival time of EV i. N is the number of charging piles in charging station j. denotes the earliest end time of charging of N EVs which arrive earlier than EV i in the charging station j, including those that are being charged and in line. Equation (16) means that if the arrival time of EV i is earlier than , the driver has to wait until . If the arrival time of EV i is later than , the driver does not need to wait and the waiting time will be 0. EV users can go to the charging station with the shortest waiting time after receiving the nearby charging station’s information transmitted by technology such as Intelligent Transport System (ITS) and Internet of Things (IoT).
4. Numerical Results
In this section, the proposed charging management for regular routes and irregular routes are simulated by EVs generated by the Monte Carlo method, based on real data of a campus area and a shopping area. The results compared to disordered charging (DC) show a great advantage in EVs’ operating costs, including the cost of battery degradation, electricity cost, distribution network load curve, and waiting time in line.
4.1. Regular Routes Planning Simulation
4.1.1. Monte Carlo Method
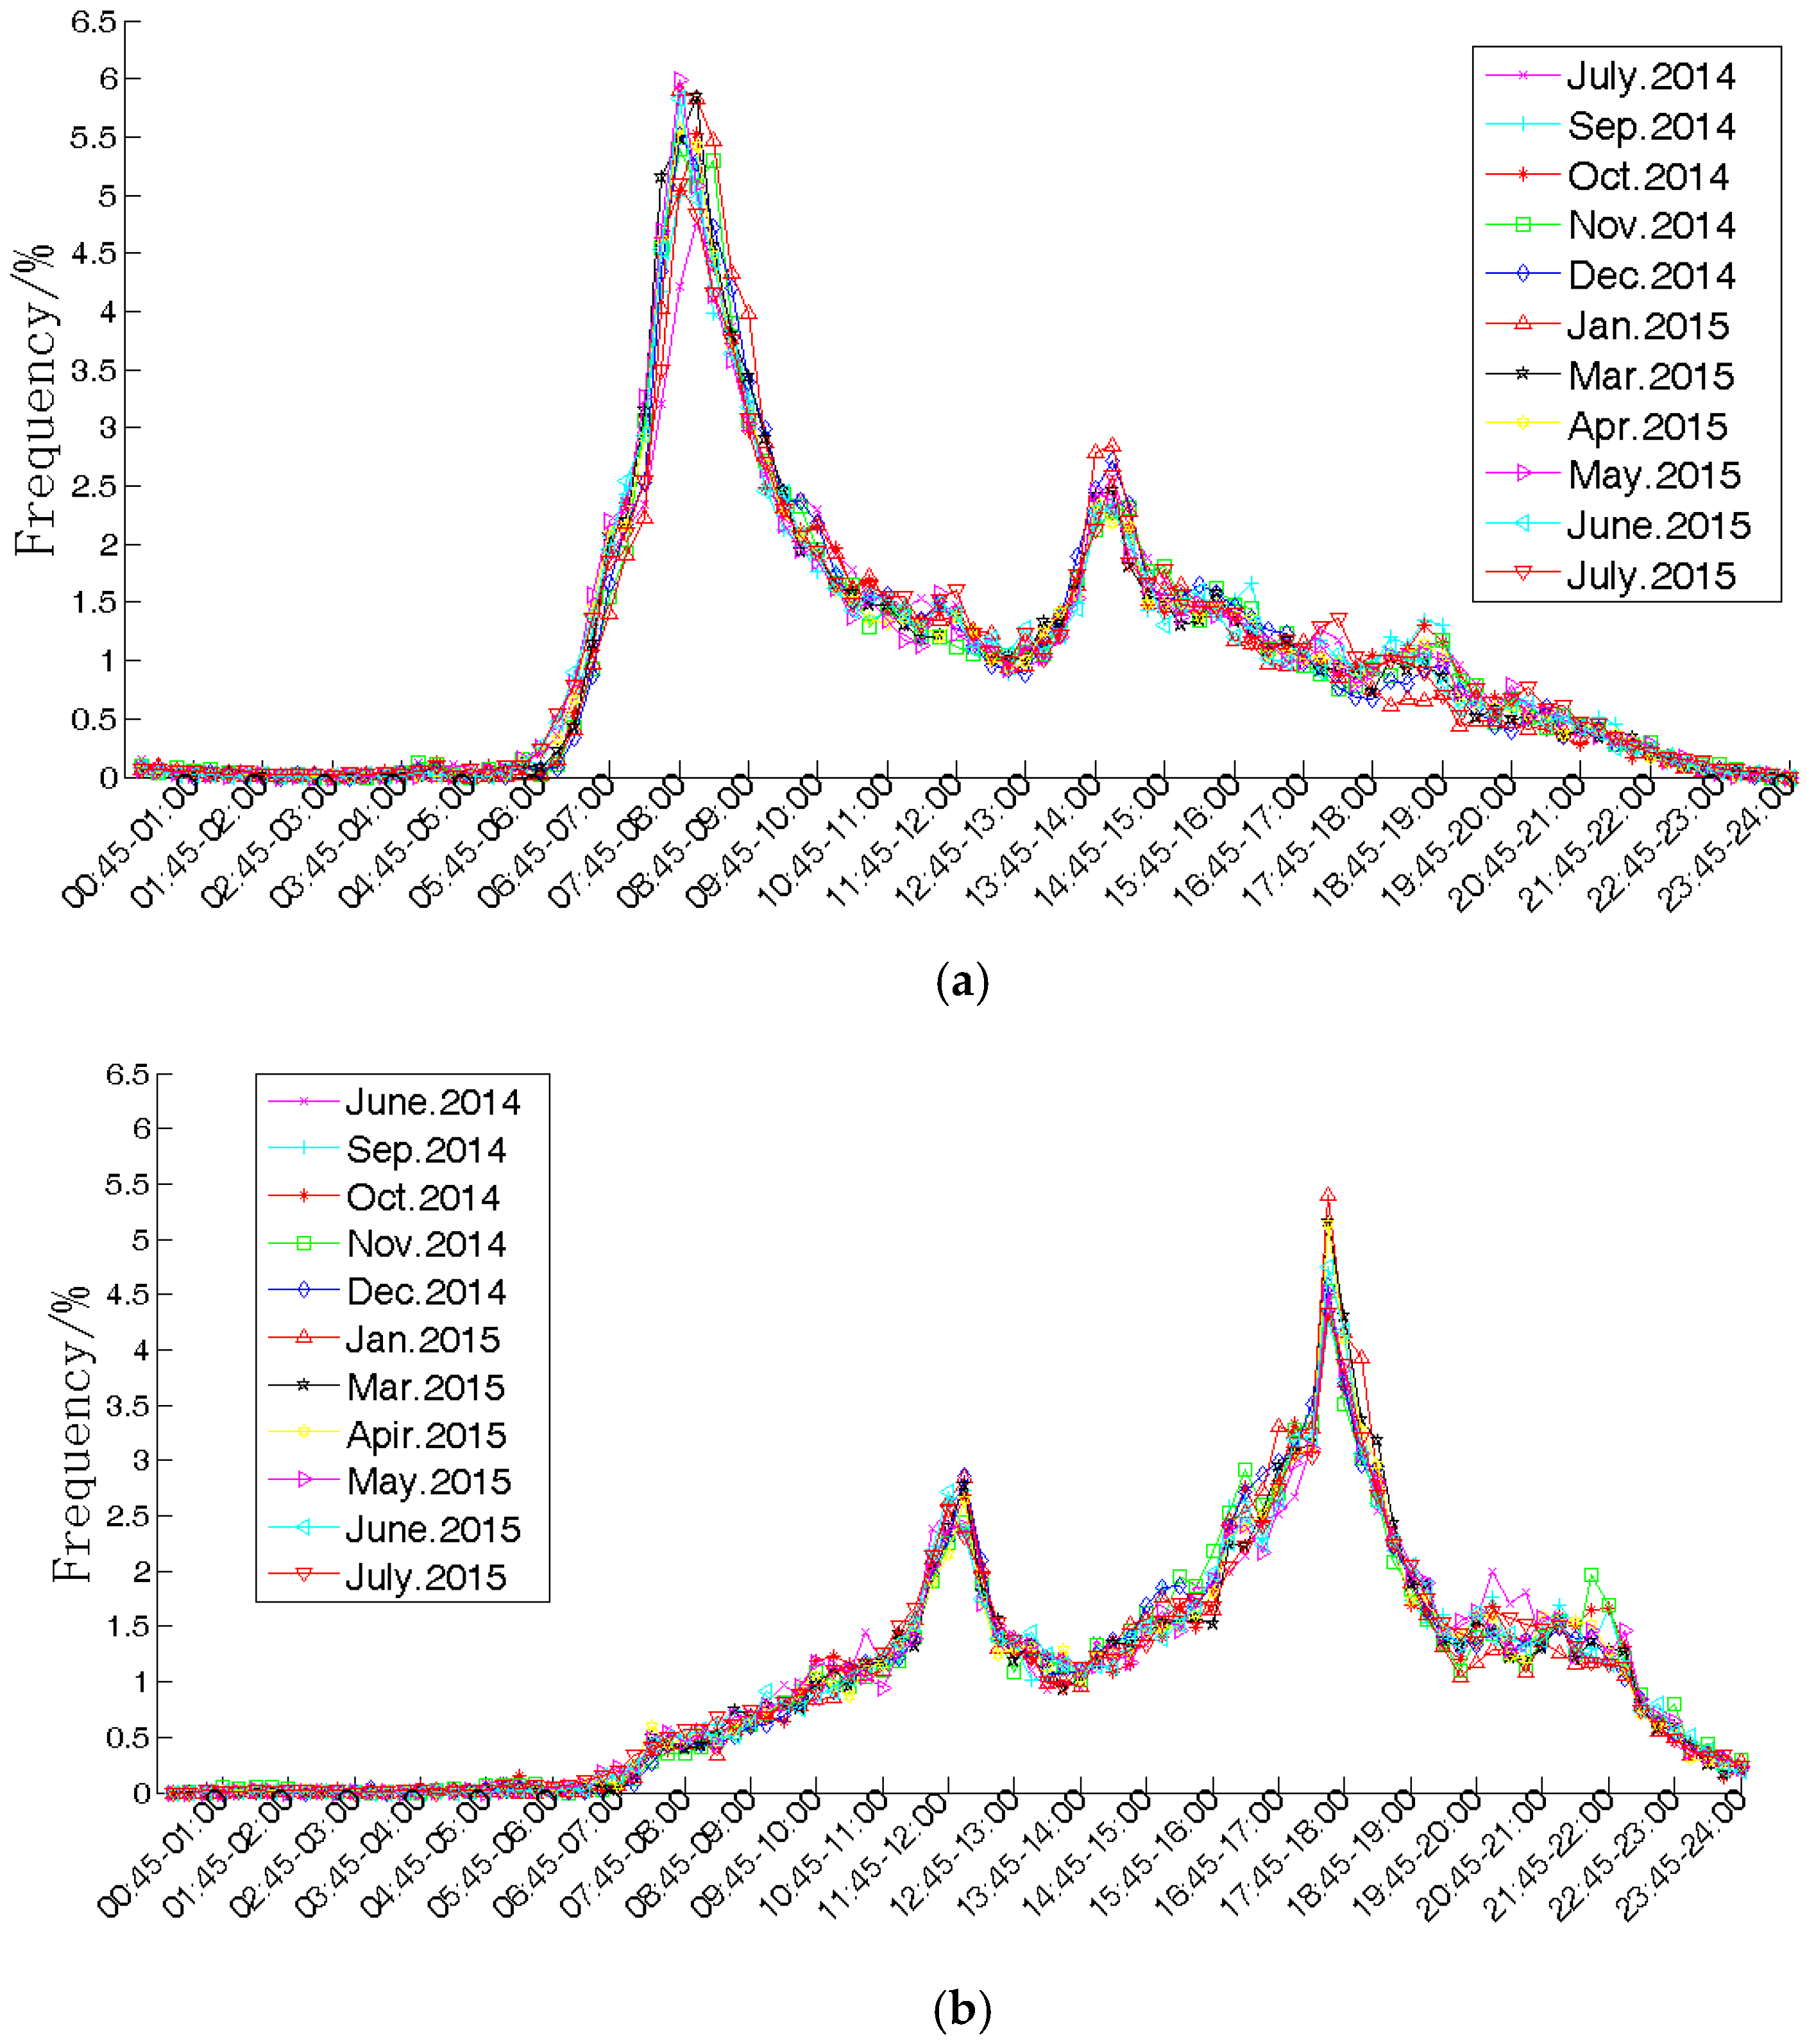
To investigate the habitual arrival and departure time of EV users, the data of a campus area containing charging piles is analyzed. Assuming that vehicle owners will drive their EVs in a similar way as they drive their internal combustion engine vehicles (ICEVs) today, this data is used for the simulation of EVs. The result of arrival and departure time distribution is shown in Figure 6.
The origin-destination pattern (OD) is assumed to follow a normal distribution, as shown in Equation (17). The average distance is 18.9 km according to the report in [32]:
Then, examples of EVs with real trip characteristics can be generated by the Monte Carlo (MC) method. The 24 h in a day are divided into 96 parts, with each part representing 15 min. One-hundred EV examples are generated with information of arrival time, departure time, and OD distance. Meanwhile, the available charging time, charging electricity quantity, and charging duration are determined also.
The capacity Q of EVs is simulated by the EV sales data from [33]. Parameters of the top four popular types of EV shown in Table 1 are randomly dispatched to the EVs generated by MC.
For disordered charging EVs are assumed to be charged as soon as they arrive until 100% SOC every time.
4.1.2. Results of Regular Routes Simulation
After setting those parameters, the necessary ΔSOC of regular routes is determined. Given that drivers need some extra electricity for unexpected things or emergencies, 10% is a floor of the planning, i.e., the EVs’ SOC will not be below 10% even if it might lead to lower operating costs. This lower boundary is to keep batteries from running out of charge. Then the charging SOC ranges are determined by the cost model of battery degradation to reduce the costs of capacity fade. The electricity costs are reduced by managing EVs’ charging time in their available charging time according to Equations (8)–(11). This step will restrict the charging start time in a smaller scope to achieve the lowest electricity costs. The optimization of distribution network will be conducted in this restricted scope. The charging power is assumed as level 1 charging, i.e., 3 kW here since EV users always have enough time for charging in the working area.
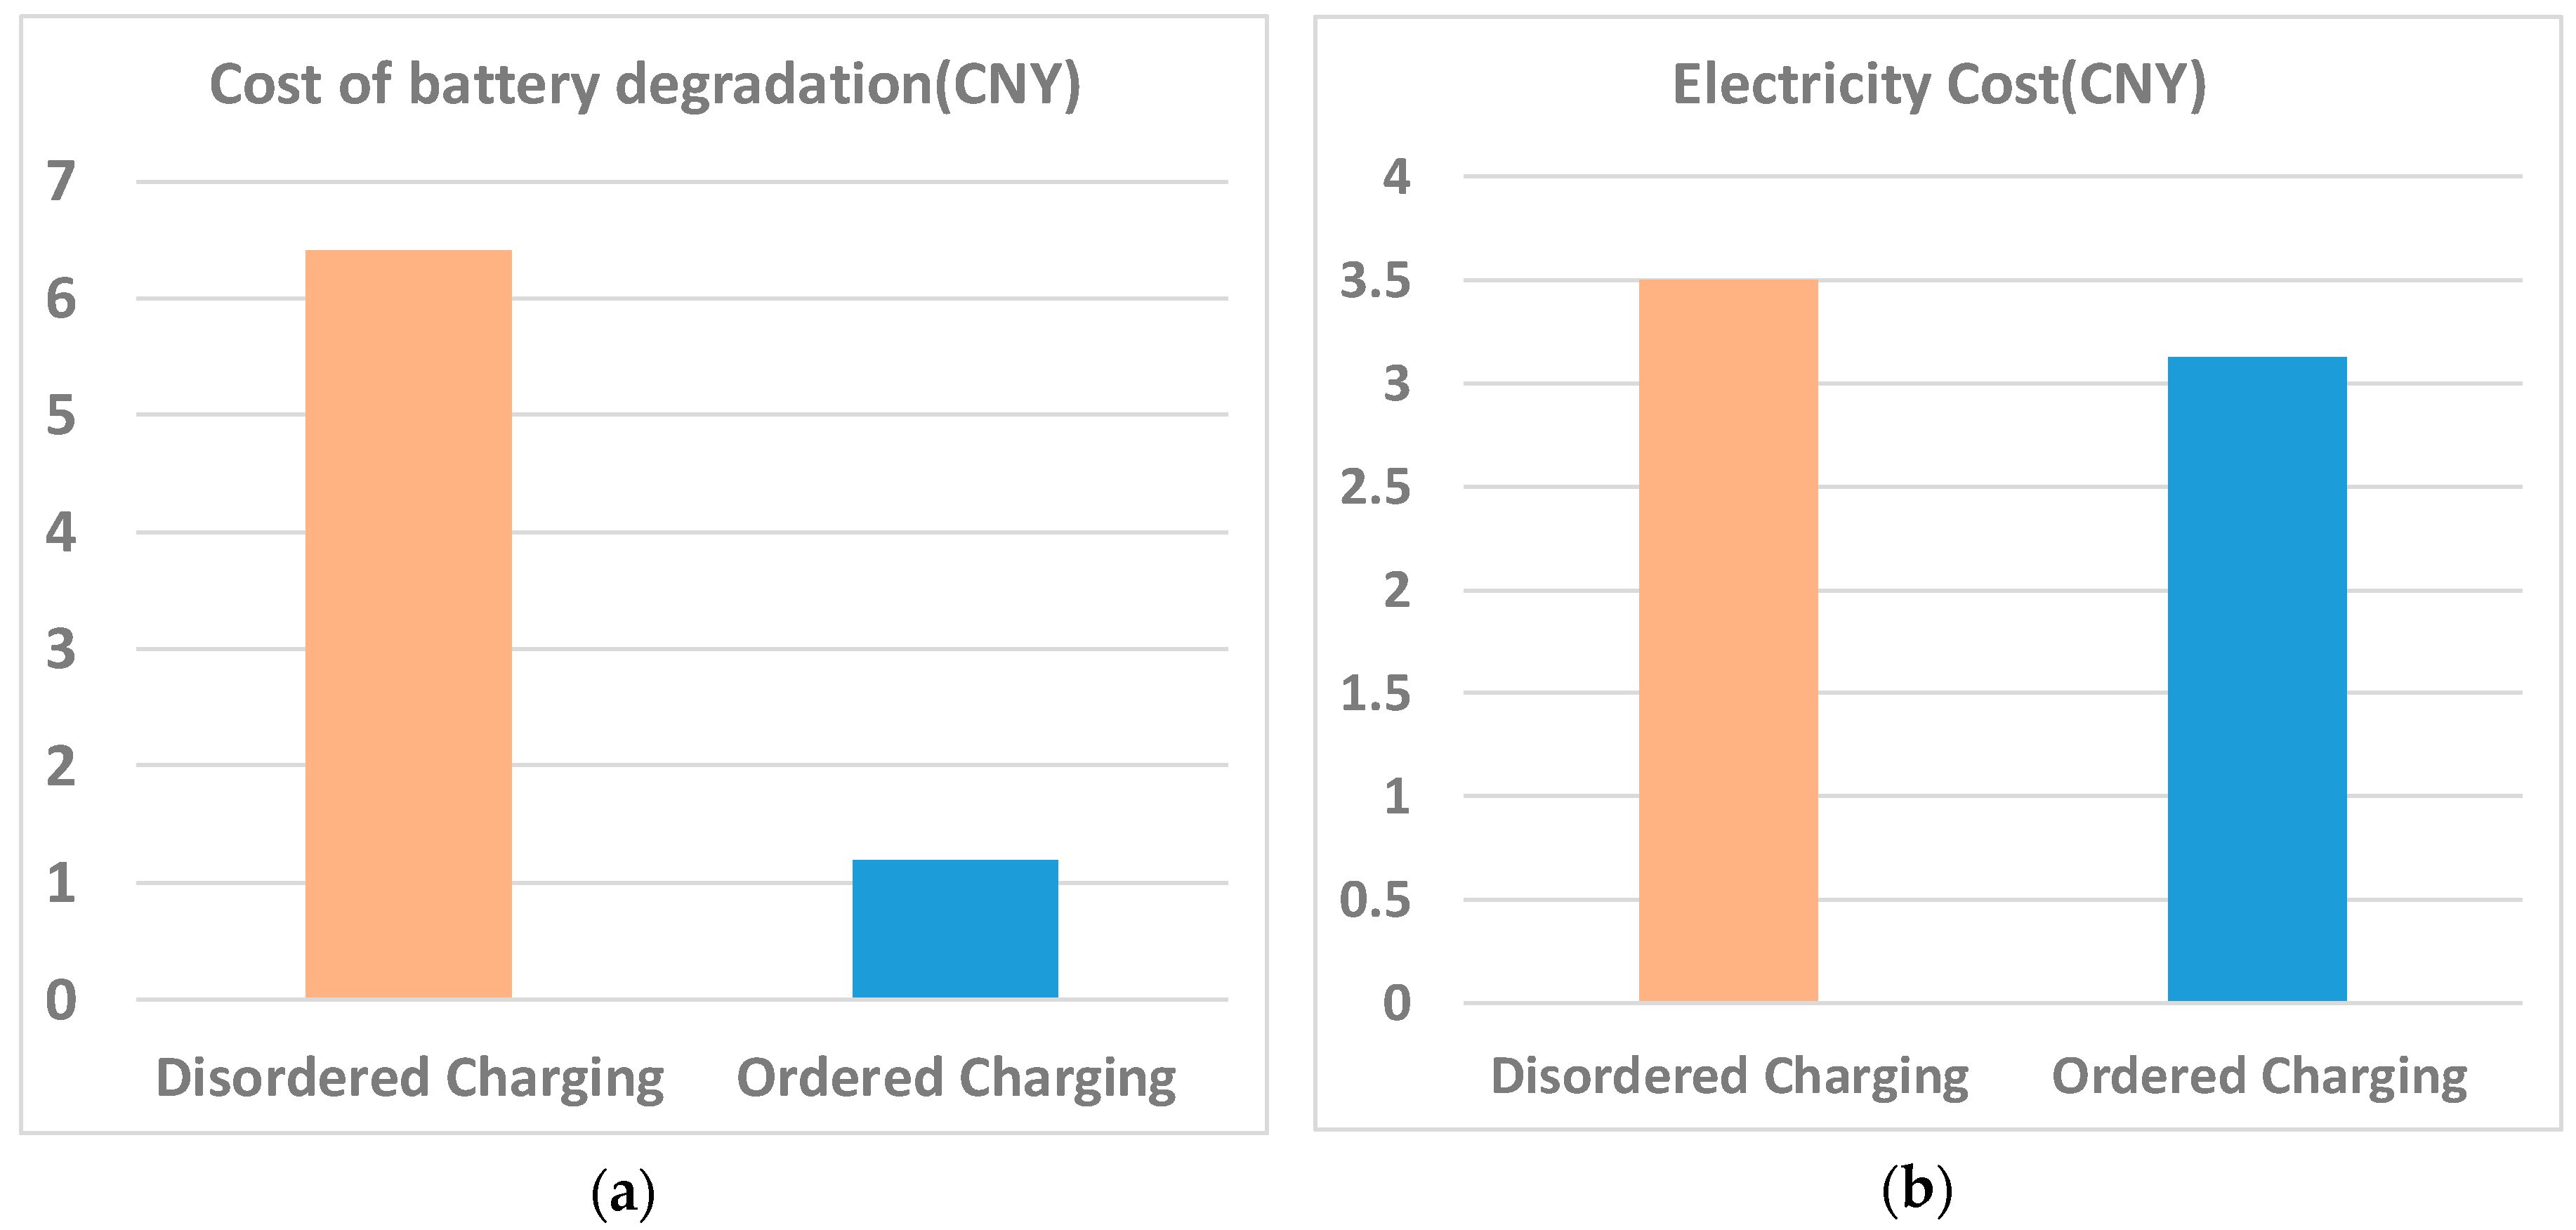
The costs of battery capacity degradation and electricity costs of ordered charging (OC) and disordered charging are calculated and the comparisons of the average values are shown in Figure 7 and Table 2.
It can be easily observed that the proposed method reduces a great amount of the cost of battery capacity degradation which plays a more important role than the cost of electricity in the total operating costs. This benefit is usually not appreciated by most users. The cost of battery capacity degradation also presents a greater elasticity to be adjusted and is more controllable than the cost of electricity.
Although the adjustable range is restricted by the requirement of EV users’ benefits, the grid load curve still has significant room to be improved. The proposed method greatly optimized the distribution network load, as shown in Figure 8 and Table 3. Many strategies proposed by other researchers seem to show a better effect for grid load than our result. However, those are the results with the assumption of a perfect participation rate, which is not realistic and has baffled researchers for a long time. The method proposed in this paper will, hopefully, be a solution of this problem, because the EV users’ benefits are put as the top priority. Given that the participation rate will be higher, the charging planning proposed in this paper will not show a worse effect than other strategies. In this way, the EV users and power grid can achieve a “win-win” situation.
4.2. Irregular Routes Planning Simulation
For irregular routes, EV drivers focus more on waiting time since the destinations are always busy areas, such as shopping malls. Therefore, reducing waiting time is given priority by the proposed queuing theory and SOC range planning. Similar to the work done before, 1000 EVs are generated by the MC method with initial SOC, battery capacity, arrival time, dwell time, and distance to the next destination. The data probability distributions are taken from “The US National Household Travel Survey (NHTS)” [34] and organized in [25]. A shopping area with two charging stations nearby is chosen as an example. All the EVs are assumed to be charged by fast charging with a charging power of 30 kW because the drivers have limited time for charging. The geographical placement of the shopping mall and charging stations are shown in Figure 9.
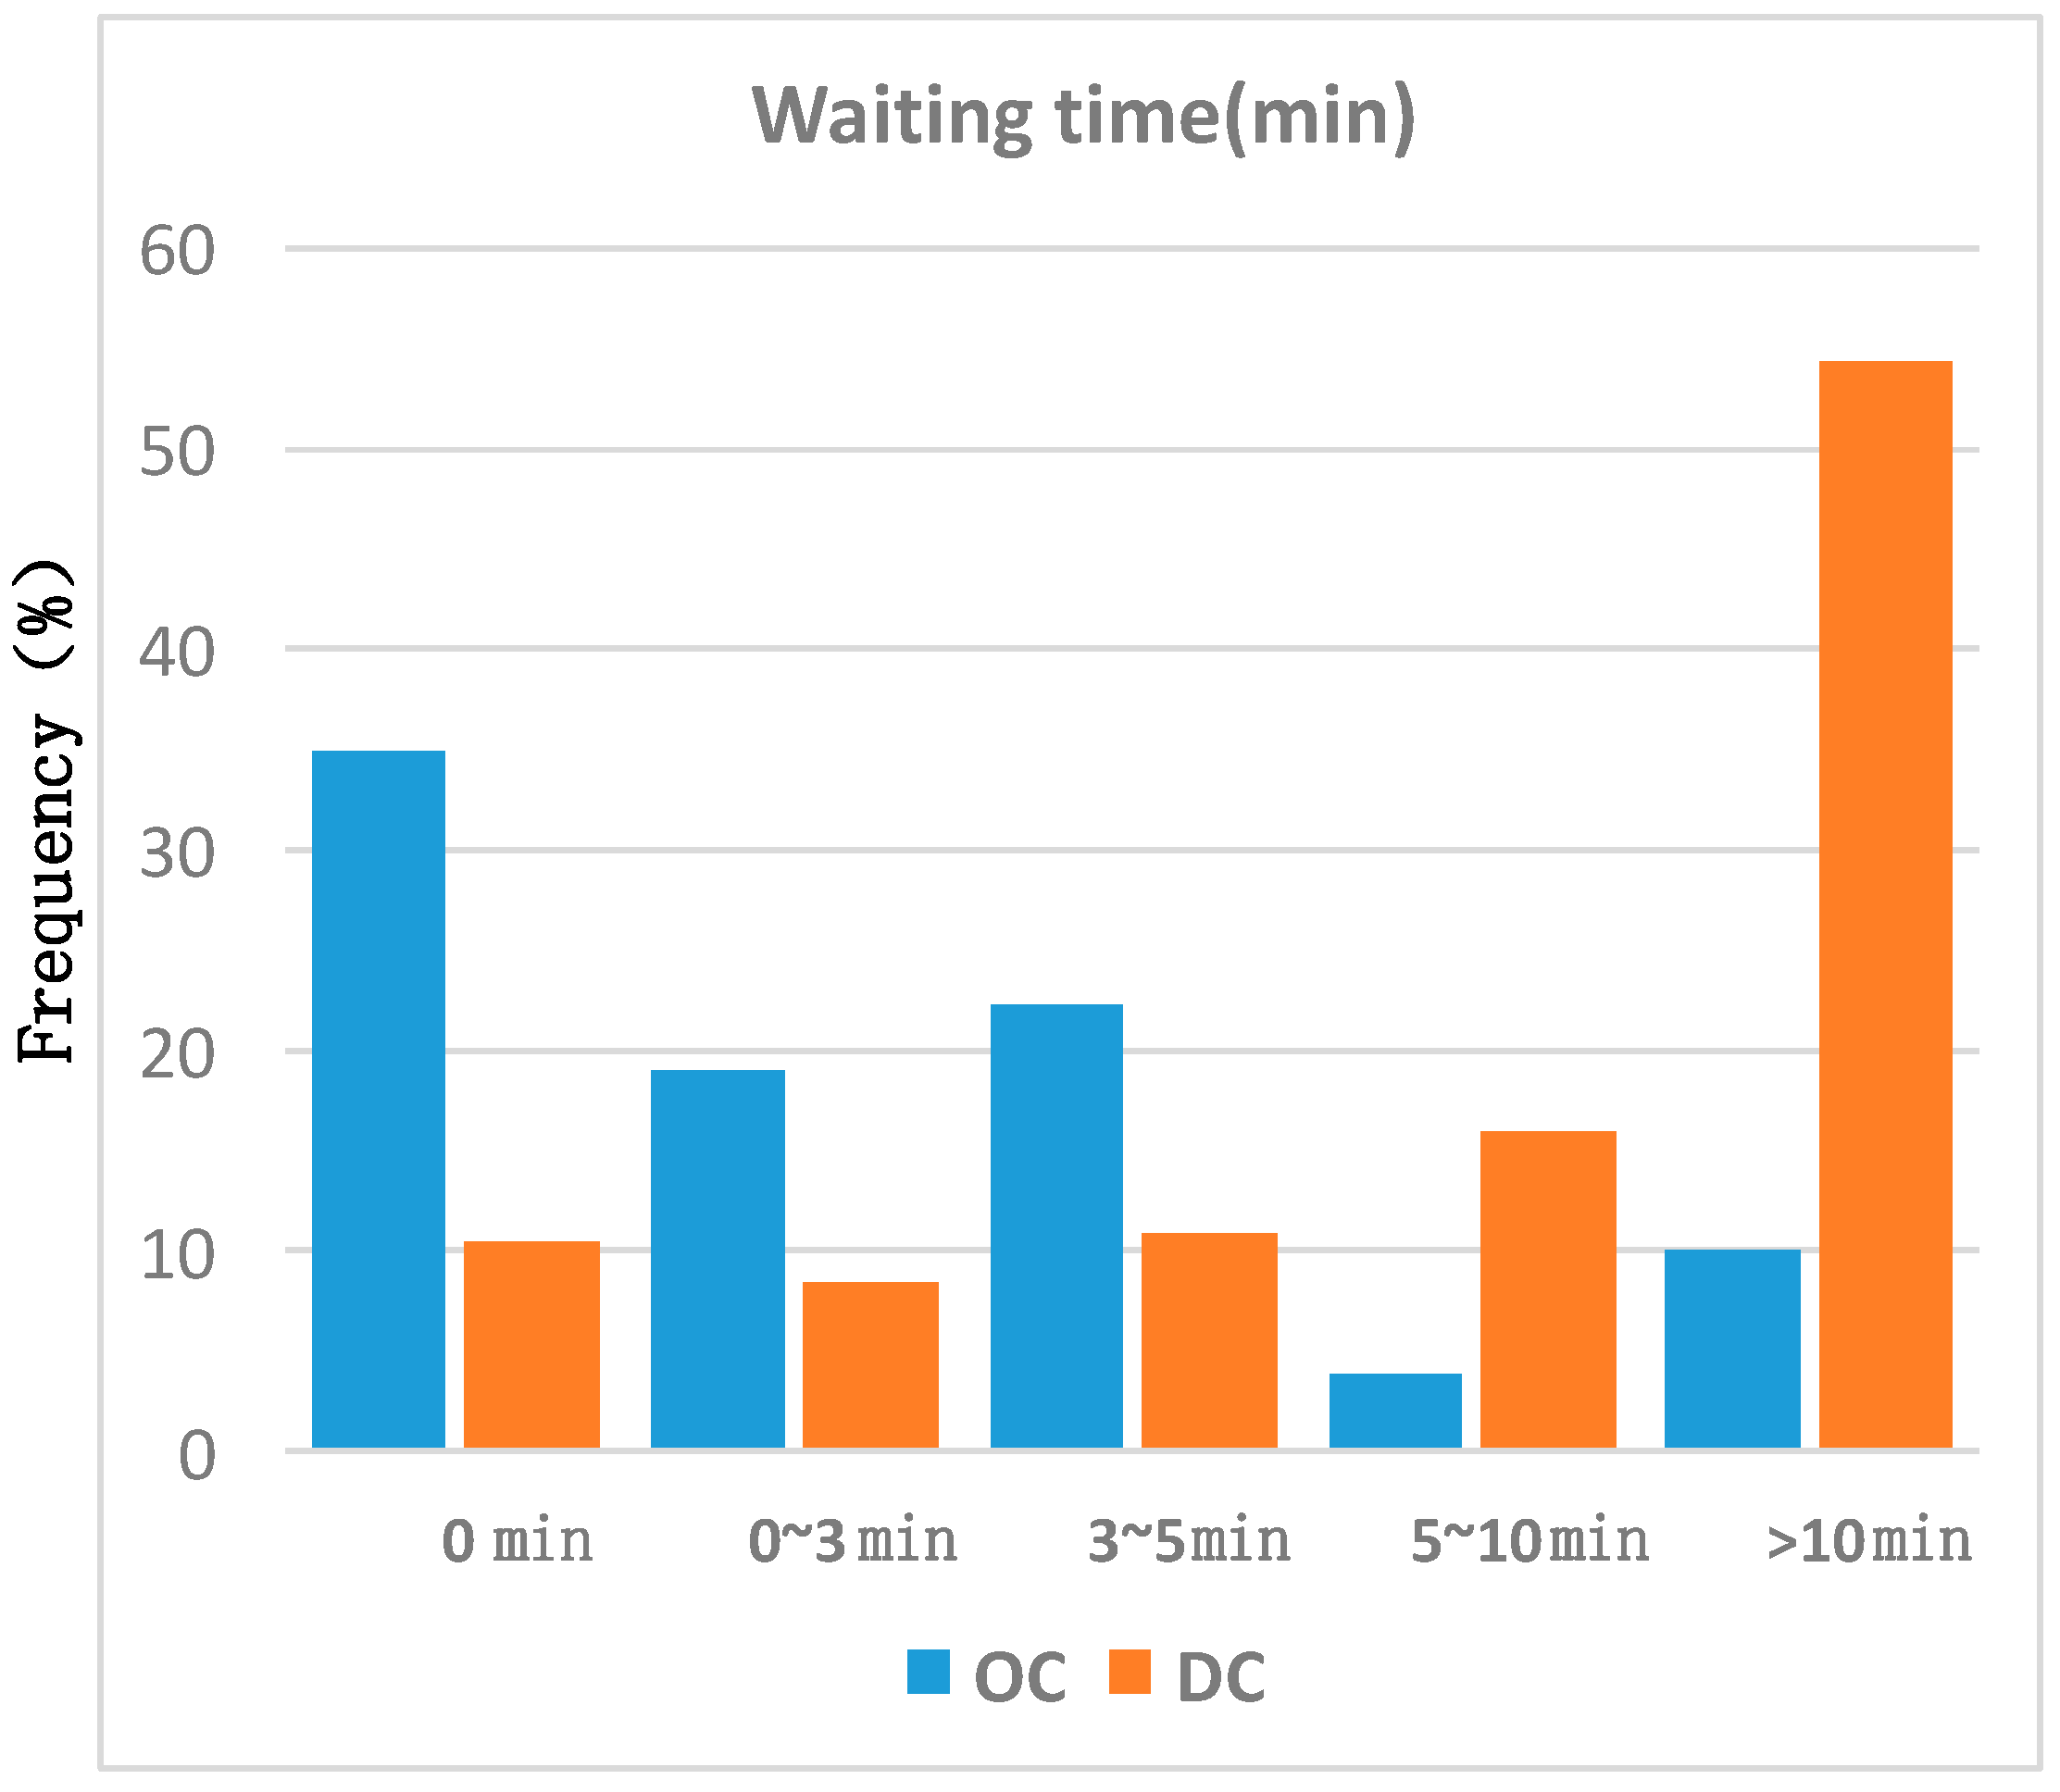
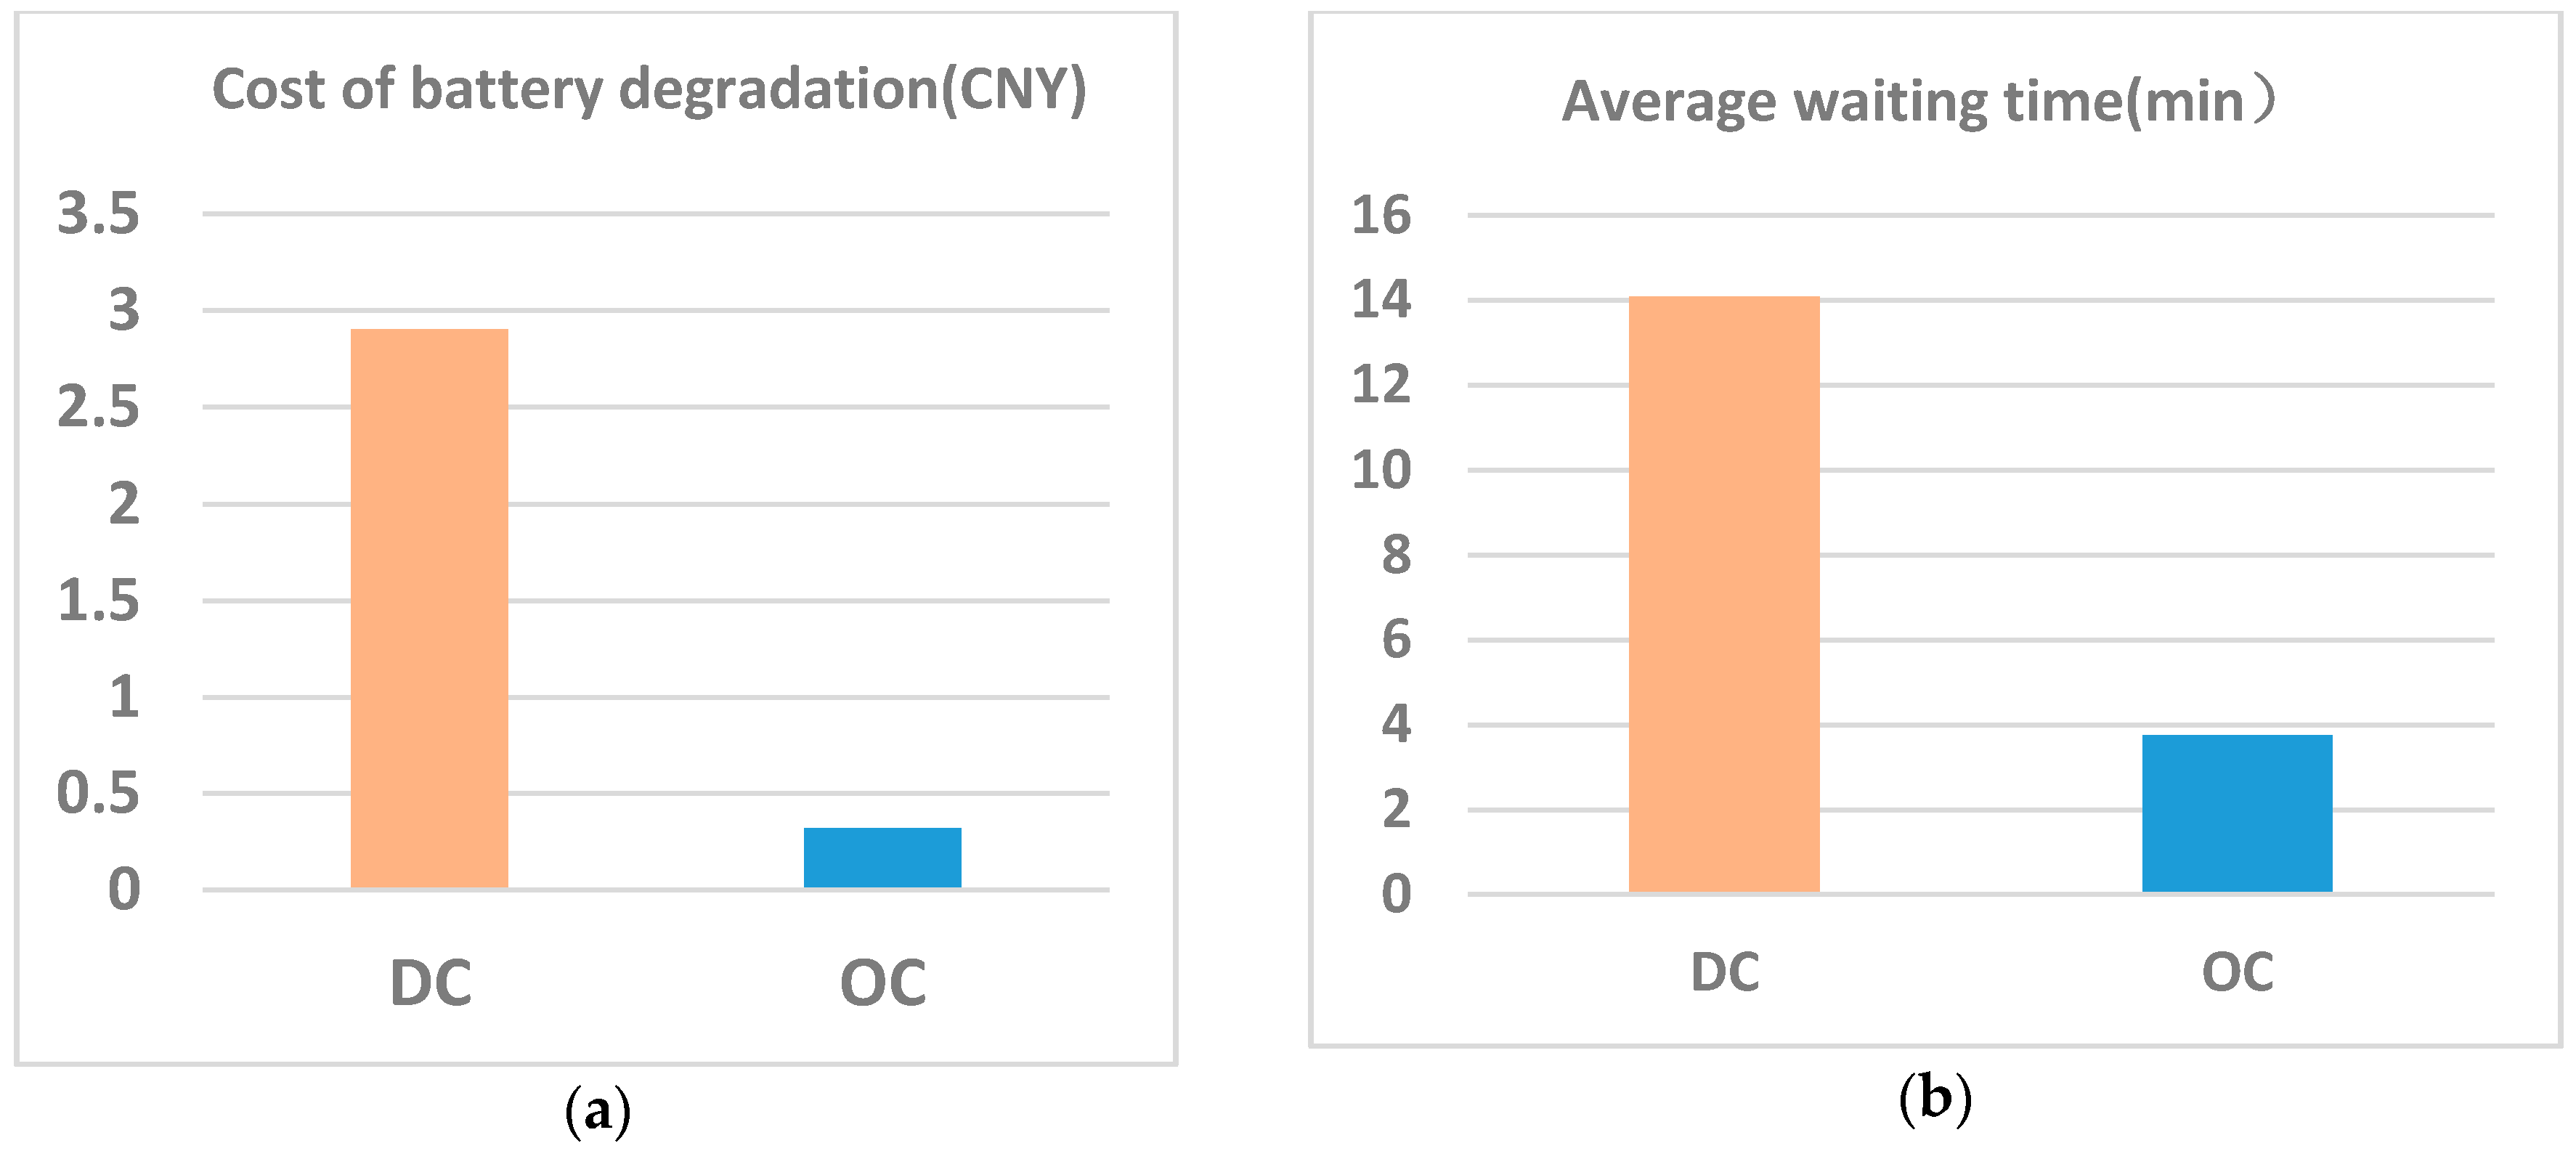
The method proposed in Section 3.1 and Section 3.4 are applied as an ordered charging method to reduce EV drivers’ waiting time and the cost of battery degradation. The disordered charging method assumes that each EV driver chooses the charging station randomly and charges their EVs to 100% SOC. The comparison results are shown in Figure 10 and Figure 11.
5. Conclusions
The EV users’ benefits are set as the highest priority in the proposed charging strategy. The types of driving are classified into two groups, namely, regular routes and irregular routes, and analyzed individually. The major contributions of the proposed strategy are summarized as follows:
- A cost model of battery capacity degradation is developed to estimate the cost of battery capacity degradation, which is usually not paid much attention by EV users. The optimal SOC range planning based on this model enables the the cost of battery degradation to be significantly reduced.
- For regular routes, to keep the operating cost low for the routes, such as commuting, charging time is also shifted to achieve the lowest electricity cost.
- For regular routes, the grid operation is optimized by AFSA with constraints which occur in the process of maximizing EV users’ benefit. In the meantime, the daily load curve in the distribution network can still be flattened markedly.
- For irregular routes, the average queue time is greatly decreased due to the application of queuing theory, and the cost of battery degradation is also reduced by the SOC range planning based on the cost model of battery degradation.
This study proposed a method for EV users to satisfy their expectations, which are depicted as the cost of battery degradation, the electricity cost in regular routes, and the waiting time and the cost of battery degradation in irregular routes, respectively. Thus, this method is expected to increase the participation of EV users for the proposed charging strategy. Both the electricity portion of the operating costs and the battery capacity degradation costs under different SOC ranges are notably reduced and, thus, the overall economic outcomes become beneficial to the EV drivers. Numerical results show that the proposed strategy has markedly provided positive effects for both types of routes. It should be emphasized that the battery capacity degradation cost is a non-negligible part and a more elastic part than the electricity cost in the total operating costs. Although this study contributes to promote EVs in our society, the model of battery capacity degradation can be further improved using more real-life examples, and the strategies to optimize the daily load curve in irregular routes should be further improved possibly with the application of energy storage systems.
Acknowledgments
This project is supported in part by the National Natural Science Foundation of China (NSFC) (51677004) and the Fundamental Research Funds for the Central Universities (E16JB00140). The authors gratefully acknowledge the contributions of the Center for Advanced Life Cycle Engineering (CALCE) at the University of Maryland for their great work on battery capacity loss experiments and open source data. Senior researcher Koji Yamashita also provided help for the research in this paper.
Author Contributions
The data analysis and charging strategy design was done by Hao Li. He also performed cost of battery capacity degradation modeling and the simulation for case studies. Su Su worked on queuing system optimization, performed data analysis and oversaw the overall paper presentation. David Wenzhong Gao performed grid load curve optimization, analyzed the results, revised the manuscript and provided suggestions.
Conflicts of Interest
The authors declare no conflict of interest.
References
- Hannan, M.A.; Azidin, F.A.; Mohamed, A. Hybrid electric vehicles and their challenges: A review. Renew. Sustain. Energy Rev. 2014, 29, 135–150. [Google Scholar] [CrossRef]
- Hilshey, A.D.; Rezaei, P.; Hines, P.D.H.; Frolik, J. Electric vehicle charging: Transformer impacts and smart, decentralized solutions. In Proceedings of the Power and Energy Society General Meeting, San Diego, CA, USA, 22–26 July 2012; pp. 1–8. [Google Scholar]
- Masoum, A.S.; Deilami, S.; Moses, P.S.; Masoum, M.A.S.; Abu-Siada, A. Smart load management of plug-in electric vehicles in distribution and residential networks with charging stations for peak shaving and loss minimisation considering voltage regulation. IET Gener. Transm. Distrib. 2011, 5, 877–888. [Google Scholar] [CrossRef]
- Razeghi, G.; Zhang, L.; Brown, T.; Samuelsen, S. Impacts of plug-in hybrid electric vehicles on a residential transformer using stochastic and empirical analysis. J. Power Sources 2014, 252, 277–285. [Google Scholar] [CrossRef]
- Fernandez, L.P.; Roman, T.G.S.; Cossent, R.; Domingo, C.M.; Frias, P. Assessment of the impact of plug-in electric vehicles on distribution networks. IEEE Trans. Power Syst. 2011, 26, 206–213. [Google Scholar] [CrossRef]
- Richardson, P.; Flynn, D.; Keane, A. Optimal charging of electric vehicles in low-voltage distribution systems. IEEE Trans. Power Syst. 2012, 27, 268–279. [Google Scholar] [CrossRef]
- Chis, A.; Lunden, J.; Koivunen, V. Scheduling of plug-in electric vehicle battery charging with price prediction. In Proceedings of the Innovative Smart Grid Technologies Europe, Lyngby, Denmark, 6–9 October 2013; pp. 1–5. [Google Scholar]
- Zheng, J.; Wang, X.; Men, K.; Zhu, C.; Zhu, S. Aggregation model-based optimization for electric vehicle charging strategy. IEEE Trans. Smart Grid 2013, 4, 1058–1066. [Google Scholar] [CrossRef]
- Aziz, M.; Oda, T.; Mitani, T.; Watanabe, Y.; Kashiwagi, T. Utilization of electric vehicles and their used batteries for peak-load shifting. Energies 2015, 8, 3720–3738. [Google Scholar] [CrossRef]
- Alam, M.; Mekhilef, S.; Seyedmahmoudian, M.; Horan, B. Dynamic charging of electric vehicle with negligible power transfer fluctuation. Energies 2017, 10, 701. [Google Scholar] [CrossRef]
- Sortomme, E.; Hindi, M.M.; Macpherson, S.D.J.; Venkata, S.S. Coordinated charging of plug-in hybrid electric vehicles to minimize distribution system losses. IEEE Trans. Smart Grid 2011, 2, 198–205. [Google Scholar] [CrossRef]
- Hu, Z.; Zhan, K.; Zhang, H.; Song, Y. Pricing mechanisms design for guiding electric vehicle charging to fill load valley. Appl. Energy 2016, 178, 155–163. [Google Scholar] [CrossRef]
- Yang, J.; Chen, J.; Chen, L.; Wang, F.; Xie, P.; Zeng, C. A regional time-of-use electricity price based optimal charging strategy for electrical vehicles. Energies 2016, 9, 670. [Google Scholar] [CrossRef]
- Hu, J.; Yang, G.; Kok, K.; Xue, Y.; Bindner, H.W. Transactive control: A framework for operating power systems characterized by high penetration of distributed energy resources. J. Mod. Power Syst. Clean Energy 2016, 5, 451–464. [Google Scholar] [CrossRef]
- Hao, H.; Corbin, C.D.; Kalsi, K.; Pratt, R.G. Transactive control of commercial buildings for demand response. IEEE Trans. Power Syst. 2017, 32, 774–783. [Google Scholar] [CrossRef]
- Jin, X.; Meintz, A. Challenges and Opportunities for Transactive Control of Electric Vehicle Supply Equipment. A Reference Guide; NREL/TP--5500-64007; National Renewable Energy Laboratory (NREL): Golden, CO, USA, 2015.
- Yagcitekin, B.; Uzunoglu, M. A double-layer smart charging strategy of electric vehicles taking routing and charge scheduling into account. Appl. Energy 2016, 167, 407–419. [Google Scholar] [CrossRef]
- Liu, D.; Wang, Y.; Shen, Y. Electric vehicle charging and discharging coordination on distribution network using multi-objective particle swarm optimization and fuzzy decision making. Energies 2016, 9, 186. [Google Scholar] [CrossRef]
- Chen, L.; Chen, Z.; Huang, X.; Jin, L. A study on price-based charging strategy for electric vehicles on expressways. Energies 2016, 9, 385. [Google Scholar] [CrossRef]
- Ouyang, M.; Feng, X.; Han, X.; Lu, L.; Li, Z.; He, X. A dynamic capacity degradation model and its applications considering varying load for a large format li-ion battery. Appl. Energy 2016, 165, 48–59. [Google Scholar] [CrossRef]
- Liu, D.; Luo, Y.; Liu, J.; Peng, Y.; Guo, L.; Pecht, M. Lithium-ion battery remaining useful life estimation based on fusion nonlinear degradation AR model and RPF algorithm. Neural Comput. Appl. 2014, 25, 557–572. [Google Scholar] [CrossRef]
- Saxena, S.; Hendricks, C.; Pecht, M. Cycle life testing and modeling of graphite/LiCoO2 cells under different state of charge ranges. J. Power Sources 2016, 327, 394–400. [Google Scholar] [CrossRef]
- Diao, Q.; Sun, W.; Yuan, X.; Li, L.; Zheng, Z. Life-cycle private-cost-based competitiveness analysis of electric vehicles in China considering the intangible cost of traffic policies. Appl. Energy 2016, 178, 567–578. [Google Scholar] [CrossRef]
- Wolfs, P. An economic assessment of “second use” lithium-ion batteries for grid support. In Proceedings of the Universities Power Engineering Conference (AUPEC), Christchurch, New Zealand, 5–8 December 2010; pp. 1–6. [Google Scholar]
- Flores, R.J.; Shaffer, B.P.; Brouwer, J. Electricity costs for an electric vehicle fueling station with level 3 charging. Appl. Energy 2016, 169, 813–830. [Google Scholar] [CrossRef]
- Chen, L.; Huang, X.; Chen, Z.; Jin, L. Study of a new quick-charging strategy for electric vehicles in highway charging stations. Energies 2016, 9, 744. [Google Scholar] [CrossRef]
- Weerdt, M.M.D.; Stein, S.; Gerding, E.H.; Robu, V.; Jennings, N.R. Intention-aware routing of electric vehicles. IEEE Trans. Intell. Transp. Syst. 2016, 17, 1472–1482. [Google Scholar] [CrossRef]
- Dong, X.; Mu, Y.; Jia, H.; Wu, J.; Yu, X. Planning of fast EV charging stations on a round freeway. IEEE Trans. Sustain. Energy 2016, 7, 1452–1461. [Google Scholar] [CrossRef]
- Lih, W.; Yen, J.; Shieh, F.; Liao, Y. Second-use Applications of lithium-ion batteries retired from electric vehicles: Challenges, repurposing process, cost analysis and optimal business model. Int. J. Adv. Comput. Technol. 2012, 4, 518–527. [Google Scholar]
- Barré, A.; Deguilhem, B.; Grolleau, S.; Gérard, M.; Suard, F.; Riu, D. A review on lithium-ion battery ageing mechanisms and estimations for automotive applications. J. Power Sources 2013, 241, 680–689. [Google Scholar] [CrossRef]
- Battery Group of Center for Advanced Life Cycle. Engineering, University of Maryland. Available online: http://www.calce.umd.edu/batteries/index.html (accessed on 4 July 2017).
- City Transportation Analysis Report of China. Available online: http://jiaotong.baidu.com/reports/ (accessed on 4 July 2017).
- China Electric Car Sales Report, CleanTechnica. Available online: https://cleantechnica.com (accessed on 4 July 2017).
- U.S. Department of Transportation, Federal Highway Administration. 2009 National Household Travel Survey. Available online: http://nhts.ornl.gov (accessed on 4 July 2017).
Figure 1.
Overall structure of the optimal planning method.
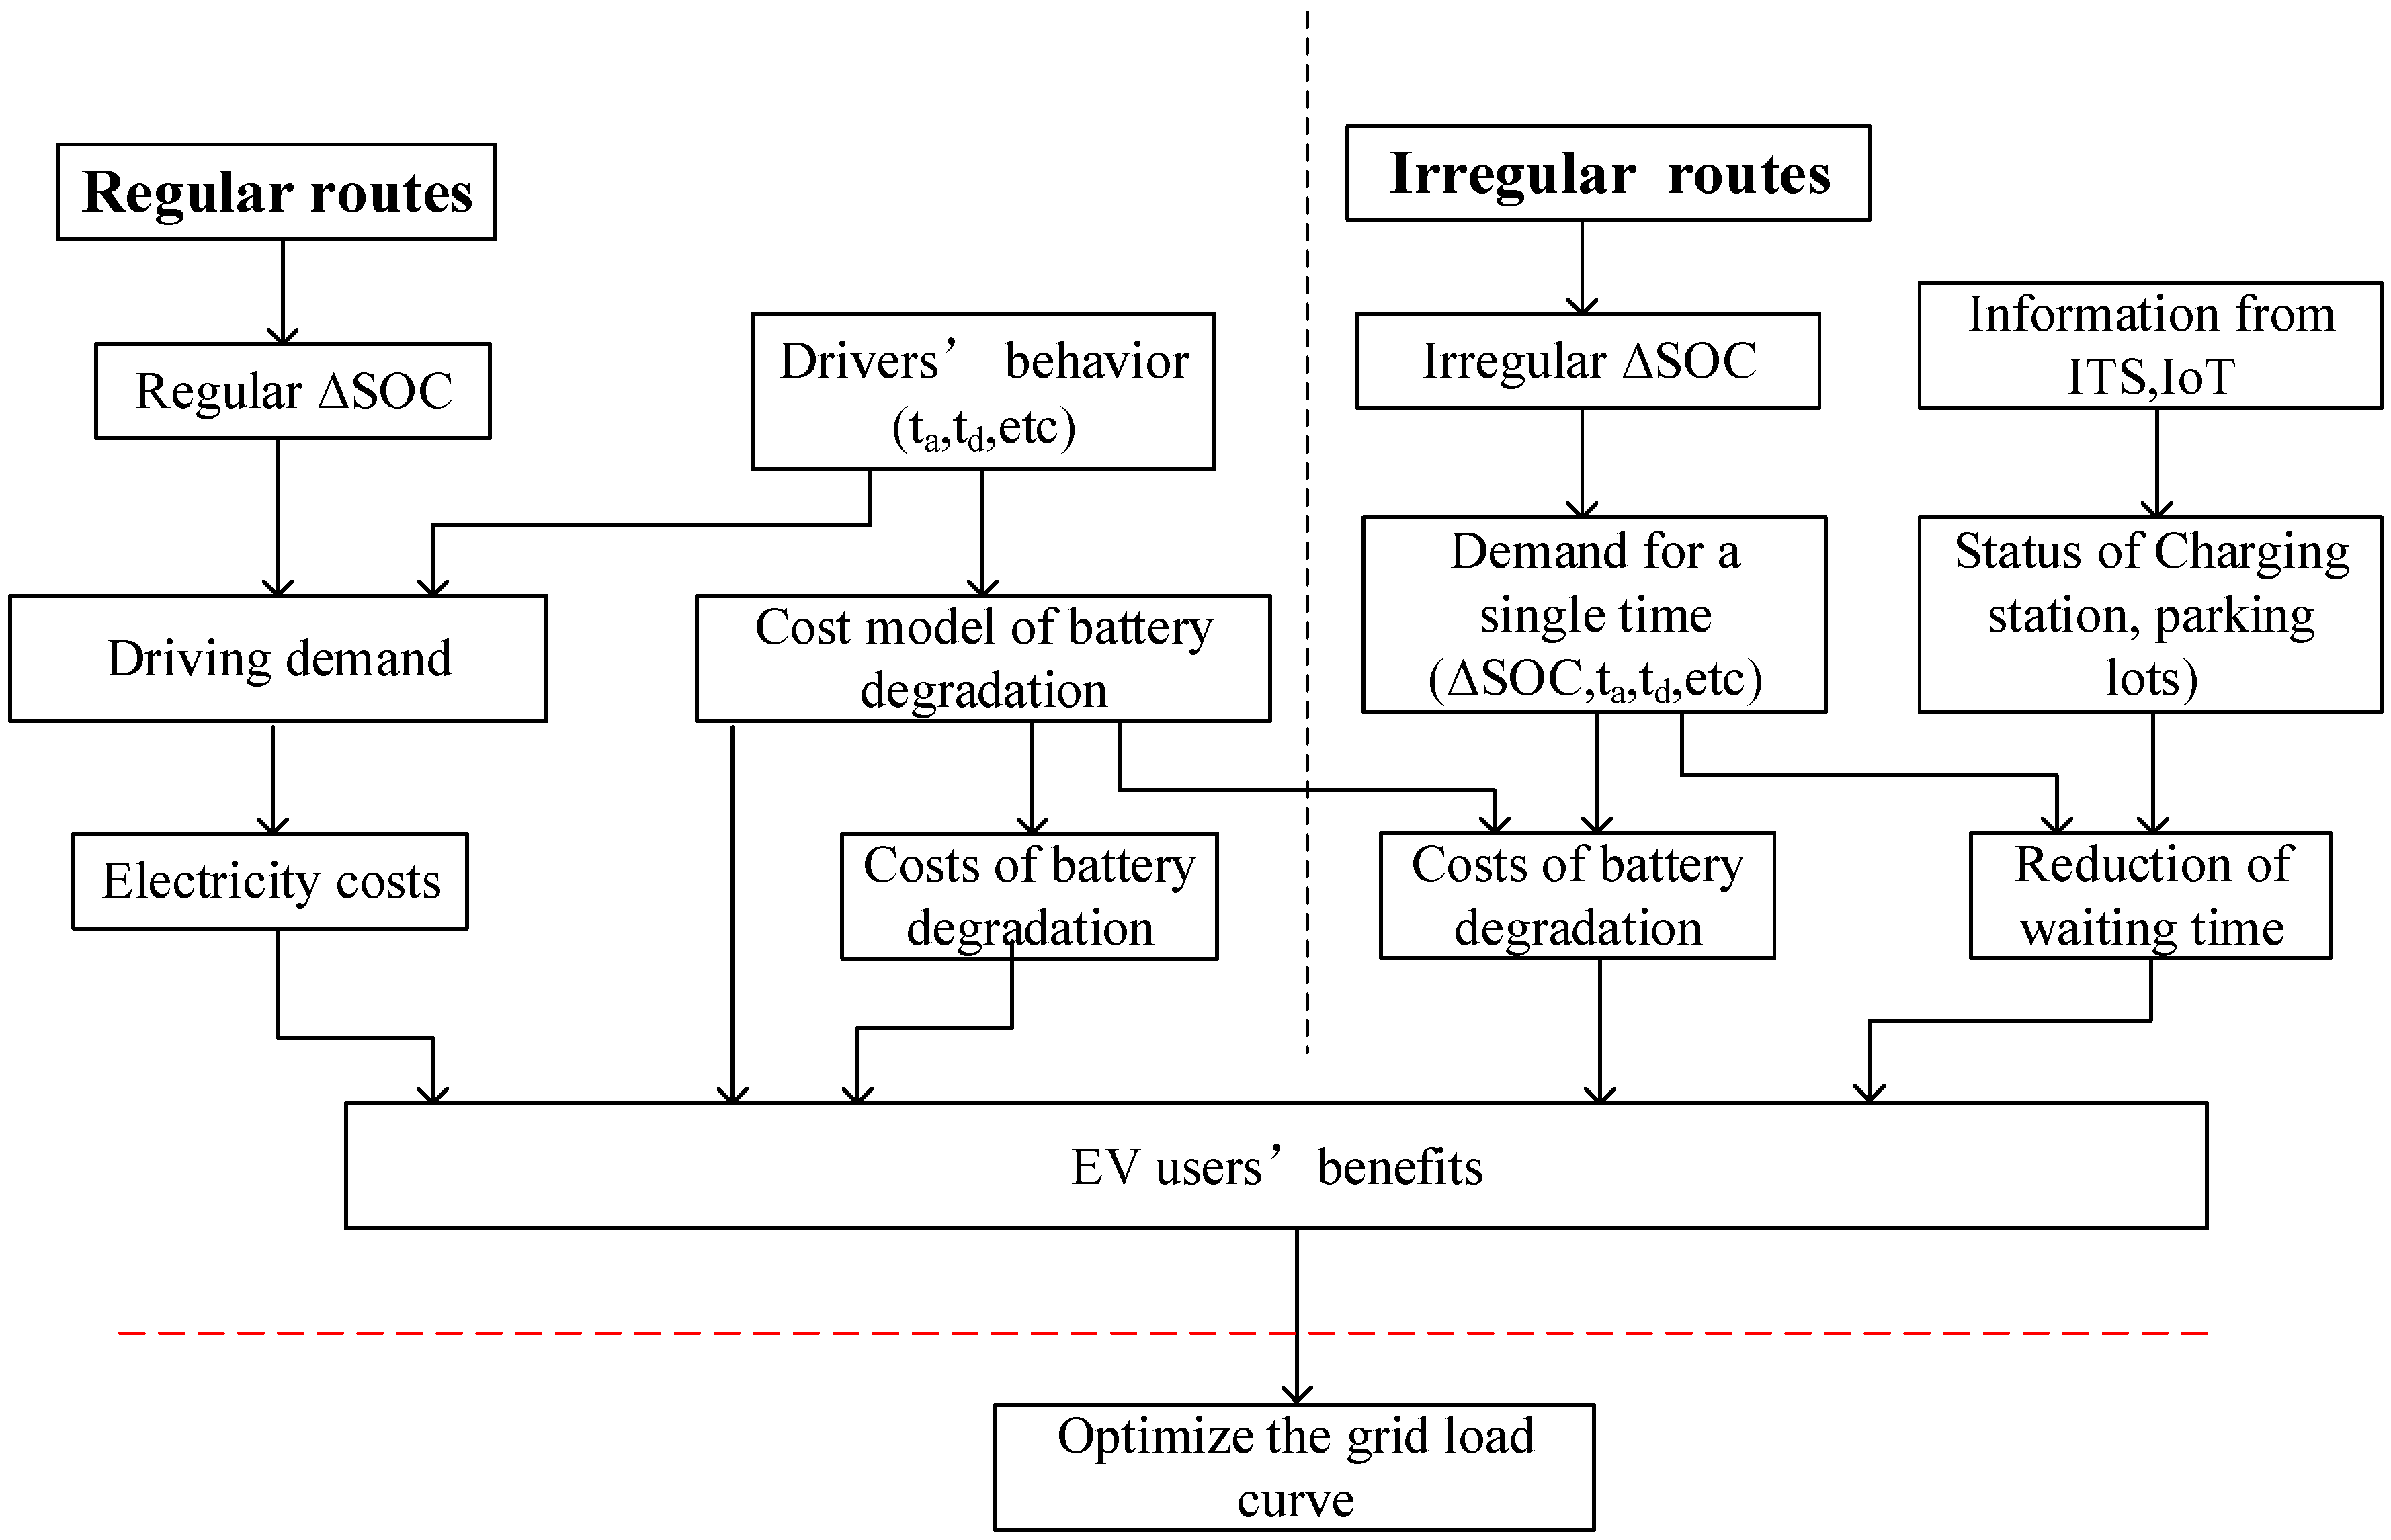
Figure 2.
(a) Battery capacity retention rate versus equivalent full cycles of batteries cycling at 50% mean SOC; (b) battery capacity retention rate versus charging times of batteries cycling at 50% mean SOC; (c) battery capacity retention rate versus equivalent full cycles of batteries cycling at 60% ΔSOC; and (d) battery capacity retention rate versus number of charging times of batteries cycling at 60% ΔSOC.

Figure 3.
Beijing peak-valley TOU electricity rate for charging.
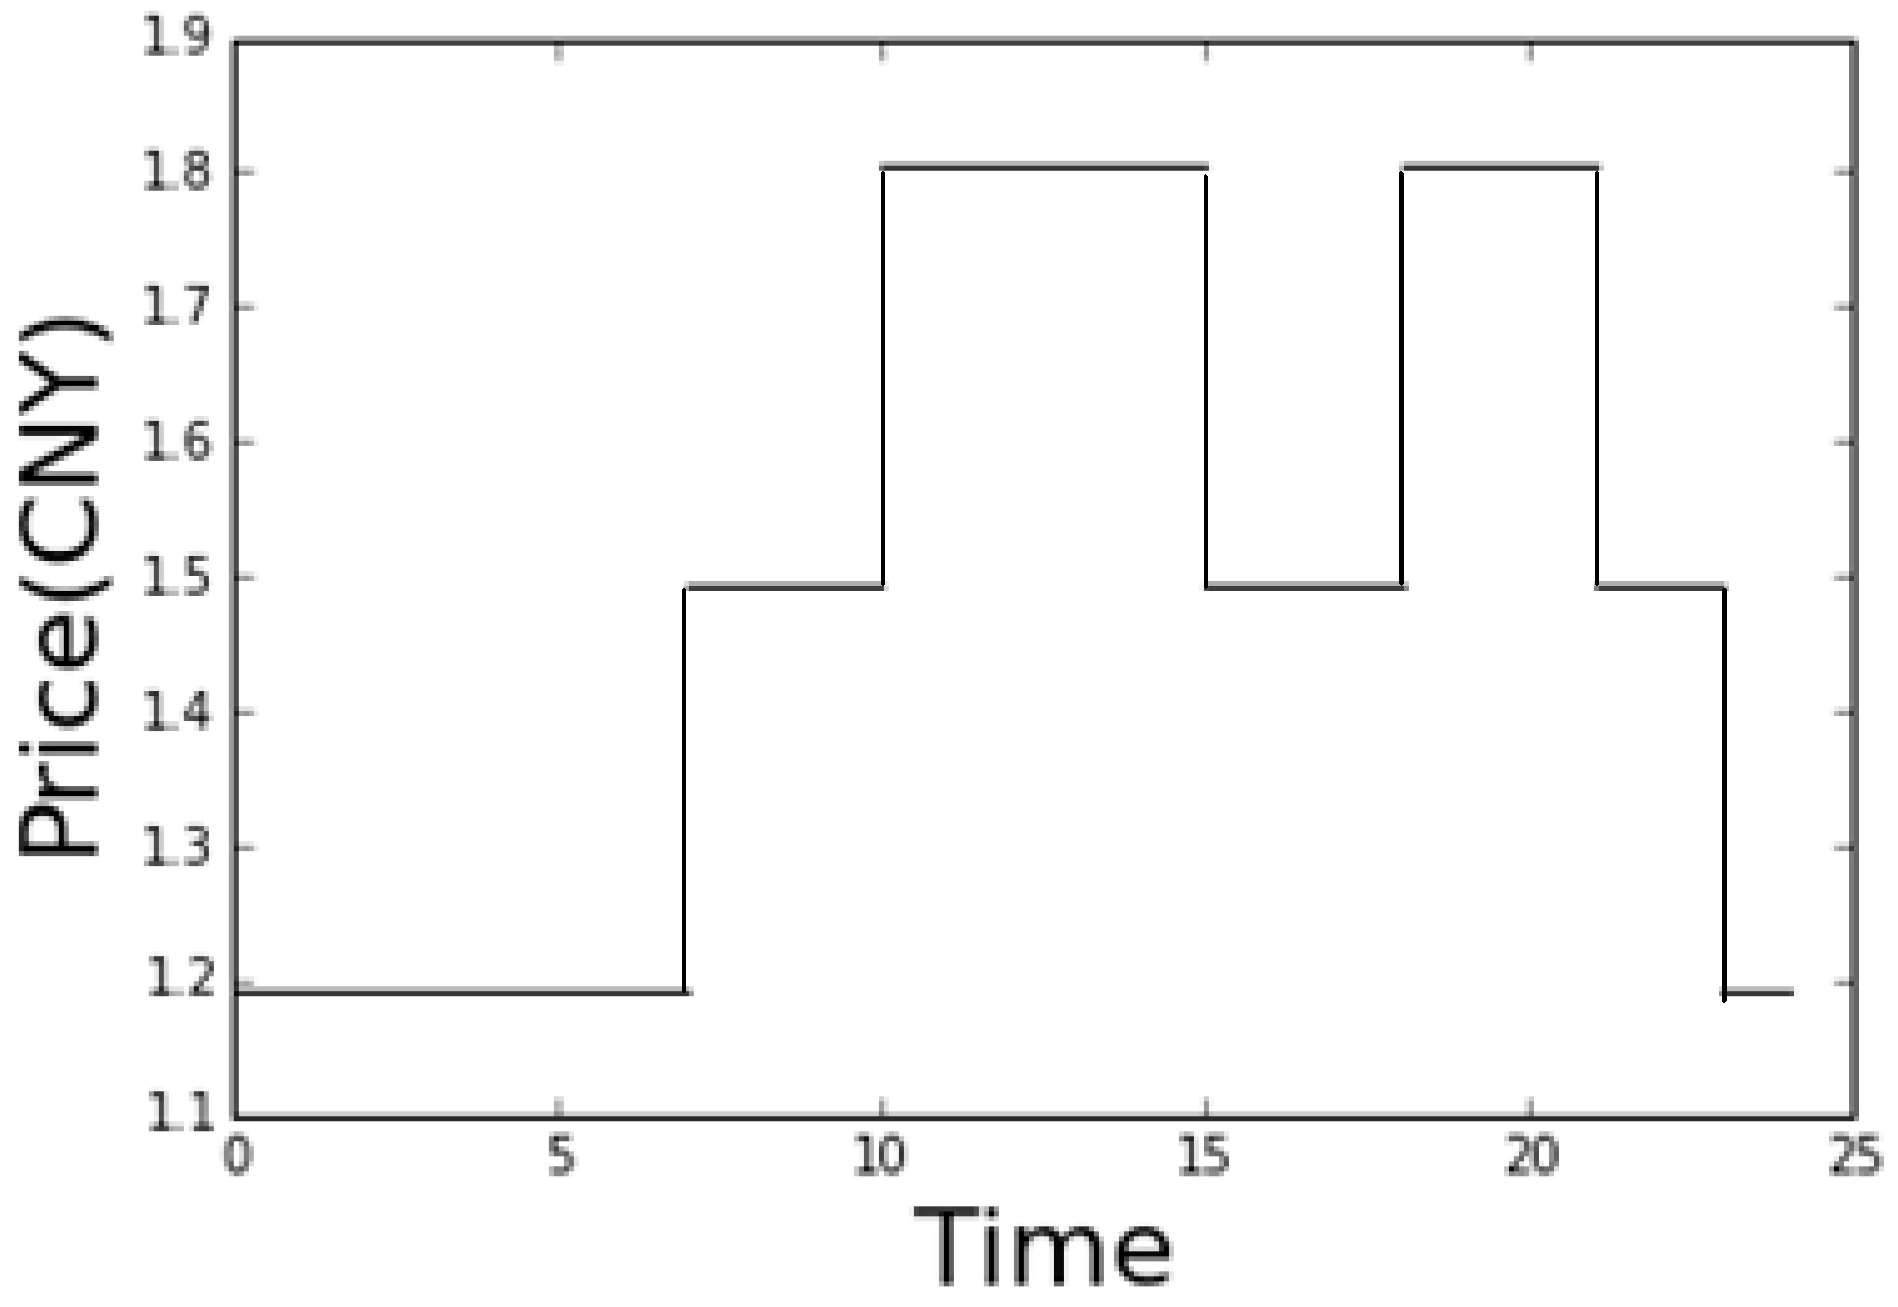
Figure 4.
Flowchart of the artificial fish swarm algorithm.
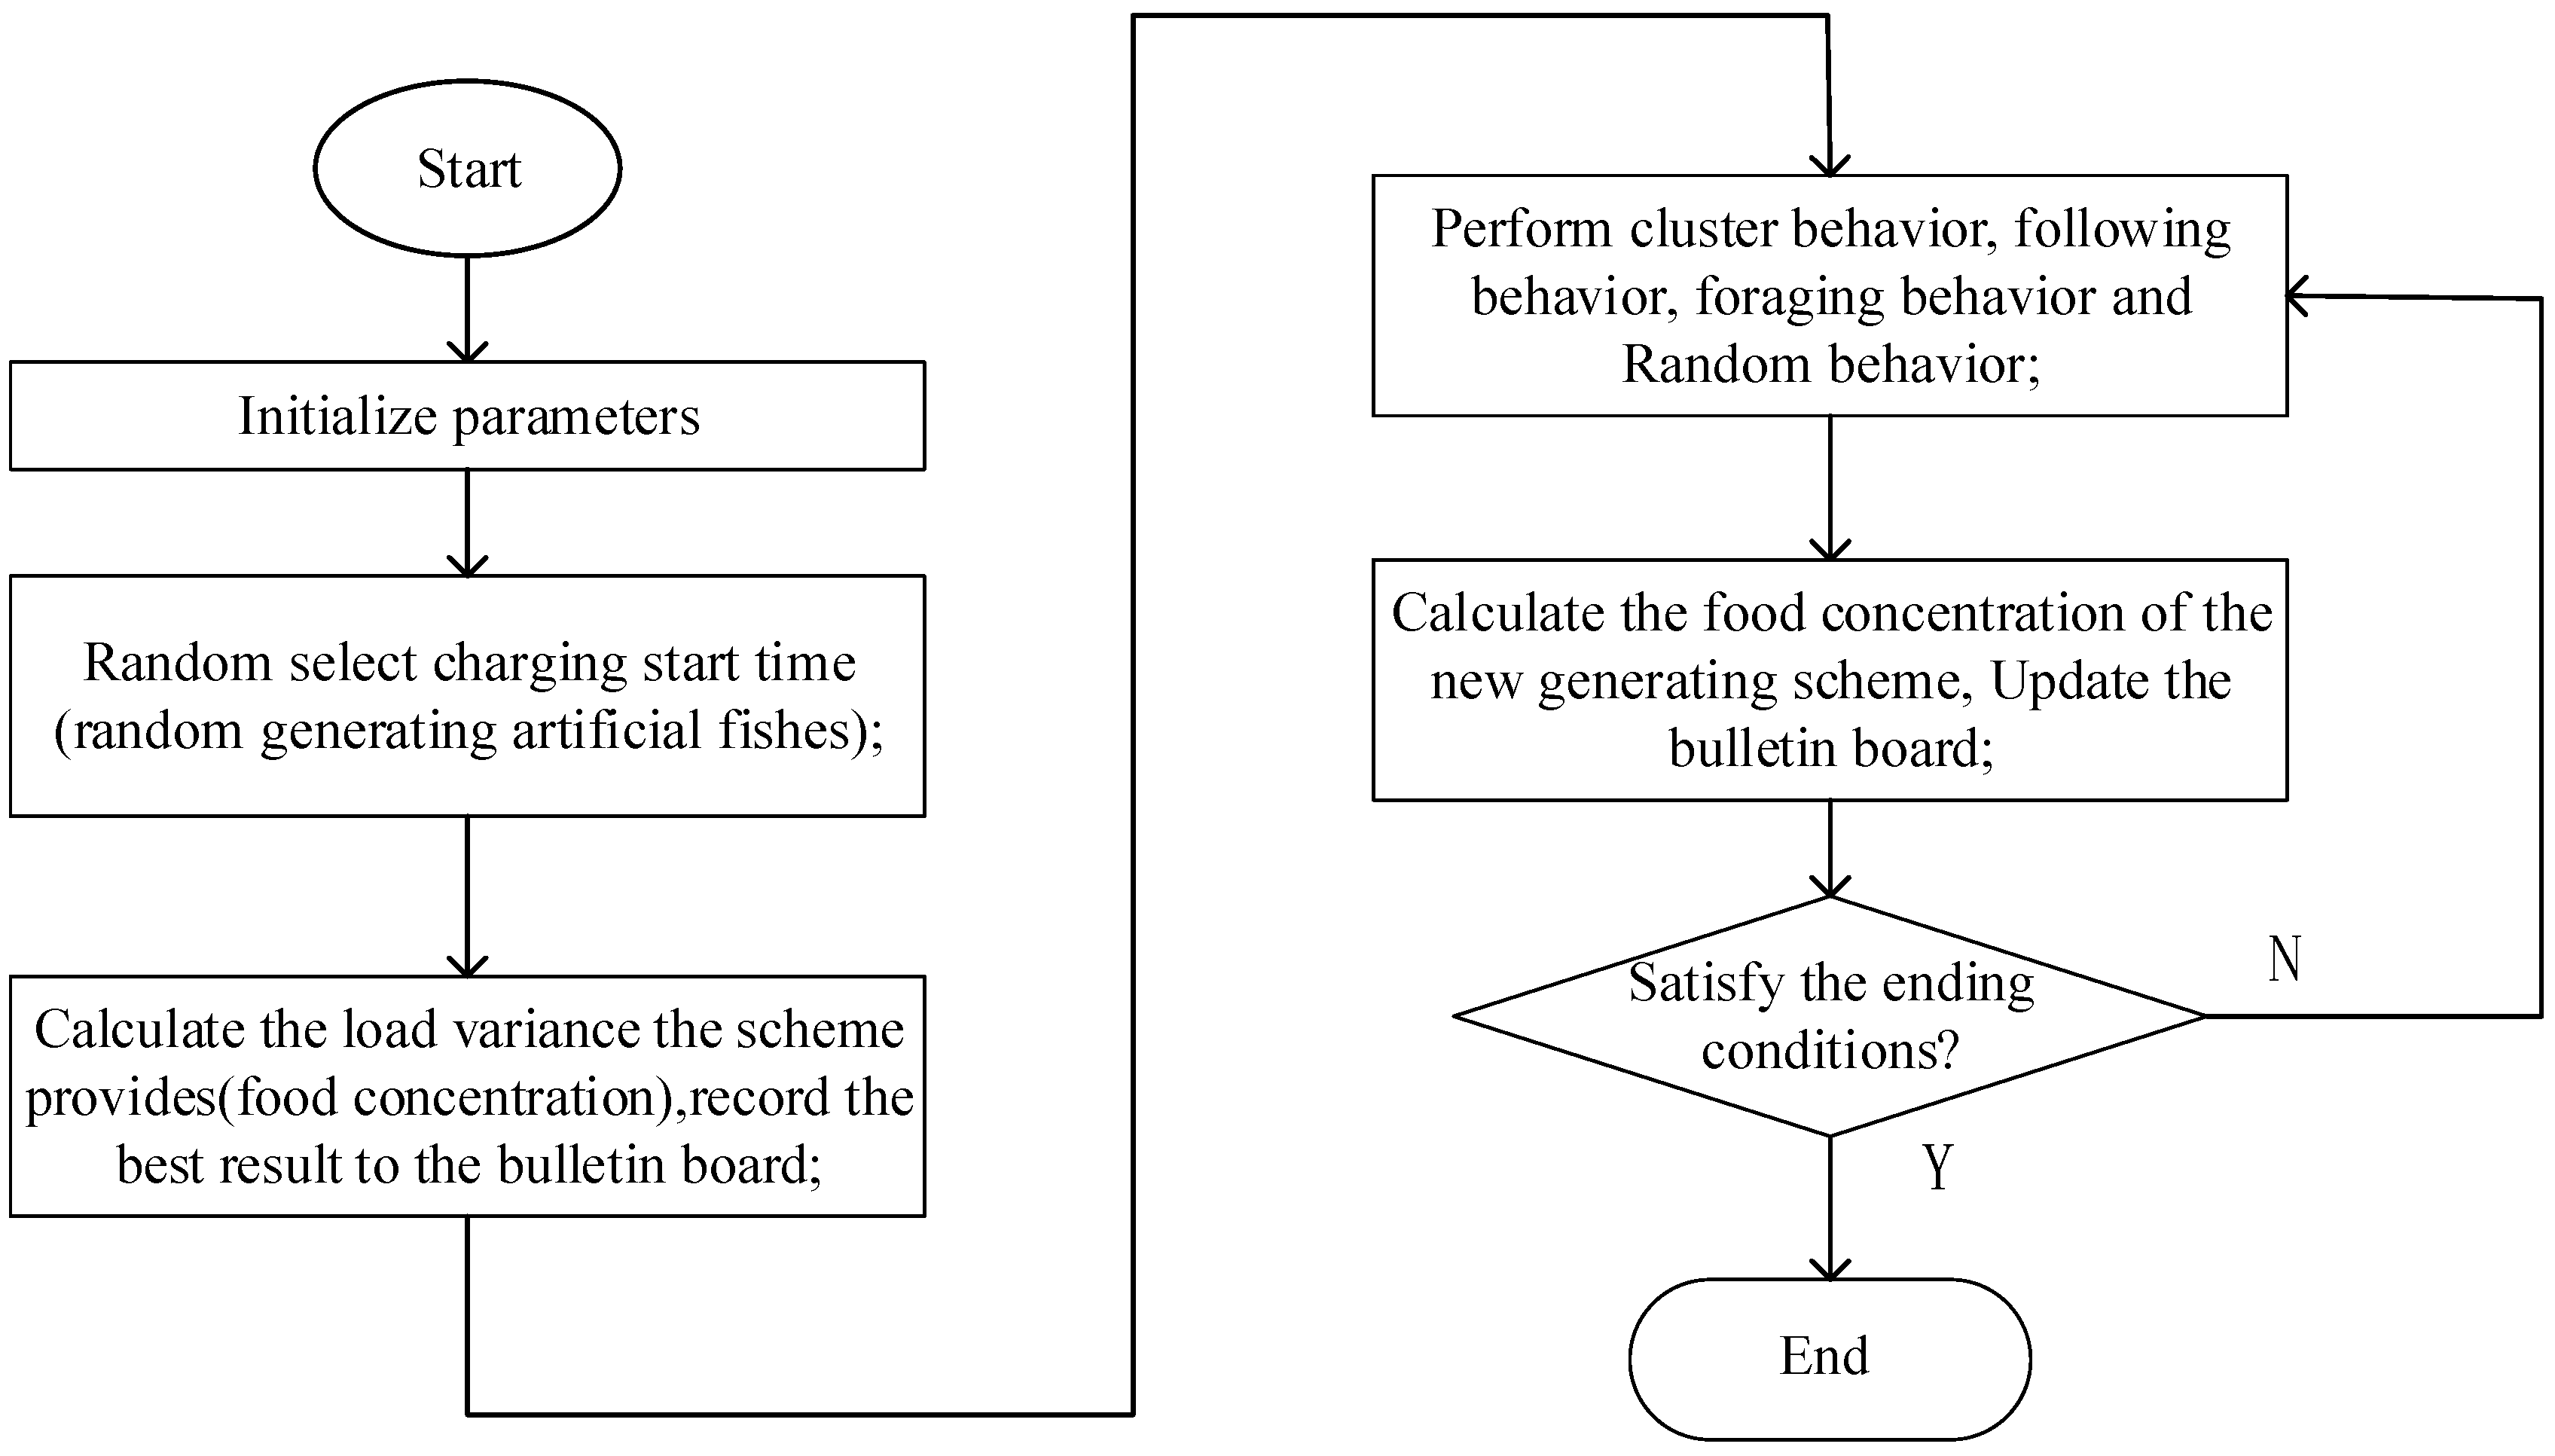
Figure 5.
Queuing system optimization.

Figure 6.
Arrival time and departure time distribution: (a) arrival time; and (b) departure time.

Figure 7.
Operating cost comparison of one time charging: (a) costs of battery capacity degradation comparison; and (b) electricity costs comparison.
Figure 7.
Operating cost comparison of one time charging: (a) costs of battery capacity degradation comparison; and (b) electricity costs comparison.

Figure 8.
Optimization of the distribution network load.
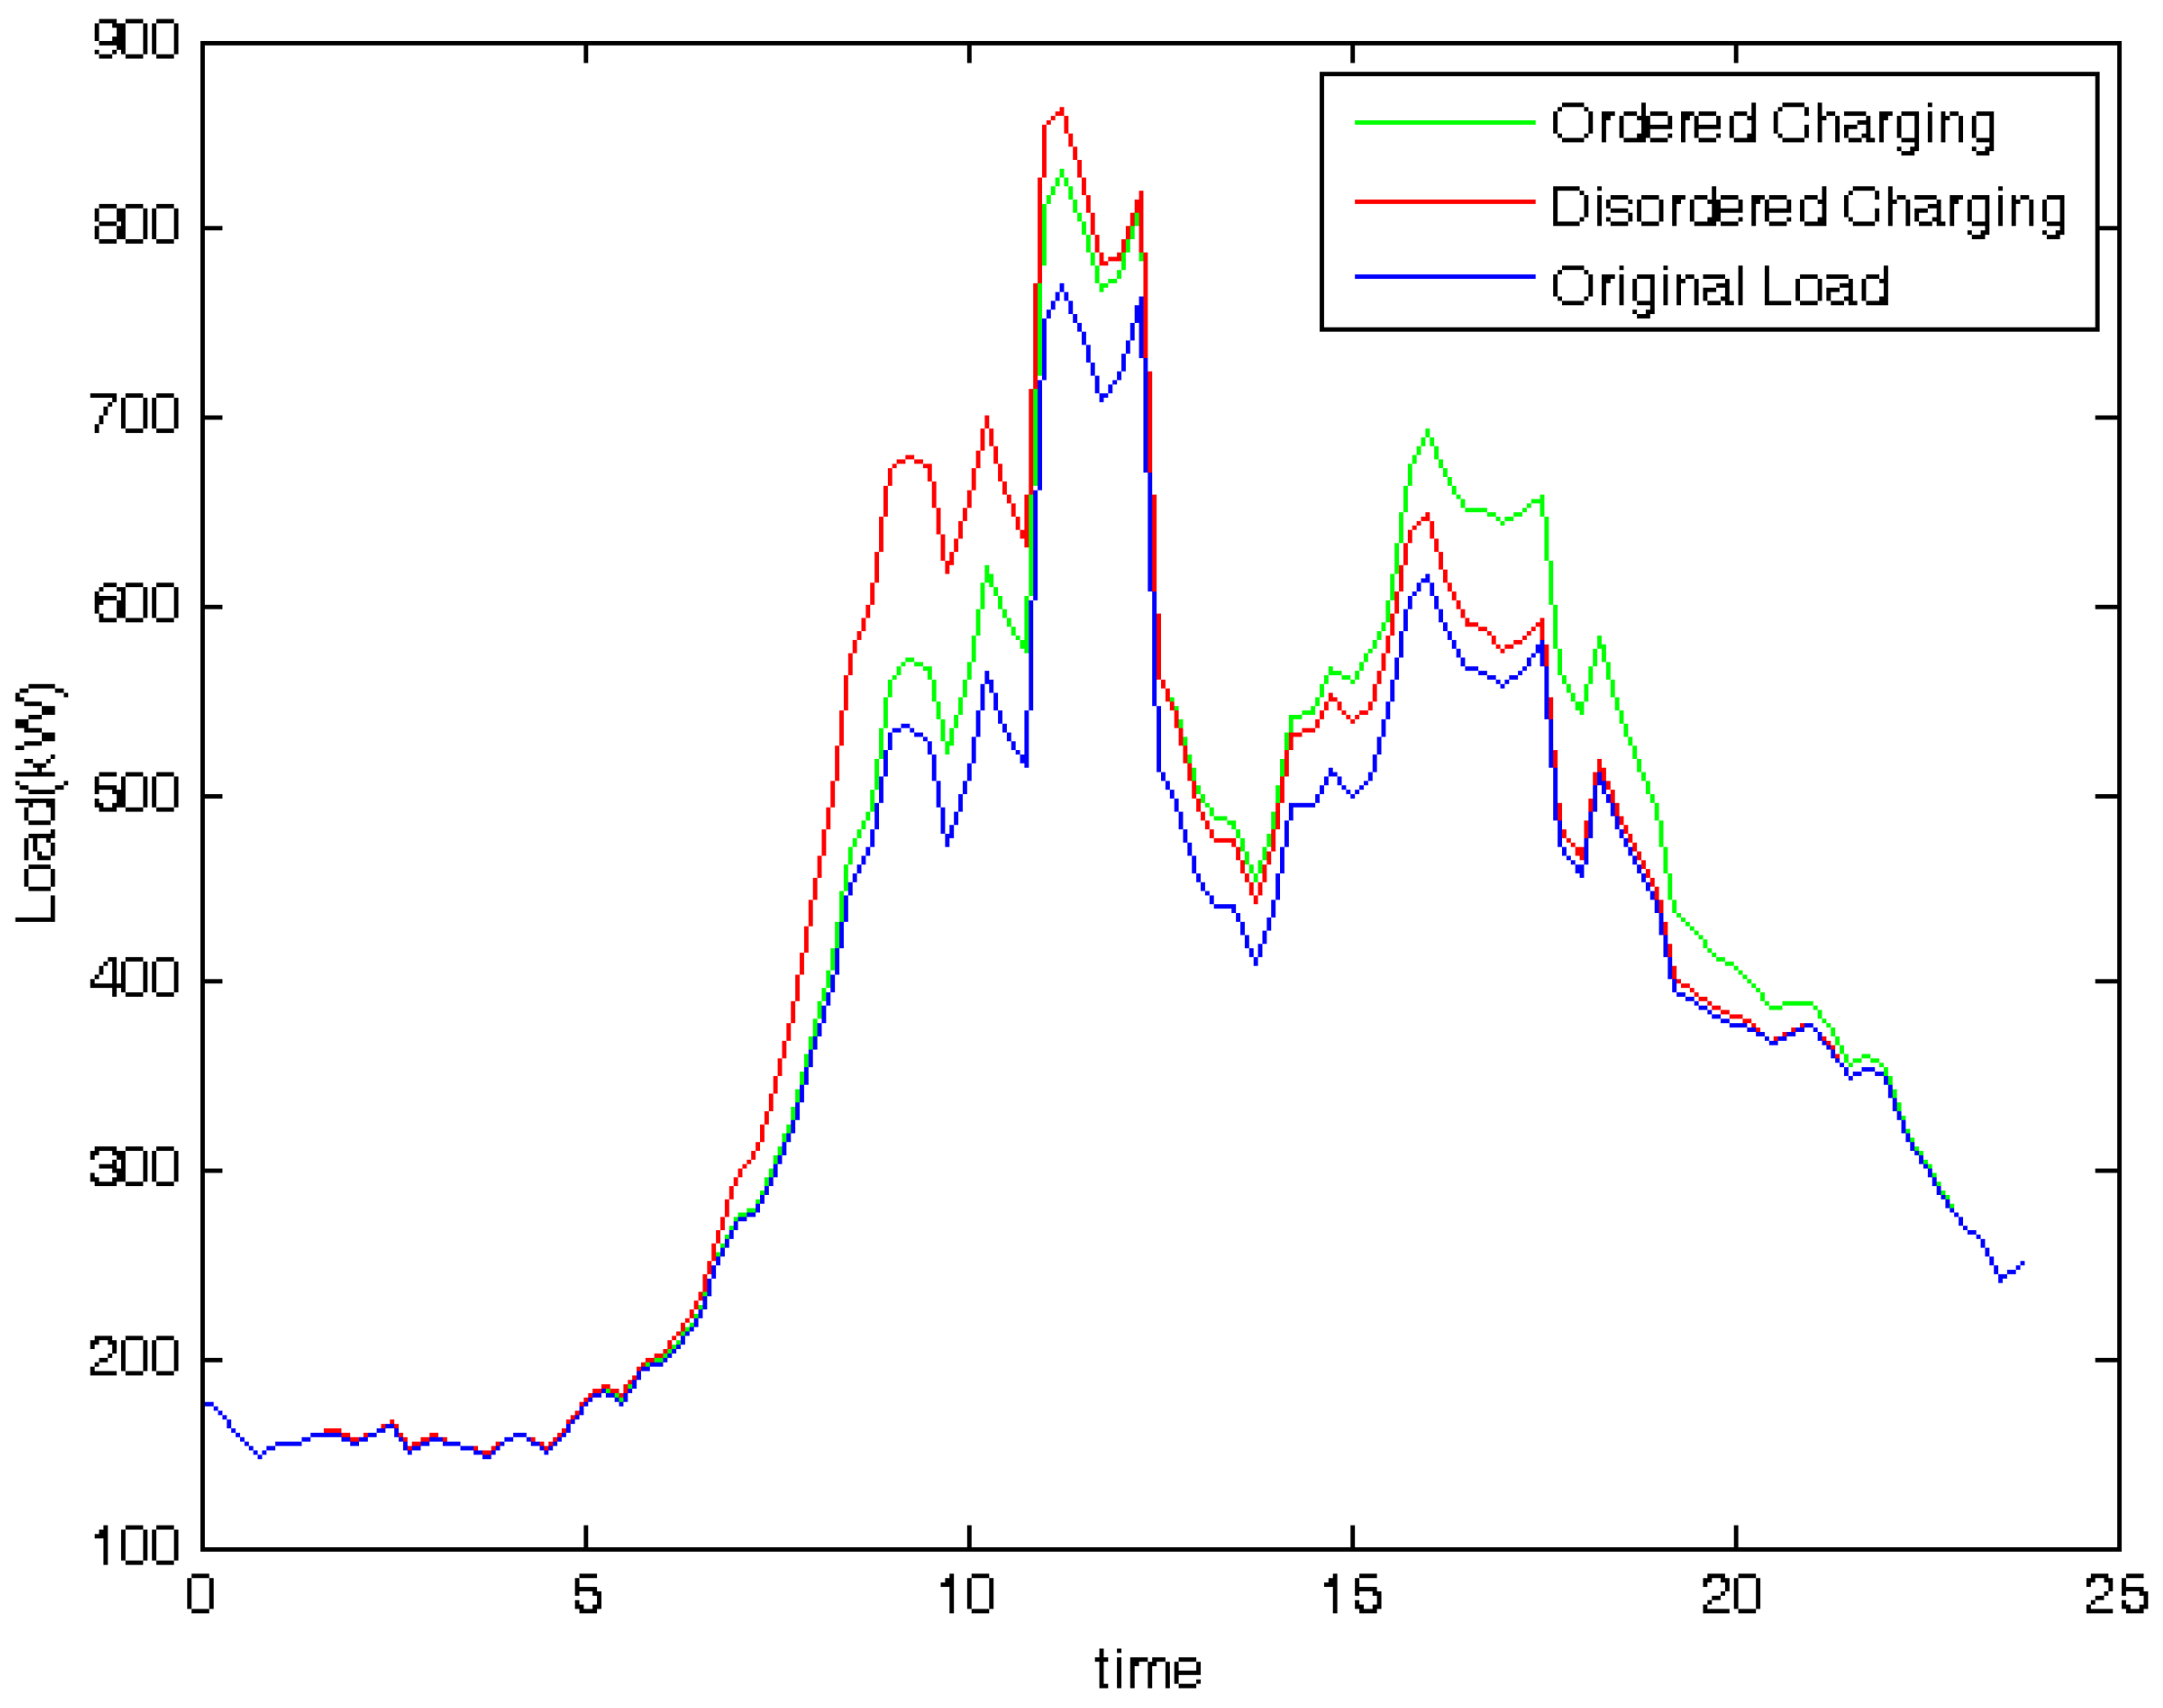
Figure 9.
Geographical placement of the shopping mall and charging stations.
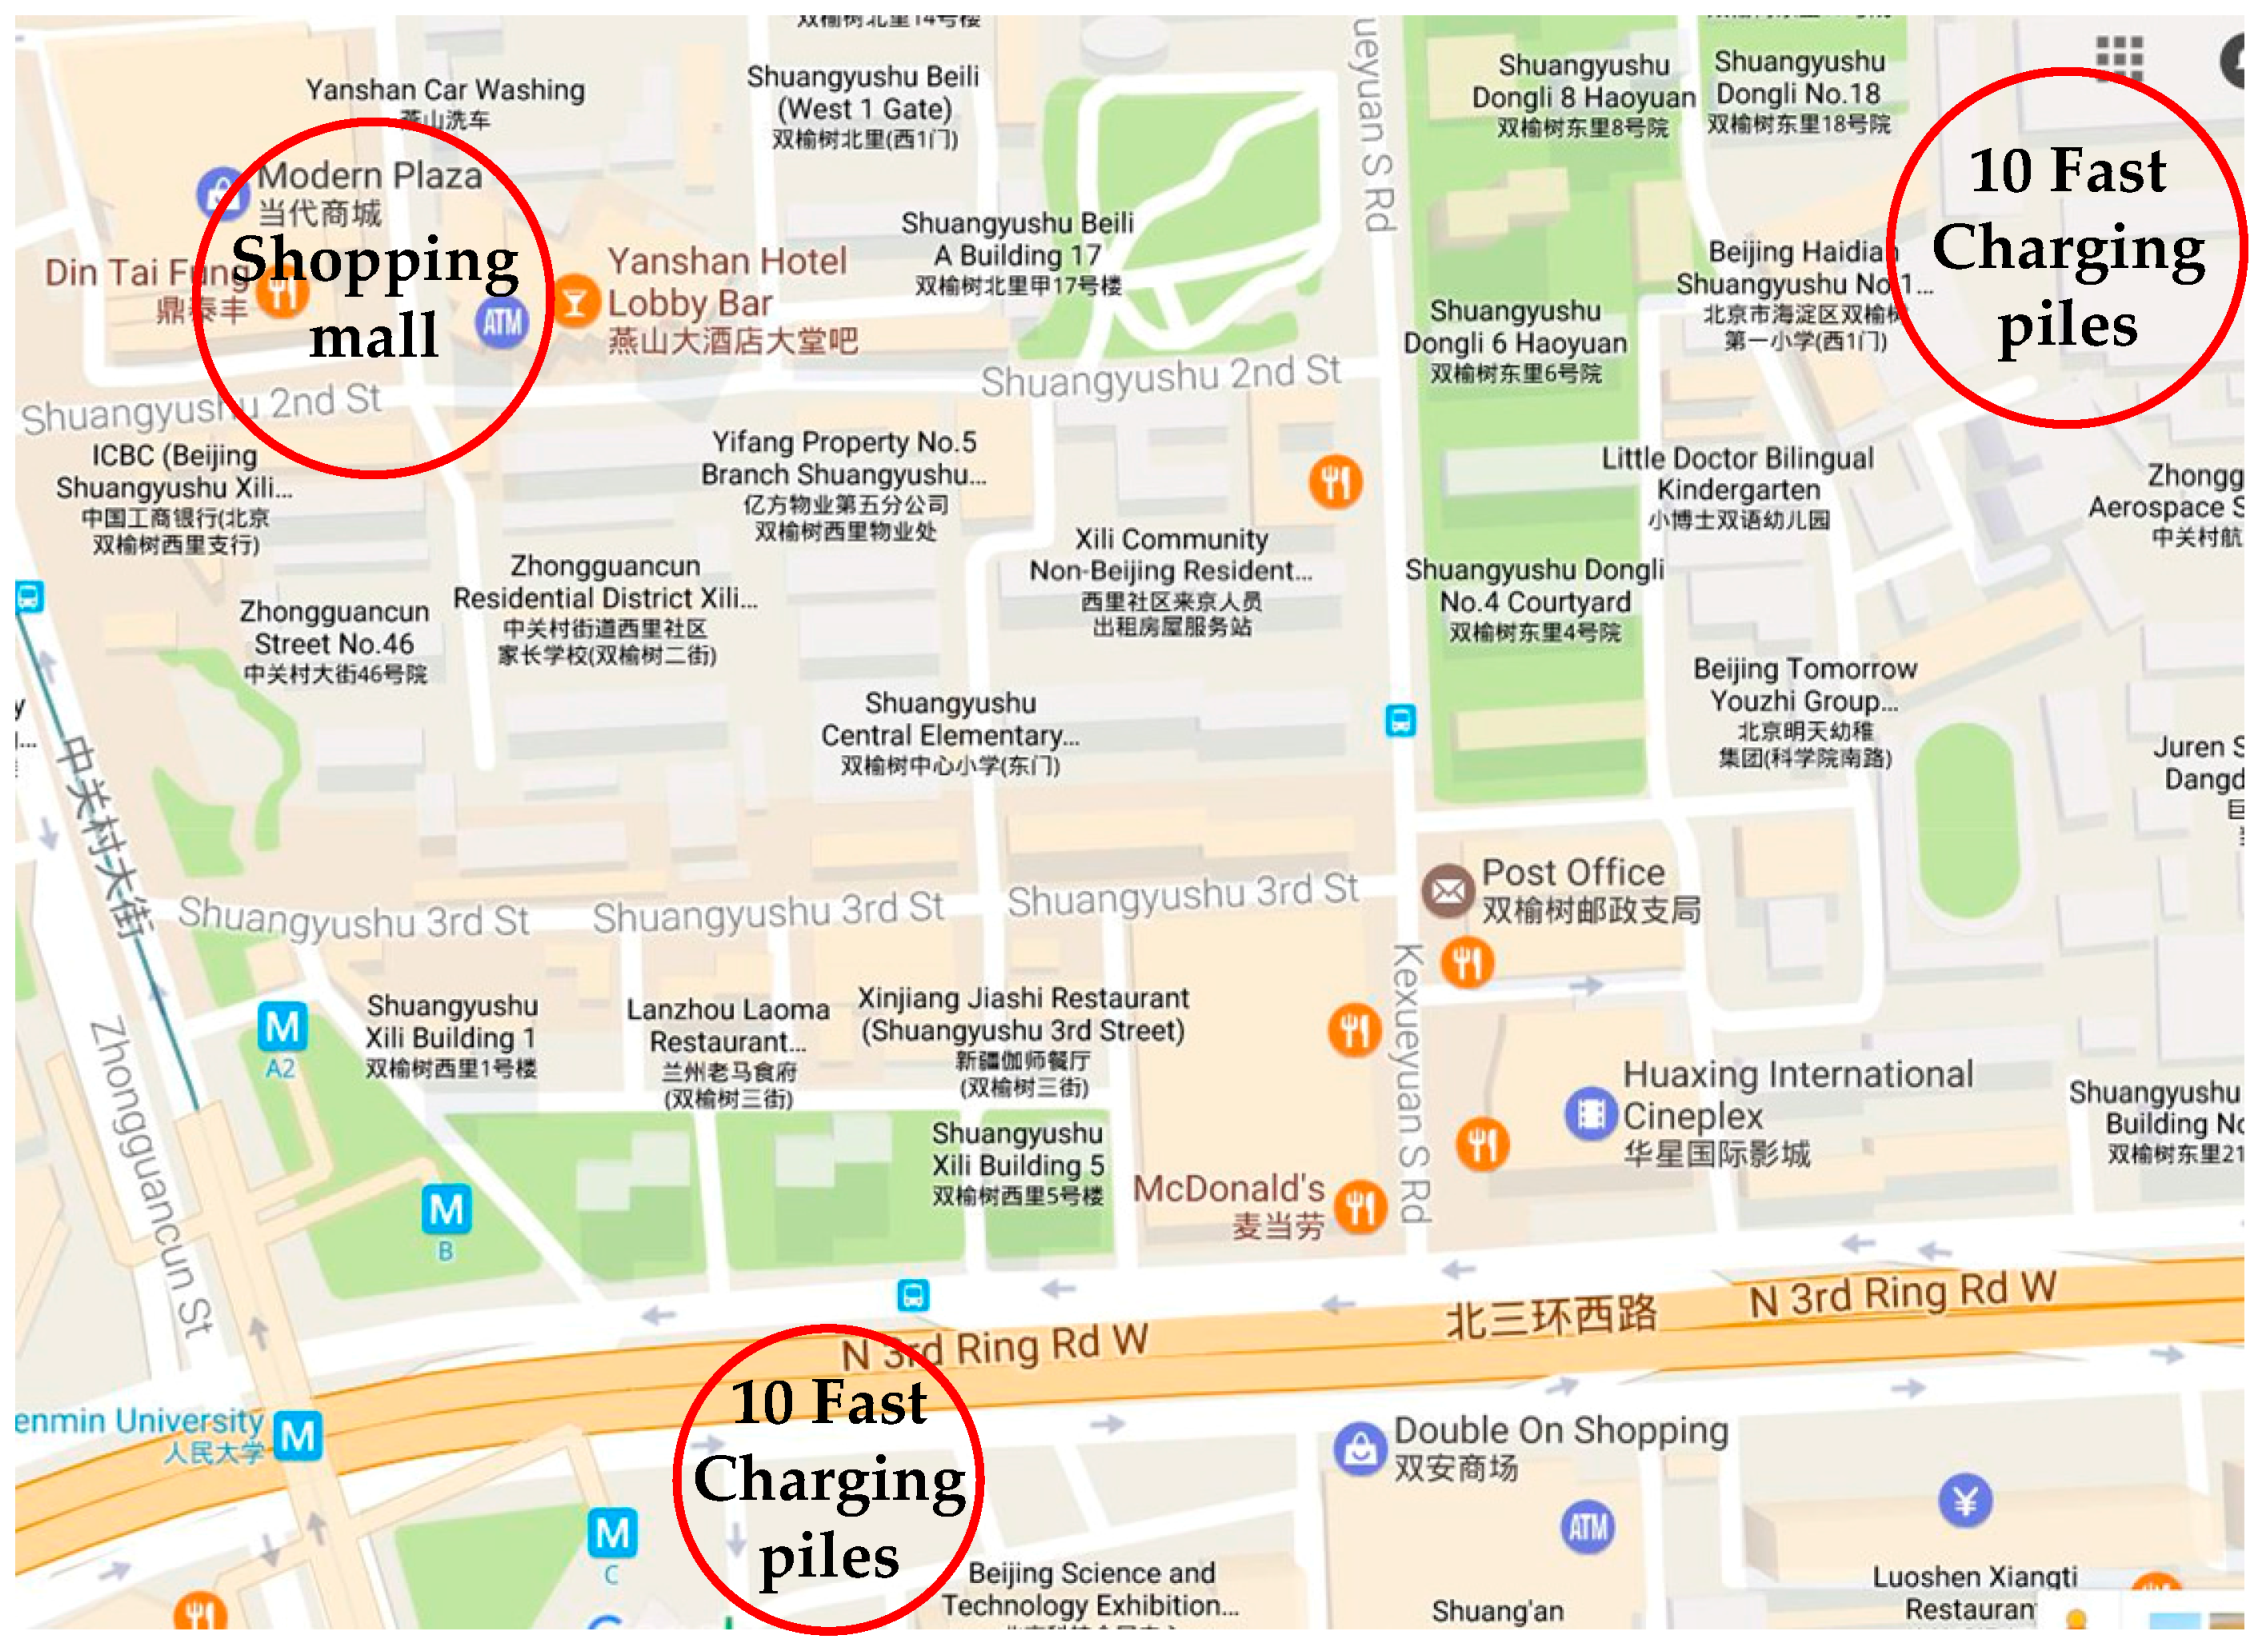
Figure 10.
Average waiting time distribution comparison of ordered charging and disordered charging.
Figure 10.
Average waiting time distribution comparison of ordered charging and disordered charging.

Figure 11.
Cost of battery degradation and average waiting time comparison of ordered charging and disordered charging: (a) cost of battery degradation; and (b) average waiting time.
Figure 11.
Cost of battery degradation and average waiting time comparison of ordered charging and disordered charging: (a) cost of battery degradation; and (b) average waiting time.


Table 1.
Parameters and sales volume of top popular EVs in China.
| Vehicle Type | Capacity (kWh) | Consumption (kWh/100 km) | Sales in 2016 |
|---|---|---|---|
| BYD e6 | 82 | 19.5 | 20605 |
| BAIC E-Series EV | 25.6 | 15 | 18814 |
| BAIC EU260 EV | 41.4 | 15.9 | 18805 |
| Geely Emgrand | 41 | 15.8 | 17181 |
Table 2.
Operating cost comparison of one time charging.
| Operating Costs | DC | OC |
|---|---|---|
| Cost of Battery Degradation (USD) | 0.94 | 0.17 |
| Electricity Cost (USD) | 0.51 | 0.46 |
Table 3.
Load variance comparison of disordered charging and ordered charging.
| Method | Variance | Peak (kW) | Valley (kW) |
|---|---|---|---|
| DC | 4098 | 864.0 | 442.2 |
| OC | 3885 | 822.7 | 464.7 |
| Orignal load | 3016 | 741.0 | 409.4 |
© 2017 by the authors. Licensee MDPI, Basel, Switzerland. This article is an open access article distributed under the terms and conditions of the Creative Commons Attribution (CC BY) license (http://creativecommons.org/licenses/by/4.0/).
Share and Cite
MDPI and ACS Style
Su, S.; Li, H.; Gao, D.W. Optimal Planning of Charging for Plug-In Electric Vehicles Focusing on Users’ Benefits. Energies 2017, 10, 952. https://doi.org/10.3390/en10070952
AMA Style
Su S, Li H, Gao DW. Optimal Planning of Charging for Plug-In Electric Vehicles Focusing on Users’ Benefits. Energies. 2017; 10(7):952. https://doi.org/10.3390/en10070952
Chicago/Turabian StyleSu, Su, Hao Li, and David Wenzhong Gao. 2017. "Optimal Planning of Charging for Plug-In Electric Vehicles Focusing on Users’ Benefits" Energies 10, no. 7: 952. https://doi.org/10.3390/en10070952
Note that from the first issue of 2016, this journal uses article numbers instead of page numbers. See further details here.