Article

Power Balancing Control for Grid Energy Storage System in Photovoltaic Applications—Real Time Digital Simulation Implementation

by
Sridhar Vavilapalli
1,
Sanjeevikumar Padmanaban
2,*,
Umashankar Subramaniam
1 and
Lucian Mihet-Popa
3
1
Department of Energy and Power Electronics, School of Electrical Engineering, VIT University, Vellore 632014, India
2
Department of Electrical and Electronics Engineering, University of Johannesburg, Auckland, Johannesburg 2006, South Africa
3
Faculty of Engineering, Østfold University College, Kobberslagerstredet 5, 1671 Kråkeroy, Fredrikstad, Norway
*
Author to whom correspondence should be addressed.
Energies 2017, 10(7), 928; https://doi.org/10.3390/en10070928
Submission received: 19 May 2017 / Revised: 29 June 2017 / Accepted: 30 June 2017 / Published: 5 July 2017

Abstract

:
A grid energy storage system for photo voltaic (PV) applications contains three different power sources i.e., PV array, battery storage system and the grid. It is advisable to isolate these three different sources to ensure the equipment safety. The configuration proposed in this paper provides complete isolation between the three sources. A Power Balancing Control (PBC) method for this configuration is proposed to operate the system in three different modes of operation. Control of a dual active bridge (DAB)-based battery charger which provides a galvanic isolation between batteries and other sources is explained briefly. Various modes of operation of a grid energy storage system are also presented in this paper. Hardware-In-the-Loop (HIL) simulation is carried out to check the performance of the system and the PBC algorithm. A power circuit (comprised of the inverter, dual active bridge based battery charger, grid, PV cell, batteries, contactors, and switches) is simulated and the controller hardware and user interface panel are connected as HIL with the simulated power circuit through Real Time Digital Simulator (RTDS). HIL simulation results are presented to explain the control operation, steady-state performance in different modes of operation and the dynamic response of the system.

1. Introduction

In solar power plants, active power transfers from the photo voltaic (PV) array to the grid during daytime and the array loses its power generating capability during nighttime or when the solar irradiation is weak. To also supply power to the grid during nighttime, energy storage is required. Since the power requirements during nighttime are usually much lower than those during the daytime, energy storage with 25% of the PV array rated power may be selected for 24-h operation. A block diagram of a grid energy storage system in a solar PV power plant is shown in Figure 1.
The different modes of operation of the above system are explained below:
Mode1:
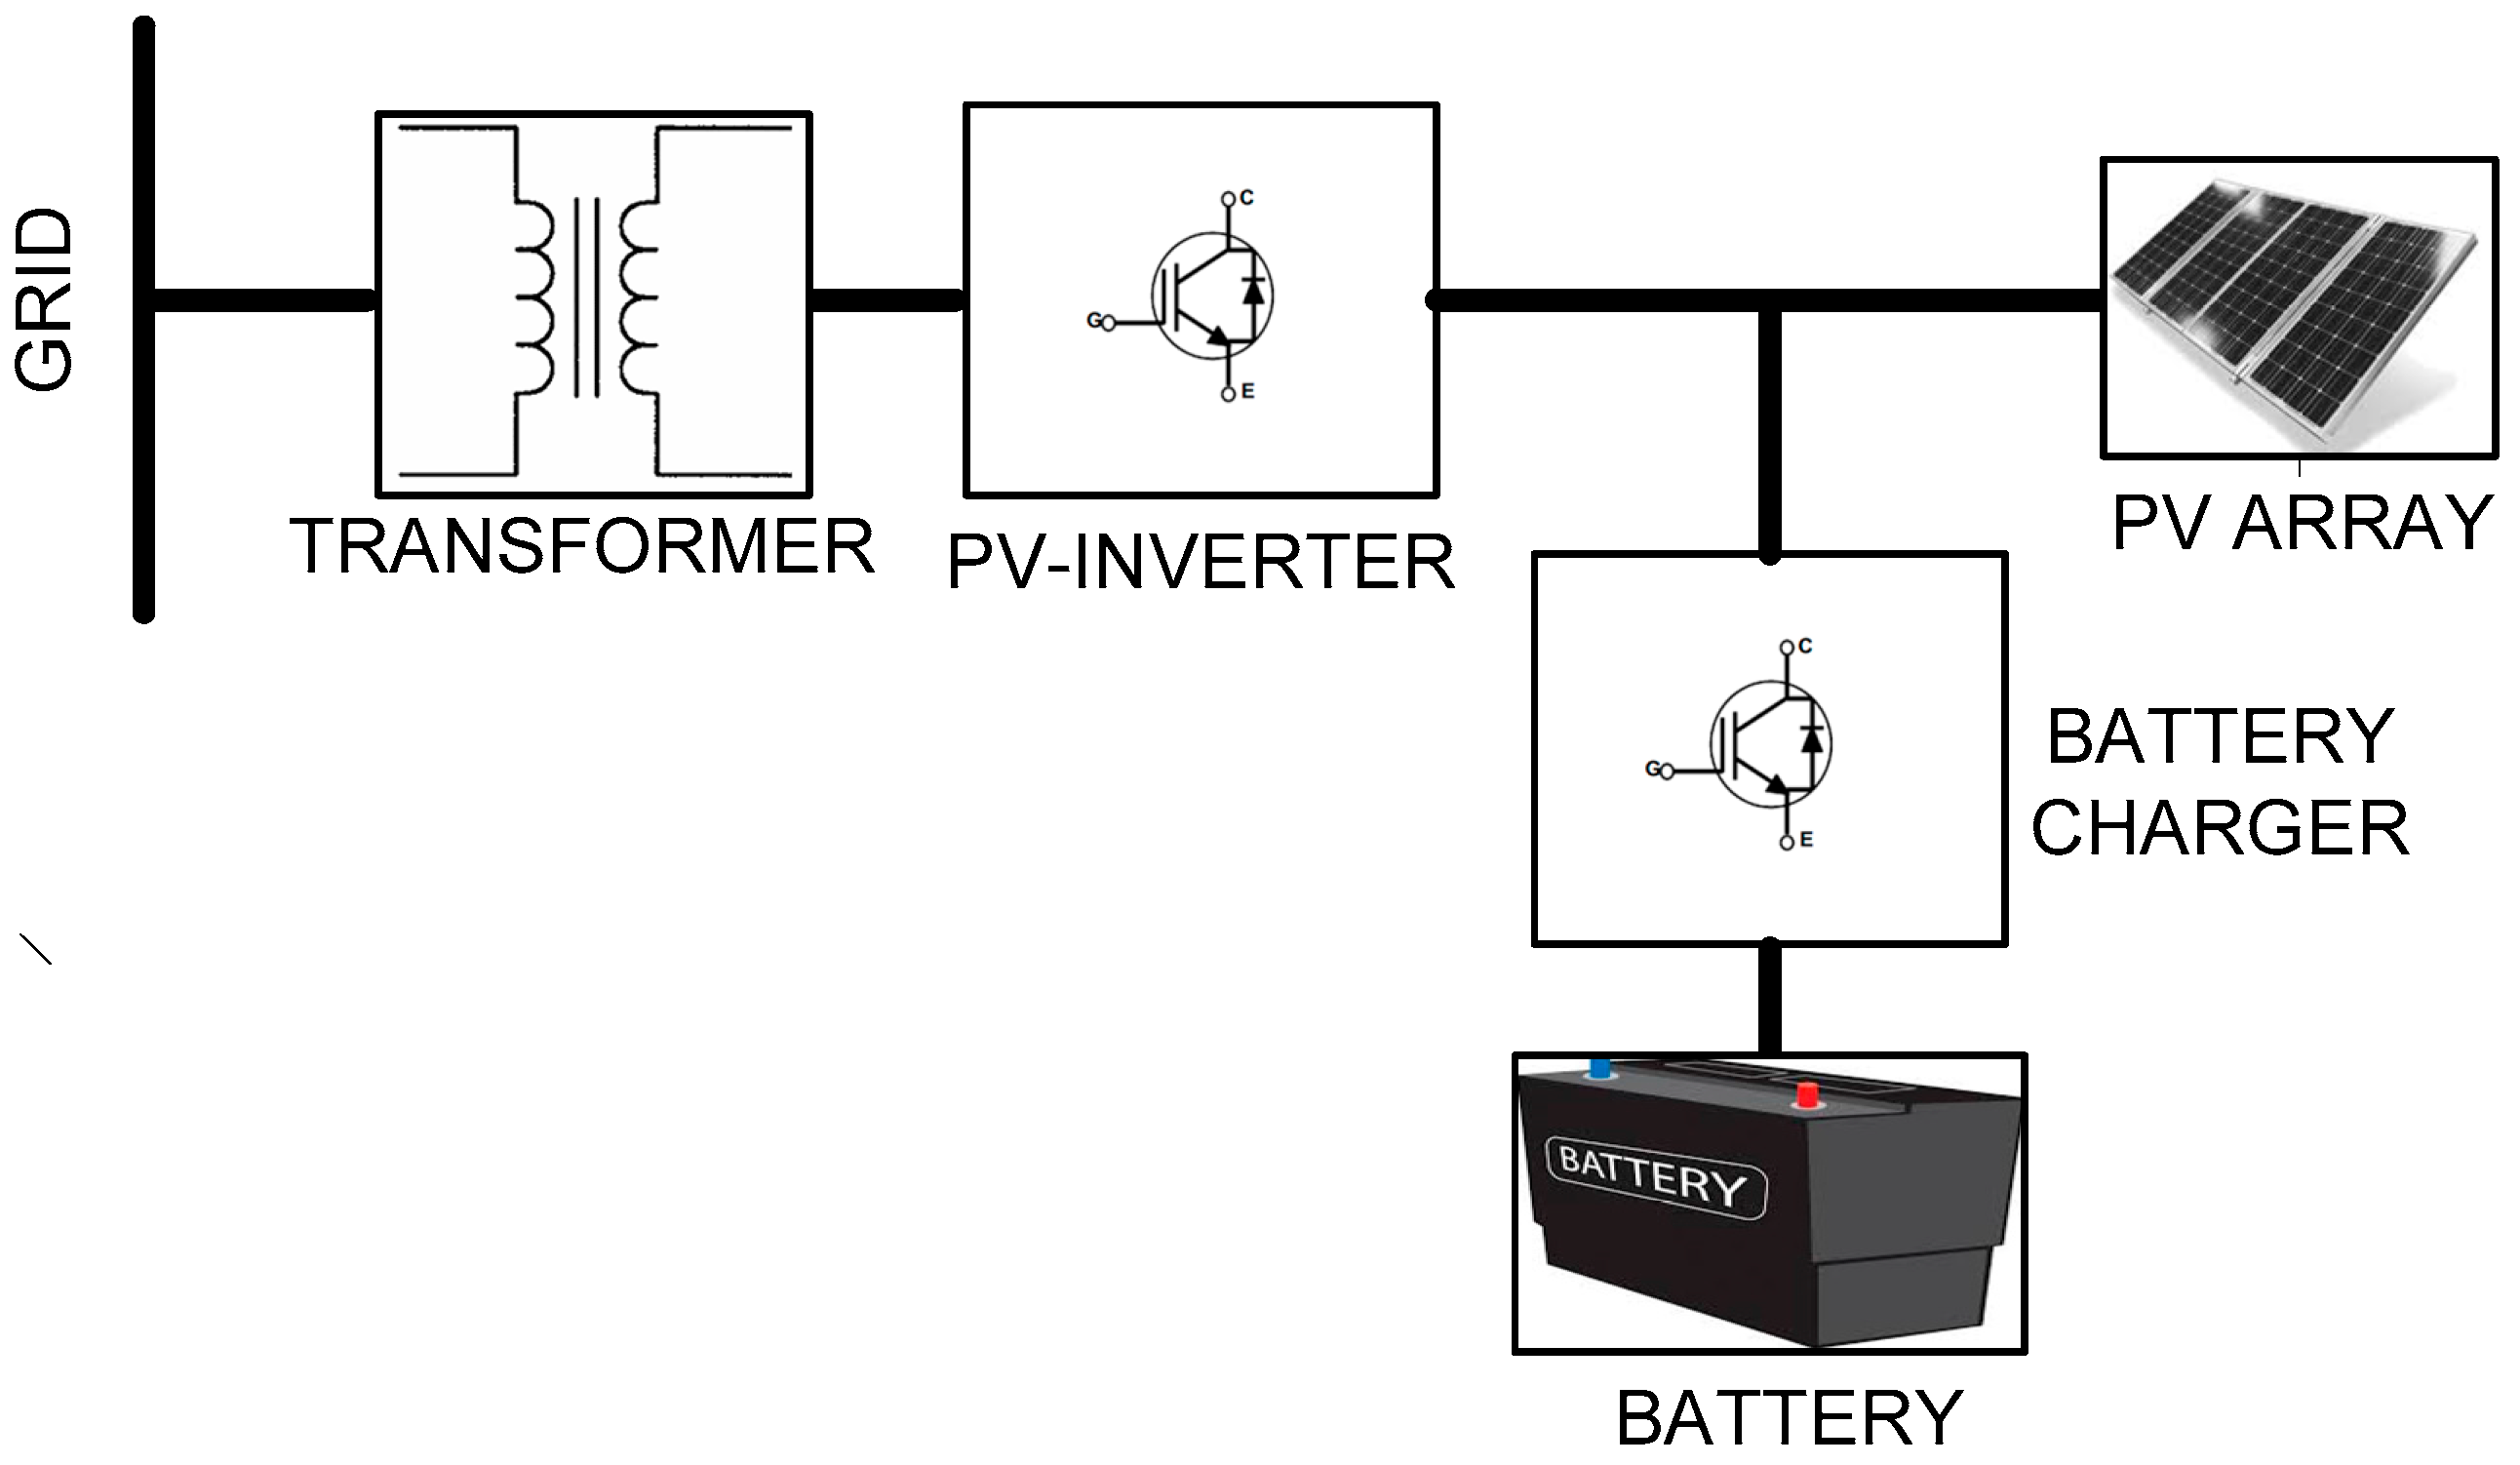
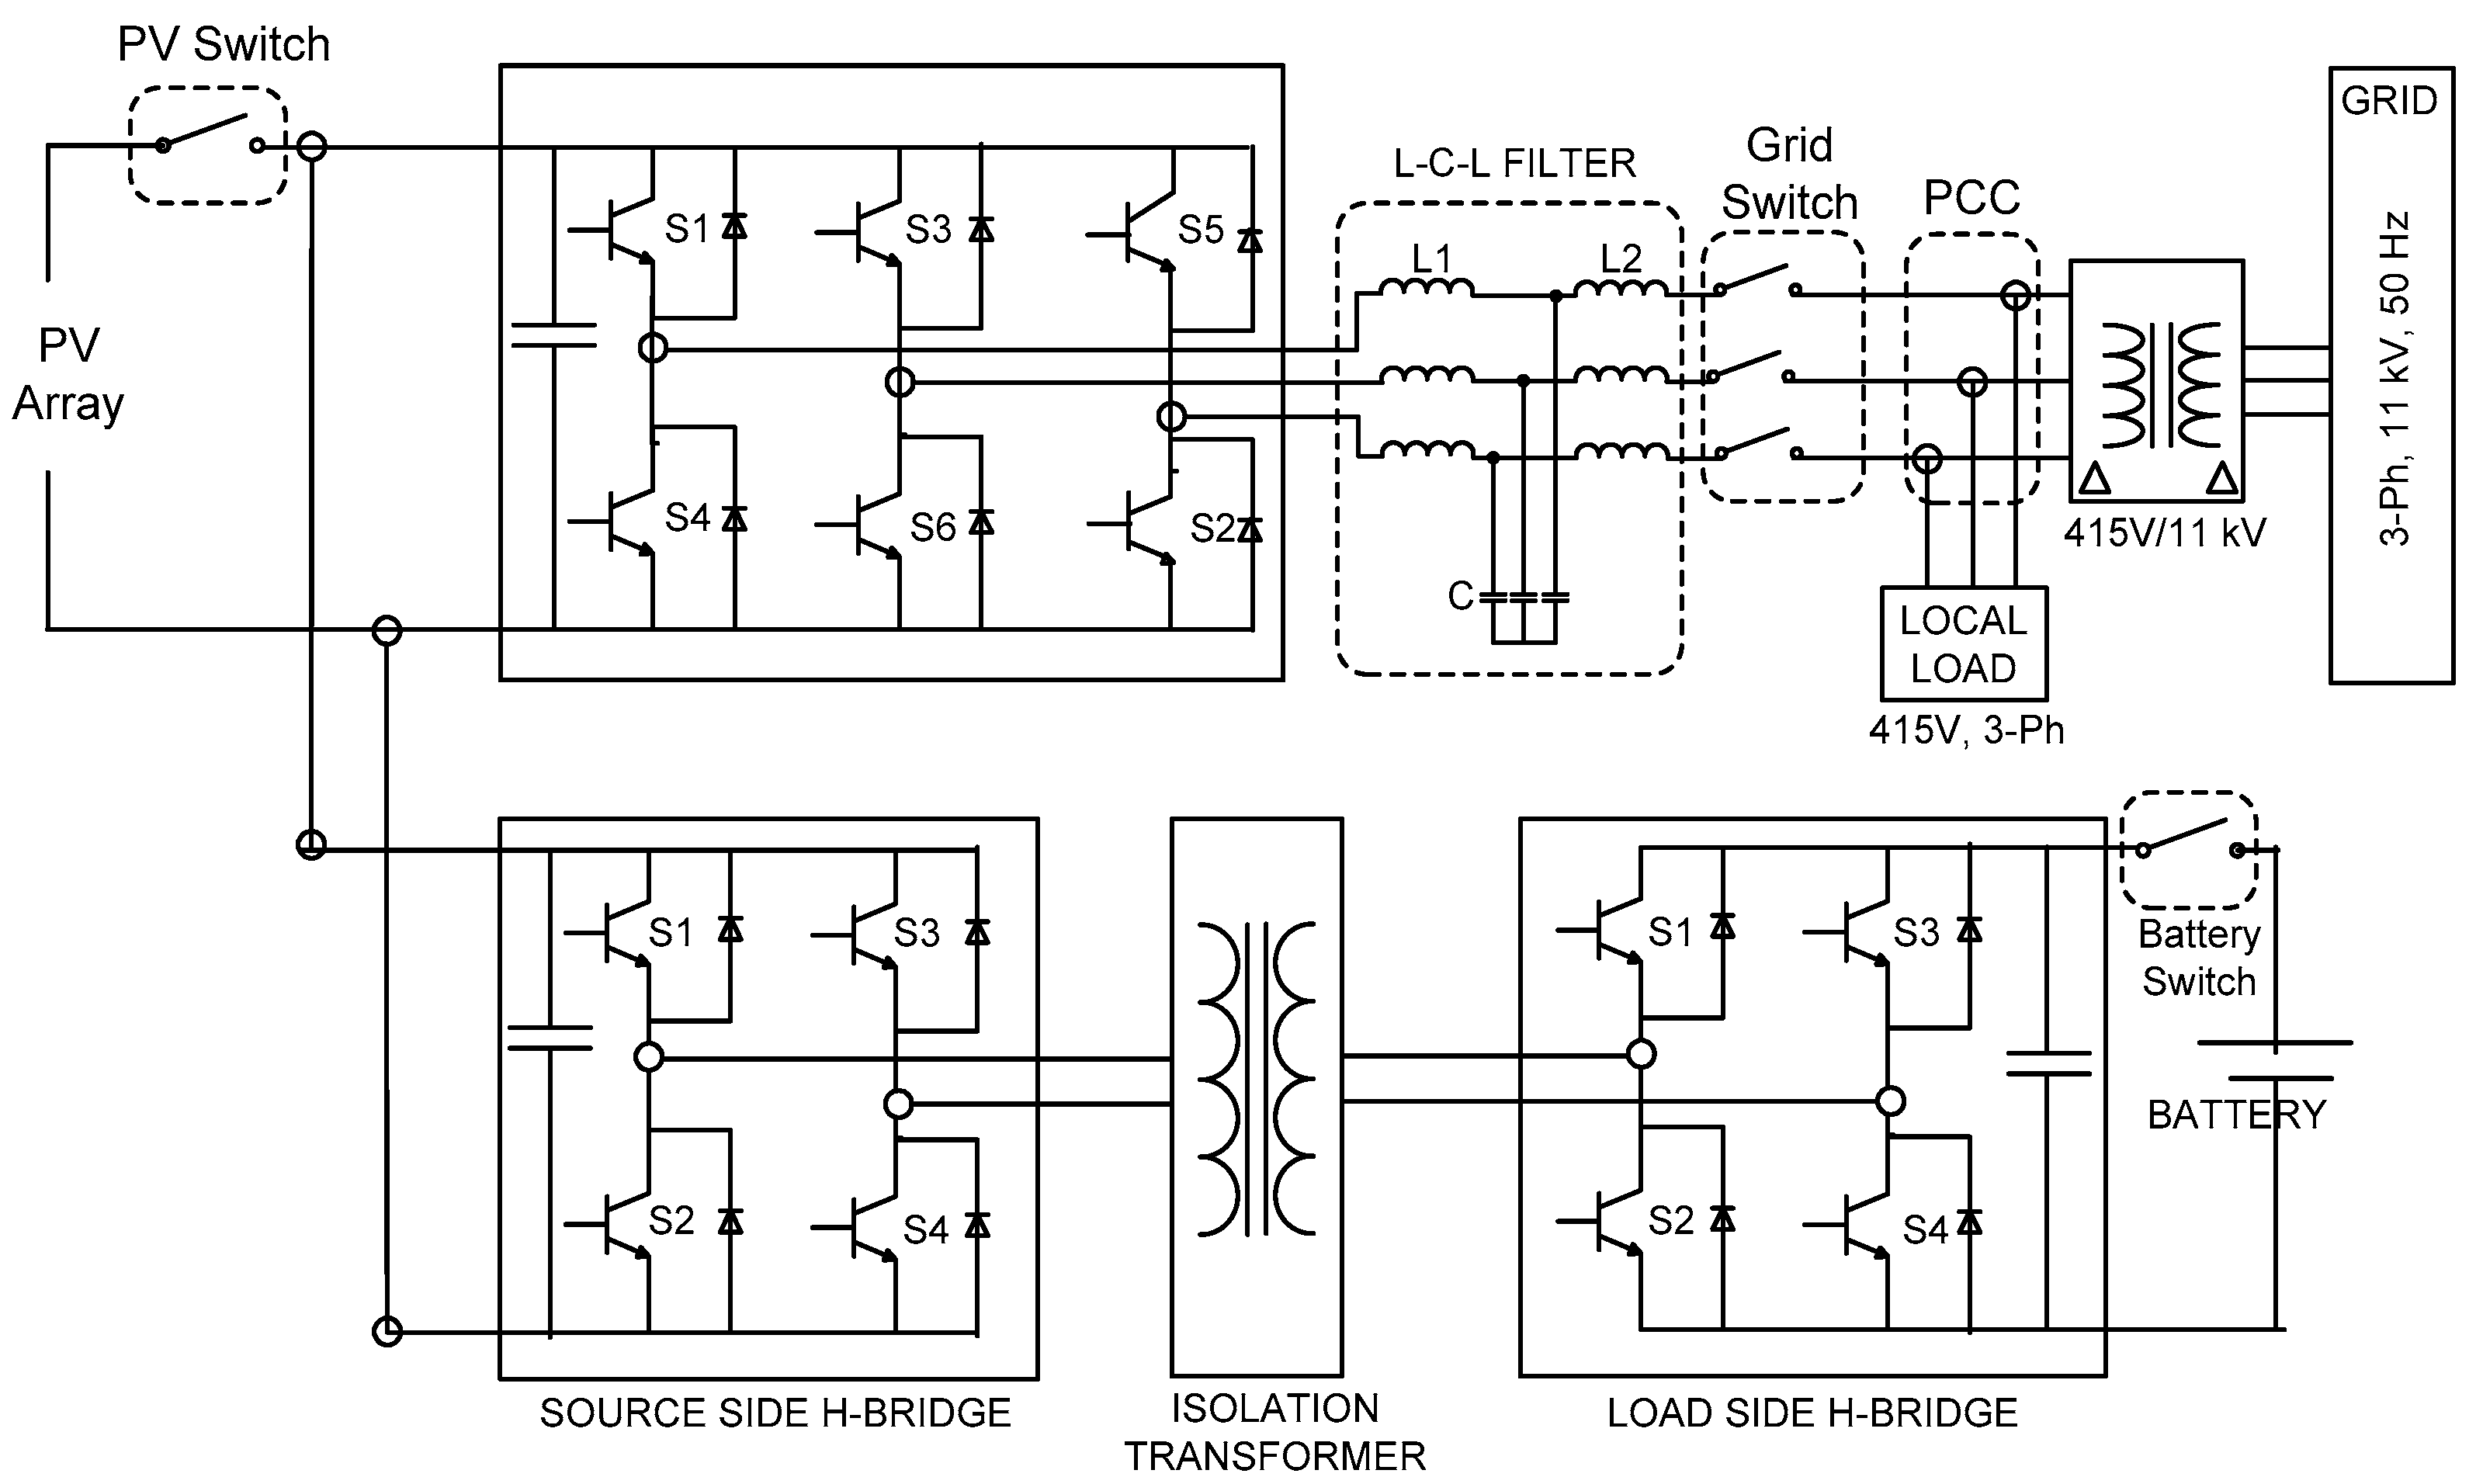
During the daytime, the PV array feeds active power to the grid through an inverter and provides charging current to the battery through the battery charger.
Mode2:
The battery is in charged condition and the PV array cannot feed full power to the grid i.e., during partial cloudiness or during nighttime or when the solar irradiation is weak. In this mode of operation, PV array feeds the power to the grid based on maximum power point (MPP) and the batteries also feed active power to the grid.
Mode3:
The battery is in fully discharged state and the PV array cannot provide the charging current to the battery i.e., during nighttime. In this mode of operation, the grid provides the charging current to the batteries through the inverter and battery charger.
With such systems, it is also possible to charge the batteries from the grid during non-peak load hours and the batteries along with PV array feed power to the grid during peak load hours [1]. Since the system is connected to three different power sources i.e., PV array, battery storage system and the grid, these three power sources need to be isolated to ensure the safety of the equipment. Existing energy storage systems for PV applications using a buck-boost chopper-based battery charger are briefly explained below.
In the configuration presented in [2], a DC-DC converter is connected between the PV array and PV inverter and the battery is connected across the DC link as shown in Figure 2a. In such systems, the DC/DC converter needs to be designed for the maximum capacity of the PV array even though the battery capacity is much less when the system operates in Mode3, the inverter should act like an active rectifier to charge the batteries and there is no isolation between the PV array and the batteries. In the configuration shown in Figure 2b, the PV array and PV inverter are connected to the DC link and the battery is connected to the DC link through a buck-boost chopper. In this case, the charger needs to be rated only for the rating of the battery. In the configuration presented in [3,4], independent DC-DC converters are required to connect the battery and PV array to the DC link as shown in Figure 2c.
An optimized operation of a dual active bridge (DAB) converter feeding a PV inverter connected to the grid is presented in [5,6]. Isolation between the grid and DC side is provided through a high-frequency transformer used in the DAB as shown in Figure 2d. In such a configuration, the DAB needs to be designed for the full capacity of the PV array. Since the design of a DAB is complex for high power ratings, this configuration is more suitable for low power applications. There is also no isolation between the DC link and the power bank with this configuration.
From the above discussions, it is observed that buck-boost chopper-based ESS cannot provide complete isolation. In this paper, a DAB-based energy storage system (ESS) for PV applications is proposed which can mitigate the drawbacks of buck-boost chopper-based systems. In the DAB-based ESS configuration, PV array and the PV inverter are directly connected to the DC link and the battery is connected to the DC link through a DAB-based bi-directional battery charger as shown in Figure 3. A high-frequency transformer in the DAB provides isolation between the DC link and the power bank. A transformer connected between the inverter and grid provides isolation between the DC sources and AC grid.
The following technical features are the main advantages of the proposed system:
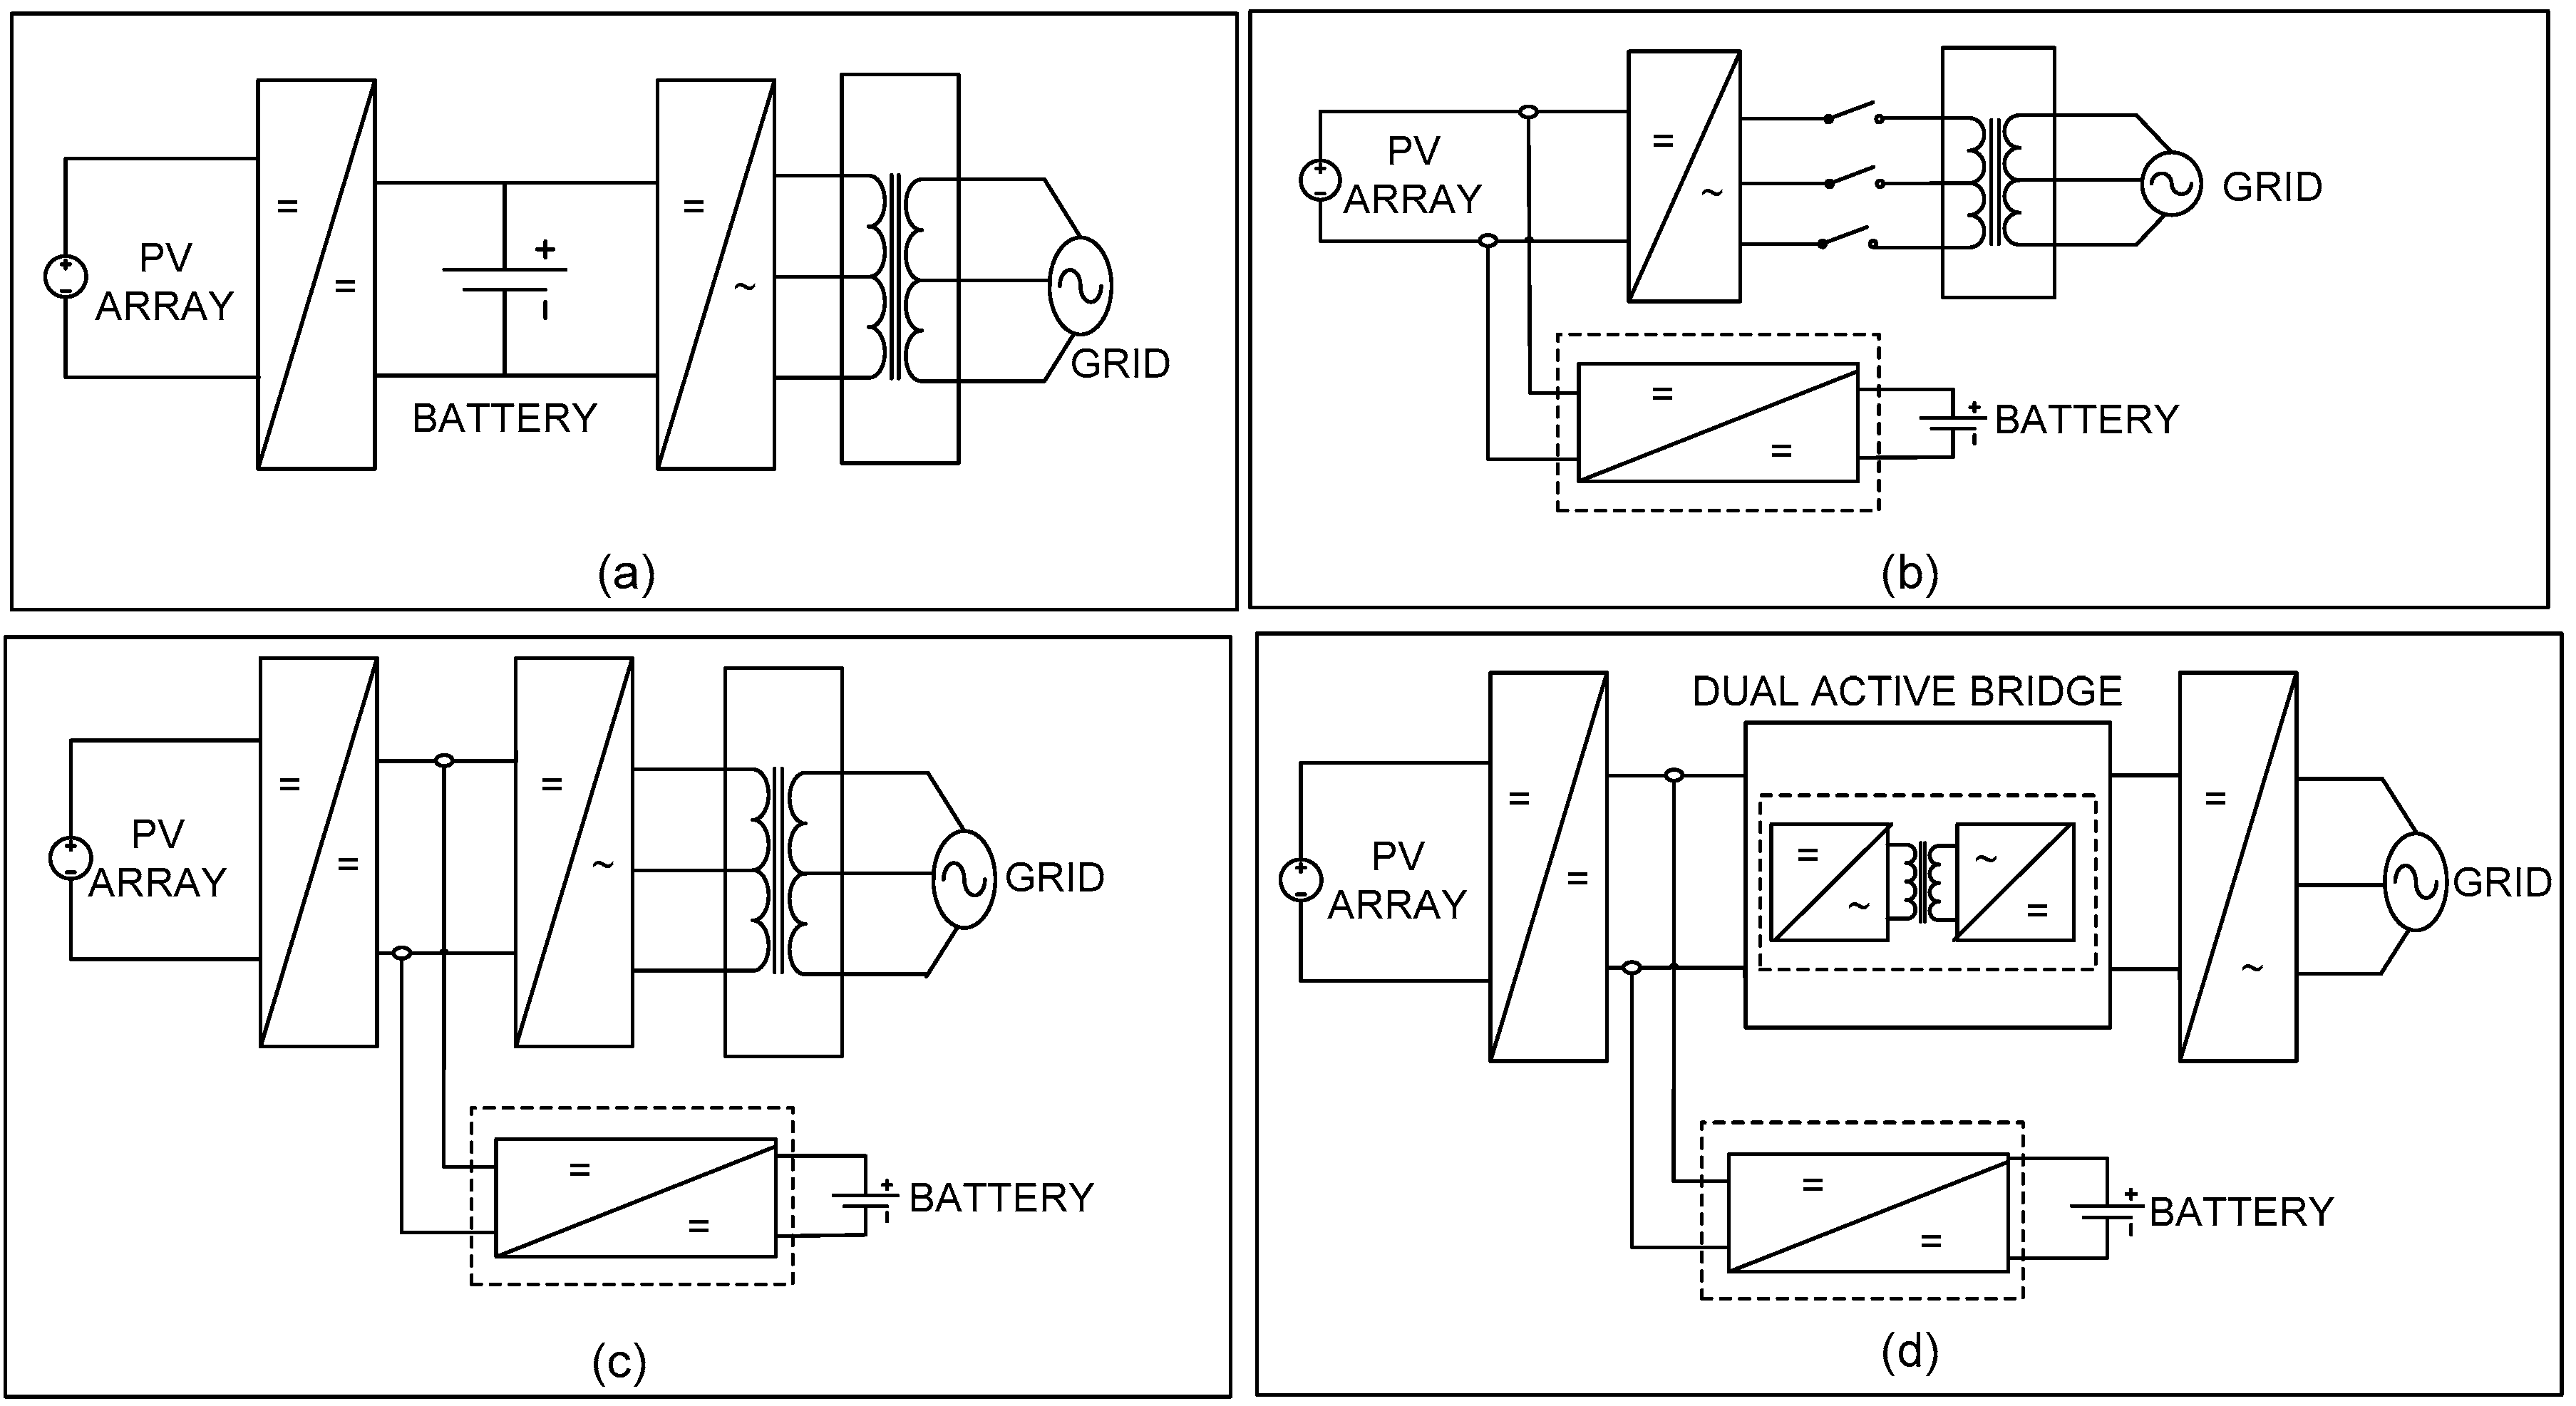
  • The battery charger only needs to be designed for the battery capacity.
  • Independent controls for the battery charger and inverter are possible.
  • When the system operates in Mode3, the inverter acts like a simple diode rectifier and the battery charger takes care of the charging current.
  • The high-frequency transformer in the DAB provides isolation between the PV array and the battery.
In this paper, a power balancing control for the DAB-based energy storage system is proposed and validated through real-time simulations. Detailed discussions on the proposed system, design calculations, and the control structure are presented in Section 2. The proposed power balancing control algorithm is explained in Section 3. In Section 4, a hardware-in-the-loop (HIL) simulation setup to validate the control algorithm is explained. HIL results are presented in Section 5.

2. Dual Active Bridge Based Energy Storage System for Photo Voltaic Applications

As shown in Figure 3, in a dual active bridge-based energy storage system, the PV array is connected to the DC link directly and the battery is connected to the DC link through a DAB-based bidirectional DC-DC converter. The PV inverter is connected to the grid through an isolation transformer. The transformer secondary is the point of common coupling (PCC) i.e., the coupling point of the grid, PV inverter output and the local load. A sine filter is used at the output terminals of the PV-inverter to smoothen the inverter output voltage. In this paper, design, and control of the proposed system with a 100 kVA PV-inverter and energy storage of 25% capacity for 4 h minimum backup time are presented. An overview of the electrical requirements of the system is shown in Table 1. Since the local load is rated for a 415 V, 50 Hz, 3-phase, the PCC voltage is selected to be the same as the rated voltage of the local load to avoid an additional transformer across the load and the PCC. Design calculations for the system to meet the electrical specifications are presented in the next subsection.

2.1. Design Calculations for the Photo Voltaic-Inverter

The design calculations for the inverter and the filter are presented in Table 2. An LCL filter (2 inductances-L connected in series with a capacitor-C in parallel) is often used to interconnect an inverter to the utility grid in order to filter the harmonics produced by the inverter. Since the PCC voltage is 415 V and the grid voltage is 11 kV, the grid side transformer with a transformation ratio of 11 kV/415 V with minimum 100 kVA rating is selected.
Due to the L-C-L filter used at the output side of the inverter, there is an voltage drop across the filter, so the inverter output voltage should be the sum of PCC voltage and the voltage drop across the filter. Considering the sinusoidal PWM (SPWM) technique for pulse generation, the minimum DC link voltage required is calculated based on the inverter output voltage. Since the inverter needs to be designed to handle the filter capacitor current in addition to the rated load current, an optimal filter capacitor is selected which draw less than 5% of rated current. The Inverter side inductor L1 is derived from the value of the capacitor C and the corner frequency Fc. After selecting the inductor L1, the grid side inductor L2 can be selected based on the maximum filter drop allowed. Inductance L2 can also be made part of the transformer on the grid side to eliminate the physical inductor L2 in the system.

2.2. Selection of Battery Type

The procedure for the calculation of PV power requirement for battery charging is explained in Table 3. As mentioned earlier, since the power requirement during nighttime is much lower than that during the daytime, an energy storage with 25% of the rated power of the PV array is selected. A Lithium-ion battery with a nominal voltage of 350 V is selected as an energy storage in this system. The ampere-hour rating of the battery is decided based on the minimum backup time required and the battery discharging current. Similarly, the charging current of the battery is calculated based on the charging time and ampere-hour rating of the battery. The power required from the PV array for charging the battery is determined from the battery nominal voltage and the charging current.
The battery selected for this system can be modeled as a voltage source [1,7,8] and the model was implemented based on the equation for the battery voltage expressed as below [9].
Battery Voltage:
VBatt = E0 − K [Q/(Q-I * T)] + Ae (-B * I * T) − [IBatt * R]
where VBatt is the battery voltage (V), IBatt is the battery current (A), E0 is the nominal voltage (V), Q is ampere-hour rating of the battery (Ah), B is the nominal discharge current (Ah)−1, K is the fully charged voltage (V)which is around 116%, A is the exponential voltage (V), which is around 105%, R is the internal resistance of the battery, and “I * T” is the discharged capacity (Ah) which is determined by integrating the battery current.
State of charge of the battery can be obtained after integrating the battery current:
% SOC = 100 × {1 − [(I * T)/Q]}

2.3. Selection of the PV Array

From the above discussions, a PV array for a minimum power rating of 113 kW is required, since a power of 100 kW for the grid and 13 kW for battery charging is required from the PV array. Design calculations for the PV array using 435 watt PV module (Make: M/s Sunpower, Model: SPR-435NE-WHT-D) is explained and the procedure for selecting a number of series, parallel PV modules in a PV array is also presented in Table 4. An operating temperature range of 25 to 55 °C is considered for the calculations. PV module parameters such as MPP voltage, MPP current, open circuit voltage and short circuit current at 25 °C are obtained from the data sheet and the values at 55 °C are derived using the temperature coefficients of the PV modules. The operating range of PV module voltages and currents are tabulated.
The total number of PV modules required in the PV array is calculated based on the total power requirement and the power rating of each PV module. The number of series PV modules in a PV array is selected based on the minimum DC link voltage requirement for the PV-inverter. For this system, the minimum DC link voltage required is 620 Volts to match the inverter voltage with the PCC voltage. Hence the PV array minimum voltage should always be more than 620 V in the operating temperature range. The minimum number of parallel PV modules in the PV array is calculated from a total number of PV modules and the number of series PV modules selected.
The PV array can be modeled as a current source [1,7,10] and the mathematical expression for the PV array model is as given below [11].
PV Current:
I = Iph – [Is × (e (V + I * Rs )/N * Vt − 1)] – [(V + I * Rs )/Rp]
where I is PV current and V is the PV voltage. Iph is the photon current and it is expressed as:
Iph = Irradiance * (Isc/Iro)
where Isc is the short circuit current of the PV array = Isc of each module, N represents the number of parallel modules, Iro is the measured irradiance = 1000 W/m2 (from the datasheet), Is is the diode saturation current and expressed as:
Is = Isc/(exp(Voc/(n * Vt)) − 1)
where Isc is the short circuit current of the PV array, Voc is the open-circuit voltage= Voc of each module, multiply by the number of series modules, n is the quality factor and Vt is the thermal voltage and expressed as:
Vt = k * T/q
where k is Boltzmann’s constant = 1.3806 × 10⁻²³, T is the operating temperature = 25 °C, q is charge of an electron = 1.602 × 10⁻¹⁹, RS is the series resistance of the PV array, Rp is the parallel resistance of the PV array.

2.4. Design Calculations for the Battery Charger

Battery charger ratings are decided after selecting the PV array. Since the PV array and the battery charger are connected to the common DC link, the battery charger input voltage range is the PV array operating voltage range. The battery charger output voltage range is the battery operating voltage range. Based on the input and output voltage range of the battery charger, an isolation transformer with a transformation ratio of 1:2 is selected. Electrical parameters for the battery charger system are listed in Table 5.
Design calculations for the proposed system are explained briefly in this subsection. The control methodology for the battery charger and the PV-inverter are explained in next subsections.

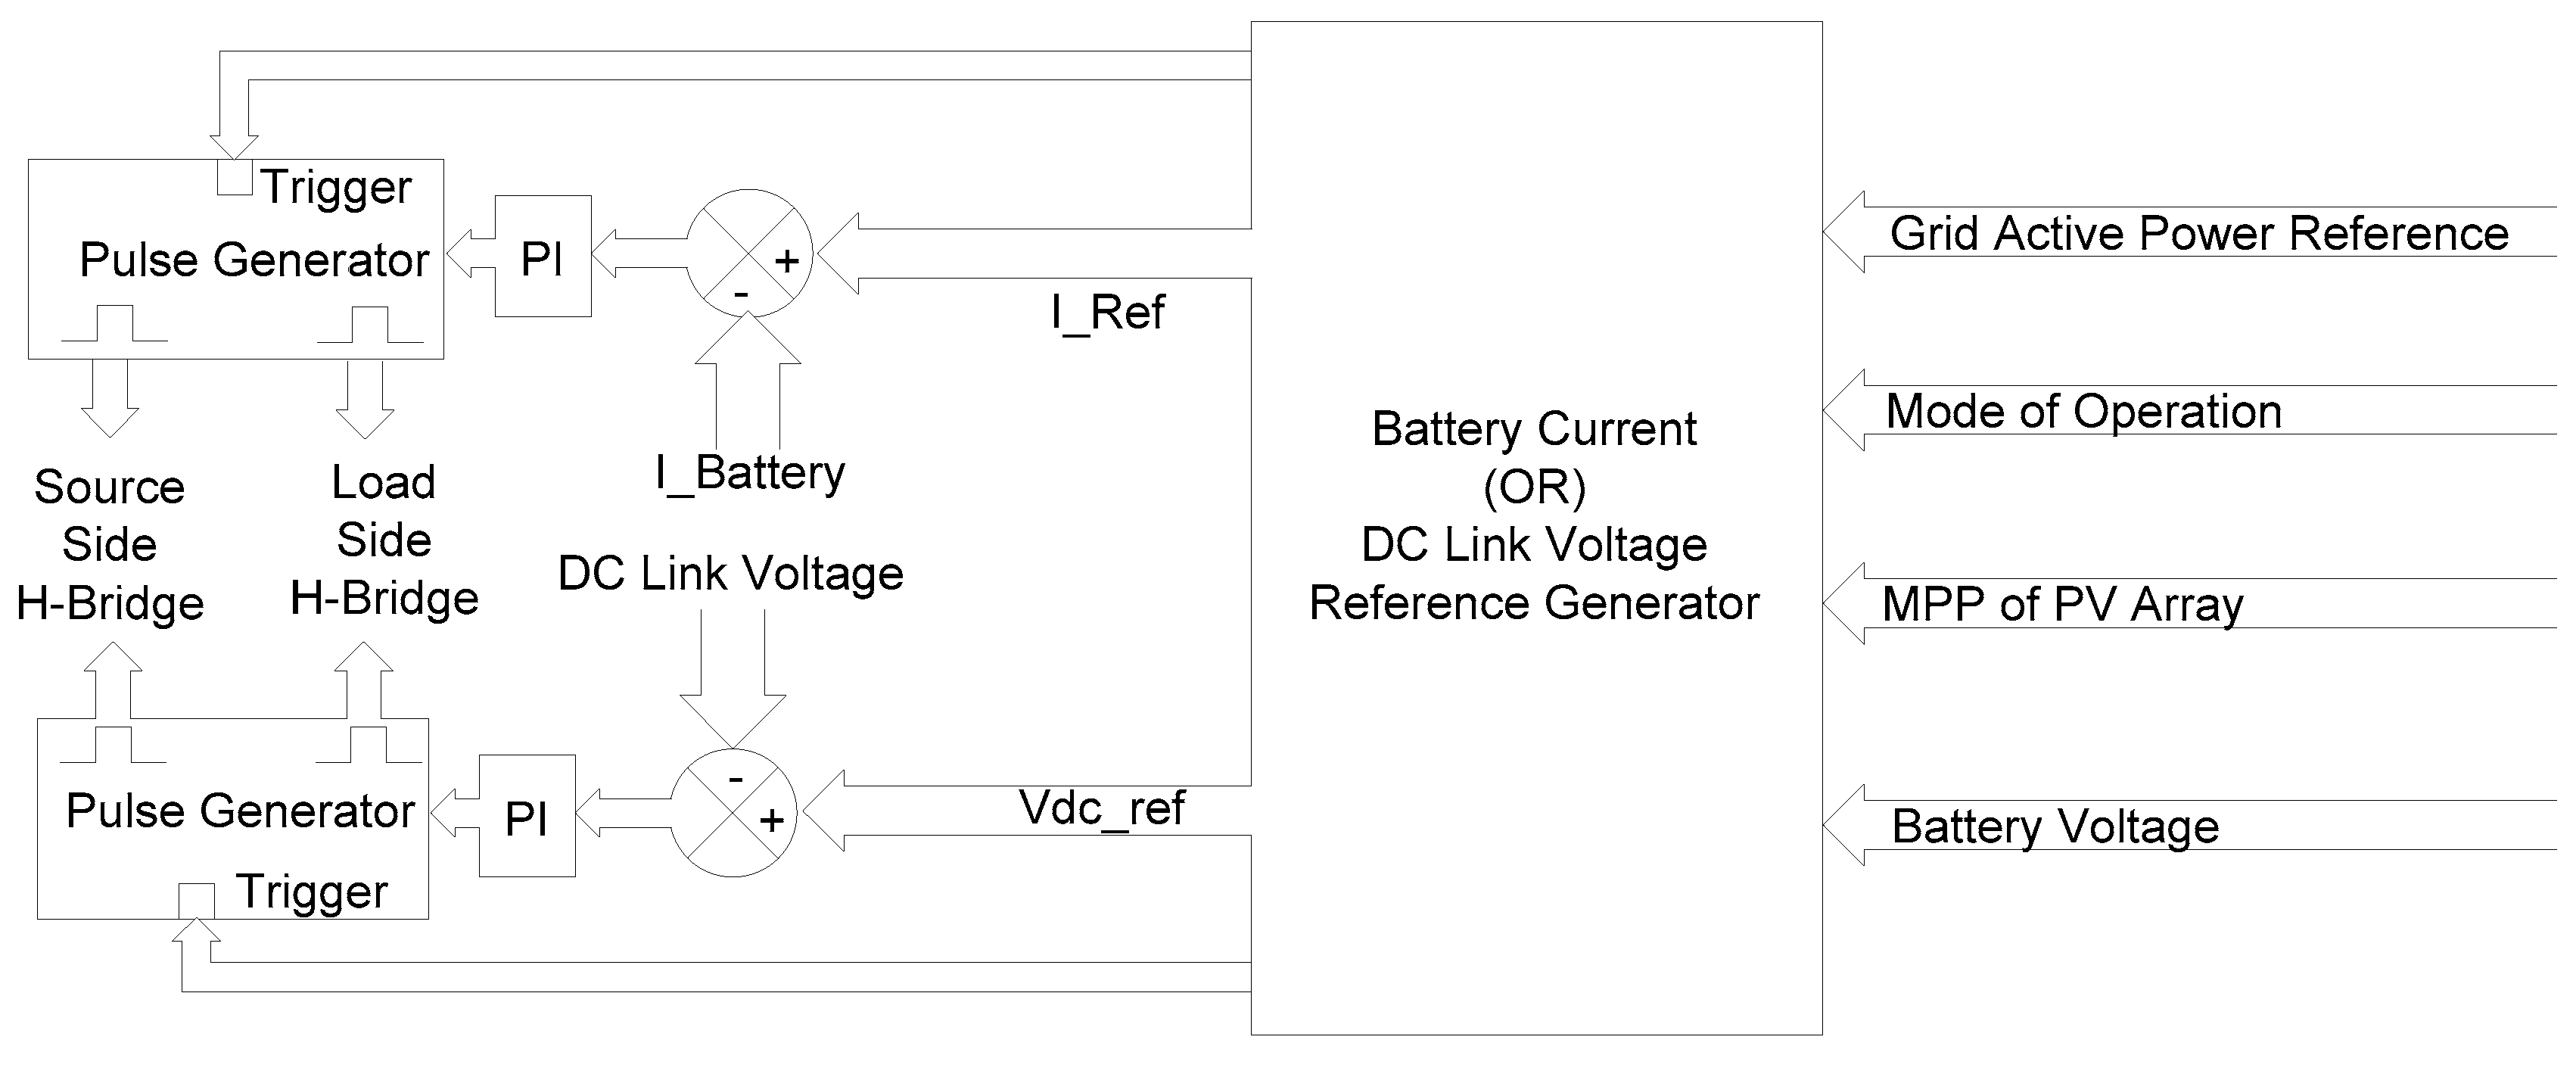
2.5. Control of the Dual Active Bridge-Based Battery Charger

The DAB-based DC-DC converter consists of two H-bridges and a high-frequency transformer. The source side H-bridge is connected to the DC link and the load side H-bridge is connected to the battery, as shown in Figure 3. A high-frequency transformer is required to match the battery voltage with the DC link voltage and also to provide isolation between the PV array and the battery. The transformer’s leakage inductance helps in boost operation mode [12,13]. The transformer winding connected to the source side H-bridge is considered as the primary and the winding connected to the load side H-bridge is considered as the secondary. A control block diagram of the DAB-based battery charger is shown in Figure 4. Source side and load side H-bridges act like a simple square wave inverter. Square pulses with 50% duty cycle are provided to the load side and source side H-bridges. Power flow through the DAB is controlled using phase shift control. The pulse generator provides the gate pulses for the source side and load side H-bridges based on the phase shift obtained through a PI controller.
During current control mode, when the battery current reference is zero, then the gate pulses for source side and load side H-bridges will be in phase with each other. During forward power flow i.e., for charging the battery, the gate pulse of the source side H-bridge will be in leading to the gate pulse of the load side H-bridge. Similarly, during reverse power flow i.e., during battery discharging mode, the load side gate pulse will be leading. The amount of power transfer depends on the phase angle between the gate pulses for the source side bridge and load side bridge. As the size and cost of a high-frequency transformer are much less than those of a high-frequency transformer for the same power rating, battery charger size and cost can be reduced by using a high-frequency transformer in a DAB.
During voltage control mode, the battery side H-bridge receives 50% duty cycle gate pulses and the DC link side H-bridge is controlled to maintain the DC link equal to the reference DC link voltage. The detailed control philosophy of the DAB-based battery charging system during various modes of operation is explained below:
(1)
Inputs to the reference generator block are the mode of operation, MPP of the PV array, active power reference, and battery voltage signals.
(2)
When the system is operating in either Mode1 or Mode3:
  • The battery is in charging mode of operation hence the battery current reference is taken as positive.
  • Based on the battery SOC, the reference charging current is obtained through a look-up-table.
  • When the battery SOC is in the range of 80 to 115%, then the battery charging current is maintained at 0.12 C i.e., 36 A (0.12 * amp-hour rating of battery) as shown in Table 3.
  • When the battery is fully charged, then the battery voltage will reach the maximum voltage, then the reference battery current is made zero to avoid overcharging. In this case, the operation can be transferred to Mode2, if the load requirement is more than the PV power.
  • When the battery is fully discharged, then the battery voltage will be less than 0.9 times the nominal voltage, then the charging current is adjusted to 0.2 C i.e., 57 A for fast charging.
(3)
When the system is operating in Mode2:
  • In this mode, the battery is in discharging mode of operation hence the battery current reference is taken as negative.
  • In this case, if the PV array is in an inactive state i.e., PV voltage is more than the minimum DC link voltage required (i.e., 620 V) but the MPP of the PV array is less than the critical load requirement:
    The battery discharging current is obtained from the Amp-hour rating of the battery and the discharging time.
    Since the minimum backup time in this system is 4 h, the user can adjust the backup time to be more than 4 h.
  • In case the PV voltage is less than the minimum DC link voltage required then the battery charger needs to provide the required voltage to the DC link:
    In this case, the DC link voltage reference (Vdc_ref) is generated by the reference generator.
    Vdc_ref is always maintained at more than the minimum required DC link voltage (620 V).

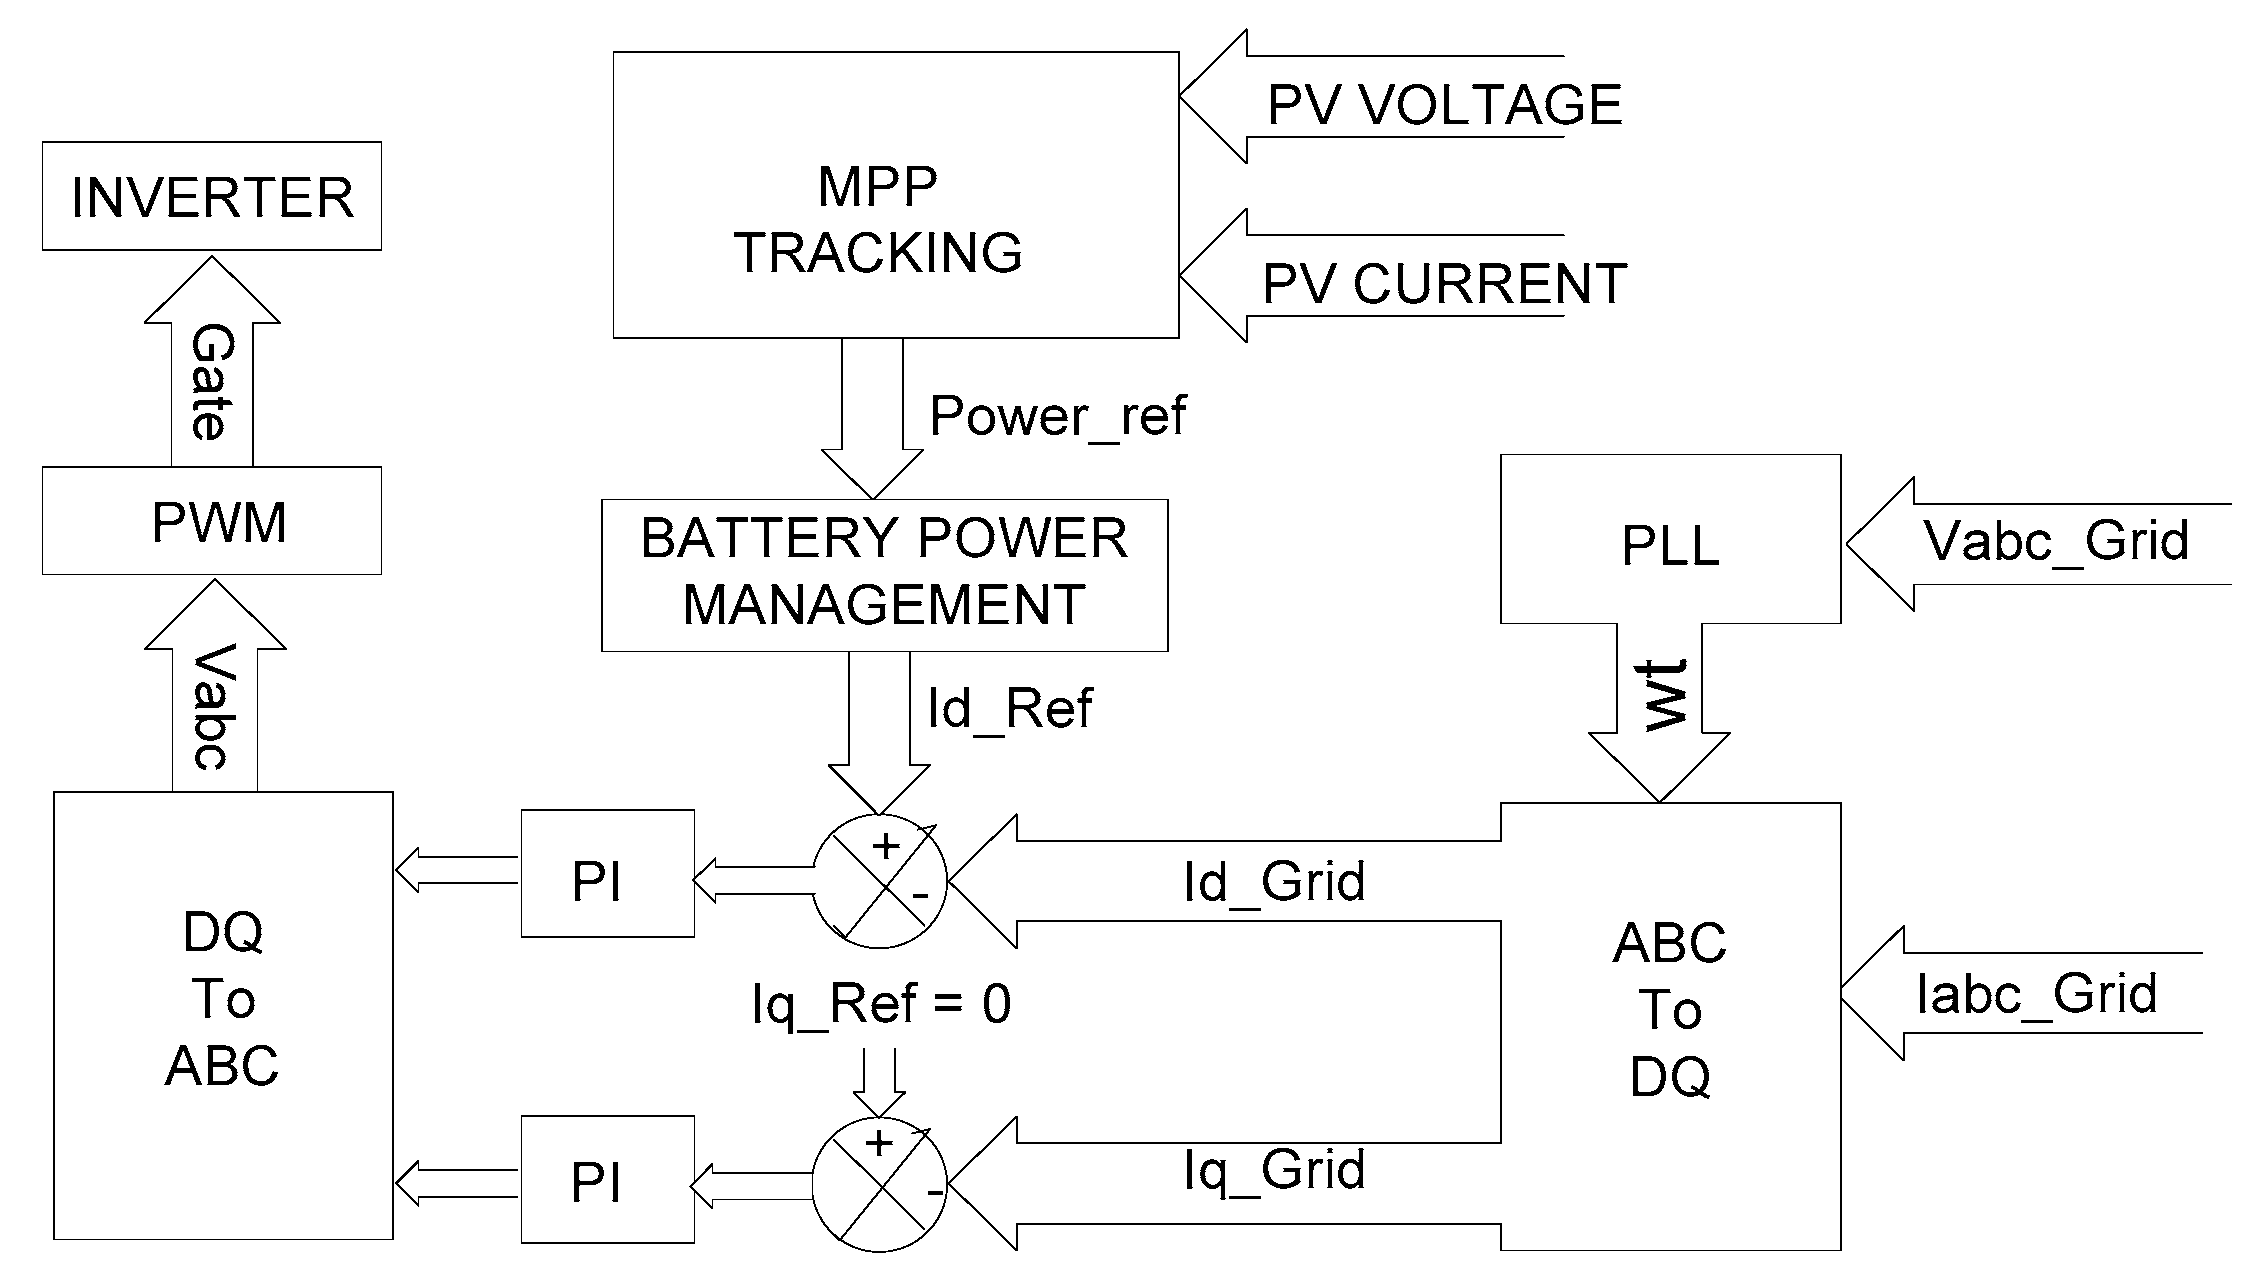
2.6. Control of the Grid-Connected Photo Voltaic Inverter

A typical grid connected solar power conditioning system consists of a three-phase two level PV-inverter for converting DC power to AC power, a sine filter to smoothen the AC output and a transformer to couple the inverter and the grid. The transformer also provides isolation between AC side and DC side. Figure 5 shows a control block diagram for a grid connected PV-inverter. In this system, the PV array voltage and currents are to be monitored for MPP tracking and the grid voltage is to be monitored for the phase-locked loop (PLL). The controller senses the charging current or discharging current of the battery and the MPP of the PV array and then calculates the maximum possible power that can be fed to the grid. The current reference is generated based on the maximum possible power and the PLL output. Three phase grid voltage is applied to the PLL to find out the angle wt. Angle wt obtained through the PLL is used to generate Id and Iq components from three phase grid currents. After comparing the reference Idq currents and actual Idq currents, the error signals are given to the PI controllers for the active and reactive power control. The PI controller outputs are converted back to three Phase modulating signals and given to the PWM generator to generate inverter gate pulses [14,15].
The perturb and observe method is used for maximum power point tracking (MPPT). In this method, the following activities are carried out:
(a)
Initially, When the system starts the PV power (Ppv) = 0
In this state, PV voltage = Voc and the PV current = 0
Initialize PV power reference MPP = 0
Minimum PV power reference (MPP_Ref_Min) is limited to 0.
Maximum PV power reference (MPP_Ref_Max) is limited to 113 kW.
(b)
Now increase the PV power reference (MPP) in 500 Watt steps:
Measure PV voltage and current and calculate the new PV power (Ppv_New)
If Ppv_New is more than Ppv
Ppv == Ppv_New
MPP == MPP + 500 Watt
If Ppv_New is less than Ppv
Ppv == Ppv_New
MPP == MPP − 500 Watt
(c)
Based on MPP_Ref and battery current, the reference inverter current is obtained.
(d)
Steps ‘b’ and ‘c’ operate in a continuous loop.
(e)
Since this activity is not required when the solar irradiation is weak, this loop can be bypassed during the nighttime.

2.7. Operation Sequence of the System

The normal operation sequence of the system is explained below:
(a)
During nighttime, the PV voltage is less than the minimum required DC link voltage. Considering that the battery is in discharged mode and being charged from the grid, hence the system is in Mode3.
(b)
Now when the irradiation improves in the morning, MPP tracking is started and when the MPP becomes more than the minimum power required for system operations and other critical requirements then the system switches to Mode1.
(c)
As the irradiance improves during the daytime, since the battery charging power is almost constant, power transfer to the grid increases.
(d)
Again when the irradiation is getting reduced, the power transferred to the grid also reduces.
(e)
In case the power requirement for the grid is more than the available PV power, then the system can be transferred manually to theMode2 operation to meet the power demand.
(f)
When the irradiation reduces further and becomes zero, then the battery stays in Mode2 till the battery gets discharged and the operation shifts to Mode3 and the process loops back to step (a).
In this work, a new power balancing control algorithm for the proposed configuration is developed to meet the operational requirements of the system. The proposed algorithm is explained in the next section.

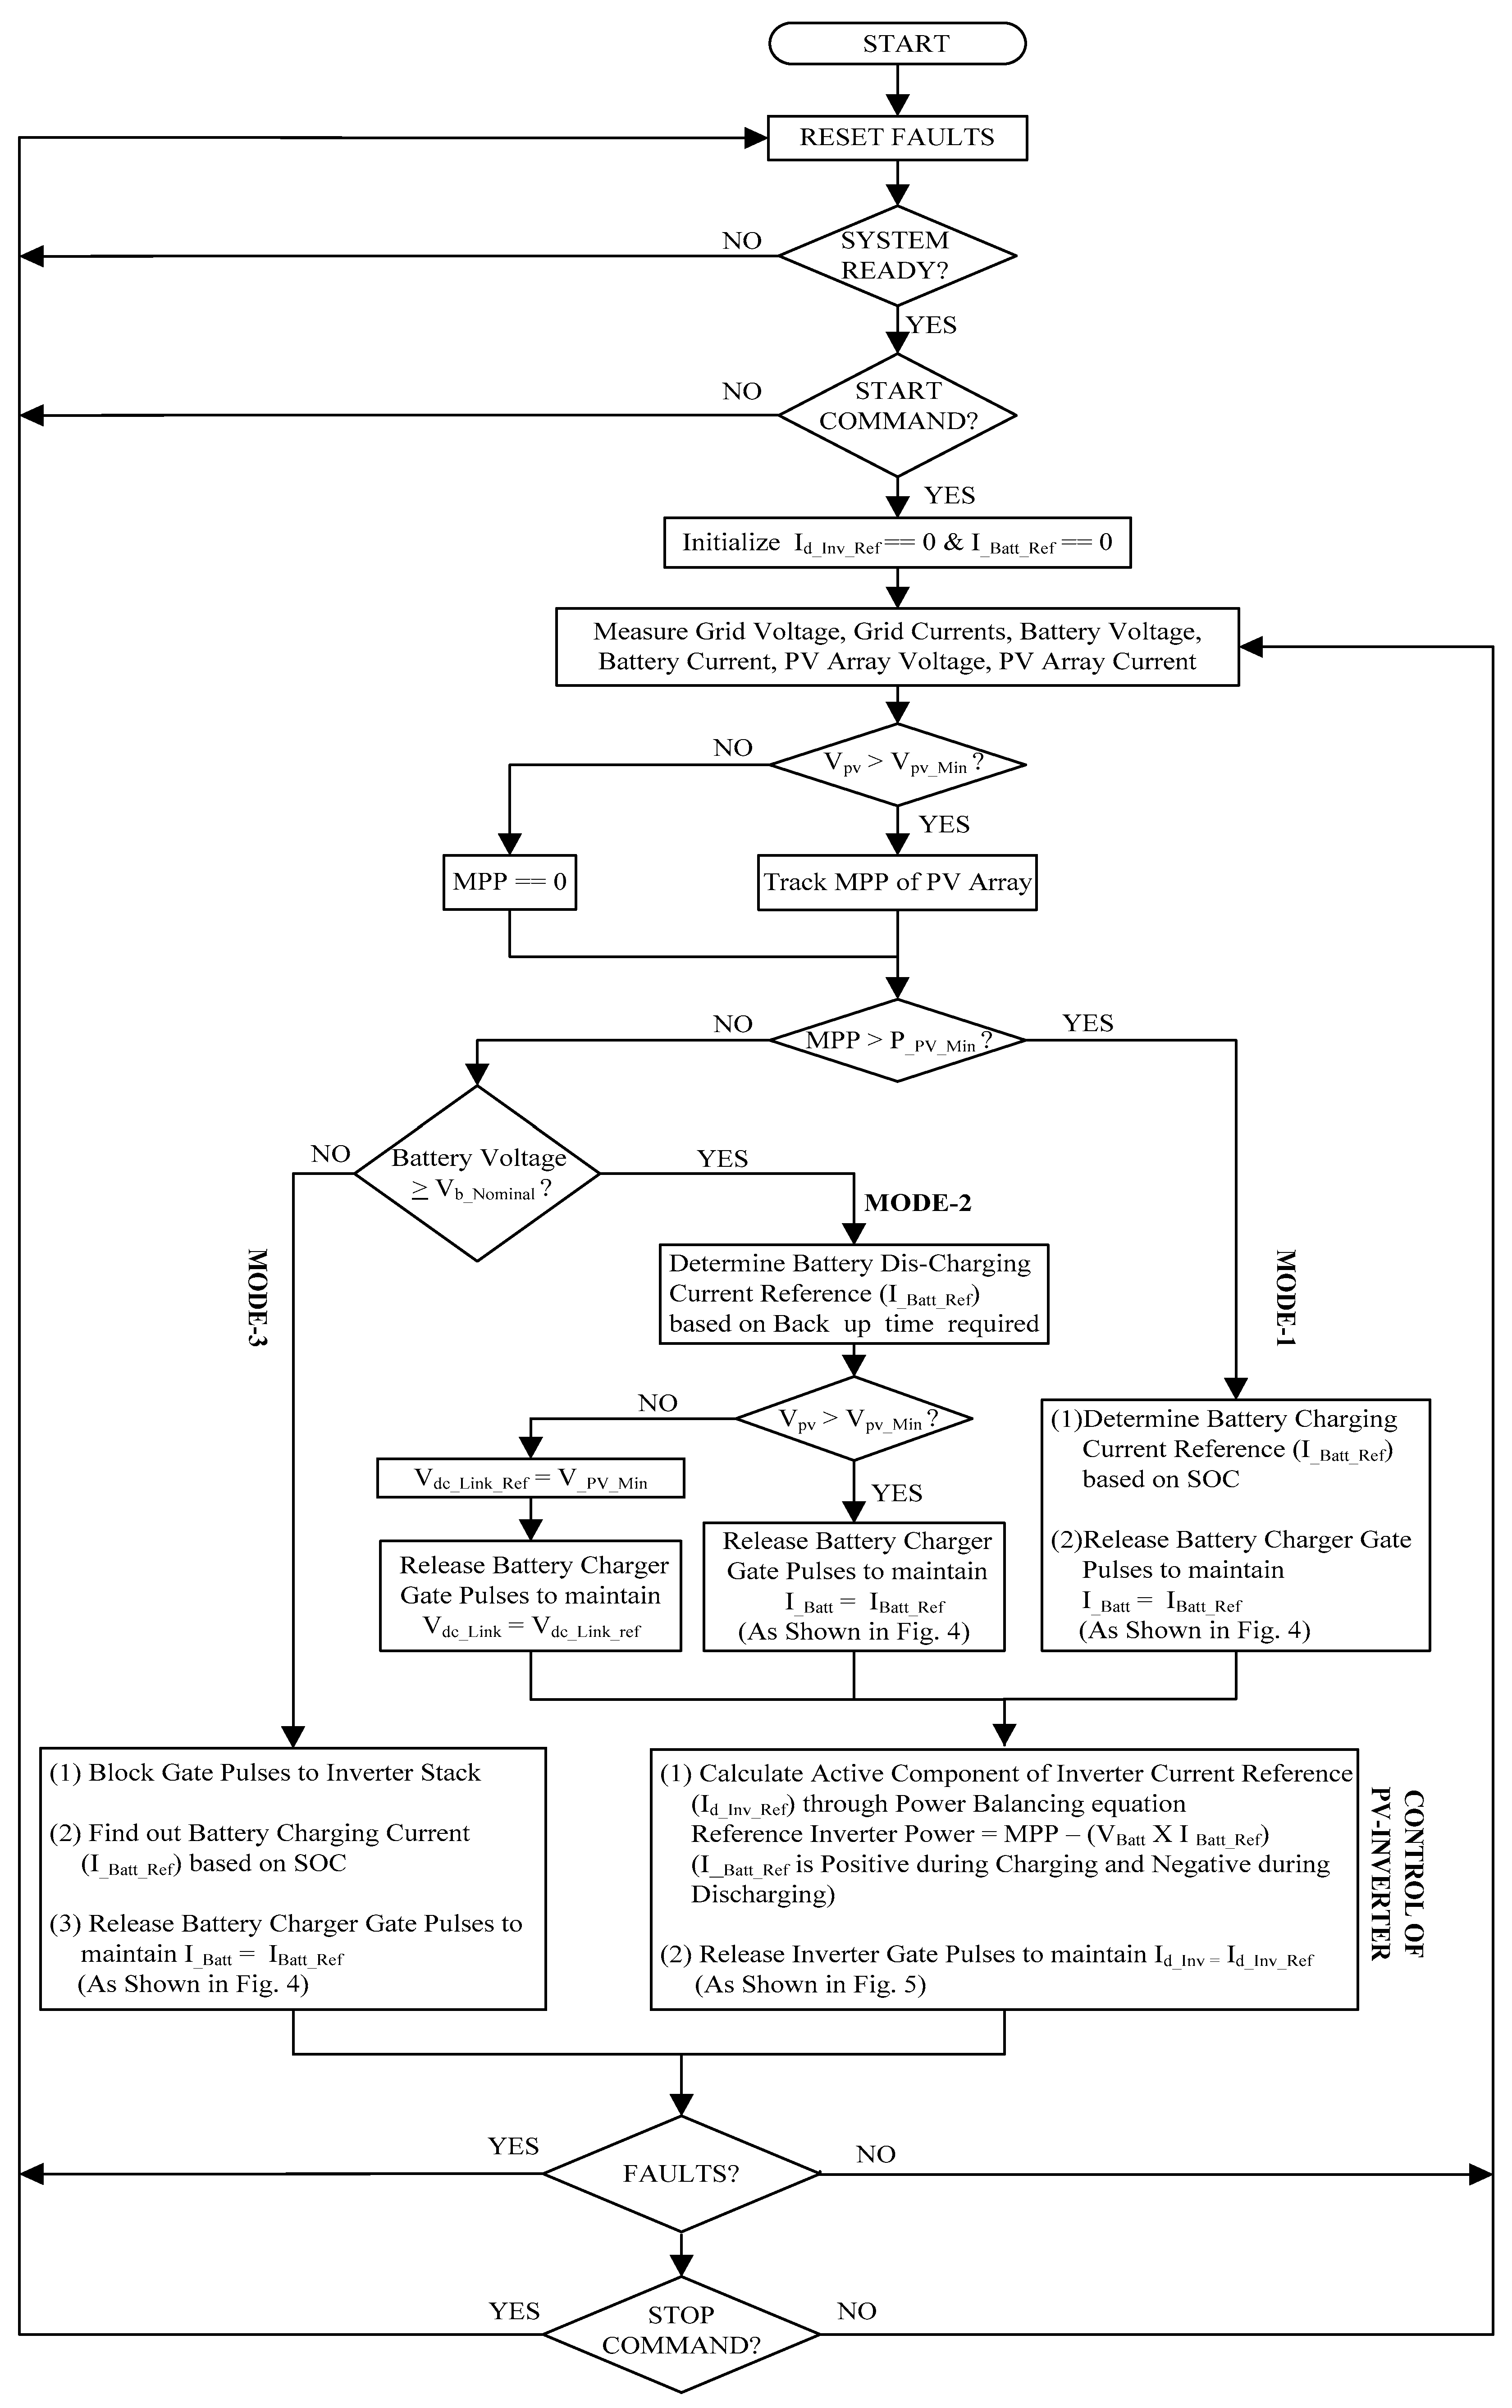
3. Power Balancing Control of the Grid Energy Storage System in Photo Voltaic Applications

Power control of PV with ESS for off-grid applications is presented in [16]. In the system presented, the battery and PV arrays are connected to the common AC load through independent converters i.e., as an AC-centric system. During charging of the battery, the PV array supplies power to the AC load and battery. When the battery is fully charged, the battery and PV arrays supply power to the common AC load. Conditions for battery charging and discharging and control of power converters during Mode1 and Mode2 operation are explained briefly. Experimental results were presented to show the dynamic response of the system during mode changeover.
Control for high power PV + a fuel cell plant with hybrid energy storage consisting of a battery and the supercapacitor is presented in [17]. Each energy source and energy storing element are connected to a common DC link through independent converters in this configuration. Energy management among the different sources, control for charging the super-capacitor and batteries is explained briefly. Experimental results were presented for explaining the dynamic characteristics of the system and plant performance during long load and short load cycles. Since the system presented is for off-grid applications, Mode3 operation i.e., charging the battery from the grid supply is not covered in this work. Real-time simulation of the hybrid energy system with wind-PV-battery storage is presented in [18]. In the presented system, independent converters for battery, PV modules, and the wind are used. Based on the power availability of all the sources, an algorithm is developed for battery charging, discharging and load shedding.
The systems presented in [16,17,18] are for off-grid applications hence the control during Mode3 of operation is not covered. System configurations presented in the above works require independent converters for each source, which may increase the cost of the system and also may increase the complexity of the control algorithm. The above mentioned drawbacks can be mitigated with the proposed system configuration and with the power balancing control algorithm explained in the next subsection.
The proposed system is the combination of three phase PV inverter and a DAB-based battery charger explained in Section 2. Power flow through the inverter can be controlled over a wide range through current control. Battery current can be controlled in both directions through DAB using a phase angle control. Power balancing among the three sources in the presently proposed system is achieved by controlling the power flow through the battery charger and inverter. The power balance control algorithm shown in Figure 6 is explained below:
(1)
Once the system is ready and the start command is given by the user, the controller reads the grid voltages for determining wt through PLL.
(2)
The controller initializes the value of the inverter reference current (Id_Inv_Ref) and battery reference currents (I_Batt_Ref) as 0.
(3)
The controller reads the PV voltage (Vpv), PV current(Ipv), battery voltage(VBatt) and battery current (I Batt)
  • If the PV voltage (Vpv) is less than the minimum PV voltage required (Vpv_Min) then MPP of the PV array is zero. Vpv_Min is the minimum DC required to match the inverter output voltage with the transformer secondary voltage. In this system, 620 V is the minimum DC link voltage required, as shown in Table 2.
    In this case, if the battery voltage is also less than the nominal battery voltage Vb_Nominal then the system is in Mode3.
    In this mode, the battery needs to be charged but the PV array cannot provide any power for battery charging, so the grid shall supply the power required for battery charging.
    In this mode of operation, the inverter acts like a simple diode rectifier to provide DC input to the battery charger.
    Based on the SOC of battery, the reference battery charging current I_Batt_Ref is obtained.
  • If the PV voltage (Vpv) is higherthanthe minimum PV voltage (Vpv_Min) then the controller tracks the MPP of the PV array by monitoring the PV voltage and current.
    In case the MPP is higher than minimum value i.e., P_PV_Min then the system is in Mode1.
    In this mode of operation, the battery will be in charging state and the PV array provides the power for battery charging.
    The remaining power after battery charging will be transferred to the grid.
    Based on the SOC of the battery, the reference battery charging current I_Batt_Ref is obtained.
    Through the power balancing equation, the inverter reference current Id_Inv_Ref is calculated based on the MPP and battery current:
    Inverter power reference = MPP − battery power reference
    (the battery Power reference is positive during charging mode and negative in discharging mode)
    Inverter Power Reference = MPP − (I_Batt_ref * V_Battery)
    √3 * Vabc_rms * Iabc_rms_Ref = MPP − (I_Batt_ref * V_Battery)
    where Vabc_rms is the RMS value of line voltage of the grid/inverter
    and Iabc_rms_ref is the reference RMS value of line current of the inverter
    Iabc_rms_ref = (MPP − [I_Batt_ref * V_Battery])/(√3 * Vabc_rms)
    Id_Inv_Ref can be calculated through the abc to dq transformation. Since in this system Iq_reference is always maintained at zero, the magnitude of Id_Inv_Ref can also be obtained as given below:
    Id_Inv_Ref = √2 * Iabc_rms_ref
    Id_Inv_Ref = √2 * (MPP − [I_Batt_ref * V_Battery])/(√3 * Vabc_rms)
  • If the MPP is less than the minimum value (P_PV_Min) but the battery is in charged condition then the system is in Mode2.
    In this case based on the backup time adjusted by the user, the reference battery current I_Batt_ref is calculated. In case the backup time adjusted by the user is 6 h, then the battery current reference is calculated as follows:
    I_Batt_ref = rated Amp-hour rating of the battery/backup time
    I_Batt_ref = 288 Ah/6 h = 48 A
    Through the power balancing equation, the inverter reference current Id_Inv_Ref is calculated based on the MPP and battery current:
    Id_Inv_Ref = √2 * (MPP – [I_Batt_ref * V_Battery])/(√3 * Vabc_rms)
    When the PV voltage is more than the minimum DC link voltage, then the battery charger is operated with closed loop current control to maintain I_Batt = I_Batt_Ref.
    When the PV voltage is less than the minimum DC link voltage then the battery charger operates with closed loop voltage control to maintain a constant DC link voltage i.e., Vdc_Link = Vdc_Link_Ref.
(4)
After determining the battery reference current I_Batt_Ref and inverter reference current Id_Inv_ref, the controller implements the closed loop current control through PI controllers and releases the gate pulses to the inverter stack and battery charger stack.
The proposed algorithm was tested on the real controller with the help of Hardware-In-Loop simulations. The need for HIL simulations, features of the real-time digital simulator and the setup built for HIL simulation for the proposed configuration are explained in the next sections.

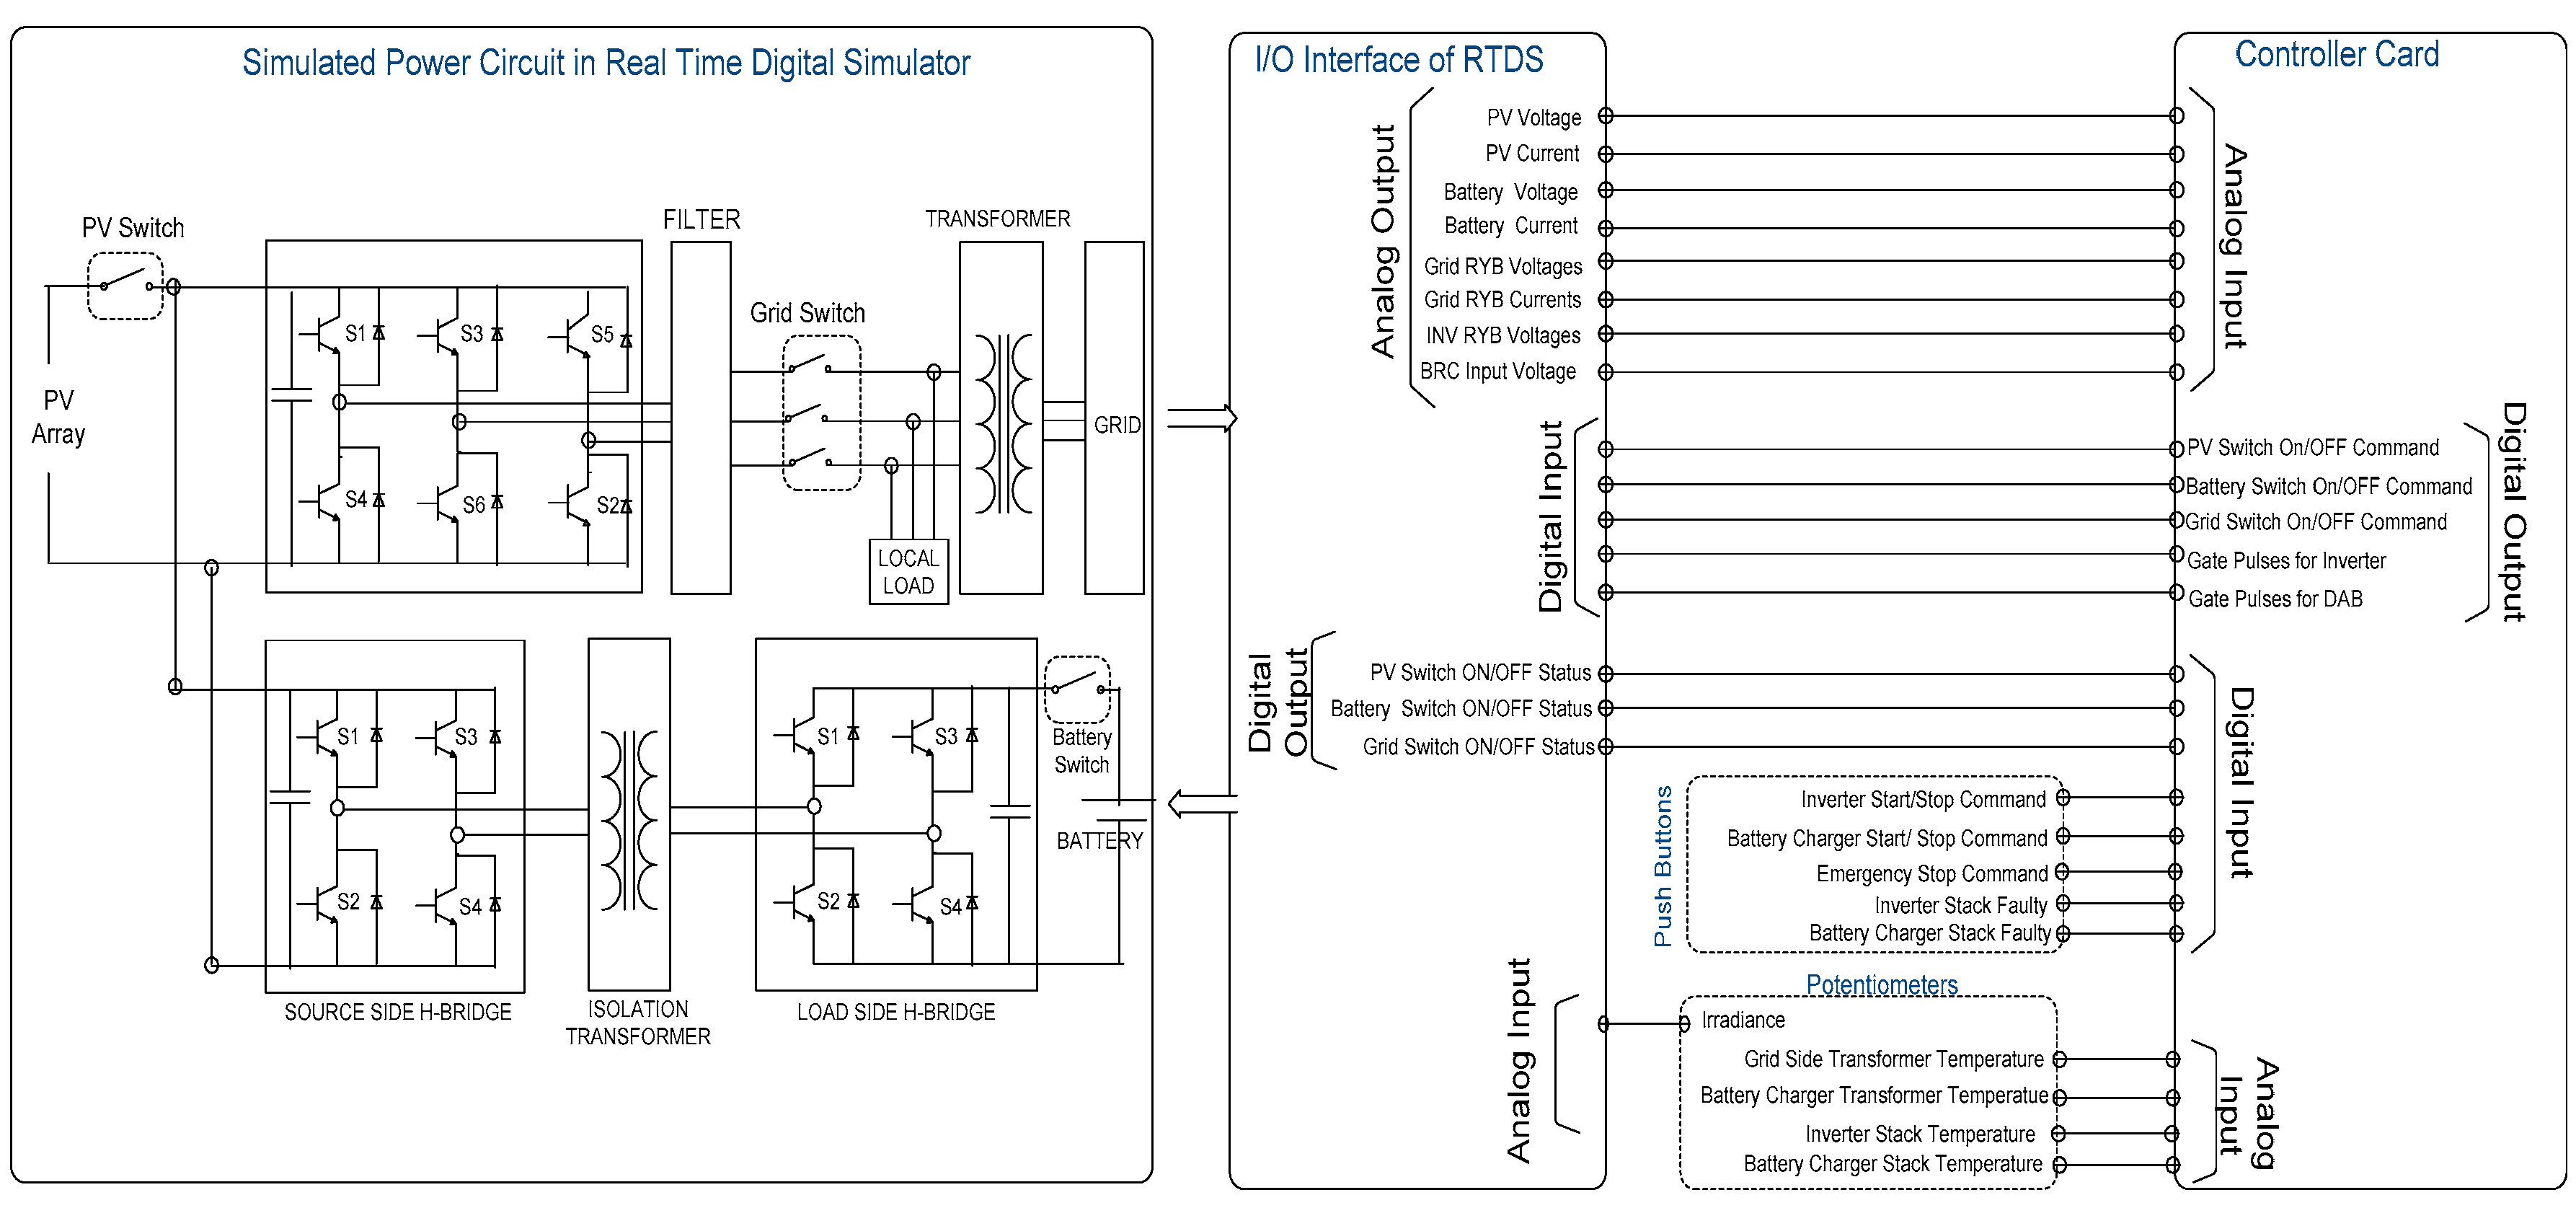
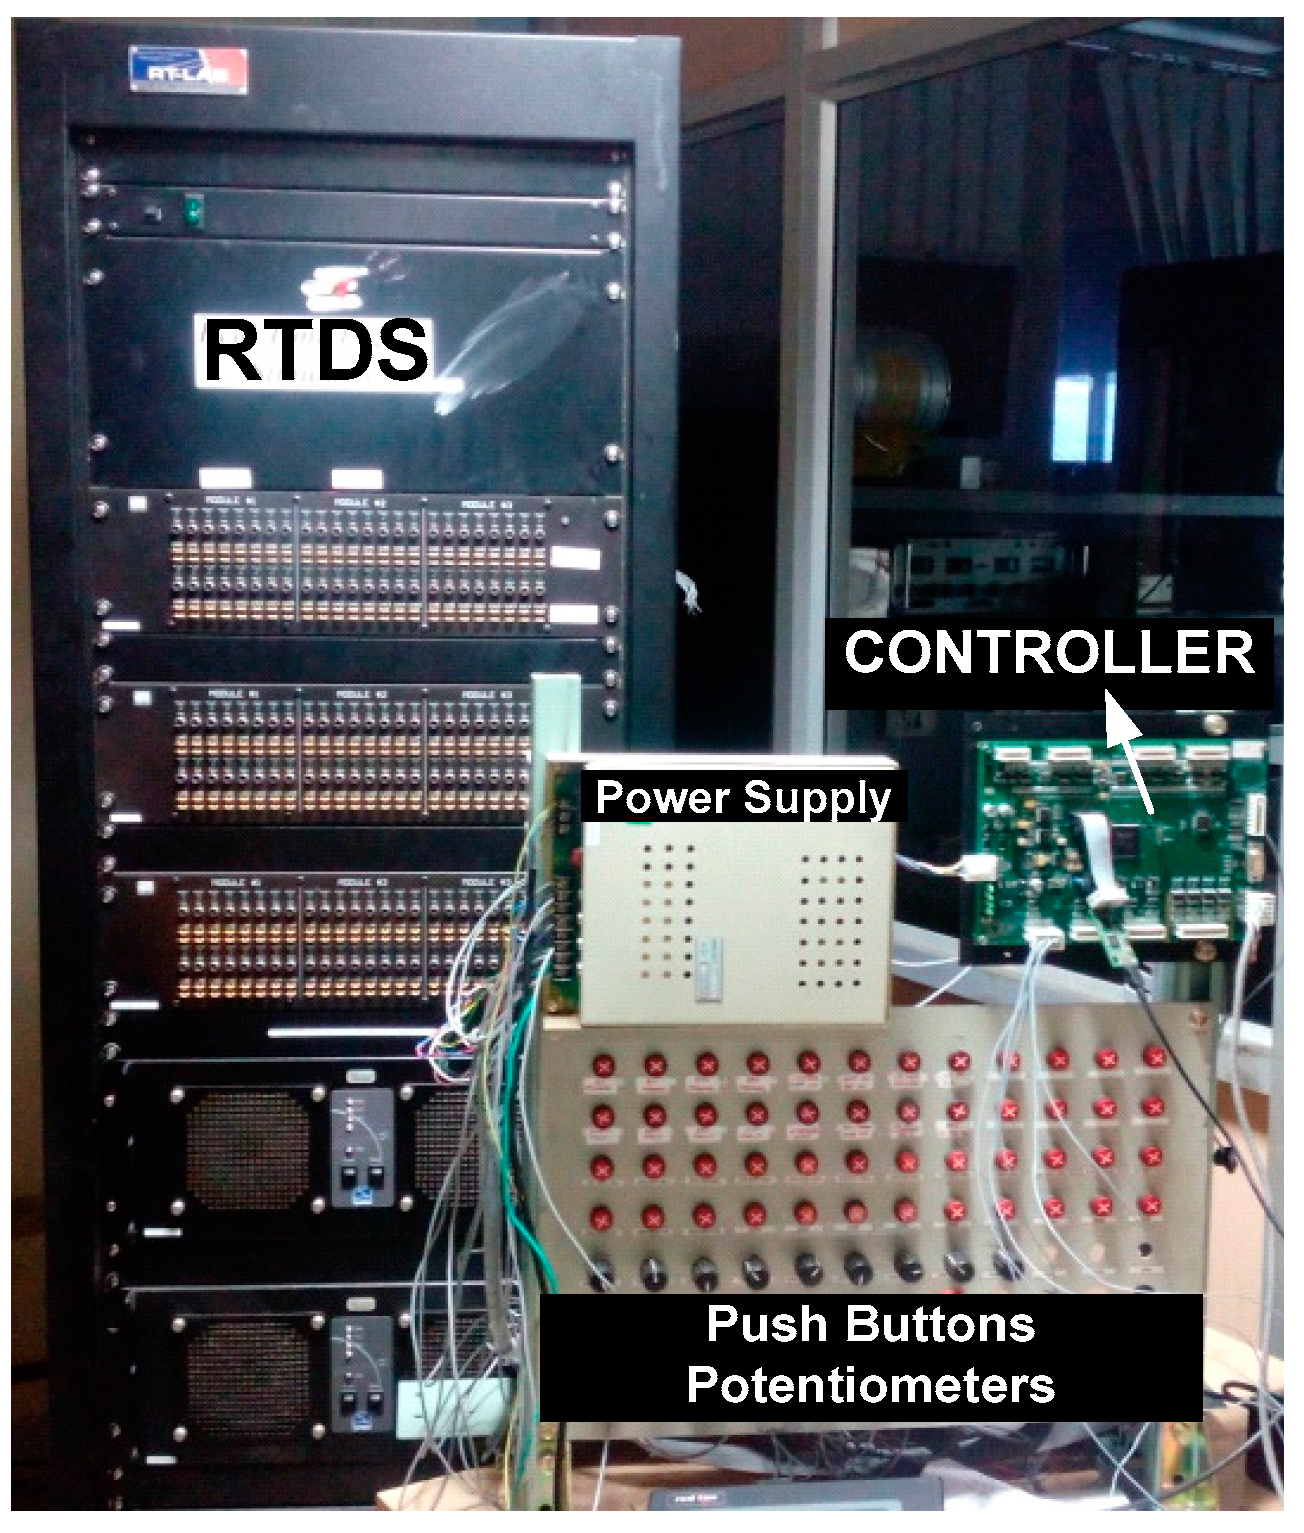
4. Hardware-in-the-Loop Simulation Setup for the Proposed System

In general, controller and control software are validated by integrating the controller with actual plant hardware. However, in the case of any error in the control system, there are risks of personal injuries, damage to the equipment and delays. Hardware-in-the-Loop (HIL) simulation is a useful tool to avoid such issues. In HIL simulation, instead of a real plant a mathematical model representing the plant loaded in the real-time simulator to act like an actual plant. Through HIL simulations, the response of a controller in real time operation can be validated [19]. The following are the advantages with the HIL simulation: (a) prototype controller software can be developed with minor assumptions about the plant parameters; (b) once the control parameters are calculated with the HIL simulation, it is easy to tune the parameters of the actual system; (c) it saves design cost and time (d) system protections in real time can be analyzed by simulating faults. To validate the control software for the proposed system, HIL simulations were carried out. A plant consisting of a PV array, inverter, battery charger, isolation transformers, grid, battery and contactors was simulated using the Matlab-Simulink software. The simulated model is compiled and loaded into the processor of a real-time digital simulator (RTDS). The simulated plant can be accessed by the external controller cards and other hardware through the I/O channels available in the RTDS. The DSP-based controller is connected as hardware in the loop as shown in Figure 7.
The RTDS used for the HIL simulations is the Opal-RT Simulator and the controller hardware is based on a Texas Instruments TMS320F2812 DSP-based controller card. The user interface panel consisting of pushbuttons and potentiometers (POT) is used for user commands and for simulating the faults. Figure 8 shows the hardware setup for the HIL simulations.

4.1. Input-Output Channels of Real-Time Digital Simulator

The Opal-RT RTDS is equipped with analog and digital input-output modules. The voltage range for analog signals is ±15 V whereas the voltage levels for digital signals is 0 and +15 V.

4.2. Input-Output Channels of Controller Card

The controller used in this work is a TMS320F2812 DSP processor-based controller card. The voltage range for analog signals is ±10 V whereas the voltage levels for digital signals is 0 and +15 V.

4.3. User Interface Panel Signals

The input to the simulated PV array is solar irradiance, which can be provided to the simulated plant through the analog input channel of RTDS from a POT mounted on a user interface panel. The minimum value of the POT output refers to an irradiance of 0 and the maximum value of the POT refers to 1000 W/m2. From the user interface panel, start/stop commands, and emergency stop commands are given to the controller card for the plant operations. The controller card receives temperature signals of from the isolation transformers and power stacks from the user interface panel. The possible fault signals are also sent to the controller card hence different faults can be simulated to check the functionality of the controller and control algorithm.

4.4. Signals from Simulated Plant to Controller

The controller receives the analog signals of the plant through the analog output channels of the RTDS. The controller receives PV voltage and current signals which are required for tracking MPP. Battery voltage is required for finding out the charging current reference and battery current signal is required for closed loop current control of the battery charger. Three phase grid voltage signals are required for the PLL and inverter side voltages are monitored for synchronization purposes. Three phase inverter currents are required for the closed loop current control of the PV inverter. Based on the start-stop commands received from the user interface panel, the controller gives the ON/OFF commands to the PV switch, grid switch and battery switches through the digital input channels of RTDS. Switch status outputs to the controller are given to the controller through the digital output channels of the RTDS.

4.5. Online Plant Parameter Modifications

Online modification of simulated plant parameters i.e., transformer parameters, filter parameters, battery SOC, DC link capacitor values and load parameters, etc. during the real-time digital simulation is also possible through RT lab main controller. Through online modifications, the optimum values of the plant components can also be obtained.

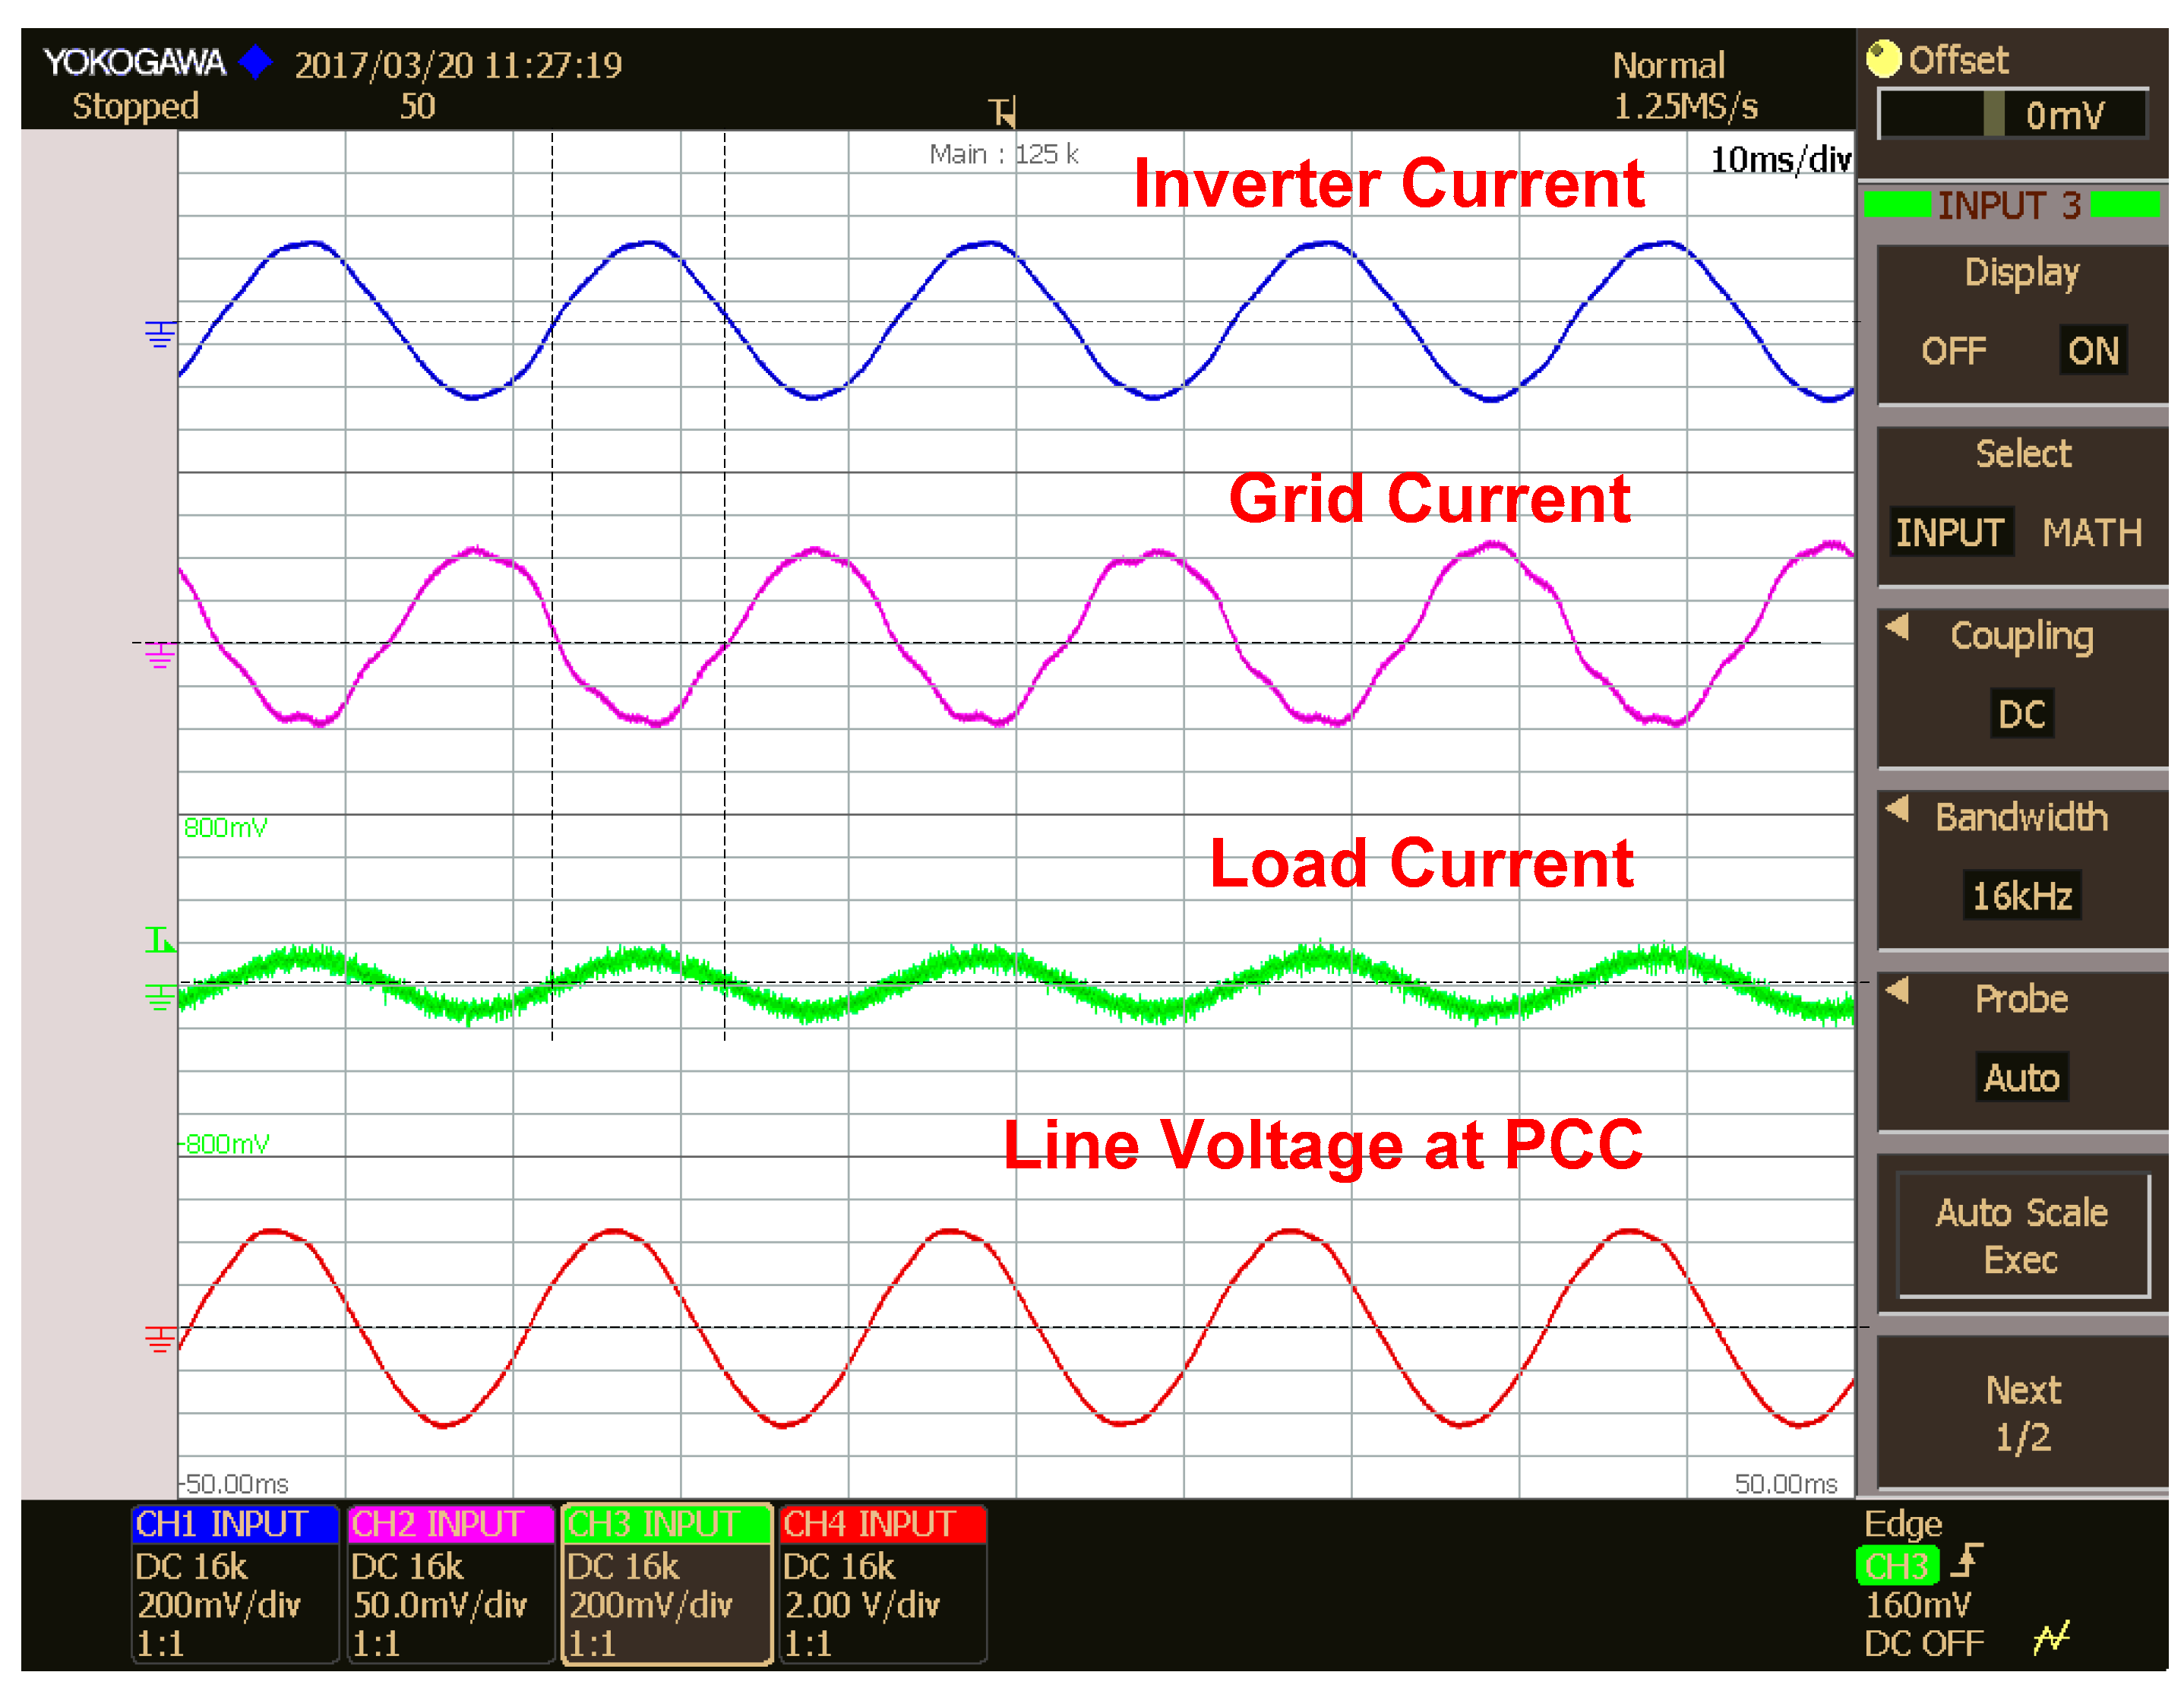
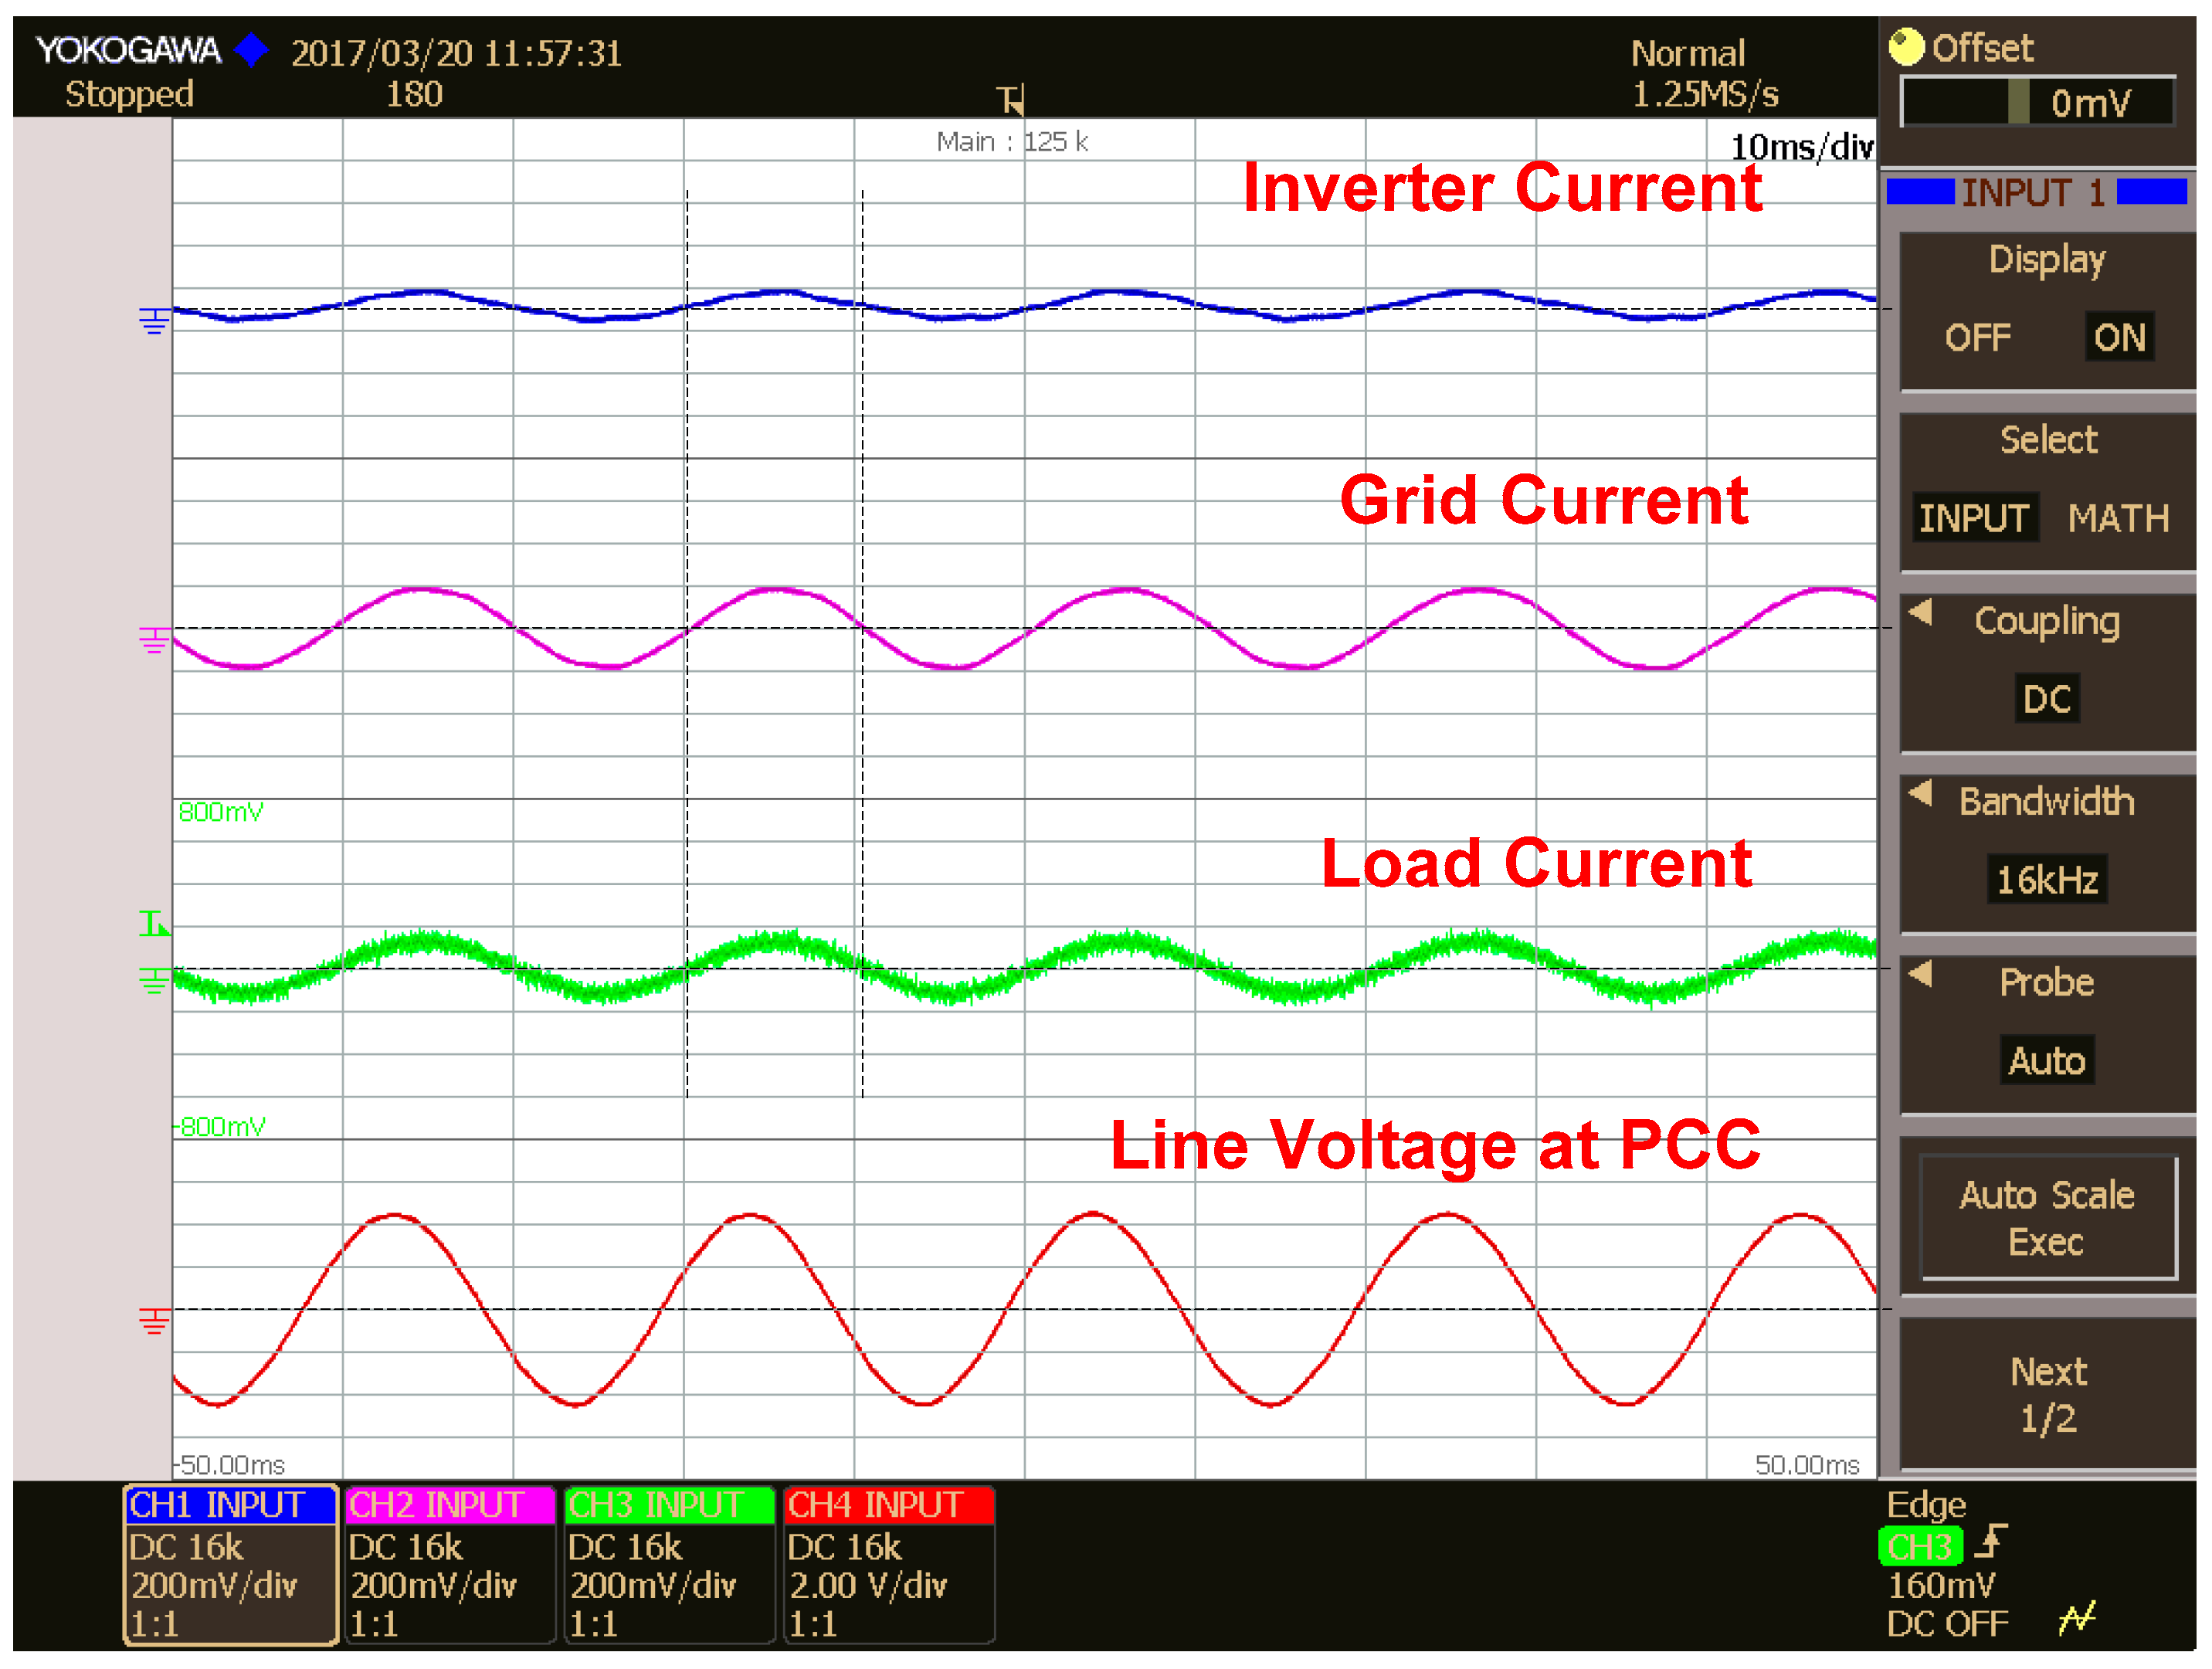
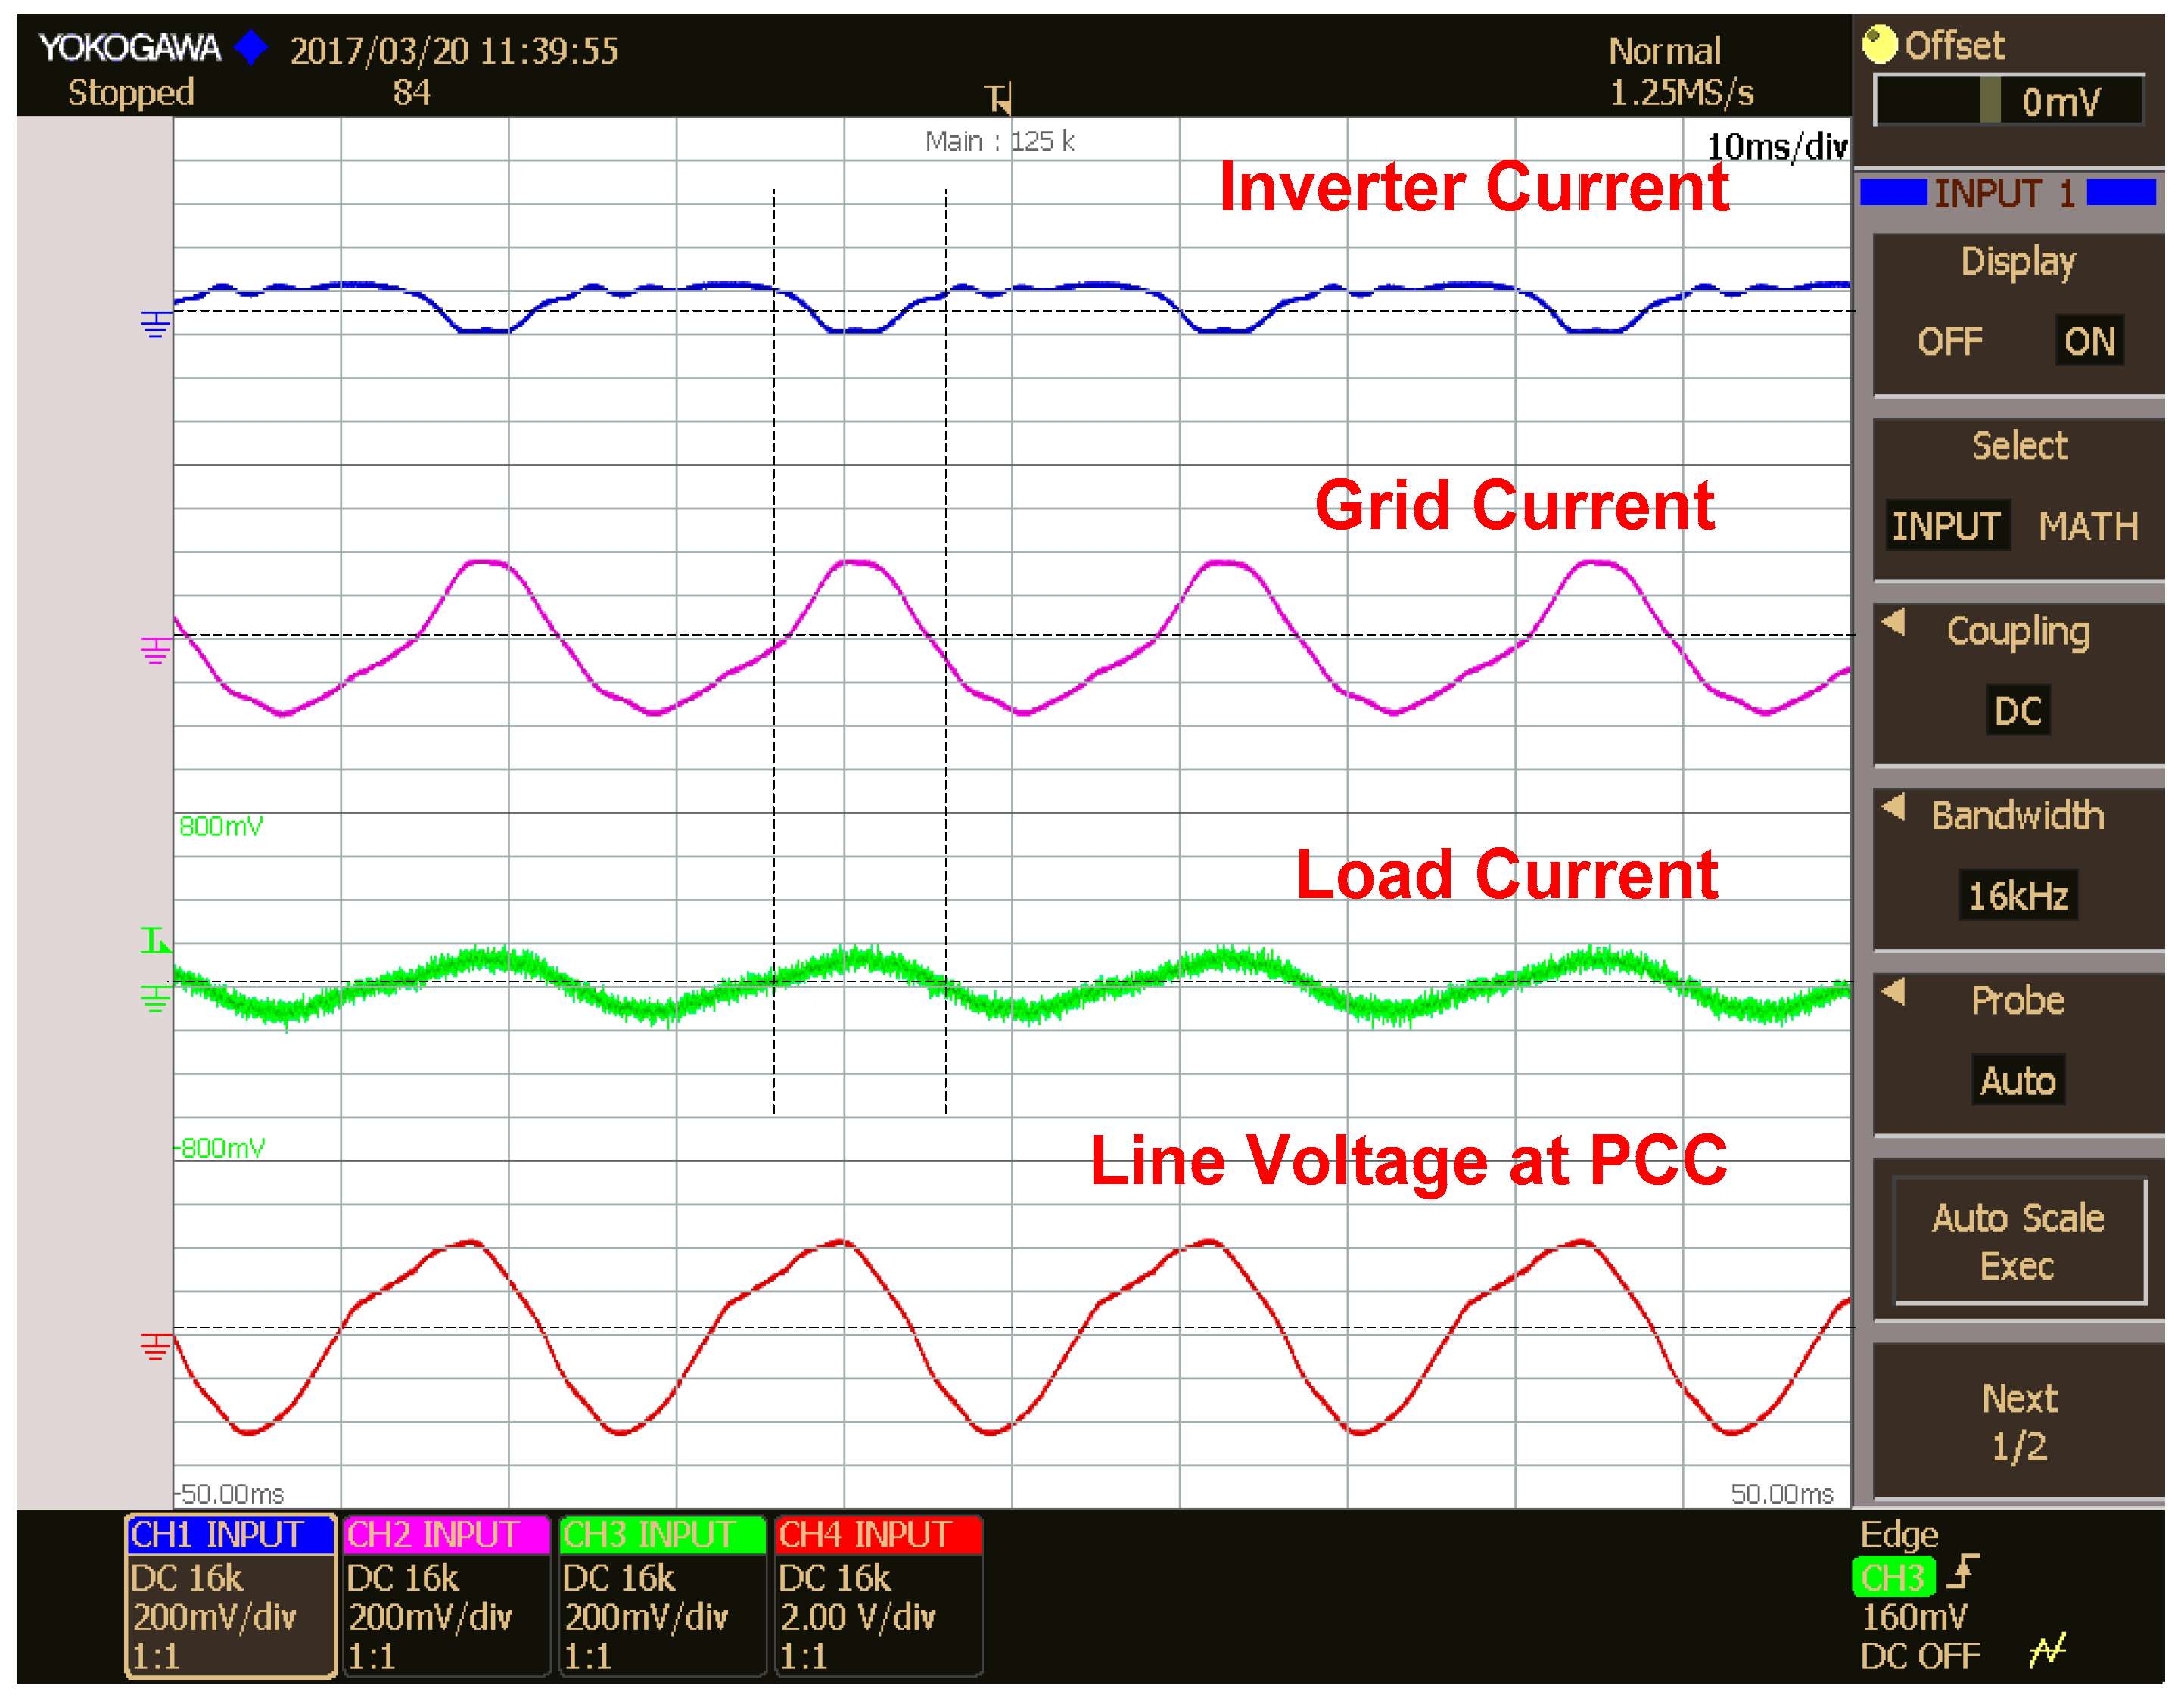
5. Results and Discussions

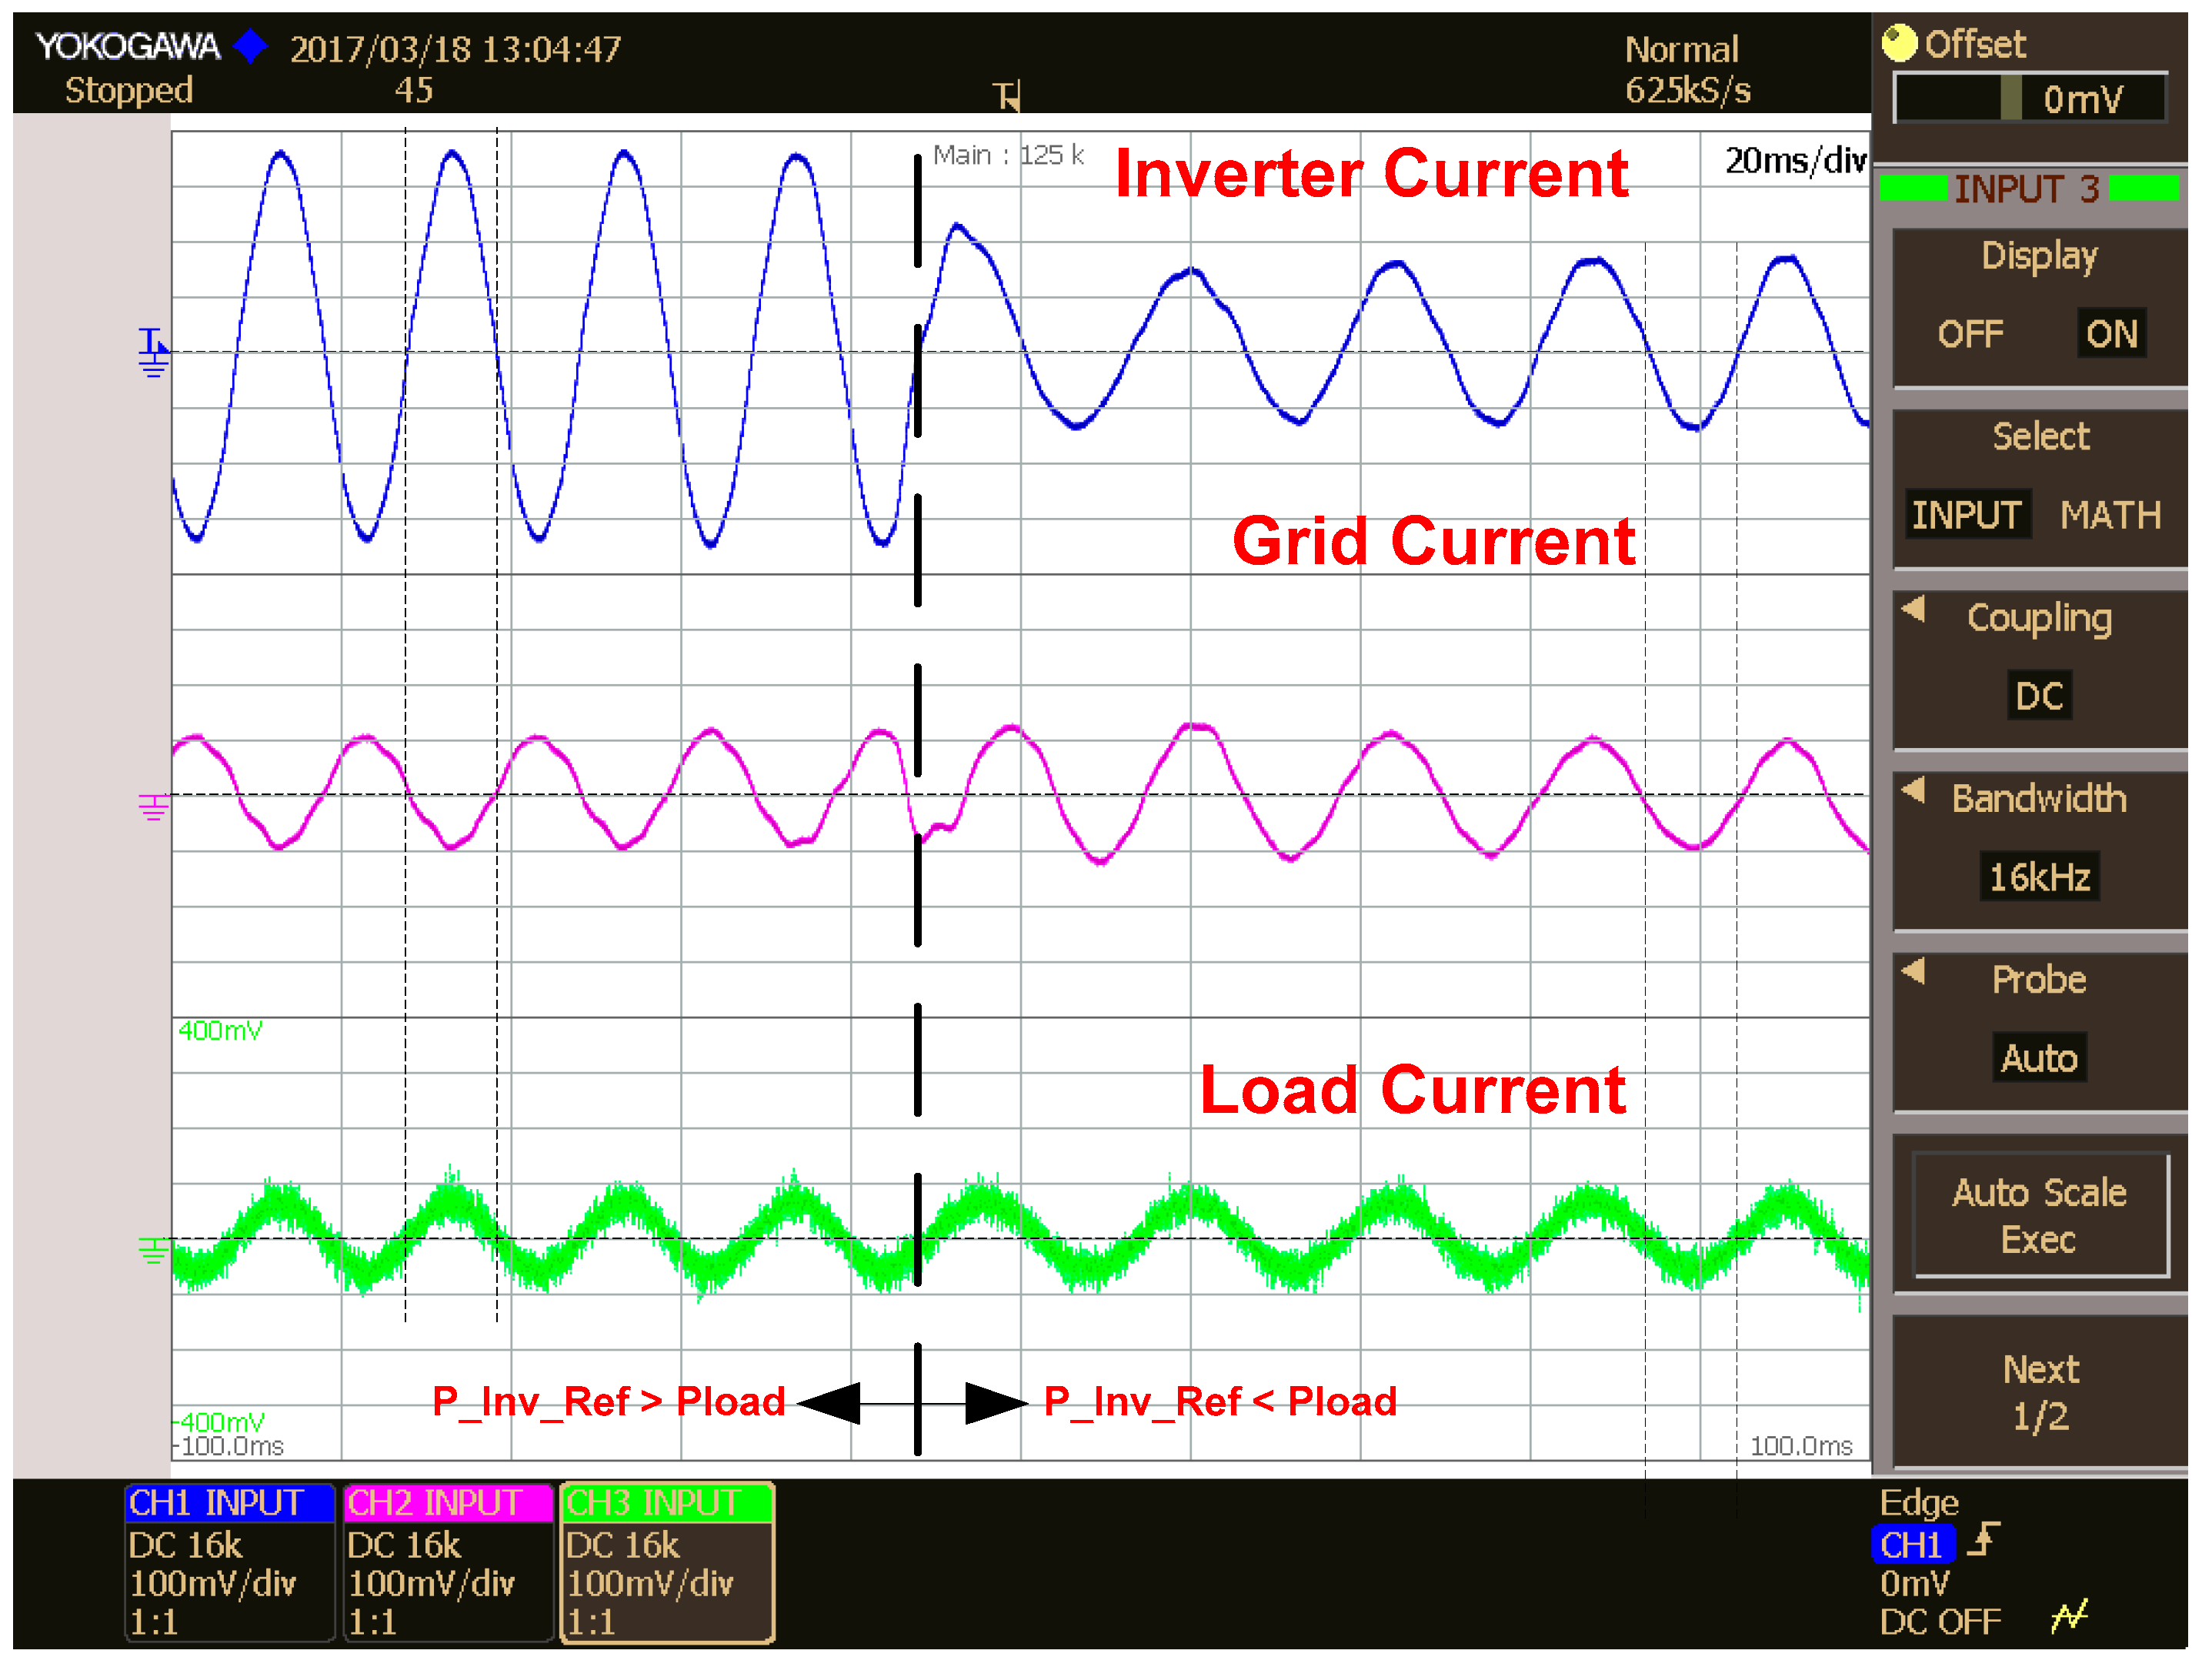
5.1. Inverter, Grid and Load Currents in Different Modes of Operation

Figure 9 shows the current waveforms in Mode1 of operation. Since the PV array can produce more than the minimum power required for charging the battery and feeding the internal loads connected to the plant, the additional power produced by the PV array is supplied to the grid. An irradiance of 1000 W/m2 is adjusted on the user interface panel, hence the PV array is producing the maximum possible power. From the presented result, it can be observed that the grid current is phase displaced by 180 degree with respect to the inverter current.
In Mode2 of operation, an irradiance of 0 W/m2 is adjusted on the user interface panel; hence the PV array cannot produce any power. The battery is in charged condition and supplies the power to the load based on the Amp-hour rating of the battery and the discharging time or backup time adjusted by the user.
Since the local loads consume more than the inverter supplied current, the remaining current is drawn from the grid as shown in Figure 10. Since the load is drawing current from both the sources, the grid current and the inverter current are in phase with each other.
In Mode3 Operation, the PV array cannot produce any power and the battery is in discharged condition. Since the battery is to be charged, the grid supplies the necessary charging current to the battery and the current required for the local loads as shown in Figure 11.
The dynamic response of the system to a step change in inverter reference power is shown in Figure 12.
When the inverter power reference is more than the local load requirement then the inverter is supplying current to grid and load. Since the grid is receiving the current, the phase displacement between grid and inverter currents is 180 degrees. After a step change in the reference power, since the reference power is less than the load requirement, the load current is supplied from both the inverter and the grid, hence the both the currents are in phase with each other. With the present controls, the system reaches the steady state within one cycle time.

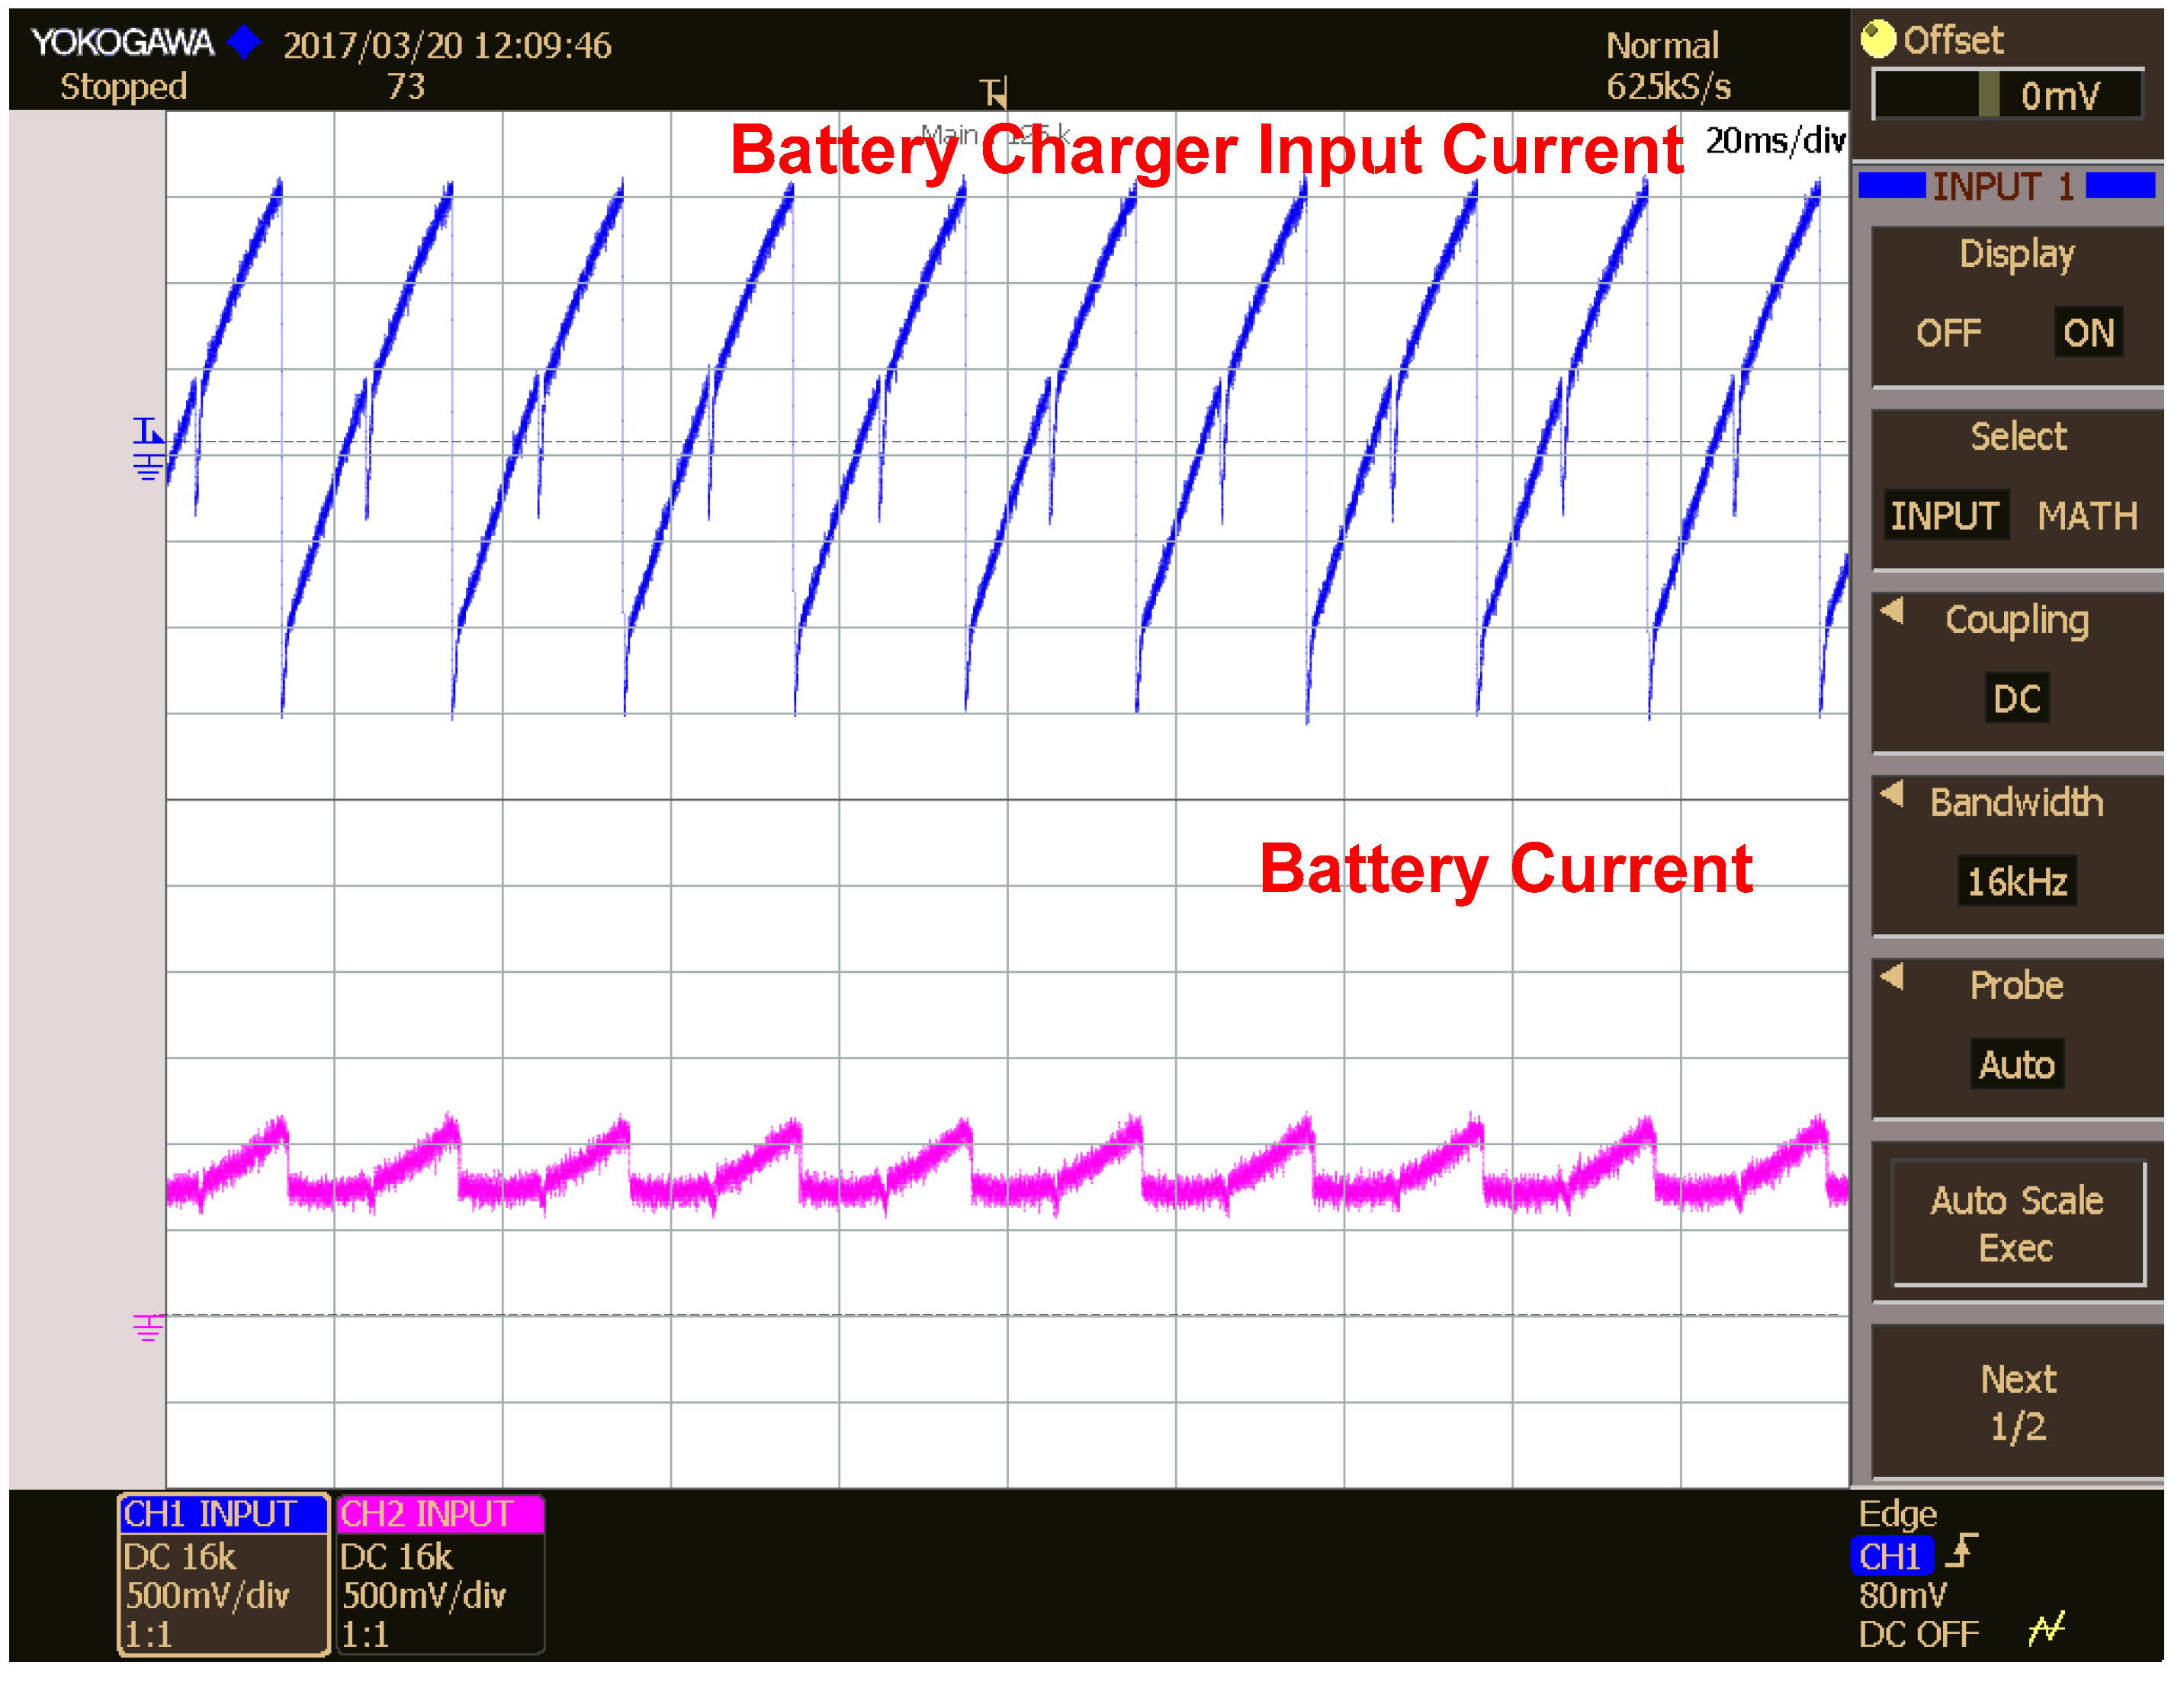
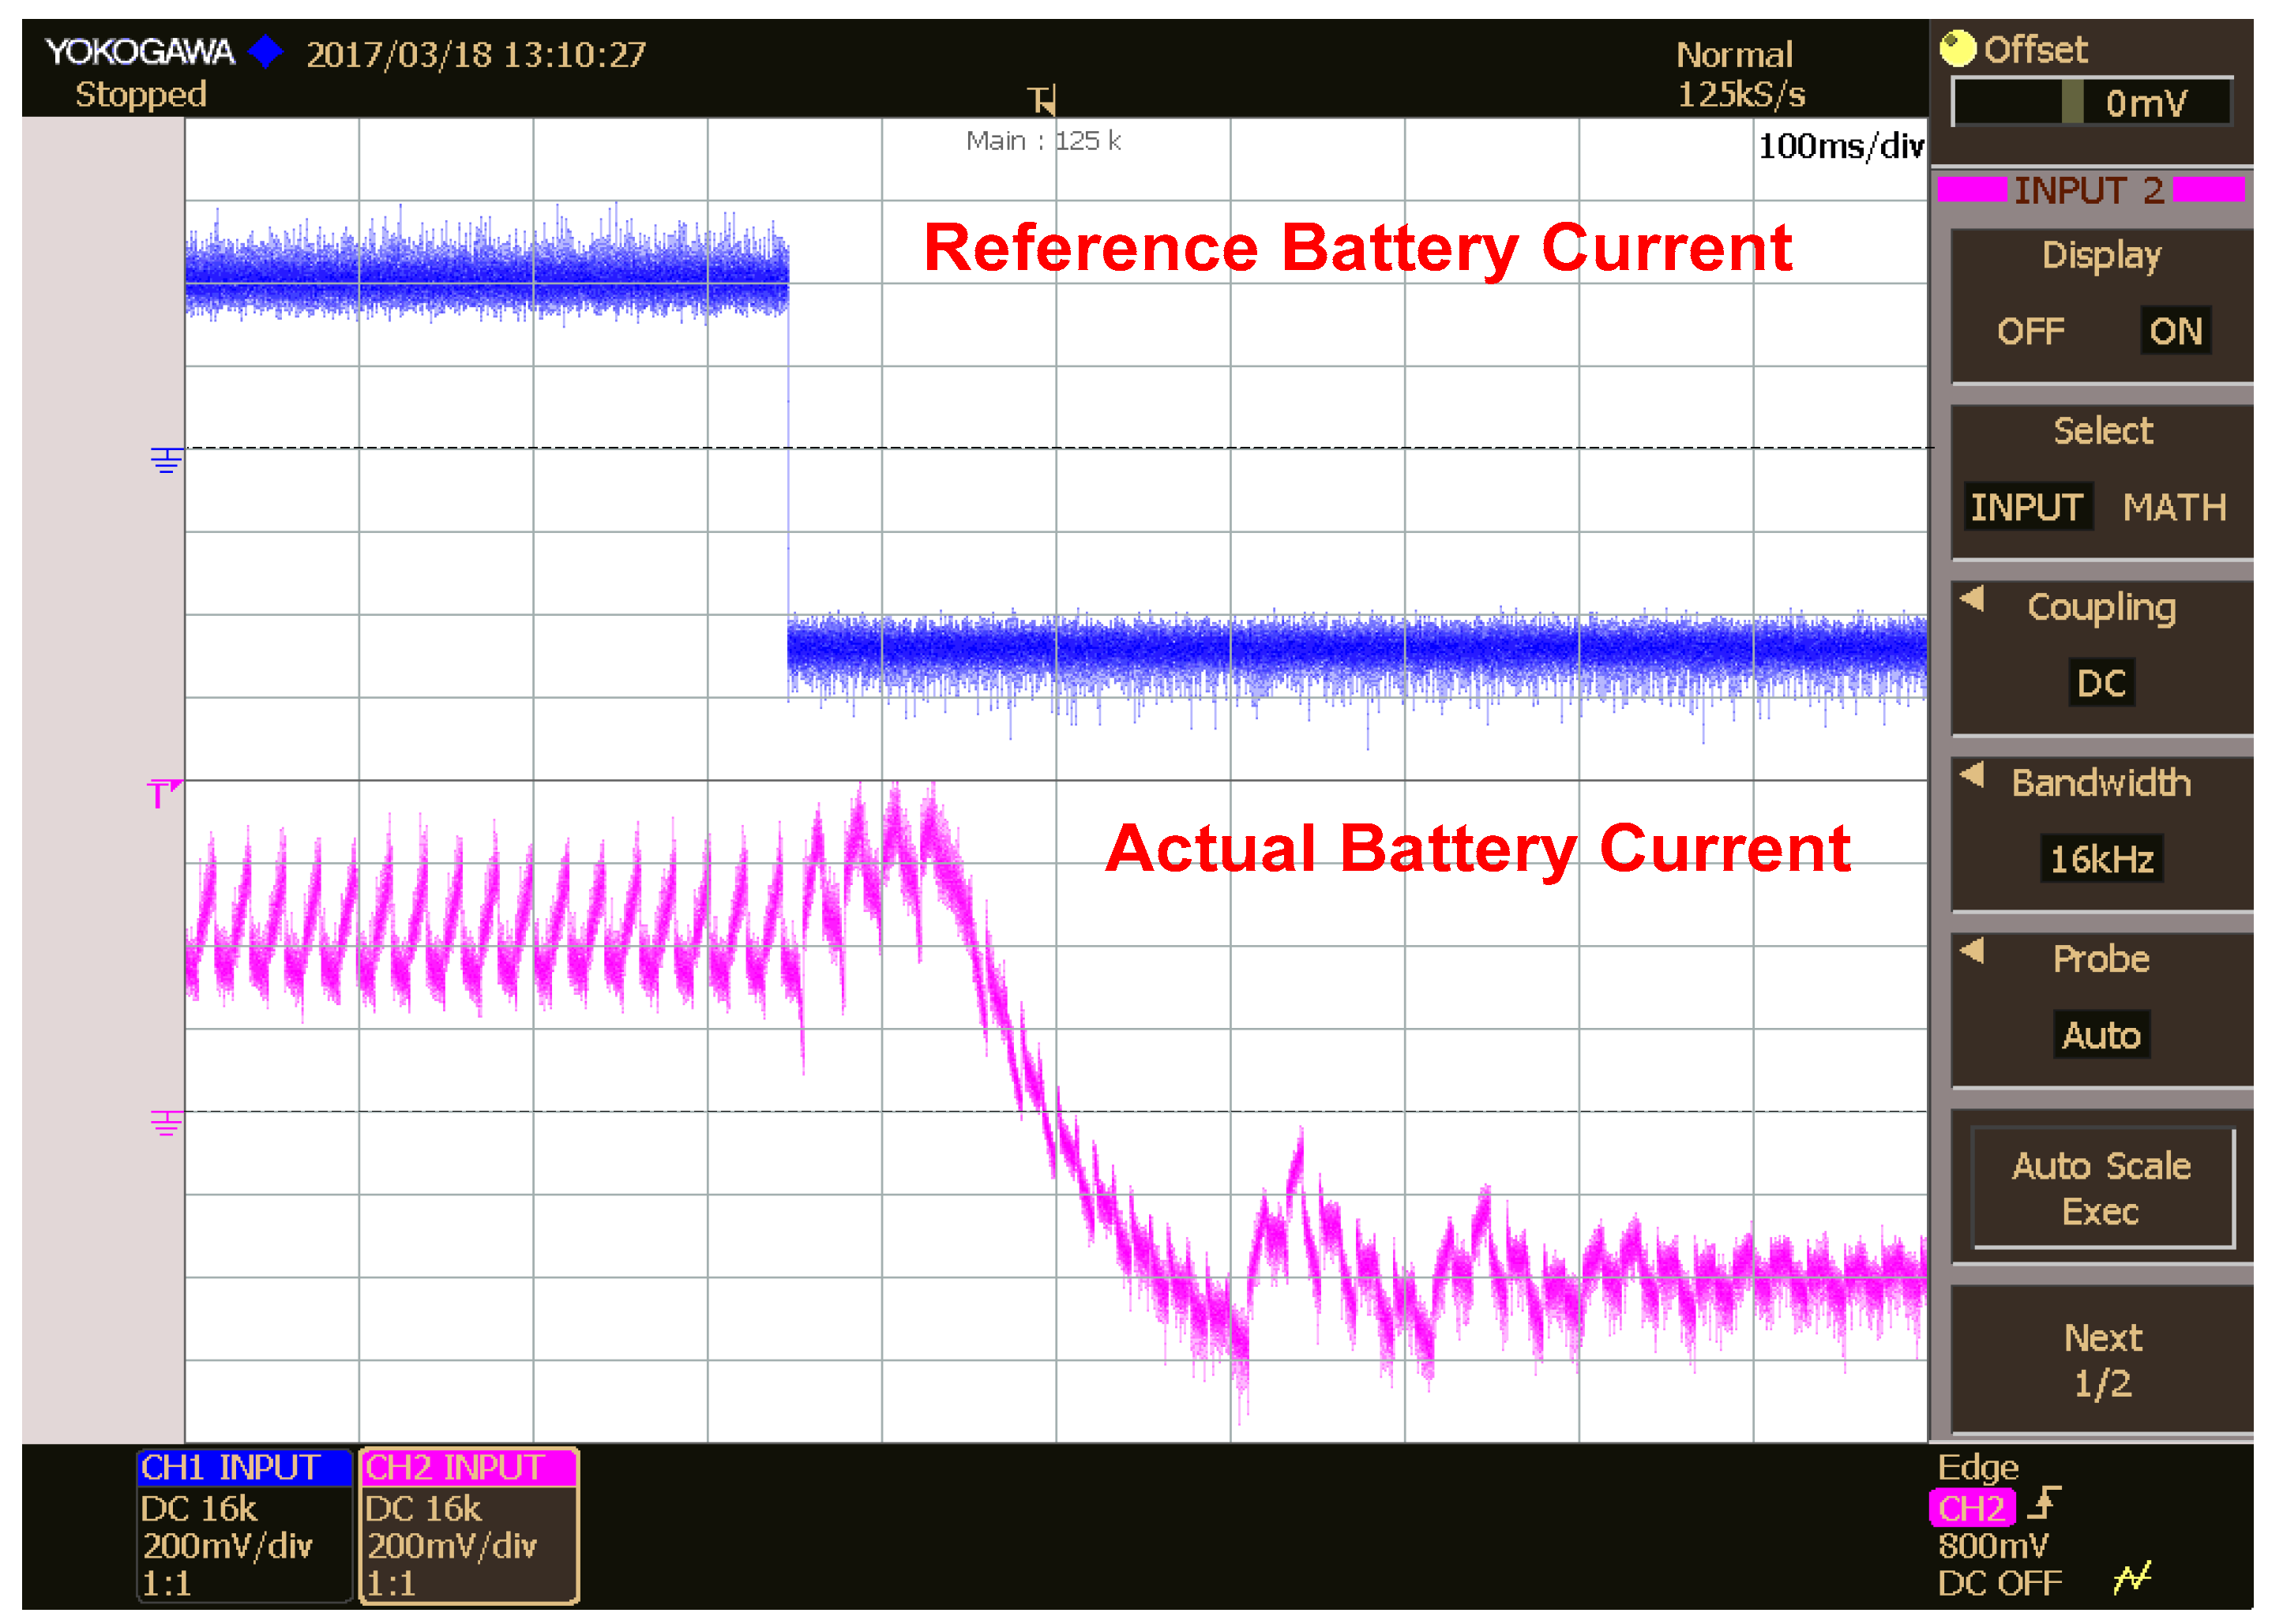
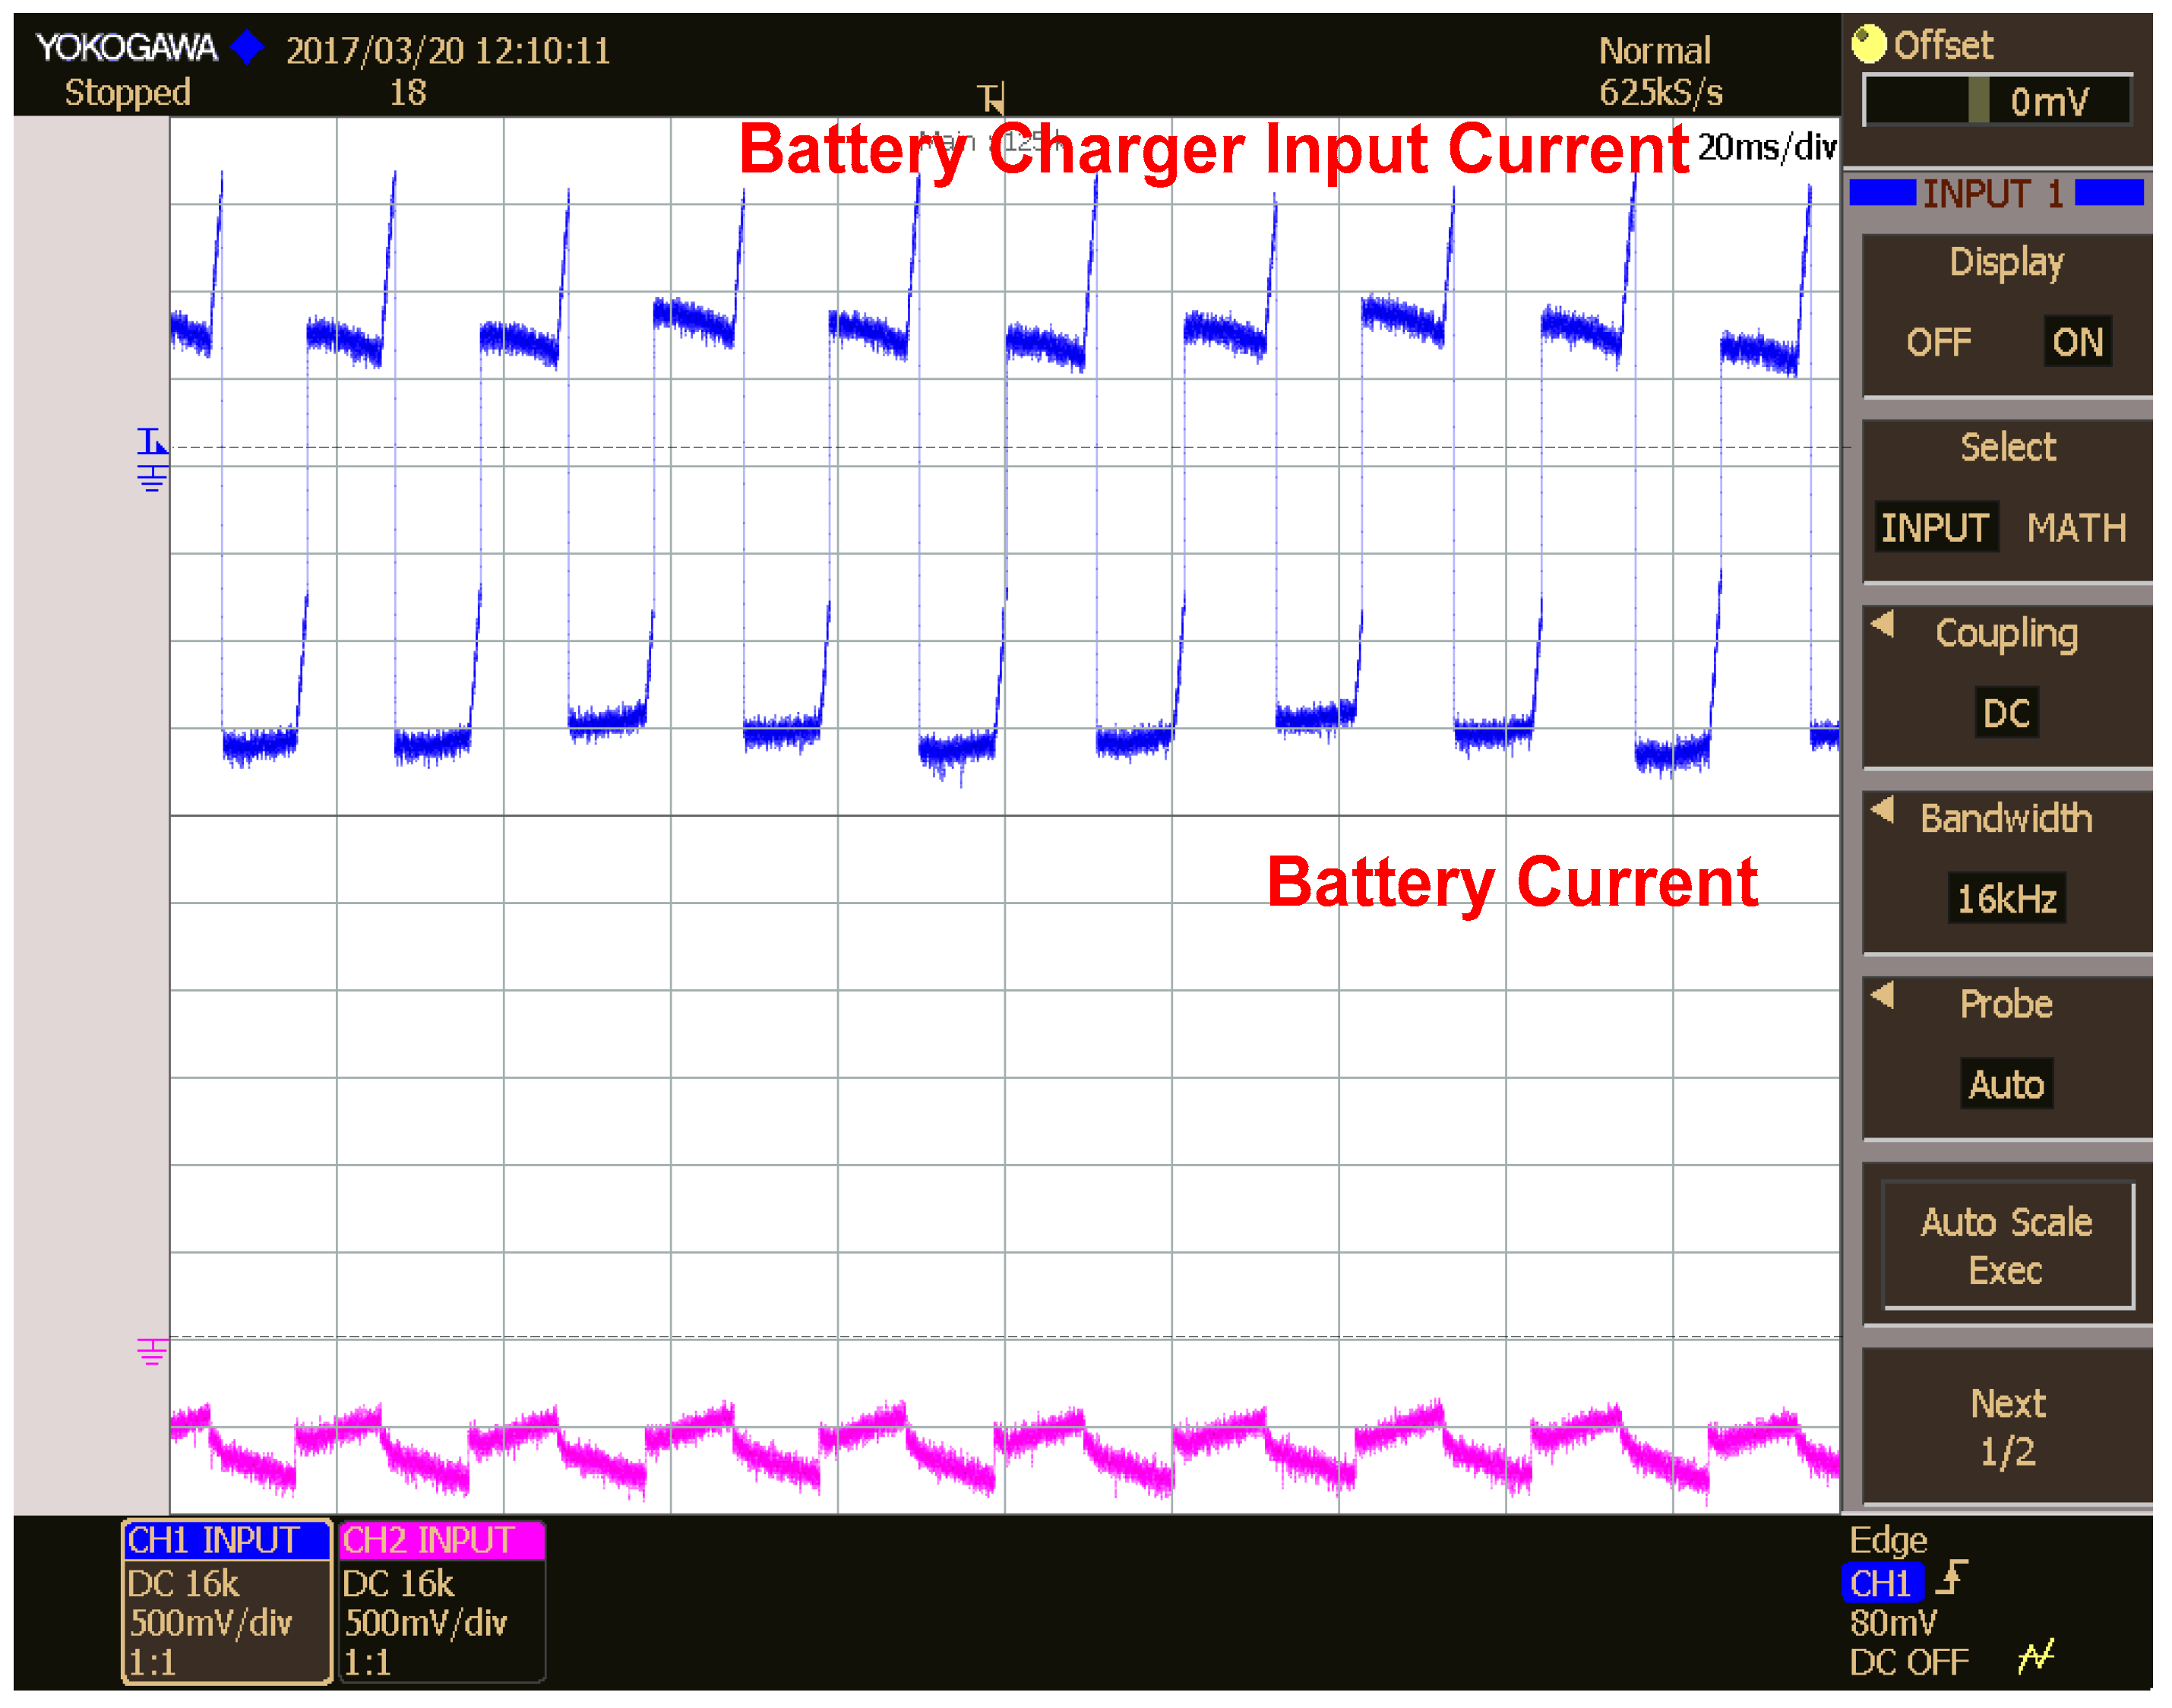
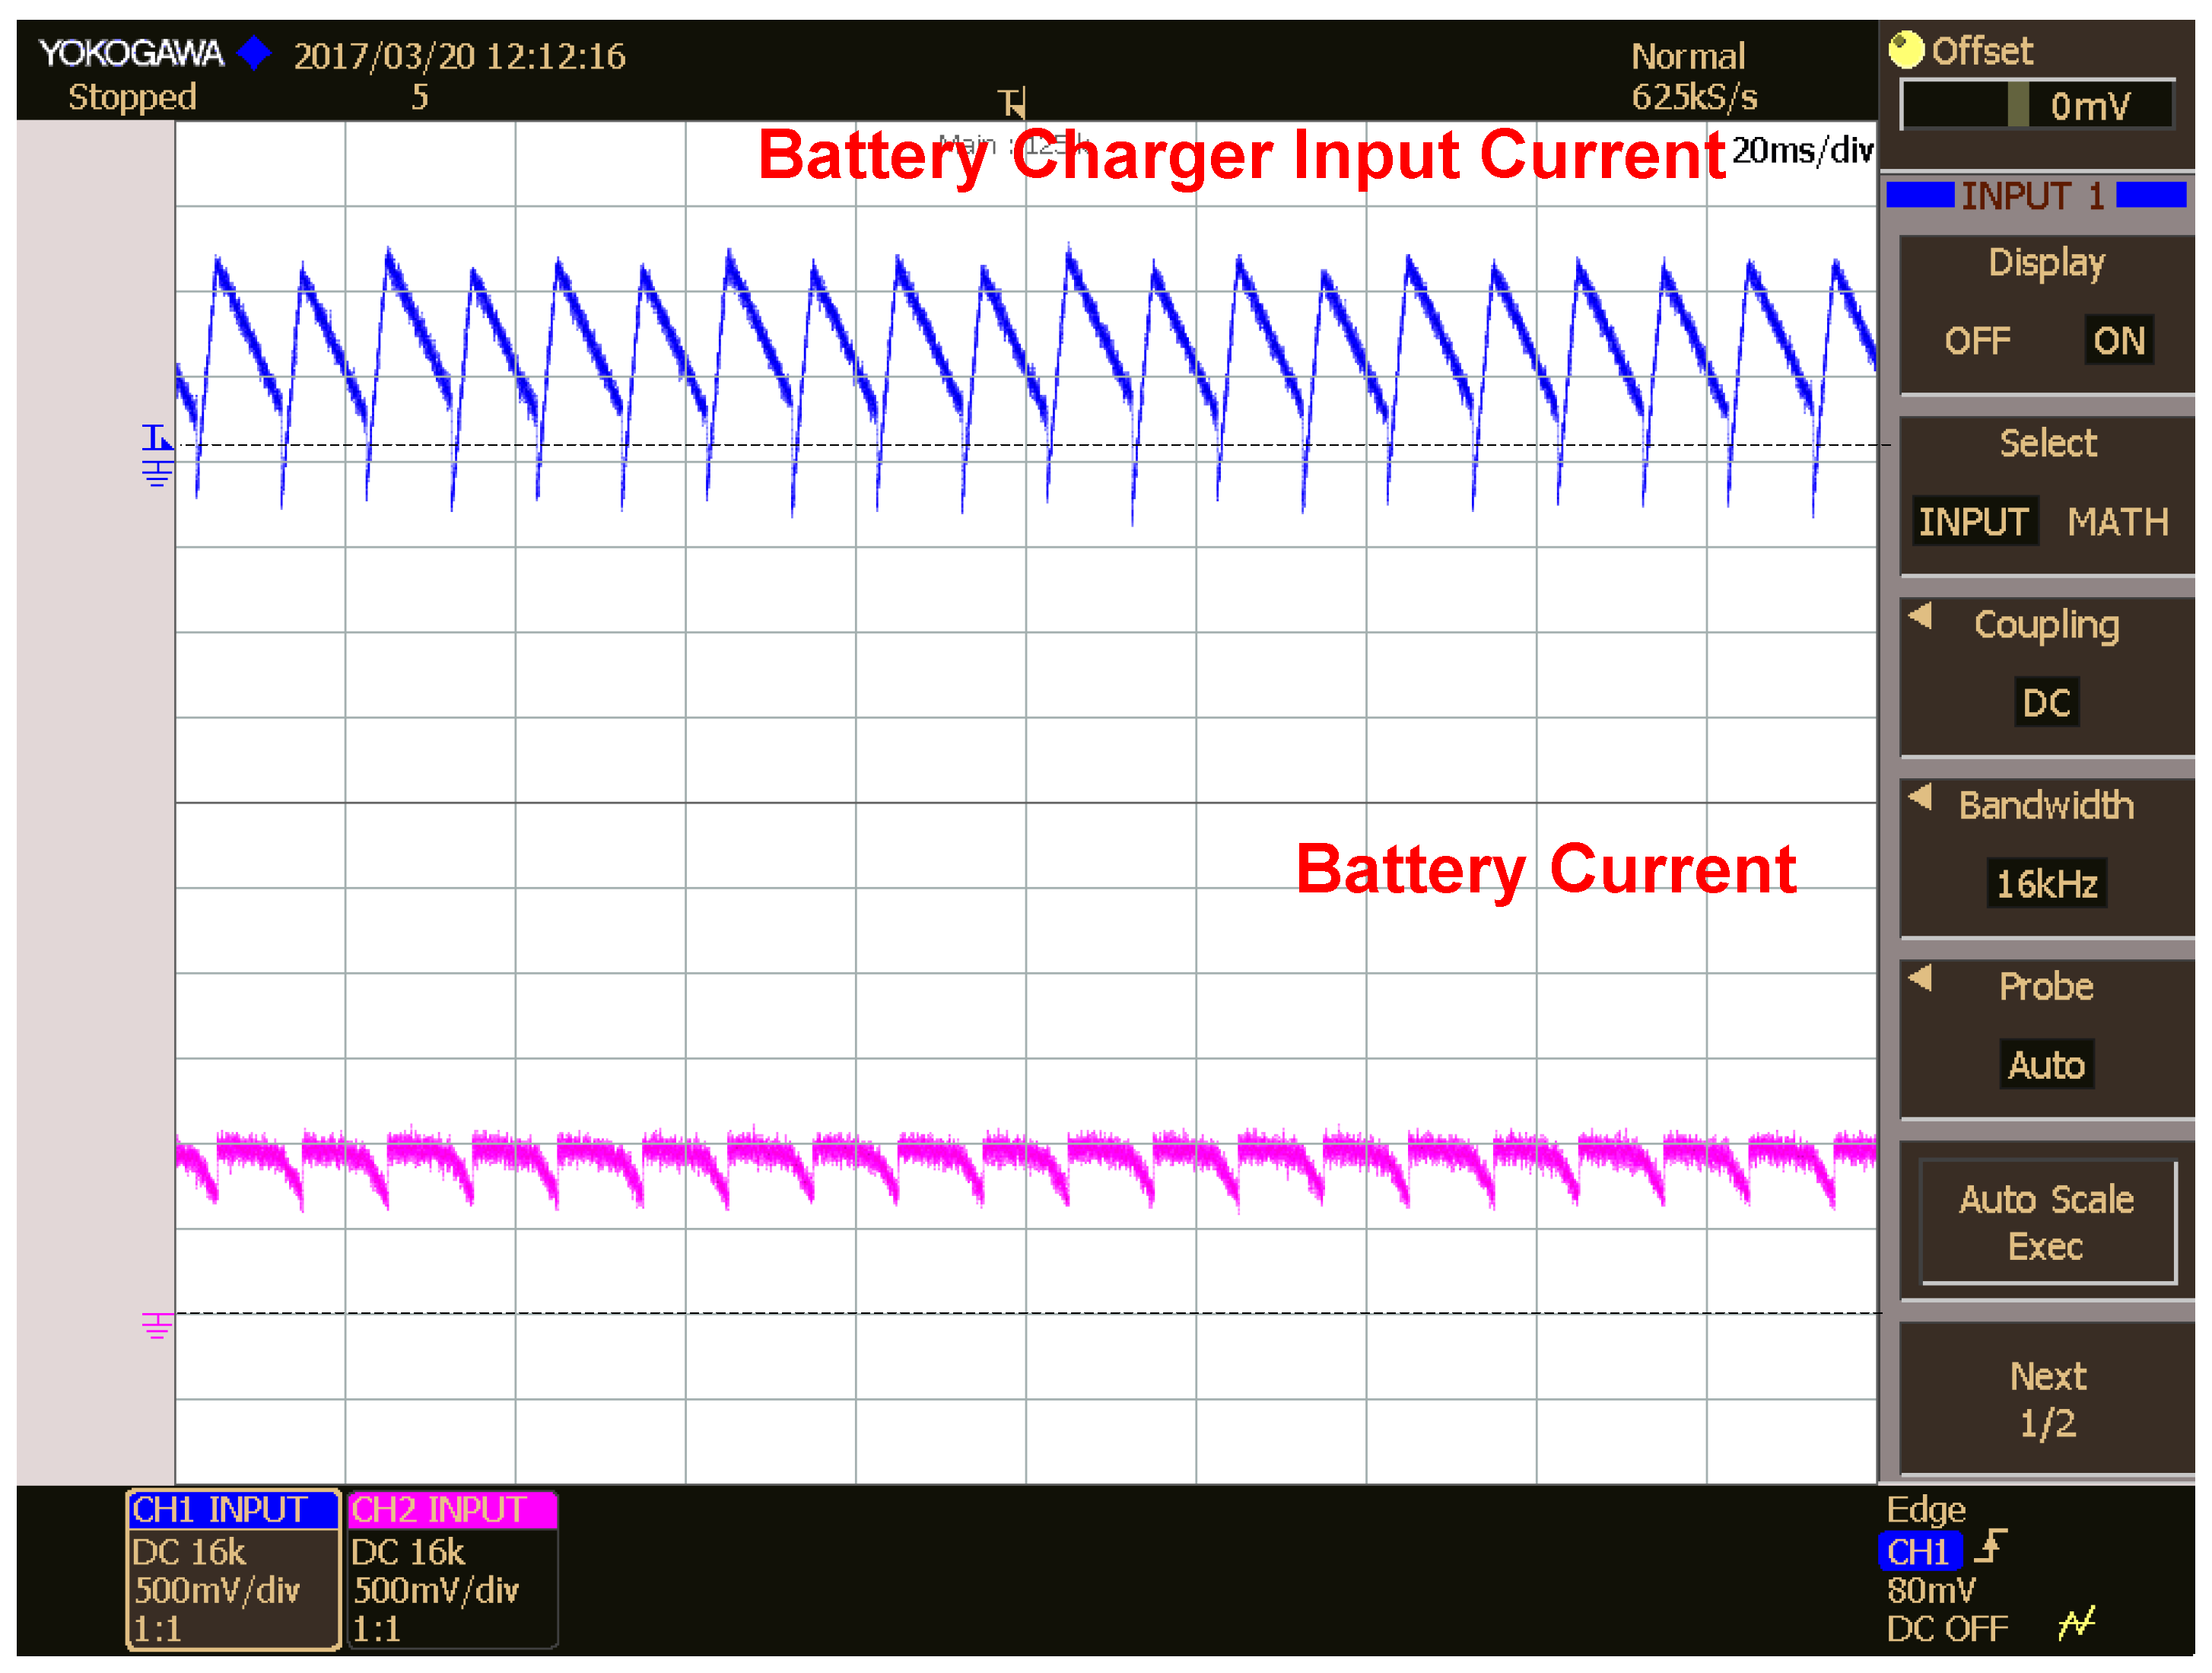
5.2. Battery Charger Input and Output Currents in Different Modes of Operation

Battery current is considered as positive during charging and negative during discharging of the battery. The battery will be in charged condition in Mode1 and Mode3 of operations as explained earlier. During charging, depending on the SOC of the battery, the charging current reference is obtained and the controller carries the closed loop current control of the battery charger. The battery charger input and output currents for different modes of operation are discussed below. In Mode1 operation, since the battery is in charging condition, battery current and the average value of battery charger input current are positive, as shown in Figure 13.
In Mode2 of operation, when the PV array voltage is less than the minimum DC link voltage then the battery charger operates with closed loop voltage control and maintains a constant DC link voltage. The current through the battery depends on the Id Reference of the inverter which is obtained through the Amp-hour rating of the battery and the backup time required for the user. Since the battery is in discharging condition, battery current and the average value of the battery charger input current are negative, as shown in Figure 14.
Similar to Mode1, in Mode3 operation battery current and the average value of the battery charger input current are also positive as shown in Figure 15. The charging current required for the battery is provided from the grid supply in this case.
The dynamic response of the battery charger system is observed by applying a step change in the battery current reference. The system takes approximately 250 milliseconds to come to the steady state as shown in Figure 16.

6. Future Scope

The results presented in this paper are obtained through real-time digital simulations. A scaled down model of the plant i.e., power circuit can also be made to test the controller and control algorithm. A predictive diagnostic in high-power transformers used in traction grade uninterruptible power supplies is presented in [20]. In similar lines, predictive diagnosis of the system components in a grid energy storage system can also be addressed as future work.
The presented system can also be extended for smart grid applications by incorporating additional energy sources along with the PV and battery, then as future work, the security and privacy problems in this smart grid can be addressed, as discussed in [21].
In this paper, design and control of grid energy storage system with a conventional PV inverter is explained in detail. Additional feature reactive power compensation can be incorporated to make the system work as PV-STATCOM. This system can also be extended for high power applications by using multilevel configurations for the PV inverter [22,23].

7. Conclusions

In this paper, a power balancing control for a grid energy storage system is presented. The PBC technique is implemented on a TMS320F2812 processor-based controller card and tested. Dynamic responses of the inverter and battery charger system are verified by applying a step change in the reference values. From the presented HIL results, it is observed that the performance of PBC control is satisfactory in all three modes of operation and good dynamic performance is also achieved using this technique. As the controls are tested through HIL simulations in this work, plant parameters are considered as ideal whereas the plant parameters vary with operating temperatures in real time operation. Hence, minor modifications in plant parameters and tuning of control parameters are required to implement the proposal on areal system. The same system can be extended further to have the feature of reactive power compensation through the modified PBC control.

Acknowledgments

No funding resources.

Author Contributions

Sridhar Vavilapalli, Sanjeevikumar Padmanaban, Umashankar Subramaniam had developed the originally proposed research work and implemented with numerical simulation software and real time RTDS system for investigation and performance validation. Sanjeevikumar Padmanaban, Umashankar Subramaniam, Lucian Mihet-Popa contributed their expertise in the proposed subject of research and verification of the obtained results based on theoretical concepts and insight background. All authors involved to articulate the research work for its final depiction as a research paper.

Conflicts of Interest

The authors declare no conflict of interest.

References

  1. Mihet-Popa, L.; Bindner, H. Simulation models developed for voltage control in a distribution network using energy storage systems for PV penetration. In Proceedings of the 39th Annual Conference of the IEEE Industrial Electronics Society—IECON’13, Vienna, Austria, 10–13 November 2013; pp. 7487–7492. [Google Scholar]
  2. El Khateb, A.; Rahim, N.A.; Selvaraj, J. Ćuk-Buck Converter for Standalone Photovoltaic System. J. Clean Energy Technol. 2013, 1, 69–74. [Google Scholar] [CrossRef]
  3. Wu, T.; Xiao, Q.; Wu, L.; Zhang, J.; Wang, M. Study and implementation on batteries charging method of Micro-Grid photovoltaic systems. Smart Grid Renew. Energy 2011, 204, 324–329. [Google Scholar] [CrossRef]
  4. Choi, H.; Jang, M.; Ciobotaru, M.; Agelidis, V.G. Hybrid energy storage for large PV systems using bidirectional high-gain converters. In Proceedings of the 2016 IEEE International Conference on Industrial Technology (ICIT), Taipei, Taiwan, 14–17 March 2016; pp. 425–430. [Google Scholar]
  5. Shi, Y.; Li, R.; Xue, Y.; Li, H. Optimized operation of current-fed dual active bridge DC–DC converter for PV applications. IEEE Trans. Ind. Electron. 2015, 62, 6986–6995. [Google Scholar] [CrossRef]
  6. Bharathi, K.; Sasikumar, M. Voltage Compensation of Smart Grid using Bidirectional Intelligent Semiconductor Transformer and PV Cell. Indian J. Sci. Technol. 2016, 9, 1–8. [Google Scholar] [CrossRef]
  7. Mihet-Popa, L.; Koch-Ciobotaru, C.; Isleifsson, F.; Bindner, H. Development of tools for DER Components in a distribution network. In Proceedings of the 2012 XXth International Conference on Electrical Machines (ICEM), Marseille, France, 2–5 September 2012; pp. 1022–1031. [Google Scholar]
  8. Chen, M.; Rincon-Mora, G.A. Accurate electrical battery model capable of predicting runtime and I-V performance. IEEE Trans. Energy Convers. 2006, 21, 504–511. [Google Scholar] [CrossRef]
  9. MathWorks. Available online: https://in.mathworks.com/help/physmod/sps/powersys/ref/battery.html;jsessionid=96072057f2374167c734b7a8e92d (accessed on 15 June 2017).
  10. Koch-Ciobotaru, C.; Mihet-Popa, L.; Isleifsson, F.; Bindner, H. Simulation Model developed for a Small-Scale PV-System in a Distribution Network. In Proceedings of the 7th International Symposium on Applied Computational Intelligence and Informatics—IEEE SACI 2012, Timisoara, Romania, 24–26 May 2012; pp. 257–261. [Google Scholar]
  11. Rahman, S.A.; Varma, R.K.; Vanderheide, T. Generalised model of a photovoltaic panel. IET Renew. Power Gener. 2014, 8, 217–229. [Google Scholar] [CrossRef]
  12. Jeong, D.K.; Kim, H.S.; Baek, J.W.; Kim, J.Y.; Kim, H.J. Dual active bridge converter for Energy Storage System in DC microgrid. In Proceedings of the 2016 IEEE Conference and Expo Transportation Electrification Asia-Pacific (ITEC Asia-Pacific), Busan, Korea, 1–4 June 2016; pp. 152–156. [Google Scholar]
  13. Dutta, S.; Hazra, S.; Bhattacharya, S. A Digital Predictive Current-Mode Controller for a Single-Phase High-Frequency Transformer-Isolated Dual-Active Bridge DC-to-DC Converter. IEEE Trans. Ind. Electron. 2016, 63, 5943–5952. [Google Scholar] [CrossRef]
  14. Kumar, N.; Saha, T.K.; Dey, J. Sliding-mode control of PWM dual inverter-based grid-connected PV system: Modeling and performance analysis. IEEE J. Emerg. Sel. Top. Power Electron. 2016, 4, 435–444. [Google Scholar] [CrossRef]
  15. Toodeji, H.; Farokhnia, N.; Riahy, G.H. Integration of PV module and STATCOM to extract maximum power from PV. In Proceedings of the International Conference on Electric Power and Energy Conversion Systems, Sharjah, UAE, 10–12 November 2009; pp. 1–6. [Google Scholar]
  16. Serban, E.; Ordonez, M.; Pondiche, C.; Feng, K.; Anun, M.; Servati, P. Power management control strategy in photovoltaic and energy storage for off-grid power systems. In Proceedings of the 2016 IEEE 7th International Symposium on Power Electronics for Distributed Generation Systems (PEDG), Vancouver, BC, Canada, 27–30 June 2016; pp. 1–8. [Google Scholar]
  17. Sikkabut, S.; Mungporn, P.; Ekkaravarodome, C.; Bizon, N.; Tricoli, P.; Nahid-Mobarakeh, B.; Thounthong, P. Control of High-Energy High-Power Densities Storage Devices by Li-ion Battery and Supercapacitor for Fuel Cell/Photovoltaic Hybrid Power Plant for Autonomous System Applications. IEEE Trans. Ind. Appl. 2016, 52, 4395–4407. [Google Scholar] [CrossRef]
  18. Merabet, A.; Ahmed, K.T.; Ibrahim, H.; Beguenane, R.; Ghias, A.M. Energy Management and Control System for Laboratory Scale Microgrid Based Wind-PV-Battery. IEEE Trans. Sustain. Energy 2017, 8, 145–154. [Google Scholar] [CrossRef]
  19. Lemaire, M.; Sicard, P.; Belanger, J. Prototyping and Testing Power Electronics Systems Using Controller Hardware-In-the-Loop (HIL) and Power Hardware-In-the-Loop (PHIL) Simulations. In Proceedings of the Vehicle Power and Propulsion Conference (VPPC), Montreal, QC, Canada, 19–22 October 2015; pp. 1–6. [Google Scholar]
  20. Saponara, S.; Fanucci, L.; Bernardo, F.; Falciani, A. Predictive diagnosis of high-power transformer faults by networking vibration measuring nodes with integrated signal processing. IEEE Trans. Instrum. Measure. 2016, 65, 1749–1760. [Google Scholar] [CrossRef]
  21. Saponara, S.; Bacchillone, T. Network architecture, security issues, and hardware implementation of a home area network for smart grid. J. Comput. Netw. Commun. 2012, 2012, 534512. [Google Scholar] [CrossRef]
  22. Sridhar, V.; Umashankar, S. A comprehensive review on CHB MLI based PV inverter and feasibility study of CHB MLI based PV-STATCOM. Renew. Sustain. Energy Rev. 2017, 78, 138–156. [Google Scholar] [CrossRef]
  23. Das, V.; Sanjeevikumar, P.; Karthikeyan, V.; Rajasekar, S.; Blaabjerg, F.; Pierluigi, S. Recent Advances and Challenges of Fuel Cell Based Power System Architectures and Control—A Review. Renew. Sustain. Energy 2017, 73, 10–18. [Google Scholar] [CrossRef]
Figure 1. Generalized block diagram of a grid energy storage system in photo voltaic applications.
Energies 10 00928 g001
Figure 2. Buck-boost chopper-based energy storage system configurations for photo voltaic applications (a); two stage conversion with battery directly connected to DC Link (b); single stage conversion with chopper based Battery charger (c); two stage conversion with chopper based battery charger (d); dual active bridge based photo voltaic inverter with chopper based battery charger.
Energies 10 00928 g002
Figure 3. Dual active bridge-based energy storage system for a grid connected PV system.
Energies 10 00928 g003
Figure 4. Control block diagram of the DAB-based battery charger.
Energies 10 00928 g004
Figure 5. Control block diagram of a grid-connected photo voltaic inverter.
Energies 10 00928 g005
Figure 6. Algorithm for power balancing control of grid energy storage system in photo voltaic applications.
Energies 10 00928 g006
Figure 7. Block diagram for hardware-in-the-loop simulation of the proposed grid energy storage system.
Energies 10 00928 g007
Figure 8. Hardware-in-the-loop simulation setup for the proposed grid energy storage system for photo voltaic applications.
Energies 10 00928 g008
Figure 9. Currents of inverter, grid, load, and voltage at PCC in Mode1 of operation.
Energies 10 00928 g009
Figure 10. Currents of inverter, grid, load , andvoltage at PCC in Mode2 of operation.
Energies 10 00928 g010
Figure 11. Currents of inverter, grid, load, and voltage at PCC in Mode3 of operation.
Energies 10 00928 g011
Figure 12. Currents of inverter, grid, load for a step change in reference power.
Energies 10 00928 g012
Figure 13. Battery charger input and output currents in mode1 operation.
Energies 10 00928 g013
Figure 14. Battery charger input and output currents in mode-2 operation.
Energies 10 00928 g014
Figure 15. Battery charger input and output currents in mode3 operation.
Energies 10 00928 g015
Figure 16. Battery charger reference and actual currents for a step change in reference current.
Energies 10 00928 g016
Table 1. Electrical specifications/requirements of the system.
SL. NOParameterValueUnitsRemarks
1Grid Voltage11kV3-Phase
2Grid Frequency (F)50Hz
3PCC Voltage415VRated Voltage of Local load
4Maximum PV-Inverter Power100kW
5Backup Power25kW25% of PV-Inverter Power
6Minimum Back Up Time4h
Table 2. Design calculations for the photo voltaic-inverter.
SL. NOParameterValueUnitsRemarks
1Power Rating100kW
2PCC Voltage (Vpcc)415V
3Inverter RMS Current140APower/(1.732 *   PCC Voltage)
4Maximum Filter Drop6%Drop across L-C-L Filter
5Inverter Voltage (Vinv)440VPCC Voltage + filter Drop
6Minimum DC Link Voltage620VVdc = (Vinv/0.71) With SPWM
Selection of Filter Capacitor (C)
7Maximum Reactive Power(Qc)5%5% of 500 kVA i.e., 25 kVAR
8Current Rating of Capacitor (Ic)11.5AQc/PCC Voltage
9Maximum Capacitance85uFIc/(2 * pi * F * Vpcc)
10Selected Value of Capacitance80uF<Maximum capacitance
Selection of Inverter Side Filter Inductor (L1)
11Corner Frequency selected (Fc)1.25kHZSwitching Frequency/4
12Inductance of Inductor L1203uHFc = 1/[2 * pi * √(LC)]
13% Voltage Drop in Inductor L12.1%[Irms × (2 * pi * F * L1)]/Vpcc
Selection of Grid Side Filter Inductor (L2)
14Maximum Drop allowed across L23.9%Max Drop-% Drop across L1
15Maximum Inductance of L2382uH(3.9% * Vpcc)/[Irms * 2 * pi * F]
Table 3. Electrical parameters of the battery.
SL. NOParameterValueUnitsRemarks
Selection of Battery
1Nominal Voltage of Battery (Vnom)350V
2Maximum Battery Voltage406V116% of Vnom for Li-Ion battery
3Minimum battery Voltage306V>87.5% for Safe operation
4Battery Rated Power25kW25% of PV-Inverter rating
5Maximum Battery Current72ABattery Power/Vnom
5Minimum Backup time4h
6Ah Rating of Battery288AhCurrent X Backup Time
7Battery Charging time8HPV Power availability time
8Charging Current (I_Charging)36AAh Rating/Charging Time
9PV Power Required for Charging12.5kWVnom × I_charging
Table 4. Photo voltaic array selection.
SL. NOParameterValueUnitsRemarks
PV Array Requirement
1Minimum Power Requirement113kWPV Inverter + Charging Power
2Minimum PV Voltage (V_PV_Min)620VVdc Minimum Refer Table 2
3Maximum PV Current182APower/V_PV_Min
Details of Selected PV Module
4MakeSunpower
5Type NumberSPR-435NE-WHT-D
6Operating Temperature Range25–55 °C
Electrical Ratings of Selected PV Module at 25 °C
7Power Rating of Each Module 435WFrom Datasheet
8Open Circuit Voltage (Voc) 85.6V
9Short Circuit Current (Isc) 6.43A
10MPP Voltage (Vmpp72.9V
11MPP Current (Impp) 5.97A
Temperature Coefficients of Selected PV Module
12Temperature Coefficient for power−0.38%/KFrom Datasheet
13Temperature Coefficient for Voltage−233.5mV/K
14Temperature Coefficient for Voltage3.5mA/K
Electrical Ratings of Selected PV Module at 55 °C
15Open Circuit Voltage (Voc) 78.59VDerived From Values at 25 °C and the Temperature Coefficients
16Short Circuit Current (Isc) 6.535A
17MPP Voltage (Vmpp) 65.89V
18MPP Current (Impp) 6.08A
Selected PV Module Electrical Ratings in the Operating Temperature Range
19Minimum Voltage (Vmod_min)65.89VVmpp at 55 °C
20Maximum Voltage (Vmod_max)85.6VVoc at 25 °C
21Maximum Current (Imod_max)6.535AIsc at 55 °C
22Maximum power (Pmod_max)435WFrom Datasheet
Electrical Ratings of PV Array
23Minimum No. of Modules required (N)260No’sPV power/Pmod_max
24Minimum No. of Modules in Series (Nse)10No’sV_PV_Min/Vmod_min
25No. of Modules in parallel (Np)26No’sN/Nse
26Minimum Voltage of PV Array658.9VVmod_min × Nse
27Maximum Voltage of PV Array856VVmod_max × Nse
28Maximum power from PV Array113kWNse × Np × Pmod_max
Table 5. Electrical parameters of the battery charger system.
SL. NOParameterValueUnitsRemarks
Selection of Battery
1Battery Charger Rated Power25kWBattery discharging capacity
2Battery Charger Input Voltage 658–856VPV Operating Range
3Battery Charger Output Voltage306–406VBattery Operating Voltage
4Isolation Transformer Turns Ratio1:2
5Transformer Primary Current38ARated Power/Min Input Voltage
6Transformer Secondary Current82ARated Power/Min Output Voltage
7Minimum kVA of Primary32.5kVAPrimary Max Voltage × Current
8Minimum kVA of Secondary33.3kVASecondary Max Voltage × Current
9Selected Transformer KVA Rating35kVAMore than minimum kVA

