
Power Quality and Energy Efficiency in the Pre-Evaluation of an Outdoor Lighting Renewal with Light-Emitting Diode Technology: Experimental Study and Amortization Analysis


Abstract
:1. Introduction
- Eliminate inefficient lamp technologies. The European Eco-Design Directive (2009/125/EC) has banned mercury vapor lamps [3], promoting more modern devices such as LED luminaires.
- Limit the maximum levels of direct light (illuminance) and light emitted to the upper hemisphere. The standardization boards should specify minimum light levels for basic activities (walking or driving) and conservative top appropriate values for these areas [2]. This is important to avoid rebound effects: to increase illumination levels as lighting becomes “cheaper” [6].
- Enhance intelligent systems to generate light adaptive control to dim the emission flows according to the specific needs of the environment.
- Generate new lighting standards for different road types which are better adapted to real use requirements (UNE 13201:2015).
2. Electric Grid, Power Quality, and Light-Emitting Diode Lighting in Sustainable Cities
2.1. Grid Power Quality
- Transient: cold starts
- Eventual: Sustained under/over voltages
- Steady state: Harmonics, flickers, and frequency variations.
2.2. Power Quality and Light-Emitting Diode Drivers
3. Methodology
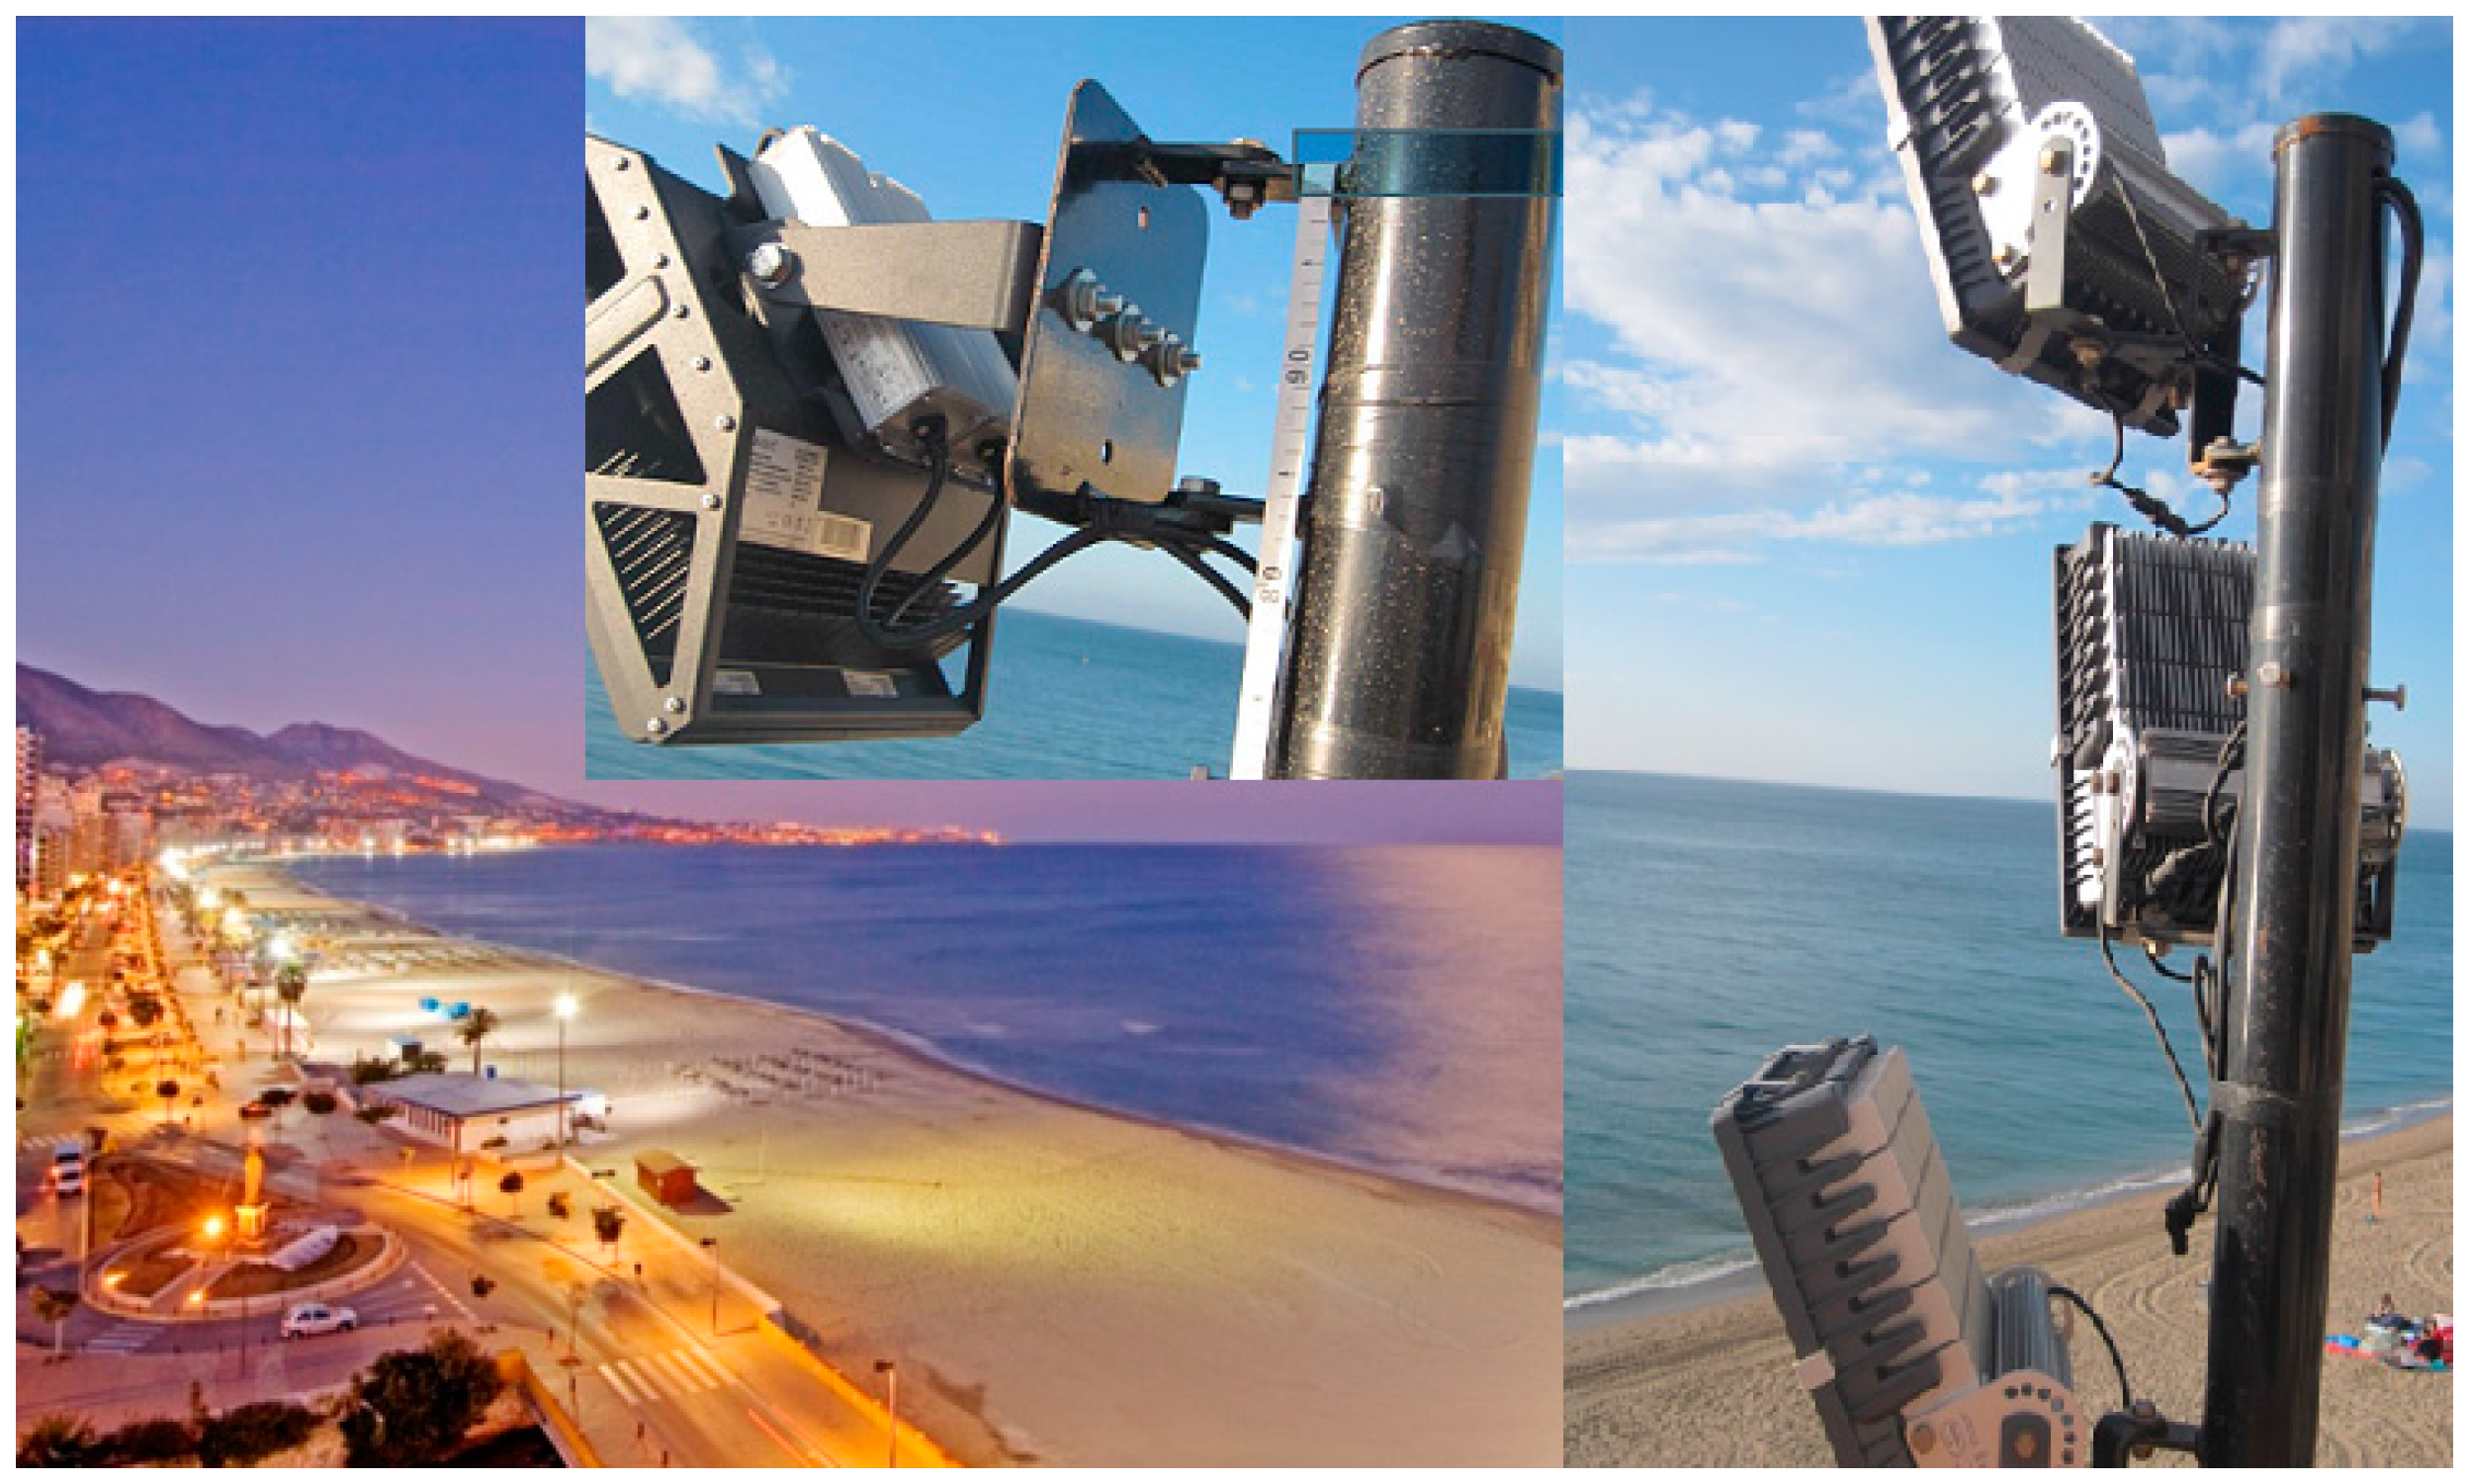
3.1. Case of Study
- A high-precision clamp ammeters (model: K2413R, manufacturer: KYORITSU, Tokyo, Japan) with a very wide measurement range (5 mA–1000 A) and a sample rate of three values per sec. This equipment is not specifically designed to capture peaks of very short duration and thus does not provide an accurate quantitative value of inrush currents. However, taking a sequence of 10 measurements and recording the highest value, we can make a meaningful comparison of the performance of the different projectors being tested.
- A high-frequency network analyzer (model: AR6, manufacturer: CIRCUITOR, Barcelona, Spain) capable of measuring stationary values of voltage, current, power, waveform, phase, and harmonics. Researchers such as Bergen et al. [33] state that “many SSL devices produce highly distorted current waveforms and harmonic content well into the hundreds of kilohertz” and “additional distortion of the waveform can also be introduced when dimming the SSL device”. Consequently, power analyzers with low bandwidth, non-continuous or an inadequately sampled current waveform will have difficulty in accurately profiling the current waveform when measuring SSL devices.
3.2. Experimental Procedure
4. Results
4.1. Field Test Set
4.2. Thermal Analysis
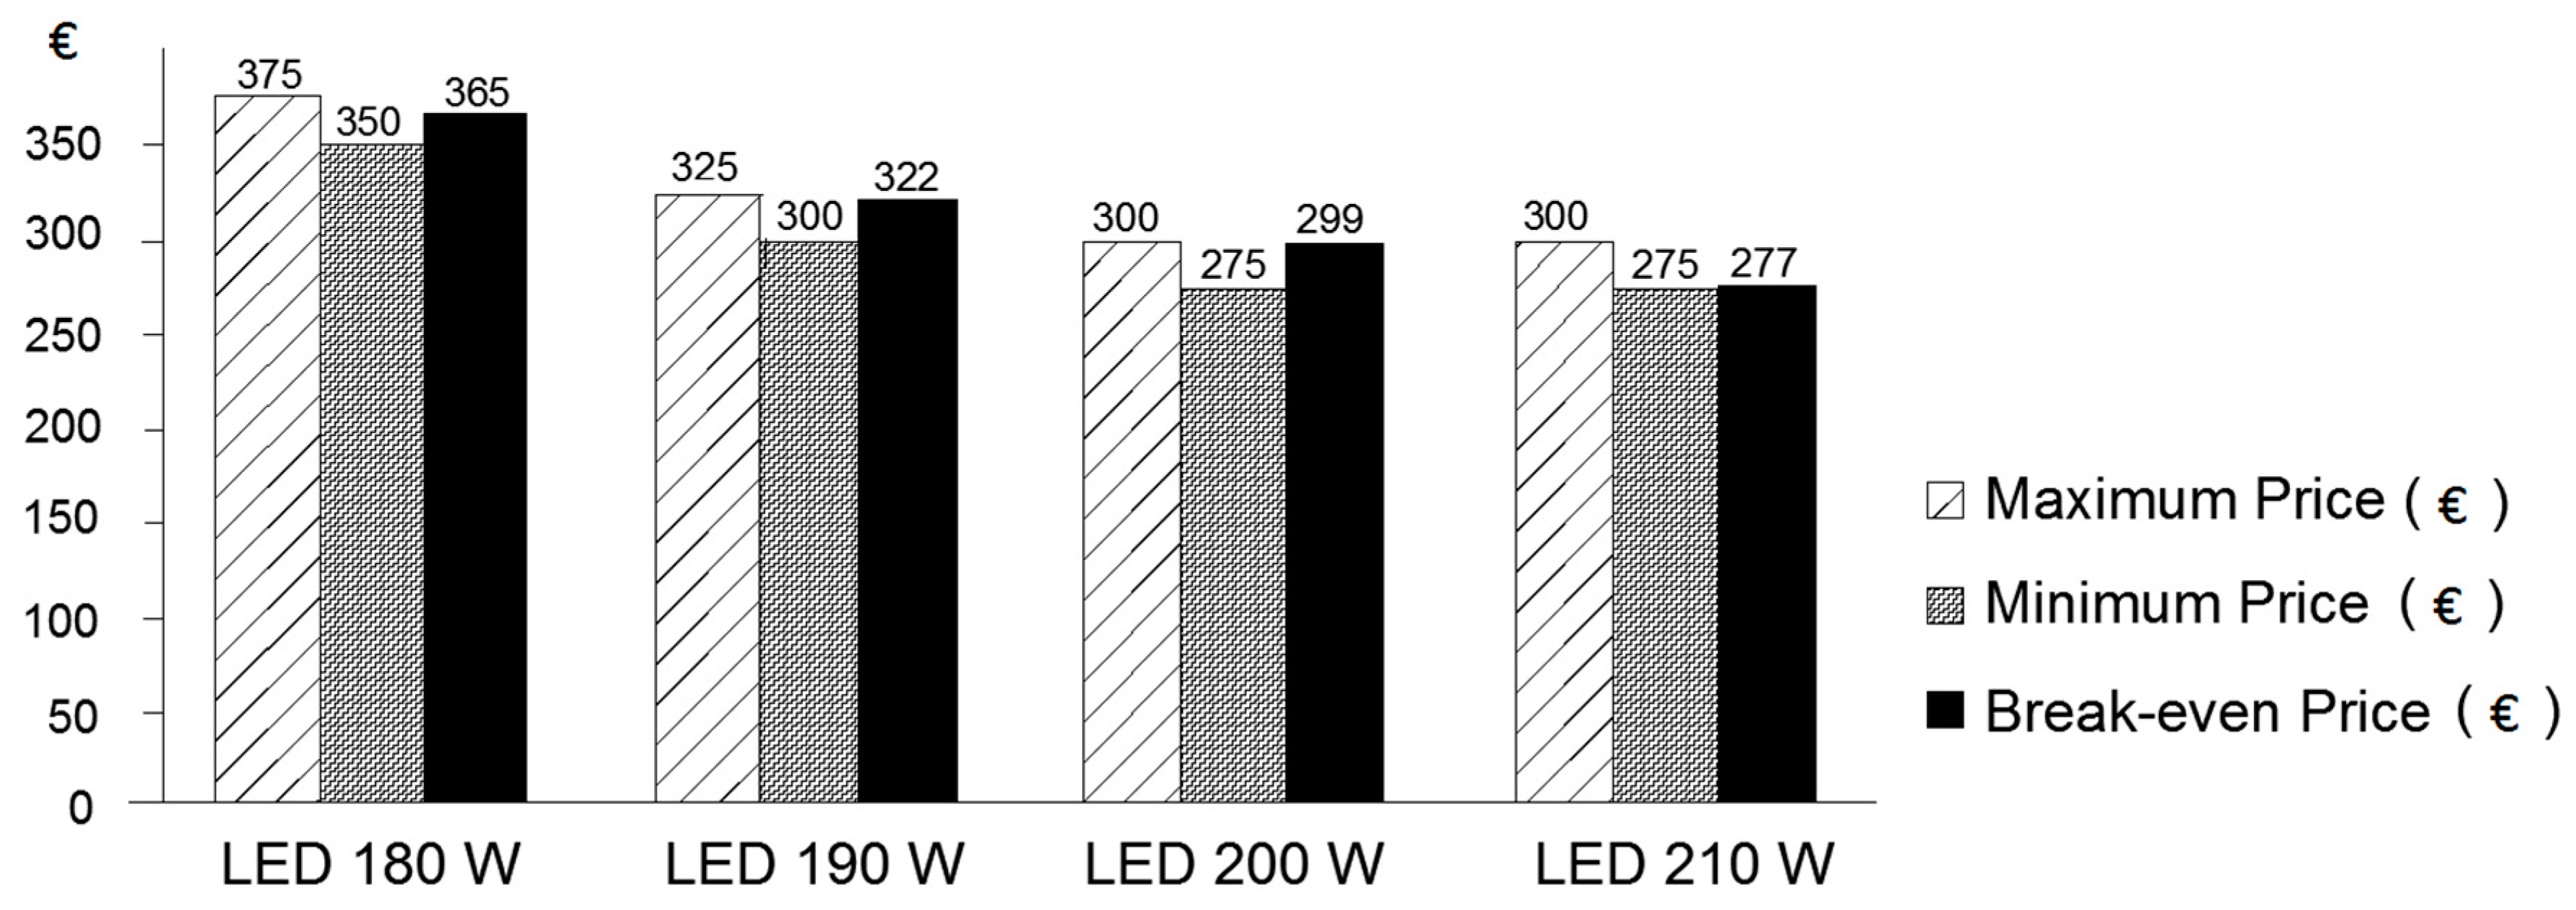
4.3. Economic Analysis and Calculation of Break-Even Points
5. Discussion
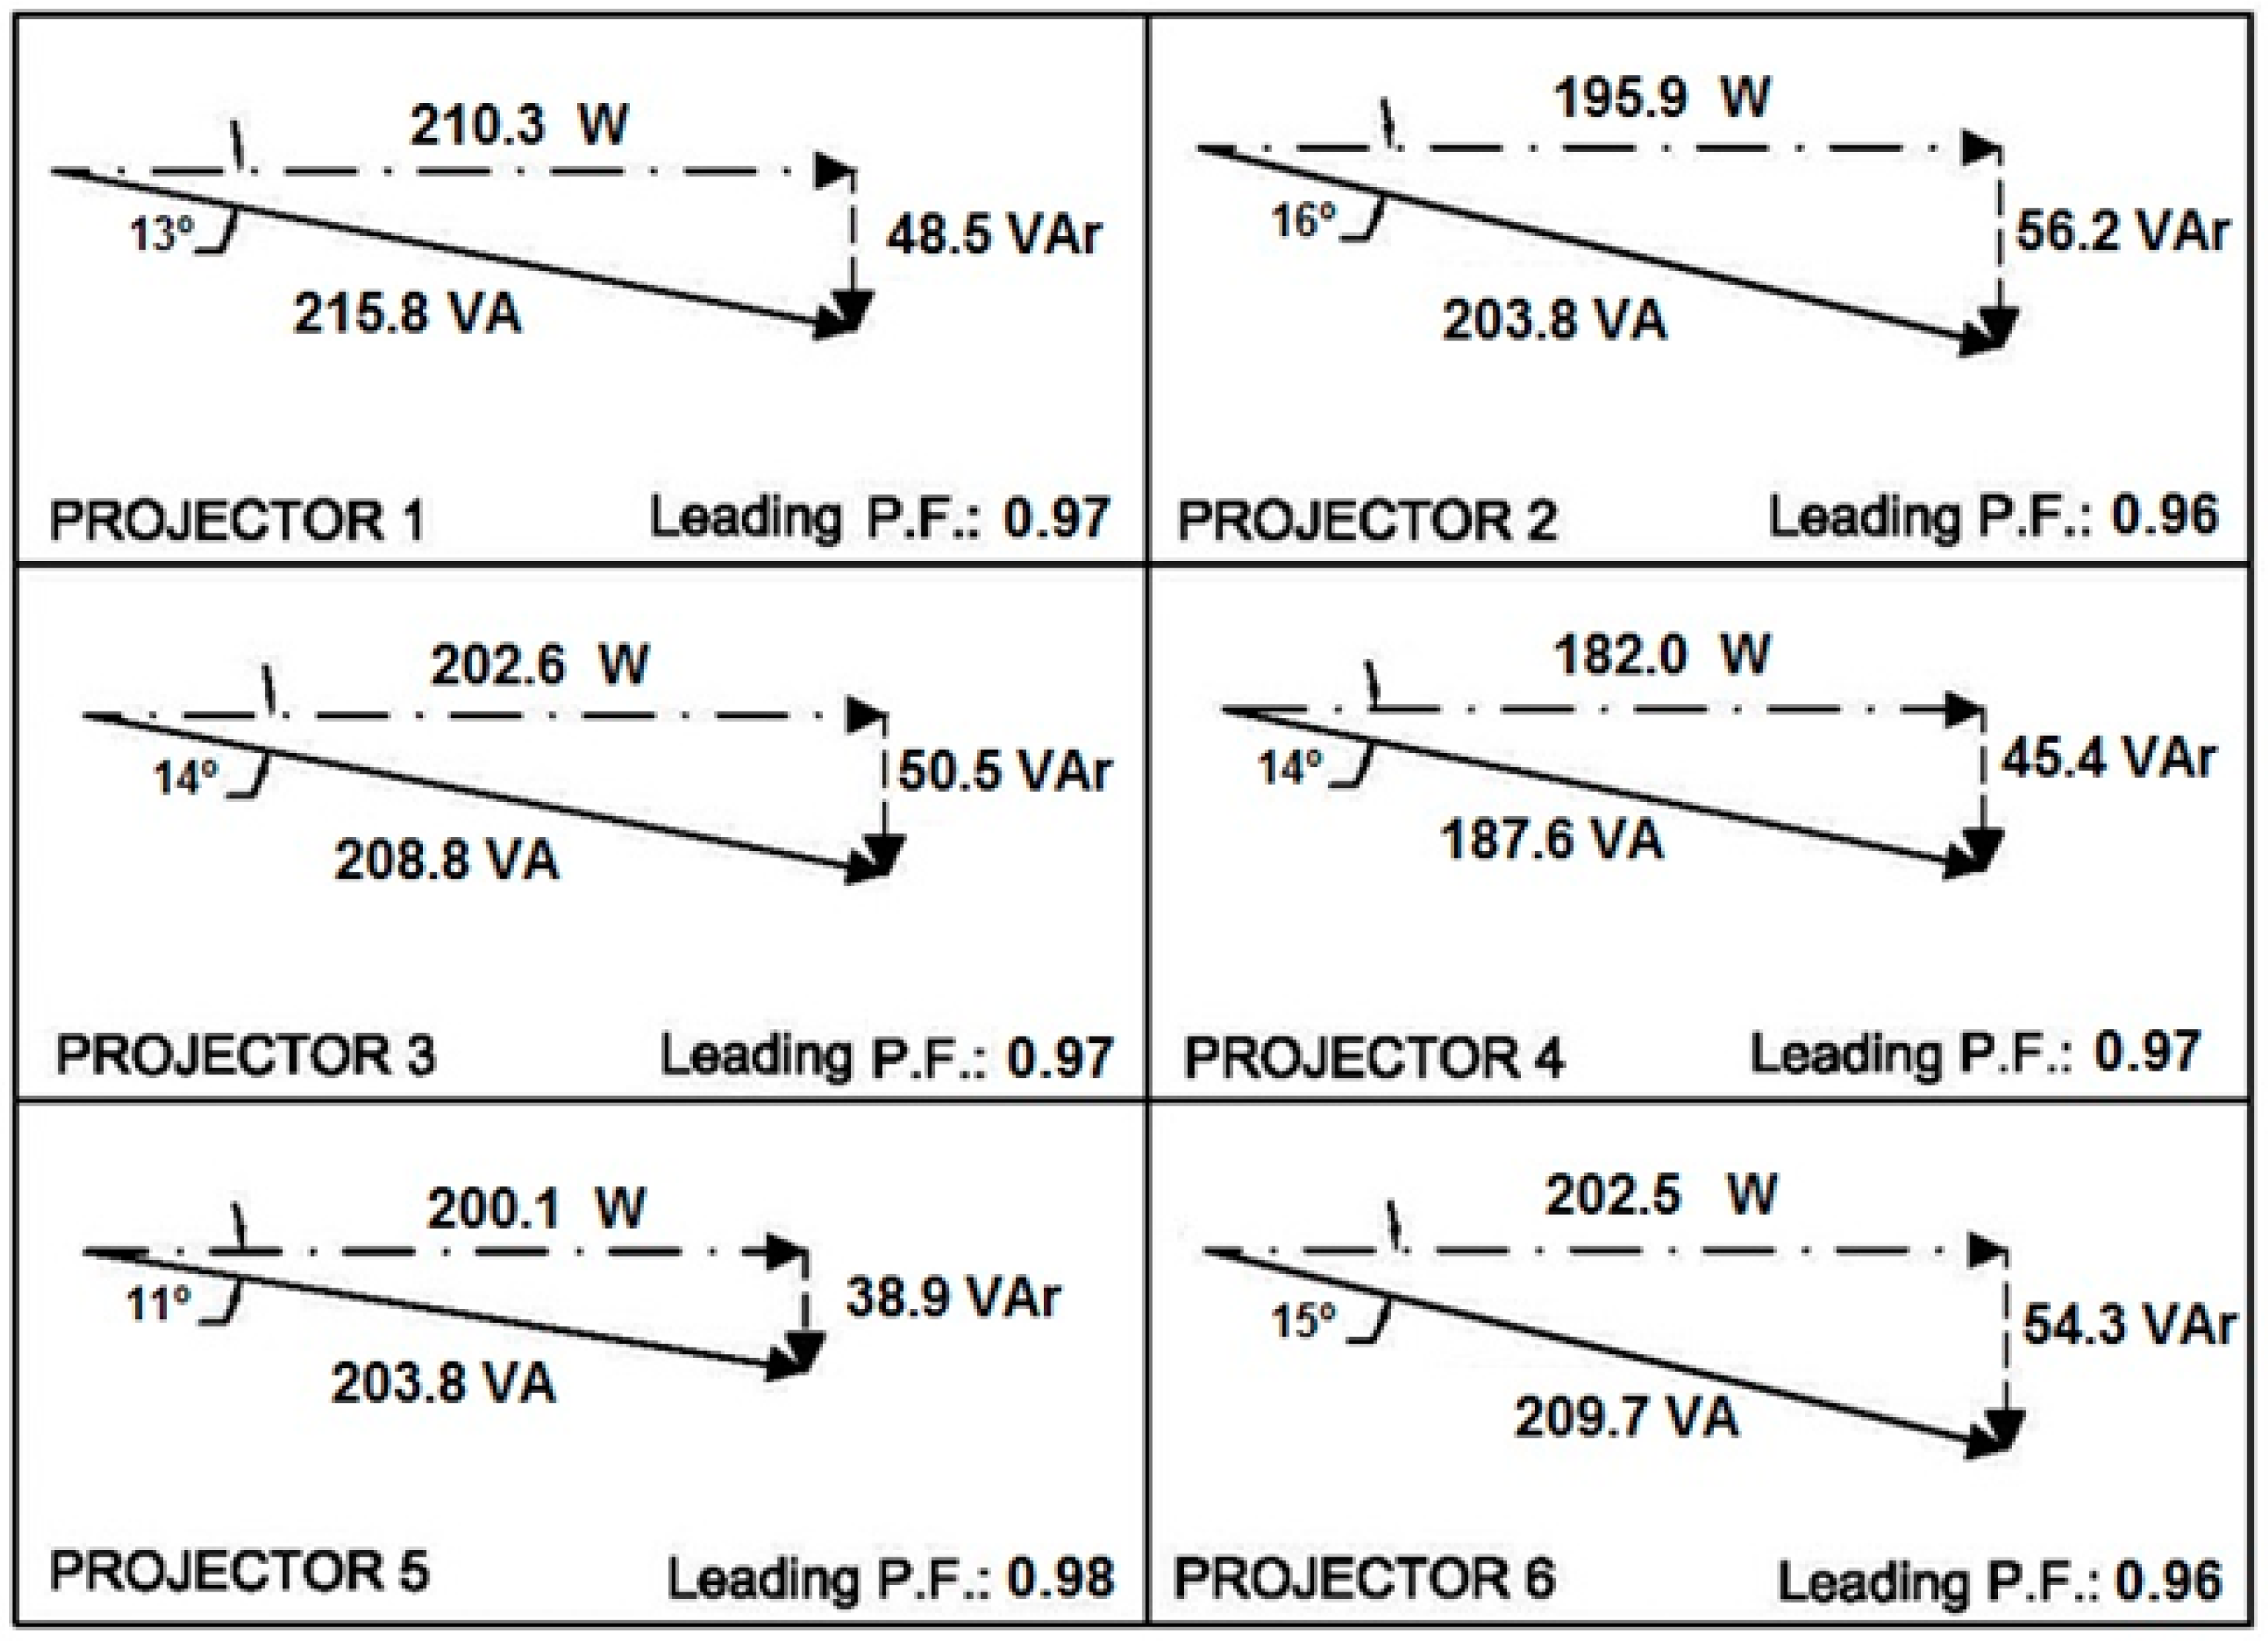
5.1. Power Consumption
5.2. Reactive Currents
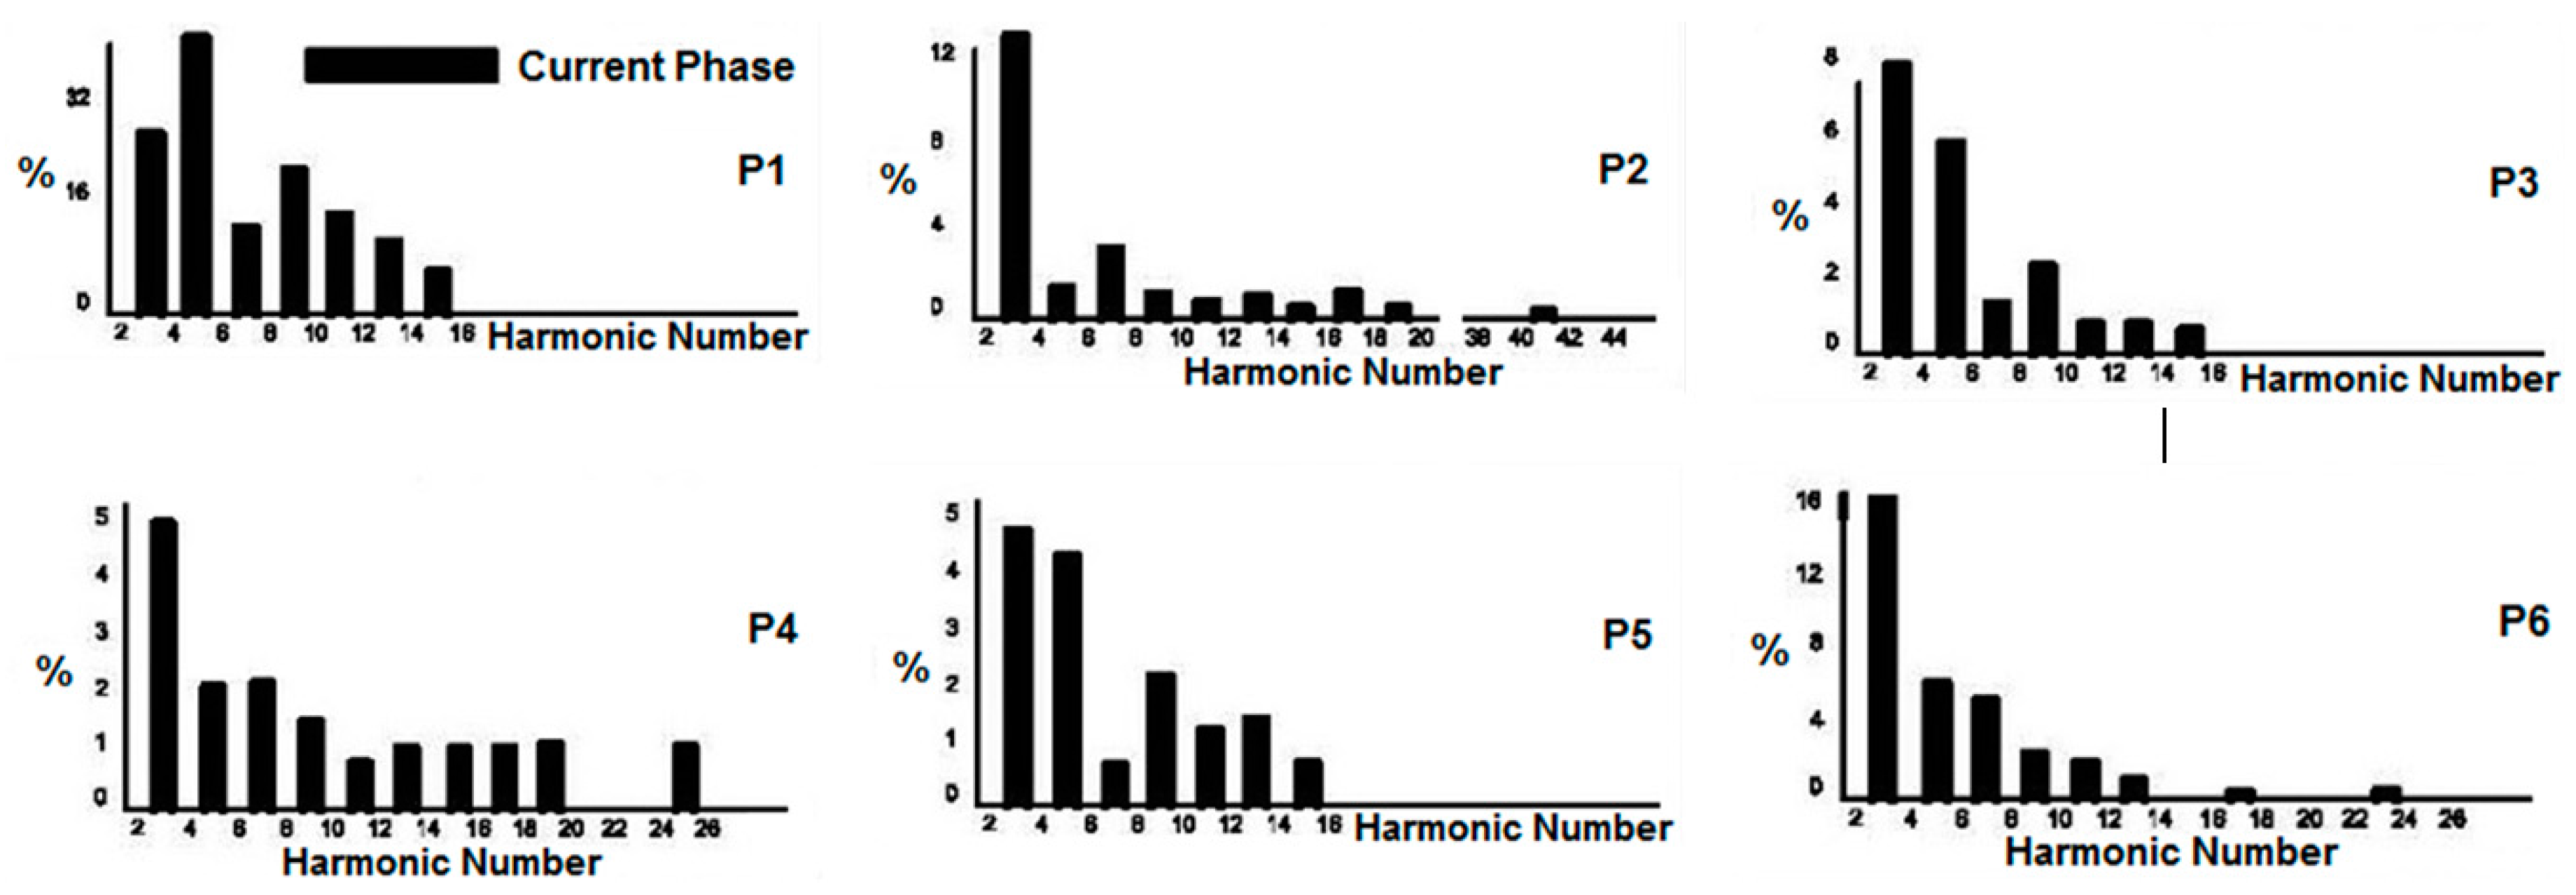
5.3. Current Harmonics
5.4. Inrush Currents
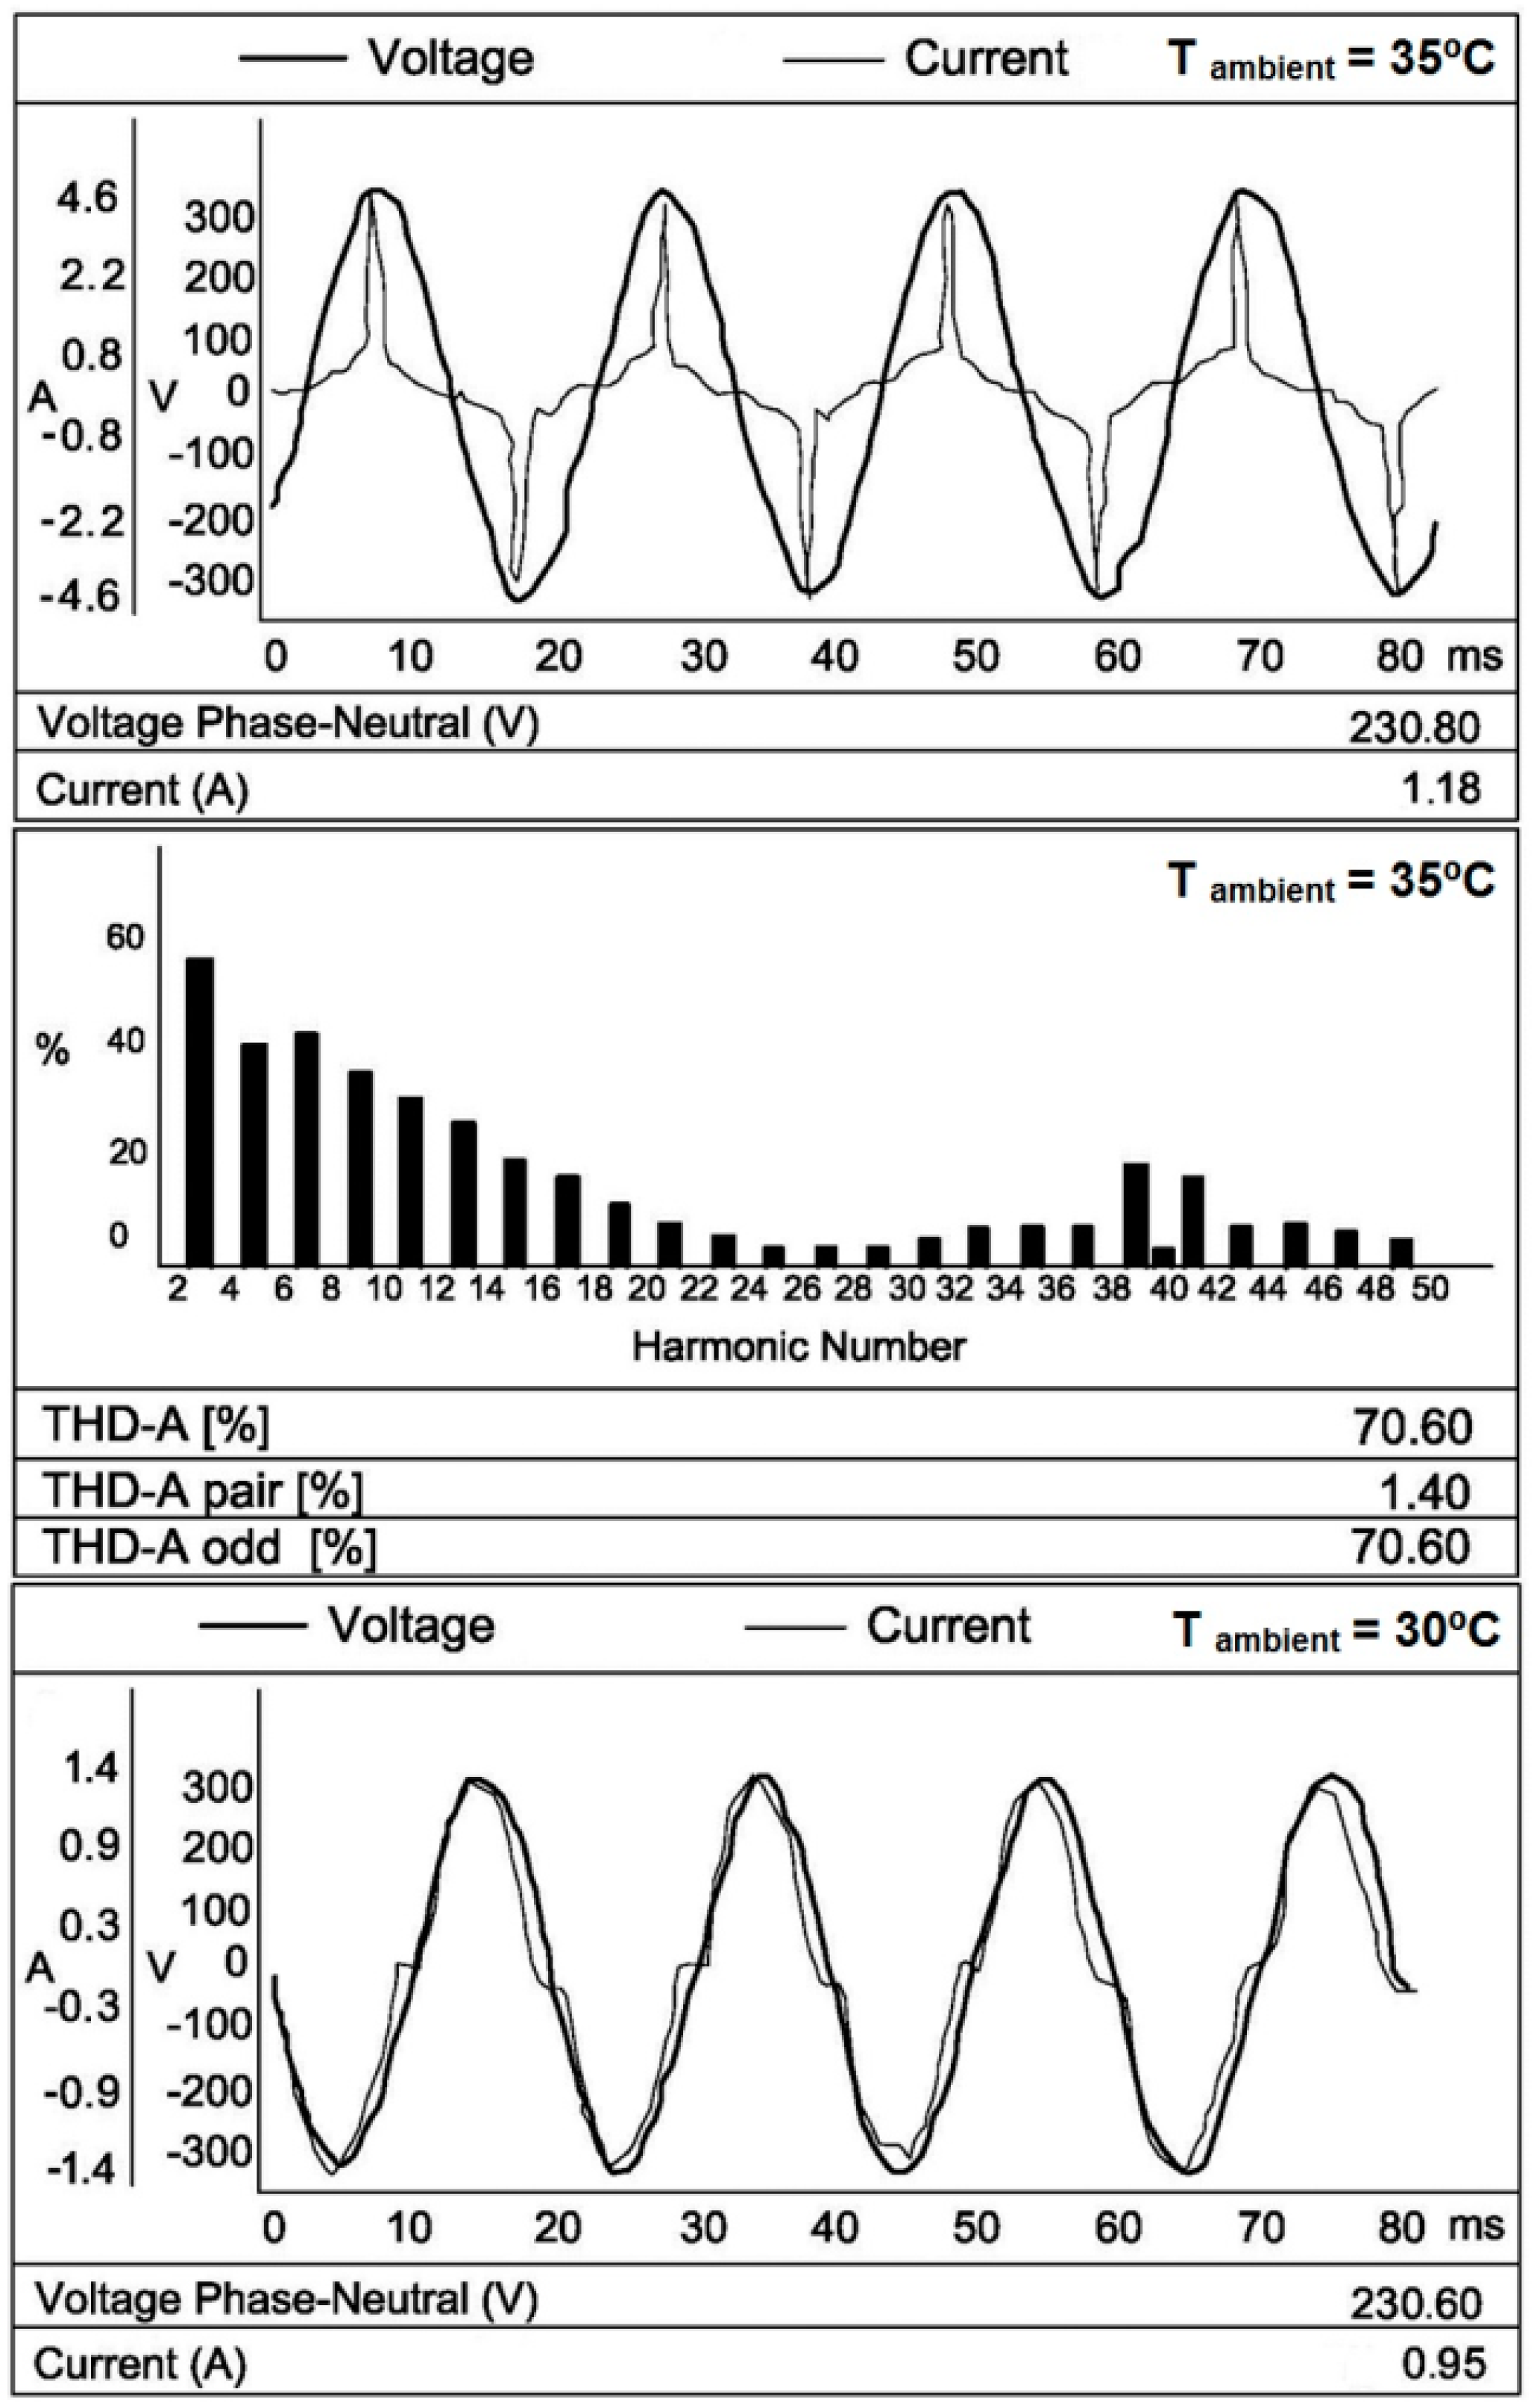
5.5. Temperature Effect
5.6. Economic Analysis
6. Conclusions
Acknowledgments
Author Contributions
Conflicts of Interest
References
- United Nations Commission on Sustainable Development (Department of Economic and Social Affairs). Indicators of Sustainable Development: Framework and Methodologies; Background Paper No. 3; United Nations: New York, NY, USA, 2001. [Google Scholar]
- Han, J.H.; Lim, Y.C. Design of an LLC resonant converter for driving multiple LED lights using current balancing of capacitor and transformer. Energies 2015, 8, 2125–2144. [Google Scholar] [CrossRef]
- Kyba, C.C.M.; Hänel, A.; Hölker, F. Redefining efficiency for outdoor lighting. Energy Environ. Sci. 2014, 7, 1806–1809. [Google Scholar] [CrossRef]
- Beccali, M.; Bonomolo, M.; Ciulla, G.; Galatioto, A.; Brano, V.L. Improvement of energy efficiency and quality of street lighting in South Italy as an action of Sustainable Energy Action Plans. The case study of Comiso (RG). Energy 2015, 92, 394–408. [Google Scholar] [CrossRef]
- Wentrup, C.; Oelgemöller, M.; Vamvounis, G. International Year of Light 2015. Aust. J. Chem. 2016, 66, 11. [Google Scholar]
- Schratz, M.; Gupta, C.; Struhs, T.J.; Gray, K. Reducing energy and maintenance costs while improving light quality and reliability with led lighting technology. In Proceedings of the 2013 Annual IEEE on Pulp and Paper Industry Technical Conference (PPIC), Charlotte, NC, USA, 23–27 June 2013. [Google Scholar]
- Next Generation Lighting Industry Alliance LED Systems Reliability Consortium. In Led Luminaire Lifetime: Recommendations for Testing and Reporting, 3rd ed.; 2014. Available online: https://energy.gov/sites/prod/files/2015/01/f19/led_luminaire_lifetime_guide_sept2014.pdf (accessed on September 2014).
- U.S. Department of Energy. LED Measurement Series: Luminaire Efficacy; PNNL-SA-54578; U.S. Department of Energy: Washington, DC, USA, 2009.
- Rodrigues, C.R.; Almeida, P.S.; Soares, G.M.; Jorge, J.M.; Pinto, D.P.; Braga, H.A. An experimental comparison between different technologies arising for public lighting: LED luminaires replacing high pressure sodium lamps. In Proceedings of the IEEE International Symposium on Industrial Electronics (ISIE), Gdansk, Poland, 27–30 June 2011. [Google Scholar]
- Jenkins, D.; Bhargava, A. LED Lighting: Maximizing the reliability, safety, and efficiency of light fixtures in hazardous environments. IEEE Ind. Appl. Mag. 2015, 21, 64–67. [Google Scholar] [CrossRef]
- Zubelzu, S.; Alvarez, R. A simplified method to assess the influence of the power generation mix in urban carbon emissions. Energy 2016, 115, 875–887. [Google Scholar] [CrossRef]
- Liu, J.; Zhang, W.; Chu, X.; Liu, Y. Fuzzy logic controller for energy savings in a smart LED lighting system considering lighting comfort and daylight. Energy Build. 2016, 127, 95–104. [Google Scholar] [CrossRef]
- Franz, M.; Nicolics, J. Environmental aspects of white LED lighting systems: Energy statistics, study parameters, rare earths. In Proceedings of the 38th International Spring Seminar on Electronics Technology (ISSE), Eger, Hungary, 6–10 May 2015. [Google Scholar]
- Yu, Y.; Yang, J.; Chen, B. The smart grids in China—A review. Energies 2012, 5, 1321–1338. [Google Scholar] [CrossRef]
- Ferrara, R. The smart city and the green economy in Europe: A critical approach. Energies 2015, 8, 4724–4734. [Google Scholar] [CrossRef]
- Markovska, N.; Duic, N.; Mathiesen, B.V.; Guzovic, Z.; Piacentino, A.; Schlör, H.; Lund, H. Addressing the main challenges of energy security in the twenty-first century Contributions of the conferences on Sustainable Development of Energy, Water and Environment Systems. Energy 2016, 115, 1504–1512. [Google Scholar] [CrossRef]
- Alammari, R.; Islam, M.S.; Chowdhury, N.A.; Sakil, A.K.; Iqbal, A.; Khandakar, A. Impact on power quality due to large-scale adoption of compact fluorescent lamps—A review. Int. J. Ambient Energy 2017, 38, 435–442. [Google Scholar] [CrossRef]
- Dubnicka, R.; Rusnak, A.; Janiga, P. Change of the spectral power distribution of luminaires under various electrical conditions. In Proceedings of the 16th International Scientific Conference on Electric Power Engineering (EPE), Kouty nad Desnou, Czech Republic, 20–22 May 2015. [Google Scholar]
- Mahela, O.P.; Shaik, A.G.; Gupta, N. A critical review of detection and classification of power quality events. Renew. Sustain. Energy Rev. 2015, 41, 495–505. [Google Scholar] [CrossRef]
- Wu, C.N.; Chen, Y.L.; Chen, Y.M. Primary-side peak current measurement strategy for high-precision constant output current control. IEEE Trans. Power Electron. 2015, 30, 967–975. [Google Scholar]
- Gil-de-Castro, A.; Moreno-Muñoz, A.; Larsson, A.; de la Rosa, J.J.G.; Bollen, M.H.J. LED Street lighting: A power quality comparison among street light technologies. Light. Res. Technol. 2013, 45, 710–728. [Google Scholar] [CrossRef]
- Doulos, L.T.; Tsangrassoulis, A.; Kontaxis, P.A.; Kontadakis, A.; Topalis, F.V. Harvesting daylight with LED or T5 fluorescent lamps? The role of dimming. Energy Build. 2017, 140, 336–347. [Google Scholar] [CrossRef]
- Gnanavadivel, J.; Kumar, N.S.; Priya, C.N.N.; Christa, S.T.J.; Veni, K.S.K. Single phase positive output super-lift luo converter fed high power LED lamp with unity power factor and reduced source current harmonics. J. Optoelectron. Adv. Mater. 2016, 18, 1007–1017. [Google Scholar]
- Gago-Calderón, A.; Fernández-Ramos, J.; Narvarte, L. Temperature-controlled light-emitting diode lamp for photovoltaic rural applications. Prog. Photovolt. 2013, 21, 232–239. [Google Scholar] [CrossRef]
- Bürger, A.; Sanchez, O. Analyzing the behavior of LED module driver under variation of ambient temperature. In Proceedings of the 7th Brazilian Congress on Metrology, Ouro Preto, Brazil, 24–27 November 2013. [Google Scholar]
- Li, S.; Tan, S.C.; Lee, C.K.; Waffenschmidt, E.; Hui, S.Y.; Tse, C.K. A survey, classification, and critical review of light-emitting diode drivers. IEEE Trans. Power Electron. 2016, 31, 1503–1516. [Google Scholar] [CrossRef]
- Arias, M.; Lamar, D.G.; Linera, F.F.; Balocco, D.; Diallo, A.A.; Sebastian, J. Design of a soft-switching asymmetrical half-bridge converter as second stage of an LED driver for street lighting application. IEEE Trans. Power Electron. 2012, 27, 1608–1621. [Google Scholar] [CrossRef]
- Nogueira, F.J.; Silva, E.S.; Gomide, T.S.; Braga, M.F.; Braga, H.A. Design of a transformeless high power factor low frequency LED driver applied to street lighting. In Proceedings of the IEEE 24th International Symposium on Industrial Electronics (ISIE), Buzios, Brazil, 3–5 June 2015. [Google Scholar]
- Leon-Masich, A.; Valderrama-Blavi, H.; Bosque-Moncusi, J.M.; Martinez-Salamero, L. A High-Voltage SiC-Based Boost PFC for LED Applications. IEEE Trans. Power Electron. 2016, 31, 1633–1642. [Google Scholar] [CrossRef]
- Lee, E.S.; Choi, B.H.; Nguyen, D.T.; Jang, G.C.; Rim, C.T. Versatile LED drivers for various electronic by variable switched capacitor. IEEE Trans. Power Electron. 2016, 31, 1489–1502. [Google Scholar] [CrossRef]
- Cheng, C.A.; Chang, C.H.; Cheng, H.L.; Chung, T.Y.; Tseng, C.H.; Tseng, K.C. A Single-Stage LED Tube Lamp Driver with Input-Current Shaping for Energy-Efficient Indoor Lighting Applications. J. Power Electron. 2016, 16, 1288–1297. [Google Scholar] [CrossRef]
- Hermoso-Orzáez, M.J.; Rojas-Sola, J.I.; Gago-Calderón, A. Electrical consequences of large-scale replacement of metal halide by LED luminaires. Light. Res. Technol. 2018. [Google Scholar] [CrossRef]
- Bergen, A.S.J.; Cupitt, A.; Cowling, I.; Budovsky, I.; Georgakopoulos, D.; Jenkins, S.E. High accuracy calibration and use of power analyzers for measurement of solid-state lighting devices. Light. Res. Technol. 2016, 48, 35–43. [Google Scholar] [CrossRef]
- International Commission of Illumination (CIE). Determination of Measurement Uncertainties in Photometry—Supplement 1: Modules and Examples for the Determination of Measurement Uncertainties. Part 1: Modules for the Construction of Measurement Equations and Part 2: Examples for Models with Individual Inputs; CIE: Vienna, Austria, 2011. [Google Scholar]
- Smet, P.F.; Joos, J.J. White light-emitting diodes: Stabilizing colour and intensity. Nat. Mater. 2017, 16, 500–501. [Google Scholar] [CrossRef] [PubMed]
- Kalair, A.; Abas, N.; Kalair, A.R.; Saleem, Z.; Khan, N. Review of harmonic analysis, modeling and mitigation techniques. Renew. Sustain. Energy Rev. 2017, 78, 1152–1187. [Google Scholar] [CrossRef]


| Projector ID | Power (W) | Luminous Efficacy (Lumen/W) | DIALUX Software Em (lux) | DIALUX Software U0 = Emin/Em |
|---|---|---|---|---|
| 1 | 200 | 94 | 7.6 | 0.29 |
| 2 | 190 | 101 | 10.1 | 0.34 |
| 3 | 200 | 102 | 6.5 | 0.18 |
| 4 | 180 | 83 | 6.9 | 0.20 |
| 5 | 200 | 101 | 8.3 | 0.32 |
| 6 | 190 | 80 | 7.1 | 0.19 |
| Projector ID | Current (A) | Voltage (V) | Frequency (Hz) | OTHD (%) | CP Cold Start (A) | CP 20 s (A) | CP 40 s (A) | CP 300 s (A) |
|---|---|---|---|---|---|---|---|---|
| P1 | 0.93 | 231.1 | 50.03 | 6.1 | 5.93 | 2.50 | 3.20 | 4.71 |
| P2 | 0.88 | 230.5 | 49.99 | 13.5 | 8.18 | 3.85 | 6.03 | 7.71 |
| P3 | 0.91 | 230.2 | 49.97 | 10.2 | 5.83 | 2.48 | 2.52 | 4.05 |
| P4 | 0.81 | 230.4 | 50.00 | 6.3 | 5.04 | 1.21 | 1.27 | 3.66 |
| P5 | 0.89 | 230.0 | 49.99 | 7.3 | 8.30 | 3.08 | 3.49 | 7.52 |
| P6 | 0.91 | 230.1 | 50.00 | 18.3 | 0.80 | 0.77 | 0.77 | 0.77 |
| Consumption Costs | MH (Real Data) | LED 180 W | LED 190 W | LED 200 W | LED 210 W |
|---|---|---|---|---|---|
| Total energy consumption (kWh/year) | 147,807 | 79,815 | 84,249 | 88,682 | 93,117 |
| Cost of energy consumption (€/year) | 20,692.98 | 11,174.14 | 11,794.79 | 12,415.45 | 13,036.44 |
| Cost of maximum power contracted (€/year) | 10,212.30 | 5514.61 | 5820.91 | 6127.21 | 6433.68 |
| Total energy cost (€/year) | 30,905.28 | 16,688.75 | 17,615.70 | 18,542.66 | 19,470.12 |
| Replacement Cost €/Luminaire | LED Consumption: 180 W | LED Consumption: 190 W | ||||
| Pay-Back (Years) | NPV (5 Years) | IRR (%) | Pay-back (Years) | NPV (5 Years) | IRR (%) | |
| 250 | 3.32 | 21,748.96 | 15.36 | 3.56 | 13,612.37 | 12.56 |
| 275 | 3.66 | 17,023.96 | 11.43 | 3.91 | 8887.37 | 8.79 |
| 300 | 3.99 | 12,298.96 | 8.04 | 4.27 | 4162.37 | 5.53 |
| 325 | 4.32 | 7573.96 | 5.07 | 4.62 | −562.63 | 2.68 |
| 350 | 4.65 | 2848.96 | 2.45 | 4.98 | −5287.63 | 0.15 |
| 375 | 4.99 | −1876.04 | 0.10 | 5.33 | −10,012.63 | −2.11 |
| Replacement Cost €/Luminaire | LED Consumption: 200 W | LED Consumption: 210 W | ||||
| Pay-Back (Years) | NPV (5 Years) | IRR (%) | Pay-Back (Years) | NPV (5 Years) | IRR (%) | |
| 250 | 3.82 | 9367.19 | 9.68 | 4.13 | 5119.68 | 6.71 |
| 275 | 4.20 | 4642.19 | 6.07 | 4.55 | 394.68 | 3.27 |
| 300 | 4.59 | −82.81 | 2.95 | 4.96 | −4330.32 | −0.28 |
| 325 | 4.97 | −4807.81 | 0.21 | 5.37 | −9055.32 | −2.34 |
| 350 | 5.35 | −9532.81 | −2.22 | 5.78 | −13,780.32 | −4.67 |
| 375 | 5.73 | −14,257.81 | −4.39 | 6.20 | −18,505.32 | −6.76 |
© 2017 by the authors. Licensee MDPI, Basel, Switzerland. This article is an open access article distributed under the terms and conditions of the Creative Commons Attribution (CC BY) license (http://creativecommons.org/licenses/by/4.0/).
Share and Cite
Hermoso-Orzáez, M.J.; Gago-Calderón, A.; Rojas-Sola, J.I. Power Quality and Energy Efficiency in the Pre-Evaluation of an Outdoor Lighting Renewal with Light-Emitting Diode Technology: Experimental Study and Amortization Analysis. Energies 2017, 10, 836. https://doi.org/10.3390/en10070836
Hermoso-Orzáez MJ, Gago-Calderón A, Rojas-Sola JI. Power Quality and Energy Efficiency in the Pre-Evaluation of an Outdoor Lighting Renewal with Light-Emitting Diode Technology: Experimental Study and Amortization Analysis. Energies. 2017; 10(7):836. https://doi.org/10.3390/en10070836
Chicago/Turabian StyleHermoso-Orzáez, Manuel Jesús, Alfonso Gago-Calderón, and José Ignacio Rojas-Sola. 2017. "Power Quality and Energy Efficiency in the Pre-Evaluation of an Outdoor Lighting Renewal with Light-Emitting Diode Technology: Experimental Study and Amortization Analysis" Energies 10, no. 7: 836. https://doi.org/10.3390/en10070836