A Control Strategy for Mode Transition with Gear Shifting in a Plug-In Hybrid Electric Vehicle


Department of Mechanical Engineering, Sungkyunkwan University, 2066 Seobu-ro, Jangan-gu, Suwon-si 16419, Korea
*
Author to whom correspondence should be addressed.
Energies 2017, 10(7), 1043; https://doi.org/10.3390/en10071043
Submission received: 19 June 2017
/
Revised: 13 July 2017
/
Accepted: 19 July 2017
/
Published: 20 July 2017
(This article belongs to the Special Issue Methods to Improve Energy Use in Road Vehicles)
Abstract
:The mode transition from electric propulsion mode to hybrid propulsion mode is important with regard to the power management strategy of plug-in hybrid electric vehicles (PHEVs). This is because mode transitions can occur frequently depending on the power management strategies and driving cycles, and because inadequate mode transitions worsen the fuel efficiency and drivability. A pre-transmission parallel PHEV uses a clutch between the internal combustion engine (ICE) and the electric motor (EM) to connect or disconnect the power source of the ICE for a mode transition. The mode transition requires additional energy consumption for clutch speed synchronization, and is accompanied by a drivetrain shock due to clutch engagement. This paper proposes a control strategy for the mode transition with gear-shifting to resolve the problems of energy consumption and drivetrain shock. Through the development of a PHEV performance simulator, we analyze the mode transition characteristics and propose a control strategy considering the vehicle acceleration and gear state. The control strategy reduces the duration required for the mode transition by moving the start time of the mode transition. This helps to improve energy efficiency while maintaining adequate drivability.
1. Introduction
Plug-in hybrid electric vehicles (PHEVs) are a type of hybrid electric vehicle (HEV) with rechargeable batteries that connect via a plug to an external electrical power source. Both PHEVs and HEVs have two or more different power sources—an internal combustion engine (ICE) and an electric motor (EM). The two vehicle types have power management strategies to distribute wheel-demanded power into different sources used for the overall driving conditions [1,2]. Compared to conventional HEVs, a PHEV has a larger battery capacity and can run more efficiently by properly using electrical energy [3]. In this respect, a PHEV has more frequent driving mode transitions. There are two different driving modes, electric vehicle (EV) and HEV. The EV mode uses only an EM, while the HEV mode uses an ICE and an EM.
A pre-transmission parallel hybrid configuration has a clutch between the ICE and EM [4]. The clutch allows the ICE to be connected or separated from the drivetrain through a mode transition. The engagement and disengagement of a clutch can deteriorate vehicle drivability [5]. The drivability includes gear-shifting, clutch operation, and engine start or stop [6]. The clutch engagement shock and mode transition duration are important for how a driver feels while operating a PHEV. In EV mode driving, the EM runs but the ICE stops. When the EV mode changes to the HEV mode, the clutch is engaged, which causes shock. In addition, a long transition duration makes the driver uncomfortable and causes acceleration delay, which needs rapid mode transition [7]. For improving the drivability for mode transition, the clutch input and output speeds are properly synchronized. If the difference between clutch speeds is small, the clutch can be engaged smoothly, but the change of the powertrain inertia causes shock at the end of the mode transition. In general, the mode transition duration and shocks have a trade-off relationship [8]. To reduce the shocks, the duration can be long. Conversely, the shock can increase if the duration reduces. It is important to resolve this problem.
Many researches have improved the mode transition to reduce the shocks and vibrations. Some researchers proposed that engine torque error and clutch friction torque are compensated for by using the torques of integrated starter and generator (ISG) and the electric motor [9]. Other researchers suggested having the HEV system without ISG by controlling the tractive motor for synchronization of clutch speeds, while it sustained low driveshaft acceleration [10].
Meanwhile, the power management strategies of PHEVs determine the number of mode transitions. If the mode transitions are conducted more frequently, then the control strategy of a mode transition is more important in terms of energy management and drivability. Some researchers proposed that the drivability metrics to improve vehicle response and optimize for engine and transmission behaviors, and the metrics were considered as constraints in the optimization goals of energy management [11]. This is because fuel economy and drivability have a trade-off relationship. Likewise, a mode transition should consider energy consumption. During mode transition, both the ISG and ICE rotate the engine shaft by consuming electrical energy and fossil fuel. The consumption depends on the mode transitions. A few researchers have dealt with ISG control methods, which would make the ICE operate more efficiently [12,13]. In conclusion, the energy consumption during a mode transition is important because the energy from mode transition is not transmitted to the drivetrain. Poor mode transition adversely affects fuel efficiency.
We will evaluate a mode transition by the mode transition duration, clutch engagement shock, and energy consumption. Previously, we proposed the concept of a control strategy, which improves drivability and fuel efficiency [14]. Specifically, we showed that the mode transition included gear-shifting and that it can reduce energy consumption. However, due to the nature of the concept, the control strategy cannot achieve its objective without vehicle conditions being considered.
In this paper, we develop a control strategy for the HEV mode transition applied practicably to the overall driving cycle. Powertrain system modeling is implemented and a PHEV performance simulator is applied using an algorithm for the mode transition. With the simulation results of PHEV driving, the vehicle conditions of the HEV mode transition and transmission shift are recognized. We present this control strategy in detail. Finally, we show how the simulation results will improve the fuel efficiency and validate the proposed control strategy. In turn, this control strategy also improves the drivability during mode transition.
2. Modeling of the Powertrain System
This section will show an evaluation method of fuel efficiency. Note that this paper does not explain powertrain modeling in great detail. For more on the modeling process, please refer to the research in [14].
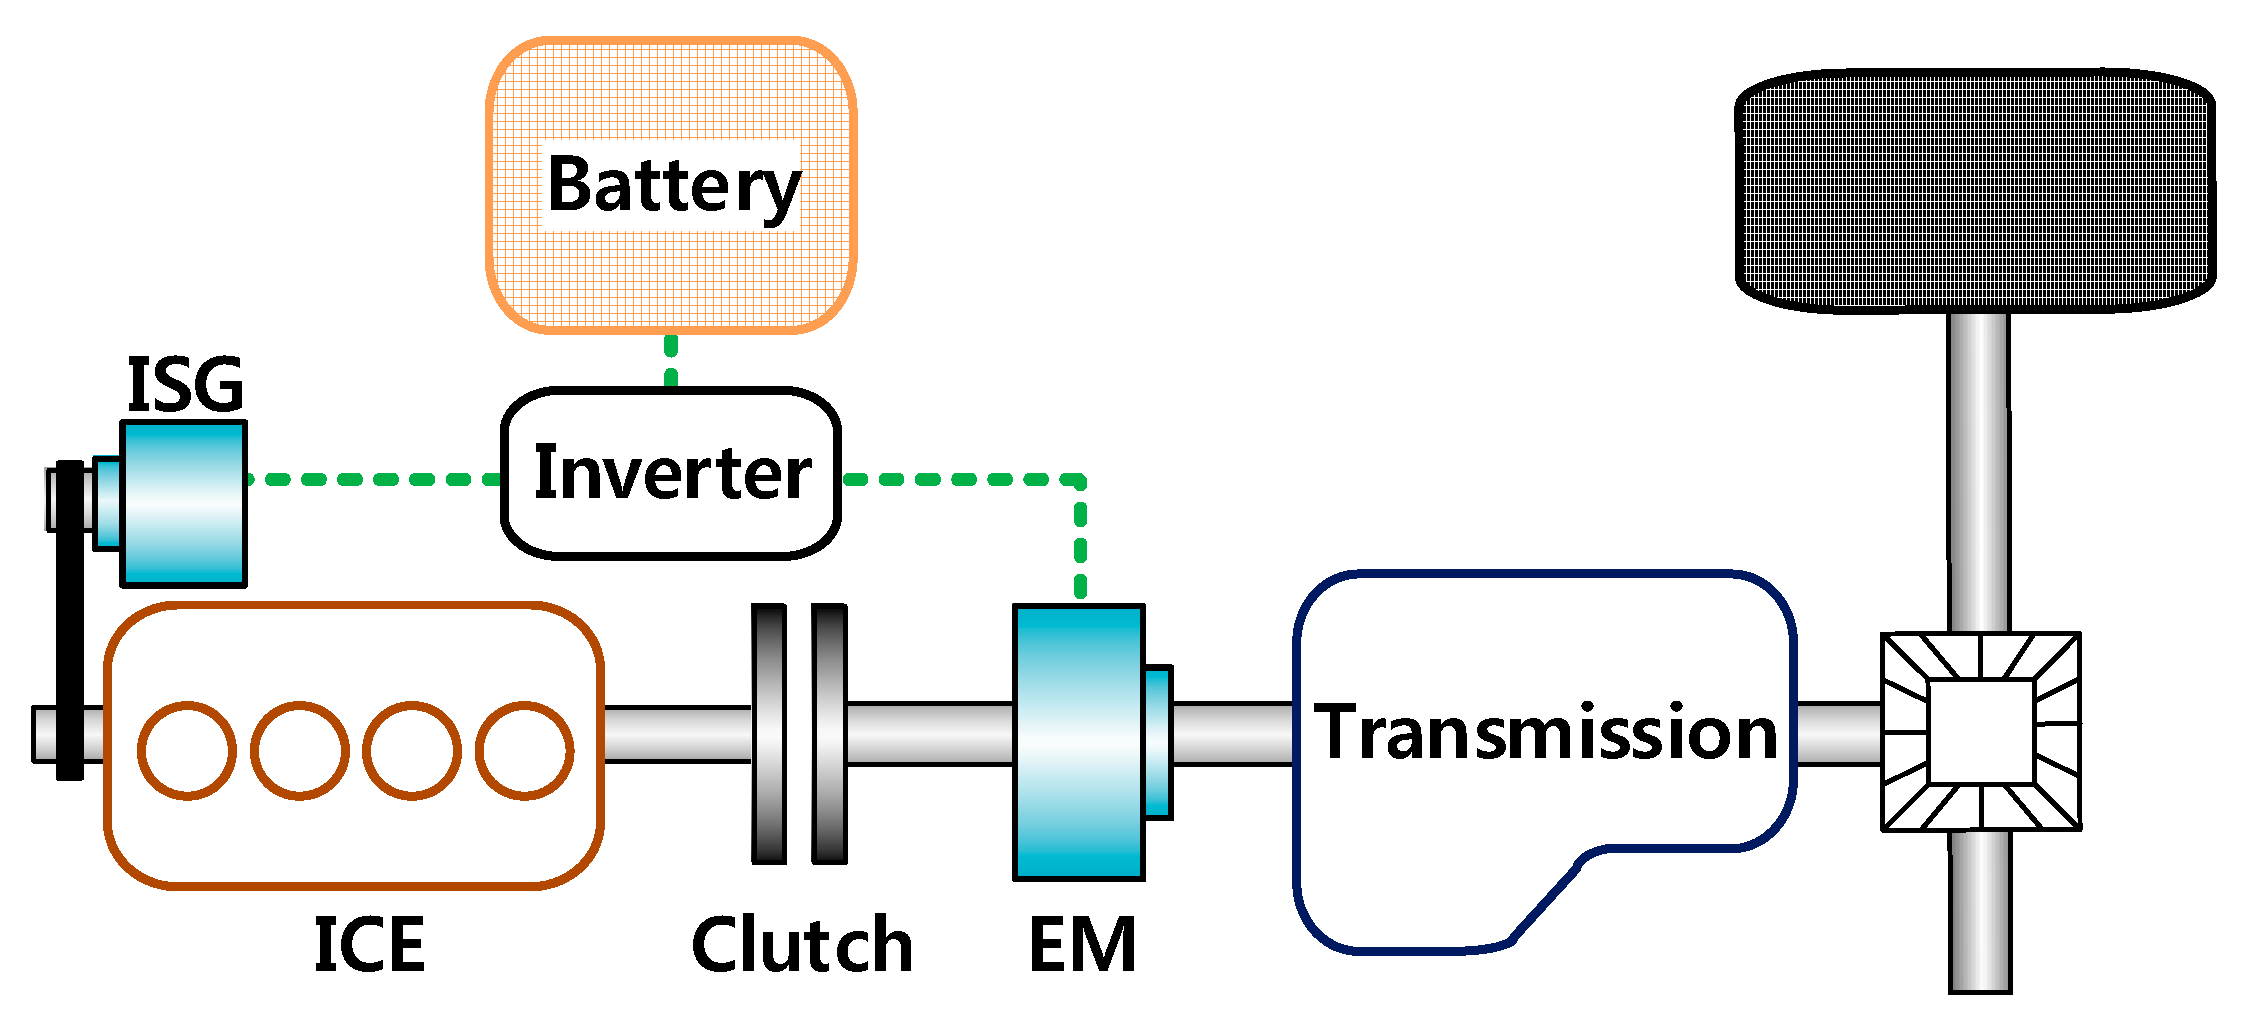
Figure 1 models the powertrain system. The configuration of the target vehicle is a pre-transmission parallel-type PHEV. The system is comprised of an ICE, EM, ISG, clutch, transmission, and final reduction gear. The ISG is connected to the crankshaft of the ICE with a belt pulley. The clutch between the ICE and EM connects and disconnects to the ICE power in the drivetrain. The target PHEV has a dual clutch transmission (DCT). DCT is a type of automated manual transmission that combines the comfort of an automatic transmission and the high efficiency of a manual transmission. It has a fixed number of gear ratios, and two clutches make gear shifting faster [15].
The ICE, EM, and ISG are modeled using steady-state maps of each component. The maps provided through the Autonomie software [16] are modified to the desired specifications. Autonomie provides validated data, despite not exactly having experimental data, to be used for evaluating the fuel efficiency and vehicle performance. It also assumes that the propulsive sources are modeled as a first-order system. The clutch is modeled using the steady-state curve. The curve is measured by a clutch experiment, which provides the clamp load along the clutch release displacement [14]. The battery based on the Thevenin equivalent circuit is modeled in [17].
A conventional HEV evaluates fuel efficiency from the assumption that the initial and final battery states of charge (SOCs) are the same [18]. However, a PHEV does not sustain the SOC. Rather, it uses more electrical energy for driving because its battery is rechargeable from an external electrical source. Therefore, the battery usage is considered when the fuel efficiency is evaluated. Figure 2 shows the process of fuel efficiency evaluation. FEeq is the equivalent fuel efficiency and Eelec is the electrical energy used. Feq is the equivalent factor. In the target PHEV, the EM and ISG use electrical energy. The electrical energy usage is converted to an equivalent volume of fossil fuels using the equivalent factor. The factor is suggested by the United States Environmental Protection Agency (EPA) [19]. The fuel consumption of the ICE is calculated by integrating the fuel rate of the current situation. The current speed and torque of the ICE determine the fuel rate. The equivalent fuel efficiency is the value of the total distance divided by fuel consumption, including both the fossil fuel used by the ICE and the electrical energy by the EM and ISG.
3. Mode Transition Algorithm
A PHEV has two different conditions, charge depleting (CD) and charge sustaining (CS). While a PHEV runs in EV mode using the electrical energy of an EM in the CD condition, the vehicle runs in the HEV mode using both an EM and ICE in the CS condition. However, if a PHEV needs more power or its power management strategies desire both EM and ICE power, the CD condition can also include HEV modes using two different power sources. There are the EV mode transition and the HEV mode transition. The EV mode transition is from the EV mode to the HEV mode. Conversely, the HEV mode transition is from the HEV mode to the EV mode. Because PHEVs have more available electrical energy than conventional HEVs, the mode transitions of PHEVs occur frequently where its energy usage is managed more flexibly. Therefore, these transitions are important in terms of affecting the fuel efficiency.
3.1. HEV Mode Transition
In this paper, we focus on the HEV mode transition. Most of the transitions occur at CS conditions, although they can also happen at CD conditions. At the CS condition, the battery SOC should be sustained within a specific limit. Under the lower SOC limit, the HEV mode runs by concentrating ICE use. A hybrid controller unit (HCU) reduces or prevents the use of electrical energy for battery recuperation from regenerative braking. In contrast, the EV mode runs using the EM when the battery has a higher SOC. This is a basic rule-based power management strategy, which is also called the CD-CS strategy [20,21].
When a PHEV runs in the EV mode, the EM is rotating, the clutch between the EM and ICE is disengaged, and the ICE stops. The speeds of the clutch input and output are not synchronized. When there is a large difference between the clutch speeds, the clutch cannot be engaged because it causes clutch engagement shock, which adversely affects drivability.
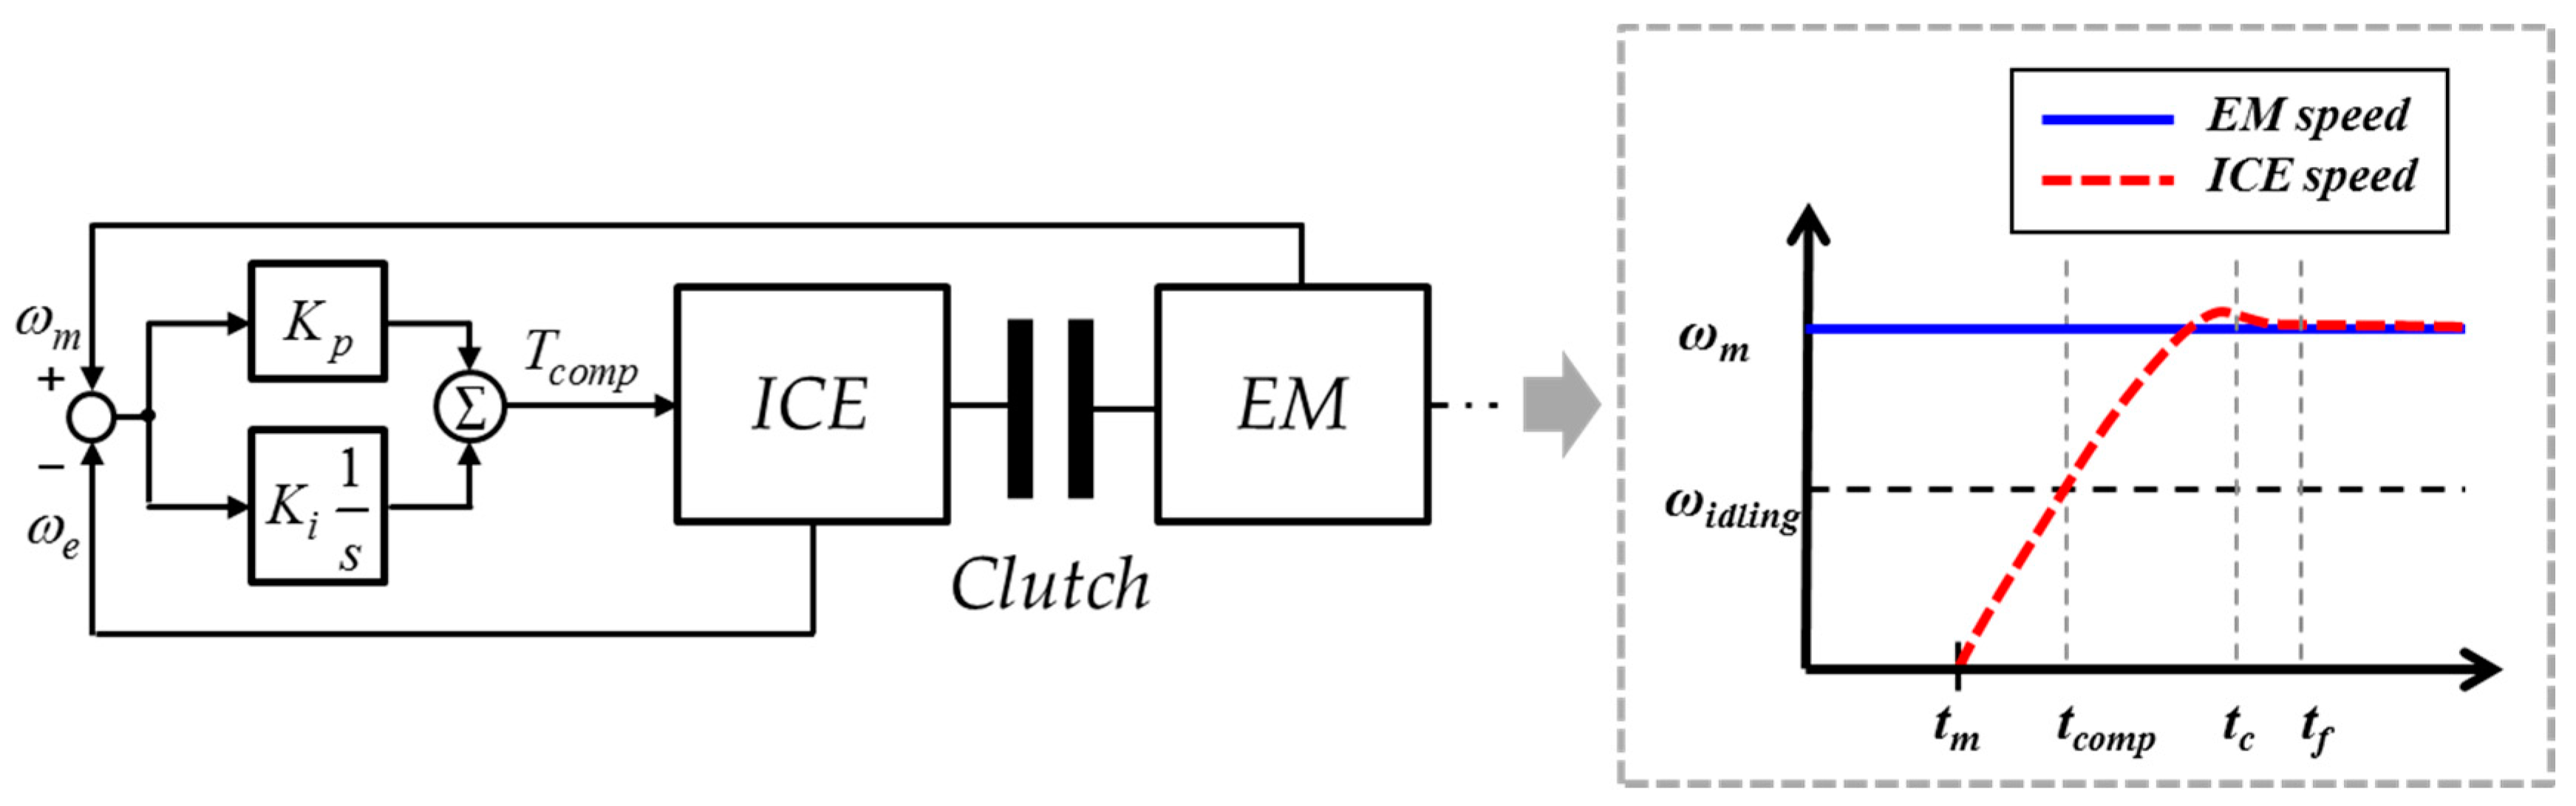
It is necessary to synchronize the speeds of the clutch so that there is only a small speed difference. When the HEV mode transition signal occurs, the ISG connected to the crank shaft of the ICE generates torque to increase the speed on the ICE side. At a higher idling speed, if the difference between clutch speeds is still high, the ICE also generates torque, which increases the speed to match the EM speed. This is ICE compensation control using a proportional plus integral (PI) controller with the difference of clutch speeds, as shown in Figure 3. When the speed difference is higher, the controller proposes the demand compensation torque which increases the input speed of the clutch on the ICE side to reach the target speed of the EM. tm refers to the time when the mode transition signal is generated; tc is the time when the clutch is actuating; tf is the time when the clutch is fully engaged and the mode transition is finished; tcomp is the time when the ICE generates torque for the compensation control; Kp and Ki are proportional and integral values, respectively; ωe, ωm, and ωidling are the speeds of the ICE, EM, and idling state of the ICE, respectively; and Tcomp is the ICE torque of compensation, which is an input of the control.
Figure 4 shows the mode transition process. When the conditions of HEV mode transition are met, the speeds of clutch are synchronized and the clutch is actuated to fully engage. Firstly, the top red rectangle decides whether to implement a control strategy with gear shifting. In the next section, we will describe the control strategy in detail. The ISG and ICE torques to synchronize clutch speeds are generated using the difference of clutch speeds. The ICE compensation torque is generated when the ICE speed (ωe) is higher than the idling state speed (ωidling). After the speed synchronization, the clutch is actuated with slip and fully engaged when the difference in clutch speeds is lower. The mode transition duration is the time from the HEV mode transition signal to full engagement of the clutch. The mode transition needs energy for its duration. Finally, clutch engagement causes shock.
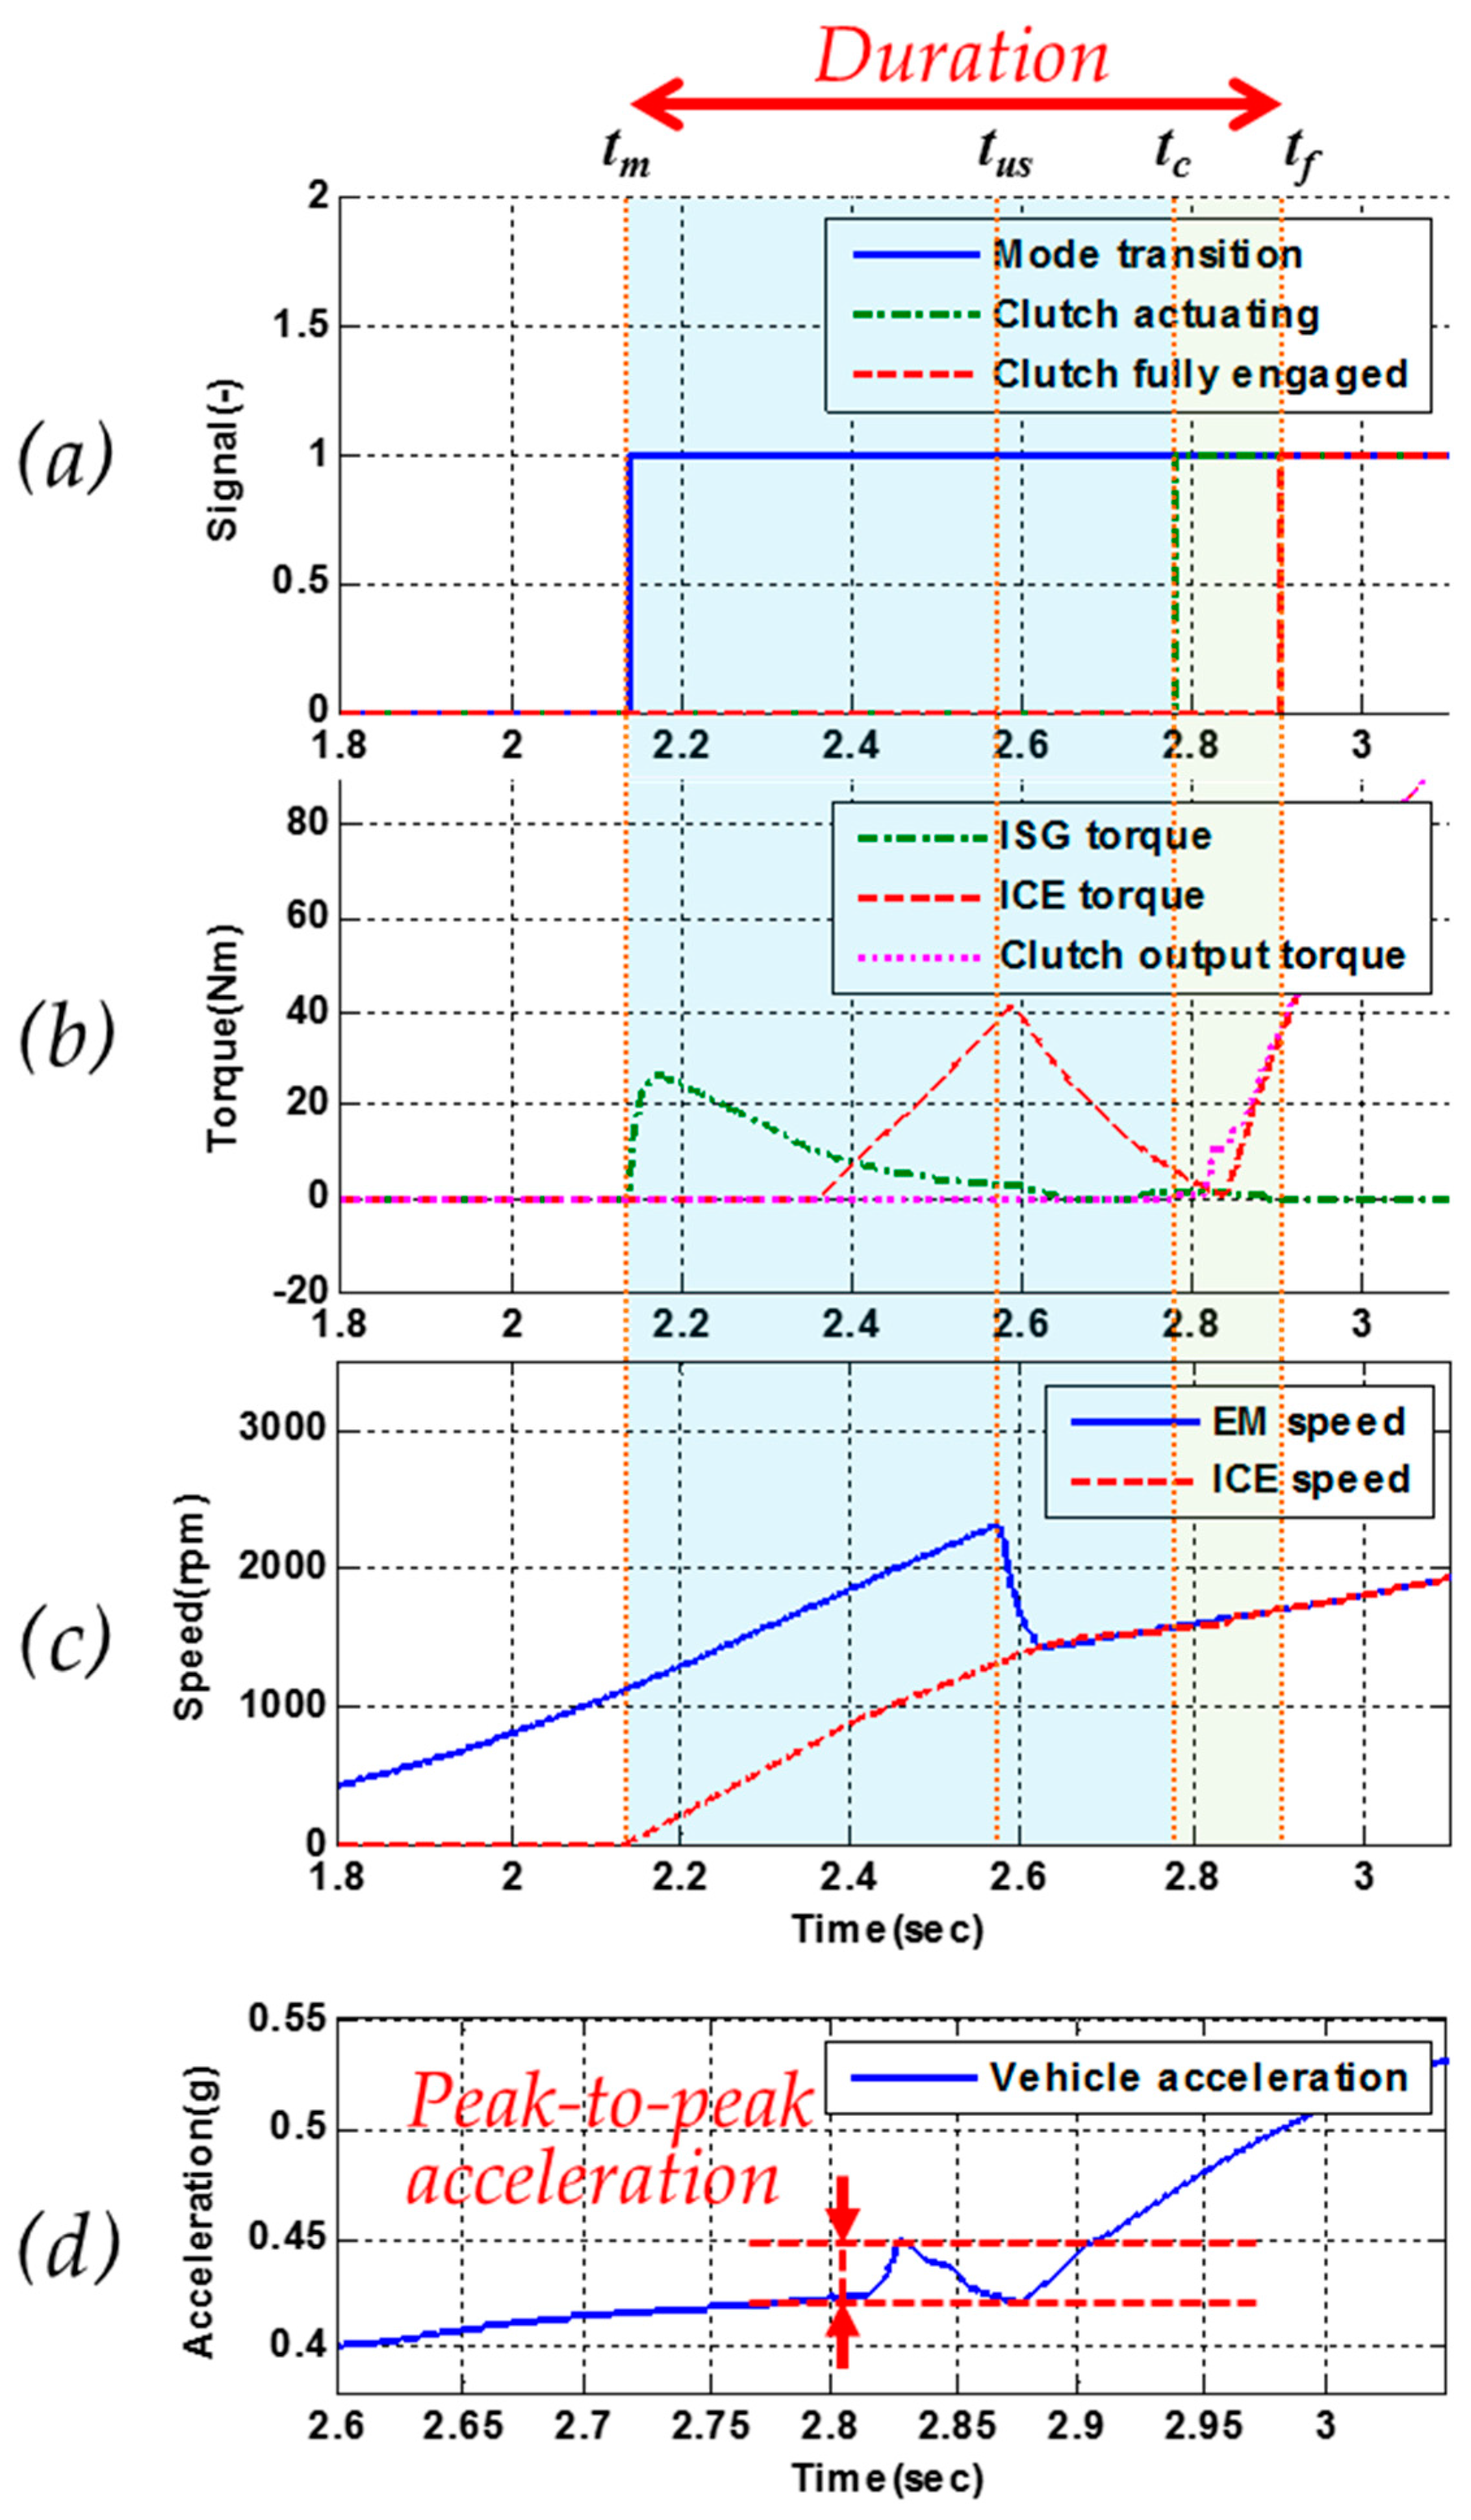
Figure 5 shows the simulation results of the HEV mode transition, which represents duration and shock. tm is the time when the mode transition signal is generated. tc is the time when the clutch is actuating. tf is the time when the clutch is fully engaged and the mode transition is finished. The duration is from tm to tf Figure 5a presents the signals of the mode transition, clutch actuating and clutch fully engaged. Figure 5b shows the torques of the ISG, ICE, and clutch. Figure 5c shows the speeds of the EM and ICE. When the mode transition signal occurs, the ISG generates torque and the ICE speed increases. If the ICE speed reaches to idling speed but the speed difference is high, the ICE generates compensation torque until the clutch is fully engaged. Figure 5d presents the acceleration of the simulation results. The shock is peak-to-peak acceleration, which is the difference between maximum and minimum accelerations during clutch engagement.
3.2. Relationship between Mode Transition and Gear Shifting
The developed PHEV performance simulator evaluates the mode transition algorithm on any driving cycle. The simulator runs a typical urban driving cycle, FTP-72. Figure 6a displays the vehicle speeds of the driving cycle and simulation results. To simulate charge sustaining, the initial battery SOC is set as 30% because the CS condition is set from 30.5% to 29.5% SOC. If a lithium ion battery is low SOC, the battery has low efficiency and downgraded performance and will be heating and aging [22]. Therefore, the simulation sets the battery usage range not to operate below 25% SOC. Figure 6b contains the speeds of the ICE and EM, and Figure 6c shows the vehicle acceleration. Figure 6d displays the mode transition and mode signals, where the mode signal is generated when a mode transition is finished and the driving mode is decided. Figure 6e shows the clutch actuating and fully engaged signals. Figure 6f,g show the battery SOC and current gear state of the transmission, respectively. Simulation results indicate that the mode transition and gear shifting happen simultaneously. The total number of HEV mode transitions is 16 and the number of both transitions with shifting is nine.
The mode transition depends on the battery SOC and wheel-demanded power. When the vehicle accelerates, and then the battery SOC is lower due to high energy consumption. It causes the HEV mode transition. Simultaneously, when initially accelerating at a stop, the transmission control unit (TCU) implements gear shifting to increase to a higher speed. The transmission shifts gears to maintain a power source at low speed and provide high torque at the optimum operating point [23]. As mentioned above, a small difference in clutch speeds during clutch engagement is important for drivability, but gear shifting can adversely affect the mode transition. The gear shifting can suddenly change the speed of the drivetrain, and make the duration of the mode transition long because the clutch speeds is not synchronized.
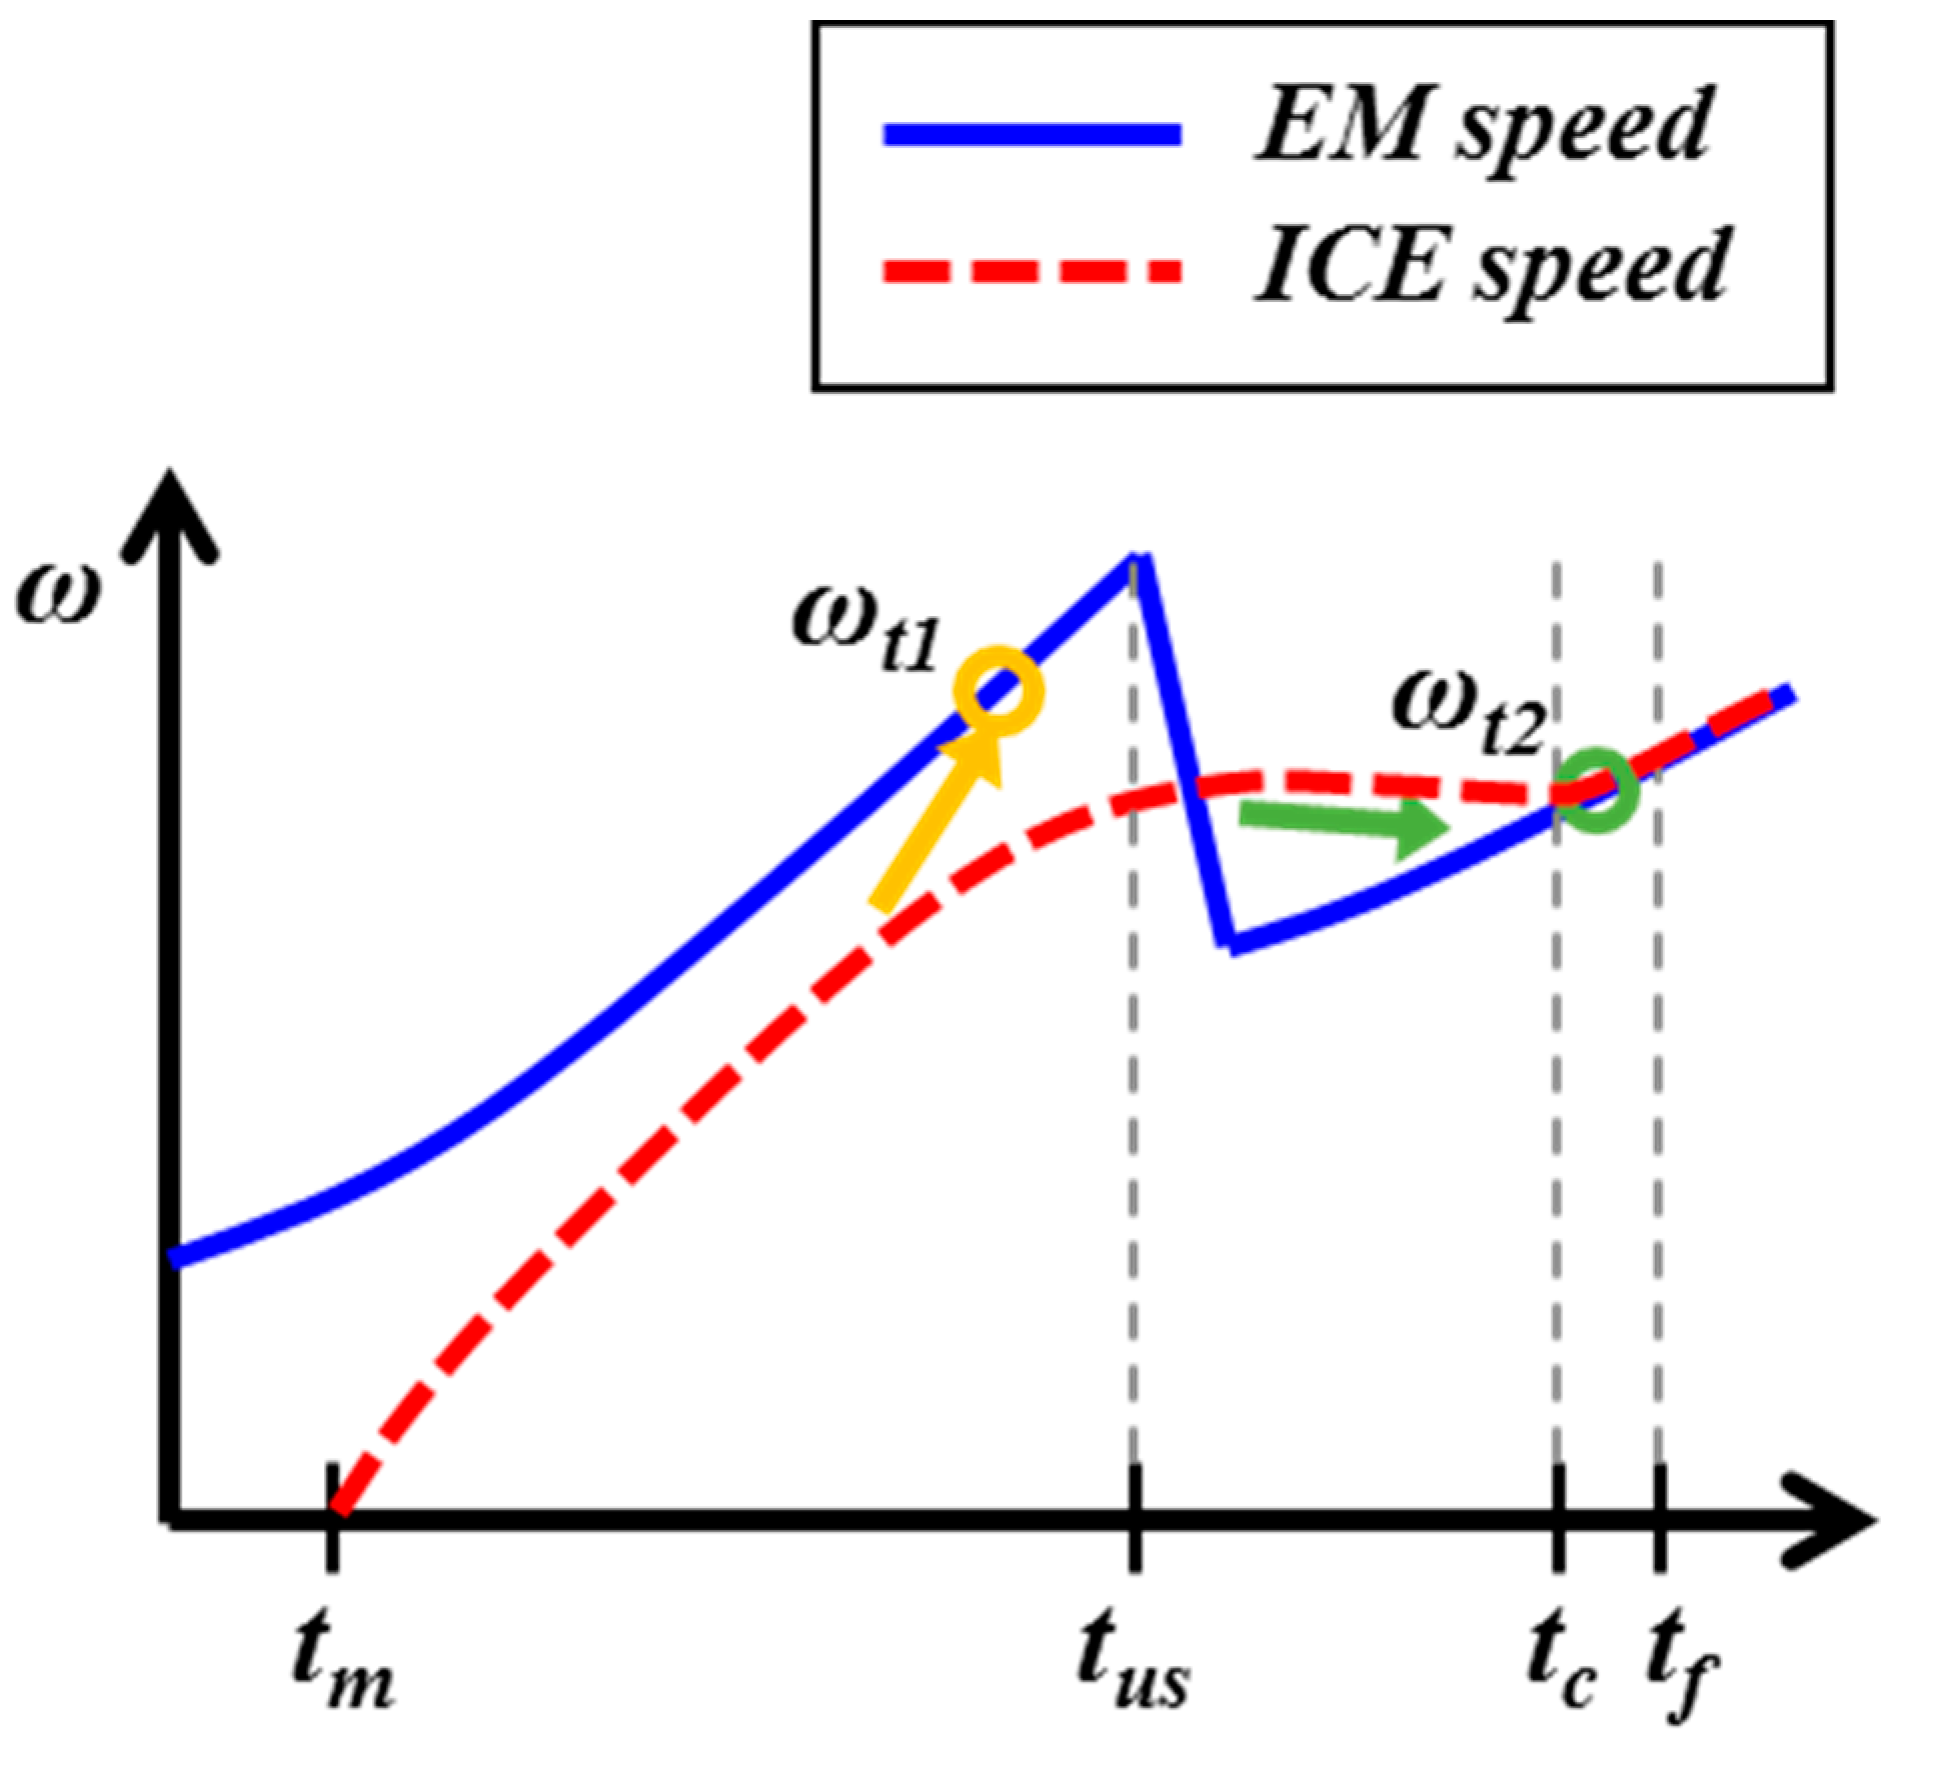
For example, Figure 7 demonstrates the problem of lengthening the mode transition. The ICE speed becomes less than the first target speed, ωt1 (output speed of clutch), and then synchronizing fails. After gear shifting, the ICE speed is not synchronized and is higher than the second target speed, ωt2. This can delay the mode transition. Therefore, to solve this problem, the gear shifting needs to be estimated, and the mode transition start time (tm) should be advanced or delayed. Thus, if the modified start time can finalize the mode transition at a lower target speed, it can reduce energy consumption and stabilize the clutch engagement. We propose a new control strategy for reducing the mode transition duration, which delays the start time.
4. Design of a Control Strategy
4.1. Analysis of Mode Transition and Gear Shifting Conditions
From the simulation results of Section 3, the points of the mode transition are identified and analyzed. Vehicle accelerations with gear shifting from first to second gear are different from the other mode transitions. Table 1 represents the vehicle accelerations at the mode transitions. There are nine mode transitions with gear shifting. Among these nine, the number of gear shifts from first to second gear is seven. The remaining two are from second to third gear. When each acceleration is analyzed during the mode transition, the acceleration is higher than 0.125 g on gear shifting from first to second gear. The gear shifting can be determined by the acceleration pedal position and the current speed [14], which are relate to acceleration. Meanwhile, the thirteenth result sustains higher acceleration than the others, and then it is excluded. The accelerations from the shifting from second to third gear does not have this property. Therefore, the fact that most of the shifts are from first to second gear can be considered as a control input. Its acceleration has a property to classify the mode transition with the gear shifting.
4.2. Design of a Control Strategy for Mode Transition with Gear Shifting
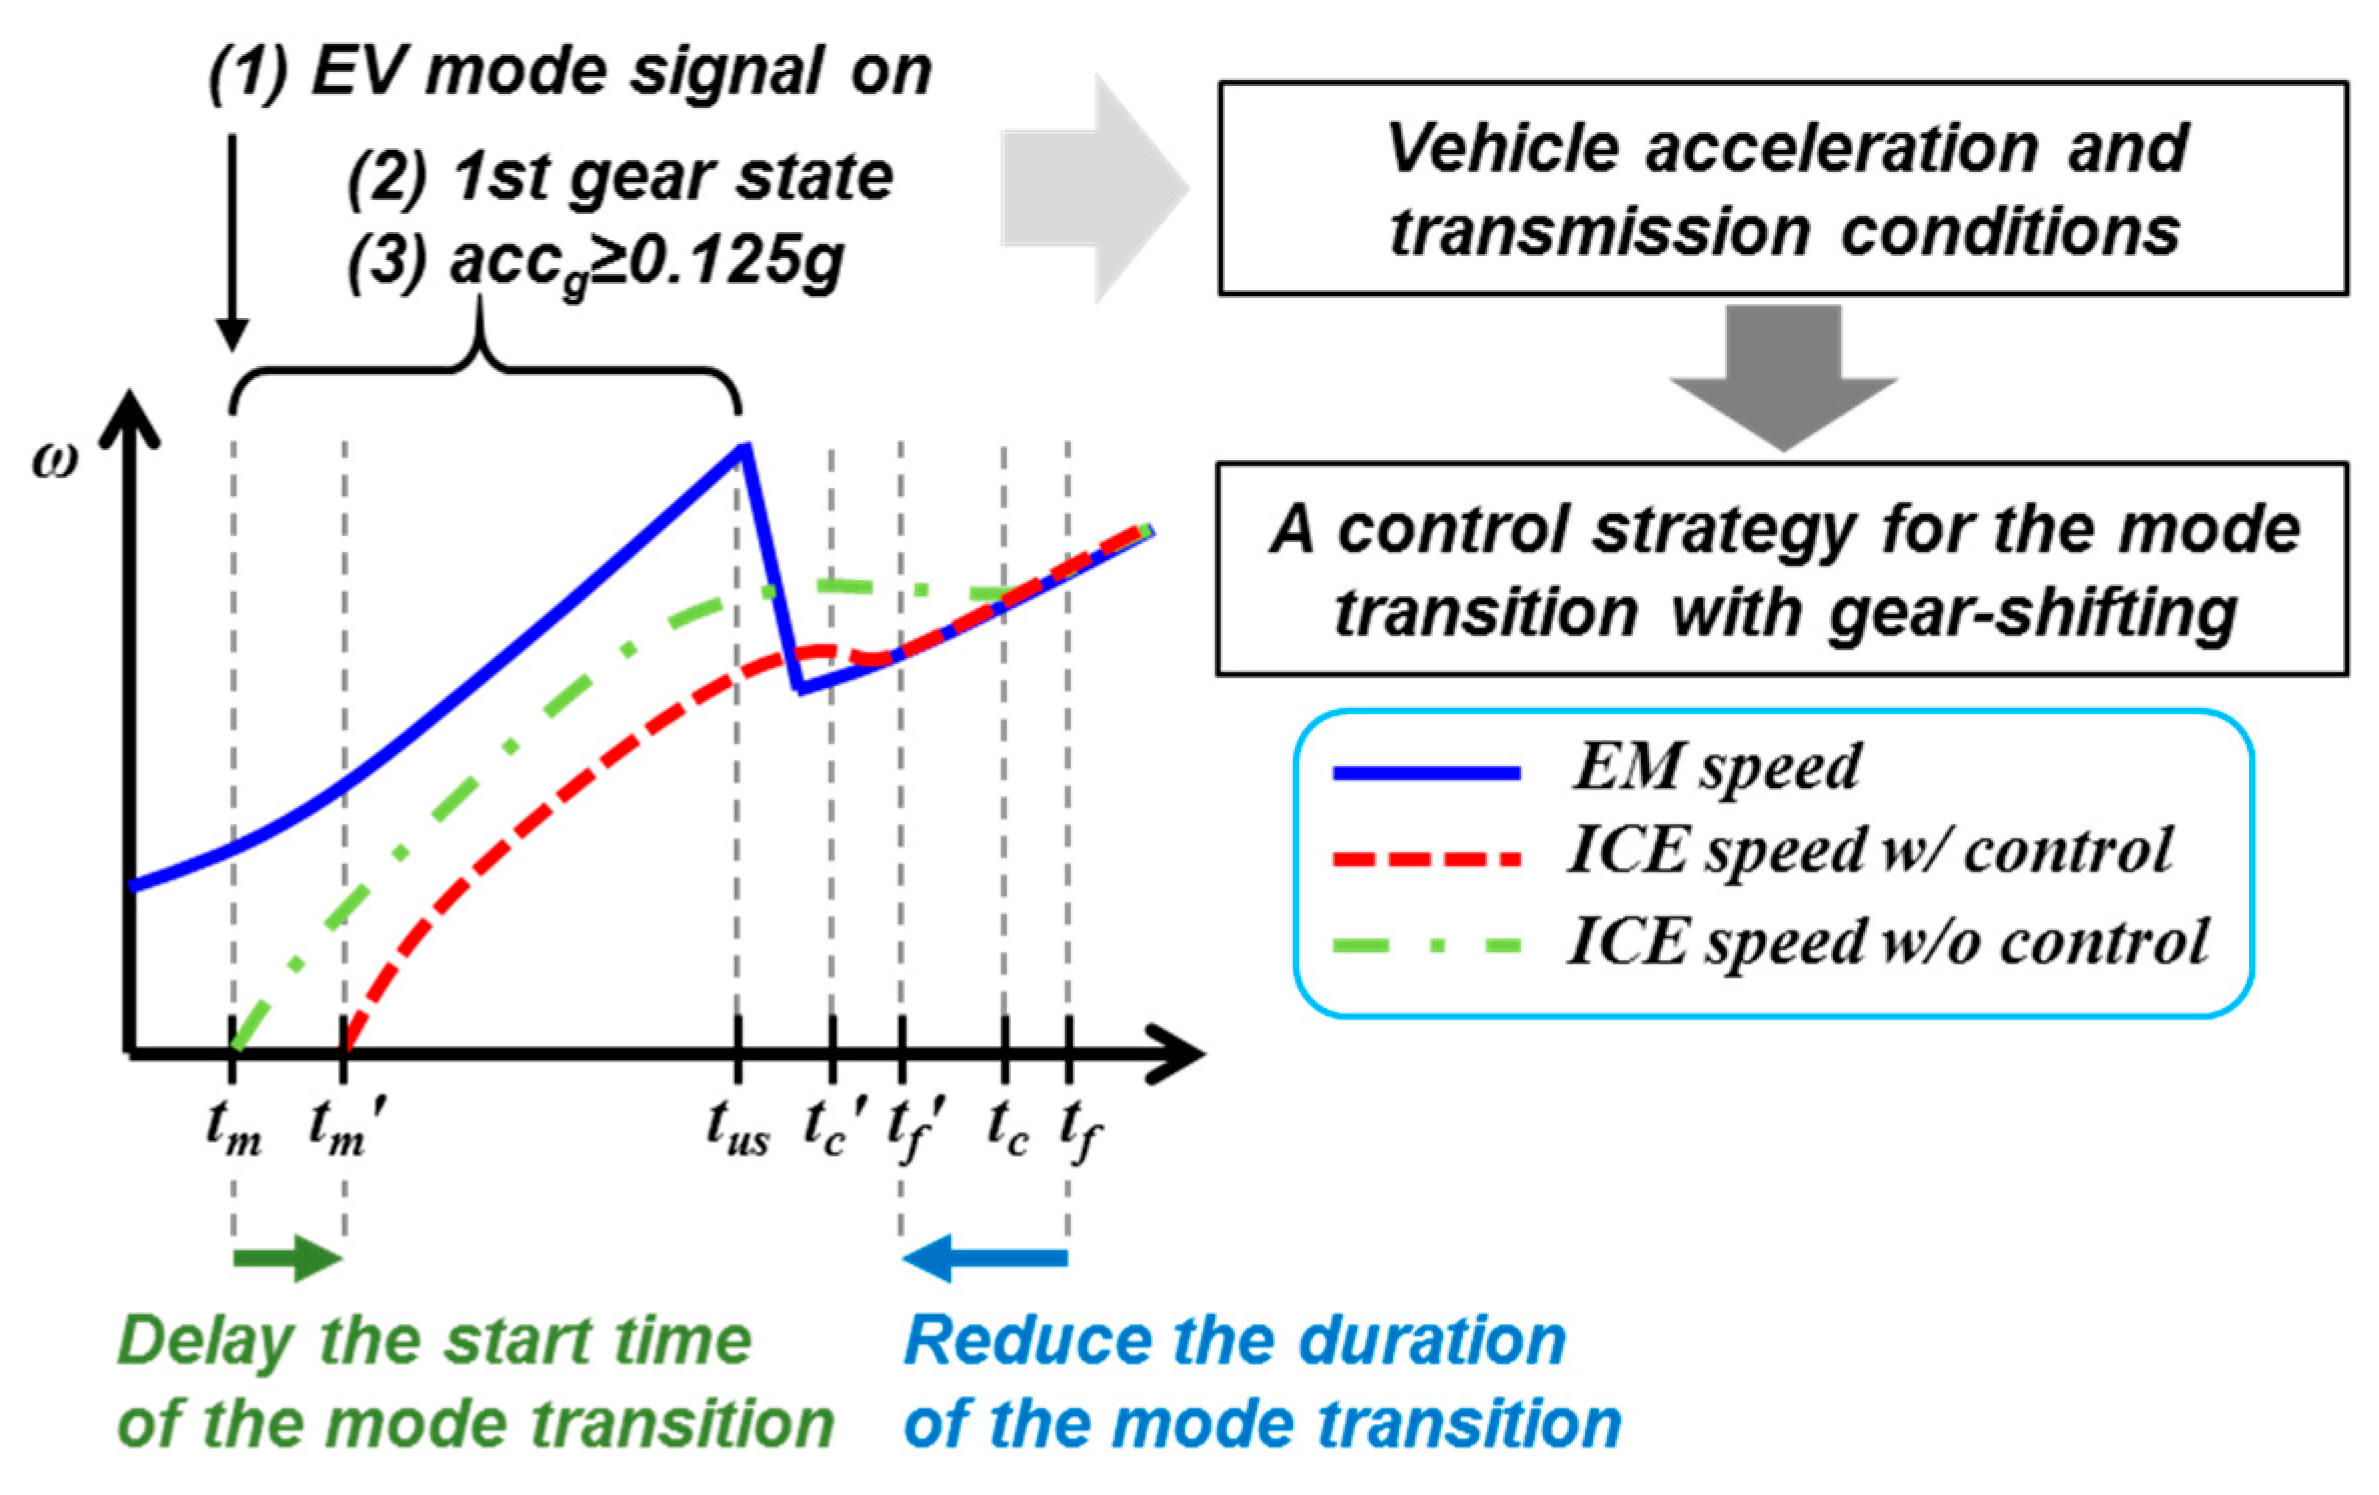
The control strategy is developed by perceiving the vehicle acceleration and transmission conditions, which determines whether to implement a mode transition. Figure 8 shows the concept of the control strategy to shift the mode transition start. tm refers to the time when the mode transition signal is generated; tc is the time when the clutch is actuating; tus is the time when the transmission gears shift; tc is the time when the clutch is actuating; tf is the time when the clutch is fully engaged and the mode transition is finished. The apostrophe time values are the results of the control strategy, which reduces the duration of the mode transition. In the Figure 4, the first red rectangle shows the control strategy. If the EV mode signal turns on, the acceleration is higher than 0.125 g, and the transmission state is in first gear, the strategy delays the mode transition start time to be closer to gear shifting. Finally, the delayed signal progresses the mode transition, followed by the clutch synchronization and engagement. The delay reduces the duration of mode transition and the output speed of the clutch (the EM side) decreases rapidly after the gear shifting. It means that the whole demanded power is reduced for speed synchronization of the mode transition.
5. Simulation Results and Analysis
5.1. Parameter Settings
5.2. Results of Mode Transition Simulation
We have provided the simulation results with and without the developed control strategy. The simulation conditions are the same as in Section 3. The driving cycle is FTP-72 and the initial battery SOC is 30% for the CS condition.
Figure 9 shows the simulation results of the mode transition with gear shifting according to the control strategy. Figure 9a,b show duration and peak-to-peak acceleration, respectively. The patterned bars are the results without the control strategy and the solid bars are the results with the control strategy. The maximum improvement of the duration is 32% and the minimum is 24%. From the previous researches, peak-to-peak acceleration less than 0.05 g does not adversely affect ride comfort in terms of drivability [24]. In this research results, the peak-to-peak accelerations during the mode transition decreases less than 0.03 g. The average improvements for the duration and the peak-to-peak acceleration are 27% and 28%, respectively.
The duration is relative to energy consumption. Energy for the mode transition is necessary but dissipates when the power disconnects from the clutch. The energy consumption includes the ISG electrical energy and the fuel consumed during the mode transition. For the comparison of total energy, the consumption is calculated by converting the electric energy usage to the equivalent fuel consumption. Table 3 shows the battery SOC, ISG electrical energy, and equivalent fuel efficiency. With the control strategy, the ISG electrical energy decreases by 31.4%. The equivalent fuel efficiency increases by 0.452%.
For example, Figure 10 shows the mode transition number 5 for FTP-72, which represent the reduced duration of mode transition through the control strategy. The simulation results are the speeds of the EM and ICE for the mode transition. Figure 10a represents the result without the control strategy. The mode transition starts at 448.2 s and finishes at 453.2 s; thus, its duration (dtw/o) is approximately 5 s. Figure 10b depicts the mode transition result with the control strategy. The mode transition starts at 449.6 s and finishes at 453 s, presenting a duration (dtw/) of 3.4 s. With the control strategy, the duration reduces by approximately 1.6 s, or 32%. As a result, the reduced duration decreases the energy consumption.
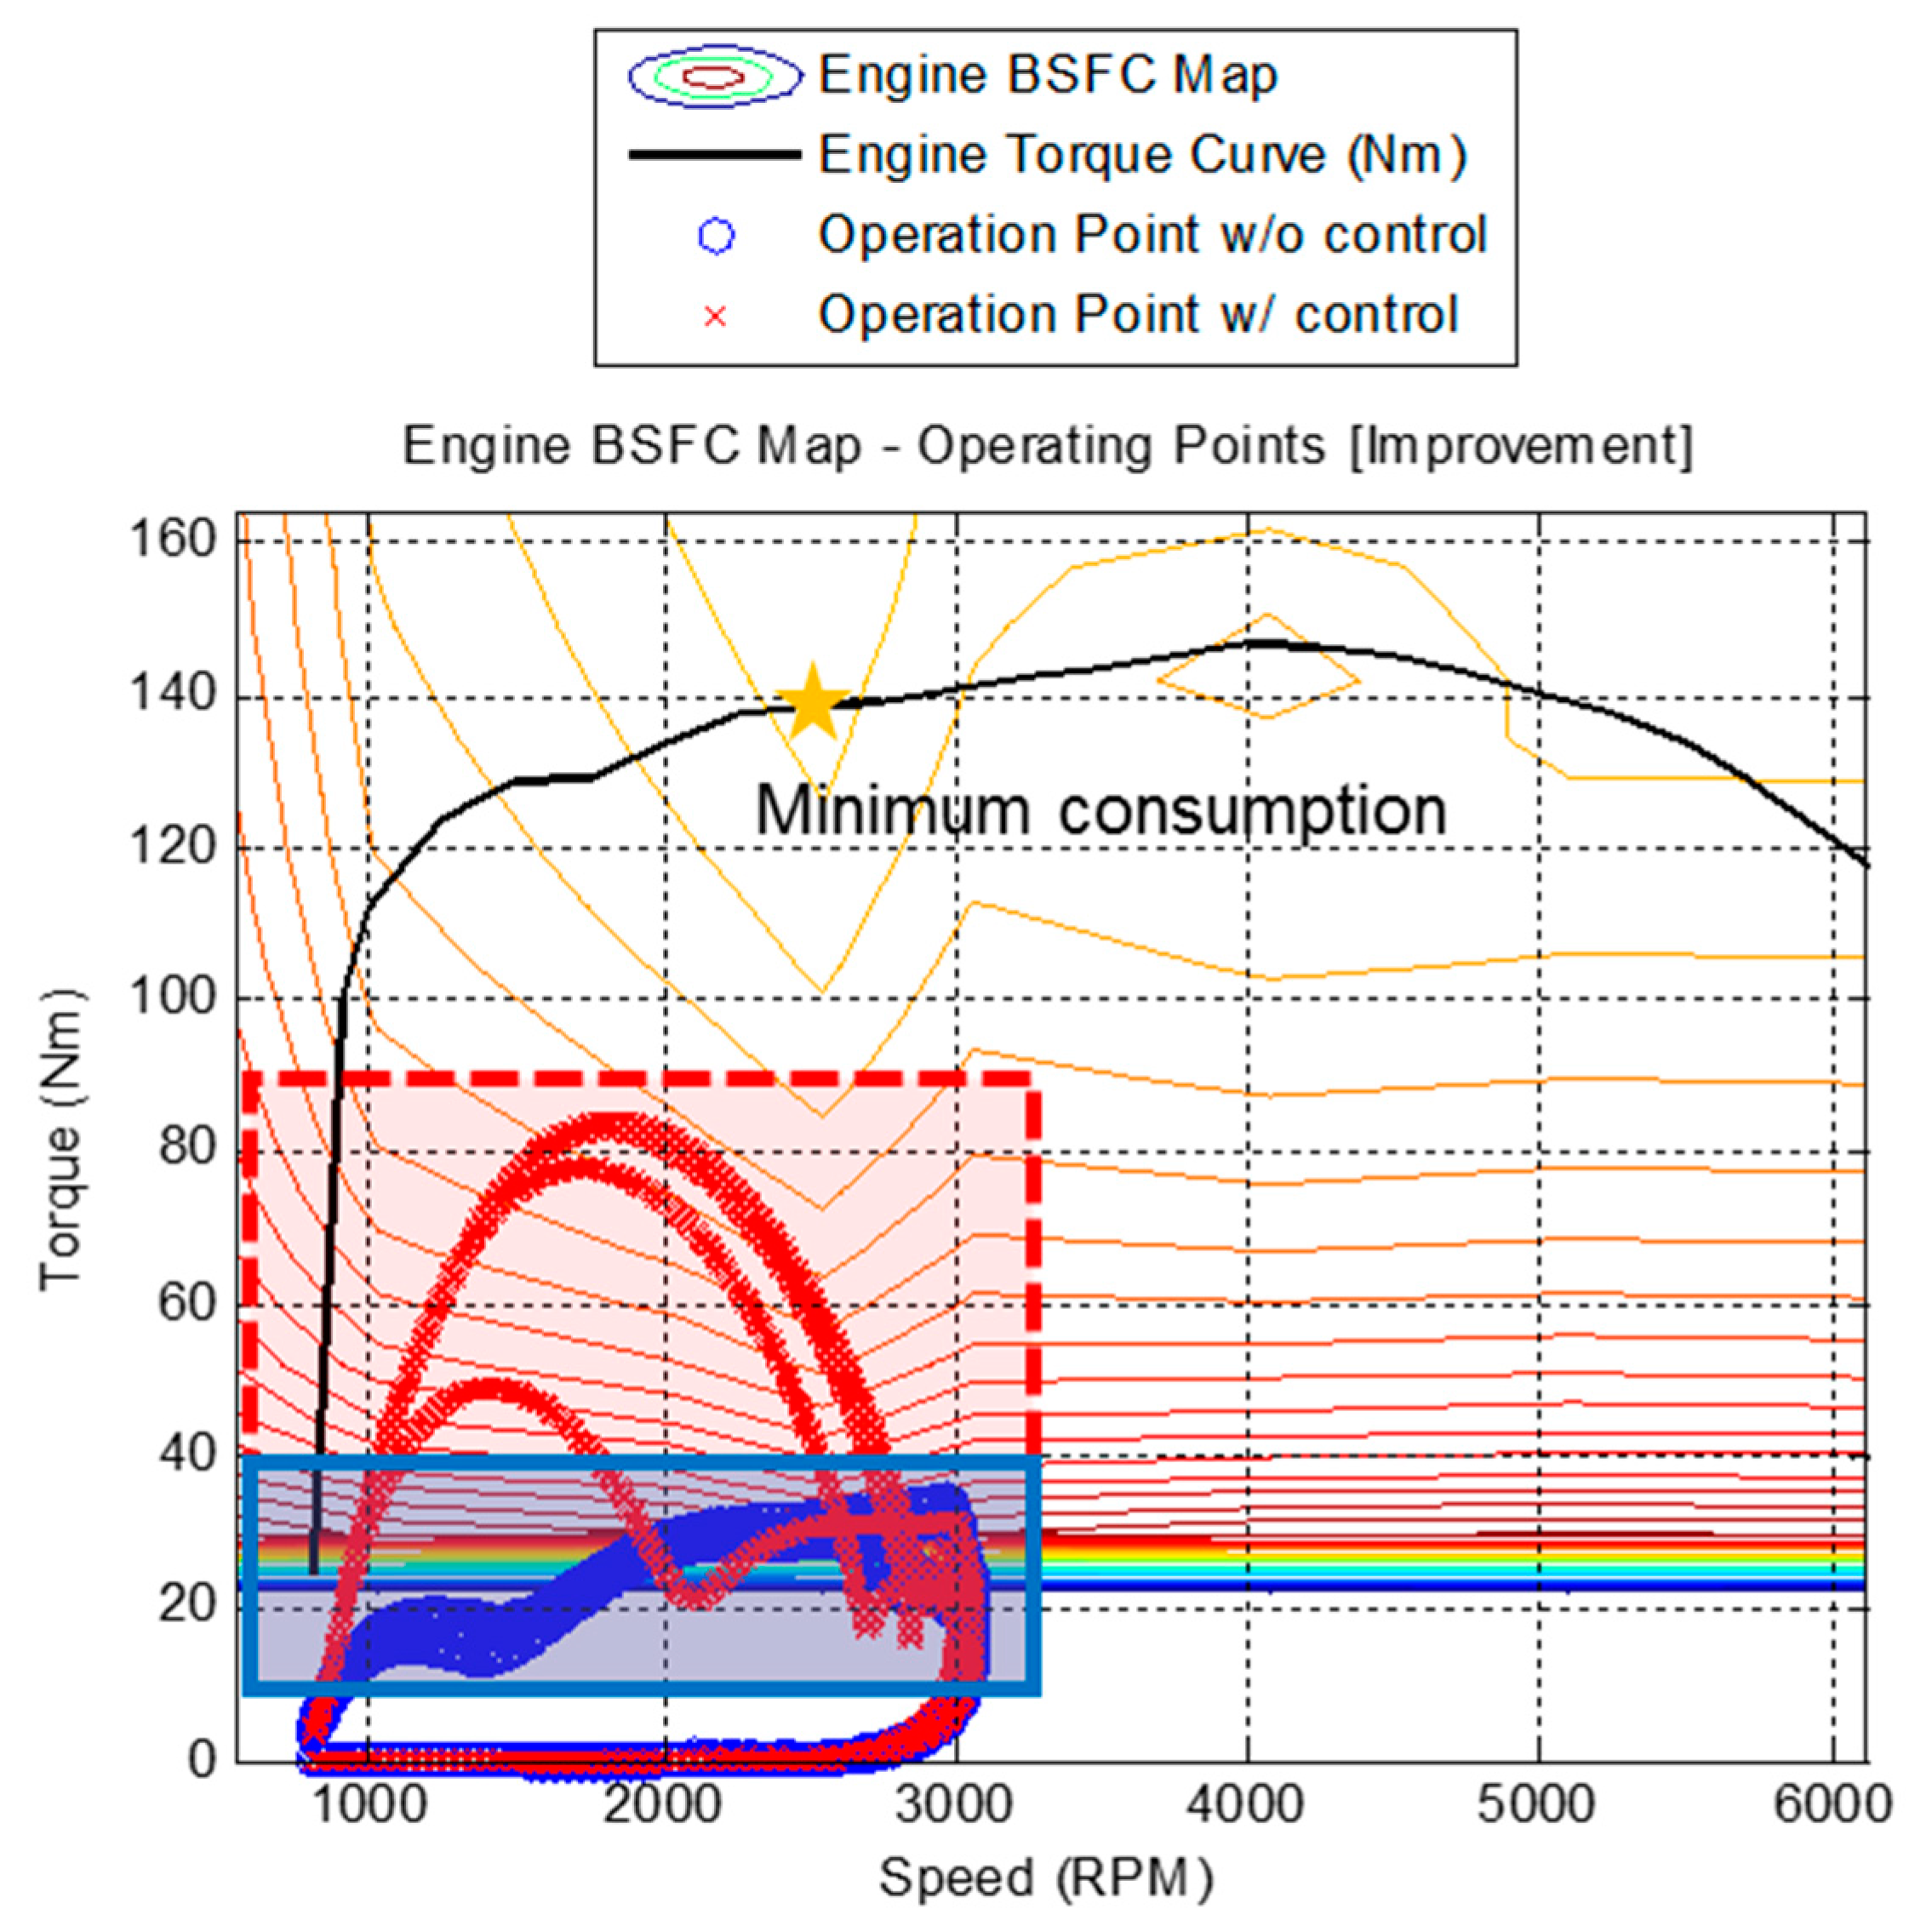
In addition, operating the ICE become more efficient. Figure 11 shows the brake-specific fuel consumption (BSFC) map and operation points of the ICE during mode transition. The BSFC map represents the rate of fuel consumption divided by the power of the ICE. The blue cross marks are the operation points of the ICE with the control strategy in the solid blue rectangle, while the red circle marks are those of the ICE in the dotted red rectangle. The ICE torque with the control strategy is higher than without the control strategy. The short duration demands an increase in the ICE torque for rapid mode transition, which quickly increases the input speed of the clutch (ICE speed), as shown in Figure 10b. This results in operating at more efficient operating points of high torque, rather than less efficient points of low torque, which enhances the fuel efficiency. Therefore, the control strategy is effective by improving the ICE efficiency and reducing unnecessary energy consumption.
5.3. Verification of the Control Strategy
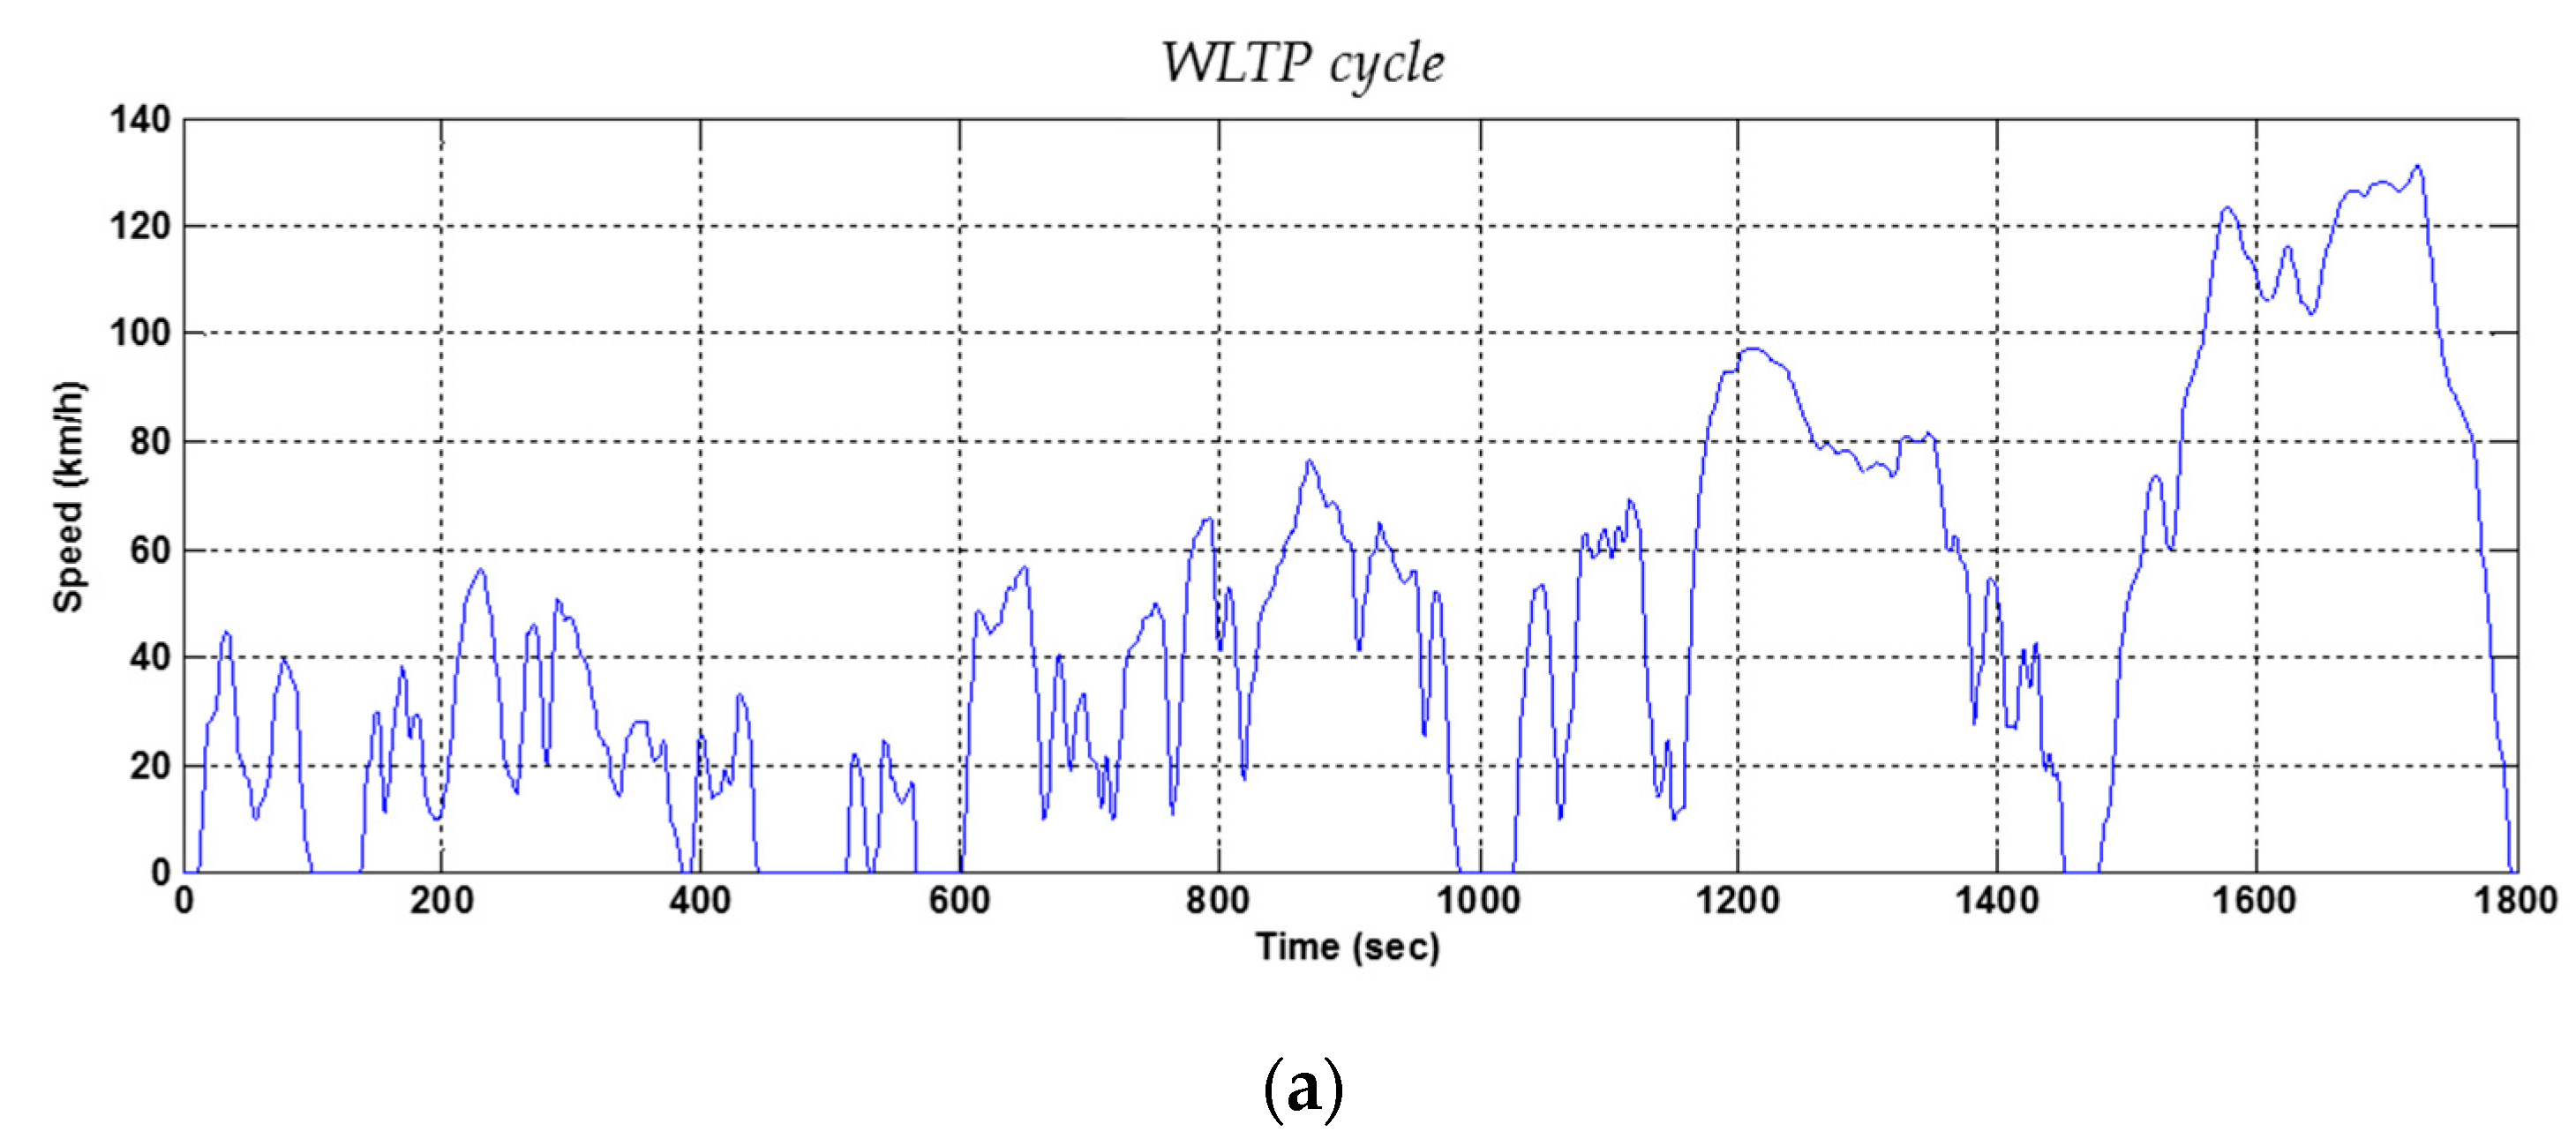
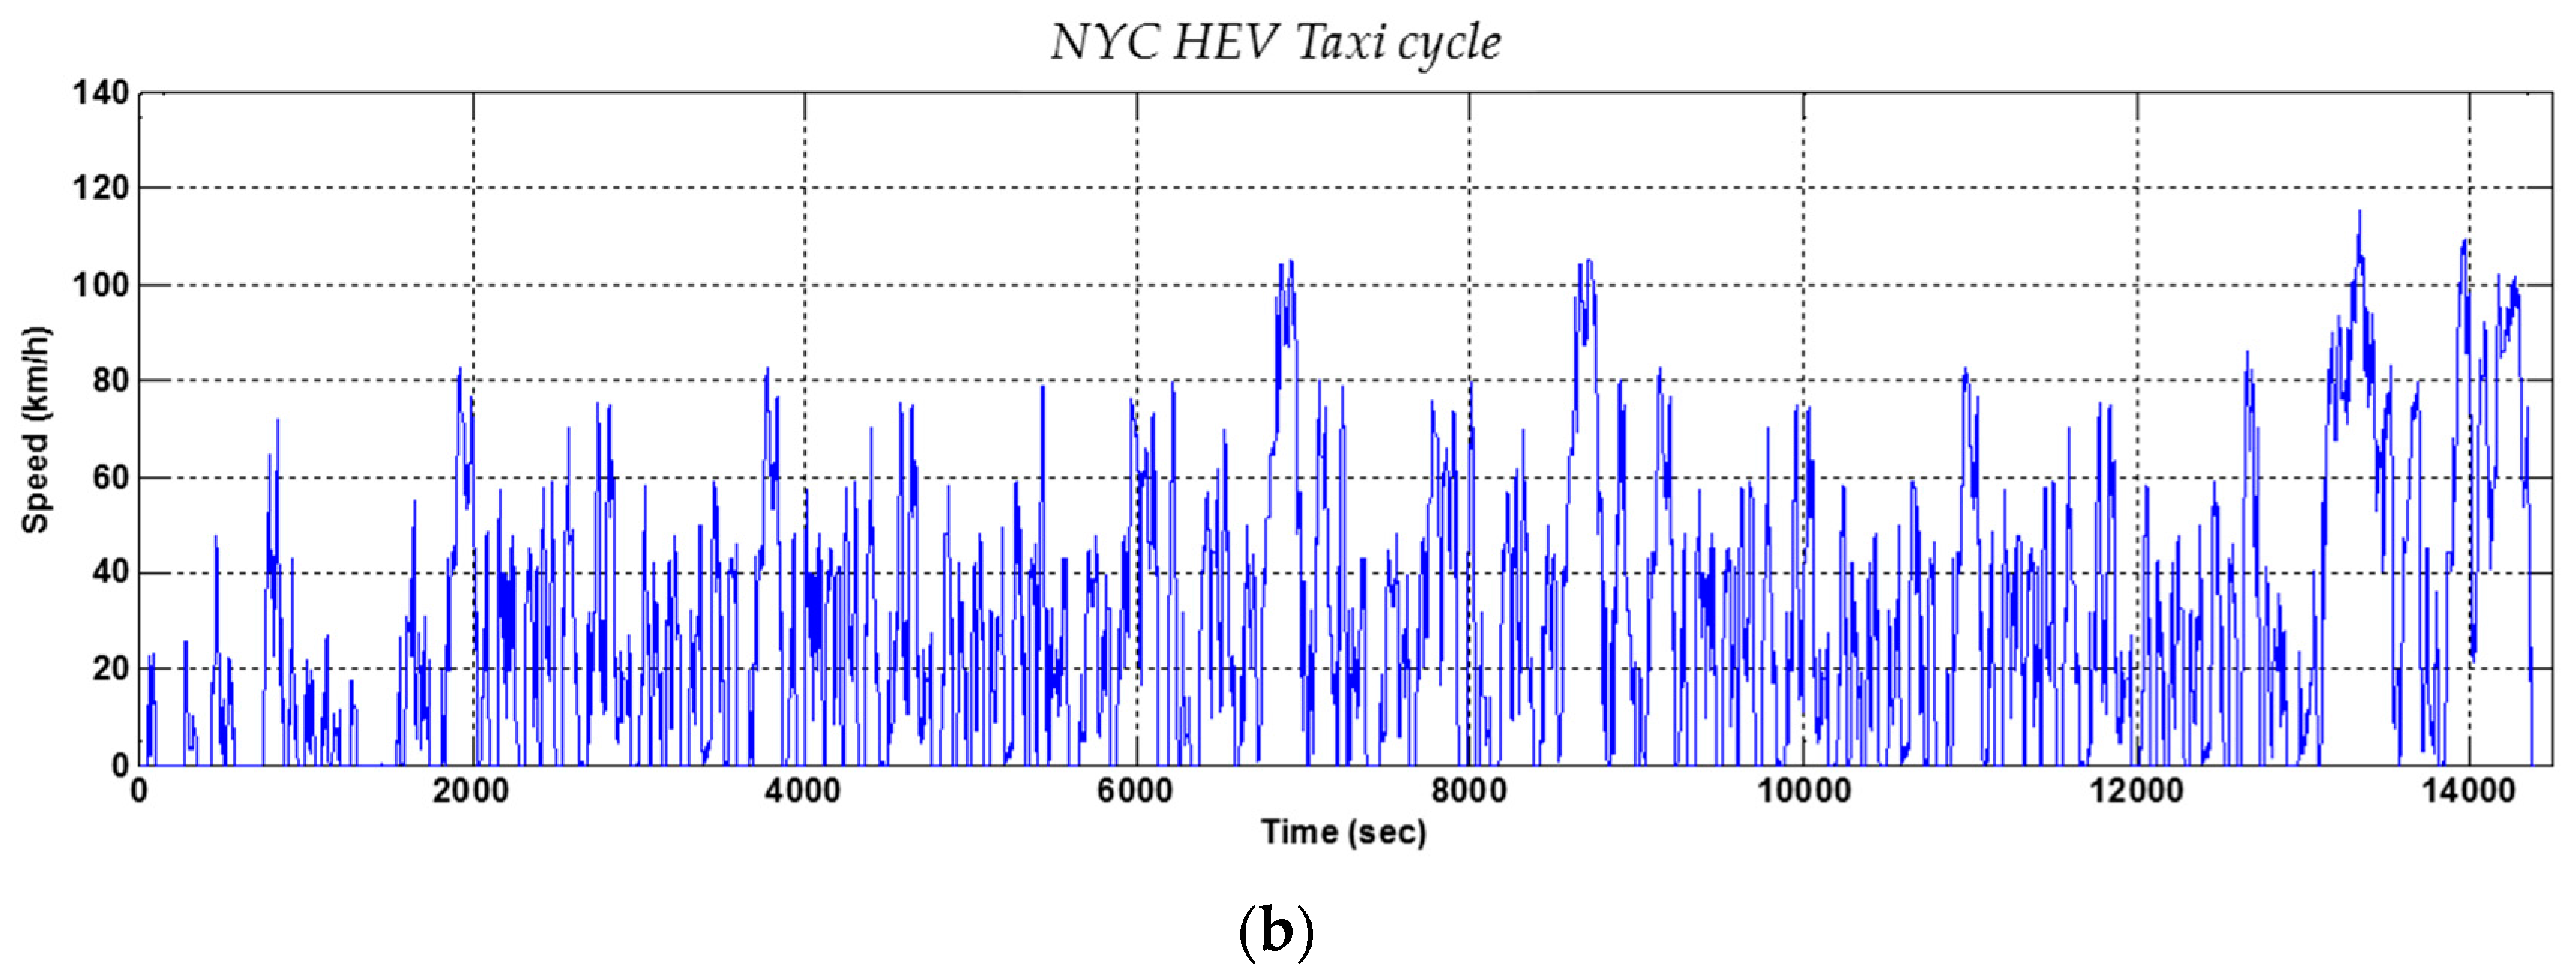
To verify the proposed control strategy, the simulation conditions are changed to different driving cycles, Worldwide Harmonized Light Vehicles Test Procedure (WLTP) and New York City (NYC) Hybrid Electric Vehicle (HEV) Taxi cycles, as shown in Figure 12. The WLTP cycle is used as a new driving cycle for evaluation of fuel efficiency and emissions for September 2017 [25]. Meanwhile, the Autonomie software [15] offers an NYC HEV Taxi cycle, lasting four hours. The two different cycles were simulated with and without the developed control strategy. With the exception of the driving cycle, the simulation conditions are the same as previously discussed in Section 5.2. The initial battery SOC is set as 30% for the CS condition.
Table 4 shows the simulation results of the WLTP and NYC HEV Taxi cycles, with regards to their equivalent fuel efficiency. In the WLTP cycle with the control strategy, the equivalent fuel efficiency increases by 0.078%. There is a total number of 13 mode transitions, and the number of transitions with shifting is three. The improvement is effective but low. FTP-72 is commonly known as the “city driving” cycle, and it has 18 stops and starts, where the transition and shifting occur easily. Compared to the FTP-72 cycle, the WLTP cycle has eight stops and starts, and the control strategy occurs less frequently.
In the NYC HEV Taxi cycle with the control strategy, the equivalent fuel efficiency increases by 0.307%. There is a total number of 83 mode transitions, and the number of transitions and shifting is 12. As the mode transitions occur more often, the control strategy further improves fuel efficiency. The driving cycle affects the improvement of the control strategy, which depends on the number of mode transitions.
In terms of drivability, the duration and peak-to-peak acceleration are identified in the two different driving cycles. Table 5 shows the simulation results of the WLTP and NYC HEV Taxi cycles, with regards to their duration and peak-to-peak acceleration during mode transition. Although the duration and acceleration depend on the different driving cycles and the mode transition conditions, the control strategy enhances the drivability. The durations of WLTP and NYC HEV Taxi cycles reduce by 31% and 11%, respectively. The peak-to-peak acceleration decreases less than 0.03 g. Because the duration decreases and saves the time for the clutch synchronization, the peak-to-peak acceleration reduces under the stabilized clutch engagement. Moreover, the reduced duration increases fuel efficiency by reducing unnecessary energy consumption.
6. Conclusions
This paper proposed a control strategy for mode transitions of PHEVs. Using the PHEV performance simulator, we considered that the mode transition occurs repeatedly with gear shifting to reduce the duration of mode transition. The acceleration at the mode transition with simultaneous gear shifting is higher than 0.125 g. If the current driving condition is in the EV mode, in the first gear state, and higher than 0.125 g, the control strategy delays the start of the mode transition. When the PHEV ran in the CS condition, using the control strategy reduced the duration and the peak-to-peak acceleration. For the FTP-72 driving cycle, the fuel efficiency improved by 0.45% due to the reduced duration. The peak-to-peak acceleration reduced by 28%. For other driving cycles, the fuel efficiency improved by 0.08% and 0.31% for the WLTP and the NYC HEV Taxi cycles, respectively. The control strategy depended on the number of mode transition, which showed that frequent mode transition further improved fuel efficiency. The mode transition strategy considered with gear shifting showed improvements both in fuel efficiency and drivability.
Acknowledgments
This work was supported by the Industrial Strategic Technology Development Program (No. 10062742, Development of Power Distribution Control for High Fuel Efficiency of Plug-in Hybrid Electric Vehicle using Route Information) funded By the Ministry of Trade, Industry & Energy (MOTIE, Korea).
Author Contributions
K.S. proposed and designed the control strategy for mode transition and wrote the paper. S.-M.O. and K.-Y.K. performed the simulation. S.-H.H. supervised this research.
Conflicts of Interest
The authors declare no conflict of interest.
References
- Onori, S.; Serrao, L.; Rizzoni, G. Hybrid Electric Vehicles; Springer: London, UK, 2016. [Google Scholar]
- Sharer, P.; Rousseau, S.; Karbowski, D.; Pagerit, S. Plug-in Hybrid Electric Vehicle Control Strategy: Comparison between EV and Charge-Depleting Options; SAE Technical Paper; SAE International: Detroit, MI, USA, 2008. [Google Scholar]
- Husain, I. Electric and Hybrid Vehicles: Design Fundamentals, 2nd ed.; CRC Press: Boca Raton, FL, USA, 2011. [Google Scholar]
- Ehsani, M.; Gao, Y.; Gay, S.; Emadi, A. Modern Electric, Hybrid Electric, and Fuel Cell Vehicles, 2nd ed.; CRC Press: Boca Raton, FL, USA, 2009. [Google Scholar]
- Guo, D.; Du, C.; Yan, F. Drivability-Related Discrete-Time Model Predictive Control of Mode Transition in Pre-Transmission Parallel Hybrid Powertrains. Energies 2016, 9, 740. [Google Scholar] [CrossRef]
- Koprubasi, K. Modeling and Control of a Hybrid-Electric Vehicle for Drivability and Fuel Economy Improvements. Ph.D. Thesis, The Ohio State University, Columbus, OH, USA, 2008. [Google Scholar]
- Sun, J.; Xing, G.; Zhang, C. Data-Driven Predictive Torque Coordination Control during Mode Transition Process of Hybrid Electric Vehicles. Energies 2017, 10, 441. [Google Scholar] [CrossRef]
- Hwang, H.S.; Yang, D.H.; Choi, H.K.; Kim, H.S.; Hwang, S.H. Torque Control of Engine Clutch to Improve the Driving Quality of Hybrid Electric Vehicles. Int. J. Automot. Technol. 2011, 12, 763–768. [Google Scholar] [CrossRef]
- Kim, H.; Kim, J.; Lee, H. Mode Transition Control using Disturbance Compensation for a Parallel Hybrid Electric Vehicle. Proc. Inst. Mech. Eng. Part D J. Automob. Eng. 2010, 225, 150–166. [Google Scholar] [CrossRef]
- Song, M.; Oh, J.; Choi, S.; Kim, Y.; Kim, H. Motor Control of a Parallel Hybrid Electric Vehicle during Mode Change without an Integrated Starter Generator. J. Electr. Eng. Technol. 2013, 8, 930–937. [Google Scholar] [CrossRef]
- Opila, D. Incorporating Drivability Metrics into Optimal Energy Management Strategies for Hybrid Vehicles. Ph.D. Thesis, The University of Michigan, Ann Arbor, MI, USA, 2010. [Google Scholar]
- Kim, S.; Chung, K.S.; Kim, S.; Jo, K. Optimal Control of Integrated Starter and Generator for Maximum Energy Recovery during Engine Stop Transition in Hybrid Electric Vehicles; Technical Paper; SAE International: Detroit, MI, USA, 2016. [Google Scholar]
- Kim, S.; Park, S. Control Strategy of Integrated Starter and Generator for Fuel Economy in Parallel Hybrid Electric Vehicle. In Proceedings of the Electric Vehicle Symposium and Exhibition (EVS29), Montreal, QC, Canada, 19–22 June 2016. [Google Scholar]
- Sim, K.H.; Oh, S.M.; Namkoong, C.; Lee, J.S.; Han, K.S.; Hwang, S.H. Control Strategy for Clutch Engagement during Mode Change of Plug-In Hybrid Electric Vehicle. Int. J. Automot. Technol. 2017, 18, 901–909. [Google Scholar] [CrossRef]
- Kim, N.; Lohse-Busch, H.; Rousseau, A. Development of a Model of the Dual Clutch Transmission in Autonomie and Validation with Dynamometer Test Data. Int. J. Automot. Technol. 2014, 15, 263–271. [Google Scholar] [CrossRef]
- Autonomie. Available online: http://www.autonomie.net/ (accessed on 31 May 2017).
- He, H.W.; Xiong, R.; Chang, Y.H. Dynamic Modeling and Simulation on a Hybrid Power System for Electric Vehicle Applications. Energies 2010, 3, 1821–1830. [Google Scholar] [CrossRef]
- Bowles, P.; Peng, H.; Zhang, X. Energy Management in a Parallel Hybrid Electric Vehicle with a Continuously Variable Transmission. In Proceedings of the American Control Conference, Chicago, IL, USA, 28–30 June 2000. [Google Scholar]
- Khajepour, A.; Fallah, S.; Goodarzi, A. Electric and Hybrid Vehicles; John Wiley & Sons: Chichester, UK, 2014. [Google Scholar]
- Malikopoulos, A. Supervisory Power Management Control Algorithms for Hybrid Electric Vehicles: A Survey. IEEE Trans. Intell. Transp. Syst. 2014, 15, 1869–1885. [Google Scholar] [CrossRef]
- Chen, Z.; Xiong, R.; Wang, K.; Jiao, B. Optimal Energy Management Strategy of a Plug-in Hybrid Electric Vehicle Based on a Particle Swarm Optimization Algorithm. Energies 2015, 8, 3661–3678. [Google Scholar] [CrossRef]
- Marano, V.; Onori, S.; Guezennec, Y.; Rizzoni, G.; Madella, N. Lithium-ion Batteries Life Estimation for Plug-In Hybrid Electric Vehicles. In Proceedings of the Vehicle Power and Propulsion Conference, Dearborn, MI, USA, 7–10 September 2009. [Google Scholar]
- Fischer, R.; Kucukay, F.; Jurgens, G.; Najork, R.; Pollak, B. The Automotive Transmission Book; Springer: Cham, Switzerland, 2015. [Google Scholar]
- Jung, H.; Lee, H.; Rhee, J.; Lee, S. Control Strategy Development for Belt-Driven ISG (Integrated Starter Generator) System Applied to the Parallel Hybrid Vehicle; Korean Society of Automotive Engineers (KSAE): Seoul, Korea, 2007. [Google Scholar]
- Mock, P.; Kuhlwein, J.; Tietge, U.; Franco, V.; Bandivadekar, A.; German, J. The WLTP: How A New Test Procedure for Cars will Affect Fuel Consumption Values in the EU; The International Council on Clean Transportation (ICCT): Berlin, Germany, 2014. [Google Scholar]
Figure 1.
Configuration of the pre-transmission parallel-type plug-in hybrid electric vehicles (PHEV).
Figure 1.
Configuration of the pre-transmission parallel-type plug-in hybrid electric vehicles (PHEV).

Figure 2.
The process of fuel efficiency evaluation.
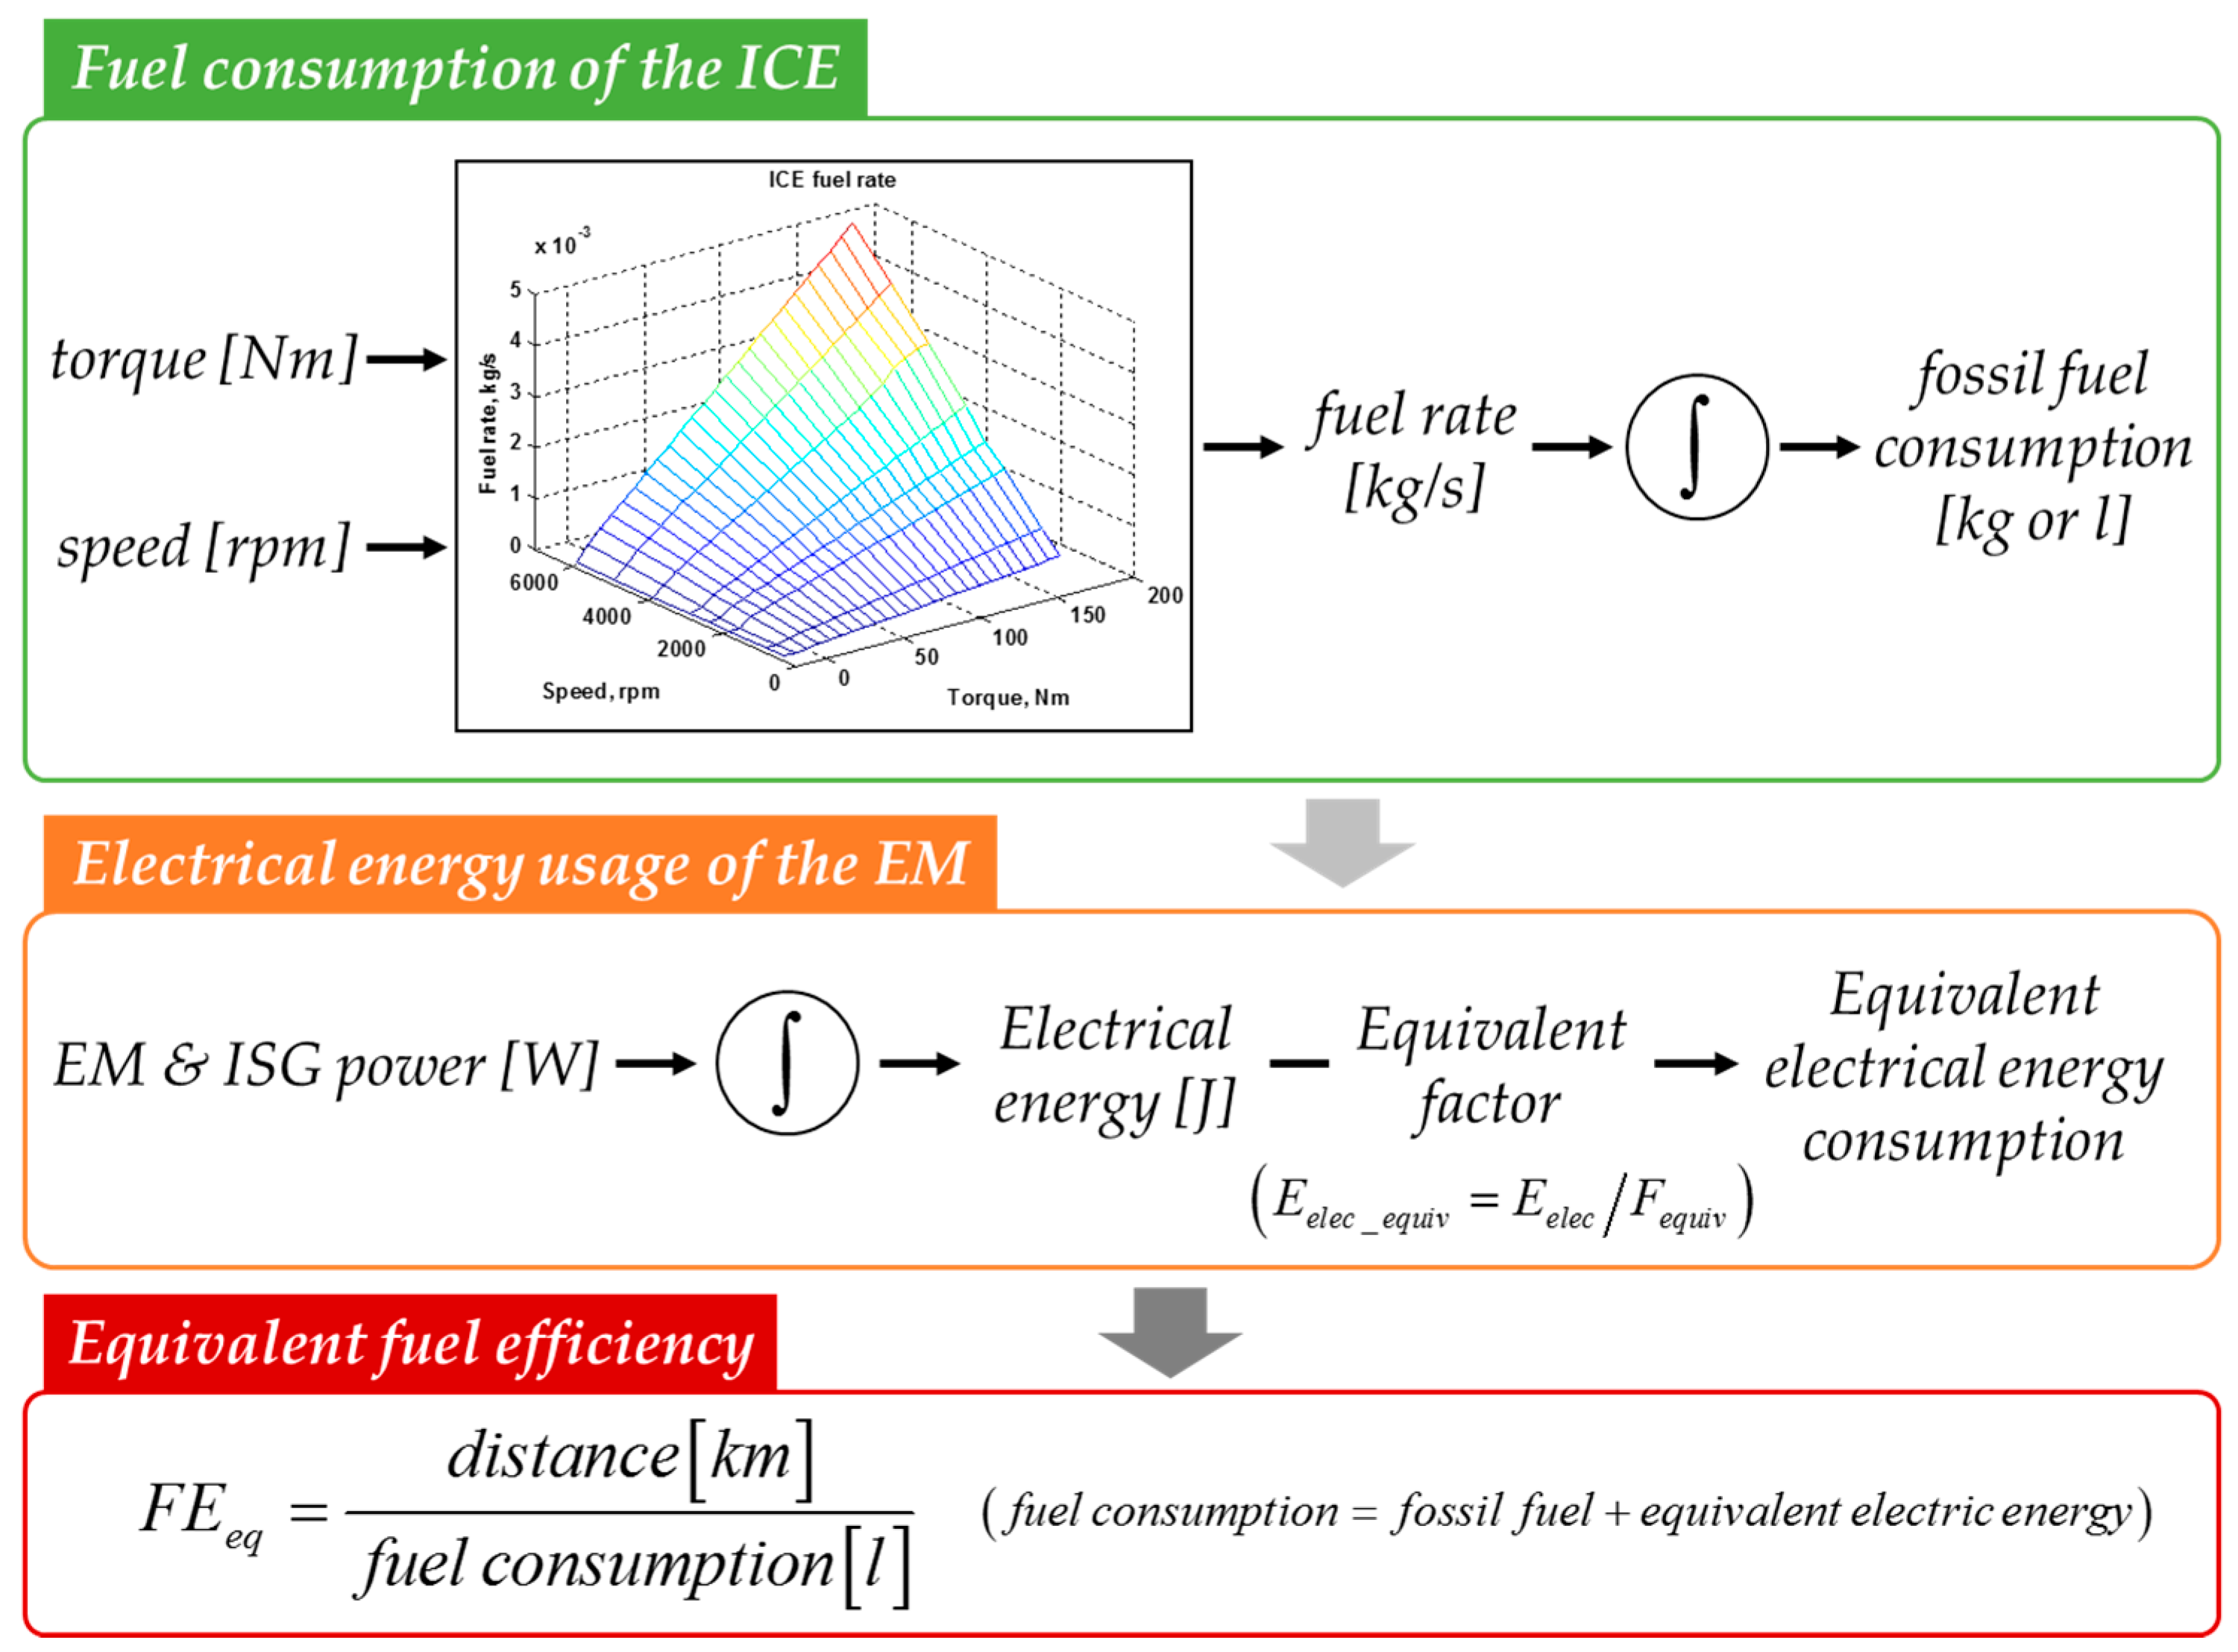
Figure 3.
Internal combustion engine (ICE) compensation control using a proportional plus integral (PI) controller.
Figure 3.
Internal combustion engine (ICE) compensation control using a proportional plus integral (PI) controller.

Figure 4.
Process of the hybrid electric vehicle (HEV) mode transition with the control strategy.
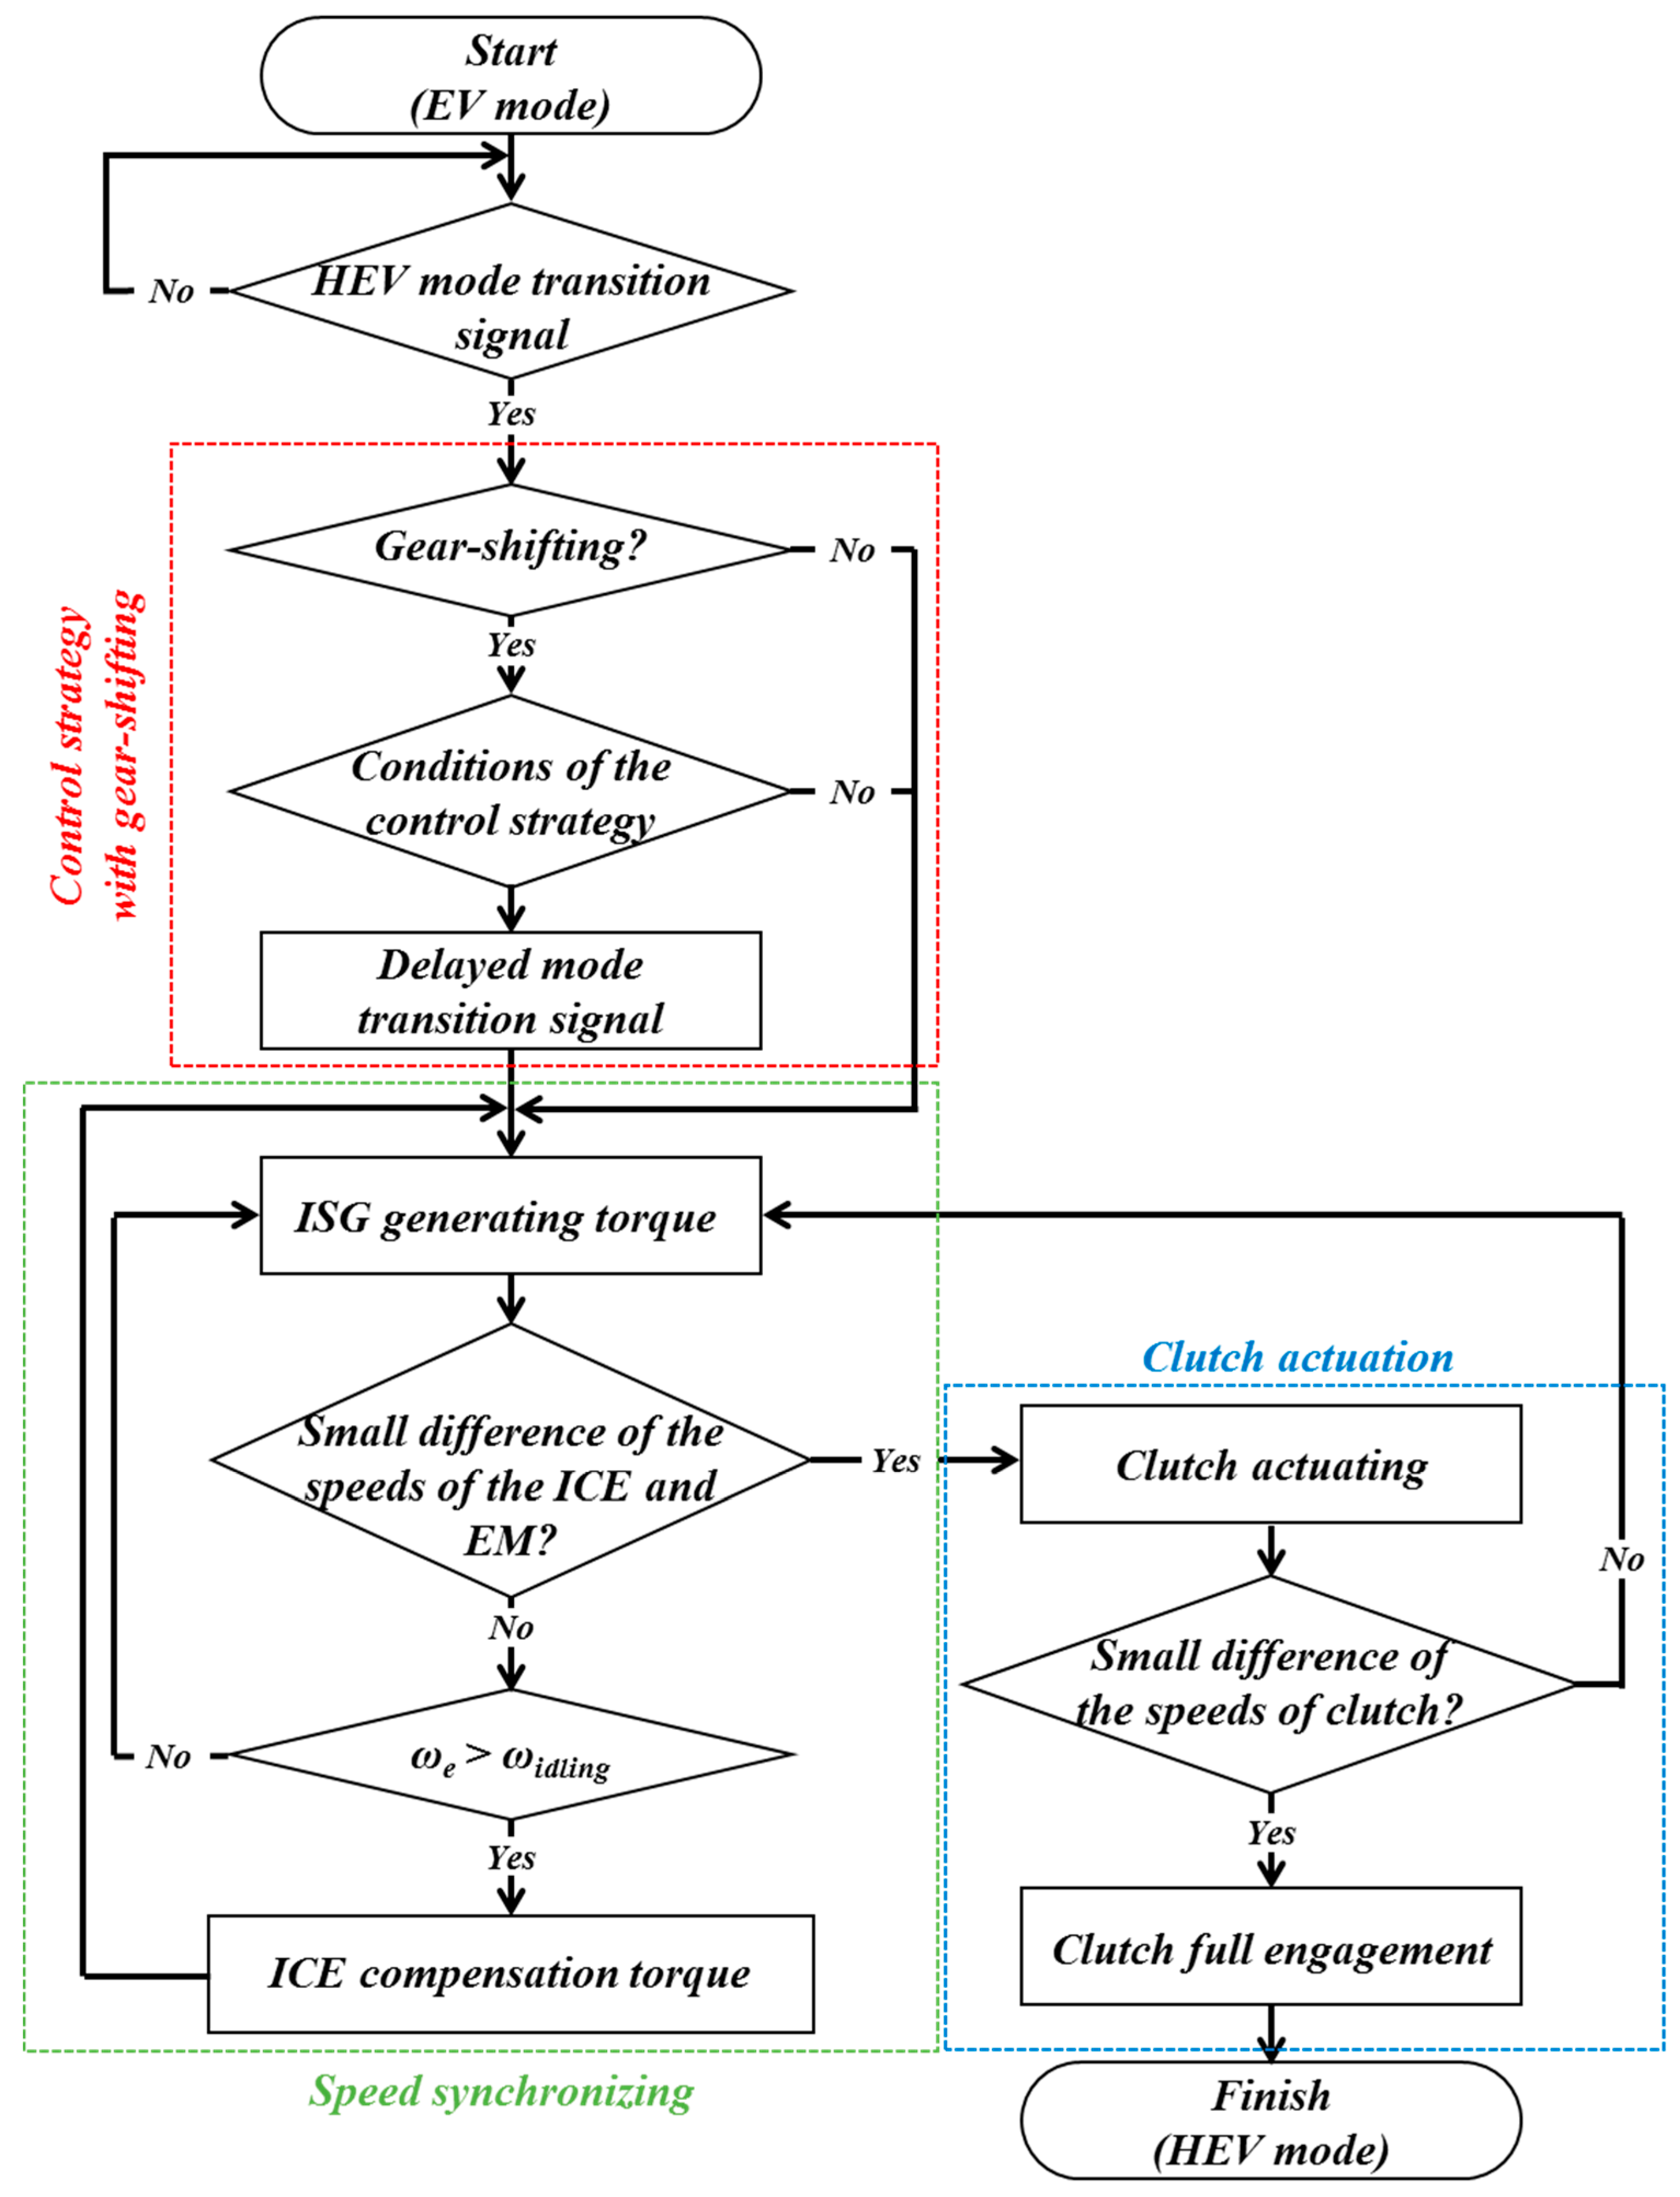
Figure 5.
Simulation results for the HEV mode transition: (a) signals of the mode and clutch; (b) torques of the ISG, ICE, and clutch; (c) speeds of the EM and ICE; (d) vehicle acceleration.
Figure 5.
Simulation results for the HEV mode transition: (a) signals of the mode and clutch; (b) torques of the ISG, ICE, and clutch; (c) speeds of the EM and ICE; (d) vehicle acceleration.

Figure 6.
The simulation results of a typical urban driving cycle, FTP-72: (a) vehicle speed; (b) speeds of the electric motor (EM) and ICE; (c) vehicle acceleration; (d) mode signals; (e) clutch signals; (f) battery states of change (SOC); and (g) gear state.
Figure 6.
The simulation results of a typical urban driving cycle, FTP-72: (a) vehicle speed; (b) speeds of the electric motor (EM) and ICE; (c) vehicle acceleration; (d) mode signals; (e) clutch signals; (f) battery states of change (SOC); and (g) gear state.
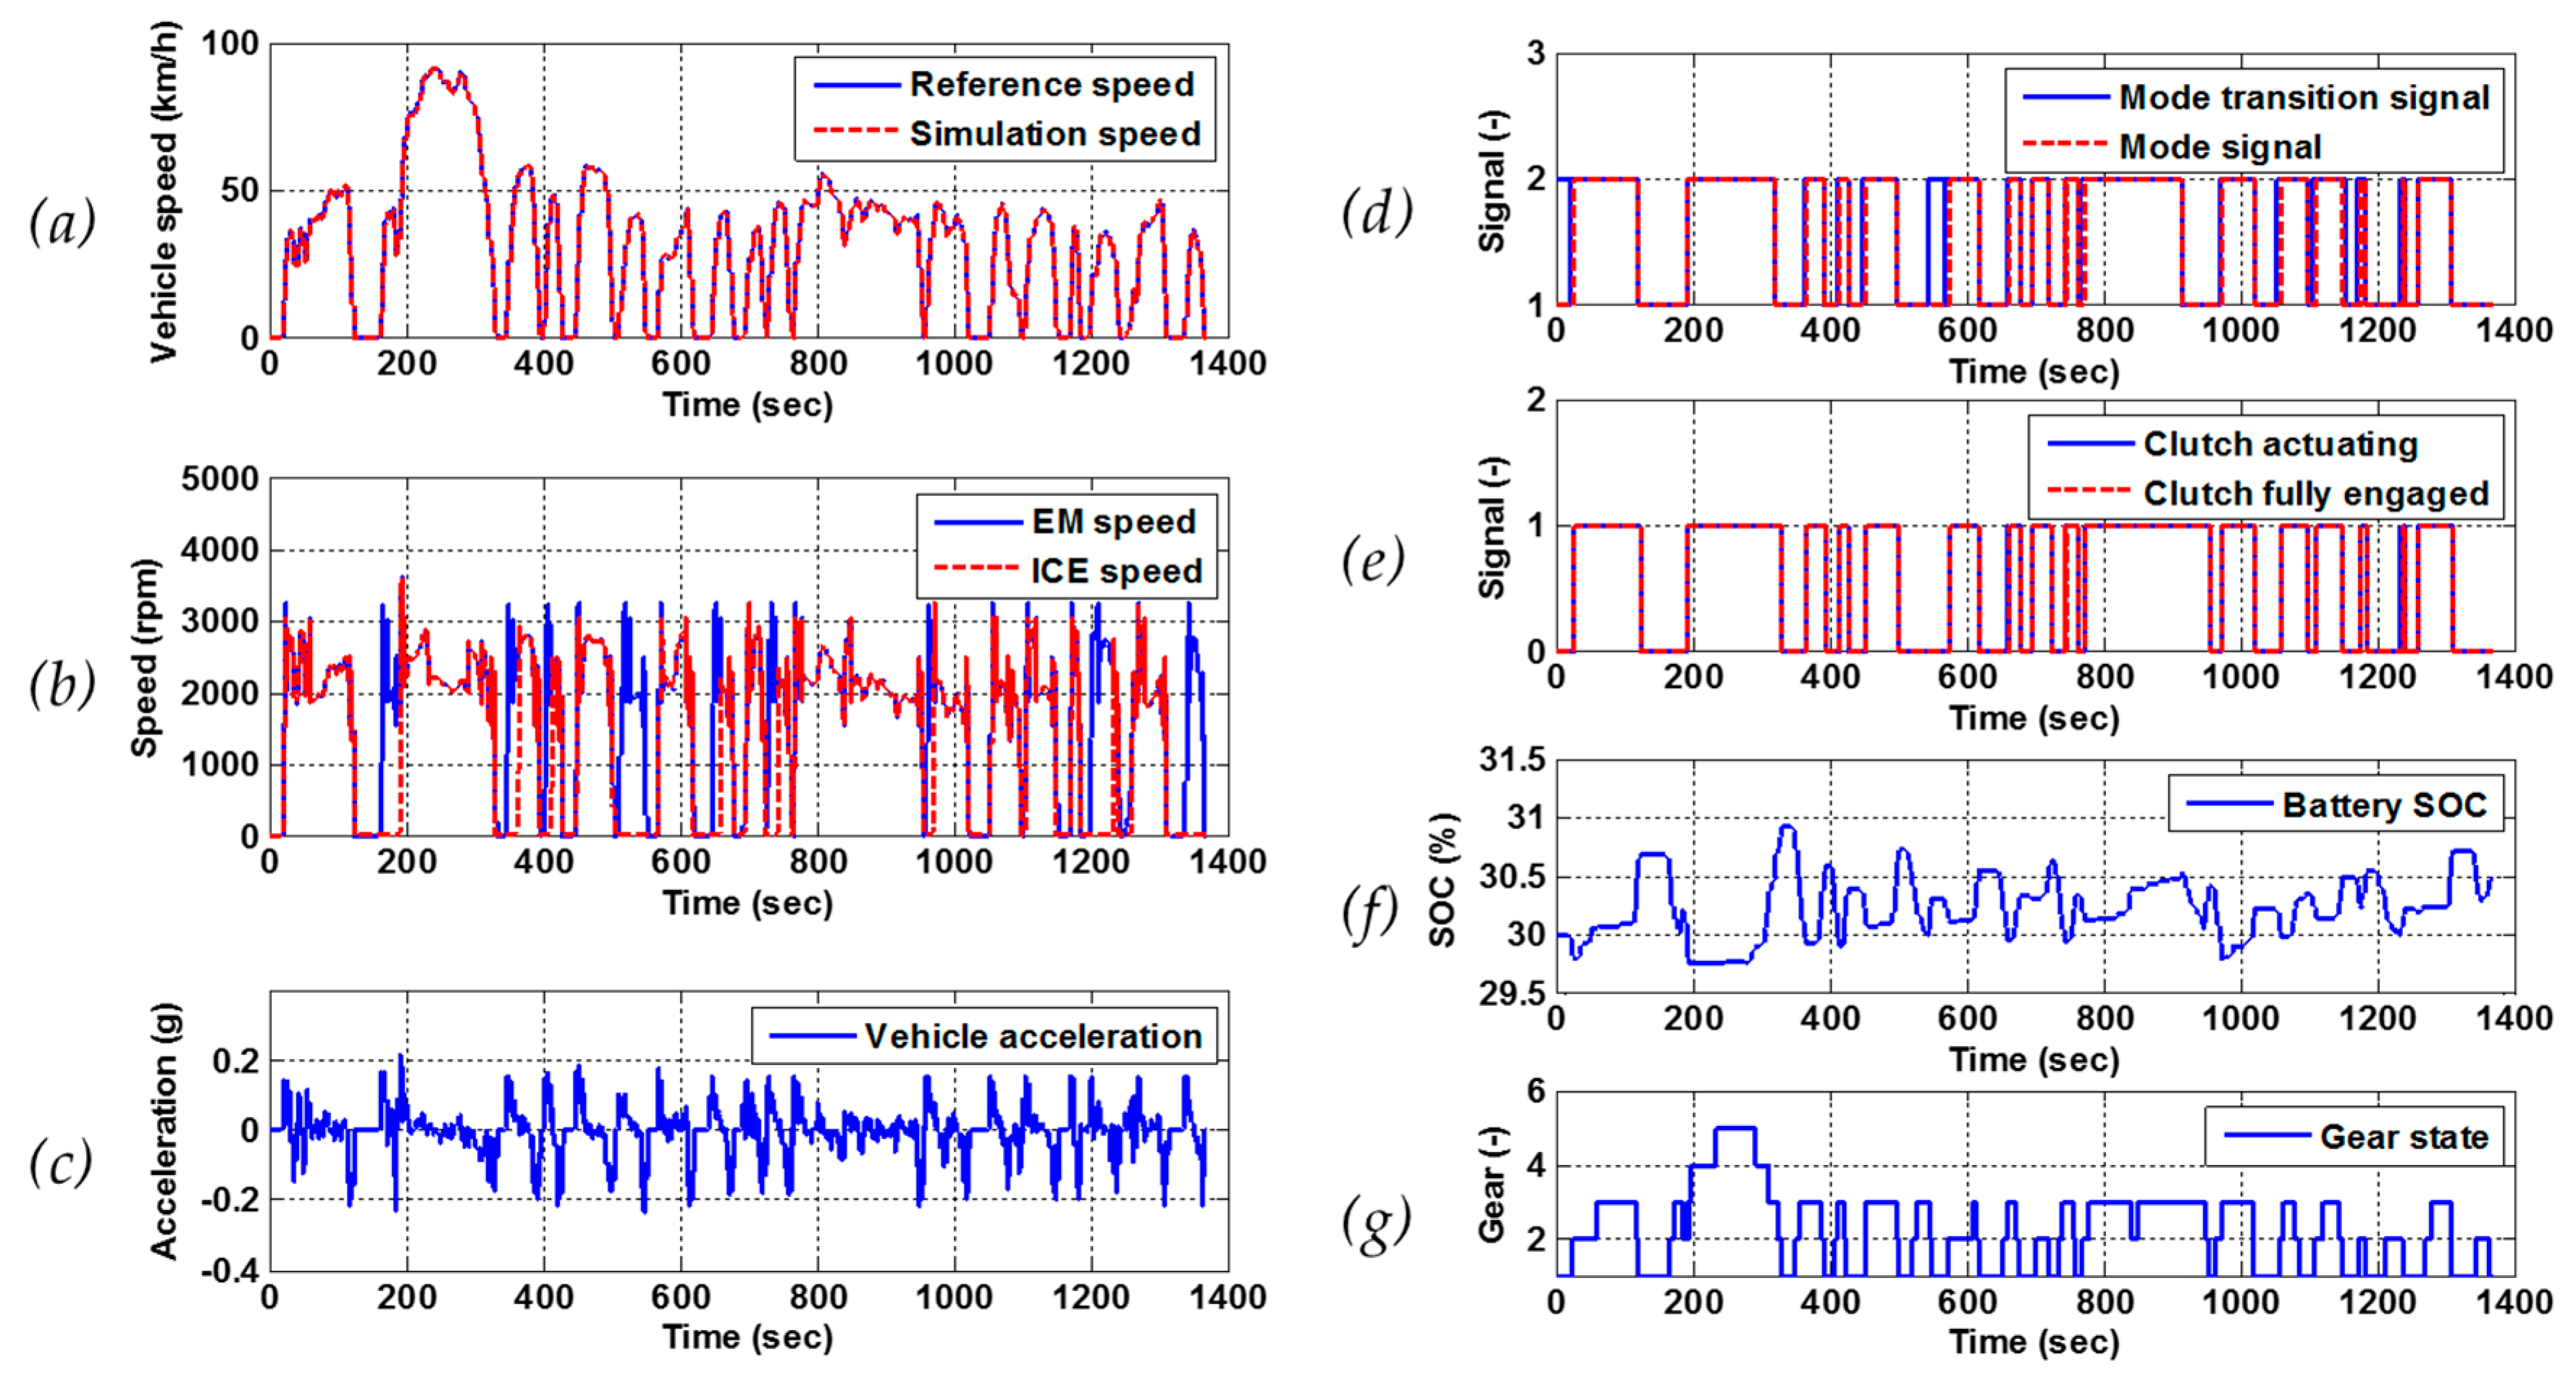
Figure 7.
The problem of mode transition with gear shifting.

Figure 8.
Concept of the control strategy for mode transition.

Figure 9.
The simulation results of the control strategy for mode transition with shifting from 1st to 2nd gear in the FTP-72 driving cycle: (a) duration and; (b) peak-to-peak acceleration.
Figure 9.
The simulation results of the control strategy for mode transition with shifting from 1st to 2nd gear in the FTP-72 driving cycle: (a) duration and; (b) peak-to-peak acceleration.
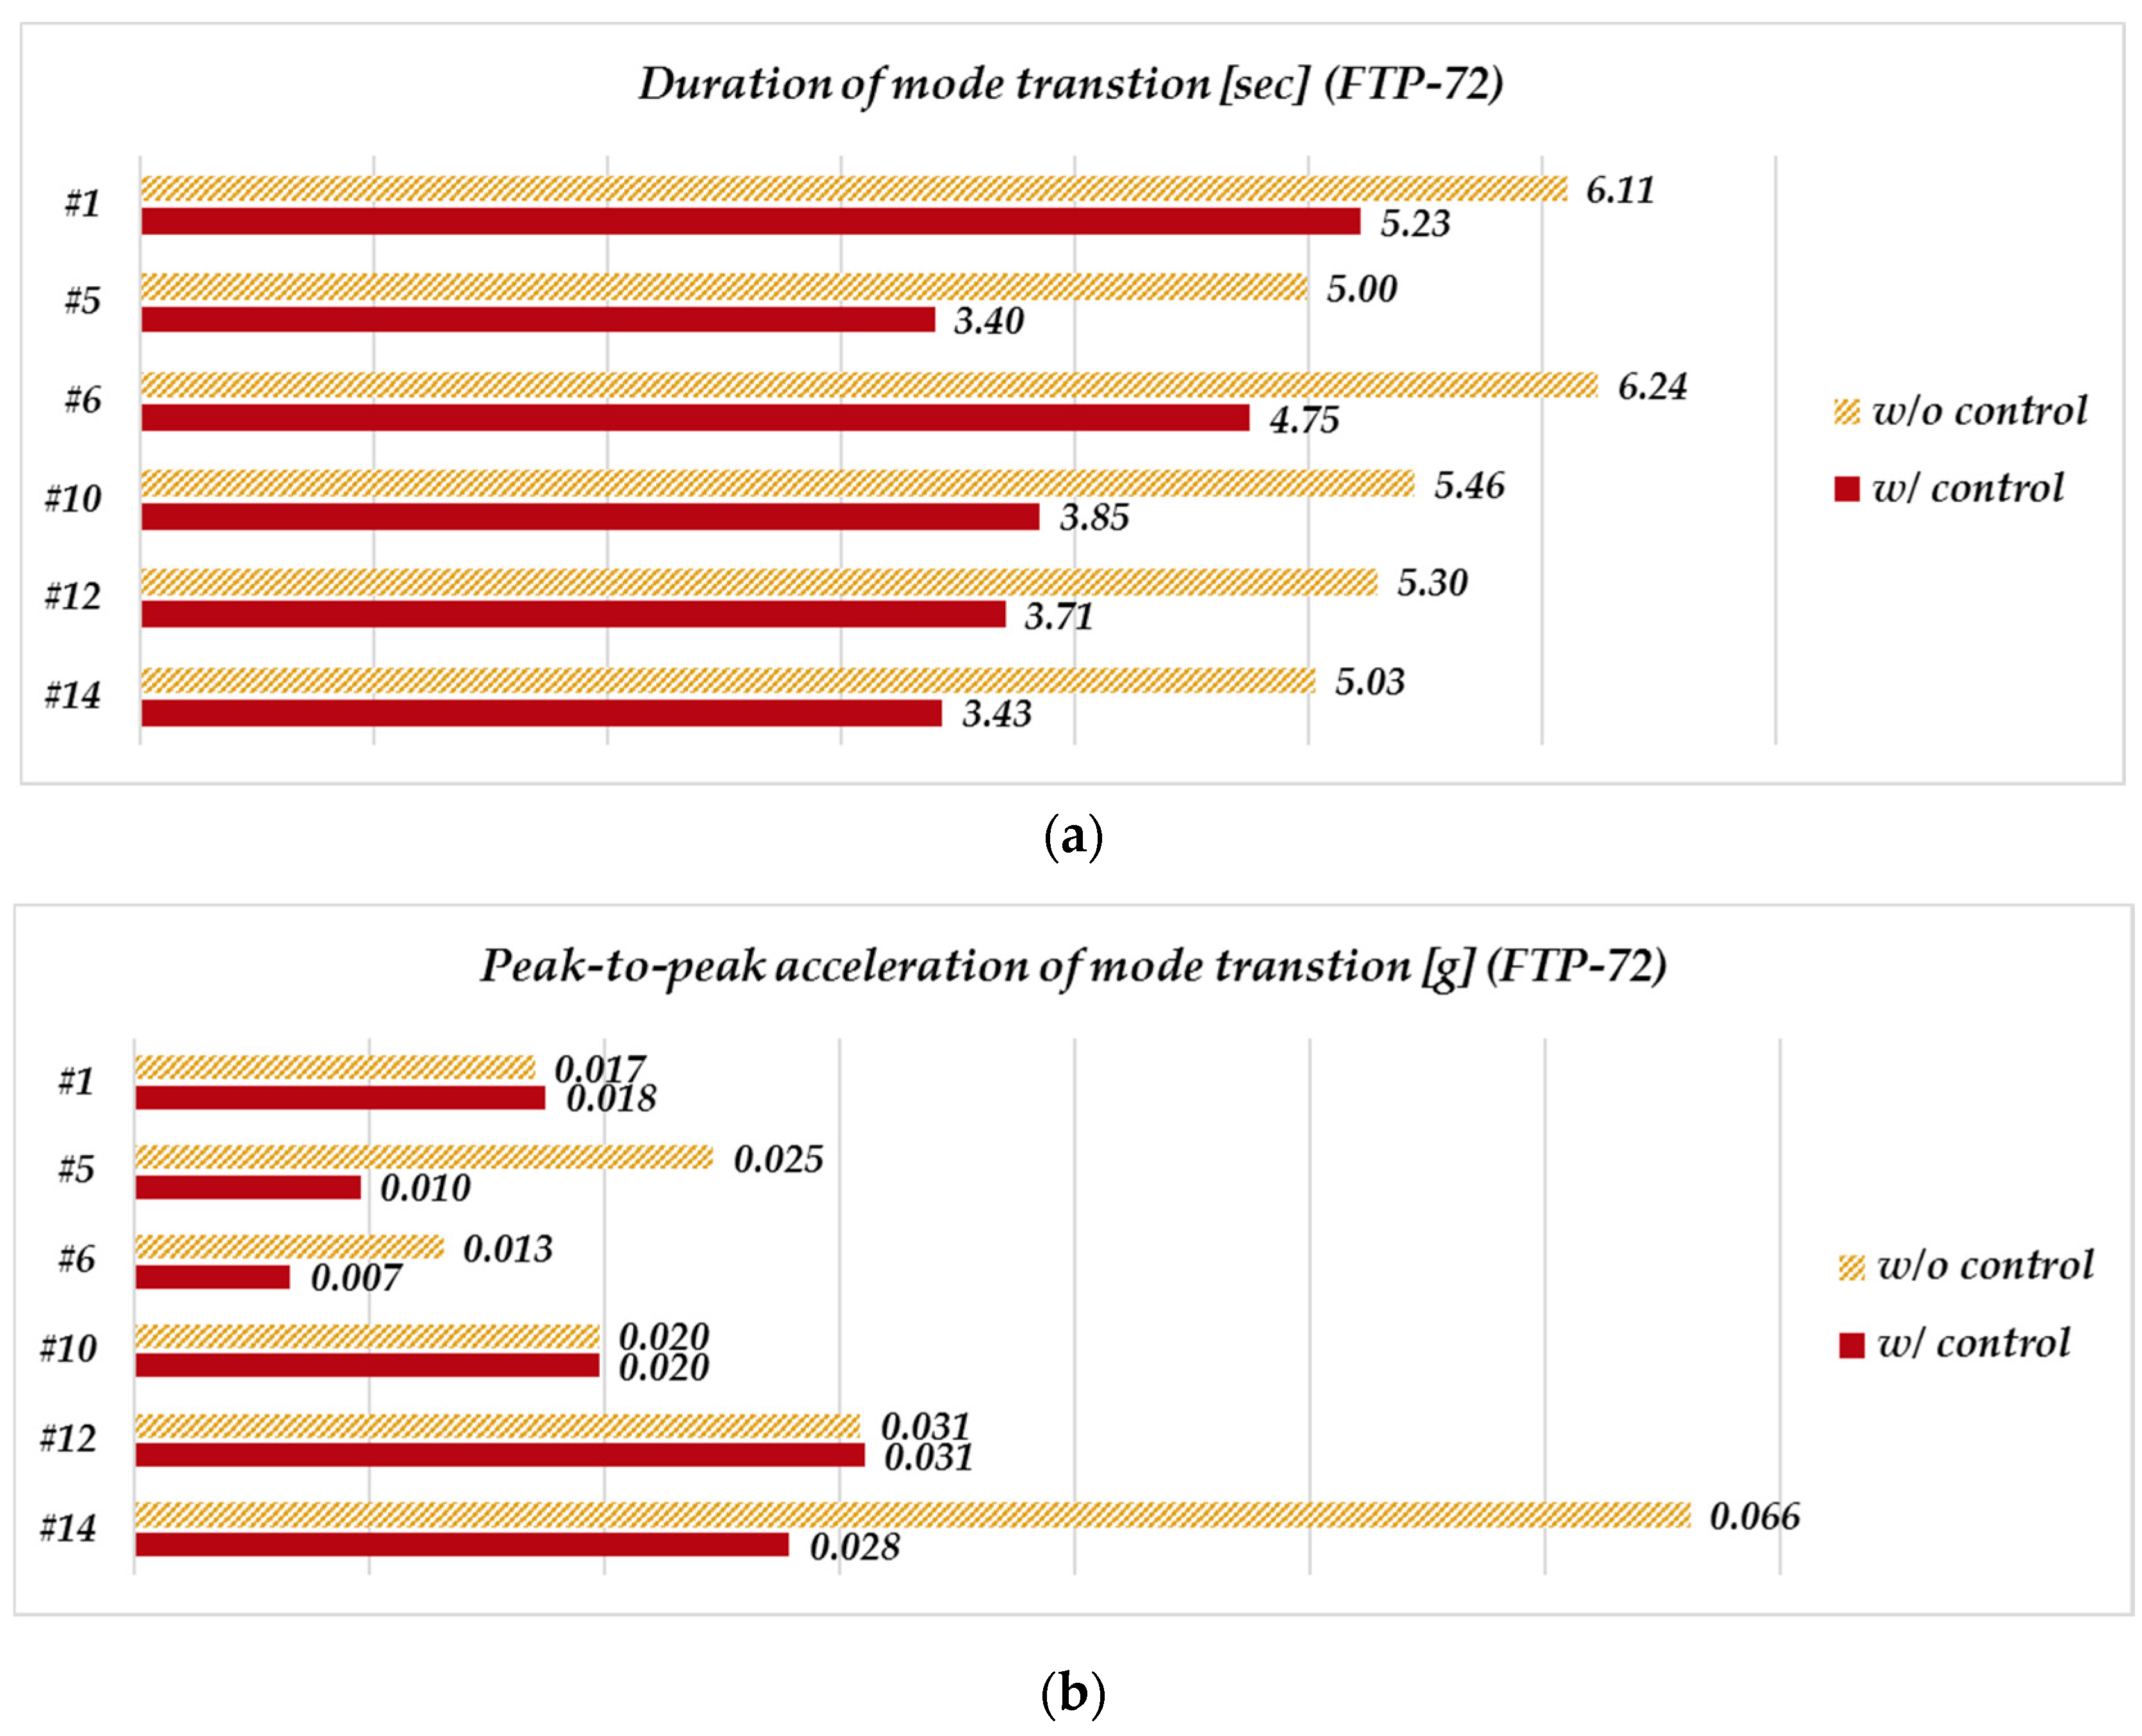
Figure 10.
The simulation number 5 of the EM and ICE speeds (a) without and (b) with the control strategy.
Figure 10.
The simulation number 5 of the EM and ICE speeds (a) without and (b) with the control strategy.
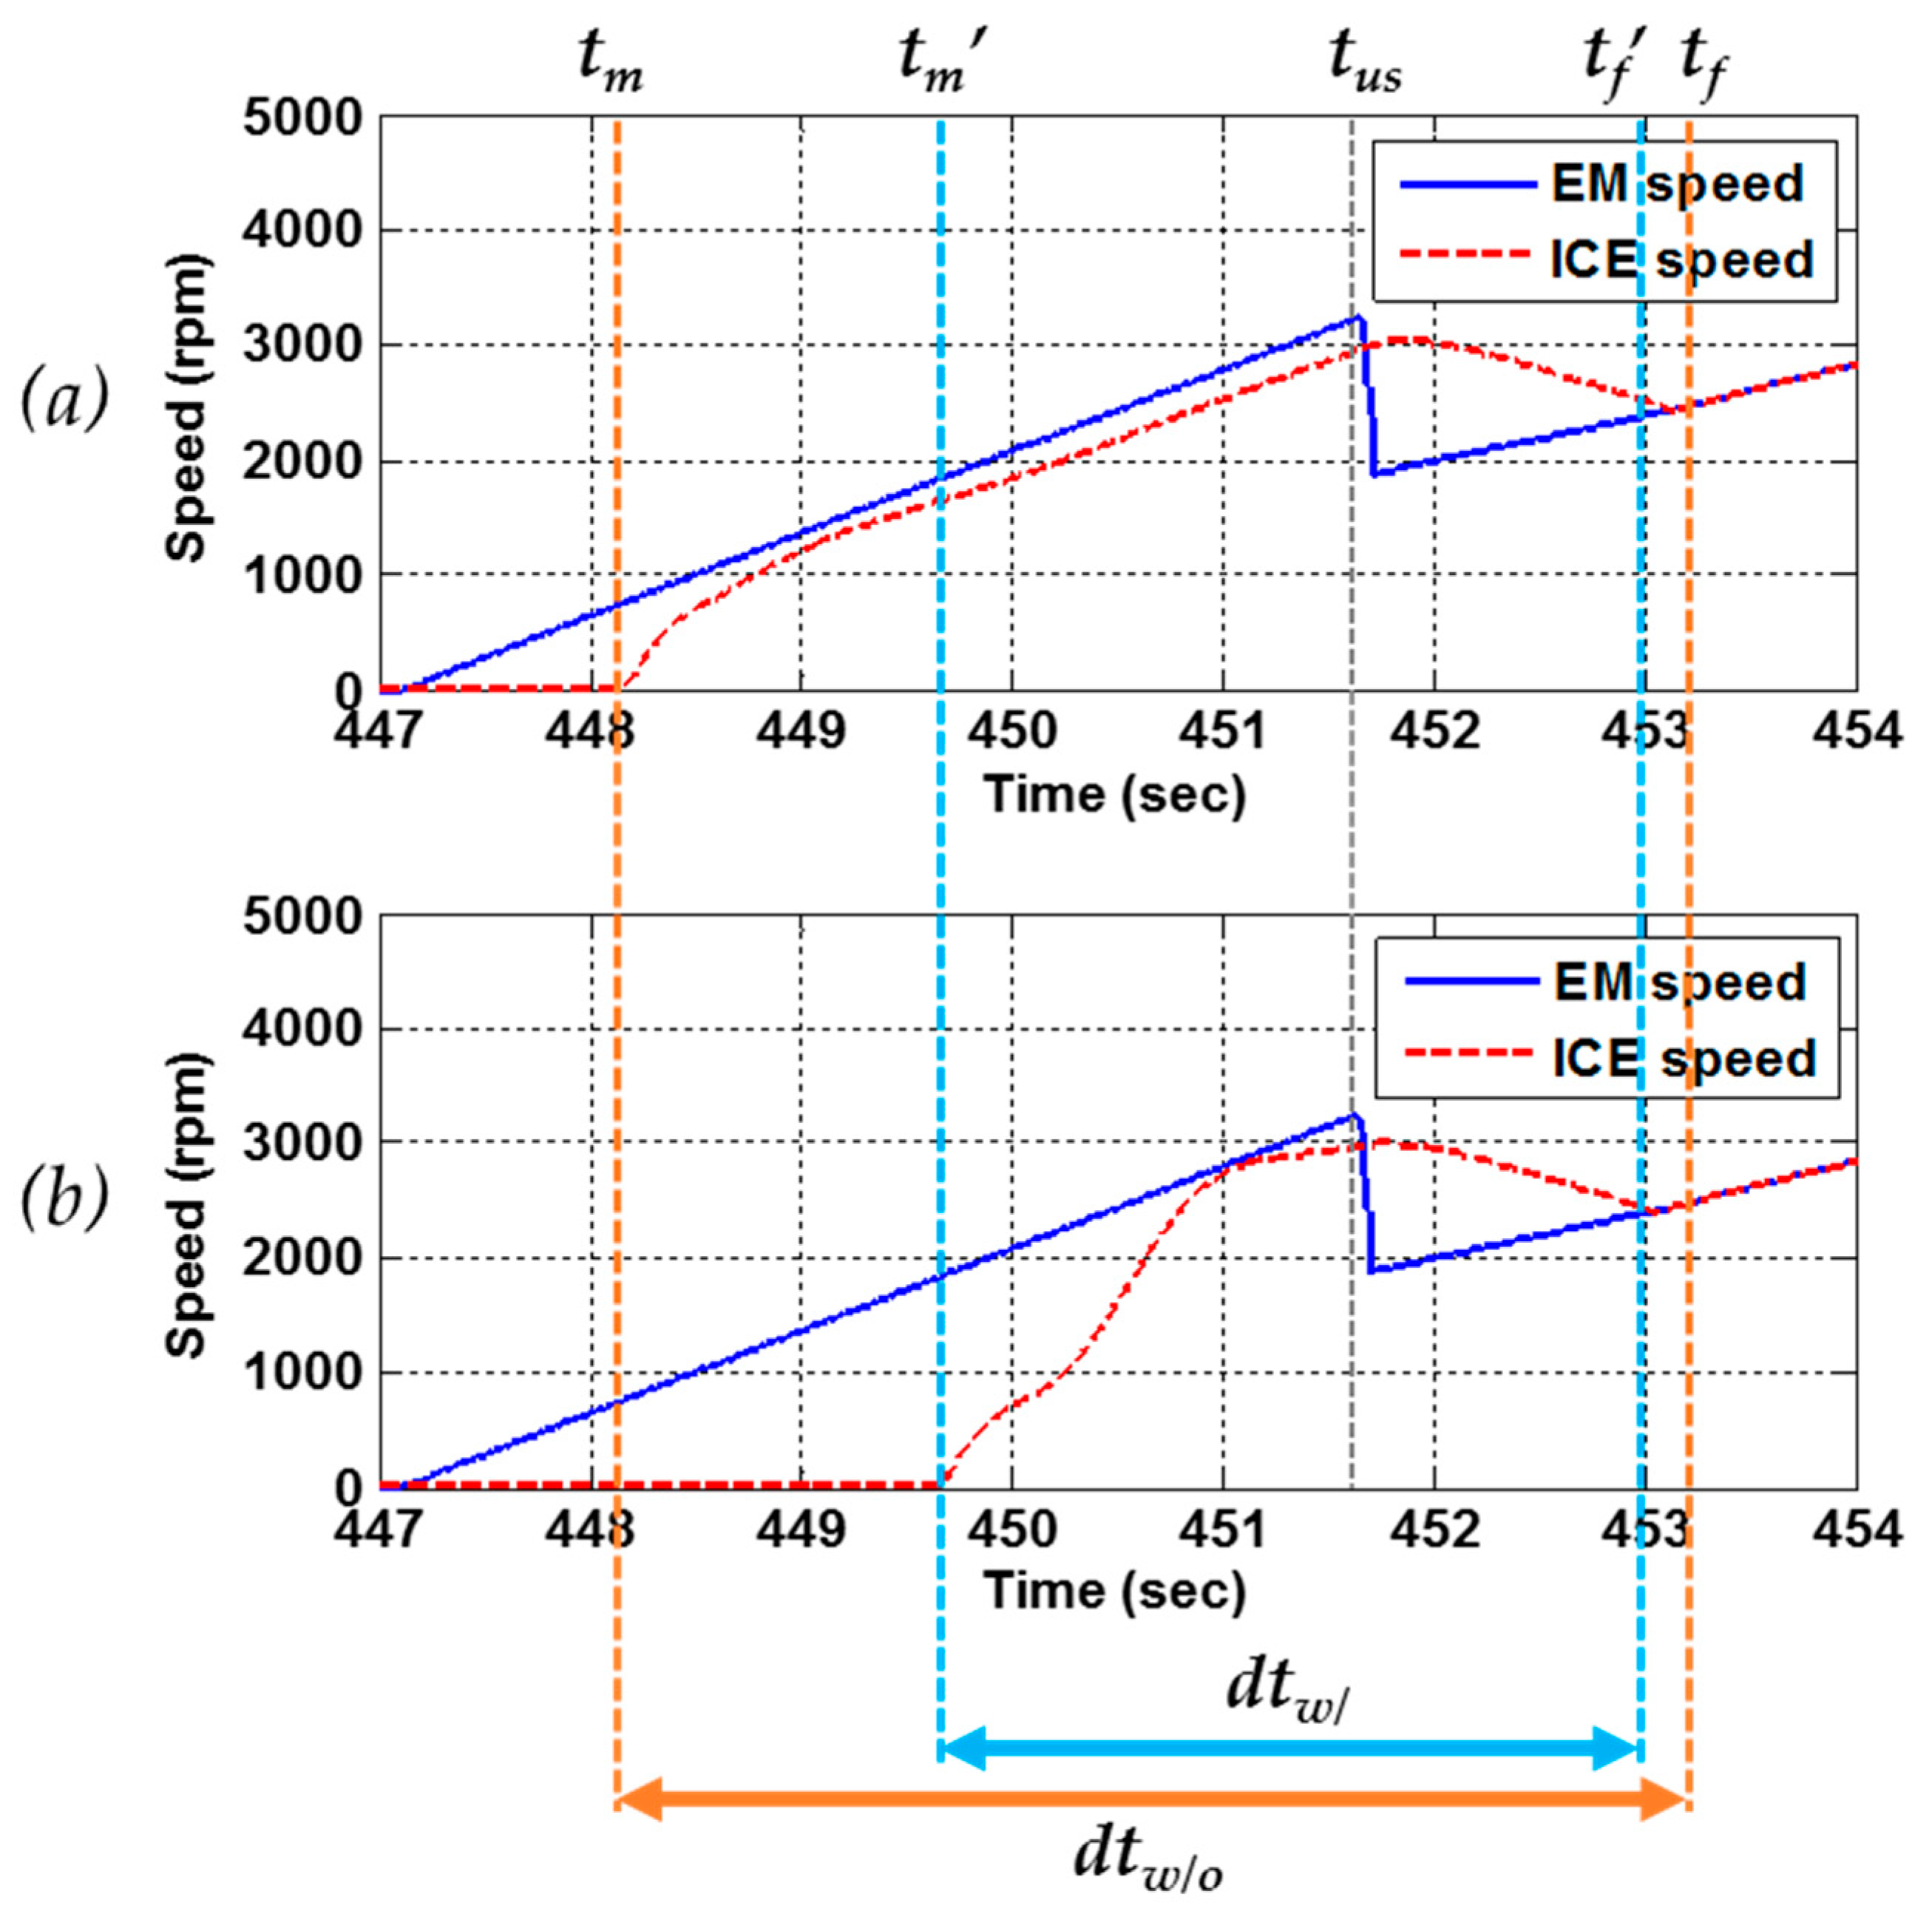
Figure 11.
The simulation results of the brake-specific fuel consumption (BSFC) map and operation points of the ICE; circle marks are without the control strategy and cross marks are with the control strategy.
Figure 11.
The simulation results of the brake-specific fuel consumption (BSFC) map and operation points of the ICE; circle marks are without the control strategy and cross marks are with the control strategy.

Figure 12.
The driving cycles: (a) Worldwide Harmonized Light Vehicles Test Procedure (WLTP) and (b) NYC HEV Taxi cycle.
Figure 12.
The driving cycles: (a) Worldwide Harmonized Light Vehicles Test Procedure (WLTP) and (b) NYC HEV Taxi cycle.


Table 1.
The simulation results of mode transition acceleration in the FTP-72 driving cycle.
| Number | Min. Acceleration (g) | Max. Acceleration (g) | Gear-Shift | Remarks |
|---|---|---|---|---|
| 1 | 0.120 | 0.135 | 1st-2nd | Shifting |
| 2 | 0.115 | 0.140 | 2nd-3rd | Shifting |
| 3 | 0 | 0.050 | - | - |
| 4 | 0 | 0.07 | - | - |
| 5 | 0.145 | 0.165 | 1st-2nd | Shifting |
| 6 | 0.070 | 0.180 | 1st-2nd | Shifting |
| 7 | 0 | 0.020 | - | - |
| 8 | 0.450 | 0.550 | - | Acceleration |
| 9 | 0 | 0.090 | - | - |
| 10 | 0.125 | 0.155 | 1st-2nd | Shifting |
| 11 | 0.040 | 0.160 | 2nd-3rd | Shifting |
| 12 | 0.125 | 0.155 | 1st-2nd | Shifting |
| 13 | 0.160 | 0.300 | 1st-2nd | Shifting |
| 14 | 0.145 | 0.155 | 1st-2nd | Shifting |
| 15 | −0.100 | 0.020 | - | Deceleration |
| 16 | 0.040 | 0.060 | - | Acceleration |
Table 2.
Parameters for the target PHEV model.
| Component | Type/Parameter | Value | Unit |
|---|---|---|---|
| Internal combustion engine (ICE) | Diesel | 3 | cylinder |
| Displacement | 0.98 | L | |
| Speed range | 1000–4000 | rpm | |
| Electric motor (EM) | Maximum power | 30 | kW |
| Speed range | 0–6000 | rpm | |
| Integrated starter and generator (ISG) | Maximum torque | 28 | Nm |
| Speed range | 0–5500 | rpm | |
| Clutch | Dry | - | - |
| Outer diameter | 0.215 | mm | |
| Inner diameter | 0.150 | mm | |
| Friction coefficient | 0.3 | - | |
| Transmission | Dual clutch transmission | 6 | speed |
| Battery | Li-ion | - | - |
| Capacity | 26.2 | Ah | |
| Vehicle | Mass | 1321 | kg |
| Front area | 2 | m2 | |
| Drag coefficient | 0.33 | - | |
| Rolling resistance coefficient | 0.014 | - |
Table 3.
The simulation results of energy consumption in the FTP-72 driving cycle.
| Condition | Initial SOC (%) | Final SOC (%) | ISG Electrical Energy (kJ) | Equivalent Fuel Efficiency (km/L) 1 |
|---|---|---|---|---|
| w/o control | 30 | 30.47 | 37.63 | 24.69 |
| w/control | 30 | 30.47 | 25.82 | 24.80 |
| Improvement | 31.4% | 0.452% | ||
1 The equivalent fuel efficiency is evaluated using an equivalent factor. This factor converts electrical energy usage to an equivalent volume of fossil fuel. The equivalent fuel efficiency includes electrical energy and fuel consumption.
Table 4.
The simulation results of equivalent fuel efficiency in the WLTP and NYC HEV Taxi driving cycles.
Table 4.
The simulation results of equivalent fuel efficiency in the WLTP and NYC HEV Taxi driving cycles.
| Driving Cycle | Number of Mode Transitions (with Shifting) | Equivalent Fuel Efficiency 1 | Improvement | |
|---|---|---|---|---|
| w/o Control | w/Control | |||
| WLTP | 13 (3) | 25.17 km/L | 25.19 km/L | 0.078% |
| NYC HEV Taxi | 83 (12) | 24.27 km/L | 24.34 km/L | 0.307% |
1 The equivalent fuel efficiency is evaluated using an equivalent factor. This factor converts electrical energy usage to an equivalent volume of fossil fuel. The equivalent fuel efficiency includes electrical energy and fuel consumption.
Table 5.
The simulation results of drivability in the WLTP and NYC HEV Taxi driving cycles.
| Driving Cycle (Number of Mode Transitions with Shifting) | Duration 1 | Improvement | Peak-to-Peak Acceleration 2 | Improvement | ||
|---|---|---|---|---|---|---|
| w/o Control | w/Control | w/o Control | w/Control | |||
| WLTP (3) | 7.4 s | 5.6 s | 31% | 0.142 g | 0.018 g | 87% |
| NYC HEV Taxi (12) | 3.7 s | 2.9 s | 11% | 0.013 g | 0.006 g | 52% |
1,2 The values are average results.
© 2017 by the authors. Licensee MDPI, Basel, Switzerland. This article is an open access article distributed under the terms and conditions of the Creative Commons Attribution (CC BY) license (http://creativecommons.org/licenses/by/4.0/).
Share and Cite
MDPI and ACS Style
Sim, K.; Oh, S.-M.; Kang, K.-Y.; Hwang, S.-H. A Control Strategy for Mode Transition with Gear Shifting in a Plug-In Hybrid Electric Vehicle. Energies 2017, 10, 1043. https://doi.org/10.3390/en10071043
AMA Style
Sim K, Oh S-M, Kang K-Y, Hwang S-H. A Control Strategy for Mode Transition with Gear Shifting in a Plug-In Hybrid Electric Vehicle. Energies. 2017; 10(7):1043. https://doi.org/10.3390/en10071043
Chicago/Turabian StyleSim, Kyuhyun, Sang-Min Oh, Ku-Young Kang, and Sung-Ho Hwang. 2017. "A Control Strategy for Mode Transition with Gear Shifting in a Plug-In Hybrid Electric Vehicle" Energies 10, no. 7: 1043. https://doi.org/10.3390/en10071043
Note that from the first issue of 2016, this journal uses article numbers instead of page numbers. See further details here.