
Location Study of Solar Thermal Power Plant in the State of Pernambuco Using Geoprocessing Technologies and Multiple-Criteria Analysis


Abstract
:1. Introduction
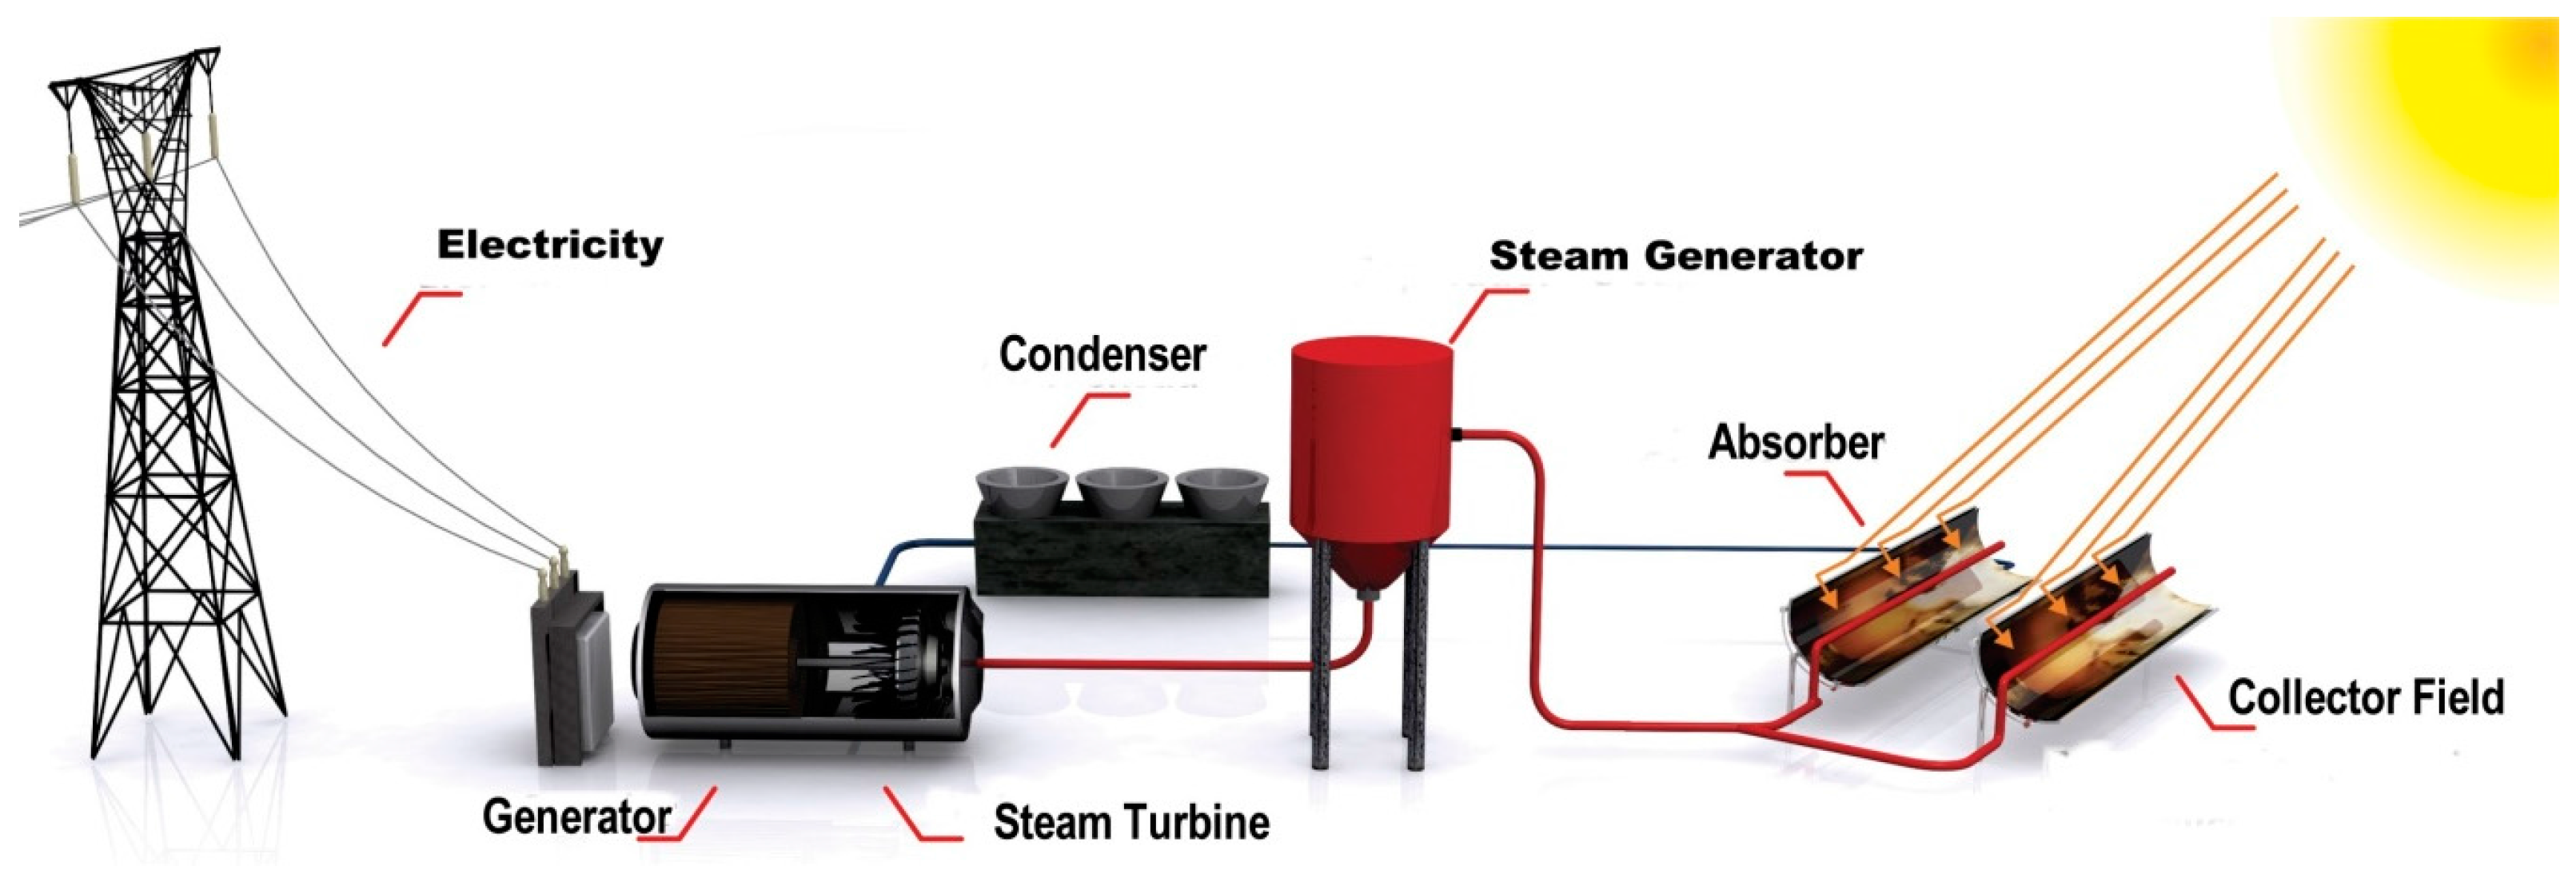
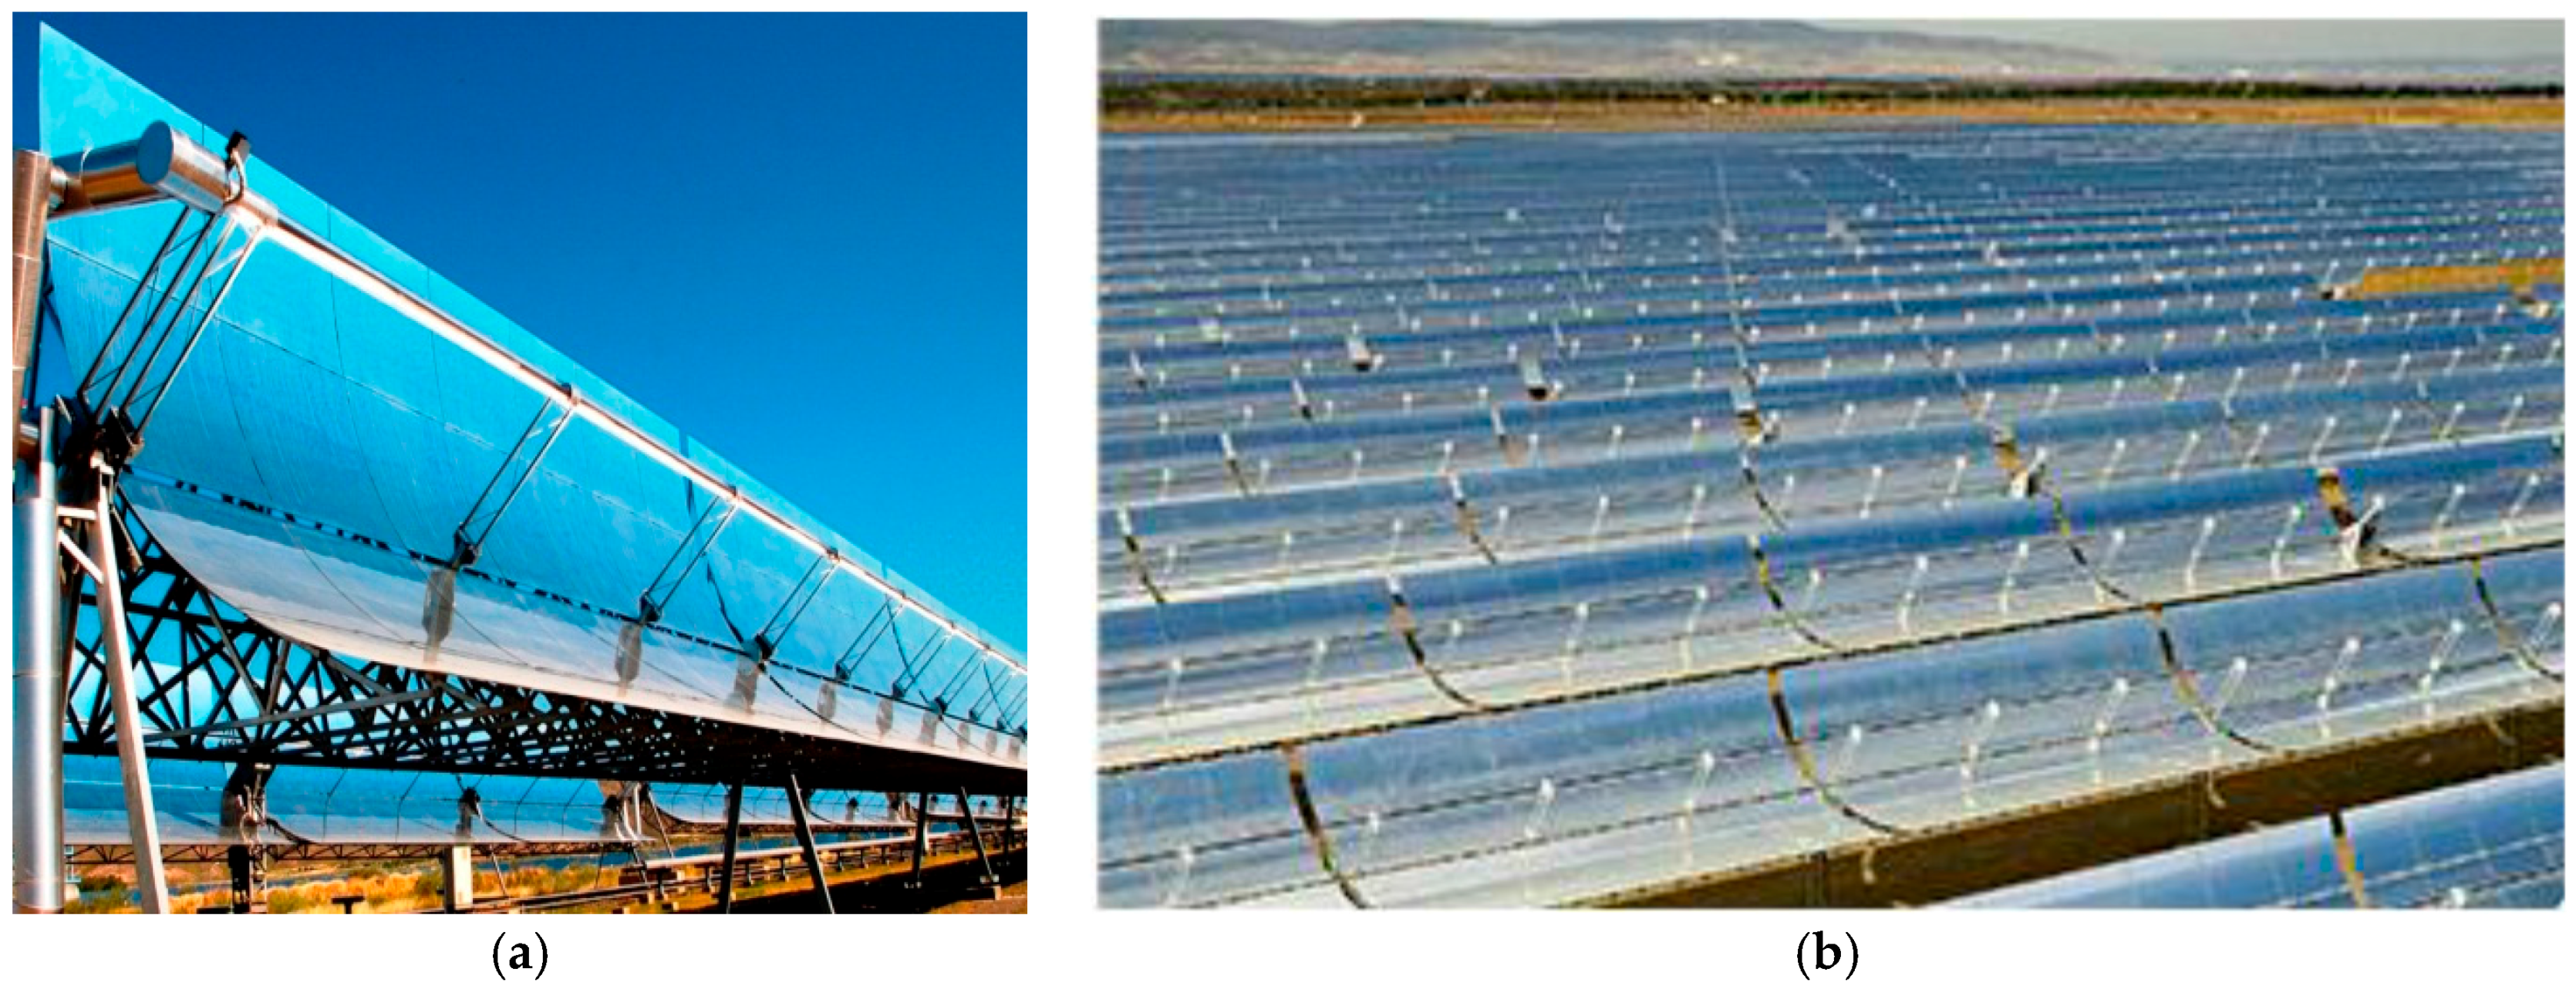
1.1. Solar Technology
1.2. Optimal Location of Thermal or Phovoltaic Solar Power Stations
2. Geoprocessing Technologies in the Support of Location Studies for Solar Thermal Power Plants
2.1. Geographic Information Systems (GIS)
2.2. Map Algebra
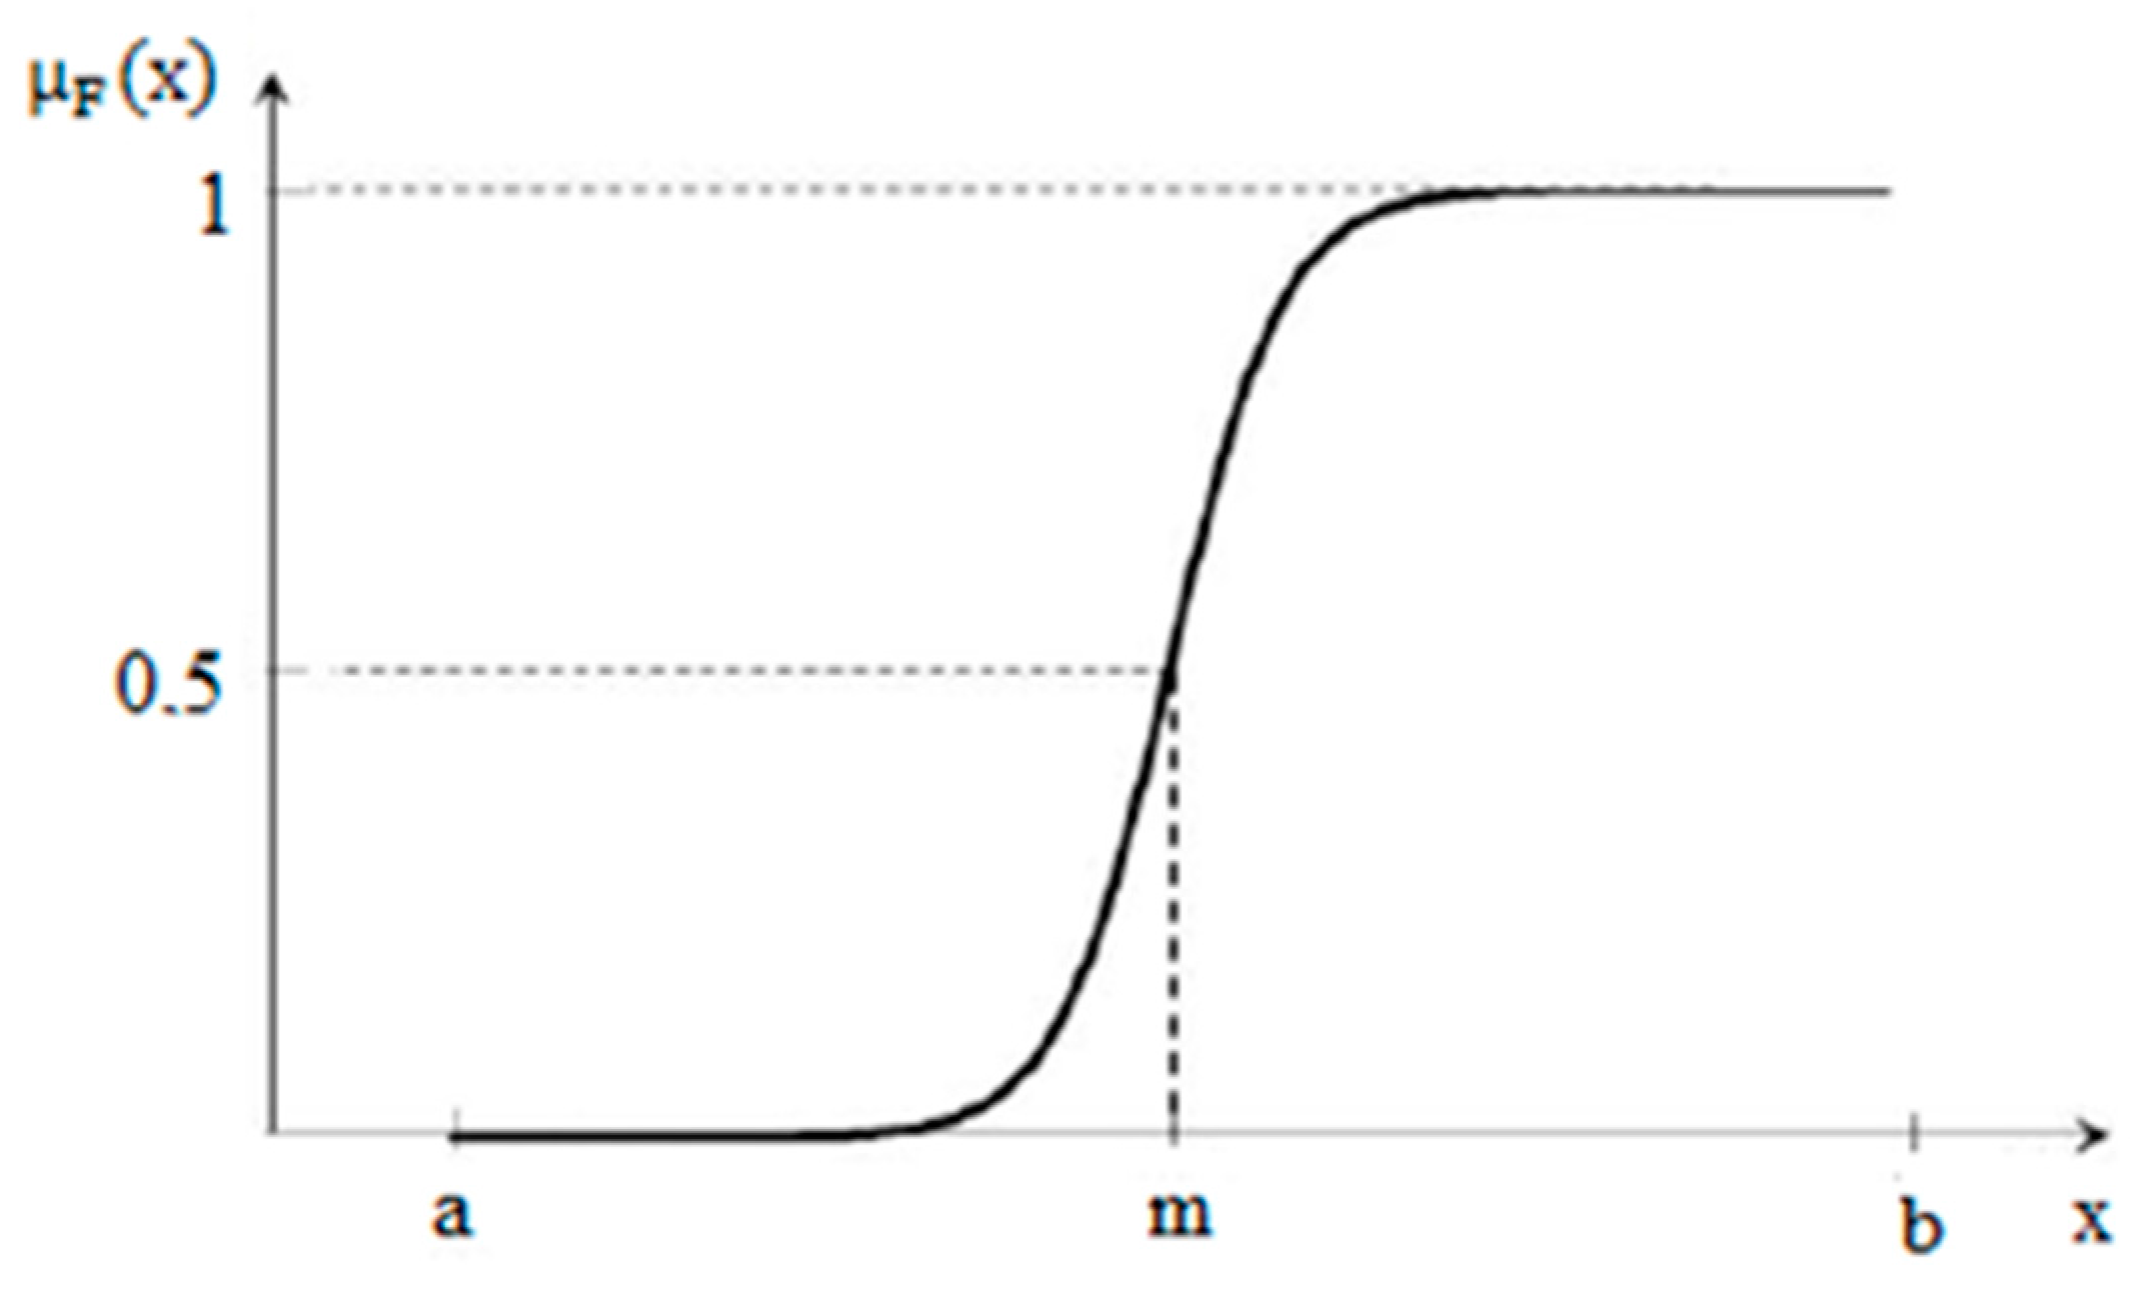
2.3. Fuzzy Logic
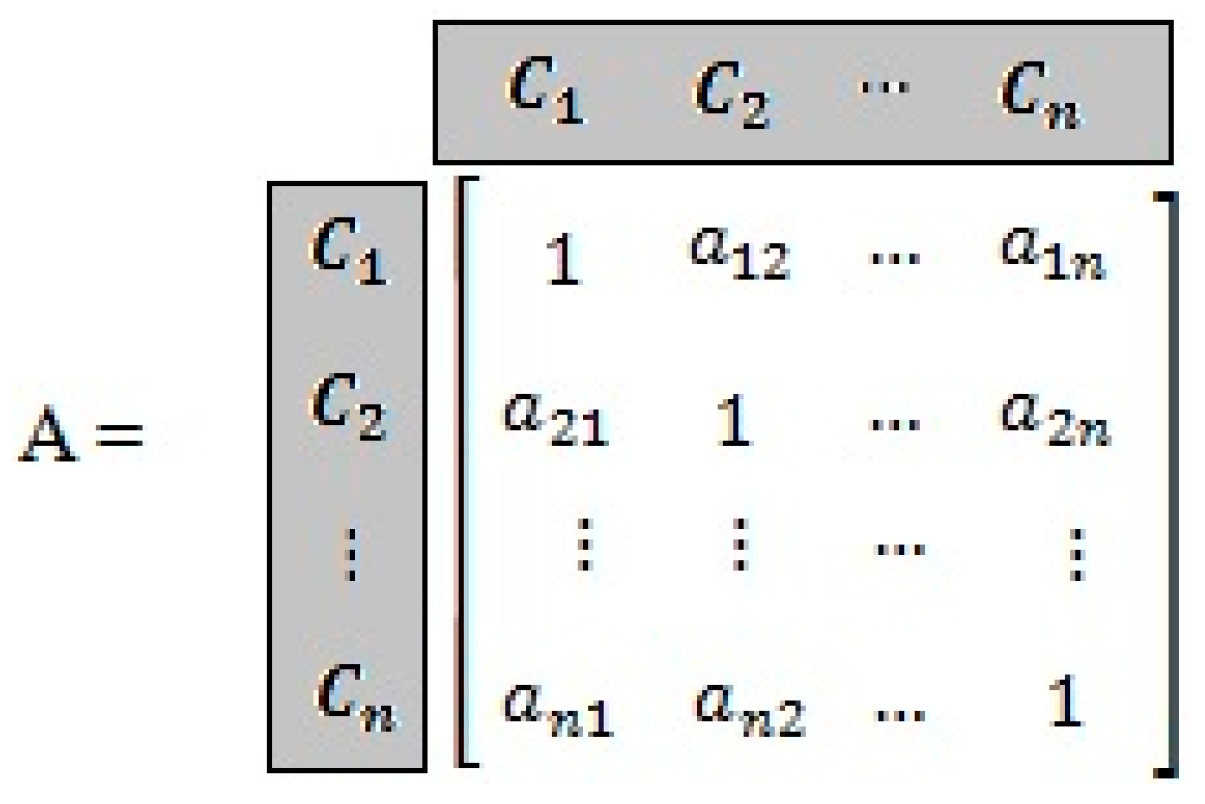
3. Multiple Criteria Decision Analysis—The AHP Method
4. Materials and Methods
4.1. Material Used
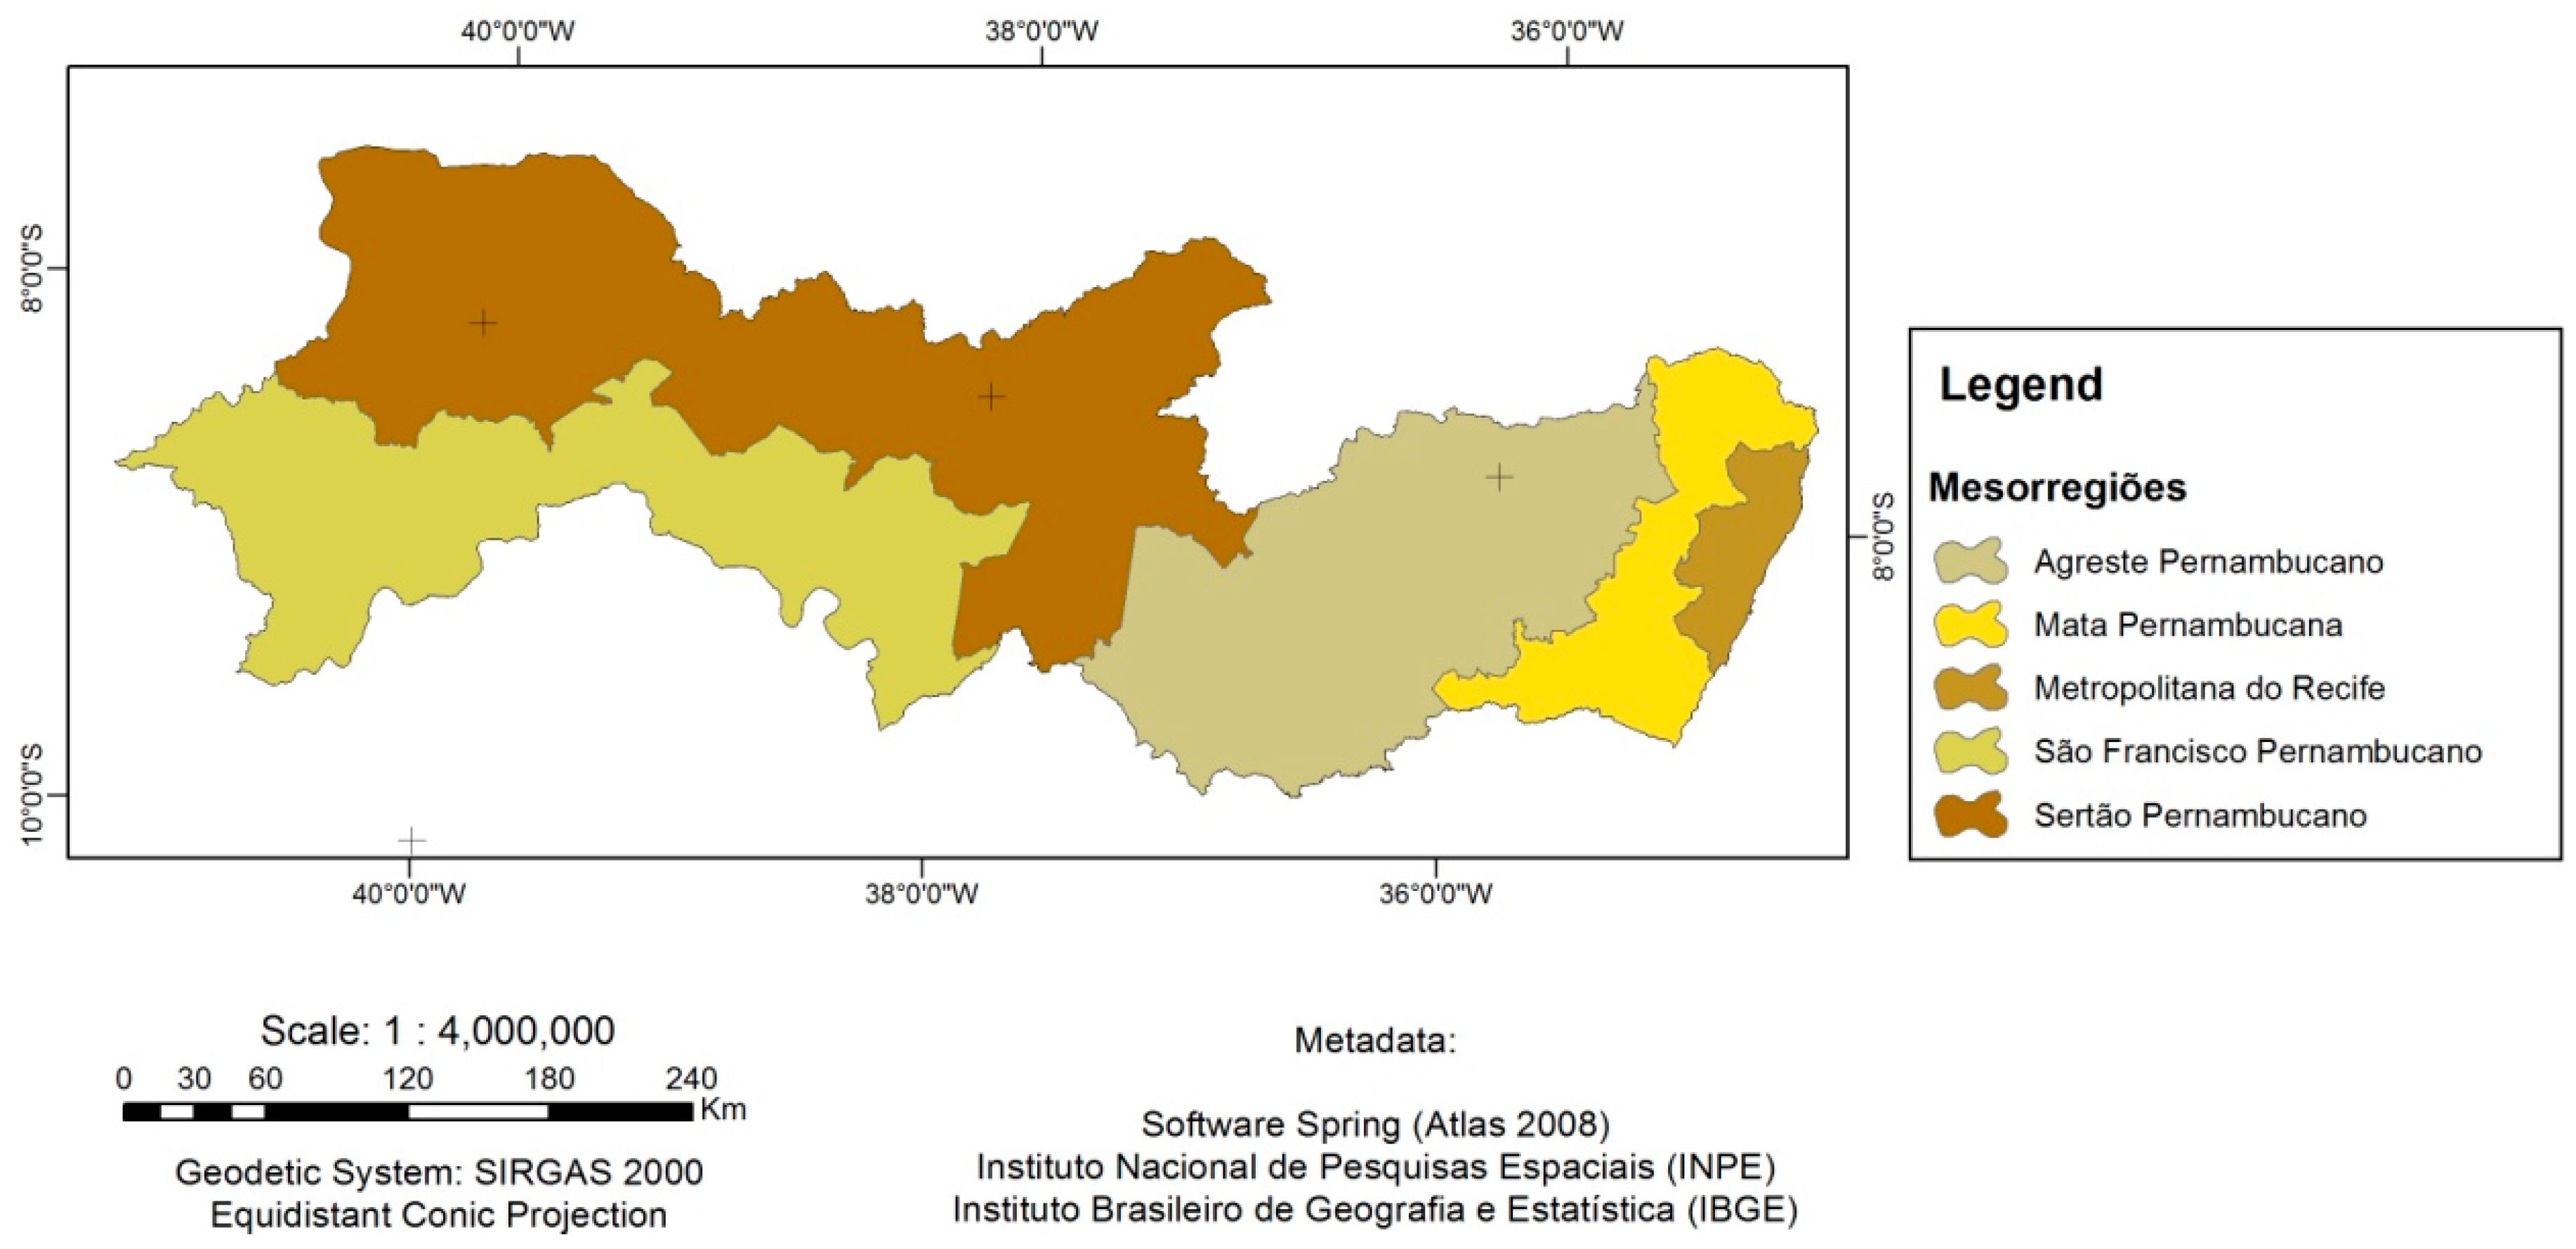
4.2. Study Area
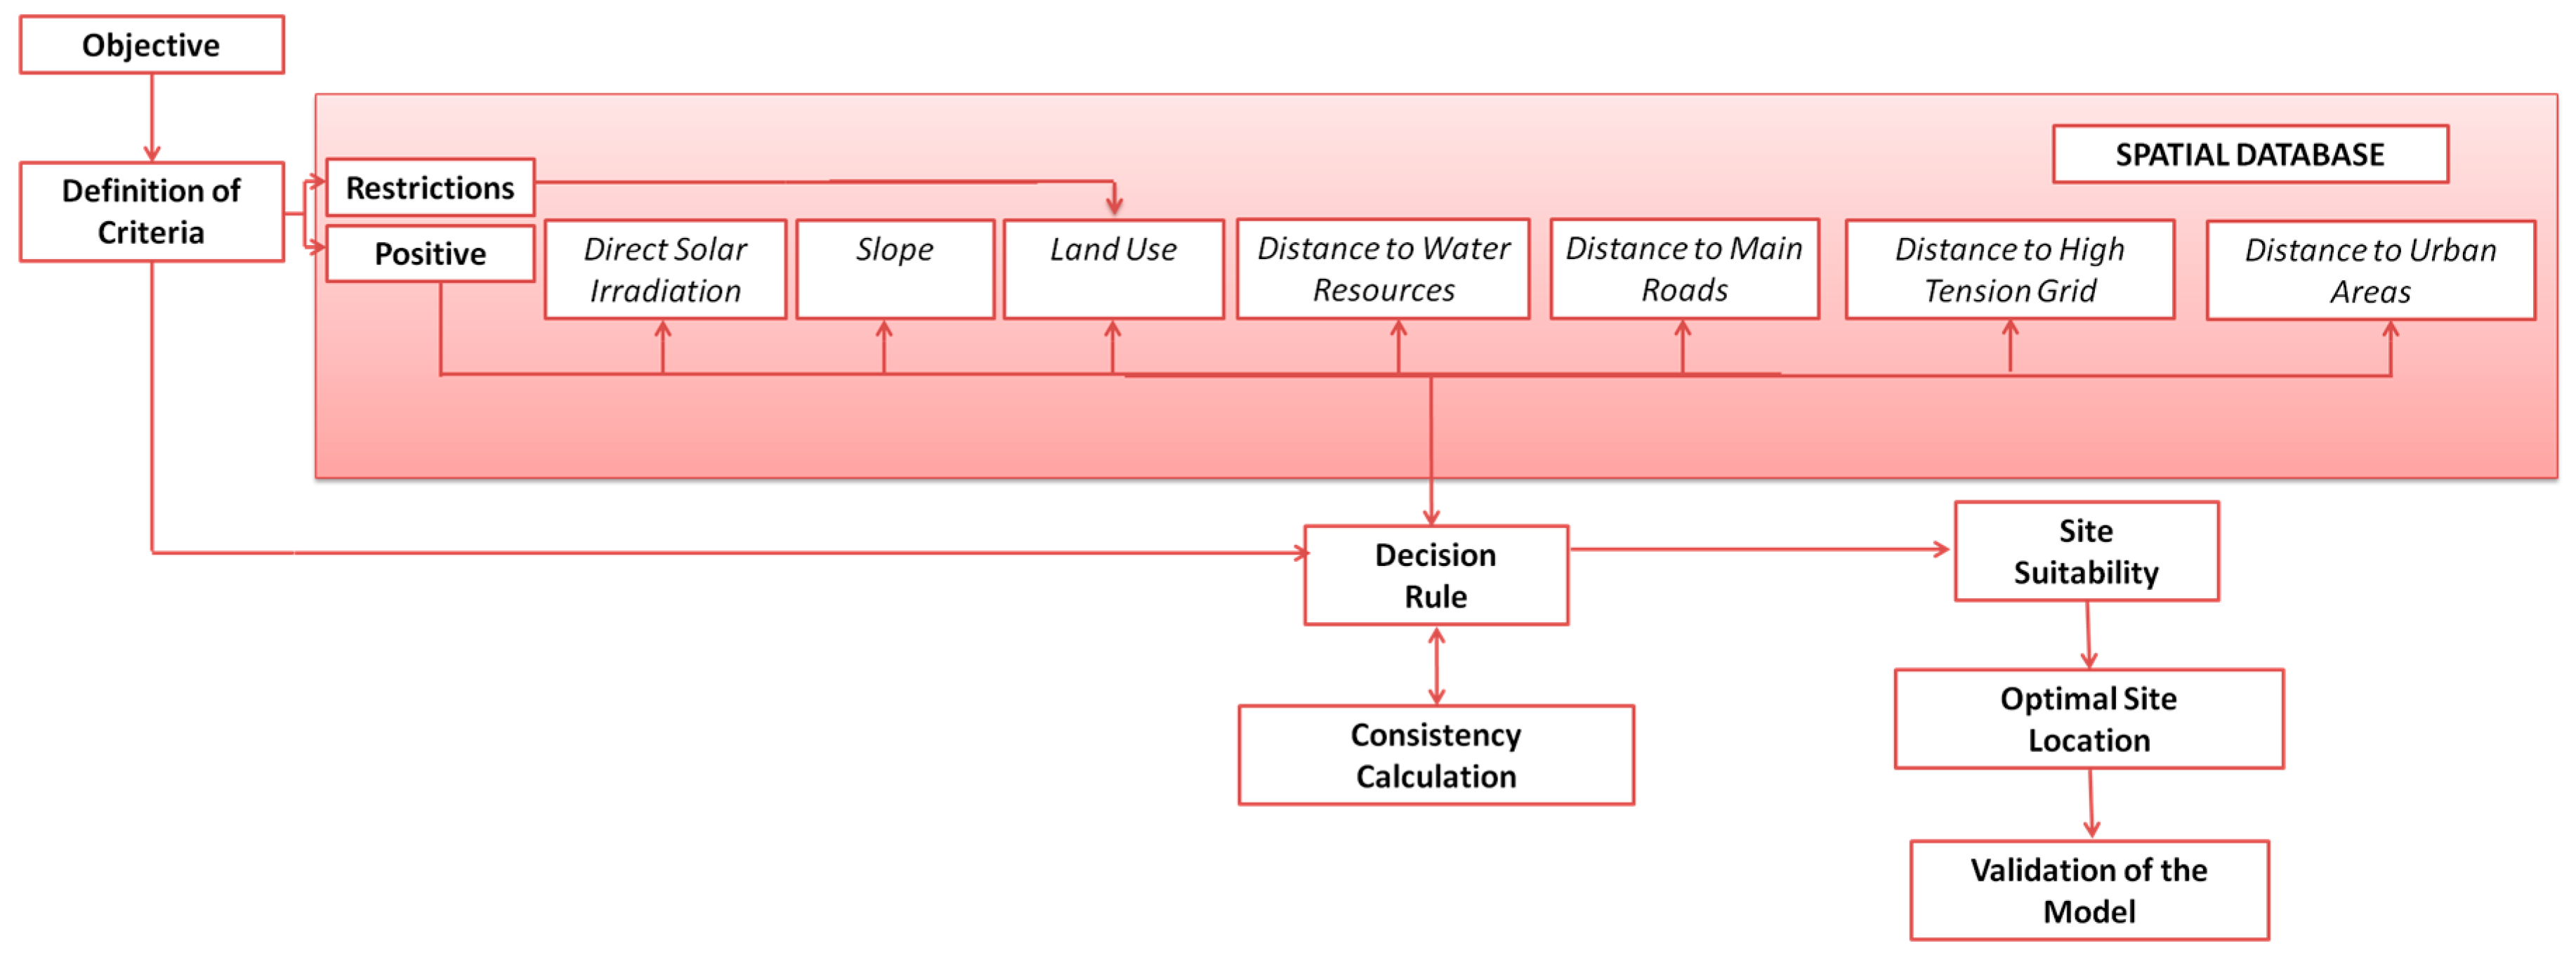
4.3. Methodological Procedures
4.3.1. Objective of the Method
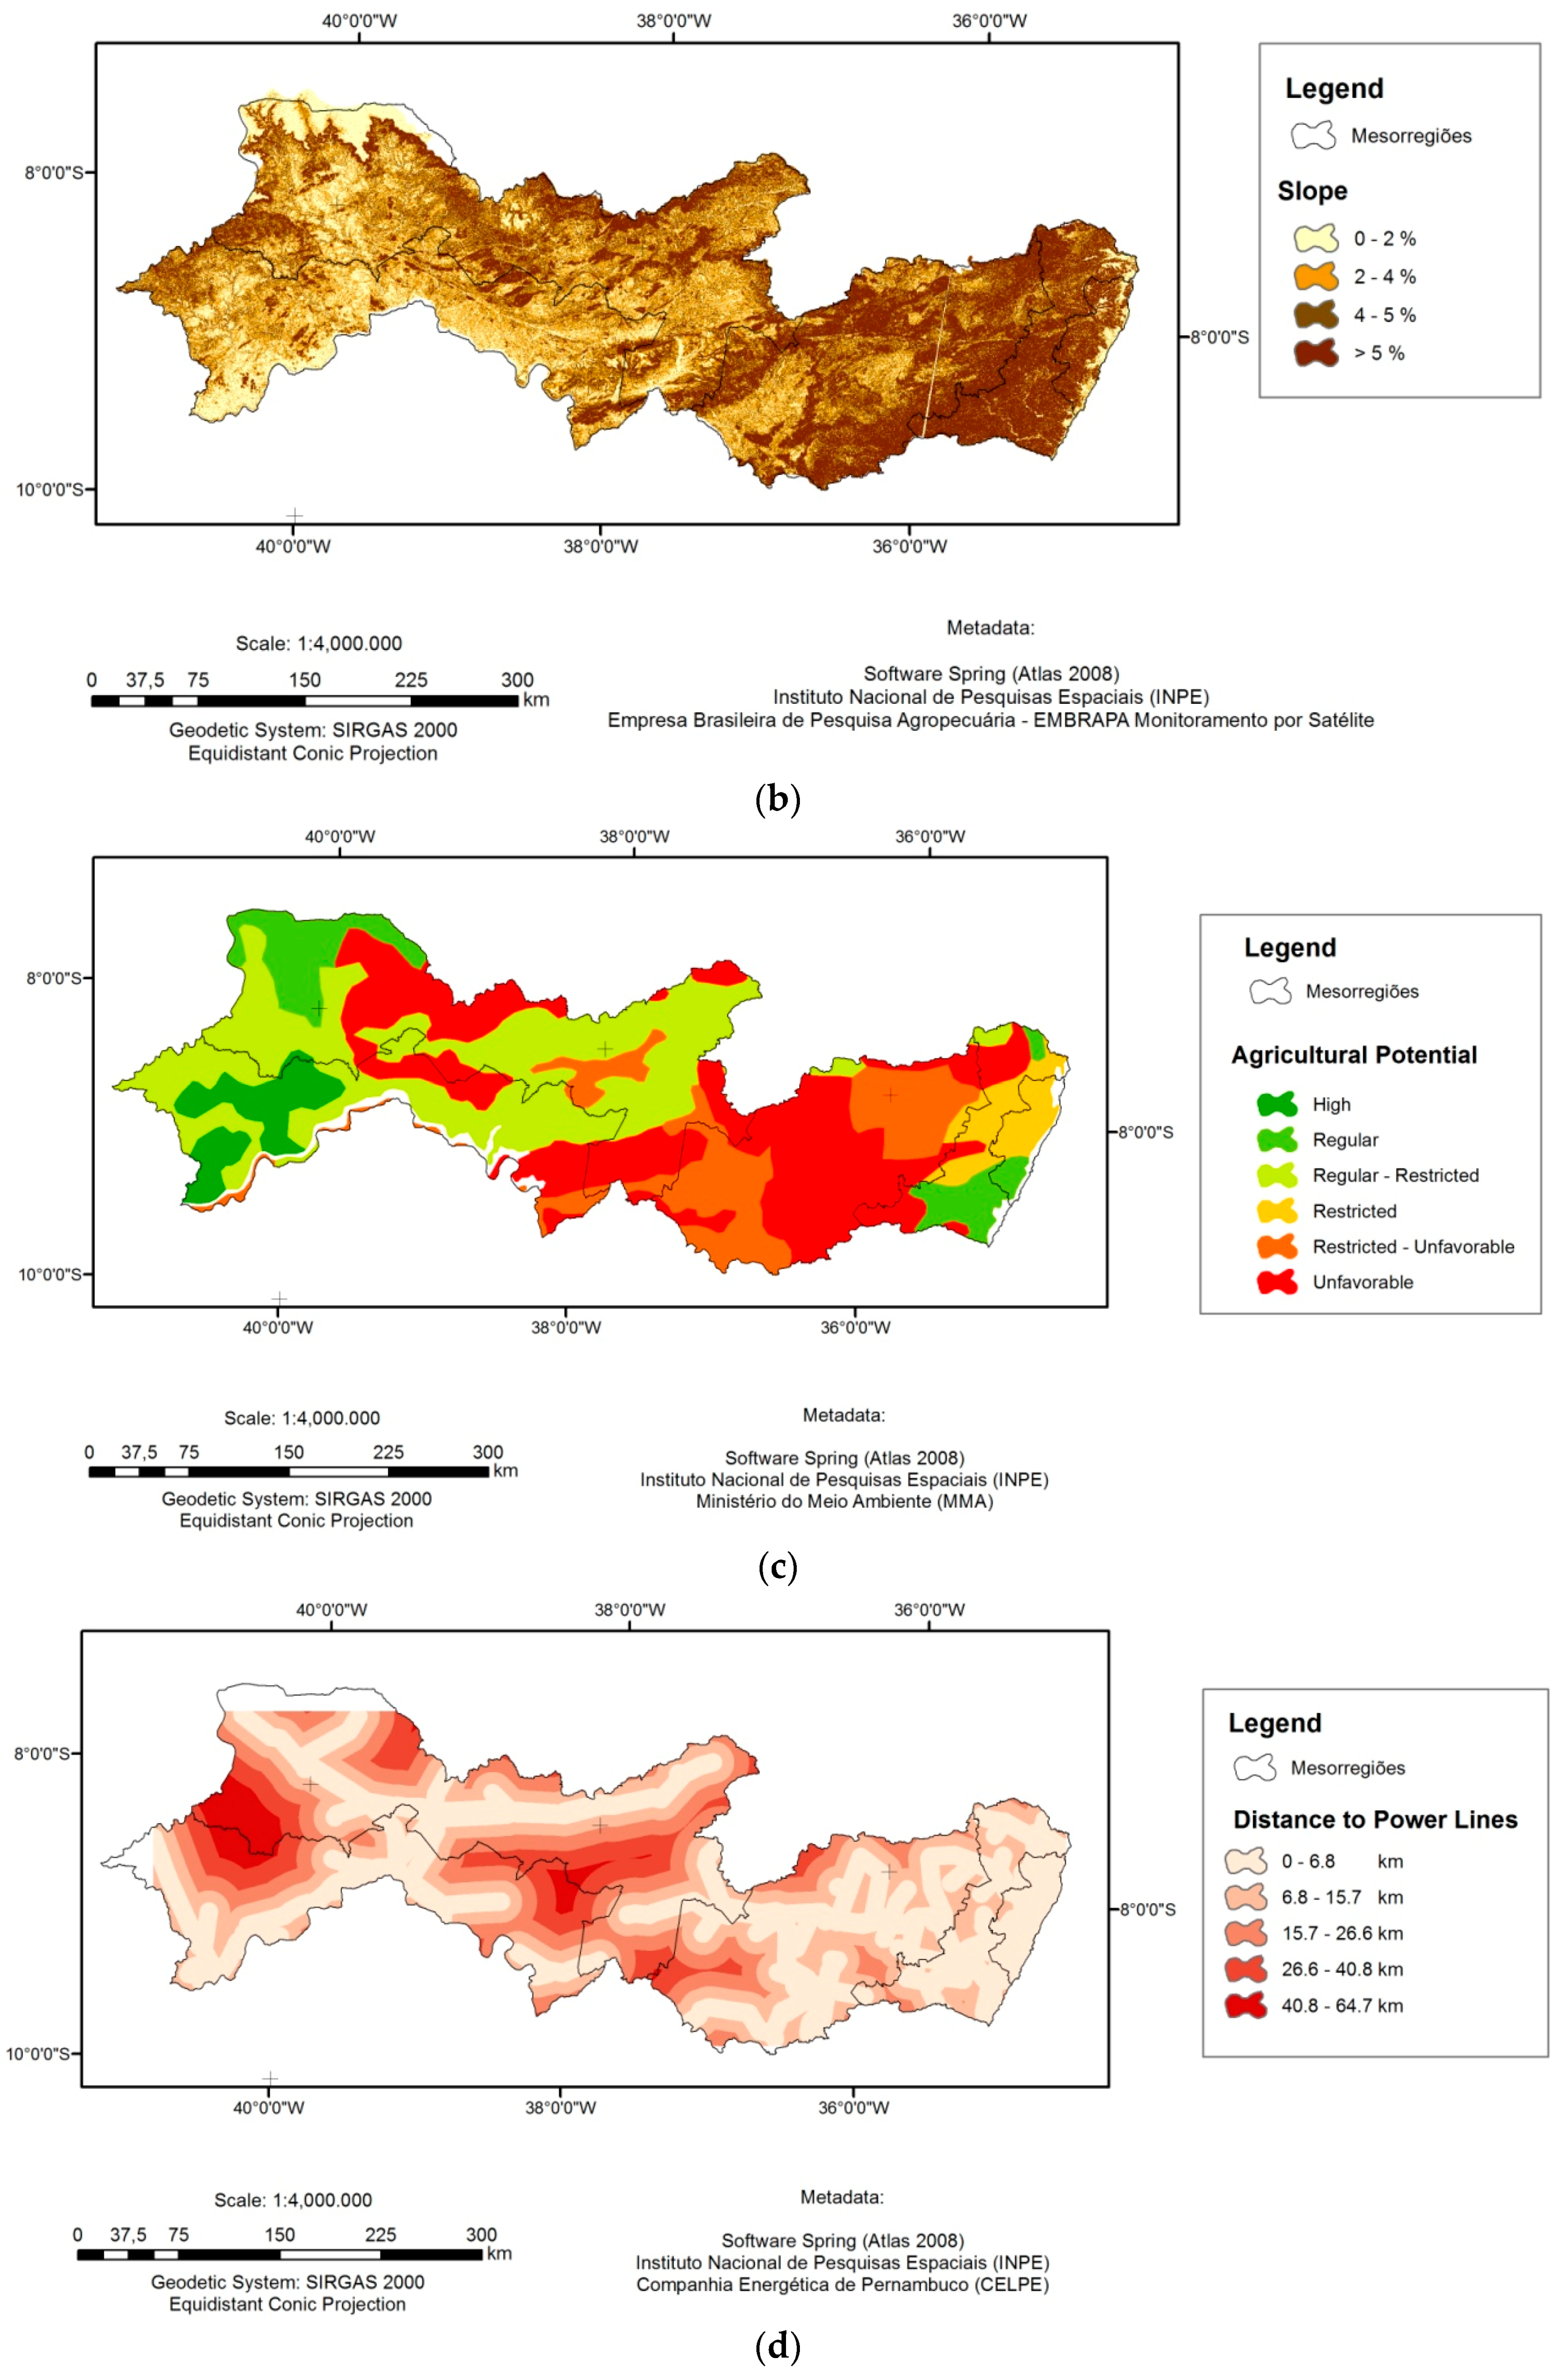
4.3.2. Criteria and Sub-Criteria Definition
4.3.3. Definition of the Decision Rule and Model Consistency Calculation
4.3.4. Sites Suitability for the Insertion of Solar Thermal Power Plants
4.3.5. Solar Power Plant Location
4.3.6. Model Validation
5. Results and Discussion
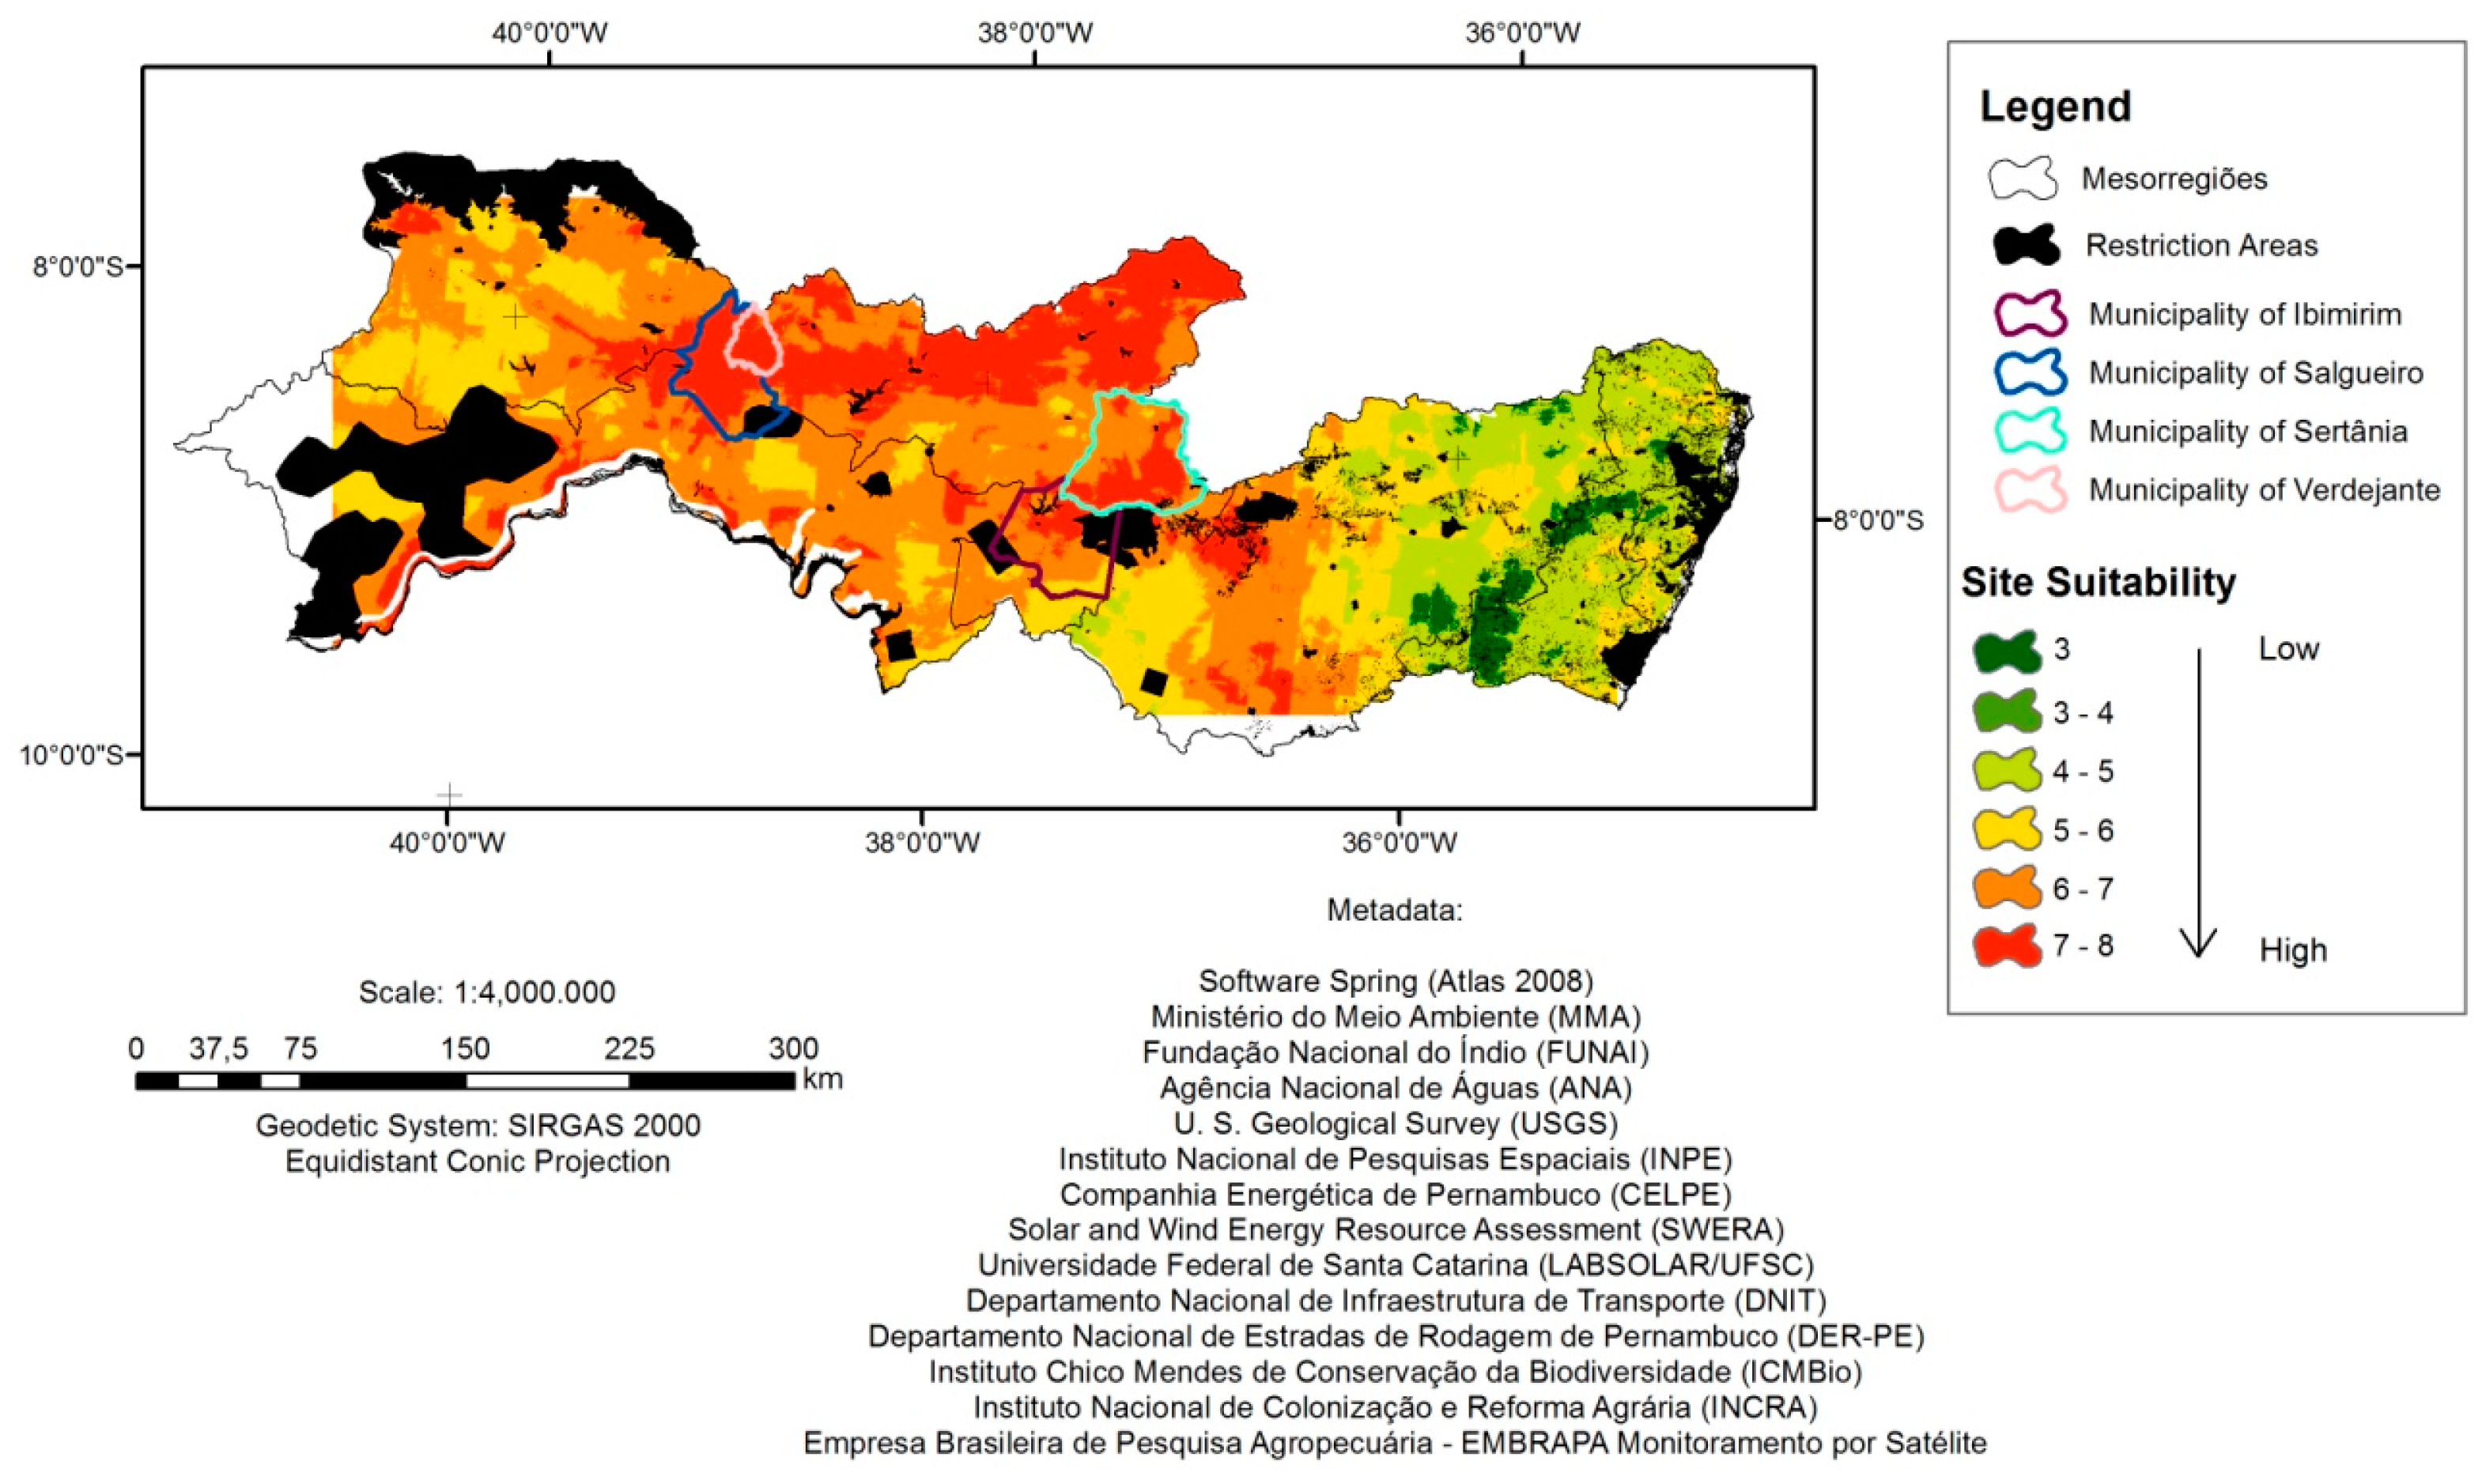
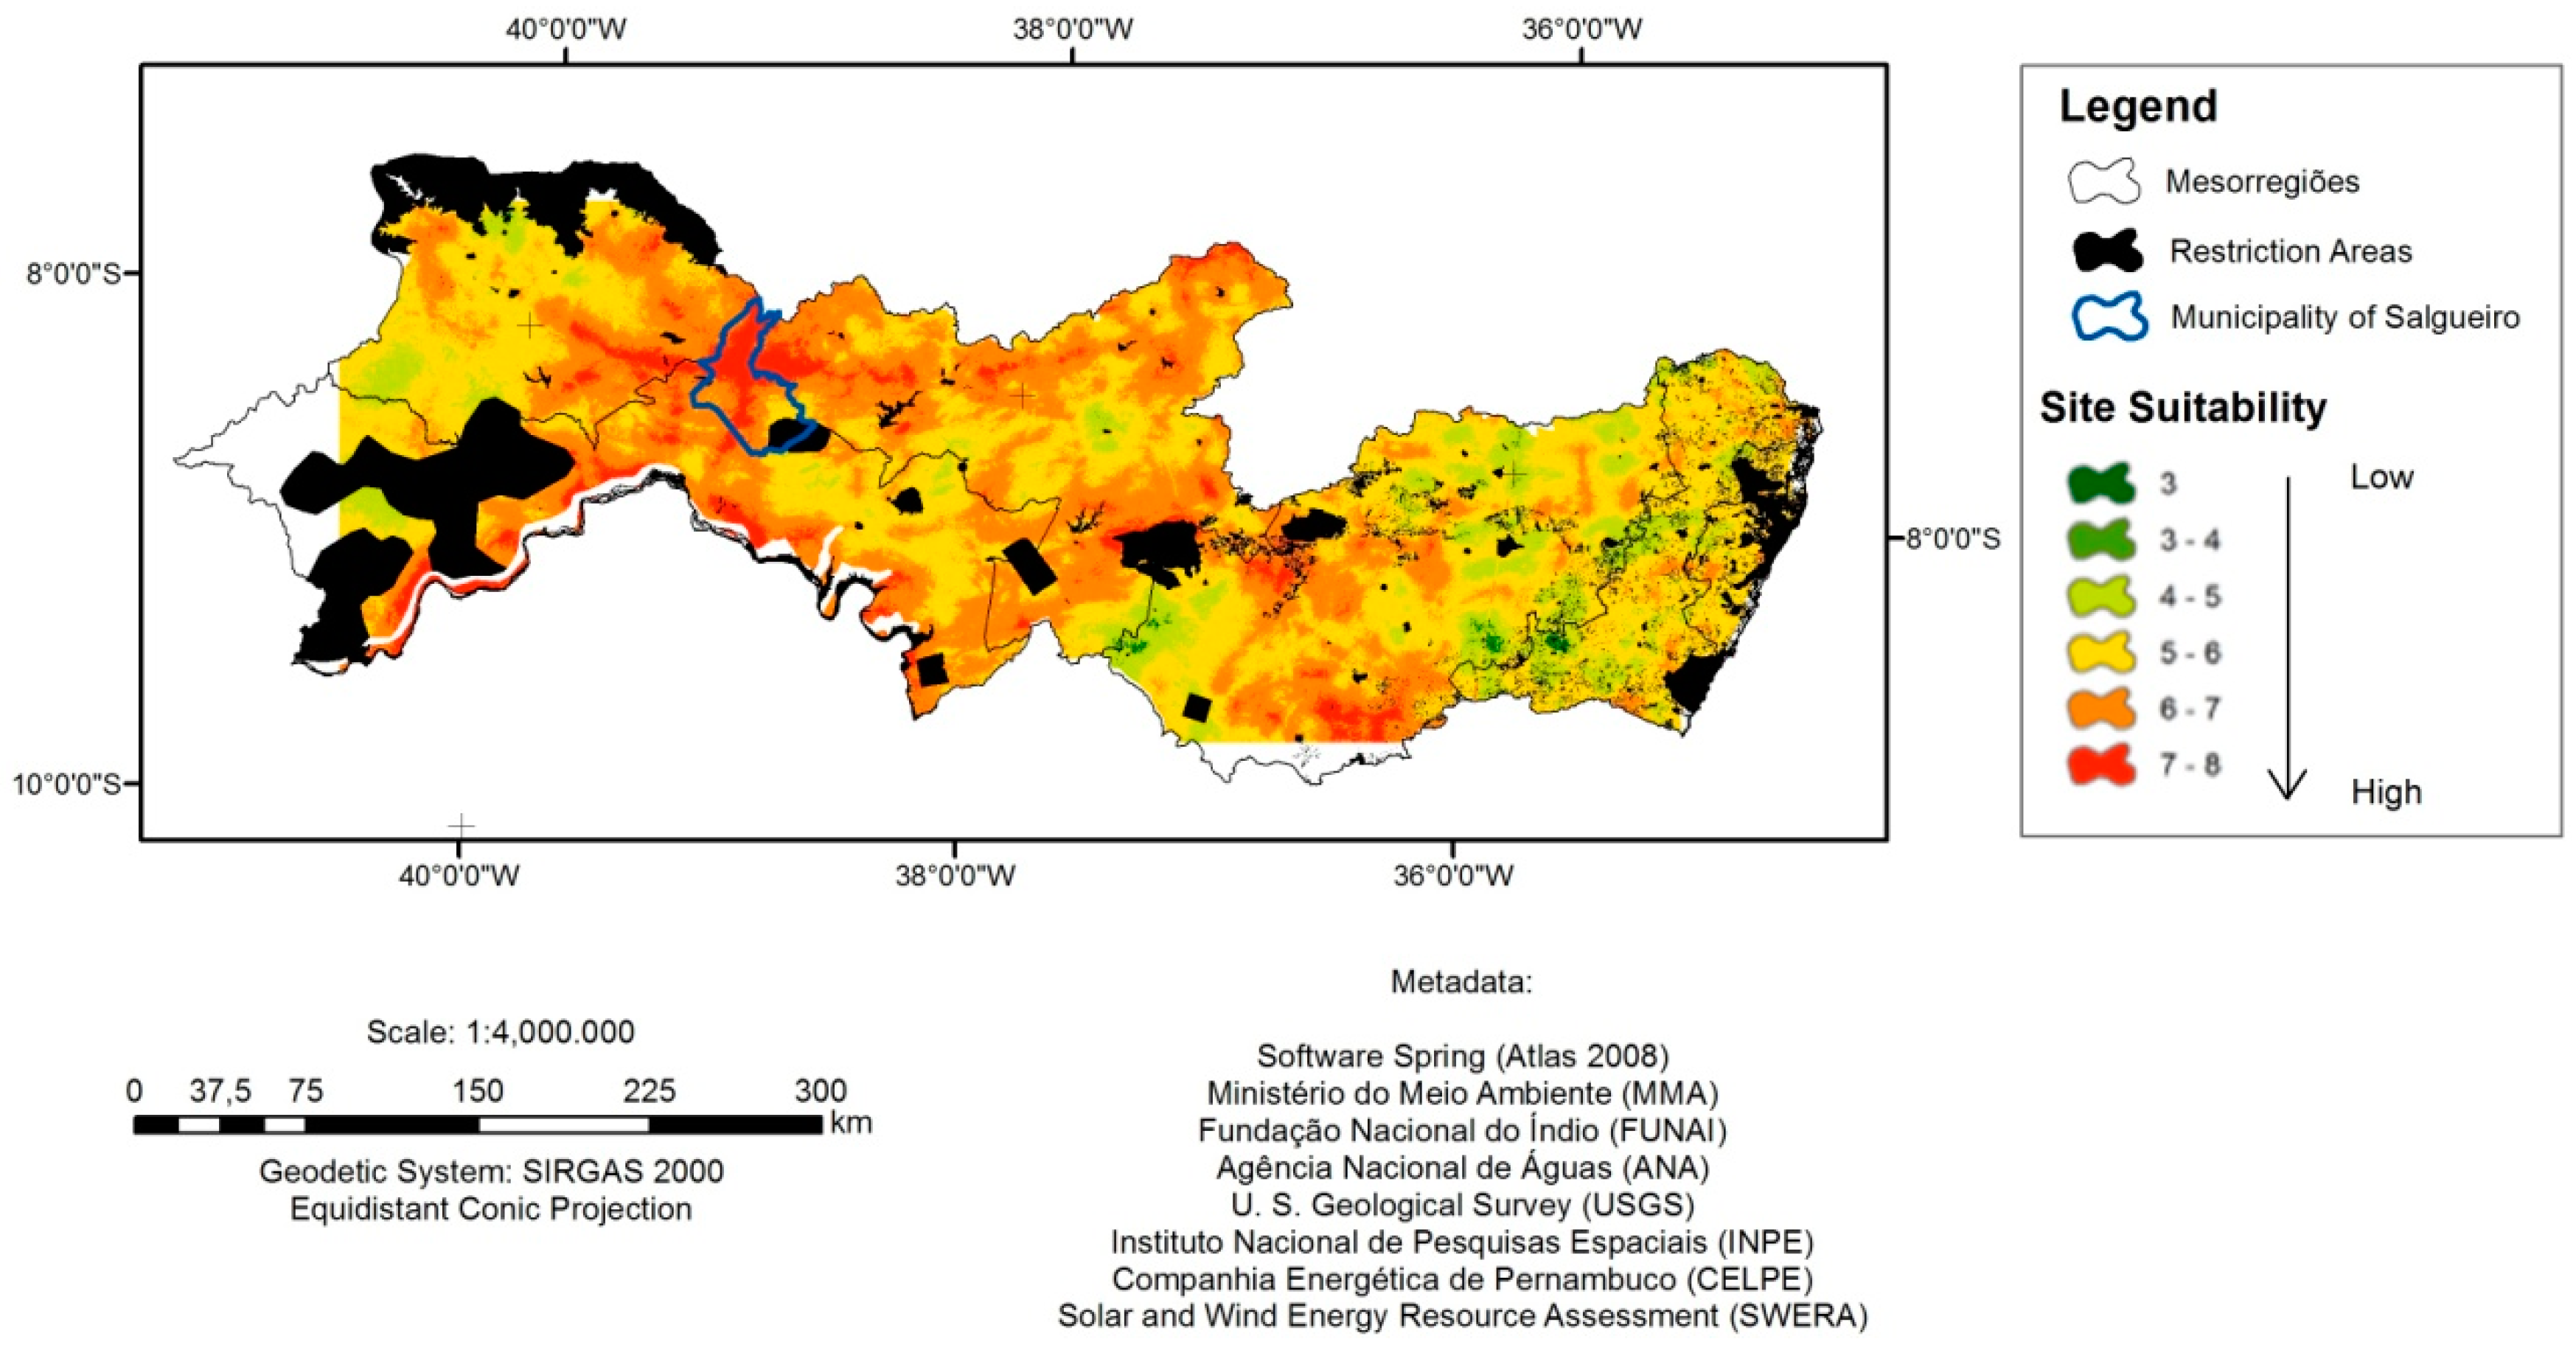
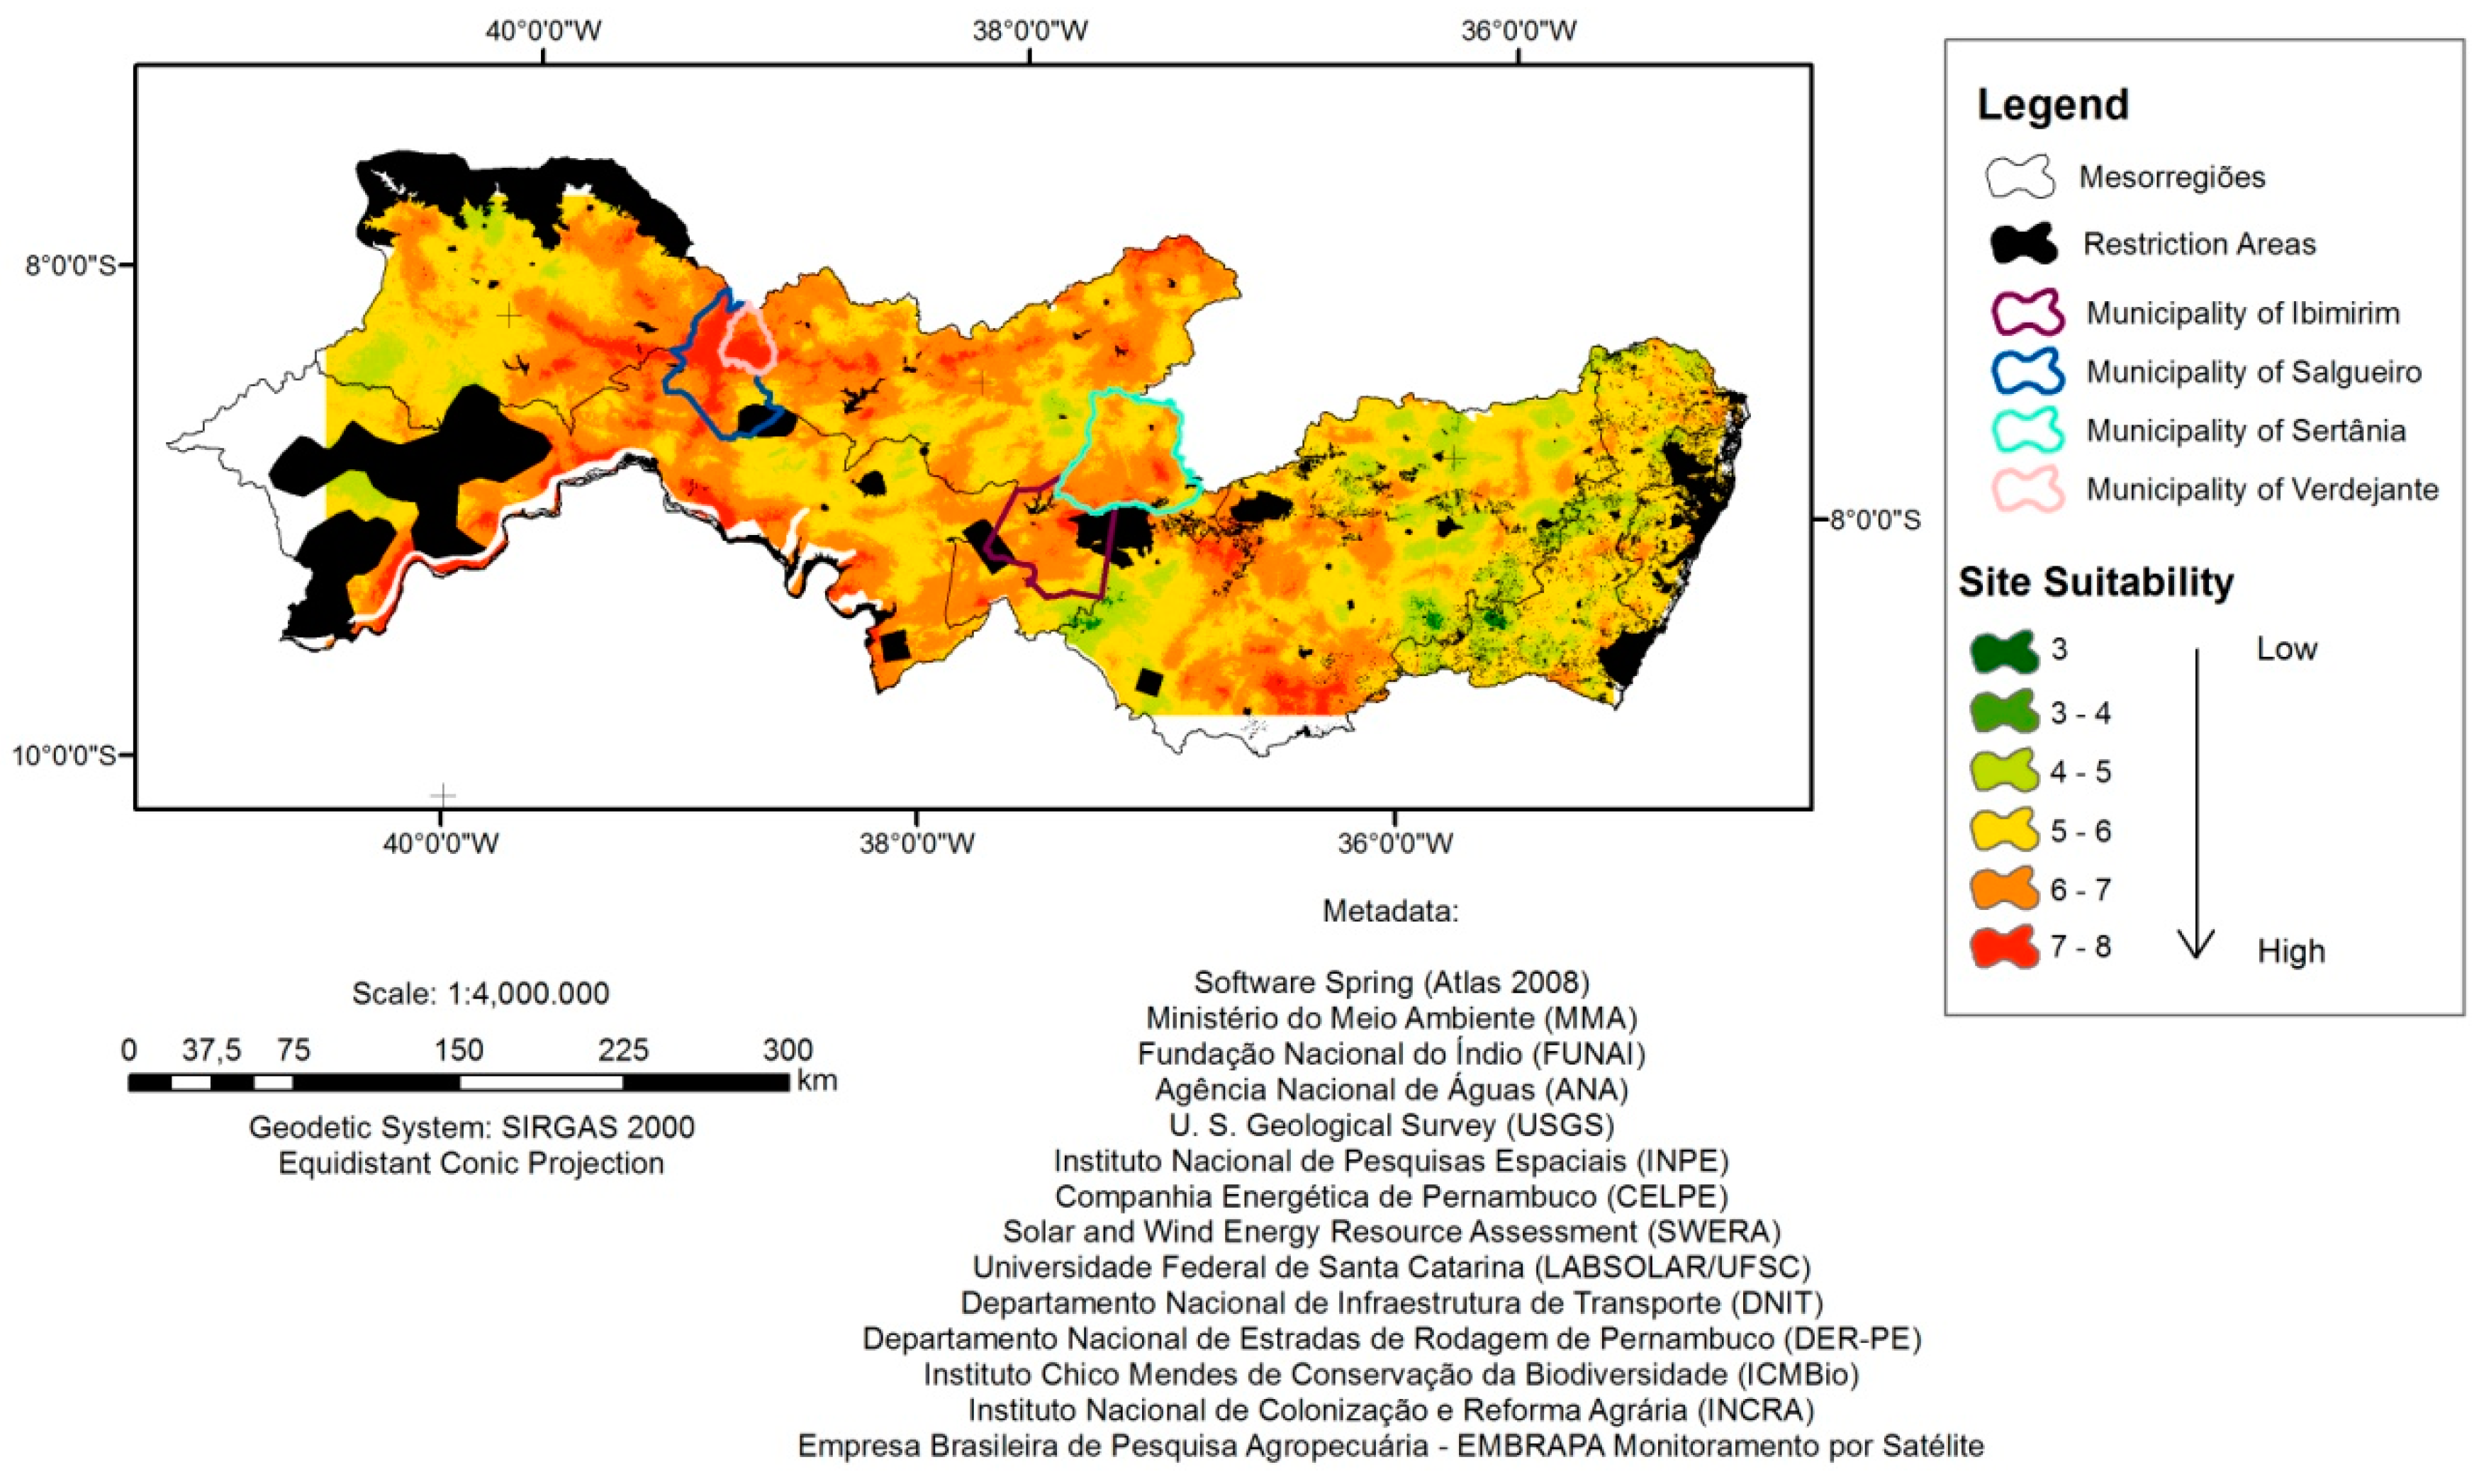
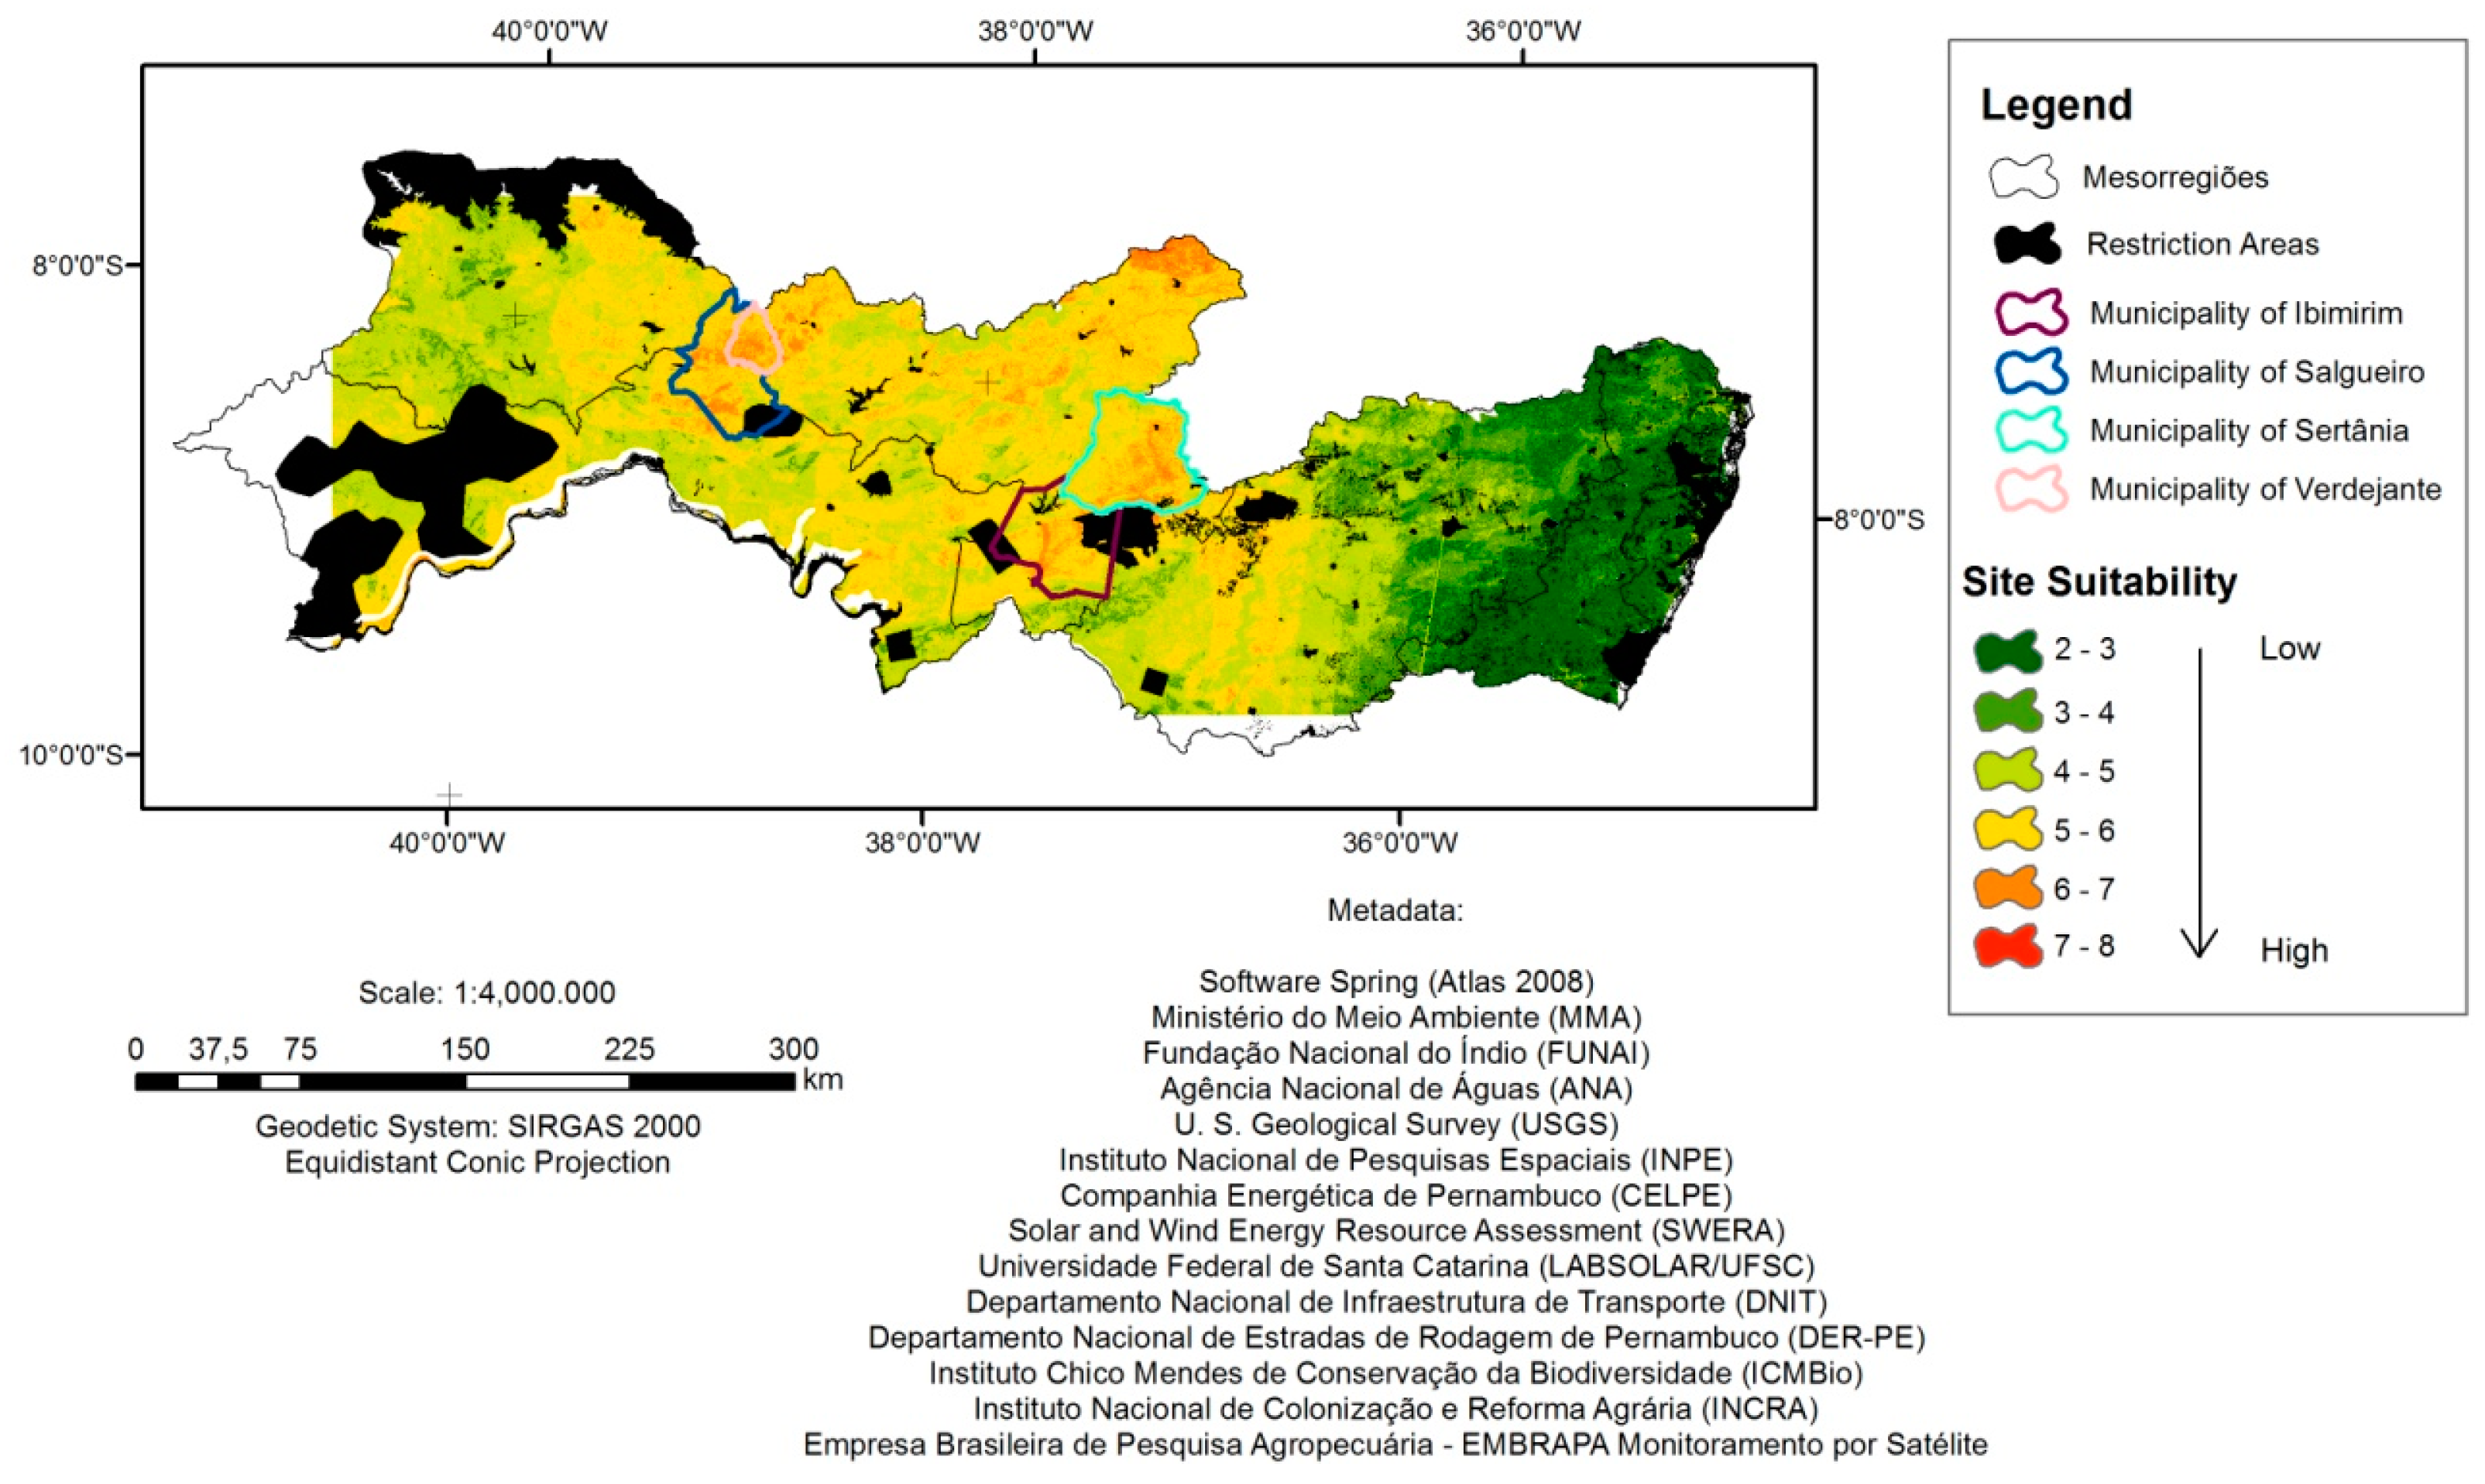
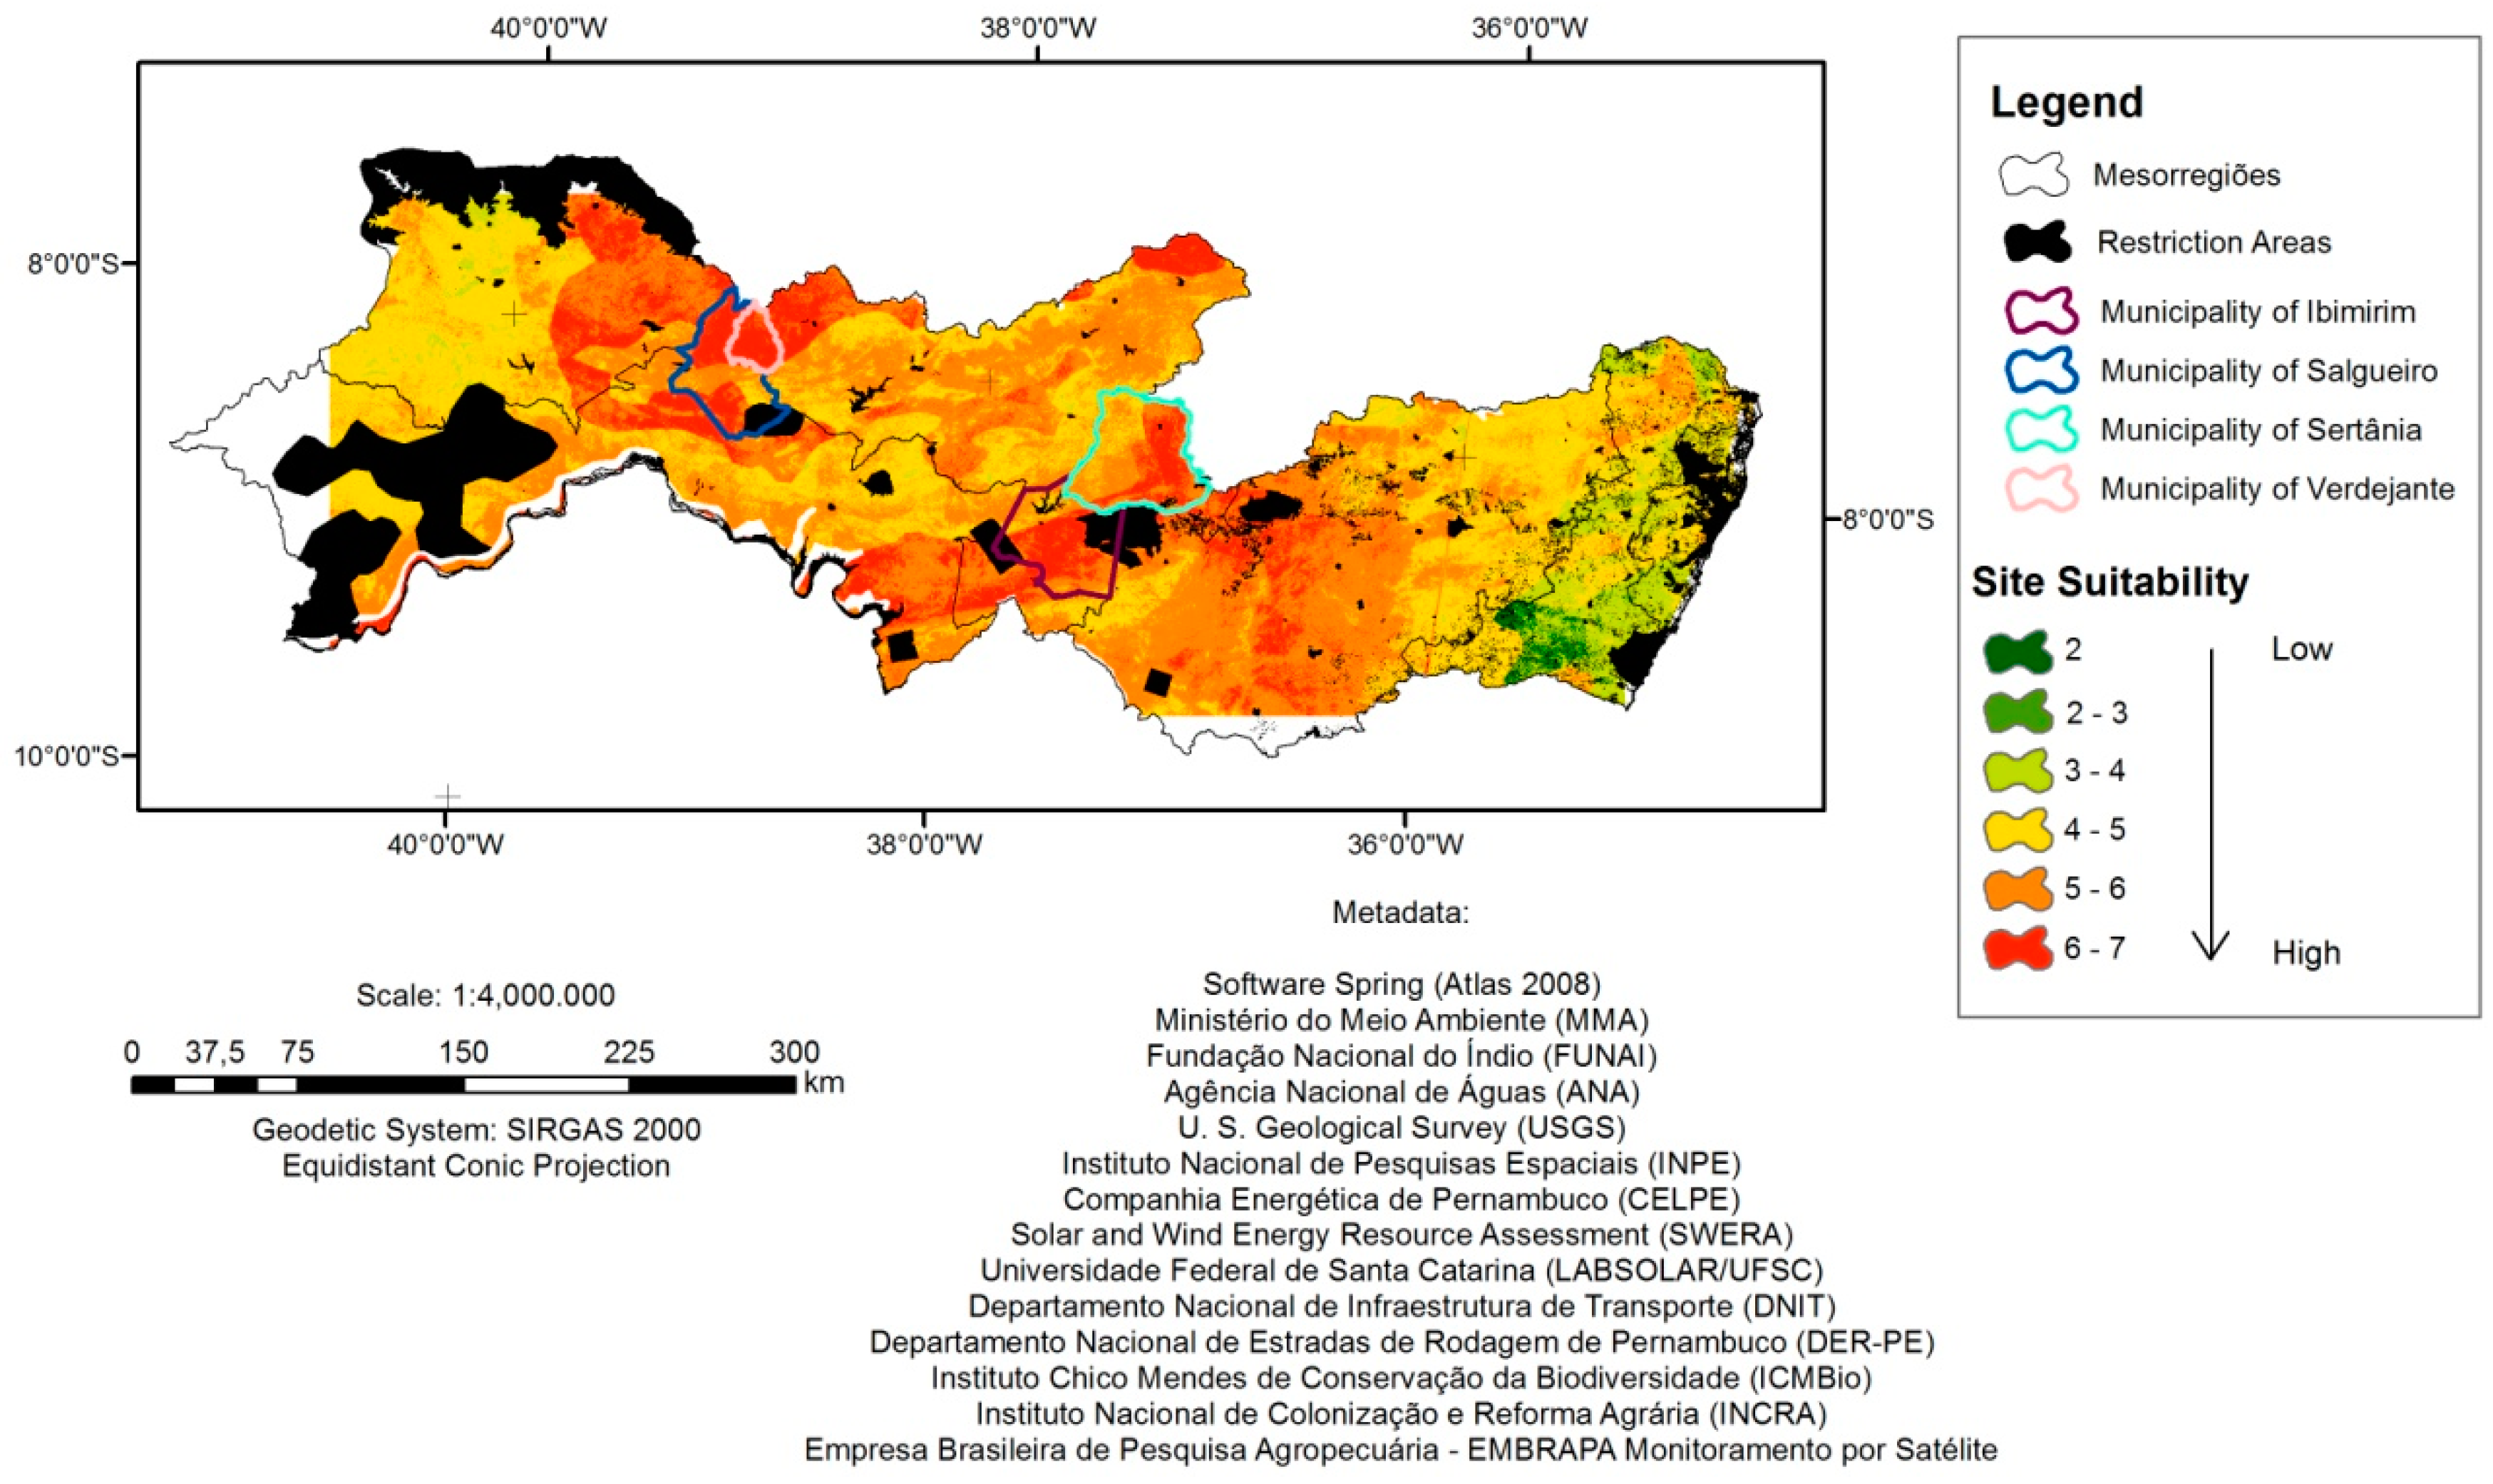
5.1. Identification of Suitable Sites
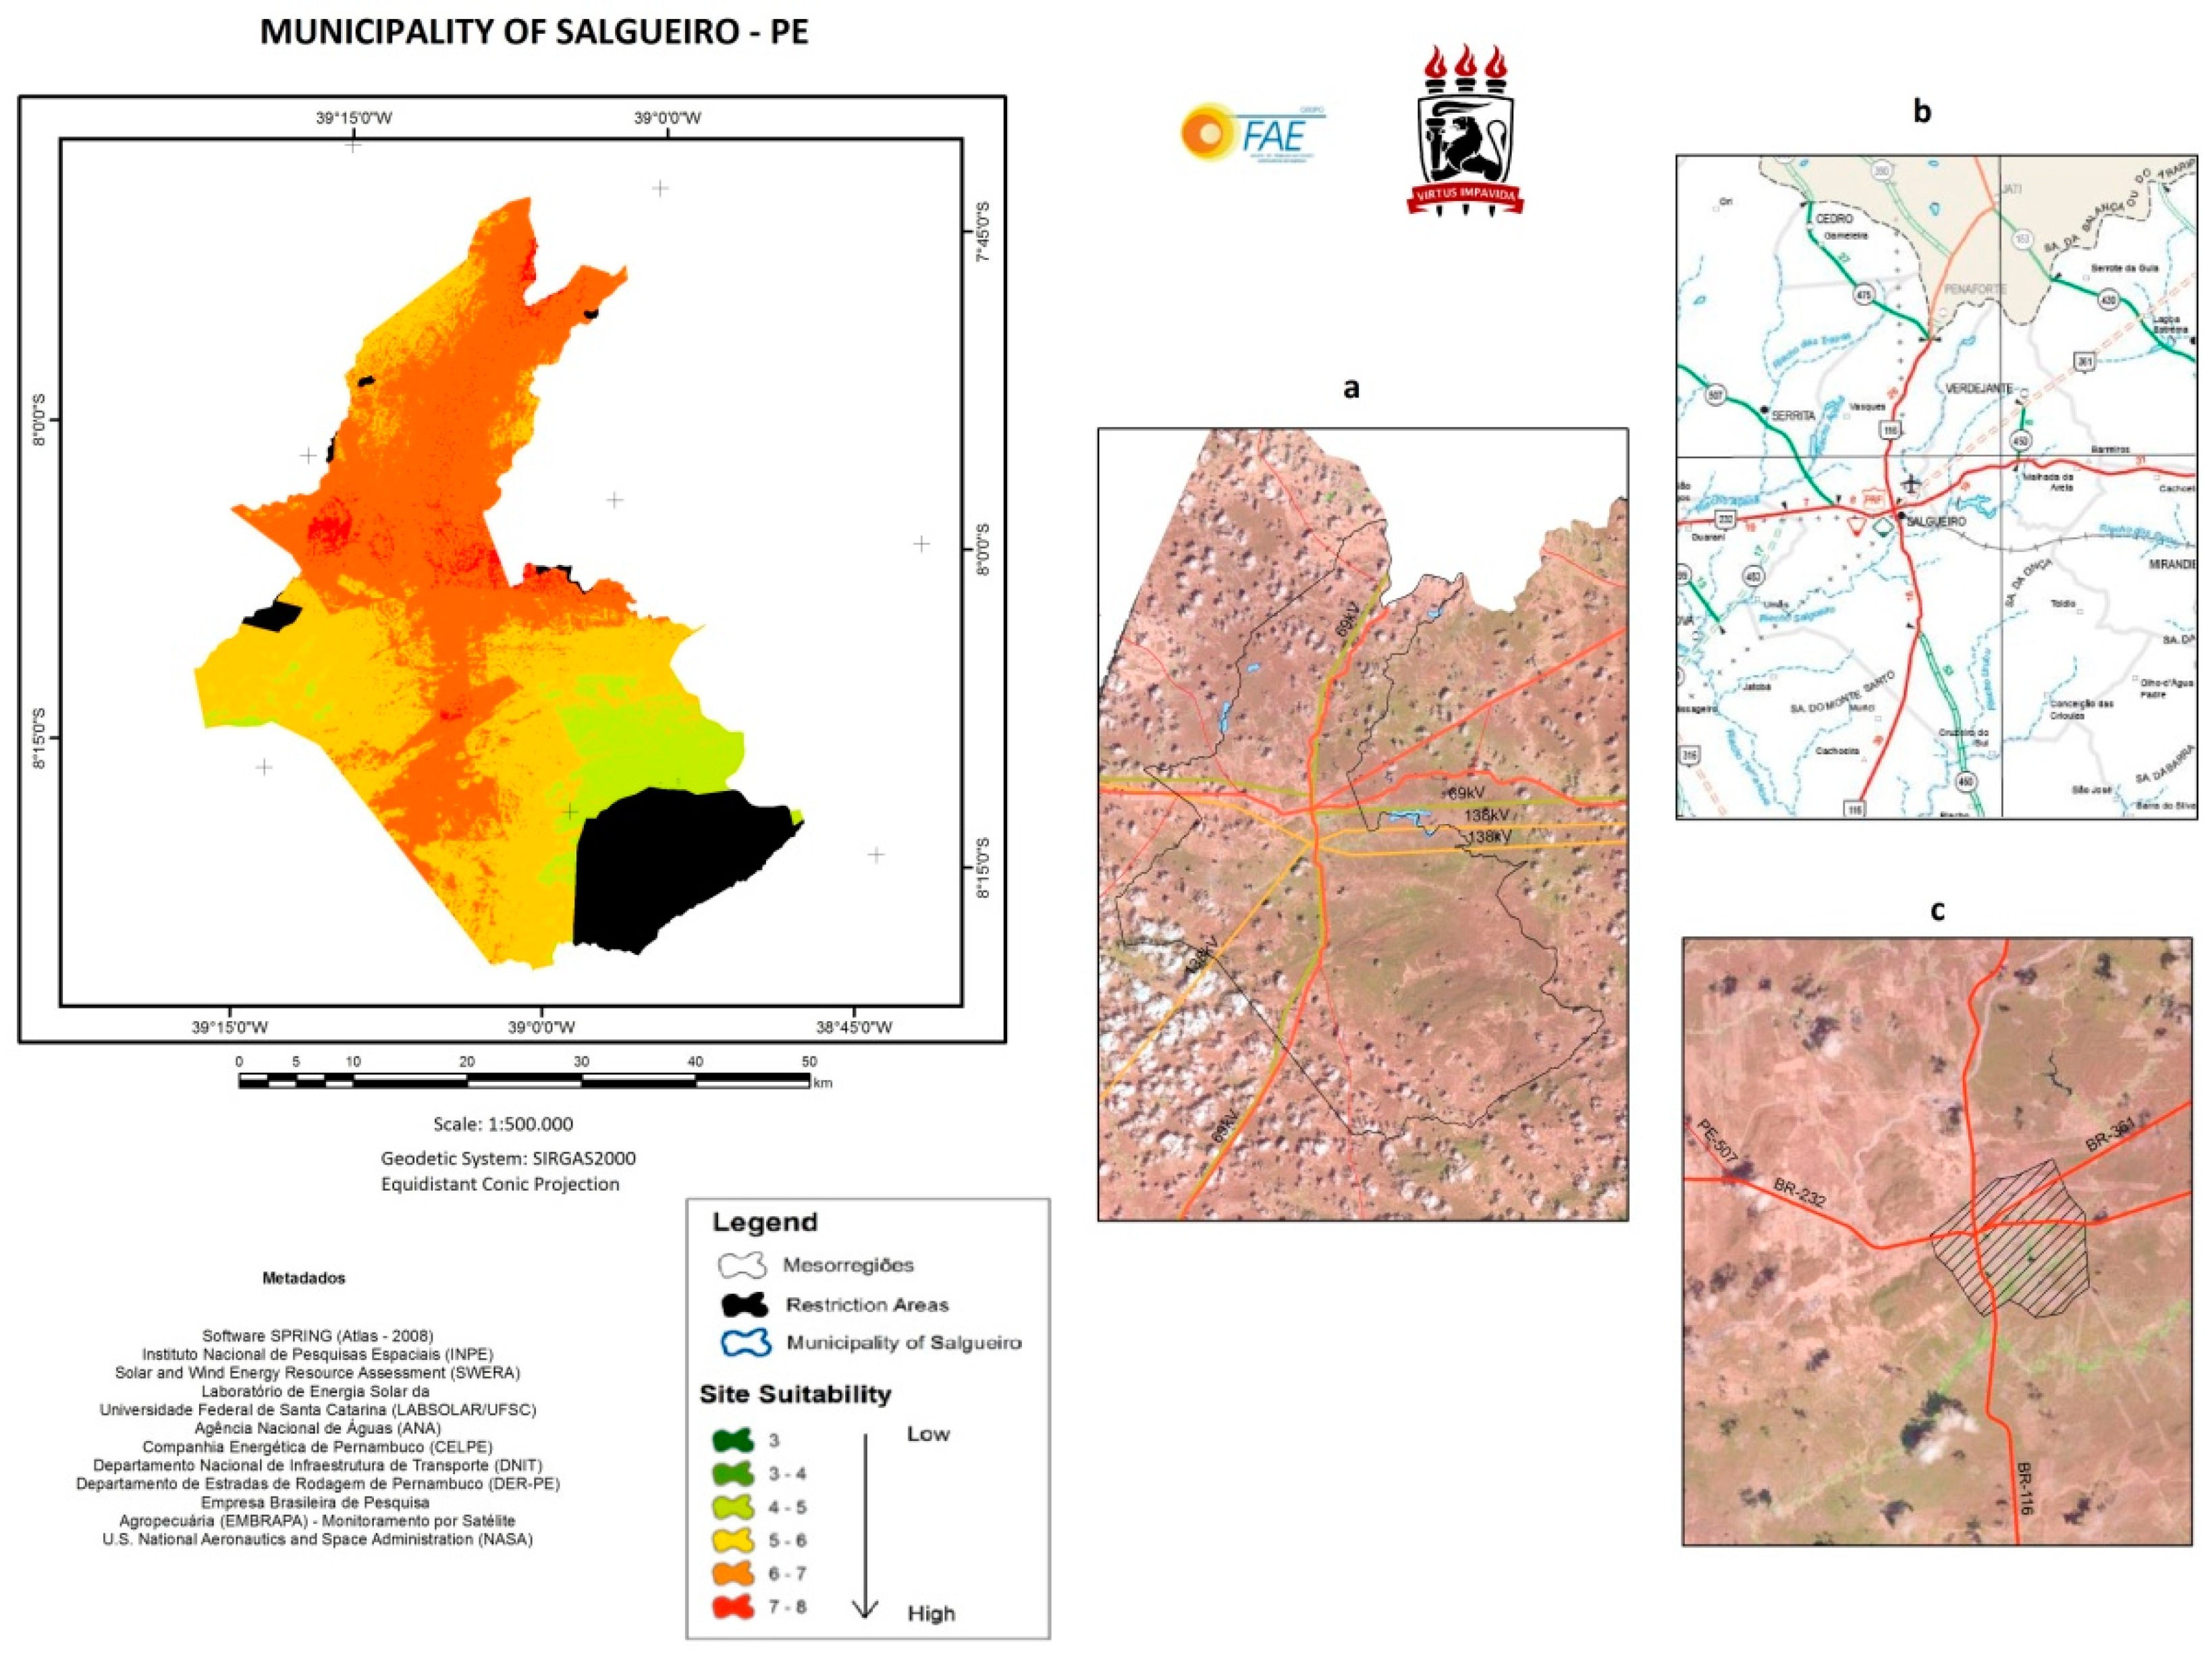
- Municipality of Salgueiro: Salgueiro is inserted in the Backlands mesoregion and has a population of 59,409 inhabitants, according to IBGE. The city had, in all scenarios of the study, high potential for the installation of solar power plants once it remained in the highest suitability class in each scenario presented (suitability class from 7 to 8 in the Scenarios Starting Point, 1 and 2; suitability class from 6 to 5 in the Scenario 3).
- Municipality of Verdejante: Verdejante has a population of 9430 inhabitants, according to IBGE and is located in the Backlands mesoregion. Verdejante also presented high potential for the installation of solar power plants in all scenarios of the study, remaining in the higher class of suitability in all scenarios—suitability class from 7 to 8 in Scenario Starting Point and Scenario 1 to 2; and suitability class from 6 to 7 in Scenario 3.
- Municipality of Sertânia: Sertânia is also located in the Backlands of Pernambuco and has a population of 35,207 inhabitants, according to IBGE. Sertânia has high potential for the installation of solar power plants, remaining in the highest suitability class in two scenarios of the study (Scenario Starting Point—classes 7 to 8; Scenario 3—classes 6 to 7) and in the class immediately bellow to the class of highest suitability in Scenarios 1 and 2 (Sertânia presented classes 6 to 7).
- Municipality of Ibimirim: Ibimirim is located in the Backlands of Pernambuco and has a population of 28,403 inhabitants, according to IBGE. The city remained in the highest suitability class in Scenario Starting Point (classes 7 to 8) and in Scenario 3 (classes 6 to 7); and in the class immediately bellow the class with highest suitability in Scenarios 1 and 2 (classes 6 to 7).
5.2. Model Validation
6. Conclusions
Acknowledgments
Author Contributions
Conflicts of Interest
References
- REN21. Renewables 2015—Global Status Report; Renewable Energy Policy Network for the 21st Century: Paris, France, 2015. [Google Scholar]
- Burgi, A.S. Avaliação do Potencial Técnico de Geração Elétrica Termossolar no Brasil a partir de Modelagem em SIG e Simulação de Plantas Virtuais. Ph.D. Thesis, Federal University of Rio de Janeiro, Rio de Janeiro, Brazil, 2013. [Google Scholar]
- Tiba, C.; Reis, R.J.R.; Costa, J.C.E.; Azevêdo, V.W.B.; Abreu, J.F.; Alves, M.A.S.; Guimarães, D.P.; Porto, M.A.D. Siting Study of Solar Thermoelectric Plants in the State of Minas Gerais. JGIS 2014, 6, 423–493. [Google Scholar] [CrossRef]
- IEA. Technology Roadmap—Solar Thermal Electricity; International Energy Agency: Paris, France, 2014. [Google Scholar]
- Bravo, J.D. Los Sistemas de Información Geográfica en la Planificación e Integración de Energías Renovables; CIEMAT, Ed.; Centro de Investigaciones Energéticas, Medioambientales y Tecnológicas: Madrid, Spain, 2002. [Google Scholar]
- Broesamle, H.; Mannstein, H.; Schillings, C.; Tieb, F. Assessment of Solar Electricity Potentials in North Africa Based on Satellite Data and a Geographic Information System. Sol. Energy 2001, 70, 1–12. [Google Scholar] [CrossRef]
- Mehos, M.; Owens, B. An Analysis of Sitting Opportunities for Concentrating Solar Power Plants in the Southwestern United States. In Proceedings of the World Renewable Energy Conference VIII, Denver, CO, USA, 28 August–3 September 2004. [Google Scholar]
- Fluri, T.P. The Potential of Concentrating Solar Power in South Africa. Energy Policy 2009, 37, 5075–5080. [Google Scholar] [CrossRef]
- Charabi, Y.; Gastli, A. GIS Assessment of Large CSP Plant in Duqum, Oman. Renew. Sustain. Energy Rev. 2010, 14, 835–841. [Google Scholar] [CrossRef]
- Azoumah, Y.; Ramde, E.W.; Tapsoba, G.; Thiam, S. Siting Guidelines for Concentrating Solar Power Plants in the Sahel: Case Study of Burkina Faso. Sol. Energy 2010, 84, 1545–1553. [Google Scholar] [CrossRef]
- Clifton, J.; Boruff, B. Assessing the Potential for Concentrated Solar Power Development in Rural Australia. Energy Policy 2010, 38, 5272–5280. [Google Scholar] [CrossRef]
- Purohit, I.; Purohit, H. Techno-Economic Evaluation of Concentrating Solar Power Generation in India. Energy Policy 2010, 38, 3015–3029. [Google Scholar] [CrossRef]
- Arán Carrión, J.; Espín Estrella, A.F.; Aznar Dols, F.; Zamorano Toro, M.; Rodríguez, M.; Ramos Ridao, A. Environmental Decision-Support Systems for Evaluating the Carrying Capacity of Land Areas: Optimal Sites Selection for Grid-Connected Photovoltaic Power Plants. Renew. Sustain. Energy Rev. 2008, 12, 2358–2380. [Google Scholar] [CrossRef]
- Charabi, Y.; Gastli, A. PV Site Suitability Analysis Using GIS-based Spatial Fuzzy Multi-Criteria Evaluation. Renew. Energy 2011, 36, 2554–2561. [Google Scholar] [CrossRef]
- Sánchez-Lozano, J.M.; García-Cascales, M.S.; Lamata, M.T. Decision Criteria for Optimal Location of Solar Plants: Photovoltaic and Thermoelectric. In Assessment and Simulation Tools for Sustainable Energy Systems; Springer: London, UK, 2013; pp. 79–91. [Google Scholar]
- Sánchez-Lozano, J.M.; Teruel-Solano, J.; Soto-Elvira, P.L.; García-Cascales, M.S. Geographical Information Systems (GIS) and Multi-Criteria Decision Making (MCDM) Methods for the Evaluation of Solar Farms Locations: Case Study in South-eastern Spain. Renew. Sustain. Energy Rev. 2013, 24, 544–556. [Google Scholar] [CrossRef]
- Noorollahi, E.; Fadai, D.; Shirazi, M.A.; Ghodsipour, S.H. Land Suitability Analysis for Solar Farms Exploitation Using GIS and Fuzzy Analytic Hierarchy Process (FAHP)—A Case Study of Iran. Energies 2016, 9, 643. [Google Scholar] [CrossRef]
- Sánchez-Lozano, J.M.; García-Cascales, M.S.; Lamata, M.T. GIS-based onshore wind farm site selection using Fuzzy Multi-Criteria Decision Making methods. Evaluating the case of Southeastern Spain. Appl. Energy 2016, 171, 86–102. [Google Scholar] [CrossRef]
- Sanchez-Lozano, J.M.; Henggeler Antunes, C.; Garcia-Cascales, M.S.; Dias, L.C. GIS-based photovoltaic solar farms site selection using ELECTRE-TRI: Evaluating the case for Torre Pacheco, Murcia, Southeast of Spain. Renew. Energy 2014, 66, 478–494. [Google Scholar] [CrossRef]
- Longley, P.A.; Goodchild, M.F.; Maguire, D.J.; Rhind, D.W. Geographic Information Systems and Science, 2nd ed.; John Wiley & Sons: Hoboken, NJ, USA, 2005. [Google Scholar]
- Mennis, J.; Viger, R.; Tomlin, C.D. Cubic Map Algebra Functions for Spatio-Temporal Analysis. Cartogr. Geogr. Inf. Sci. 2005, 32, 17–32. [Google Scholar] [CrossRef]
- Burrough, P.A.; Mcdonnel, R.A. Principles of Geographical Information Systems; Oxford Clarendon Press: Oxford, UK, 1998. [Google Scholar]
- Eastman, J.R.; Jiang, H. Fuzzy Measures in Multi-Criteria Evaluation. In Proceedings of the Second International Symposium on Spatial Accuracy Assessment in Natural Resources and Environmental Studies, Fort Collins, CO, USA, 21–23 May 1996; pp. 527–534. [Google Scholar]
- Saaty, T.L. The Analytic Hierarchy Process: Planning, Priority Setting, Resource Allocation; McGraw-Hill: New York, NY, USA, 1980. [Google Scholar]
- Saaty, T.L. Método de Análise Hierárquica; Makron Books: São Paulo, Brazil, 1991; 367p. [Google Scholar]
- Kelly, B. Nexant Parabolic Trough Solar Power Plant Systems Analysis, Task 2: Comparison of Wet and Dry Rankine Cycle Heat Rejection; National Renewable Energy Laboratory: Golden, CO, USA, 2006.
- Azevêdo, V.W.B. Estudo de Localização de Usina Solar Termoelétrica no Estado de Pernambuco. Ph.D. Thesis, Federal University of Pernambuco, Recife, Brazil, 2016. [Google Scholar]
- Zadeh, A. Fuzzy Sets. Information and Controls. Inf. Control 1965, 8, 338–353. [Google Scholar] [CrossRef]
- Mussone, L.; Sala, G. A Method to Evaluate Vehicular Accident Probability by Using Self Organizing Maps. In Proceedings of the CUPUM—7th International Computers in Urban Planning and Urban Management Conference, University of Hawaii, Honolulu, Hawaii, USA, 18–20 July 2001. [Google Scholar]
- Zambon, K.L.; Carneiro, A.A.F.M.; Negri, J.C. Análise de Decisão Multicritério na Localização de Usinas Termoelétricas Utilizando SIG. Rev. Pesqui. Oper. 2005, 25, 183–199. [Google Scholar] [CrossRef]
- Pozzobon, E. Utilización de un Sistema de Información Geográfica para la Selección y Priorización de Áreas a Reforestar en los Alrededores de la Ciudad de Mérida, Venezuela. Rev. For. Venez. 2003, 47, 61–72. [Google Scholar]


| Importance | Definition |
|---|---|
| 1 | Equal Preference or Importance |
| 3 | Weak Preference or Importance |
| 5 | Moderate Preference or Importance |
| 7 | Strong Preference of Importance |
| 9 | Absolute Preference or Importance |
| n | RI |
|---|---|
| 2 | 0.00 |
| 3 | 0.58 |
| 4 | 0.90 |
| 5 | 1.12 |
| 6 | 1.24 |
| 7 | 1.32 |
| 8 | 1.41 |
| 9 | 1.45 |
| 10 | 1.49 |
| Criteria | Sub-Criteria | Positive Indicator |
|---|---|---|
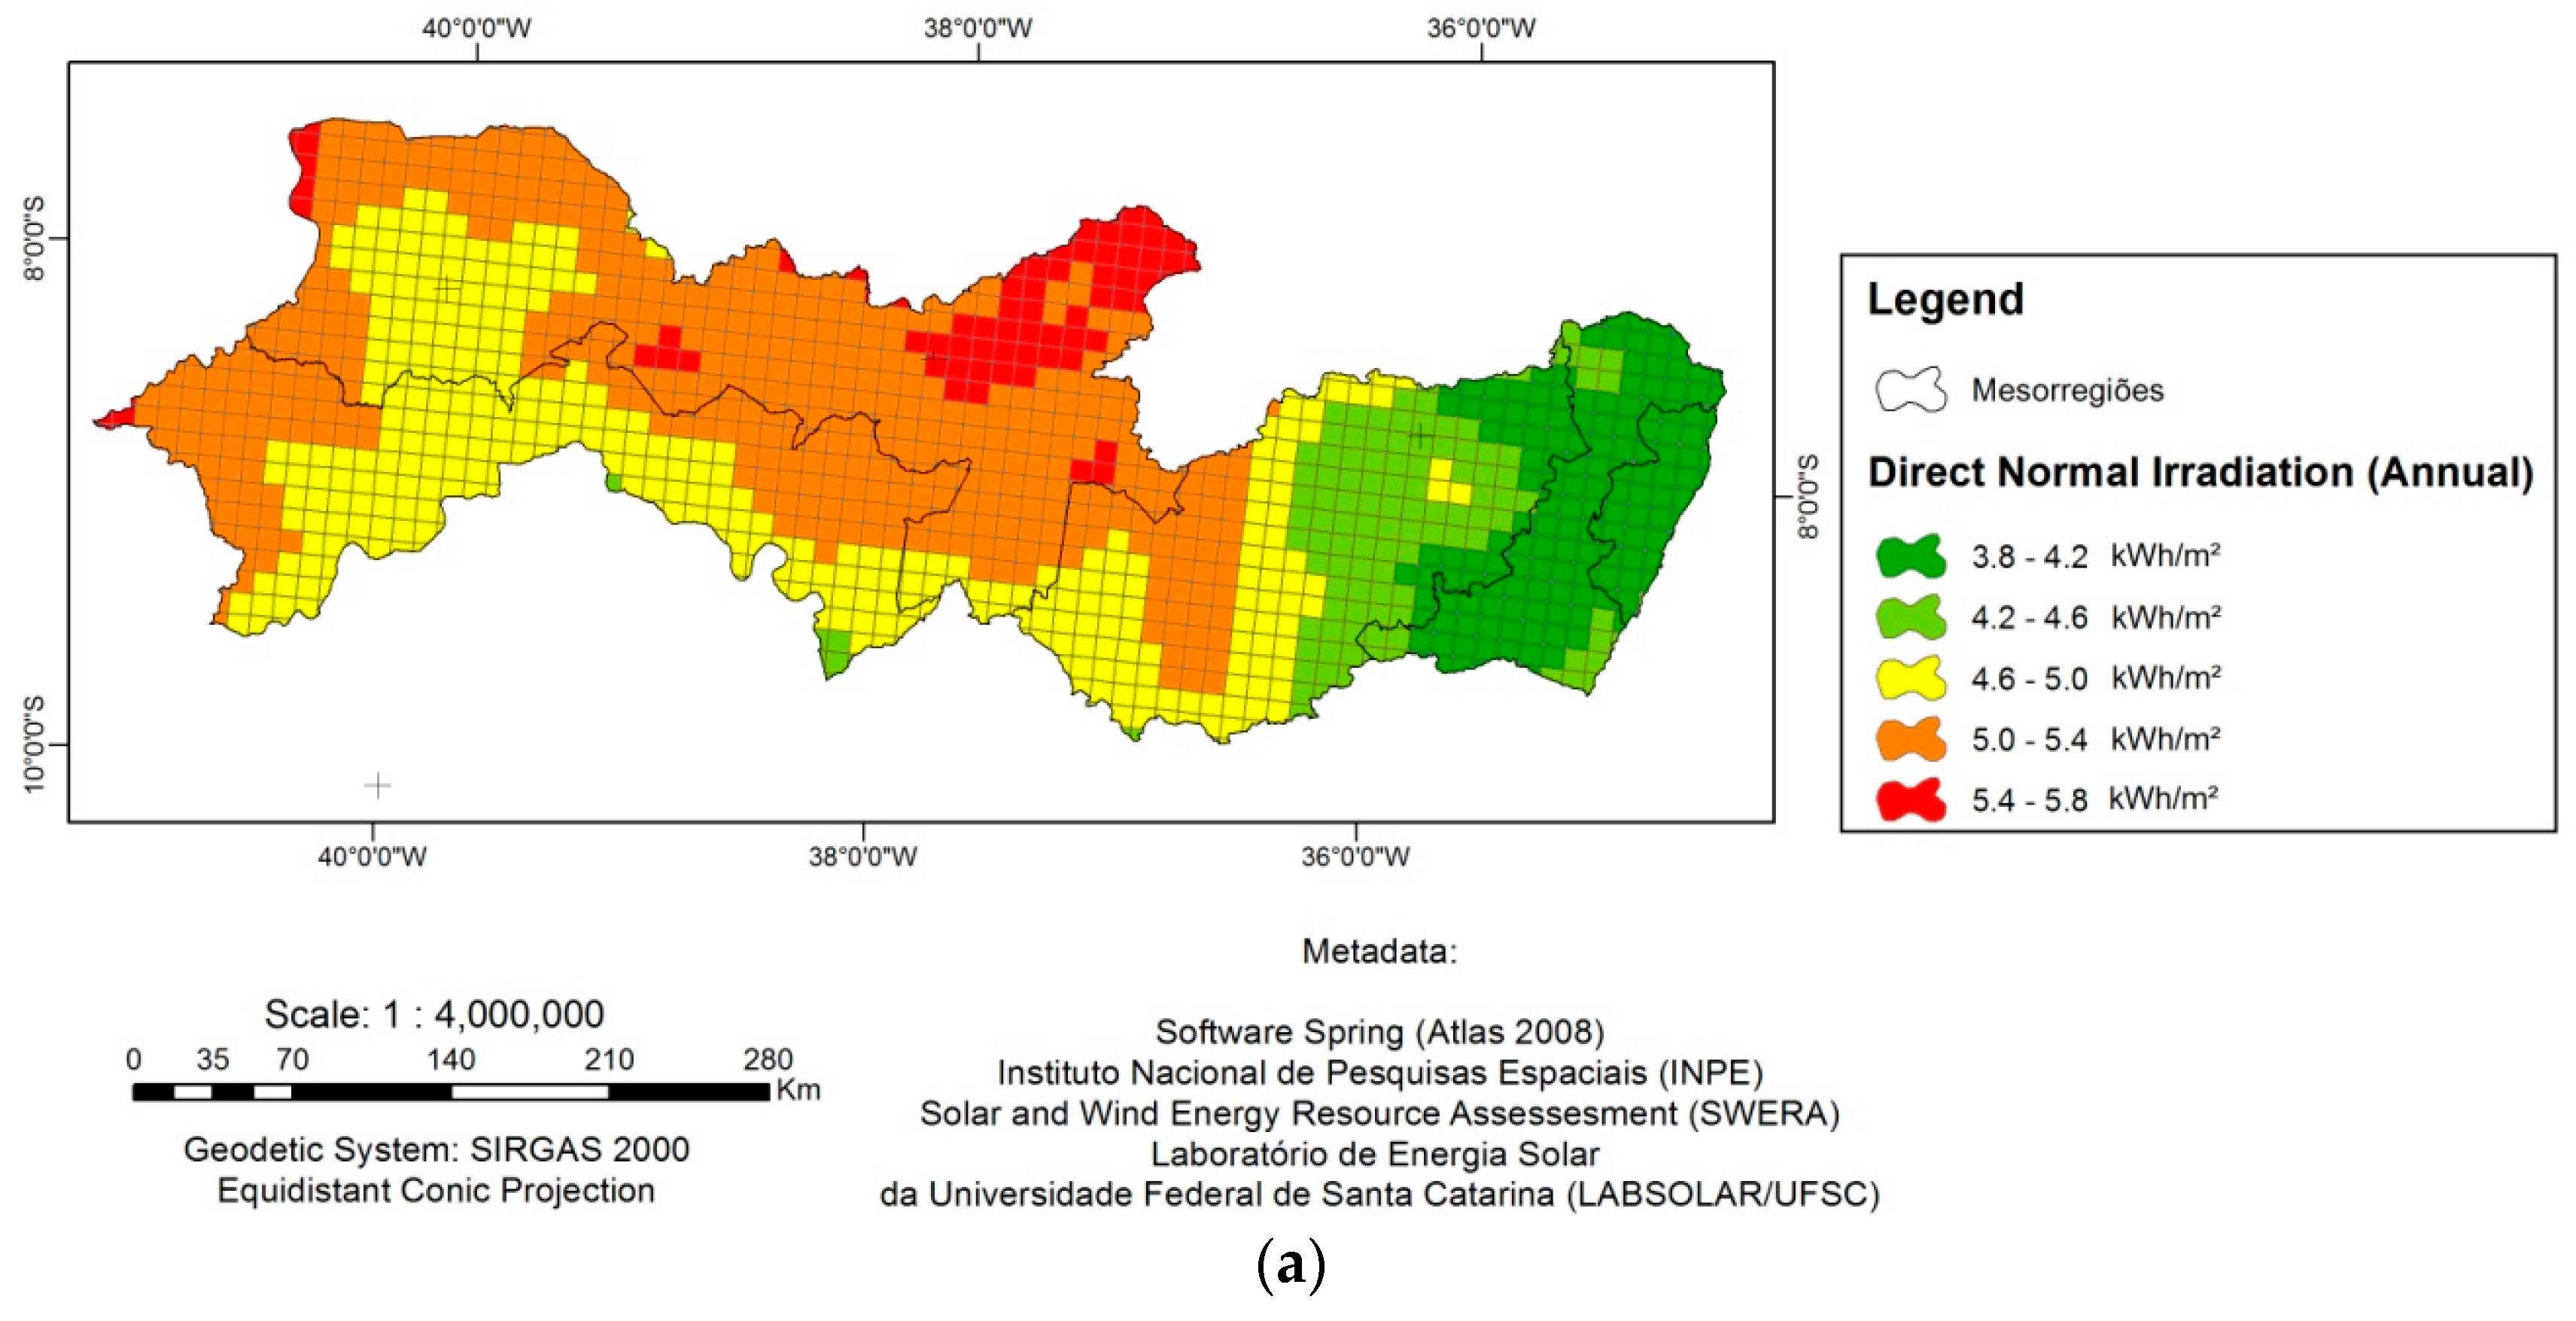
| Climatic | Direct Normal Irradiation | 3.8–4.2 kWh/m²·day 4.2–4.6 kWh/m²·day 4.6–5.0 kWh/m²·day 5.0–5.4 kWh/m²·day 5.4–5.8 kWh/m²·day |
| Topographic | Slope | 0–2% 2–4% 4–5% >5% |
| Environmental | Use of Soil | Regular Agricultural Potential Regular to Restrict Agricultural Potential Restrict Agricultural Potential Restrict to Unfavorable Agricultural Potential Unfavorable Agricultural Potential |
| Location | Distance to the Power Lines | 0–6.8 km 6.8–15.7 km 15.7–26.6 km 26.6–40.9 km 40.9–64.7 km |
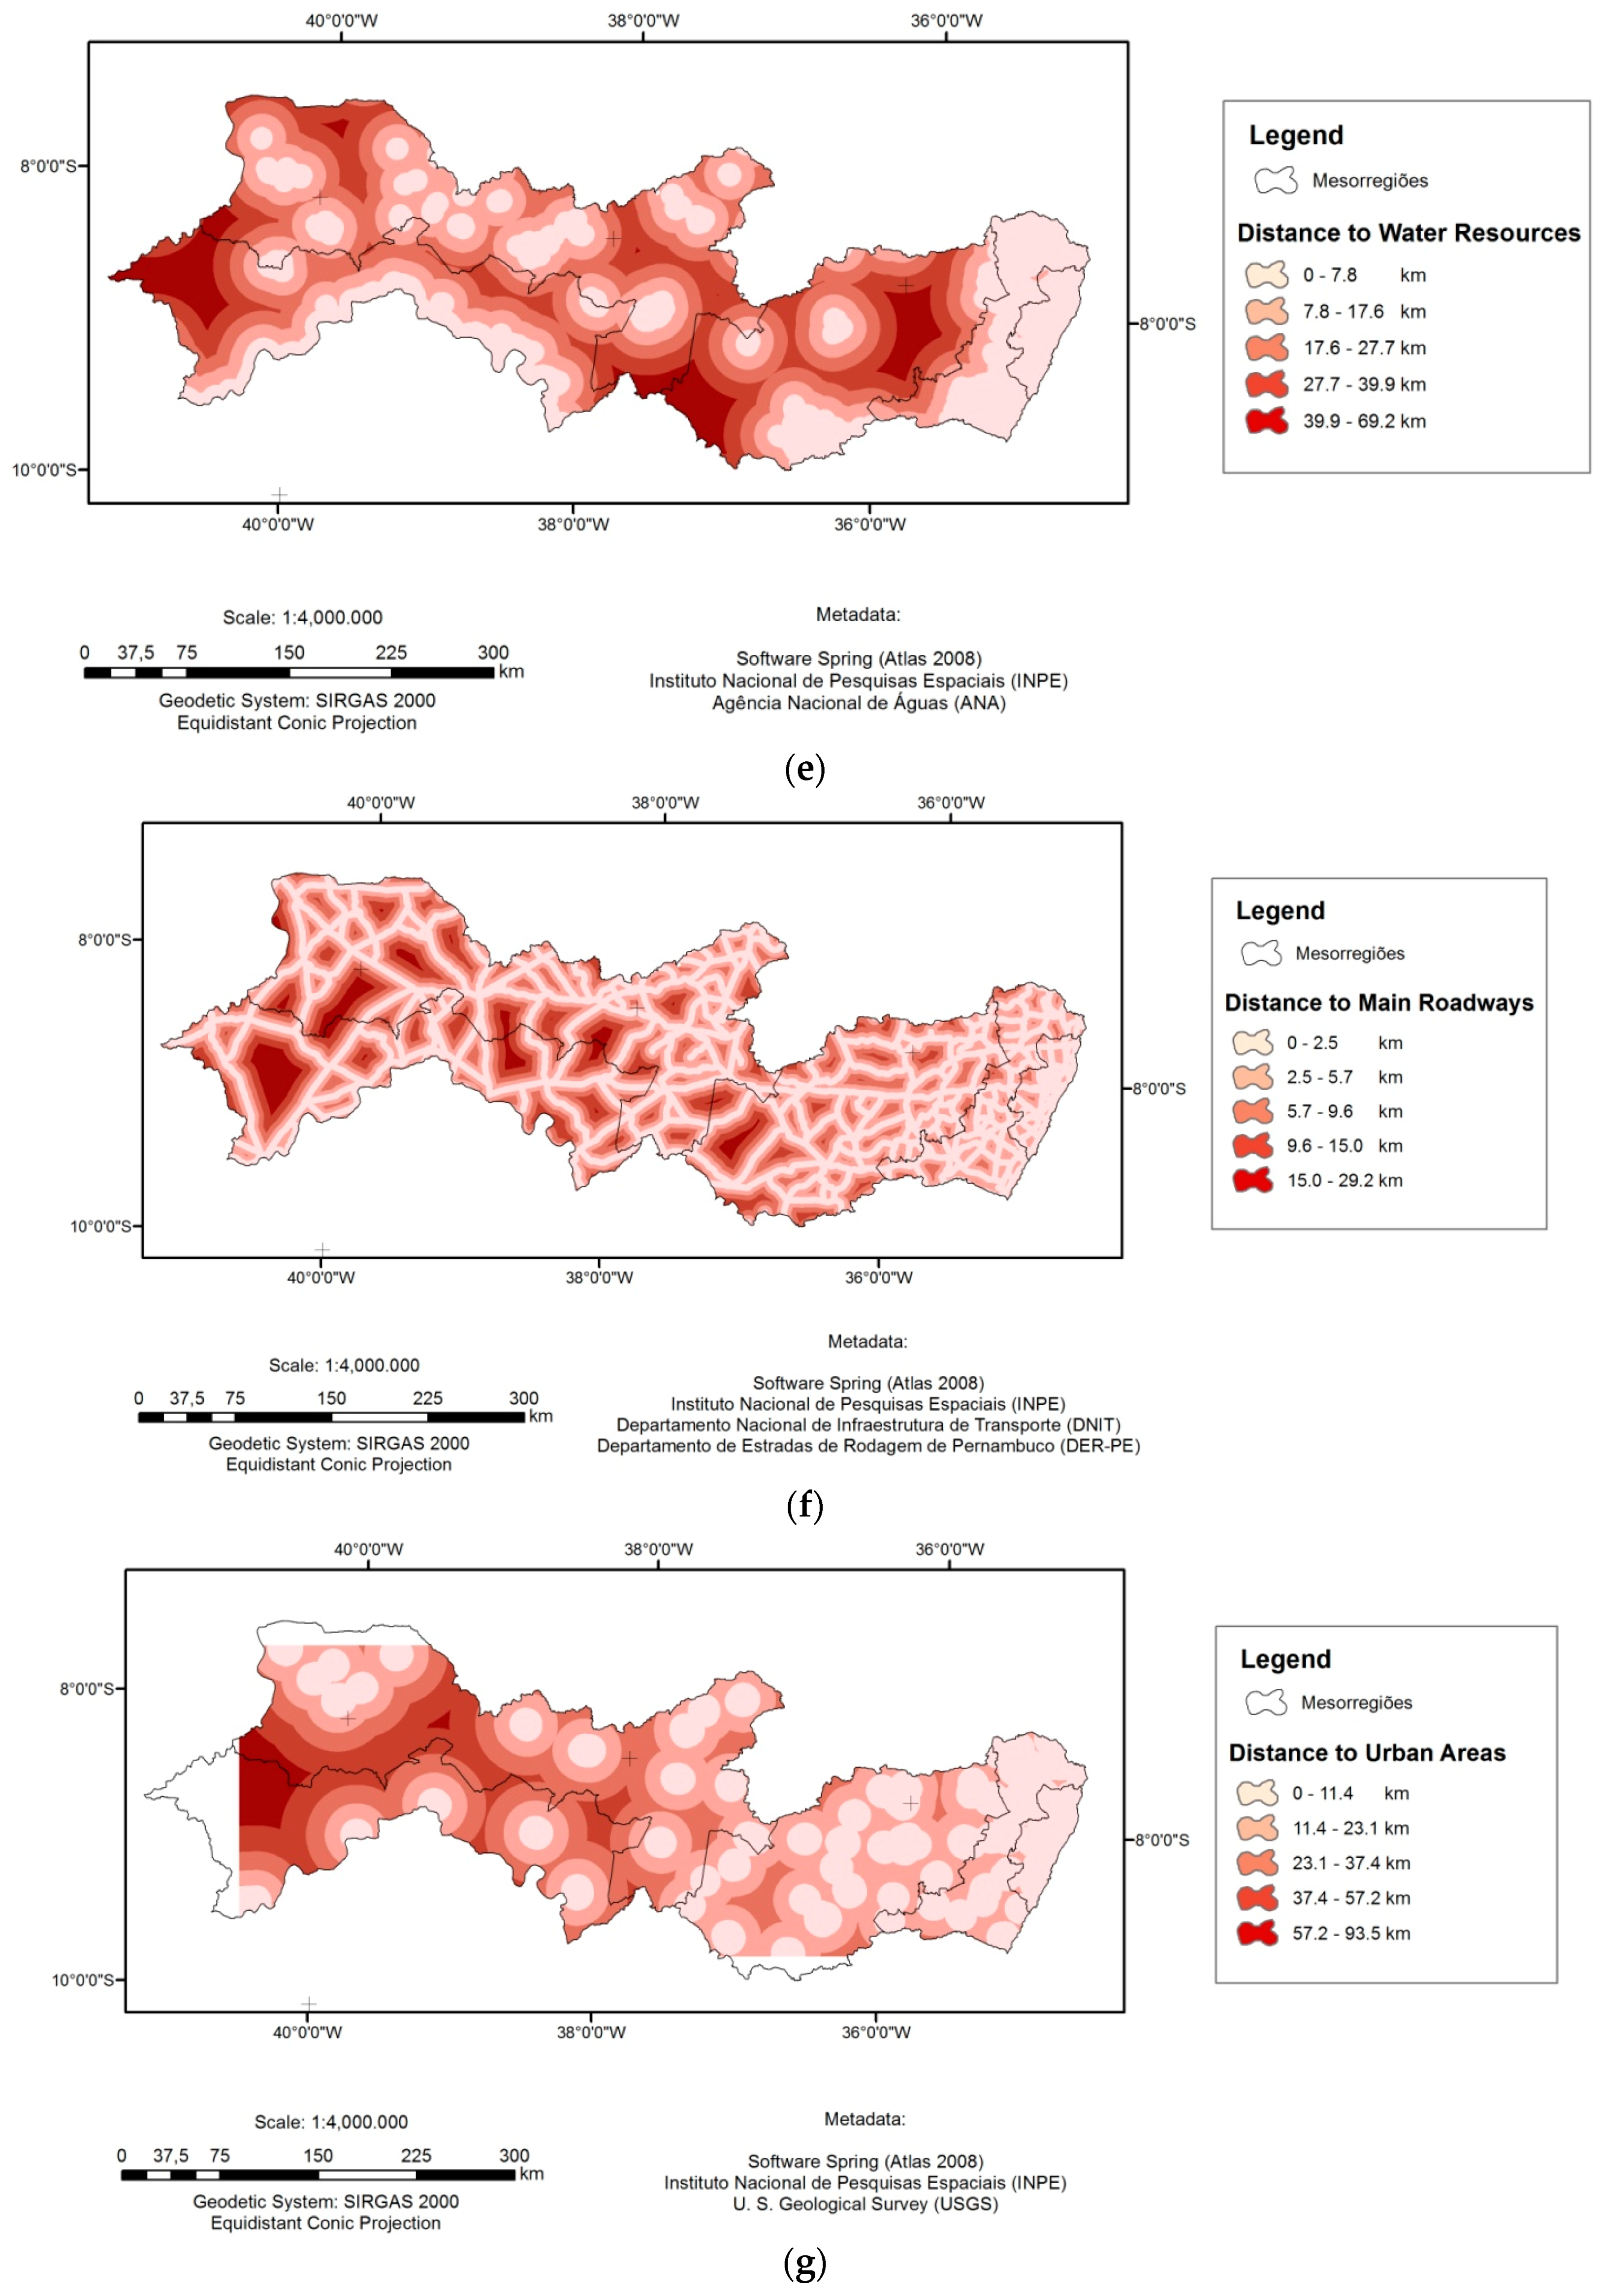
| Distance to the Water Resources | 0–7.8 km 7.8–17.6 km 17.6–27.7 km 27.7–39.9 km 39.9–69.2 km | |
| Distance to the Main Roads | 0–2.5 km 2.5–5.7 km 5.7–9.6 km 9.6–15.0 km 15.0–29.2 km | |
| Distance to Urban Areas | 0–11.4 km 11.4–23.1 km 23.1–37.4 km 37.4–57.2 km 57.2–93.5 km |
| Criteria | Sub-Criteria | Restriction |
|---|---|---|
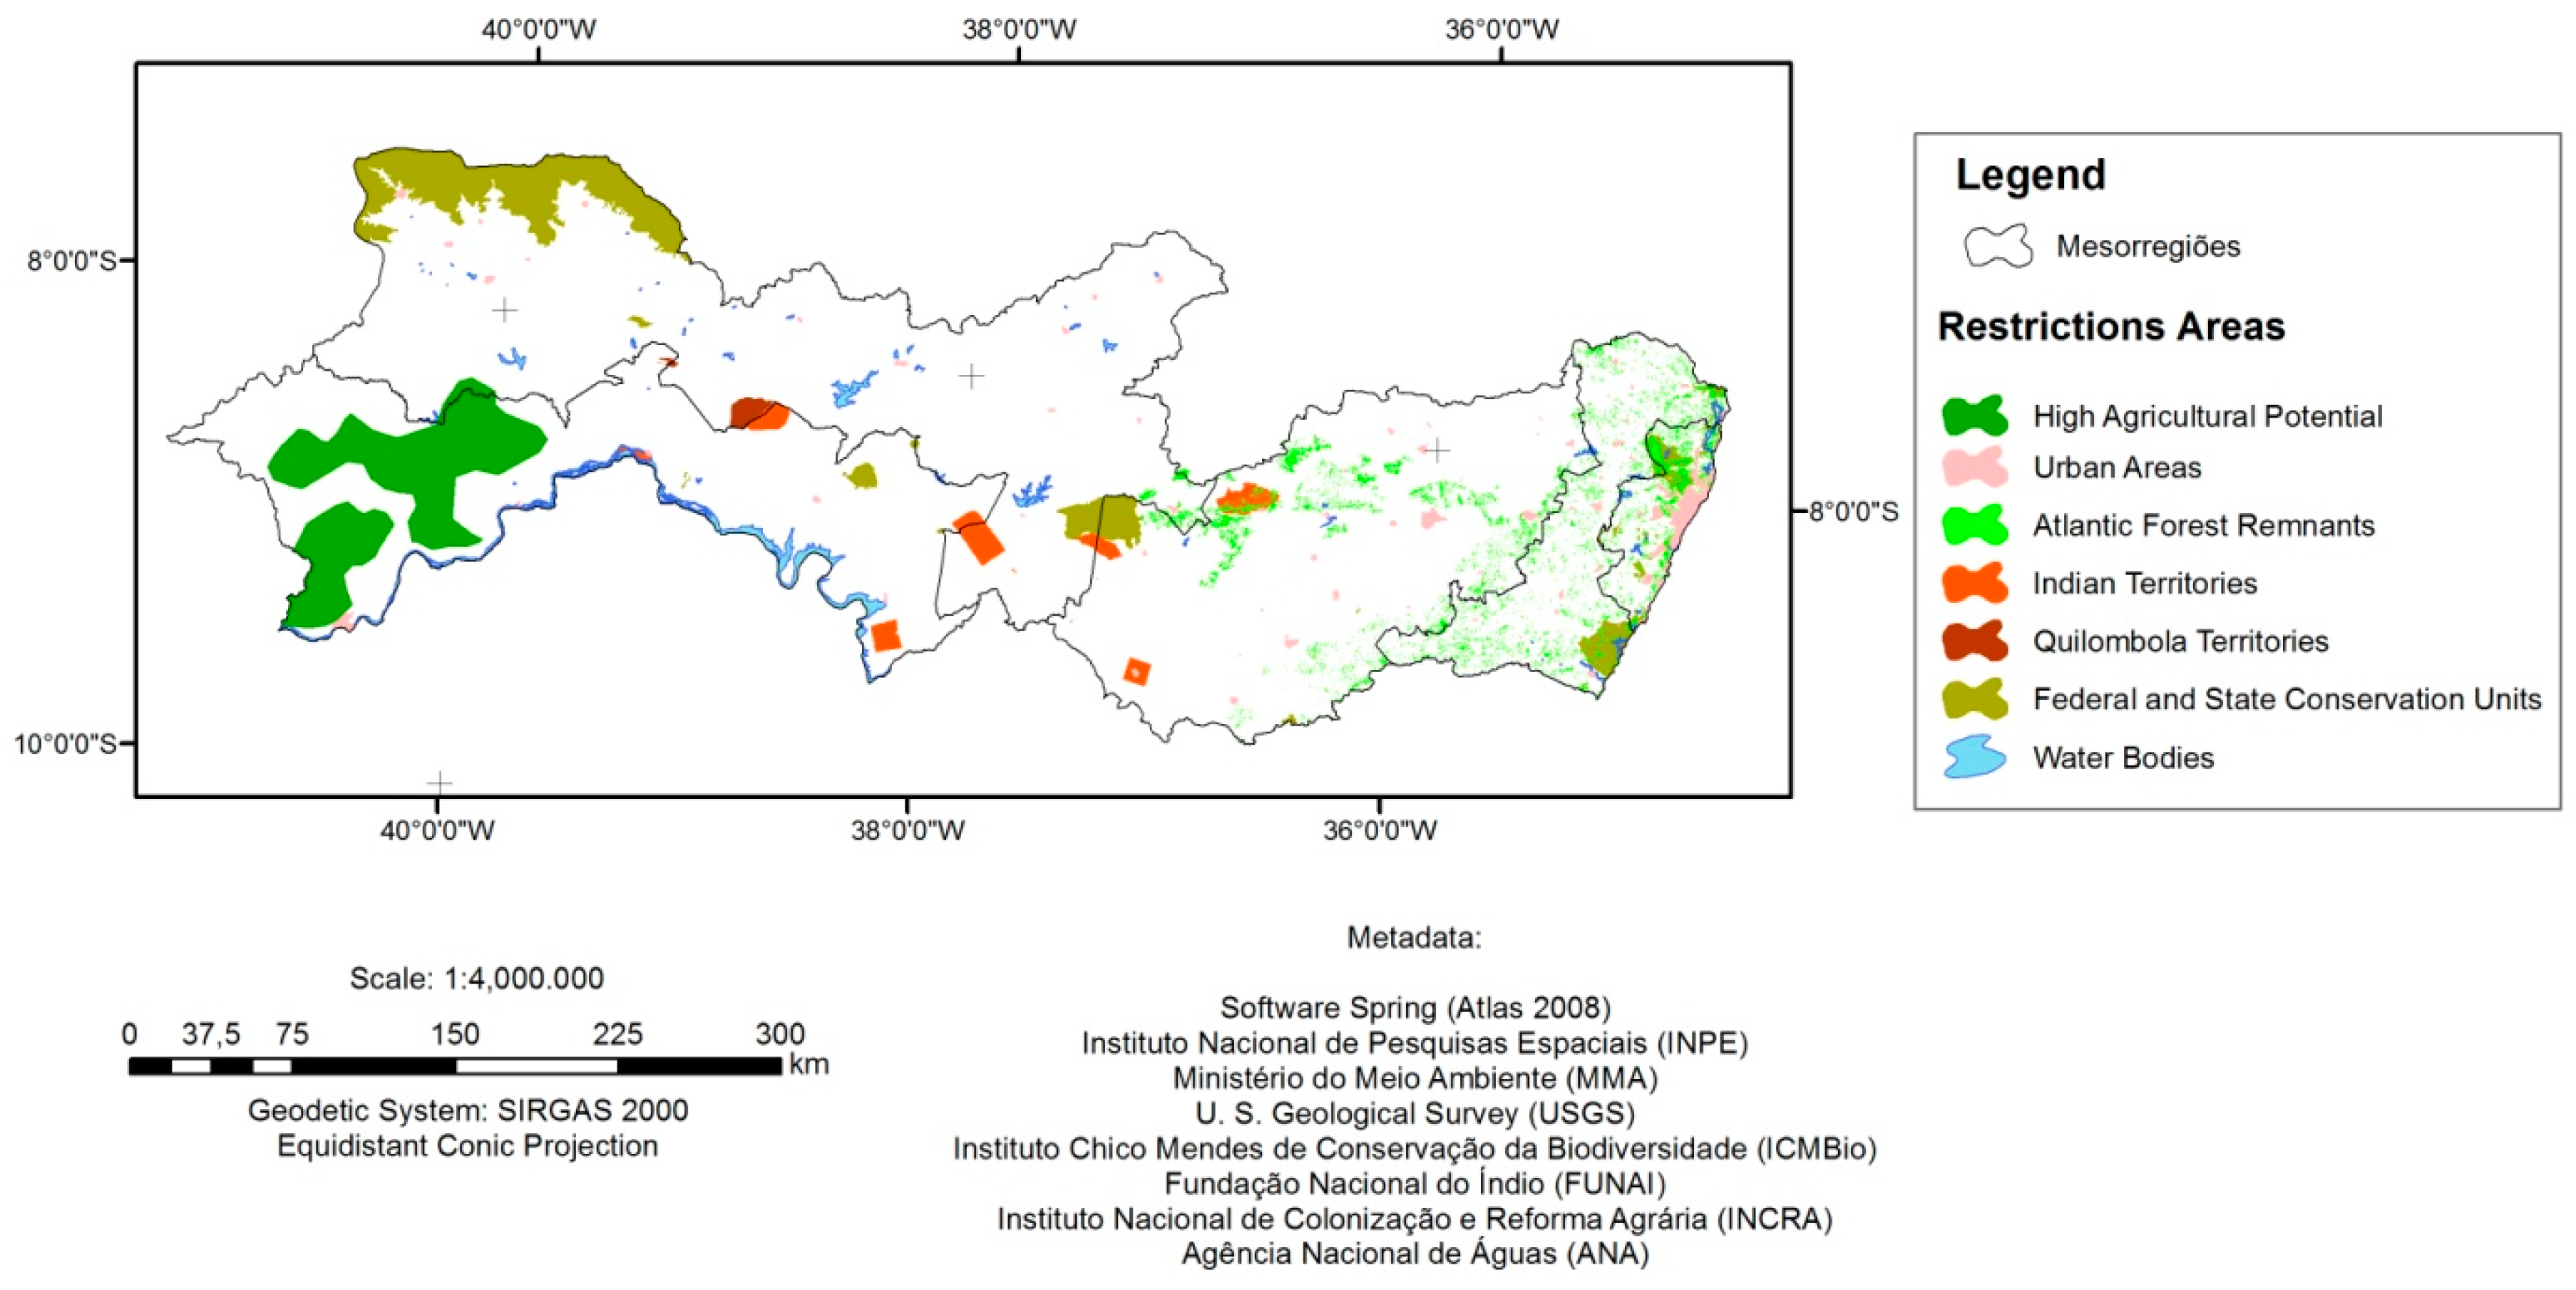
| Environmental | Use of Soil | Conservation Units Remnant of the Atlantic Forest Indigenous Territories Quilombo Territories High Agricultural Potential Areas Urban and Urban Expansion Areas Water Bodies |
| Scenario | Decision Rule | ||
|---|---|---|---|
| Scenario 1 | Order of Importance |  | Climatic Topographic Environmental Location |
| Scenario 2 | Order of Importance | | Climatic Location Topographic Environmental |
| Scenario 3 | Order of Importance | | Environmental Climatic Topographic Location |
| Scenario | Estimated Weights (%) |
|---|---|
| Scenario 1 | Climatic (46%) Topographic (29%) Environmental (16%) Located (9%) |
| Scenario 2 | Climatic (46%) Located (31%) Topographic (16%) Environmental (7%) |
| Scenario 3 | Environmental (46%) Climatic (27%) Topographic (18%) Located (9%) |
| Scenario | λmax | CI | CR |
|---|---|---|---|
| Scenario 1 | 4.045870784 | 0.015290261 | 0.016989179 |
| Scenario 2 | 4.108684635 | 0.036228212 | 0.040253569 |
| Scenario 3 | 4.088439432 | 0.029479811 | 0.032755345 |
| Scenario | Sub-Criteria Weights (%) | λmax | CI | CR |
|---|---|---|---|---|
| Scenario 1 | Solar Radiation (42%) Slope (26%) Use of Soil (18%) Dist. to Power Lines (5%) Dist. to Water Resources (4%) Dist. to Main Roads (3%) Dist. to Urban Area (2%) | 7.12523894 | 0.020873158 | 0.015812998 |
| Scenario 2 | Solar Radiation (47%) Dist. to Power Lines (14%) Dist. to Water Resources (13%) Dist. to Main Roads (10%) Dist. to Urban Area (9%) Slope (4%) Use of Soil (3%) | 7.21056631 | 0.035009438 | 0.026586656 |
| Scenario 3 | Use of Soil (40%) Solar Radiation (22%) Slope (20%) Dist. to Power Lines (7%) Dist. to Water Resources (5%) Dist. to Main Roads (4%) Dist. to Urban Area (2%) | 7.05681448 | 0.009469081 | 0.007173547 |
© 2017 by the authors. Licensee MDPI, Basel, Switzerland. This article is an open access article distributed under the terms and conditions of the Creative Commons Attribution (CC BY) license (http://creativecommons.org/licenses/by/4.0/).
Share and Cite
Azevêdo, V.W.B.; Candeias, A.L.B.; Tiba, C. Location Study of Solar Thermal Power Plant in the State of Pernambuco Using Geoprocessing Technologies and Multiple-Criteria Analysis. Energies 2017, 10, 1042. https://doi.org/10.3390/en10071042
Azevêdo VWB, Candeias ALB, Tiba C. Location Study of Solar Thermal Power Plant in the State of Pernambuco Using Geoprocessing Technologies and Multiple-Criteria Analysis. Energies. 2017; 10(7):1042. https://doi.org/10.3390/en10071042
Chicago/Turabian StyleAzevêdo, Verônica Wilma B., Ana Lúcia B. Candeias, and Chigueru Tiba. 2017. "Location Study of Solar Thermal Power Plant in the State of Pernambuco Using Geoprocessing Technologies and Multiple-Criteria Analysis" Energies 10, no. 7: 1042. https://doi.org/10.3390/en10071042