A Robust Battery Grouping Method Based on a Characteristic Distribution Model


1
Department of Electronics and Information, Hangzhou Dianzi University, 2nd Street, Xiasha Higher Education Zone, Hangzhou 310018, China
2
Departmant of Electric and Computer Engineering, Wayne State University, 5050 Anthony Wayne Drive, Detroit, MI 48202, USA
*
Author to whom correspondence should be addressed.
Energies 2017, 10(7), 1035; https://doi.org/10.3390/en10071035
Submission received: 17 May 2017
/
Revised: 10 July 2017
/
Accepted: 12 July 2017
/
Published: 19 July 2017
Abstract
:The inconsistent characteristics of individual power batteries in a battery pack can seriously affect the performance and service life of the whole pack. Battery grouping is an effective approach for dealing with the inconsistency problem by grouping batteries with similar characteristics in the same battery pack. In actual production, the battery grouping process still relies on the traditional manual method, which results in high labor and time costs. In this paper, a robust and effective battery grouping method based on the characteristic distribution model is developed. Specifically, a novel characteristic distribution model is proposed to determine the grouping priority of different batteries. Then, an improved k-nearest-neighbor algorithm is used to decide which batteries should be group into the same battery pack. Experimental results demonstrate the effectiveness of the proposed method.
1. Introduction
To address our ever-increasing demands for energy and the urgent environmental impact issues caused by higher levels of energy production, one of the most viable solutions is to electrify vehicles for improved fuel efficiency and reduced emissions, and to implement clean, renewable energy systems for electricity generation on a large scale with high penetration [1,2,3]. Batteries are one of the most critical enabling technologies for accomplishing clean, efficient and sustainable energy development in transportation and power sectors. The small capacity and low voltage of a single battery cell cannot meet the needs of an electric vehicle and other battery storage applications. Thus, a pack of battery cells are grouped together to form a battery module or pack to provide enough power and energy storage capacity for certain applications [4]. For example, electric bicycles usually require four or five 12 V/10 Ah lead–acid batteries to construct a battery pack. However, due to the limitations of the production process, different batteries have inconsistent characteristics. Because of the inconsistent characteristics, some of the batteries in a battery pack can be over-charged or over-discharged while some other some batteries in the pack are not fully utilized. This can seriously affect the performance and service life of the whole battery pack [5,6,7]. Moreover, the inconsistency of the batteries will also cause more difficulties in monitoring and management of the state of the battery pack [8].
The variations in raw materials and manufacturing processes are the main reasons for the parameter inconsistency [9]. To solve the inconsistency problem, battery manufacturers should improve the consistency and quality of the battery materials as well as the manufacturing processes of batteries. However, it can take a long time to improve the consistency of battery materials or optimize the manufacturing processes and normally it is an expensive process. By comparison, battery grouping is a more effective approach for handling the inconsistency problem as it groups the batteries with close characteristics in the same battery pack.
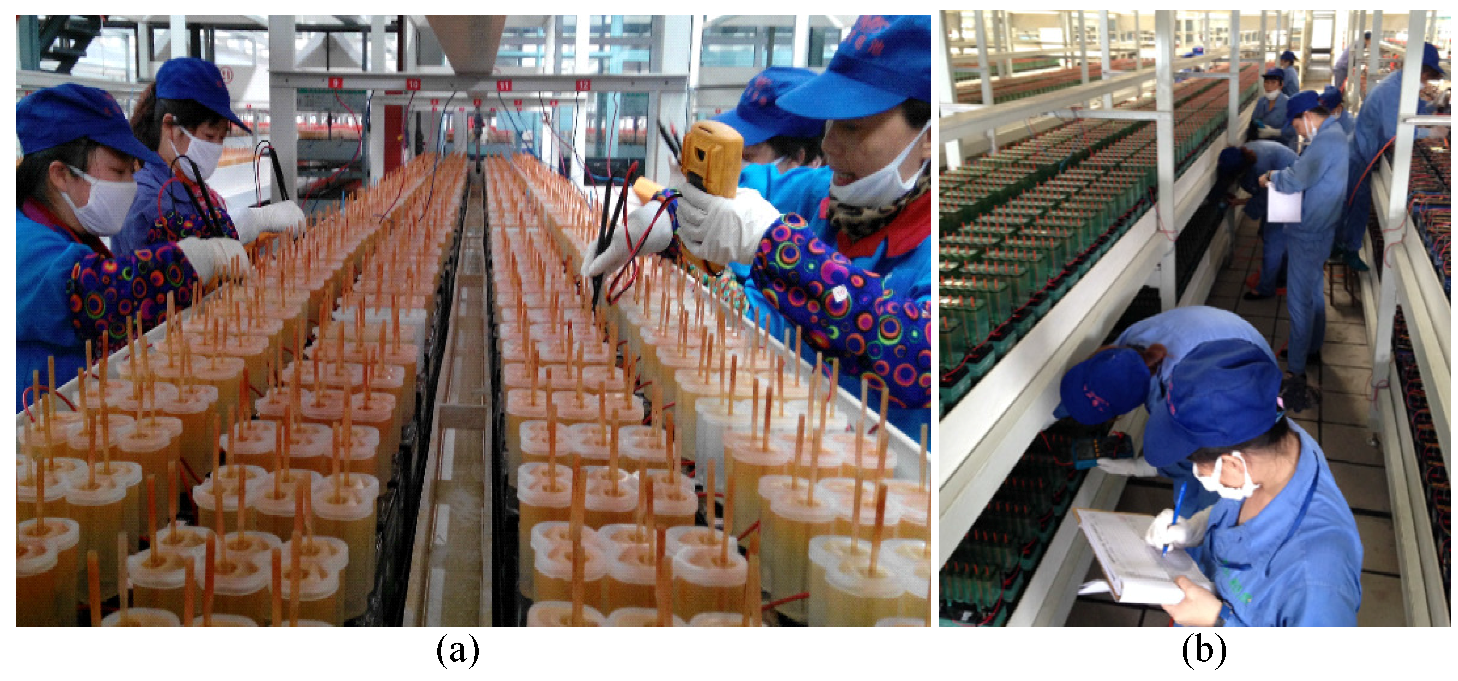
For practical battery production, the battery grouping process still relies on the traditional manual grouping method based on several measured voltages. This manual grouping method is labor-intensive and cost ineffective, as shown in Figure 1. Besides, limited by the human errors, the manual grouping method is prone to false groupings. In the past few years, with the rapid development of automation technology, more and more factories have applied automation technology to replace the traditional manual method for higher efficiency and lower costs [10,11].
For battery grouping, battery cells should firstly be characterized before the battery grouping process. Internal resistance is widely considered characteristic of building battery packs [12]. However, it is difficult to measure internal resistance accurately. The discharging curves [13] can well reflect the capacity and characteristic of the lead–acid battery. As the important parameters of the discharging curves, the charge static voltage and discharge termination voltage [14] are widely applied for battery grouping in major lead–acid battery manufacturers of China as shown in Figure 1a. However, these two voltages alone do not fully characterize batteries.
In this paper, the complete discharging curves are automatically measured and used as characteristics to complete the grouping process. Moreover, a robust battery grouping method based on the characteristic distribution model is proposed and implemented in the host computer to achieve better battery grouping. Based on the proposed method, the cells with the most similar characteristics will be grouped in the same pack. The experimental results verify that the proposed grouping method can achieve superior performance over other state-of-the-art clustering solutions. Furthermore, the proposed method can also be extended for grouping other types of battery such as lithium ion battery cells.
The rest of the paper is organized as follows: The related work is reviewed in Section 2. The proposed grouping algorithms are described in Section 3. In Section 4, the experimental results are given to demonstrate the superiority of the proposed method. Finally, the conclusions are drawn in Section 5.
2. Related Work
Given the characteristics of different batteries, the goal of battery grouping is to group batteries with similar characteristics into the same battery pack. Researchers focus on solving this battery grouping by data clustering algorithms [15]. As an important form of data analysis technology, data clustering [16] has been applied to many areas, such as data mining [17], content retrieval [18,19] and image segmentation [20]. By clustering algorithms, data can be divided into different clusters based on some criteria, and data in the same cluster are similar to each other and dissimilar otherwise as a result. Traditional clustering algorithms, such as k-means and fuzzy c-means (FCM) perform well for convex data, but will fall into local optimization with non-convex data. Spectral clustering algorithms are a newly developed technique [21,22]. Unlike traditional clustering algorithms, spectral clustering methods apply spectral graph theory to solve the non-convex sphere of sample spaces, and can achieve a global optimal solution without any assumptions on the structure of data. Hence, spectral clustering has achieved outstanding performance in many areas [23,24,25] and become one of the hottest topics in clustering.
Nevertheless, for battery grouping it is required that each battery pack consists of a fixed number of batteries with similar characteristics. For example, if 200 batteries need to be grouped, and each battery pack consists of 4 batteries, then we have to classify these 200 batteries into 50 groups. Directly using clustering algorithms, we can divide the 200 batteries into several clusters, but there are not necessarily exactly 50 clusters with 4 batteries in each cluster. Hence, simply using a clustering algorithm does not solve the battery grouping problem. We still need to decide which four batteries should be grouped into the same pack.
In this paper, we propose a robust battery grouping method based on a characteristic distribution model. Specifically, a novel characteristic distribution model is proposed to determine the grouping priority of different batteries. Then, an improved k-nearest-neighbor algorithm is used to decide which batteries should be grouped into the same battery pack. Actual experiments have been carried out to verify the effectiveness of the proposed grouping method.
3. The Proposed Battery Grouping Method
3.1. The Discharging Characteristic Curve
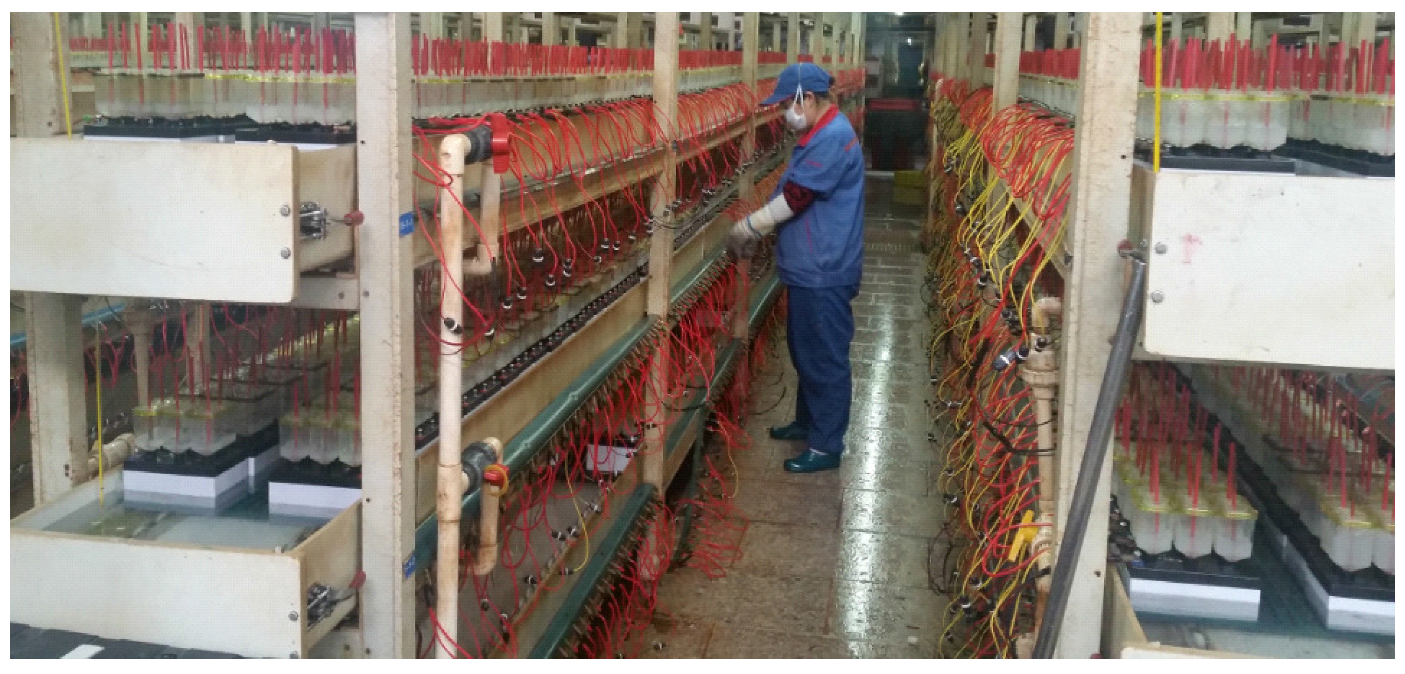
The discharging characteristic curve can well reflect the capacity and characteristic of lead–acid batteries. Taking into account the operability of the actual measurement, the charge static voltage and discharge termination voltage are widely applied for battery grouping in major lead–acid battery manufacturers in China. The charge static voltage is defined as the open circuit voltage of a fully charged battery after resting for over 24 h and the discharge termination voltage is defined as the open circuit voltage of the battery after a complete discharging procedure at a constant discharge current. As previously discussed, these two voltages do not convey all the characteristic information of the battery. In this paper, an automatic measuring device is designed to obtain the complete discharging curves of lead–acid batteries in a shelf. As shown in Figure 2, the discharge curves of 12 V lead–acid batteries on a shelf (200 batteries in each battery shelf) are automatically measured.
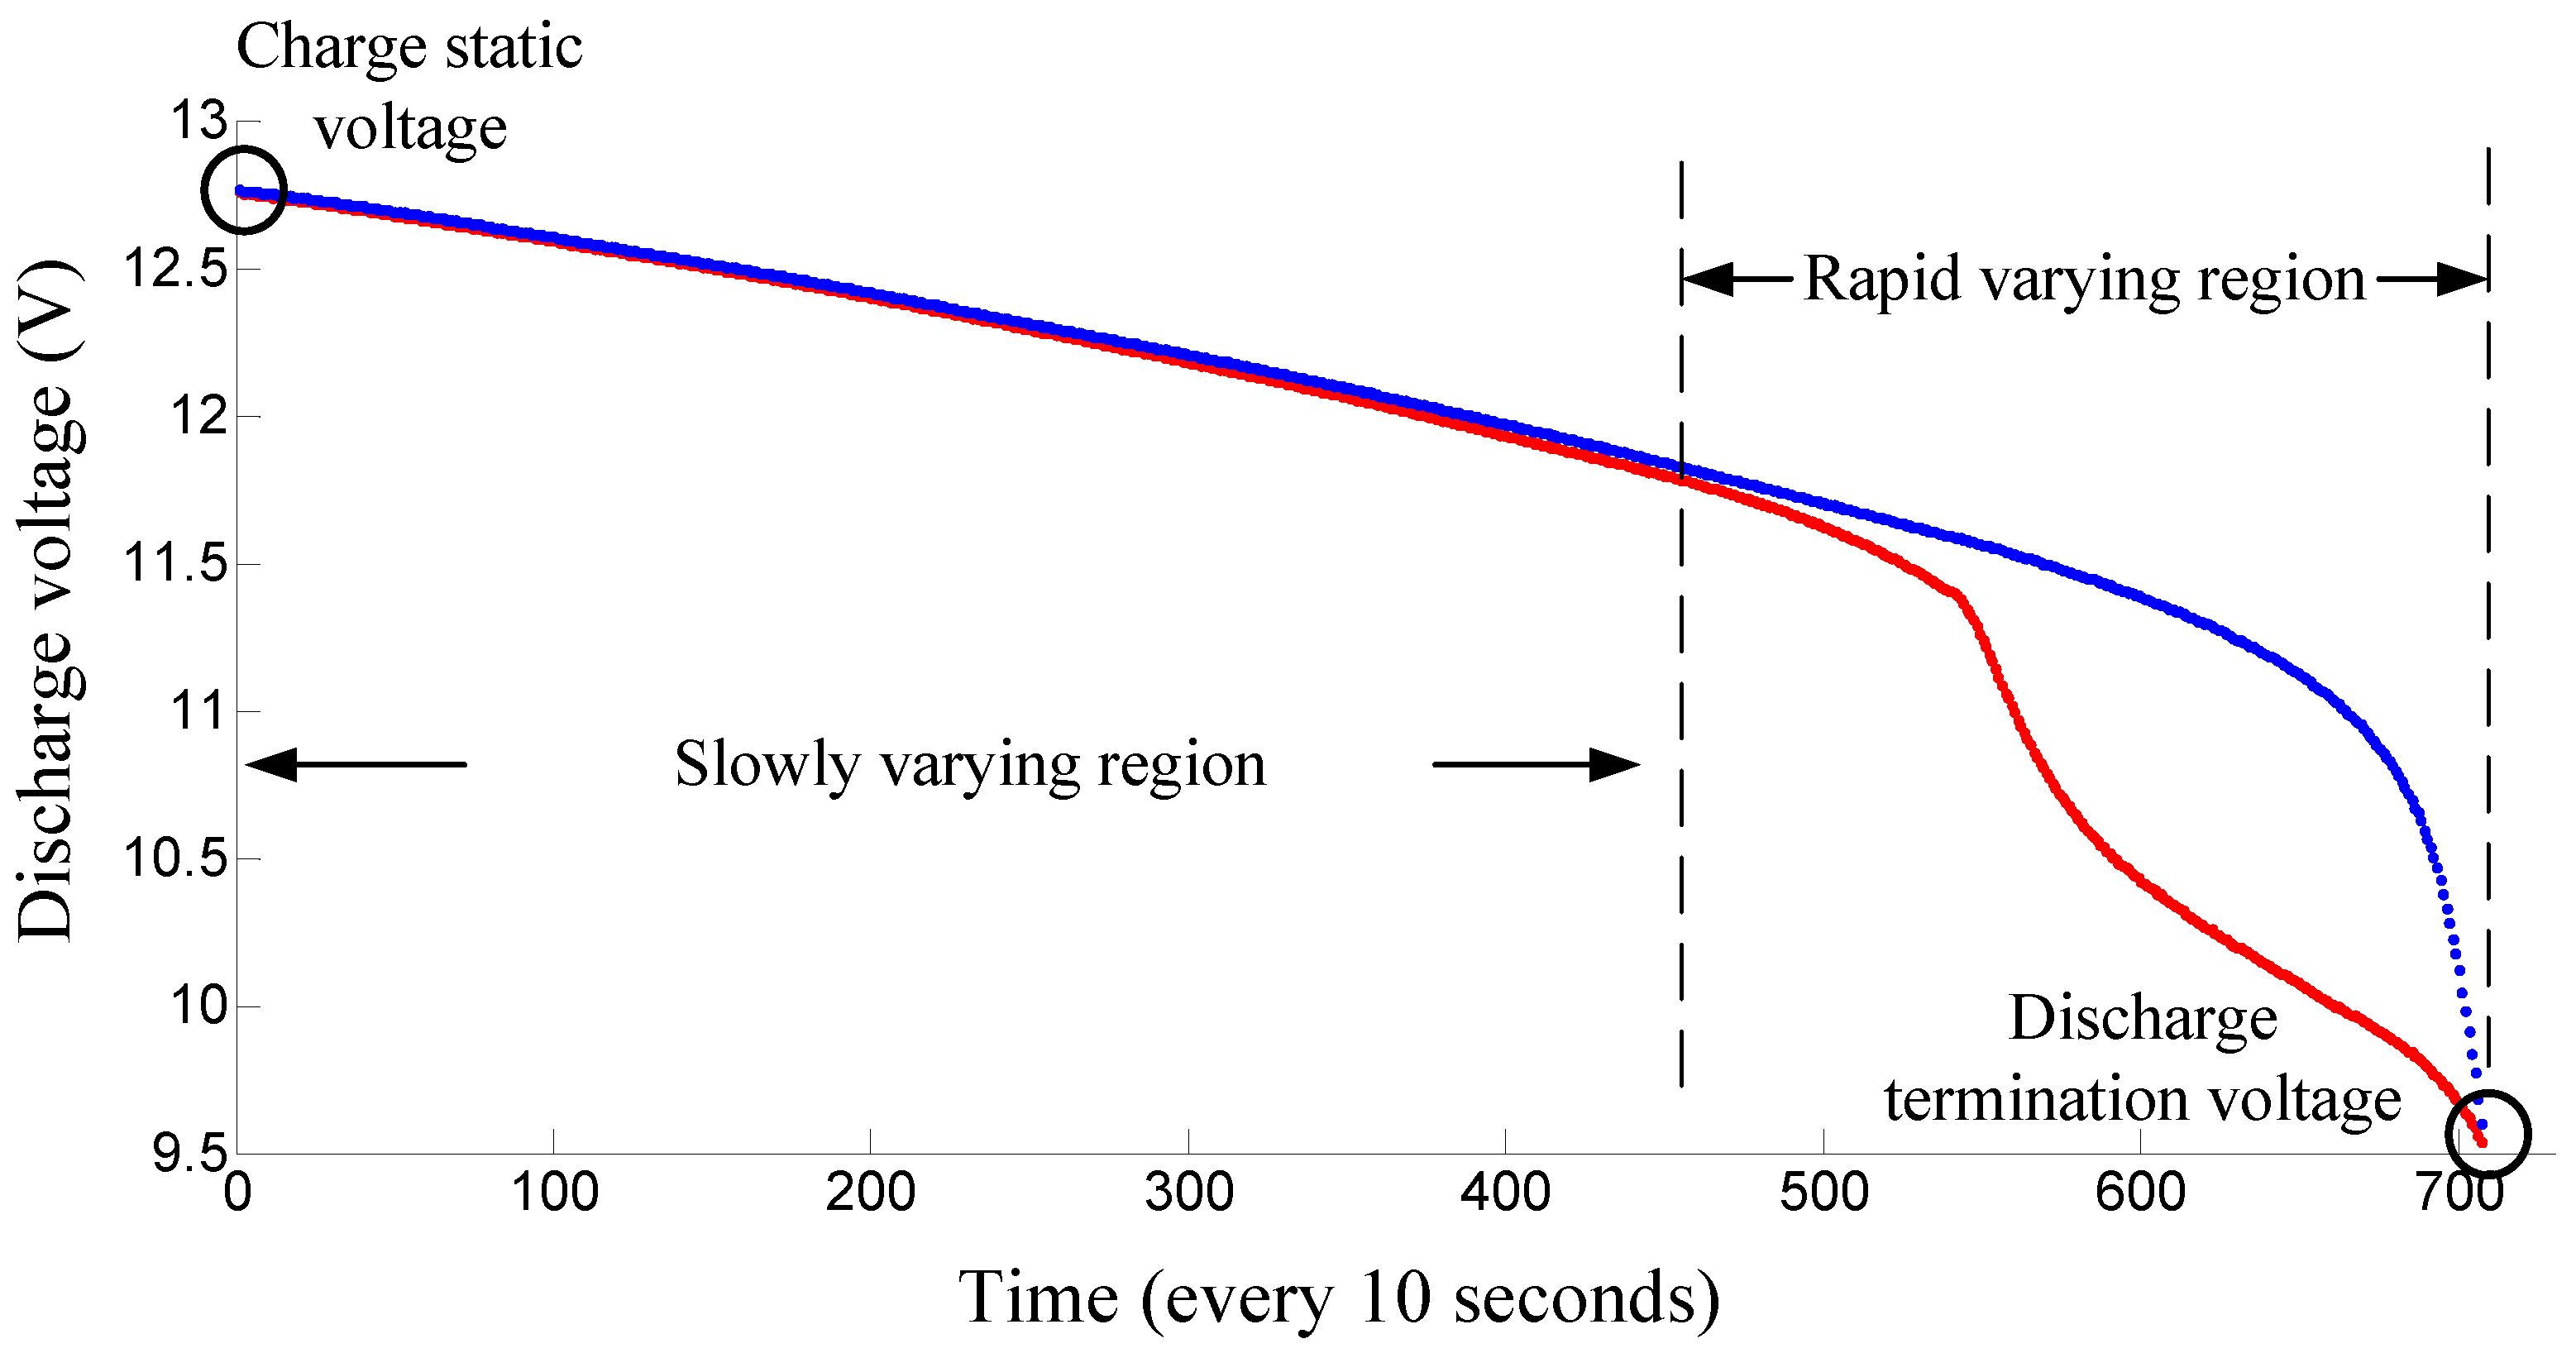
Firstly, the batteries are charged using a constant current (0.1 C) until it reaches the charging termination voltage 1.1, where is the nominal charging termination voltage. Let the battery rest for 24 h. Then, the battery is discharged with a constant current (0.1 C) until reaching a fixed discharge time. The voltages of the discharging batteries are measured and uploaded to the host computer every 10 s. The discharging curves can then be obtained, as shown in Figure 3.
Figure 3 shows these two batteries with similar discharge termination voltages and charge static voltages. Obviously, the discharge curves of these two batteries have big differences and these two batteries have very different characteristics. Therefore, they should not be grouped into the same pack. However, if just using discharge termination voltage and charge static voltage as the battery characteristics for grouping, these two batteries may be grouped into the same pack. Hence it is unsuitable to achieve battery grouping just using discharge termination voltage and charge static voltage. In this paper, more effective voltage features of the discharging curve are extracted to indicate the characteristics of the batteries. As shown in Figure 3, in the slowly-varying region, the voltage features are extracted with a large sampling interval. In the rapid-varying region, the voltage features are extracted with a small sampling interval. Then, the voltage feature vector is obtained and used for the grouping process.
3.2. Characteristic Distribution Model
In the grouping process, it is necessary to group batteries with similar characteristics into the same battery pack. Consider each pack consisting of m batteries (m is determined by the actual application). To reduce the battery manufacturing cost it is also necessary that as many battery cells as possible complete the grouping process. Hence, two objectives should be achieved in battery grouping:
- The batteries grouped into the pack should have more similar characteristics than the others and meet the characteristic consistency criterion.
- For a set of batteries to be grouped, the objective is to maximize the number of successful-grouping battery packs by making full use of the batteries with similar characteristics.
In this paper, the discharge curves of 12 V lead–acid batteries in each shelf are measured and each shelf has 200 batteries. The extracted voltage features of the discharge curve are then used as the battery characteristics to complete the grouping process.
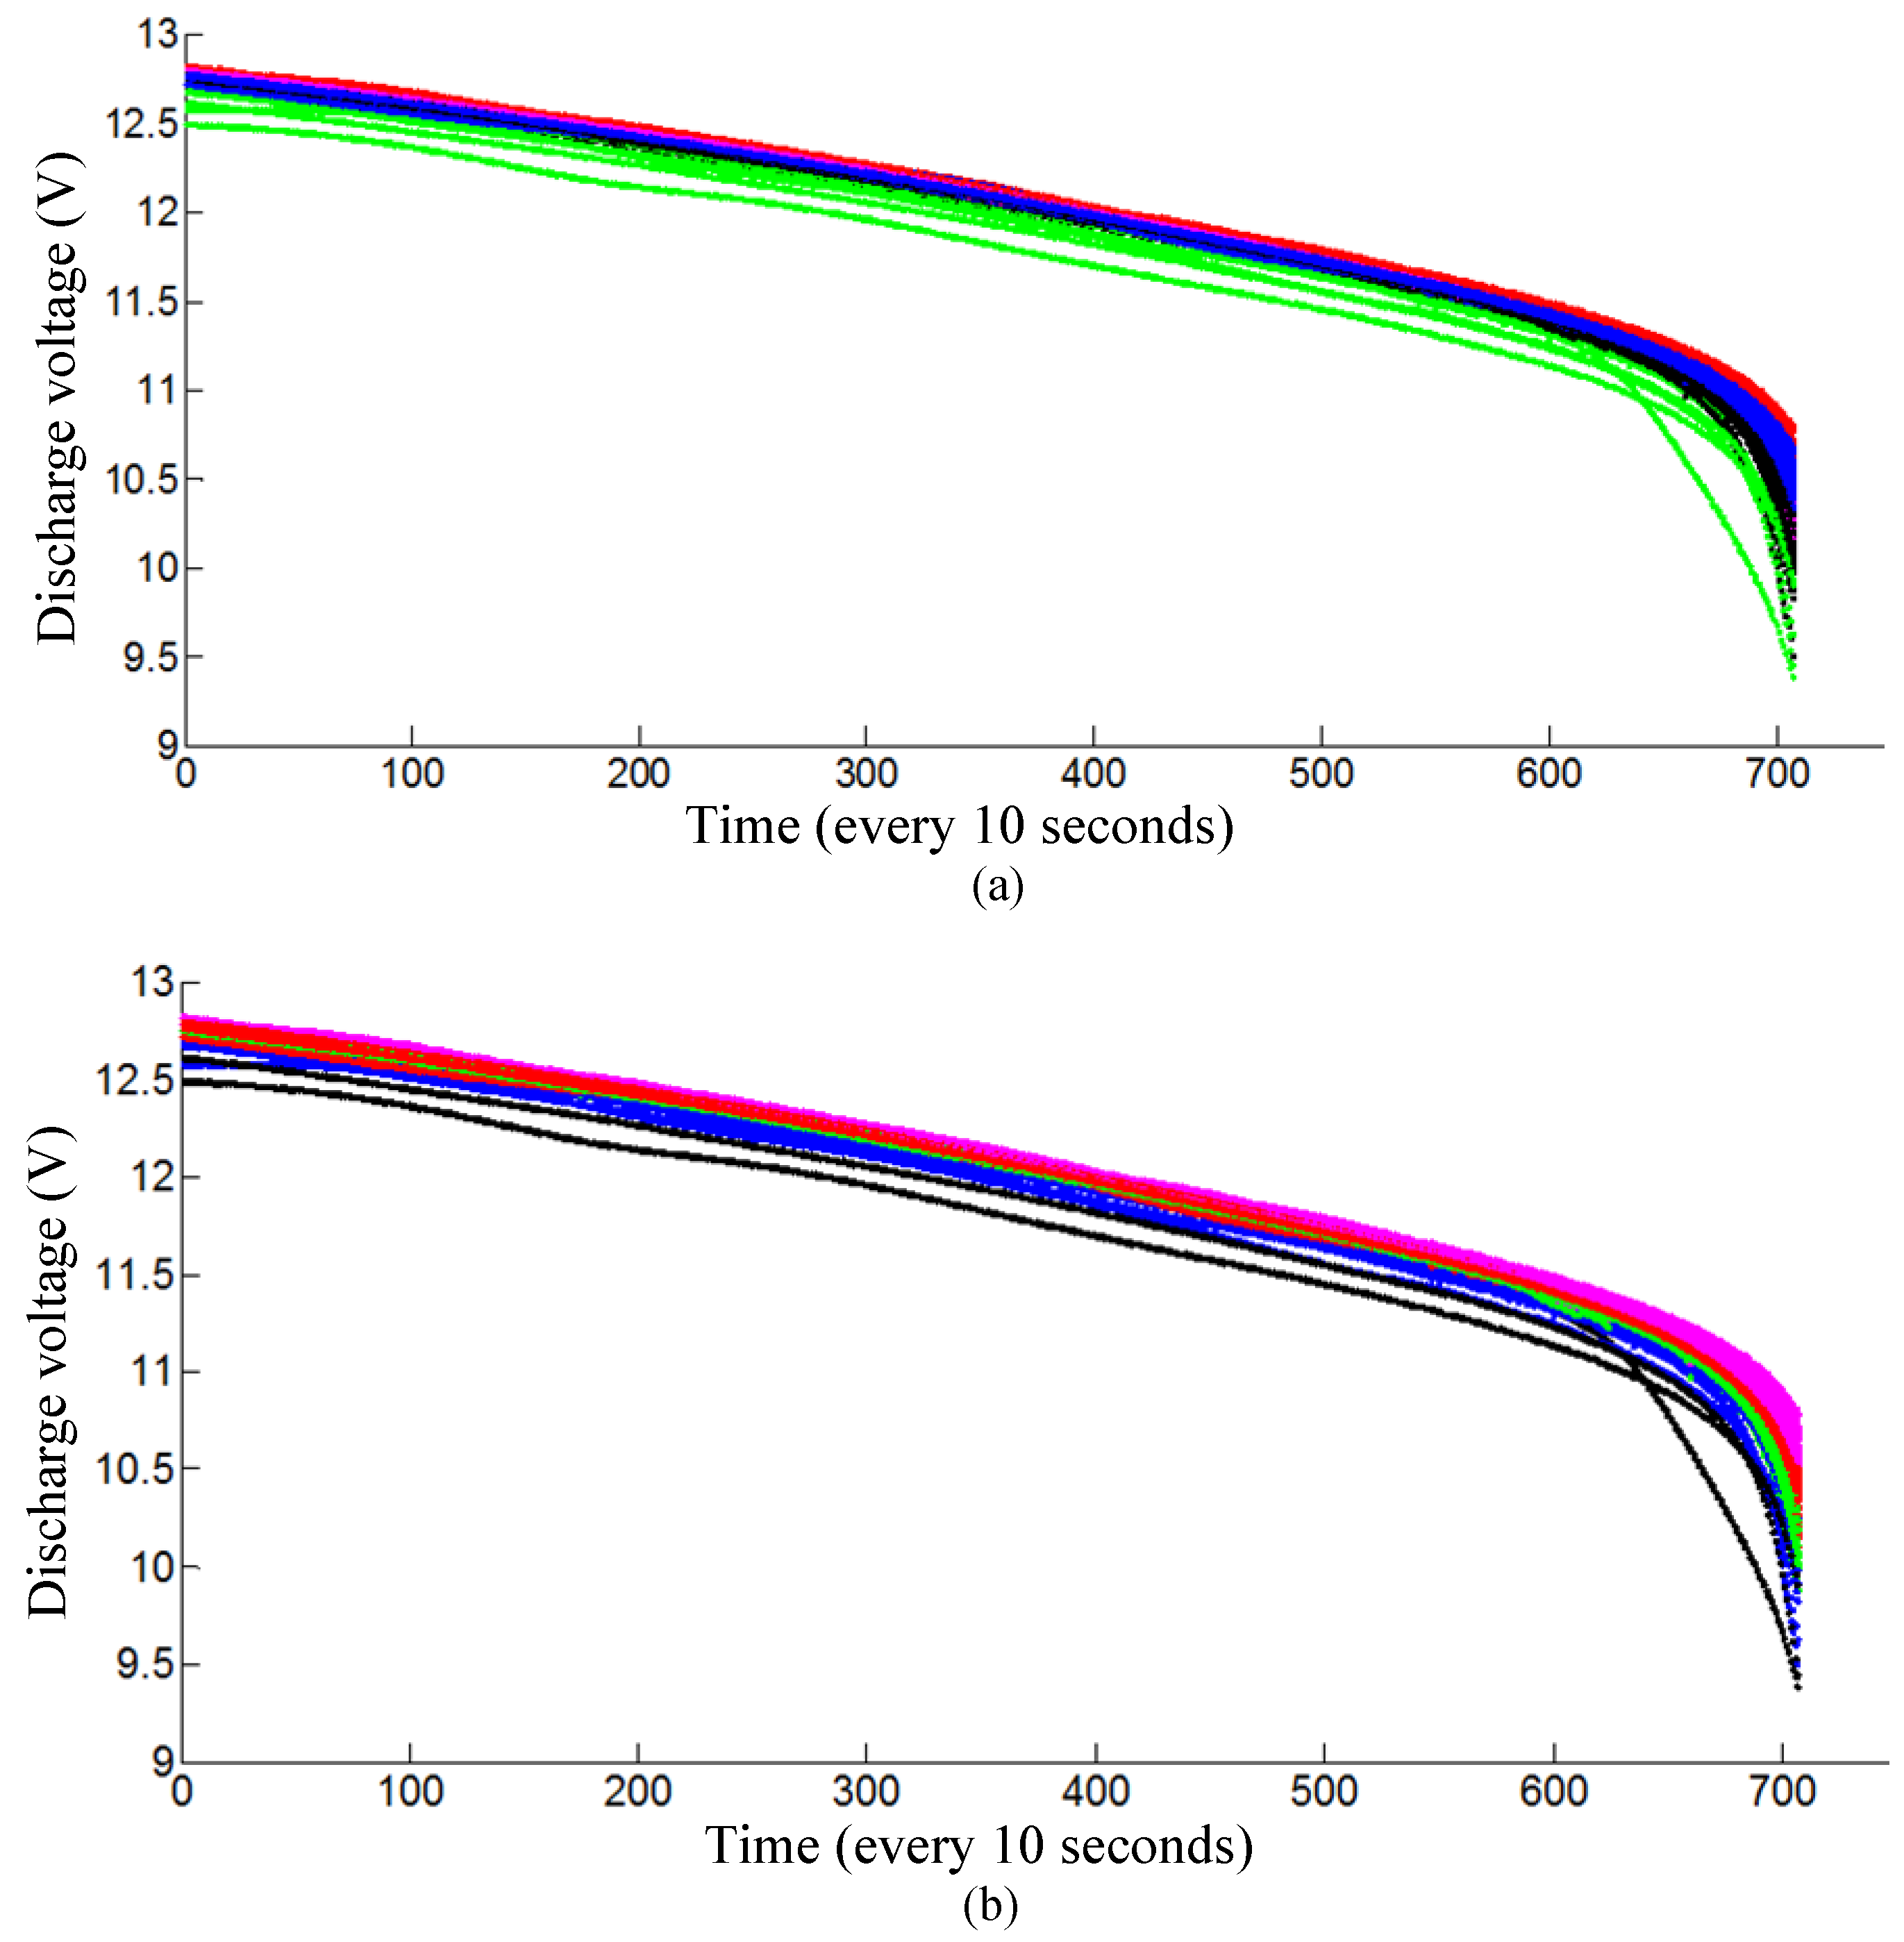
In general, traditional clustering algorithms are not suitable for this problem. Even if the batteries can be divided into several clusters using certain traditional clustering algorithms, it is still impossible to decide which m batteries should be grouped into the same pack. Firstly, the k-means algorithm [16], the most widely used clustering algorithm, is applied to solve this grouping problem. As shown in the Figure 4a, the curves of the batteries are divided into five clusters, but it is impossible to decide which m batteries should be grouped into the same pack. Then, another widely used clustering algorithm, the spectral clustering algorithm [21,24], is also applied. As shown in Figure 4b, batteries can also be divided into five clusters, but it is again still impossible to decide which m batteries should be grouped into the same pack.
To address the limitation of traditional clustering algorithms for battery grouping, we propose a novel battery grouping method based on a characteristic distribution model. Using the proposed algorithm, the process starts with the grouping of the batteries in a low density characteristic region. Eventually the batteries with similar characteristics will be grouped together and as many batteries as possible will complete the grouping process. The proposed distribution model is described in detail as follows:
Let denote the measured characteristics (discharge voltages) of the batteries in one shelf. The characteristic distribution density of a battery i is defined as follows:
where are the distances between battery i and its k-nearest neighbors (). m is the number of batteries each pack includes, which is determined by the actual application. k is the number of nearest neighbors. The distance between two batteries is defined as follows:
where is a factor to control the balance between different voltage features. As defined in Equation (1), for a larger the value of , battery i has a denser distribution around it. Specifically, the proposed grouping algorithm based on this characteristic distribution model is given as follows:
Step 1: Sort the characteristic distribution densities of different batteries from small to large:
where n represents the number of batteries that have not completed the grouping process.
Step 2: Choose battery i that has the minimum density (). The k-nearest neighbors of battery i are defined as . The batteries in set are sorted from small to large based on its distance with battery i. Then place this battery i in a temporary group, named as P.
Step 3: Sequentially choose a battery . If the distances between battery and all the other batteries in the temporary group are less than the predefined threshold , then place battery into the temporary group P; otherwise,
where q is a battery in the temporary pack P. Then, we sequentially choose another battery belonging to and repeat step (3).
Step 4: When the battery number in the temporary pack reaches m, the batteries in the temporary group are saved as a successful grouping. Then repeat step (1) in the next grouping process.
Step 5: After all the batteries in have been scanned, and if the battery number in the temporary group cannot reaches m, then this battery group is marked as a failure-grouping battery. Repeat step (1) for the next grouping process.
When all the batteries have completed this grouping process, the master computer will send the grouping results to a hand-held instrument and guide the workers to group the batteries.
4. Experiment and Discussion
In the experiments, the discharge curves of 12 V lead–acid batteries in each shelf are automatically measured. There are 200 batteries in each battery shelf and the grouping parameter m is set as 4, i.e., 4 batteries in a battery pack. The voltage data are then sent to the master computer and different grouping algorithms are applied to compare the grouping results.
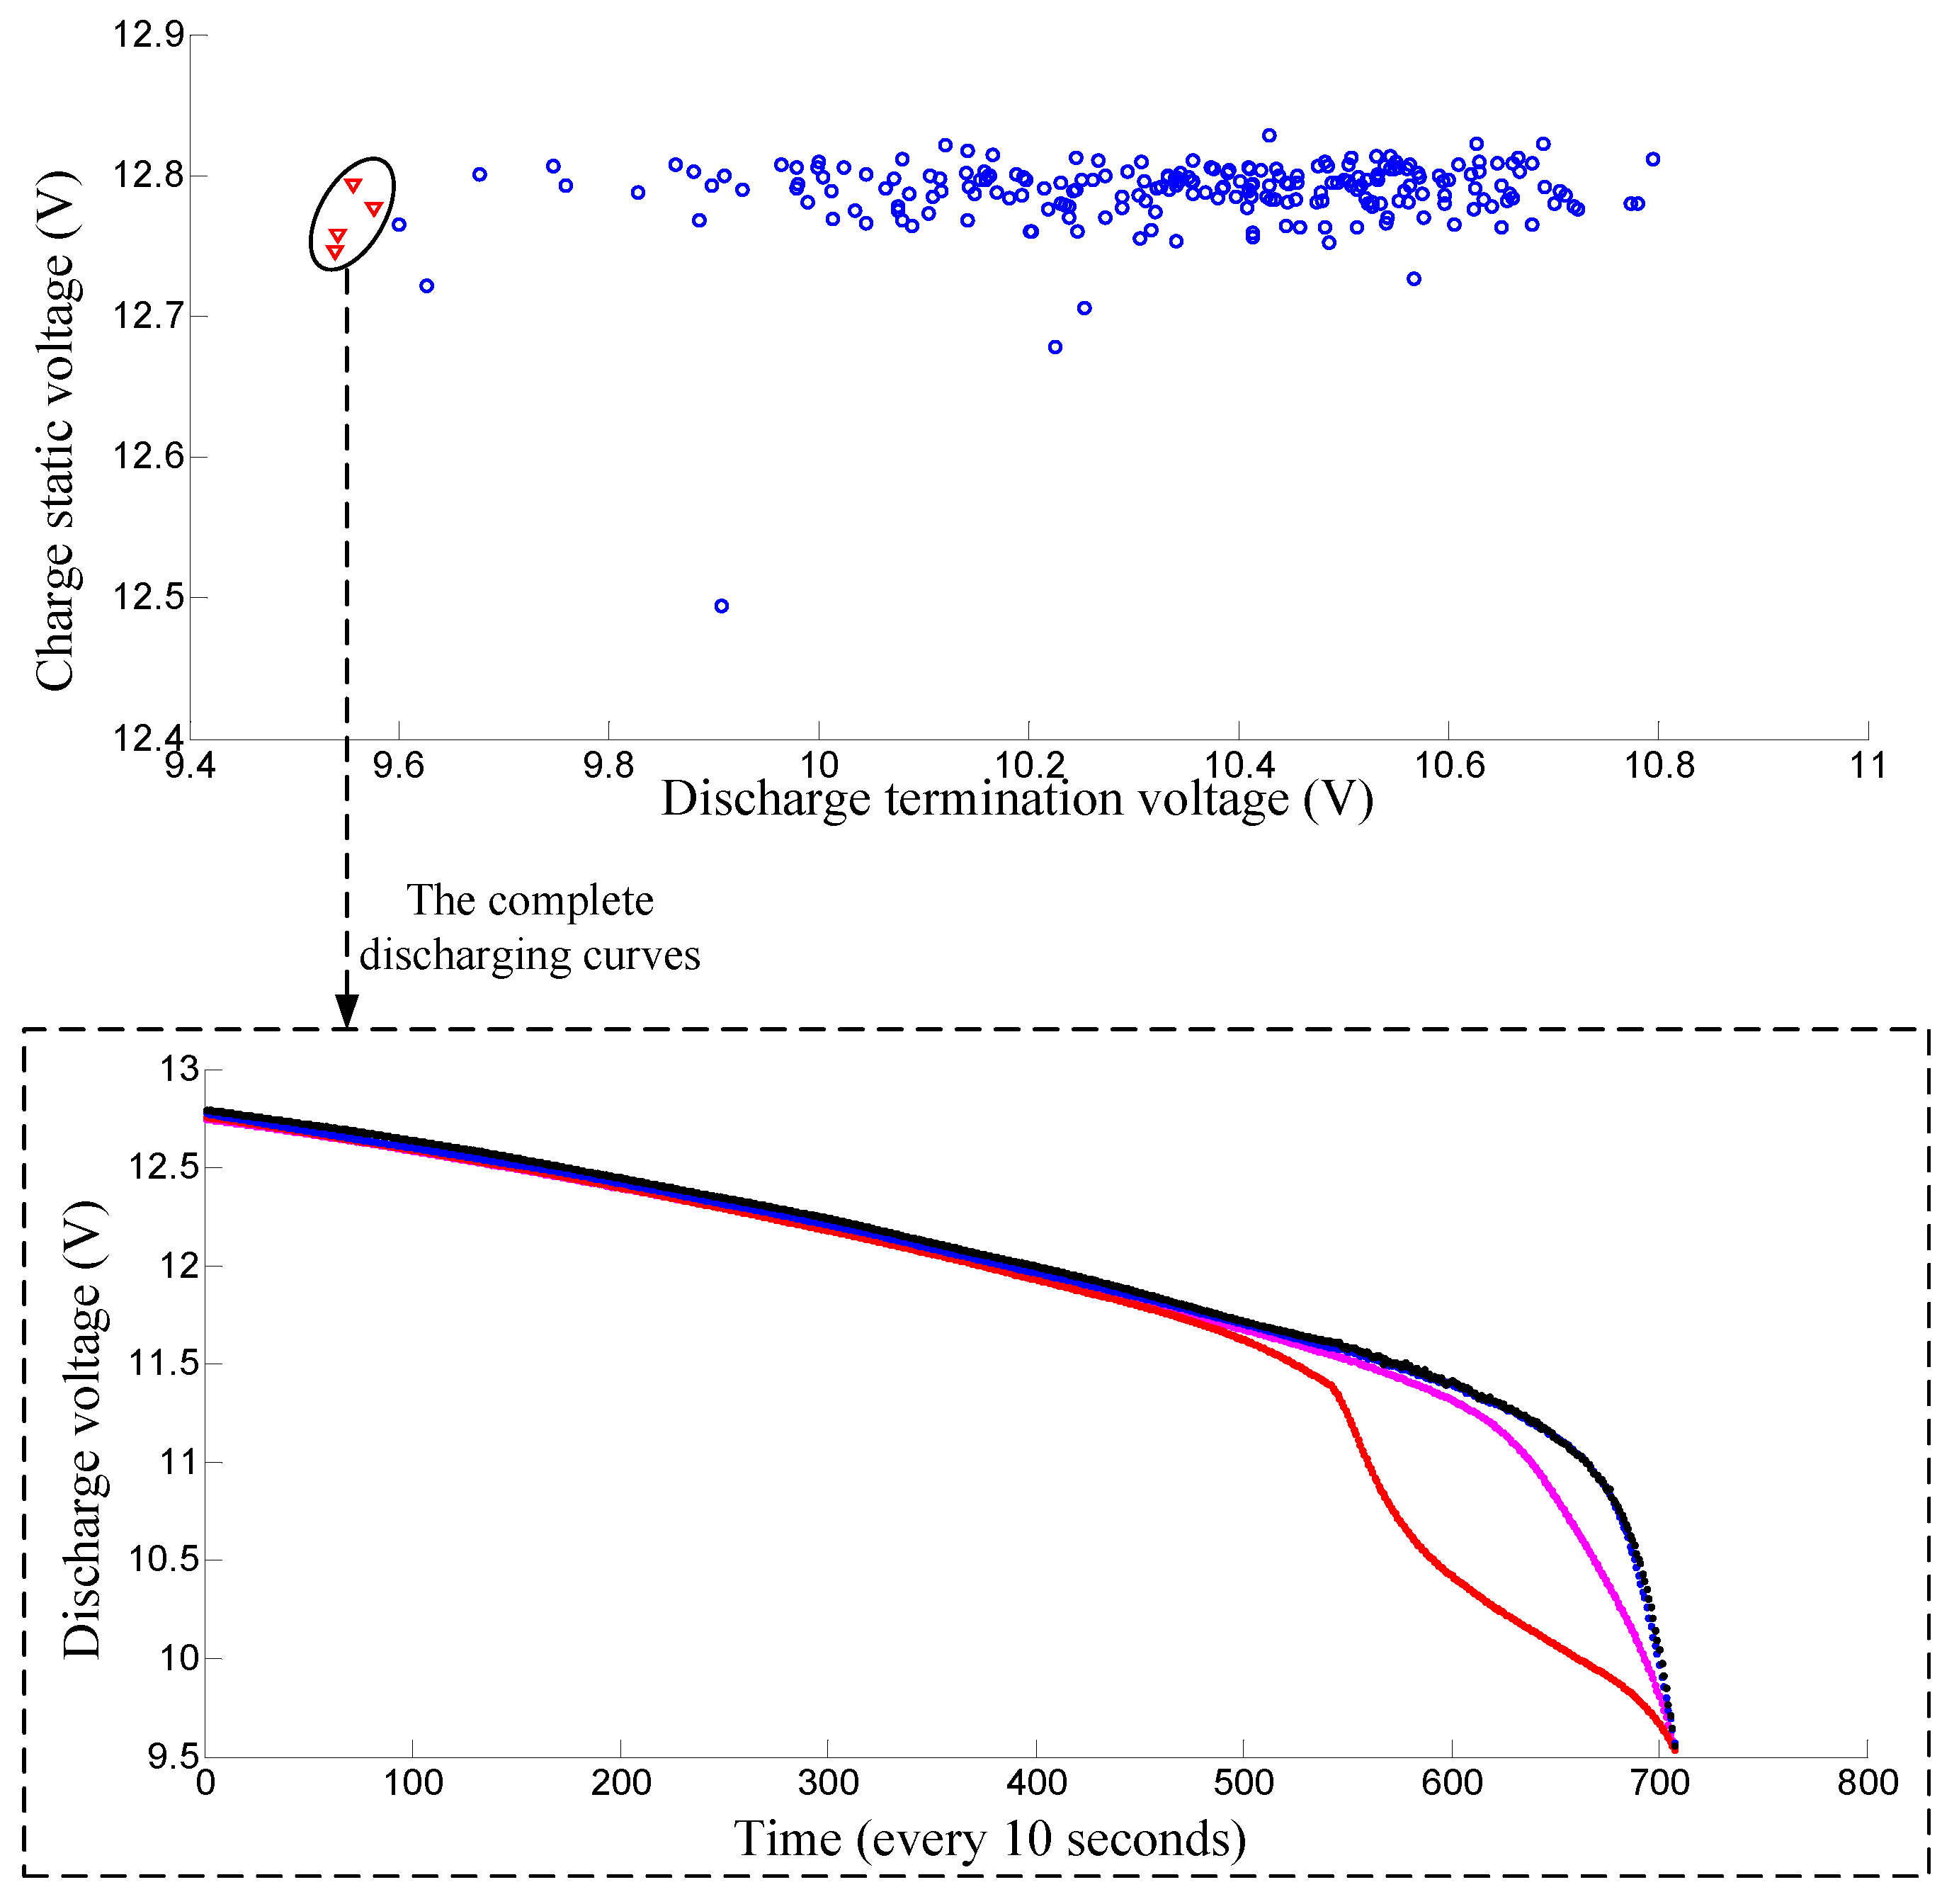
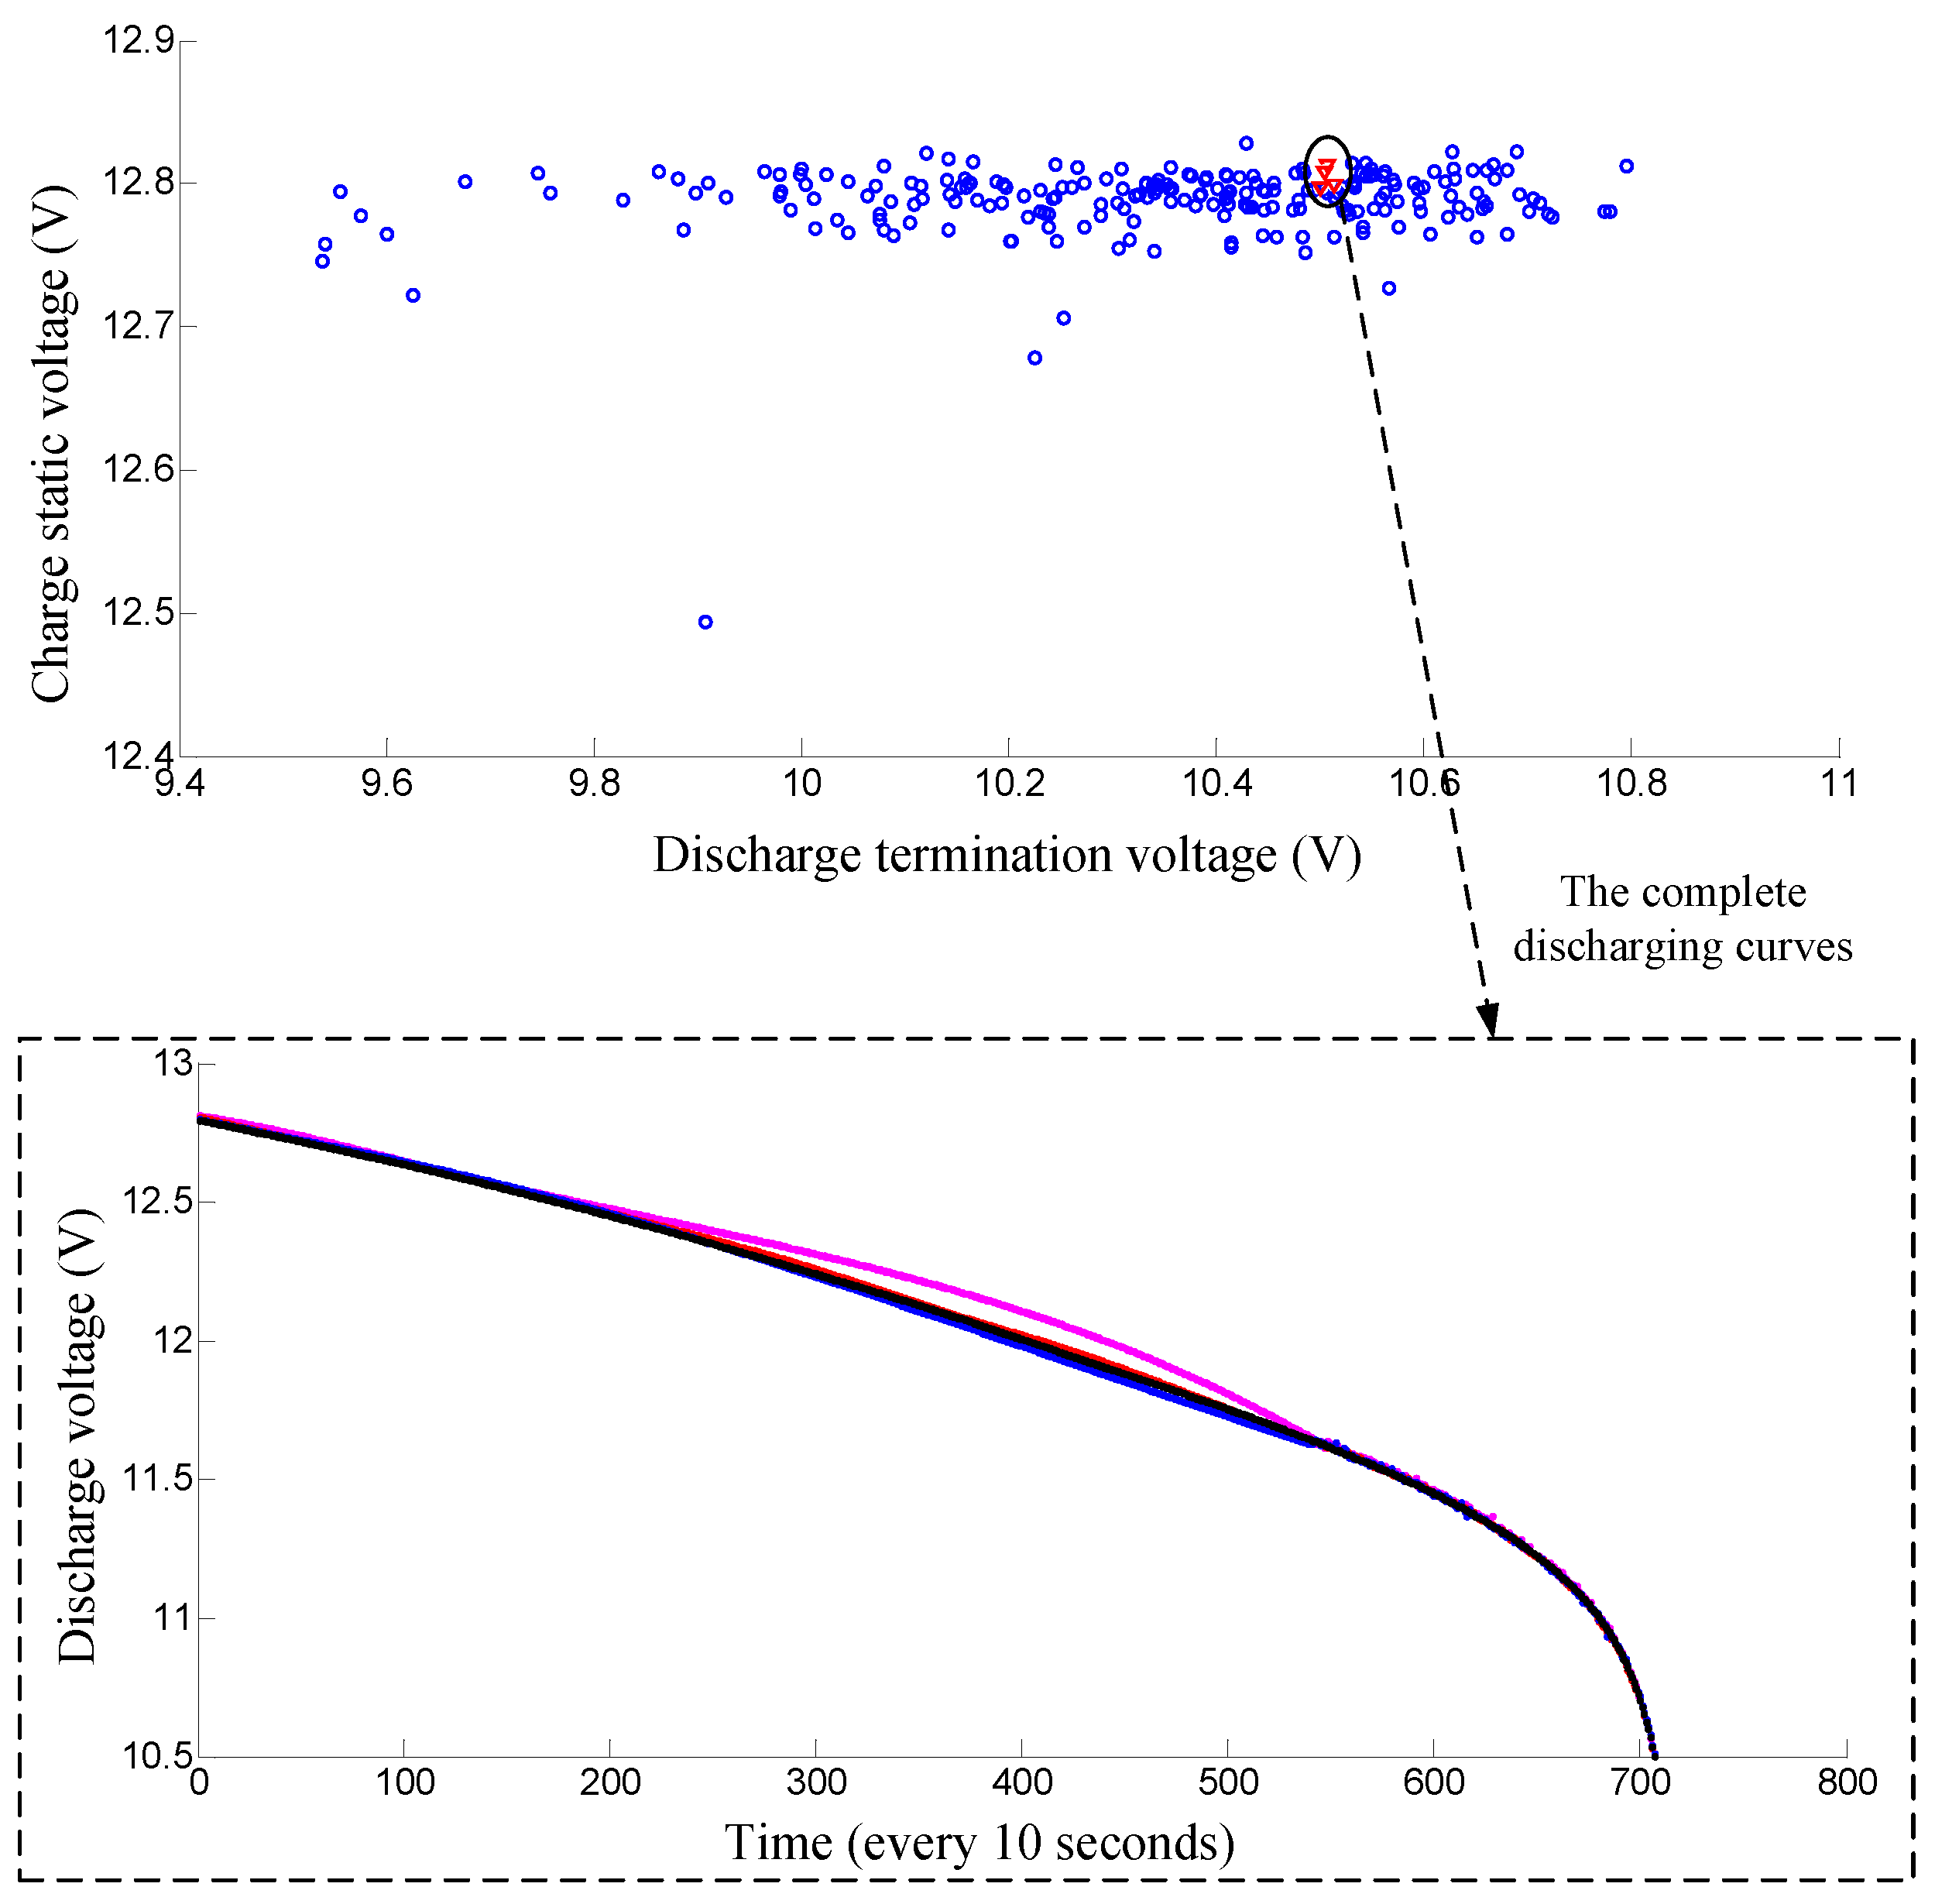
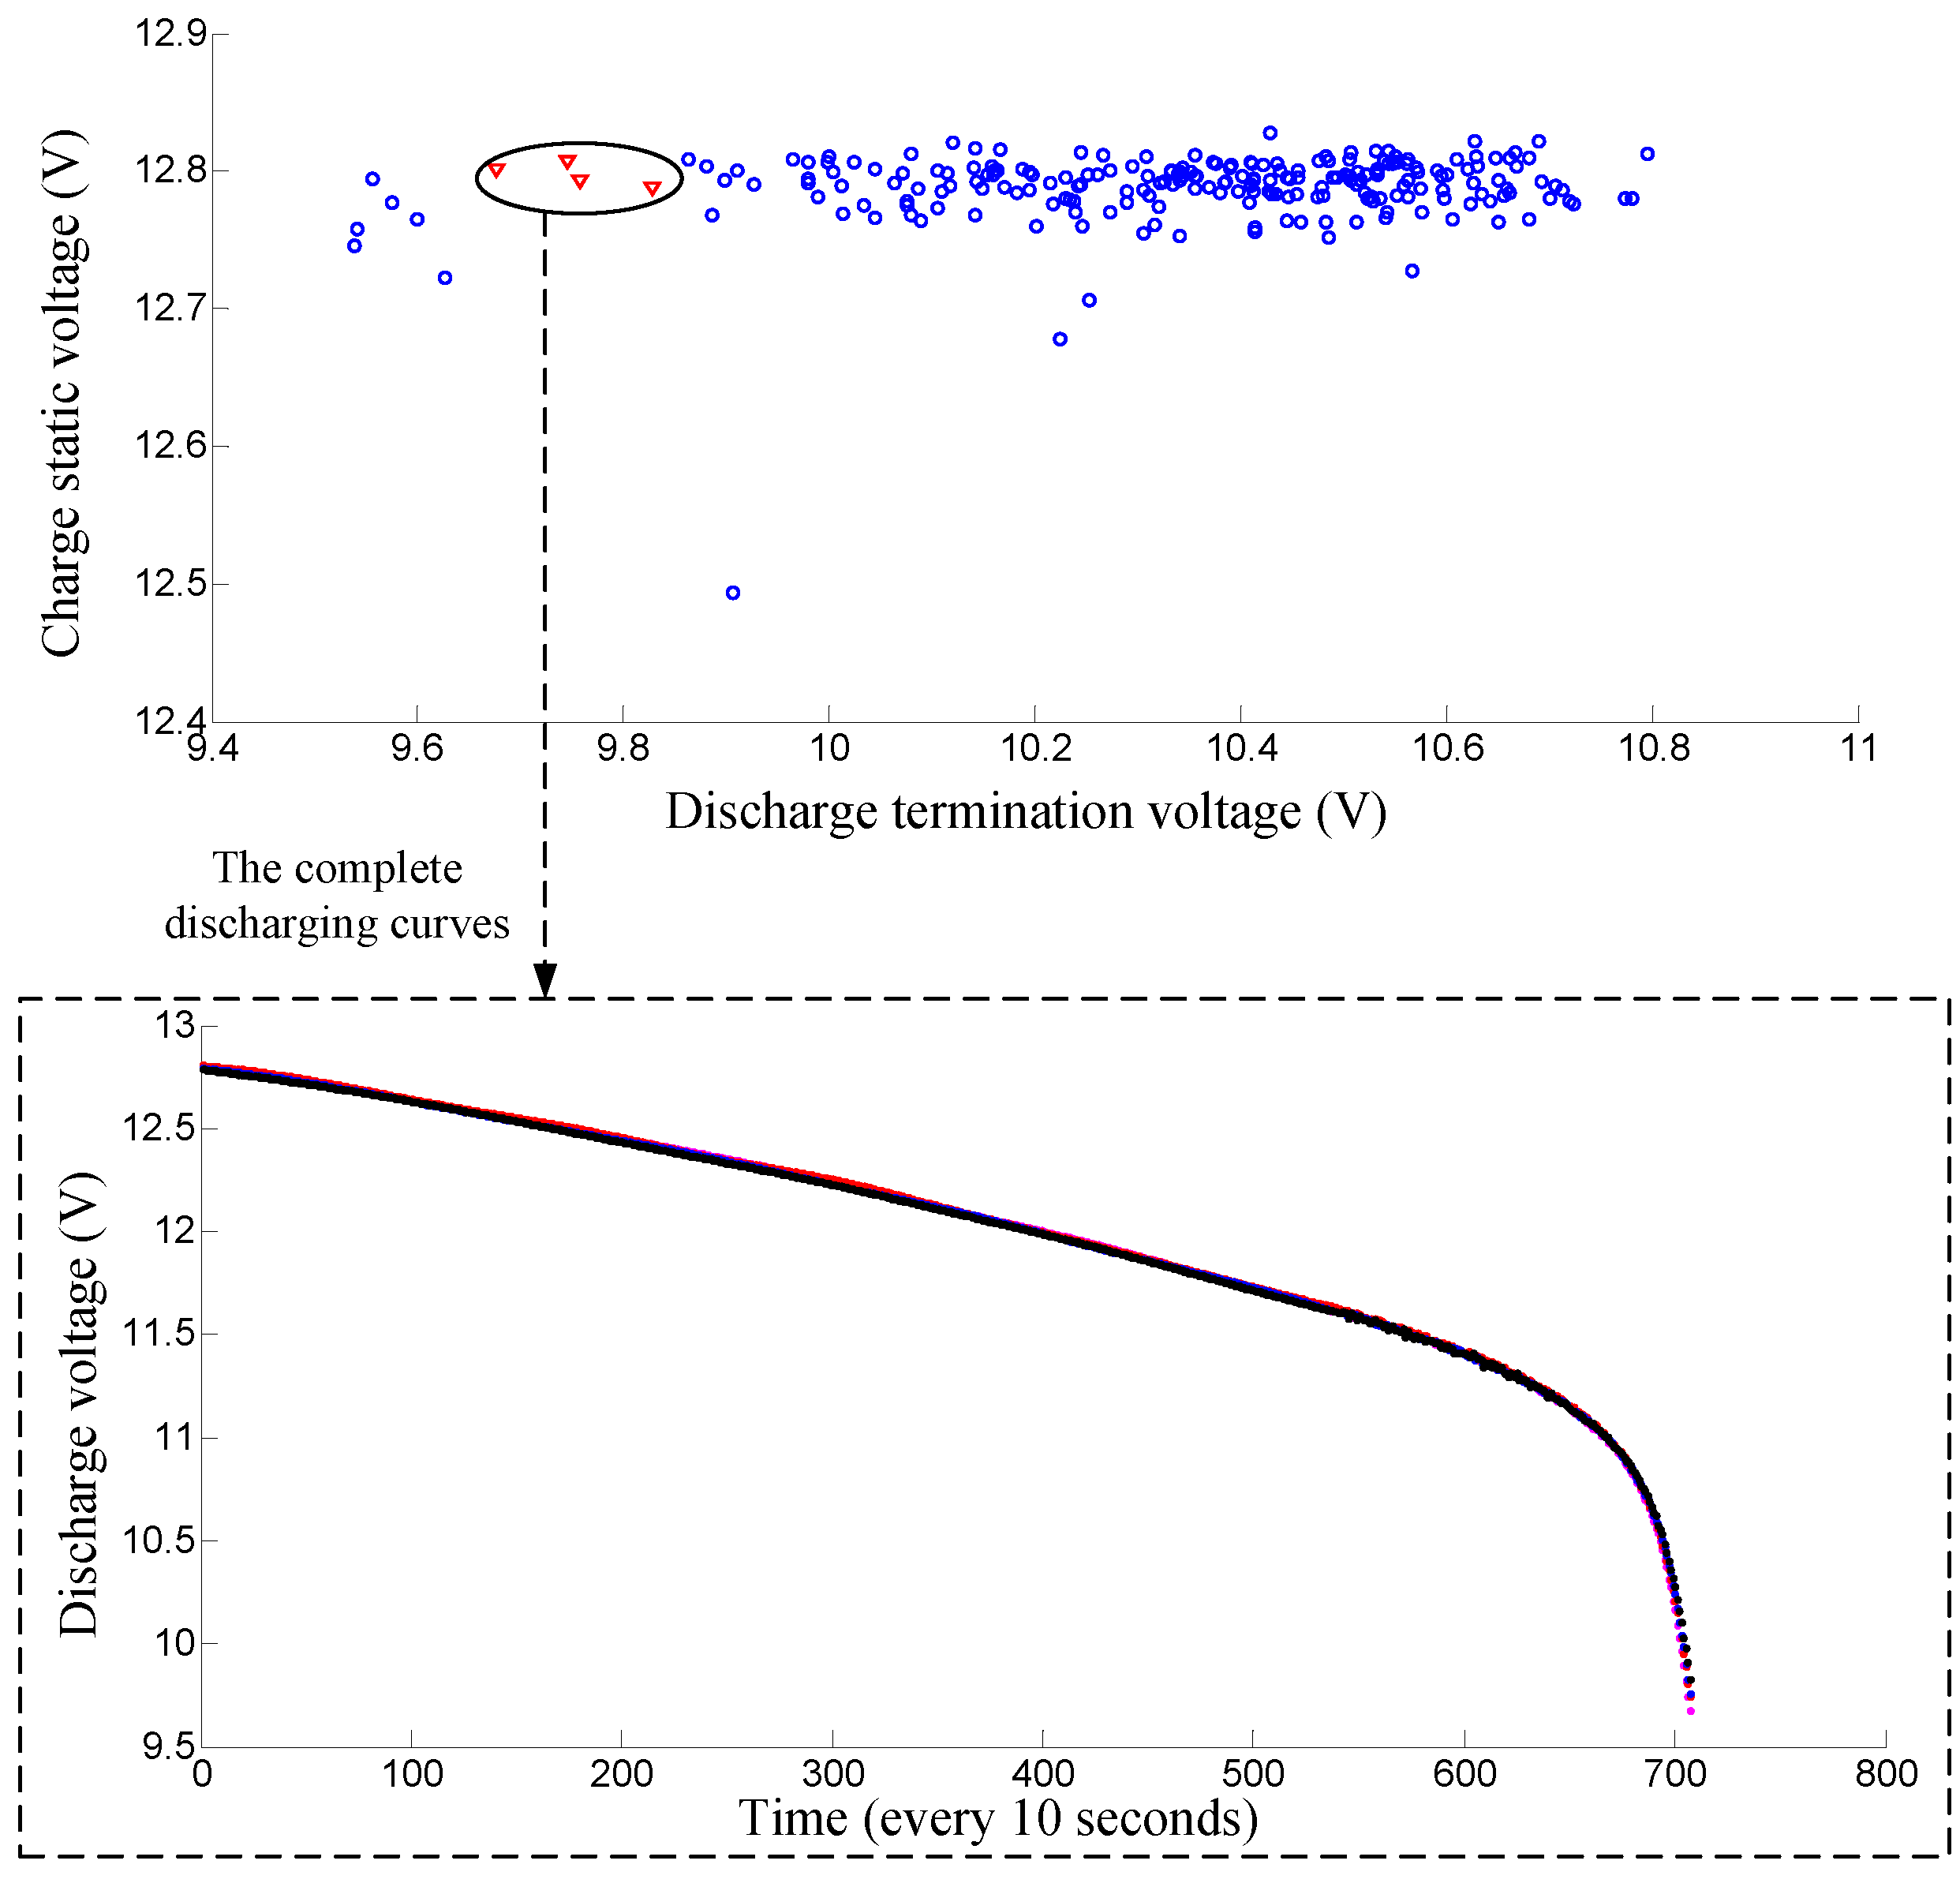
For major lead–acid battery manufacturers in China, the battery grouping process still relies on the traditional manual grouping method. Workers measure the charge static and discharge termination voltages manually with each battery and then group those batteries according to these two measured voltages. Therefore, only the charge static voltage and discharge termination voltage are firstly used as the features for grouping in our algorithm and later on compared with the new approach. The parameter k of nearest-neighbor is set to 10 in the algorithm. The charge static and the discharge termination voltages of 12 V lead-acid batteries in a shelf are plotted in a two-dimensional map. As shown in Figure 5, the first successful-grouping battery pack is displayed with triangle shape. The complete discharging curves of this battery pack are shown in Figure 5. As shown in the lower part of the figure, the discharge curves of this battery pack have great differences. To better illustrate the problem, another successful grouping example is also shown in Figure 6, we can see that the batteries in this pack have very close charge static and discharge termination voltages. However the discharges of these batteries also have big differences. Hence it is not suitable to just use the charge static and discharge termination voltages for battery grouping.
Then, the proposed algorithm is applied to address this grouping problem using the complete discharge curves. The parameter k of nearest-neighbor is also set to 10. To show the grouping results more clearly, the grouping results of the proposed method are also shown in the two-dimensional map. Compared to Figure 5, the first successful grouping battery pack is shown in Figure 7 with a triangle shape. The complete discharging curves of this battery pack are shown in the lower part of the figure. We can see the discharge curves of this battery pack are very close to each other. Moreover, those four error grouping points (batteries) in Figure 6 are grouped into different packs using the proposed method, and one example is given in Figure 8. Compared to Figure 6, the battery packs in Figure 8 have very close discharging curves though they do not have the most similar charge static and discharge termination voltages. Hence, the proposed grouping method can effectively solve the mischaracterization and grouping issues by using the complete discharge curves. Moreover, the intra group variances of battery packs using the proposed method with different features are compared in Figure 9 and Table 1. Specifically, the intra group variance of battery pack is defined as follows:
where, P denotes a battery pack after grouping, is the measured discharging curve of battery i in pack P, denotes the average discharging curve of pack P, denotes the intra-group variance of pack P.
The red curve in Figure 9 represents the intra-group variances of battery packs just using the charge static and discharge termination voltages for grouping. The blue curve in Figure 9 represents the intra-group variances of battery packs using the proposed method for grouping. As shown in Figure 9 and Table 1, the proposed method using the whole discharging curve can achieve smaller variances and better intra-group consistency. In general, it is recommended to use the whole discharging curve for battery grouping instead of the traditional manual method.
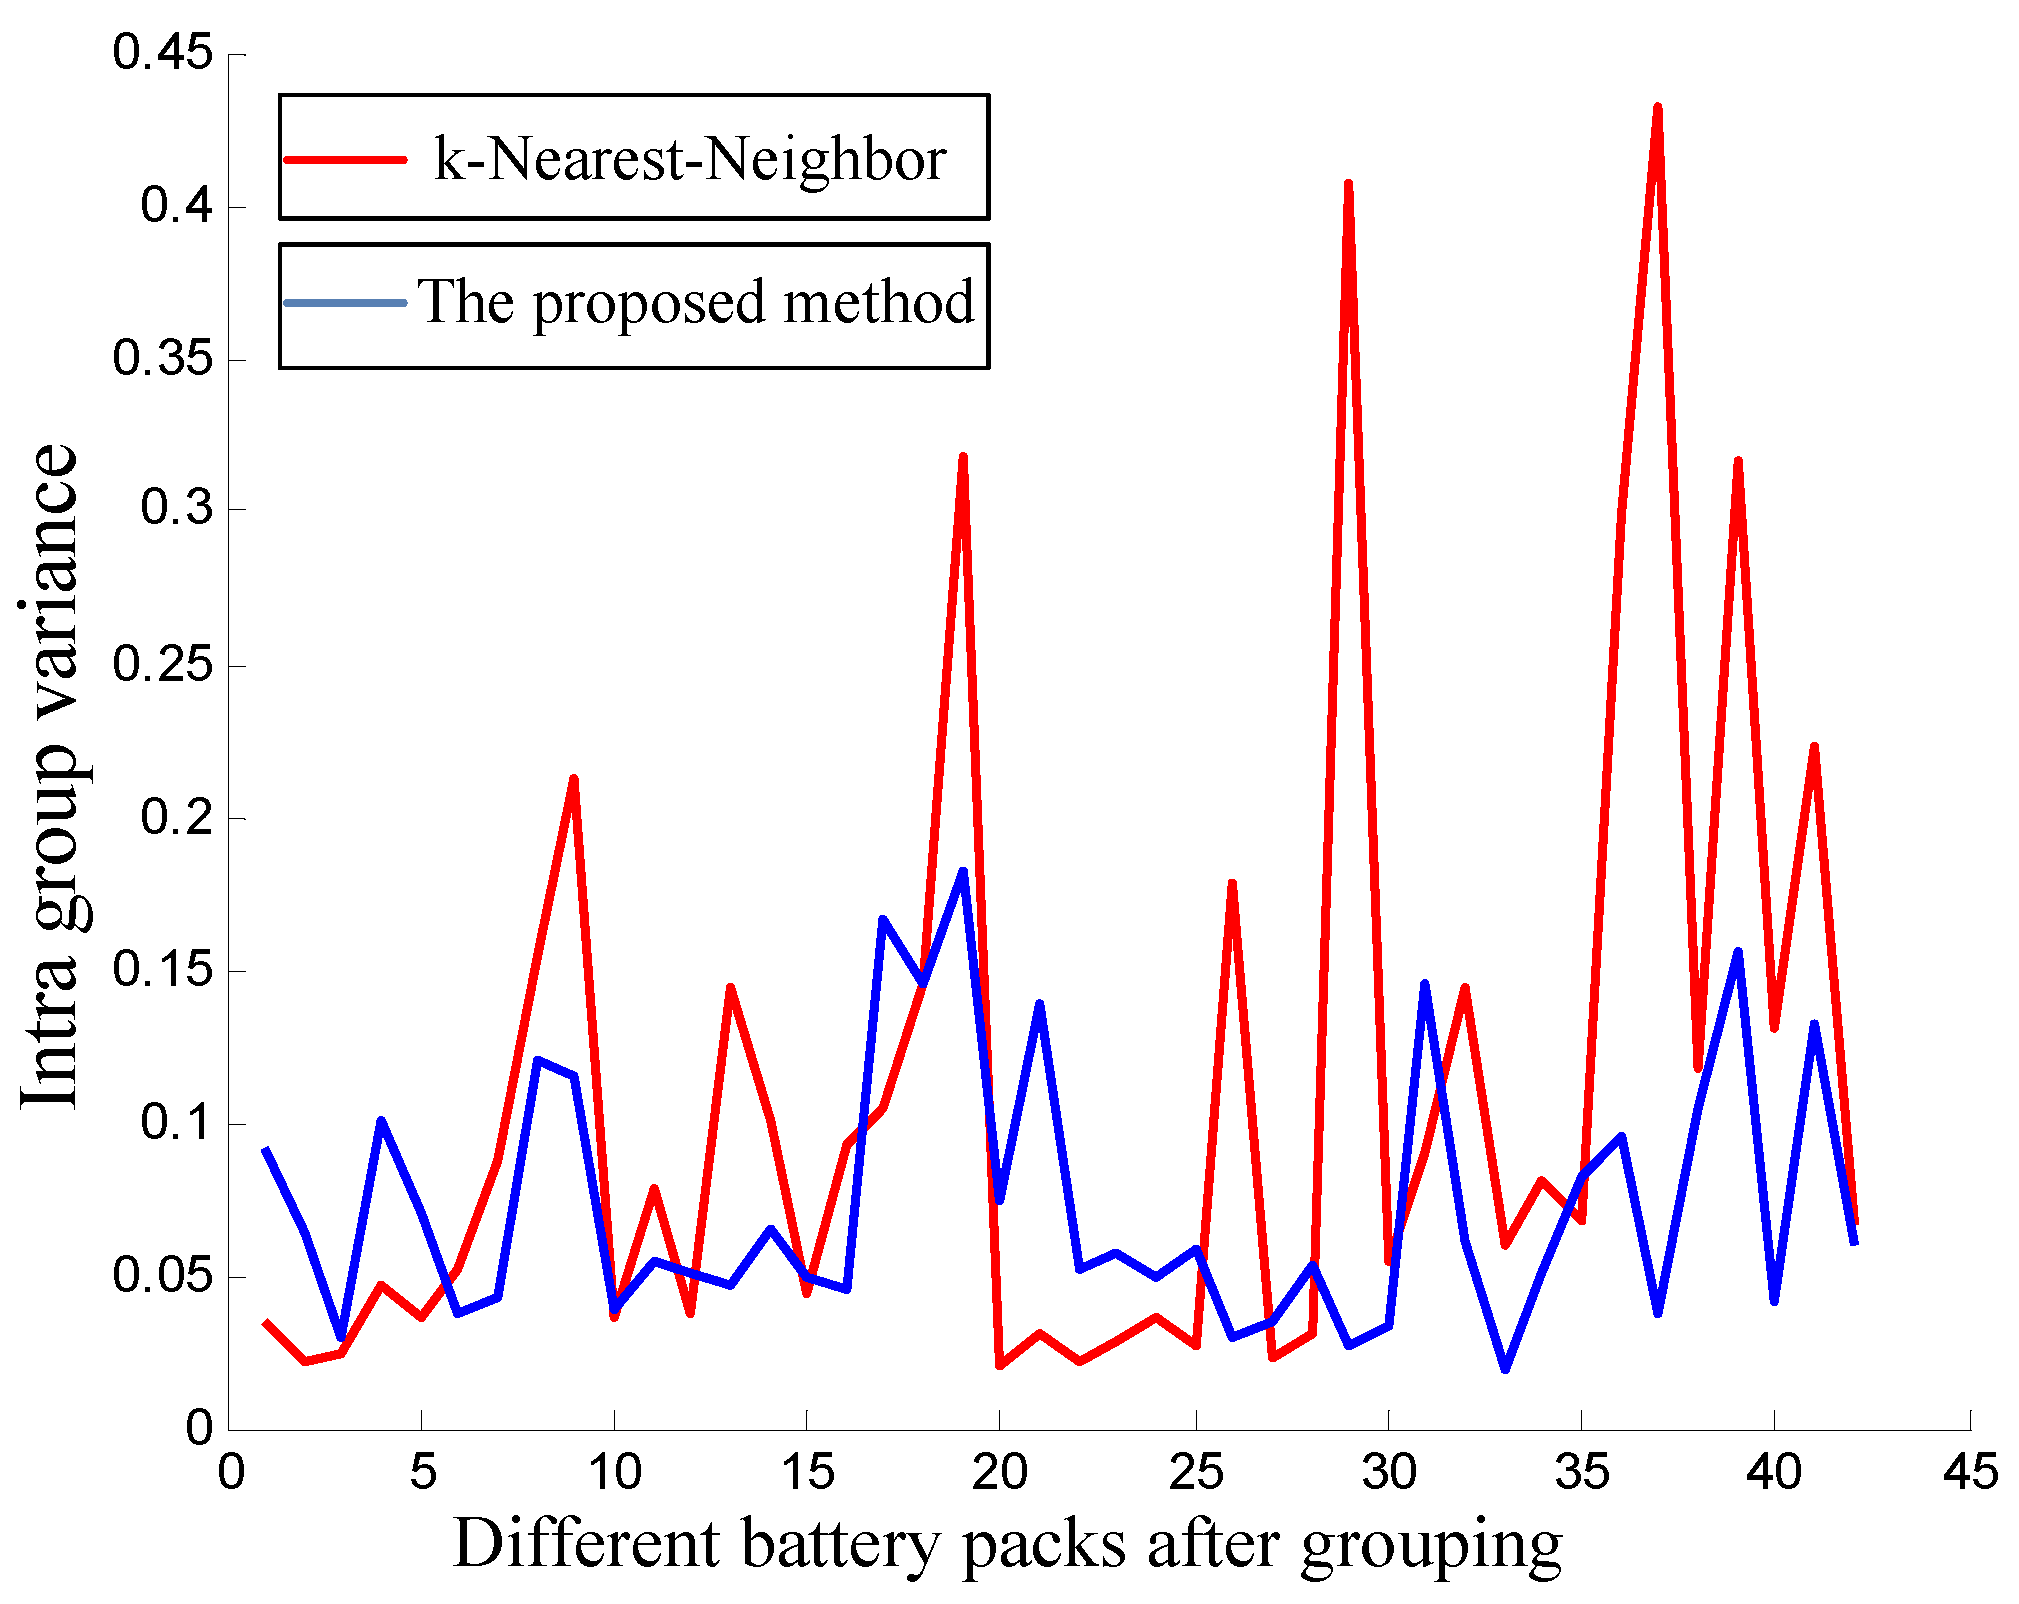
Moreover, to further demonstrate the superior performance of the proposed method, more studies have been carried to compare the proposed method with the original k-nearest-neighbor algorithm. For the original k-nearest-neighbor algorithm, the parameter k of nearest-neighbor is set the same as the grouping parameter m and each m nearest-neighbor batteries will be grouped together to form a battery pack. The comparison results have been given in Figure 10 and Figure 11 and are summarized in Table 2. As shown in the table, the grouping failure rate of the original k-nearest-neighbor algorithm is much higher than the proposed method. As shown in Figure 10, there are much more “orphan” batteries that cannot be grouped into a good battery pack when using the original k-nearest-neighbor algorithm. More “orphan” batteries mean a greater manufacturing cost. For battery manufacturers, this is a huge waste and is unacceptable. With the developed characteristic distribution model, the proposed grouping method can effectively reduce the number of “orphan” batteries. At the same time, the intra-group consistency of the proposed method is also compared with the original k-nearest-neighbor algorithm in Table 2 and Figure 11. It can be seen that the proposed method can also achieve smaller variances and better intra-group consistency compared to the original k-nearest-neighbor algorithm. In general, the proposed method can improve the grouping success rate while ensuring the intra-group consistency.
As analyzed in Section 3.2, the grouping parameter m of the proposed approach can be easily adjusted according to the requirements of the manufacturer. Other experiments (m is set as 5) are carried out to prove the adaptability of the proposed algorithm. As shown in the Figure 12, the grouping failure rate of the original k-nearest-neighbor algorithm is also much higher than the proposed method. The proposed grouping method can effectively reduce the number of “orphan” batteries while taking out those batteries that have very different characteristics.
Using the proposed method, the voltage data can be uploaded to the master computer and obtain the grouping results. Compared to the manual grouping method, the developed method can reduce the time cost significantly. If the daily production of a workshop is 10,000 batteries, then 50 battery shelves (i.e., 200 batteries per shelf) need to be grouped every day. With the manual grouping method, 30 min per shelf are required to complete the grouping work. While for the proposed automatic grouping method, about 2 s per shelf is enough to complete the same job, as shown in Table 3.
5. Conclusions
In this paper, a robust battery grouping method based on the novel density distribution model has been developed for lead–acid batteries. Compared to the traditional manual grouping method, the developed method can significantly reduce the time and labor costs. The proposed grouping algorithm has been compared with typical grouping methods including the k-means algorithm and the spectral clustering algorithm and has demonstrated its superiority in battery grouping. Experiments have been carried out for grouping batteries in 4 batteries and 5 batteries per pack, respectively. The experimental results have verified the effectiveness of the proposed method in battery grouping. In future work, the proposed system can be improved by incorporating other battery charge/discharge characteristics. Moreover, the proposed method can also be extended for grouping other types of battery such as the lithium ion battery, which will be one of our future tasks.
Acknowledgments
This work was supported in part by the National Natural Science Foundation of China (U1609216, 61471151 and 61671194).
Author Contributions
Yuxiang Yang and Mingyu Gao conceived and designed the experiments; Yuxiang Yang performed the experiments; Zhiwei He contributed analysis tools; Yuxiang Yang and Caisheng Wang analyzed the data; Yuxiang Yang wrote the paper.
Conflicts of Interest
The authors declare no conflict of interest.
References
- Lee, I.O. A Hybrid PWM-Resonant DC-DC Converter for Electric Vehicle Battery Charger Applications. J. Power Electron. 2015, 15, 1158–1167. [Google Scholar] [CrossRef]
- Liu, T.; Chen, Y.; Yi, P.; Chen, J. Integrated battery charger with power factor correction for electric-propulsion systems. IET Electr. Power Appl. 2015, 9, 229–238. [Google Scholar] [CrossRef]
- Feng, B.; Lin, H.; Wang, X. Modulation and control of ac/dc matrix converter for battery energy storage application. IET Power Electron. 2015, 8, 1583–1594. [Google Scholar] [CrossRef]
- Wang, T.; Tseng, K.J.; Zhao, J.; Wei, Z. Thermal investigation of lithium-ion battery module with different cell arrangement structures and forced air-cooling strategies. Appl. Energy 2014, 134, 229–238. [Google Scholar] [CrossRef]
- Zheng, Y.; Ouyang, M.; Lu, L.; Li, J.; Han, X.; Xu, L. On-line equalization for lithium-ion battery packs based on charging cell voltages: Part 2. Fuzzy logic equalization. J. Power Source 2014, 247, 460–466. [Google Scholar] [CrossRef]
- Li, J.; Michael, S.M. Accurate battery pack modeling for automotive applications. J. Power Source 2013, 237, 215–228. [Google Scholar] [CrossRef]
- Gong, X.; Xiong, R.; Chris Mi, C. Study of the Characteristics of Battery Packs in Electric Vehicles with parallel-Connected Lithium-Ion Battery Cells’. IEEE Trans. Ind. Appl. 2015, 51, 1872–1979. [Google Scholar] [CrossRef]
- He, Z.W.; Gao, M.Y.; Wang, C.; Wang, L.; Liu, Y.Y. Adaptive state of charge estimation for Li-ion batteries based on an unscented Kalman filter with an enhanced battery model. Energies 2013, 6, 4134–4151. [Google Scholar] [CrossRef]
- Lin, H.T.; Liang, T.J.; Chen, S. Estimation of battery state of health using probabilistic neural network. IEEE Trans. Ind. Inform. 2013, 9, 679–685. [Google Scholar] [CrossRef]
- Feng, H.; Jiang, Z.; Xie, F.; Yang, P.; Shi, J.; Chen, L. Automatic Fastener Classification and Defect Detection in Vision-Based Railway Inspection Systems. IEEE Trans. Instrum. Meas. 2014, 63, 877–888. [Google Scholar] [CrossRef]
- Yang, Y.X.; Zha, Z.J.; Gao, M.Y.; He, Z.W. A robust vision inspection system for detecting surface defects of film capacitors. Signal Process. 2016, 124, 54–62. [Google Scholar] [CrossRef]
- Gogoana, R.; Pinson, M.B.; Bazant, M.Z.; Sarma, S.E. Internal Resistance Matching for Parallel-connected Lithium-ion Cells and Impacts on Battery Pack Cycle Life. J. Power Source 2014, 252, 8–13. [Google Scholar] [CrossRef]
- David, R.P.; Edward, P.D.; Michael, F.; Stimson, E.; Mollendorf, J.C. A rechargeable lithium-ion battery module for underwater use. J. Power Source 2011, 196, 793–800. [Google Scholar]
- Zeng, Y.; Yang, Y.X.; He, Z.W.; Gao, M.Y.; Hong, M. Lead-acid Battery Automatic Grouping System Based on Graph Cuts. Electr. Power Compon. Syst. 2016, 44, 450–458. [Google Scholar] [CrossRef]
- He, Z.W.; Gao, M.Y.; Ma, G.J.; Liu, Y.Y.; Tang, L.J. Battery Grouping with Time Series Clustering Based on Affinity Propagation. Energies 2016, 9, 561. [Google Scholar] [CrossRef]
- Jain, A.; Murty, M.; Flynn, P. Data clustering: A Review. ACM Comput. Surv. 1999, 31, 264–323. [Google Scholar] [CrossRef]
- Li, X.; Nong, Y. A supervised clustering and classification algorithm for mining data with mixed variables. IEEE Trans. Syst. Man Cybern. Part A Syst. Hum. 2006, 36, 396–406. [Google Scholar]
- Tang, H.; Chu, S.M.; Hasegawa-Johnson, M.; Huang, T. Partially Supervised Speaker Clustering. IEEE Trans. Pattern Anal. Mach. Intell. 2014, 34, 959–971. [Google Scholar] [CrossRef] [PubMed]
- Papapetrou, O.; Siberski, W.; Fuhr, N. Decentralized Probabilistic Text Clustering. IEEE Trans. Knowl. Data Eng. 2012, 24, 1848–1861. [Google Scholar] [CrossRef]
- Sulaiman, S.N.; Isa, N. Adaptive fuzzy-K-means clustering algorithm for image segmentation. IEEE Trans. Consum. Electron. 2010, 56, 2661–2668. [Google Scholar] [CrossRef]
- Von Luxburg, U. A tutorial on spectral clustering. Stat. Comput. 2007, 17, 395–416. [Google Scholar] [CrossRef]
- Yang, P.; Zhu, Q.; Huang, B. Spectral clustering with density sensitive similarity function. Knowl. Based Syst. 2011, 24, 621–628. [Google Scholar] [CrossRef]
- Zbib, H.; Mouysset, S.; Stute, S. Unsupervised Spectral Clustering for Segmentation of Dynamic PET Images. IEEE Trans. Nucl. Sci. 2013, 62, 840–850. [Google Scholar] [CrossRef]
- Li, X.; Hu, W.; Shen, C.; Dick, A.; Zhang, Z. Context-Aware Hyper graph Construction for Robust Spectral Clustering. IEEE Trans. Knowl. Data Eng. 2014, 26, 2588–2597. [Google Scholar] [CrossRef]
- Cai, D.; Chen, X. Large Scale Spectral Clustering Via Landmark-Based Sparse Representation. IEEE Trans. Cybern. 2015, 45, 1669–1680. [Google Scholar] [PubMed]
Figure 1.
A practical battery production process: (a) Manual measurement of battery voltages; (b) Manual battery grouping.
Figure 1.
A practical battery production process: (a) Manual measurement of battery voltages; (b) Manual battery grouping.

Figure 2.
Discharge curve automatic measurement.

Figure 3.
Discharging curves of different batteries.

Figure 4.
Grouping results of a shelf using different clustering algorithms: (a) Results of the k-means algorithm [16]; (b) Results of spectral clustering algorithm [21,24]. Note that the battery discharge curves can be divided into several clusters (represented by different colors), but it is impossible to decide which m batteries should be grouped into the same pack.

Figure 5.
The first successful-grouping battery pack only using the charge static voltage and discharge termination voltage. Note that the full discharge curves of this battery pack have big differences.
Figure 5.
The first successful-grouping battery pack only using the charge static voltage and discharge termination voltage. Note that the full discharge curves of this battery pack have big differences.

Figure 6.
Another successful-grouping battery pack only using the charge static voltage and discharge termination voltage. Note that the discharge curves of this battery pack also have big differences.
Figure 6.
Another successful-grouping battery pack only using the charge static voltage and discharge termination voltage. Note that the discharge curves of this battery pack also have big differences.

Figure 7.
The first successful-grouping battery pack of our method using the complete discharge curves. Note that the discharge curves of this battery pack are very close to each other.
Figure 7.
The first successful-grouping battery pack of our method using the complete discharge curves. Note that the discharge curves of this battery pack are very close to each other.

Figure 8.
Another successful-grouping battery pack of our method using the complete discharge curves. Note that the discharge curves of this battery pack are very close to each other.
Figure 8.
Another successful-grouping battery pack of our method using the complete discharge curves. Note that the discharge curves of this battery pack are very close to each other.
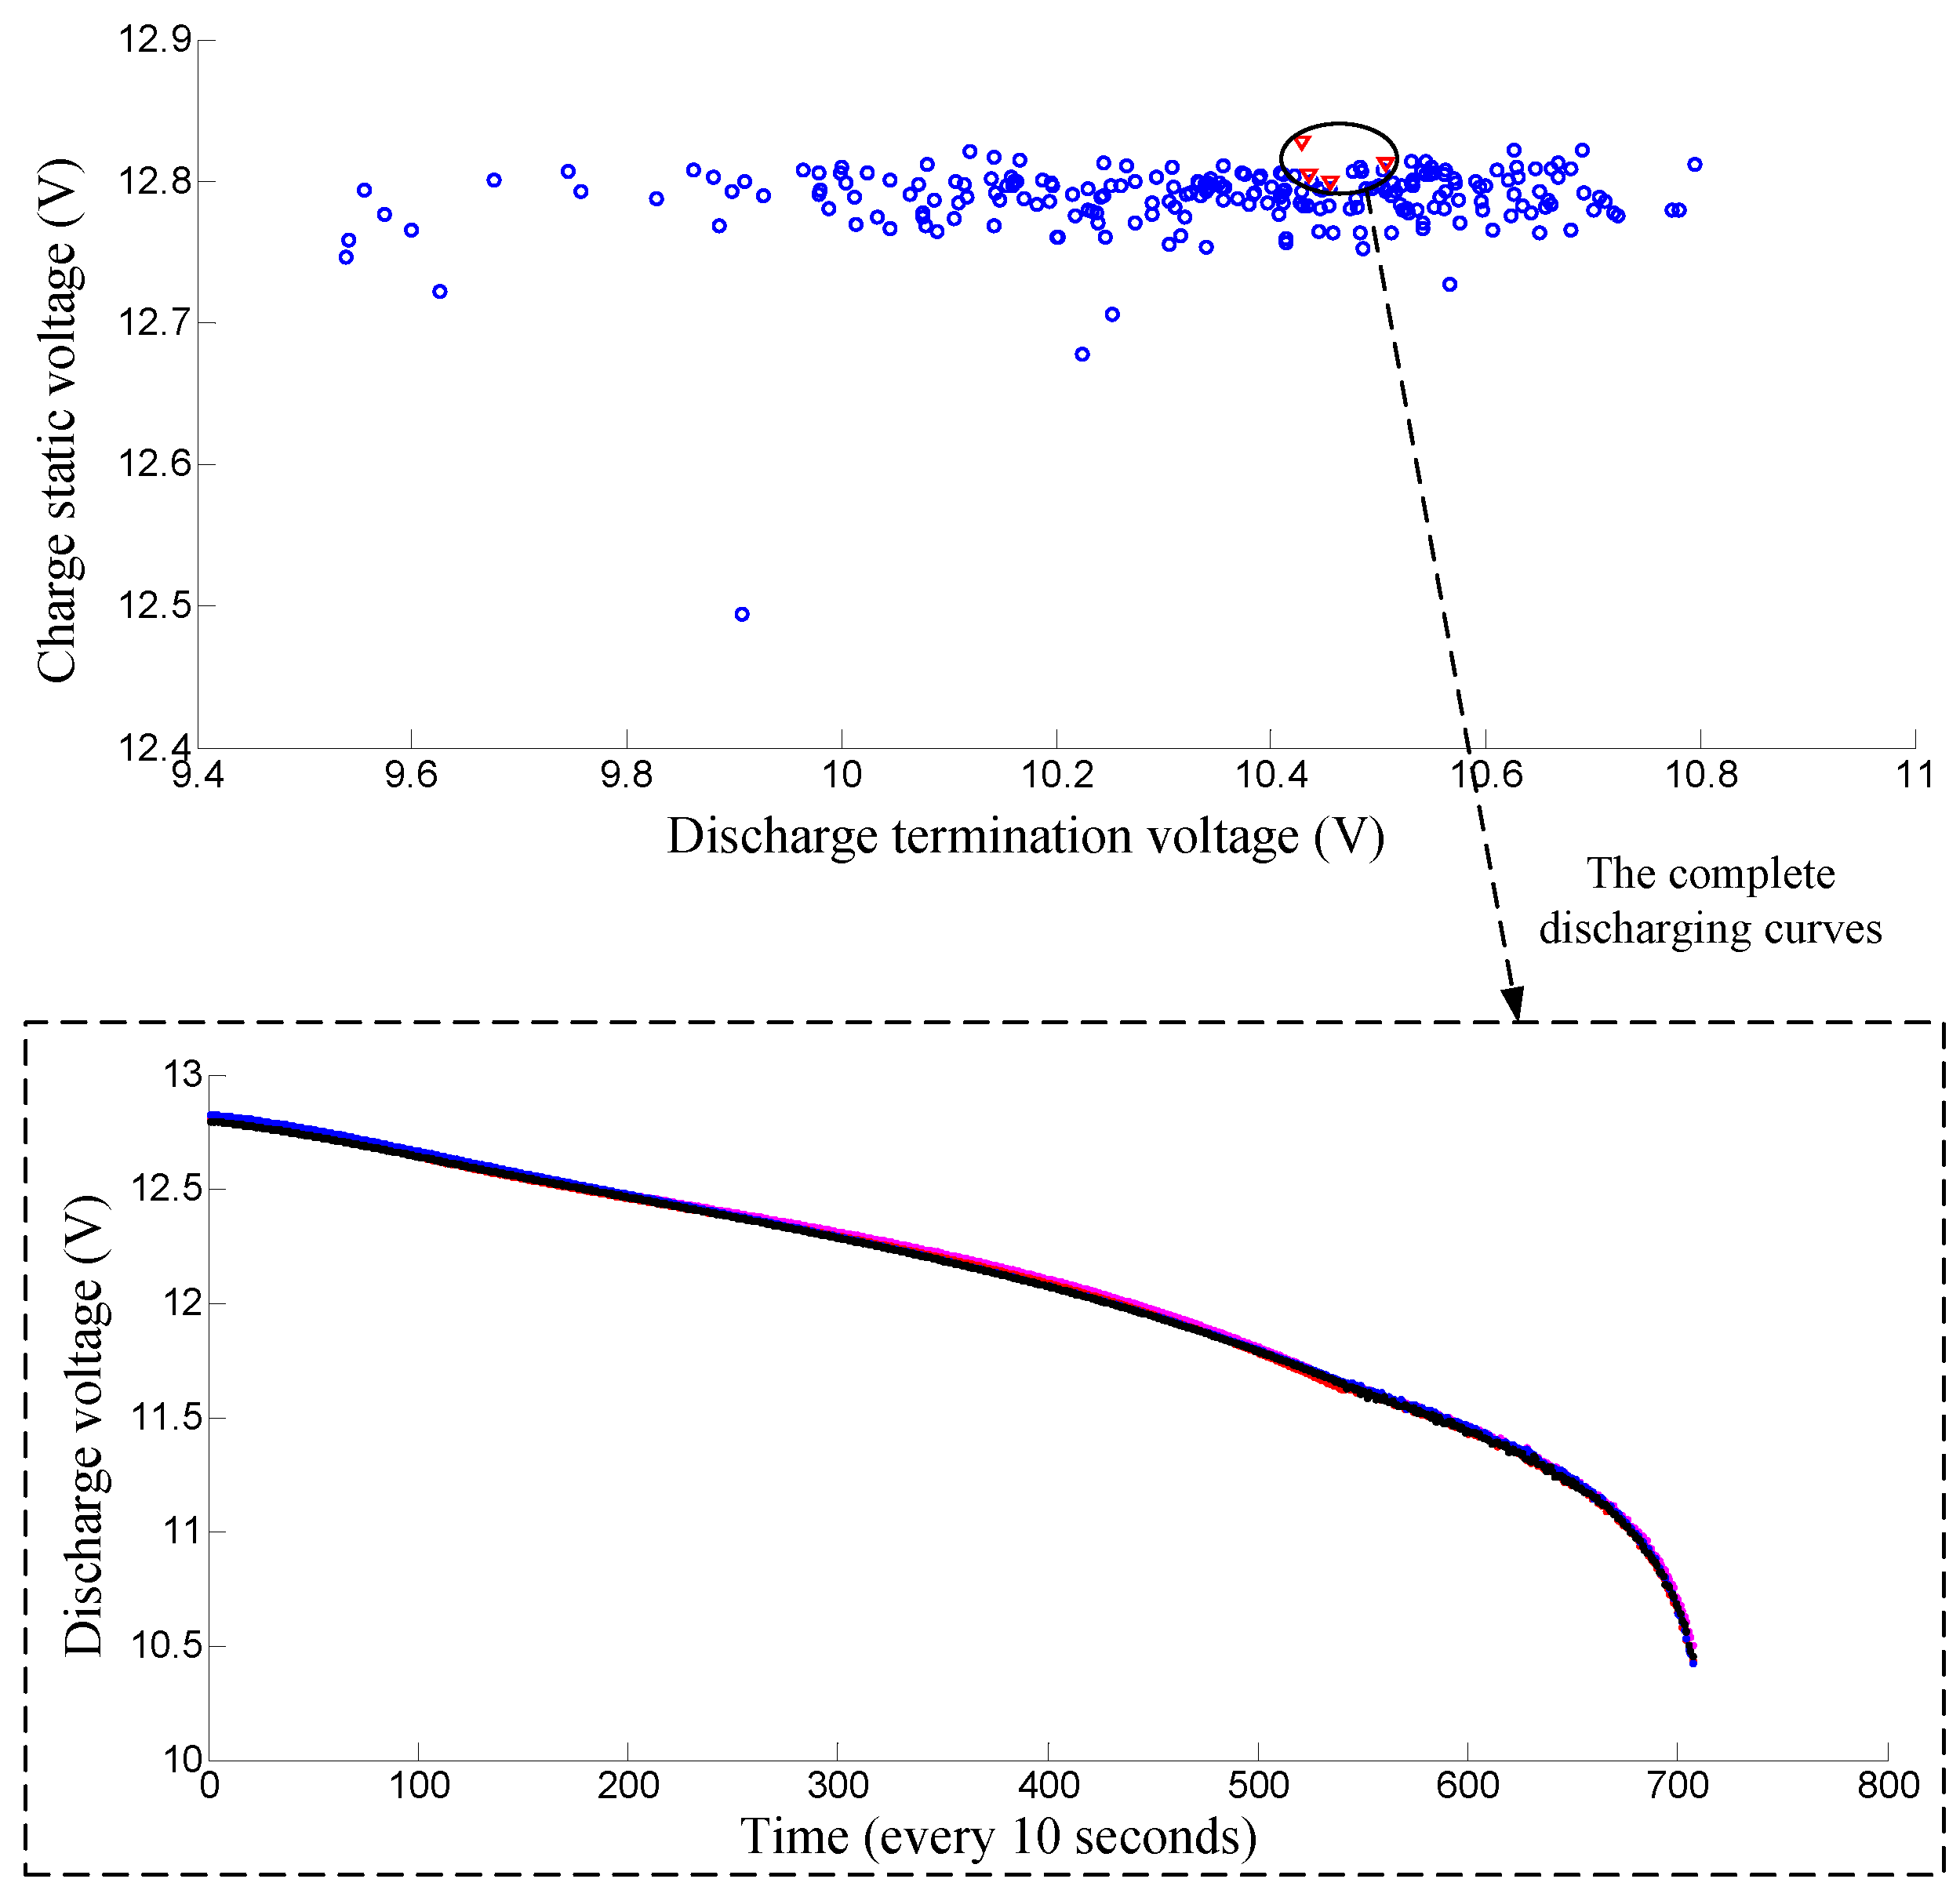
Figure 9.
The comparison of intra group variances: Results only using the charge static voltage and discharge termination voltage and results using the whole discharging curves. Note that the proposed method using the whole discharging curves can achieve smaller variances and better intra group consistency.
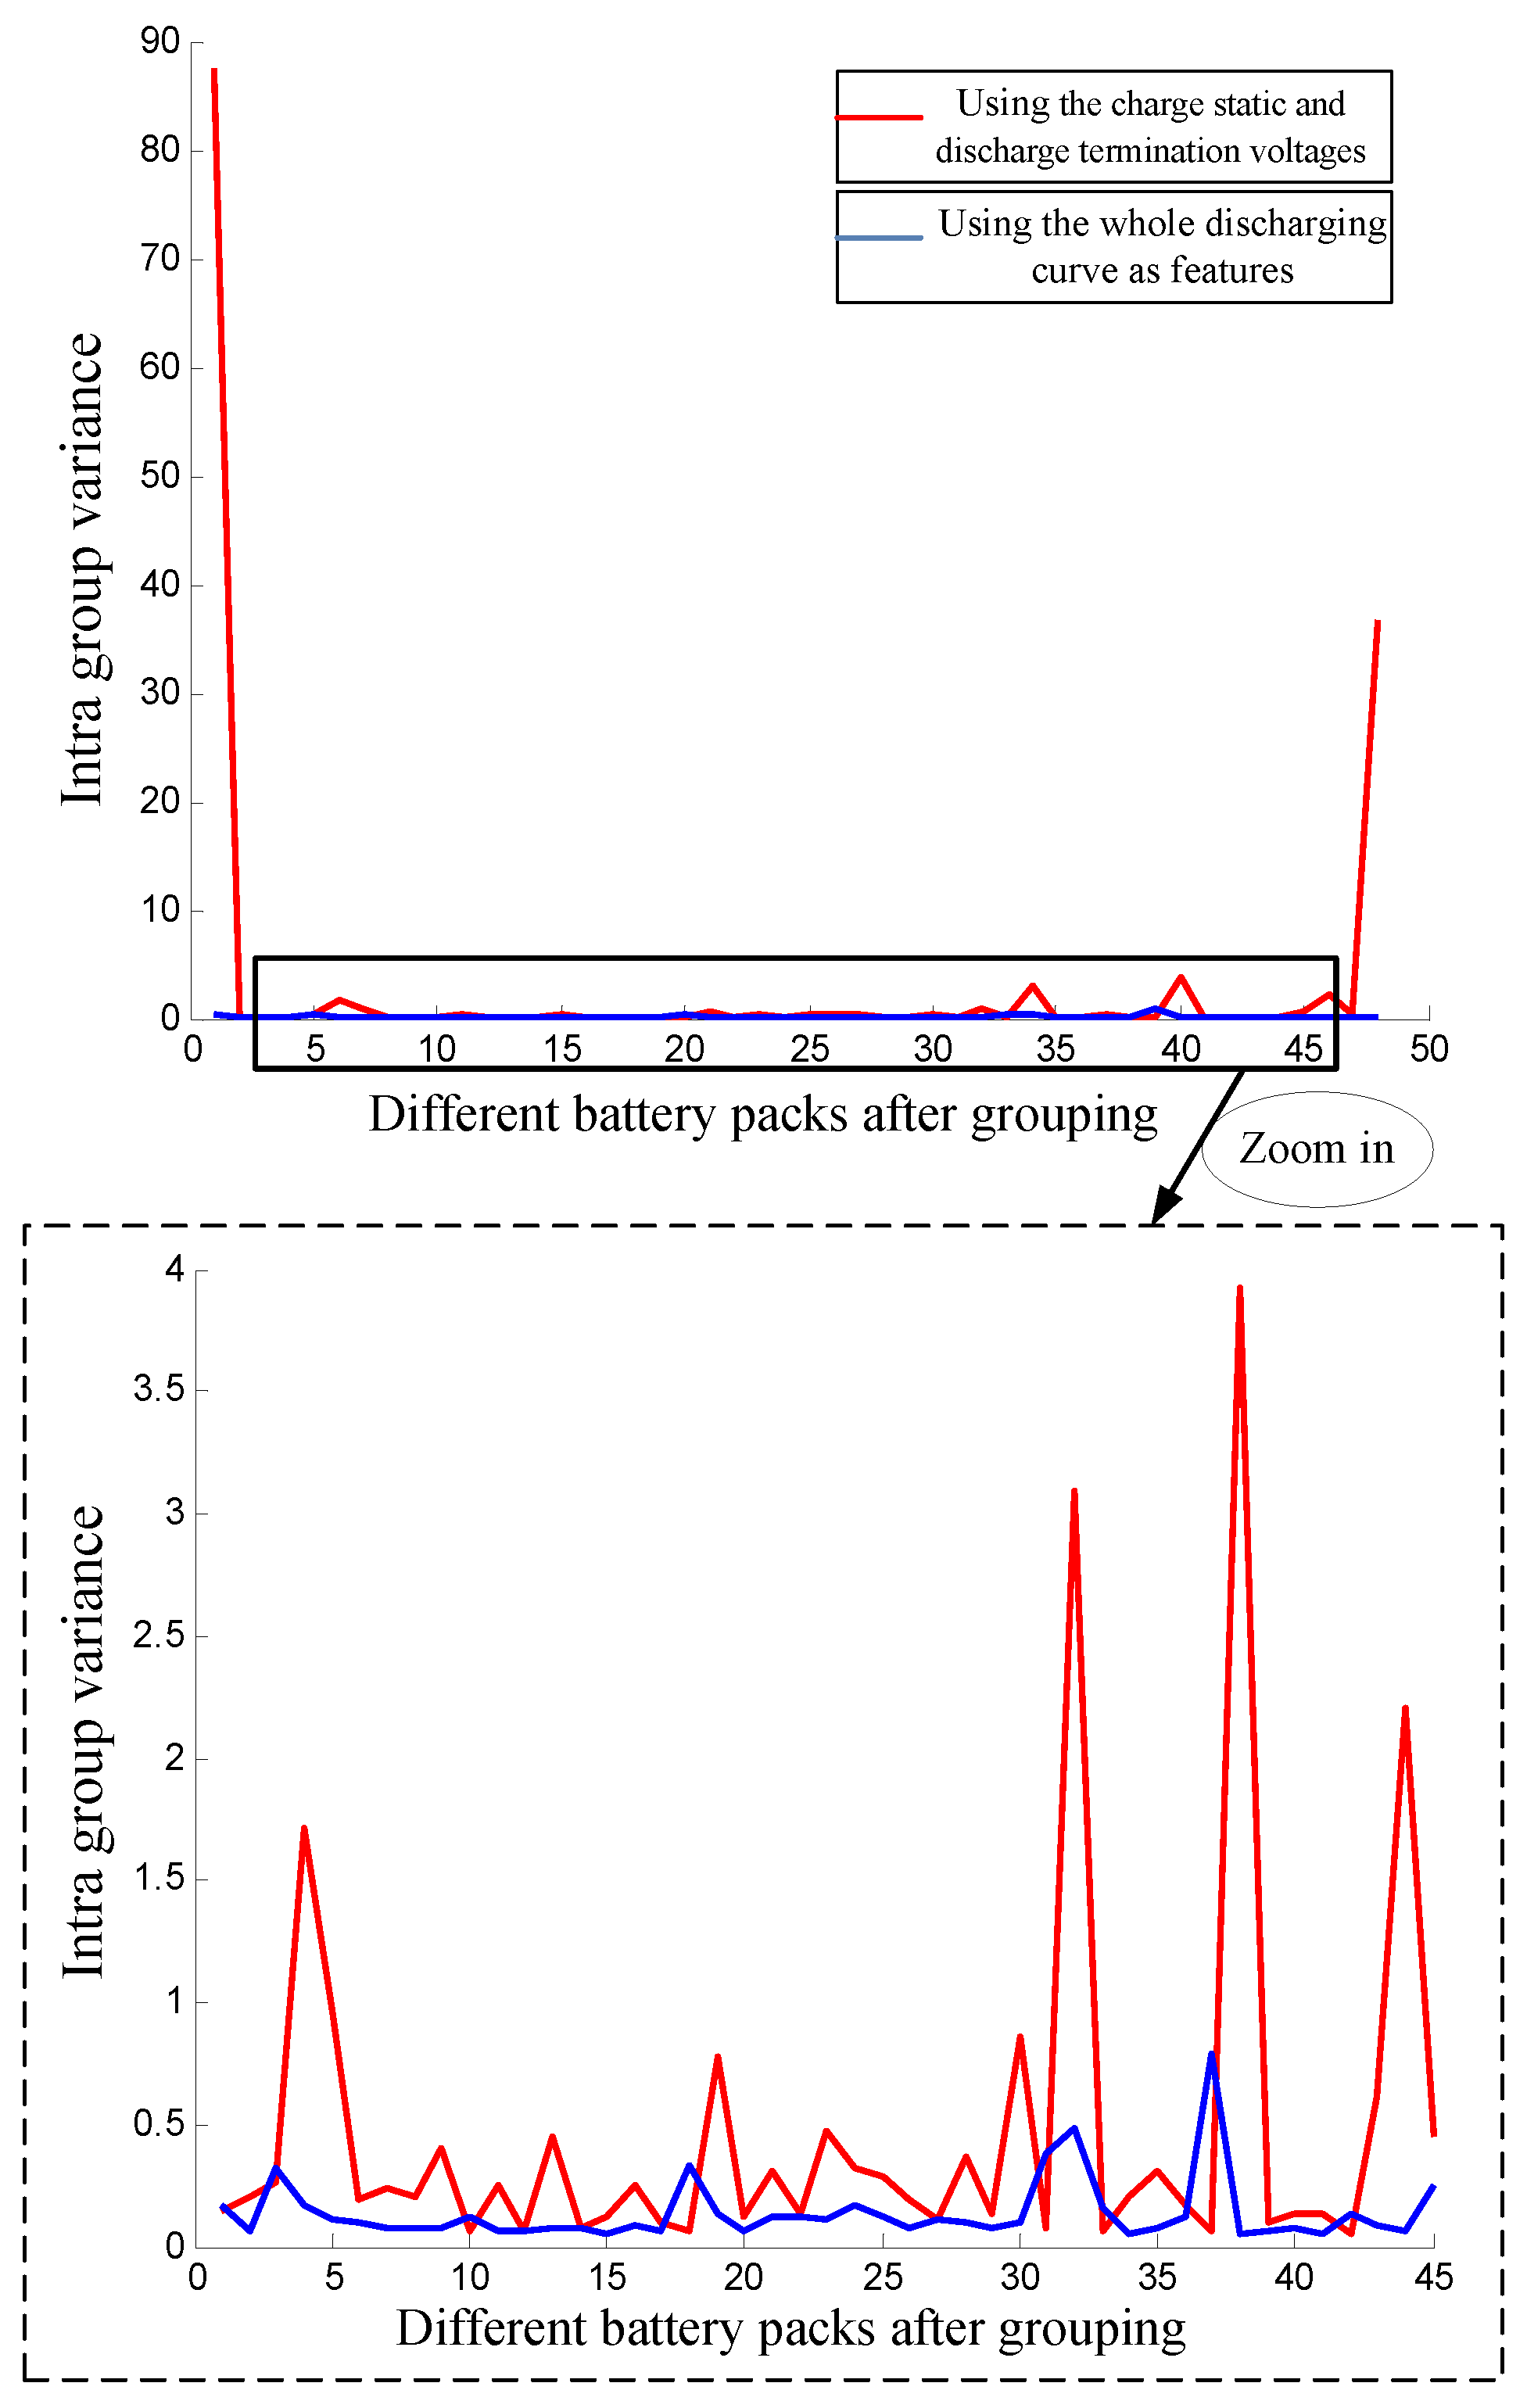
Figure 10.
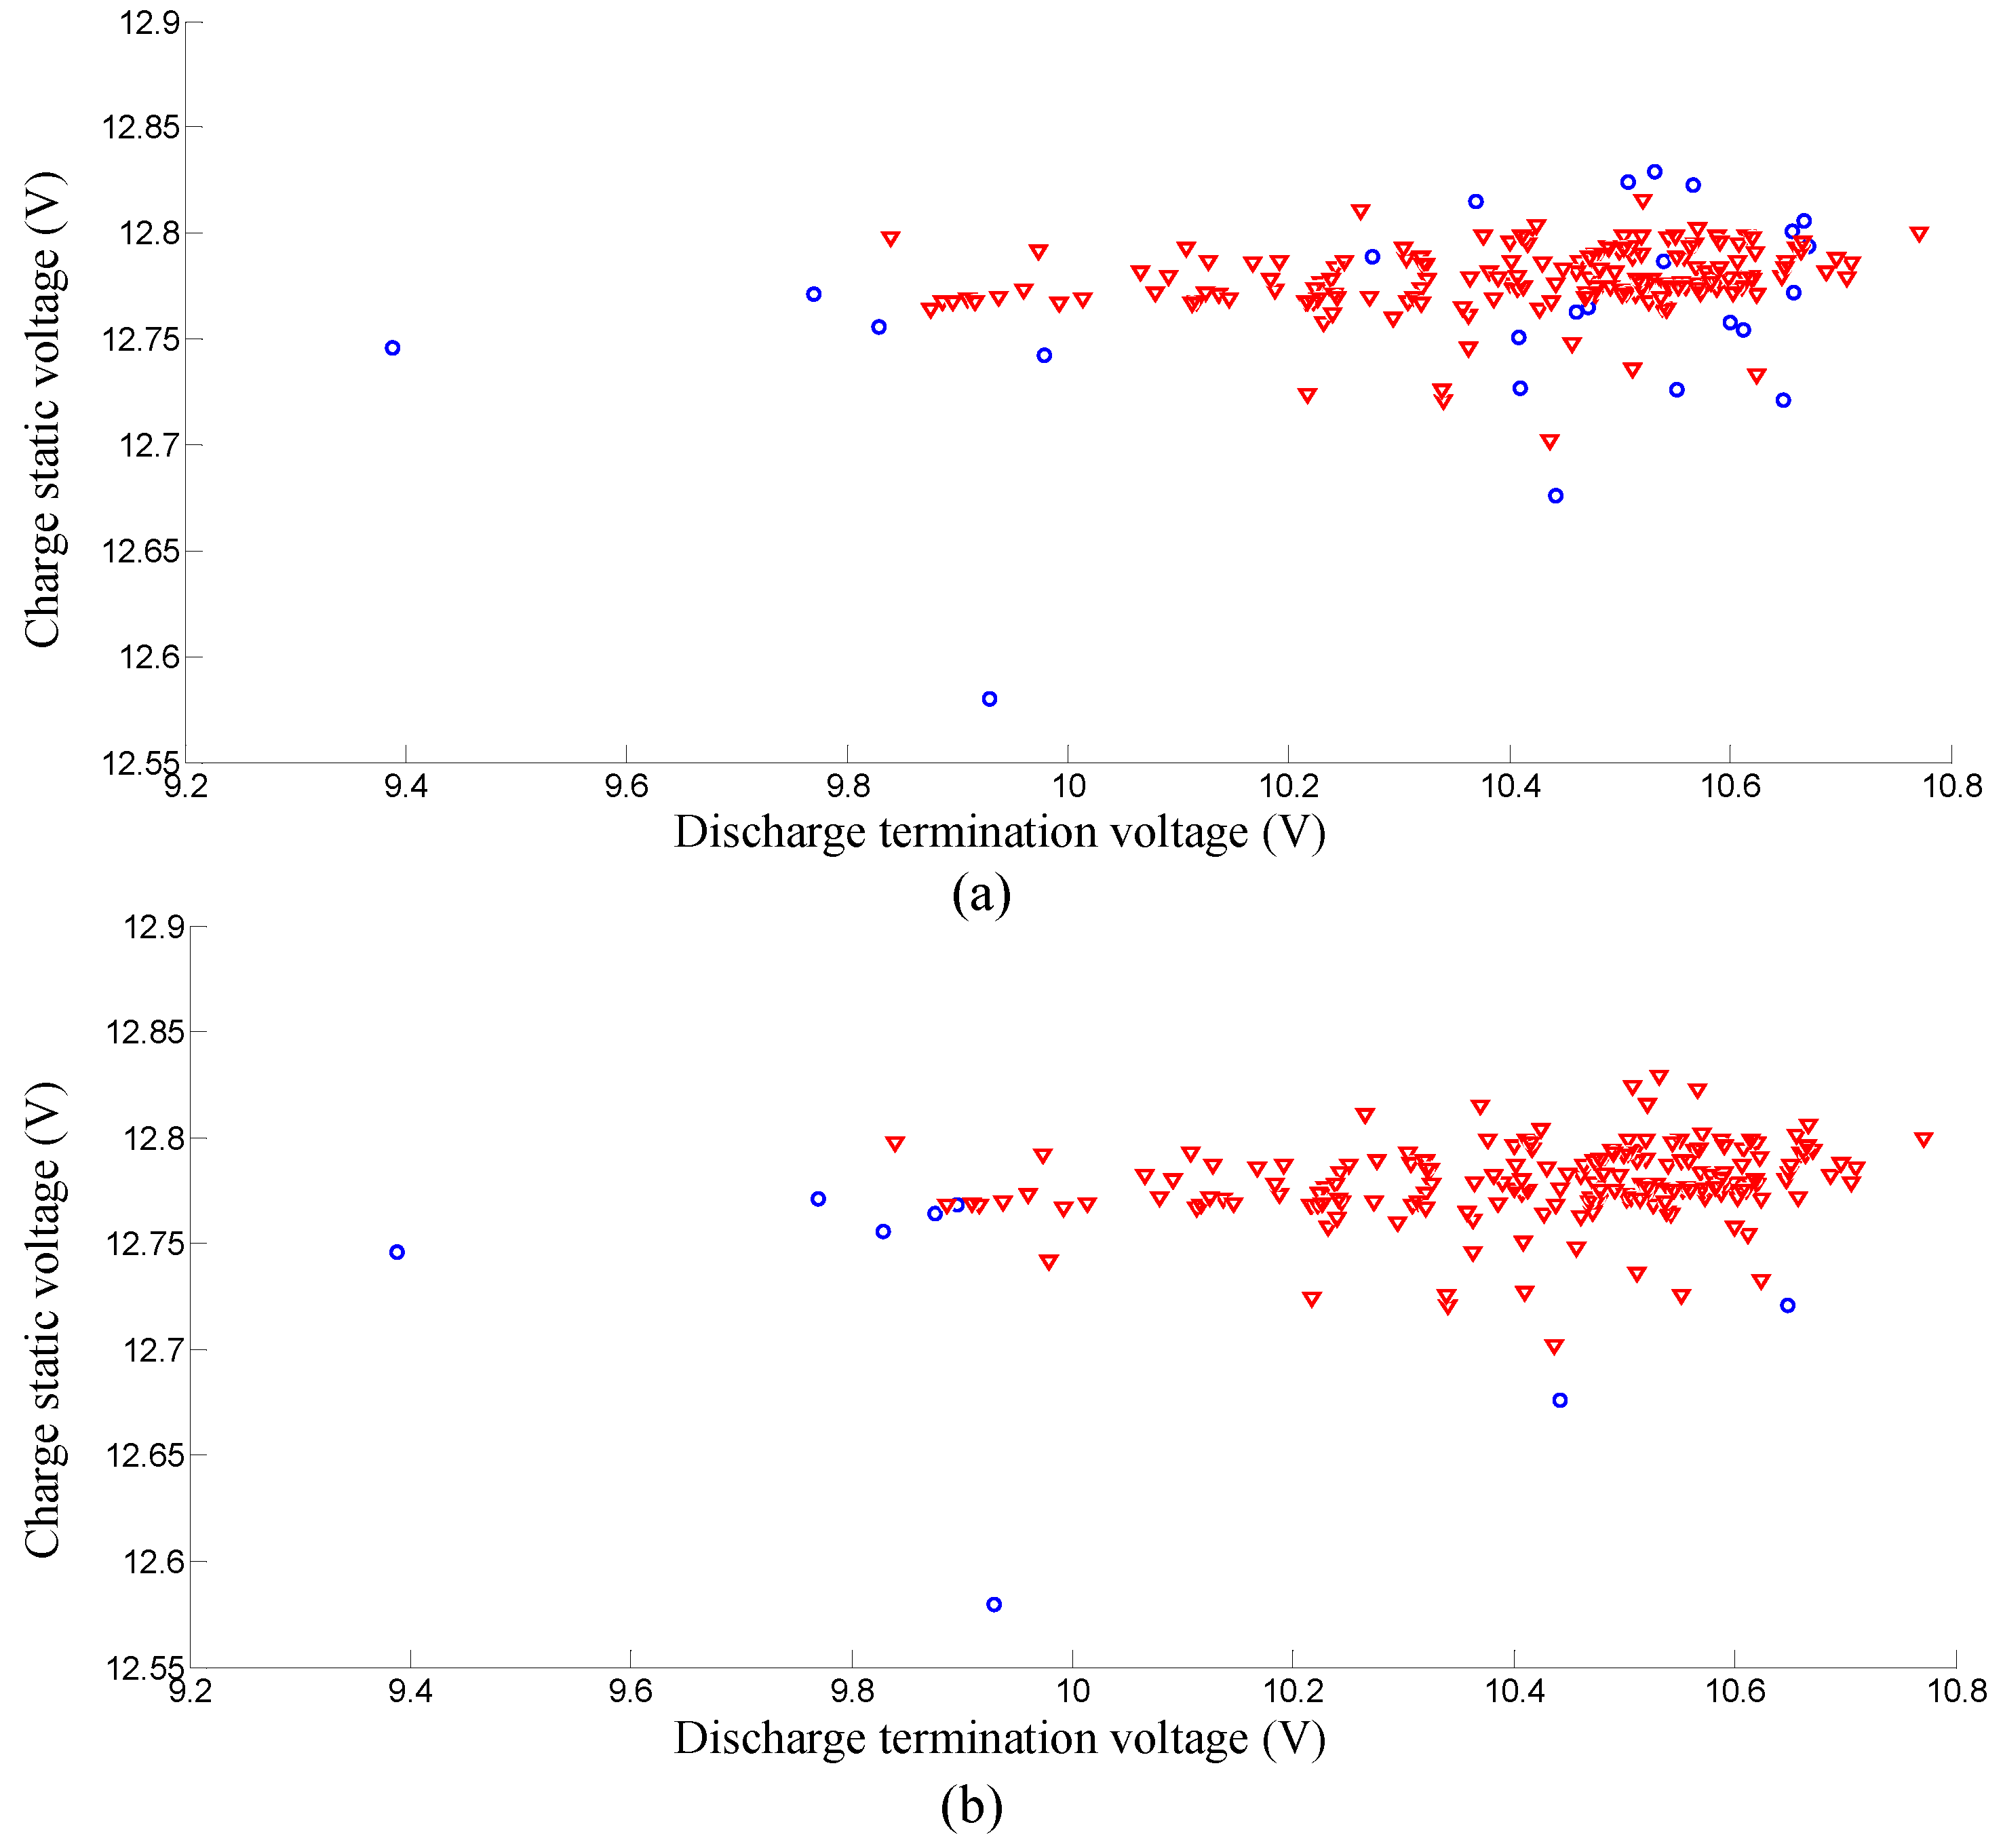
Comparison of failure amounts: (a) Results of original k-nearest-neighbor algorithm; (b) Results of the proposed method. Note that the red triangles represent the successfully-grouped batteries and the blue circles denote those grouping-failed (“orphan”) batteries.
Figure 10.
Comparison of failure amounts: (a) Results of original k-nearest-neighbor algorithm; (b) Results of the proposed method. Note that the red triangles represent the successfully-grouped batteries and the blue circles denote those grouping-failed (“orphan”) batteries.

Figure 11.
The comparison of intra-group variances: Results of original k-nearest-neighbor algorithm; Results of the proposed method. Note that the proposed method can achieve smaller variances and better intra-group consistency.
Figure 11.
The comparison of intra-group variances: Results of original k-nearest-neighbor algorithm; Results of the proposed method. Note that the proposed method can achieve smaller variances and better intra-group consistency.

Figure 12.
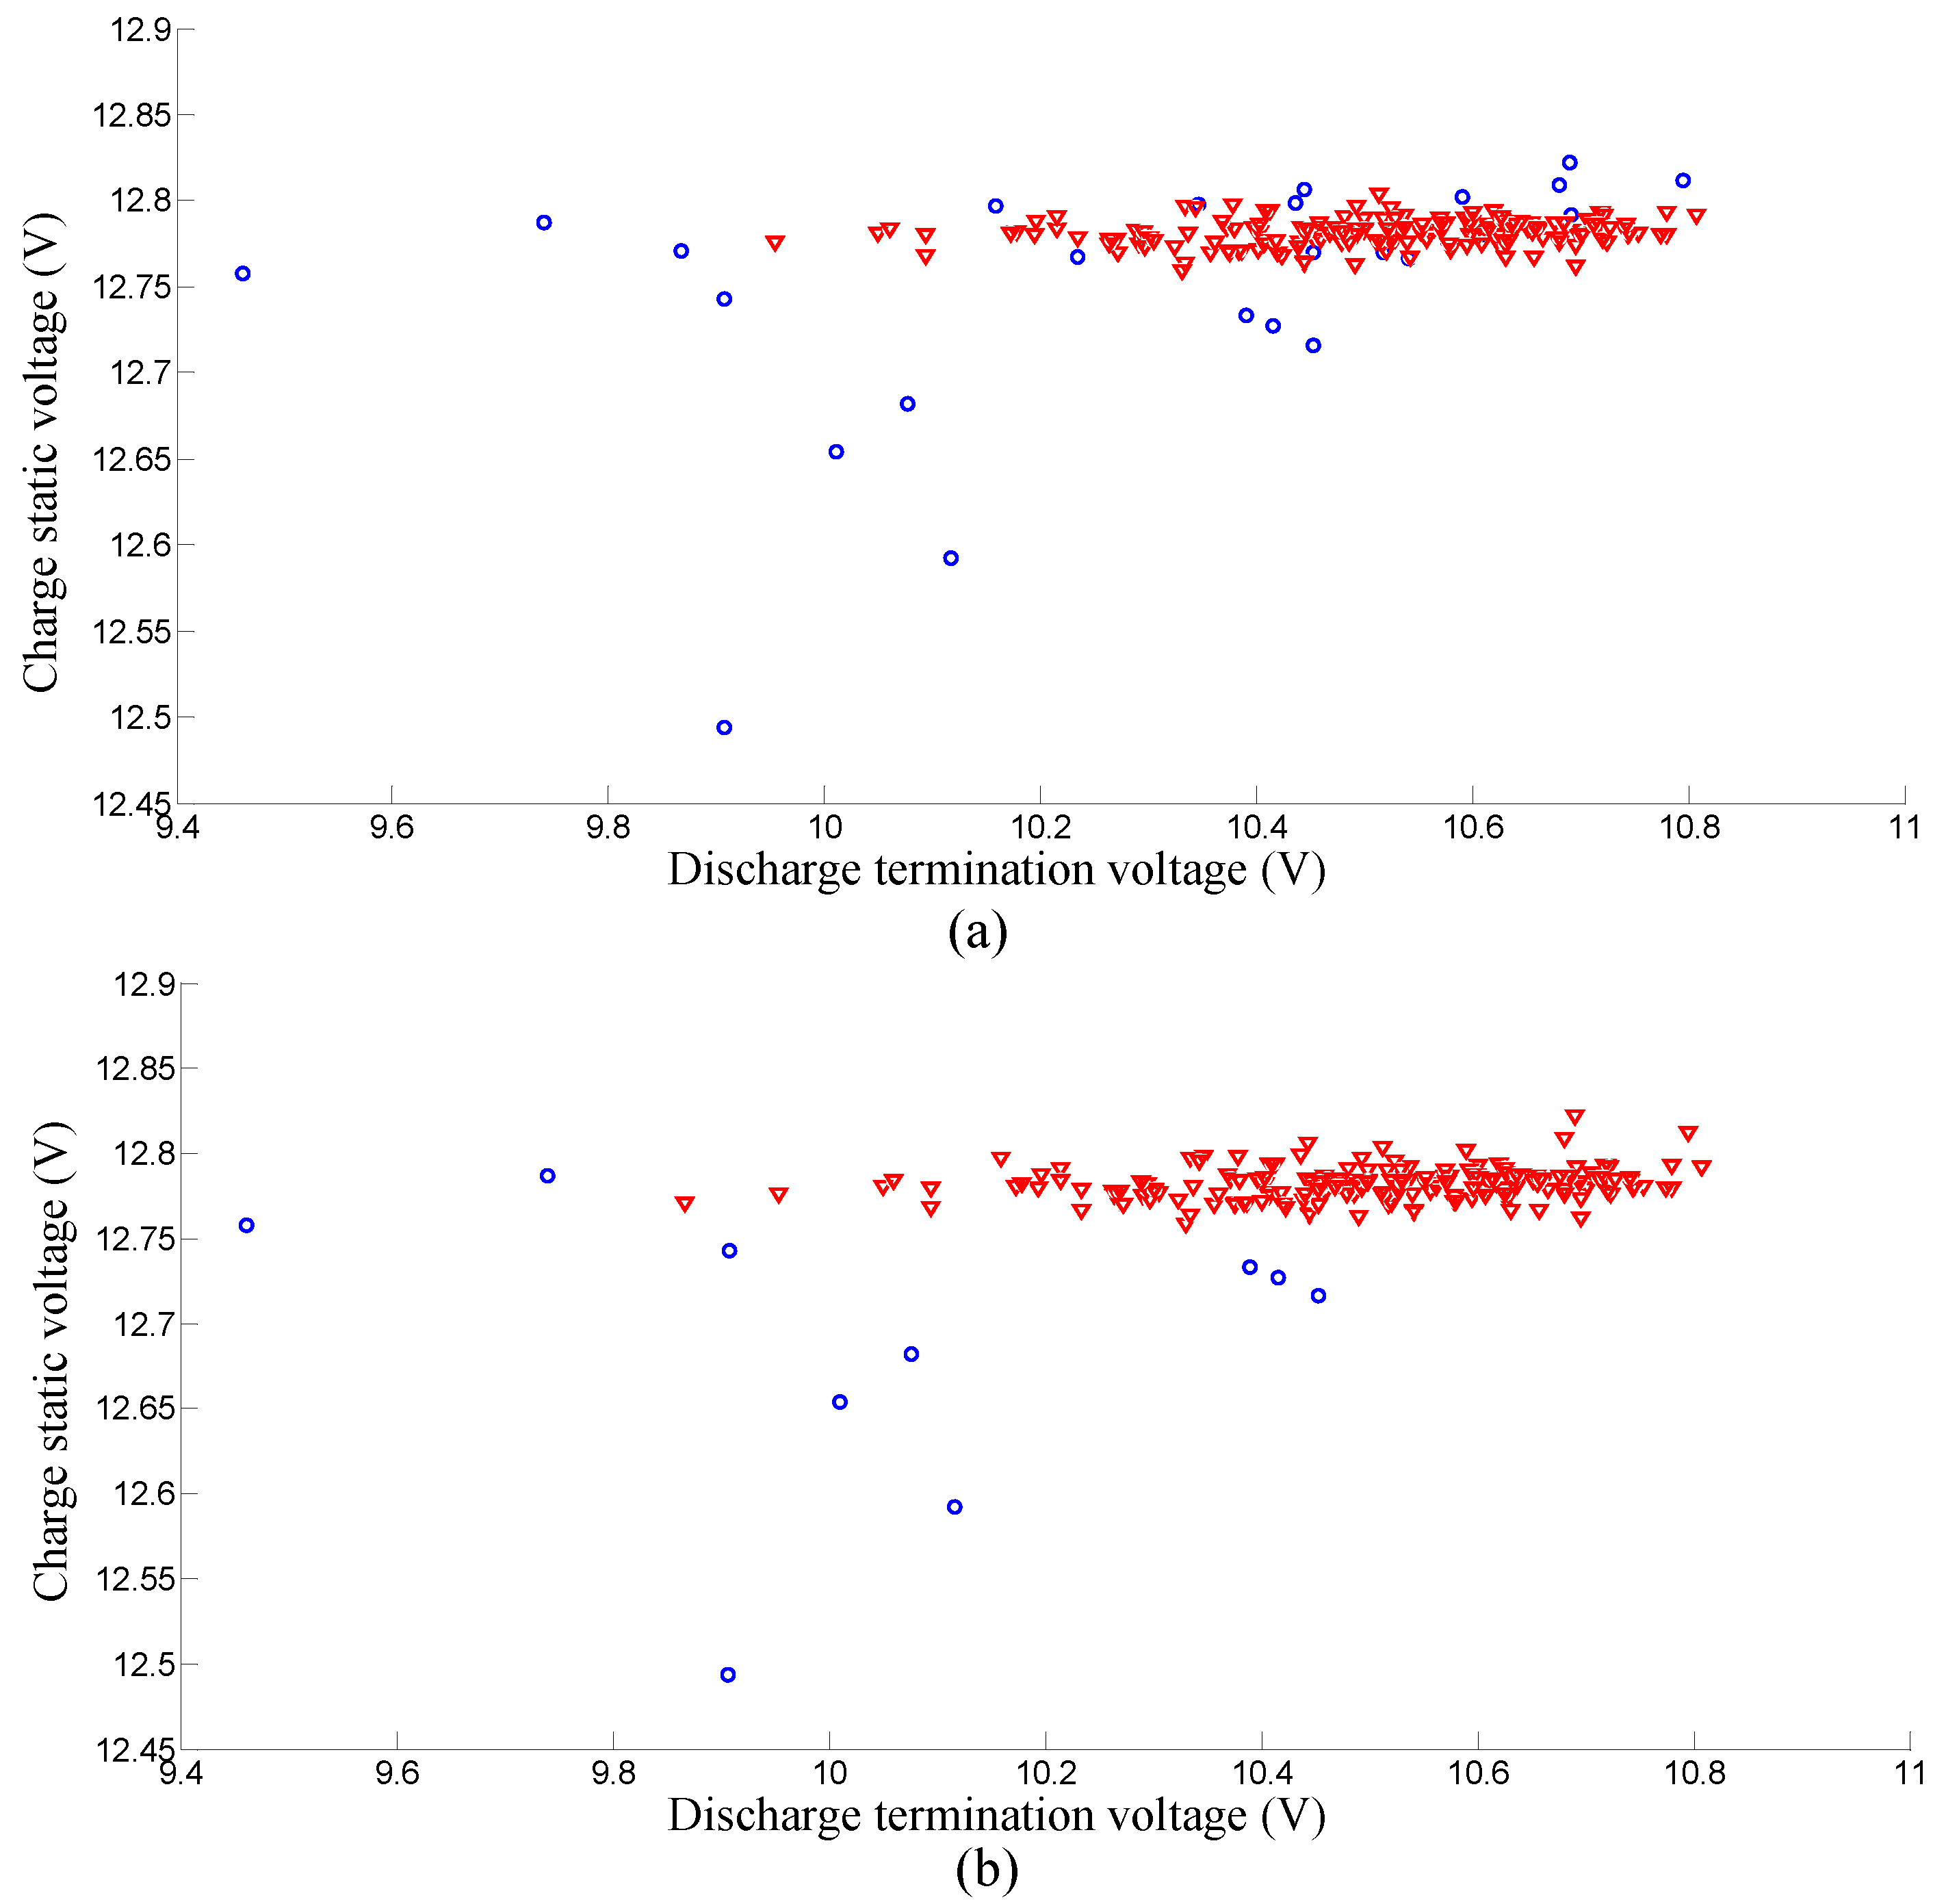
Comparison of failure amounts (): (a) Results of original k-nearest-neighbor algorithm; (b) Results of the proposed method. Note that the red triangles represent the successfully-grouped batteries and the blue circles denote those grouping-failed (“orphan”) batteries.
Figure 12.
Comparison of failure amounts (): (a) Results of original k-nearest-neighbor algorithm; (b) Results of the proposed method. Note that the red triangles represent the successfully-grouped batteries and the blue circles denote those grouping-failed (“orphan”) batteries.


Table 1.
Comparison of the intra-group variances of the proposed grouping method using different grouping features.
Table 1.
Comparison of the intra-group variances of the proposed grouping method using different grouping features.
| Features | Maximum Intra-Group Variance | Average Intra-Group Variance |
|---|---|---|
| Only using charge static and discharge termination voltages: | 87.4430 | 2.5986 |
| Using the whole discharge curves: | 0.7948 | 0.1389 |
Table 2.
Comparison between the proposed method and the original k-nearest-neighbor algorithm.
| Methods | Shelf 1 | Shelf 2 | Shelf 3 | Shelf 4 | Shelf 5 |
|---|---|---|---|---|---|
| “orphan” battery amount of k-nearest-neighbor: | 20 | 24 | 16 | 12 | 12 |
| “orphan” battery amount of the proposed algorithm: | 12 | 8 | 8 | 8 | 4 |
| Average intra-group variance of k-nearest-neighbor: | 0.1423 | 0.1255 | 0.0778 | 0.1239 | 0.1319 |
| Average intra-group variance of the proposed algorithm: | 0.1389 | 0.1003 | 0.0607 | 0.0993 | 0.0936 |
Table 3.
Comparison of grouping efficiency.
| Methods | Time Cost of Each Shelf | Time Cost Each Day |
|---|---|---|
| Manual method: | 30 min per shelf | 25 h each day |
| Proposed system: | 2 s per shelf | 100 s each day |
© 2017 by the authors. Licensee MDPI, Basel, Switzerland. This article is an open access article distributed under the terms and conditions of the Creative Commons Attribution (CC BY) license (http://creativecommons.org/licenses/by/4.0/).
Share and Cite
MDPI and ACS Style
Yang, Y.; Gao, M.; He, Z.; Wang, C. A Robust Battery Grouping Method Based on a Characteristic Distribution Model. Energies 2017, 10, 1035. https://doi.org/10.3390/en10071035
AMA Style
Yang Y, Gao M, He Z, Wang C. A Robust Battery Grouping Method Based on a Characteristic Distribution Model. Energies. 2017; 10(7):1035. https://doi.org/10.3390/en10071035
Chicago/Turabian StyleYang, Yuxiang, Mingyu Gao, Zhiwei He, and Caisheng Wang. 2017. "A Robust Battery Grouping Method Based on a Characteristic Distribution Model" Energies 10, no. 7: 1035. https://doi.org/10.3390/en10071035
Note that from the first issue of 2016, this journal uses article numbers instead of page numbers. See further details here.