Article

Matching Relationship and Alternating Injection for Polymer Flooding in Heterogeneous Formations: A Laboratory Case Study of Daqing Oilfield

1
Department of Petroleum Engineering, Missouri University of Science and Technology, Rolla, MO 65409, USA
2
College of Petroleum Engineering, Northeast Petroleum University, Daqing 163318, China
3
SINOPEC Research Institute of Safety Engineering, Qingdao 266000, China
*
Author to whom correspondence should be addressed.
Energies 2017, 10(7), 1018; https://doi.org/10.3390/en10071018
Submission received: 13 April 2017 / Revised: 10 July 2017 / Accepted: 11 July 2017 / Published: 18 July 2017
(This article belongs to the Section L: Energy Sources)

Abstract

:
A series of experiments were carried out to study the relationship between polymer and reservoir permeability, as well as the alternating injection pattern for heterogeneous formations. The polymer molecular size (MS) was studied using dynamic light scattering. The parameters such as hydraulic radius, molecular weight (MW), concentrations and salinity were studied. The injection capacity and the relationship between polymer and formation were obtained using injection experiments with natural cores, which represent different regions in the Daqing oilfield. Moreover, an improved injection pattern, alternating injection in heterogeneous formation was studied based on the injection experiments of parallel and in-layer heterogeneous artificial cores. The alternate cycle and slug size were investigated. It was proven that the alternating injection can improve the efficiency of low permeability layers up to 7.3% and a mean value of 4.27%. It was also found that the mechanism of alternating injection is blocking the high permeability layers and improving the water injection profile. We suggest that other fields with high heterogeneity could try the alternating injection to optimize the polymer flooding. Meanwhile, further pilot tests or numerical simulation of polymer alternating injection in heterogeneous formation (formation type II) should be conducted.

1. Introduction

Due to the clear and in-depth understanding about the mechanism of polymer flooding (PF) and its easy implementation, many countries began to study PF earlier. America started the laboratory experiments in 1950s, and the field tests were carried out in 1964. Soon after, the Former Soviet Union and Canada carried out the pilot tests. After the 1980s, the PF technology was developed rapidly in China, and we have received some cognitions [1], not only in the oil production but also the mechanism of polymer flooding. The Daqing oilfield had started to use PF in industrial processes since 1996 and made a huge success. There are about 68 blocks that have been flooded with polymer. The annual production of tertiary oil recovery is above 10 million tons, and the PF is an important support for the stable production at Daqing oilfield [2]. It has been proven in various studies that the enhanced oil recovery (EOR) mechanism of PF is not only reducing the oil–water mobility ratio or expanding swept volume, but also improving the microscopic oil displacement efficiency [3,4,5]. Qian Genbao [6] studied the microscopic mechanism of PF in glutenite reservoir by means of computed tomography (CT) scanning and nuclear magnetic resonance (NMR) approach, and concluded that the pore radius of oil in the range of 1~10 μm contributes most to the polymer recovery. Wang et al. [7] had analyzed the changes in micro forces between polymer and residual oil, they studied the elastic properties using mathematical simulation and lab tests, and further understood the mechanism of PF. Huh et al. [8] had carried out a detailed study on the residual oil of PF using core flooding tests and simulations and it has been concluded that the PF for the second time could reduce the saturation of residual oil, while a PF for the third time will be useless.
Conventionally, it is considered that the PF is suitable for the homogenous layers, which have a certain thickness. During the development of the Daqing oilfield, most of the type I formations in Daqing placanticline have finished PF and entered into subsequent water flooding stage. Therefore, the main objects of PF turned into type II formation, which has strong heterogeneity between layers in vertical direction and the sedimentary facies changed complex on the plane, and the connections between sand bodies are poor [9,10]. This kind of reservoir leads to a severe regional problem. Thus, the characteristic designs and effective tracking adjustments of polymer in type II formation should be studied, based on the successful application of polymer flooding in the type I formations. In light of the PF in type II formation, our studies started from the relationship between polymer and permeability. The purpose of this paper is to investigate and provide the relationship of polymer properties (concentrations and molecular weight (MW)) and reservoir permeability, which can be used for type II formation in Daqing oilfield. The paper also provides an optimized injection pattern and experimental evidence, which prove that the alternating injection can yield a better effect for PF in heterogeneous formations. The process of studying relationship between polymer and reservoir permeability as well as the injection pattern of alternating injection could draw some inspiration to others blocks, during the design of PF.

2. Relationship between Polymer Molecular and Reservoir Permeability

To realize the characteristic design for heterogeneous formation, especially the type II formation in Daqing, the relationship between polymer and reservoir permeability should be studied. We investigated the effects of major parameters of polymer, such as MW, molecular size (MS) and concentration using injection experiments.

2.1. The Measure of Polymer Molecular Size (Application of Light Scattering Theory)

Light scattering is of two types: (i) Static light scattering (SLS) and (ii) Dynamic light scattering (DLS). For 20 years, DLS has been widely used in the measurement of polymer Rh (Hydrodynamic Radius) [11]. The main principle of DLS: polymer molecules have Brownian motion in aqueous solution. As a result, the frequency of incident light and the scattered light is not equal, using which the translational and rotational diffusion coefficients can be calculated [12]. In the study of the polymer MS under different conditions, the size of polymer-coil can be seen as an equivalent sphere of diameter Dh, and the radius of microspheres is regarded as Rh (hydrodynamic radius) of polymer molecular [13]. The Rh being:
R h = K B T 3 π η D
where KB refers to the Boltzmann constant, T is the absolute temperature, η is the solvent viscosity, D is the diffusion coefficient.
The experimental conditions include wide-angle dynamic/static light scattering equipment BI-200 SM made by Brookhaven USA (New York, NY, USA), Partially Hydrolyzed Polyacrylamide (HPAM) made by the Daqing Refining & Chemical Company (Daqing, China), the scattering angle of dynamic testing is 90°, and the experimental temperature is 20 °C. The polymer parameters studied in the paper are MW, concentration and solution salinity, which influence Rh.

2.2. The Relationship between Molecular Size and Polymer Parameters

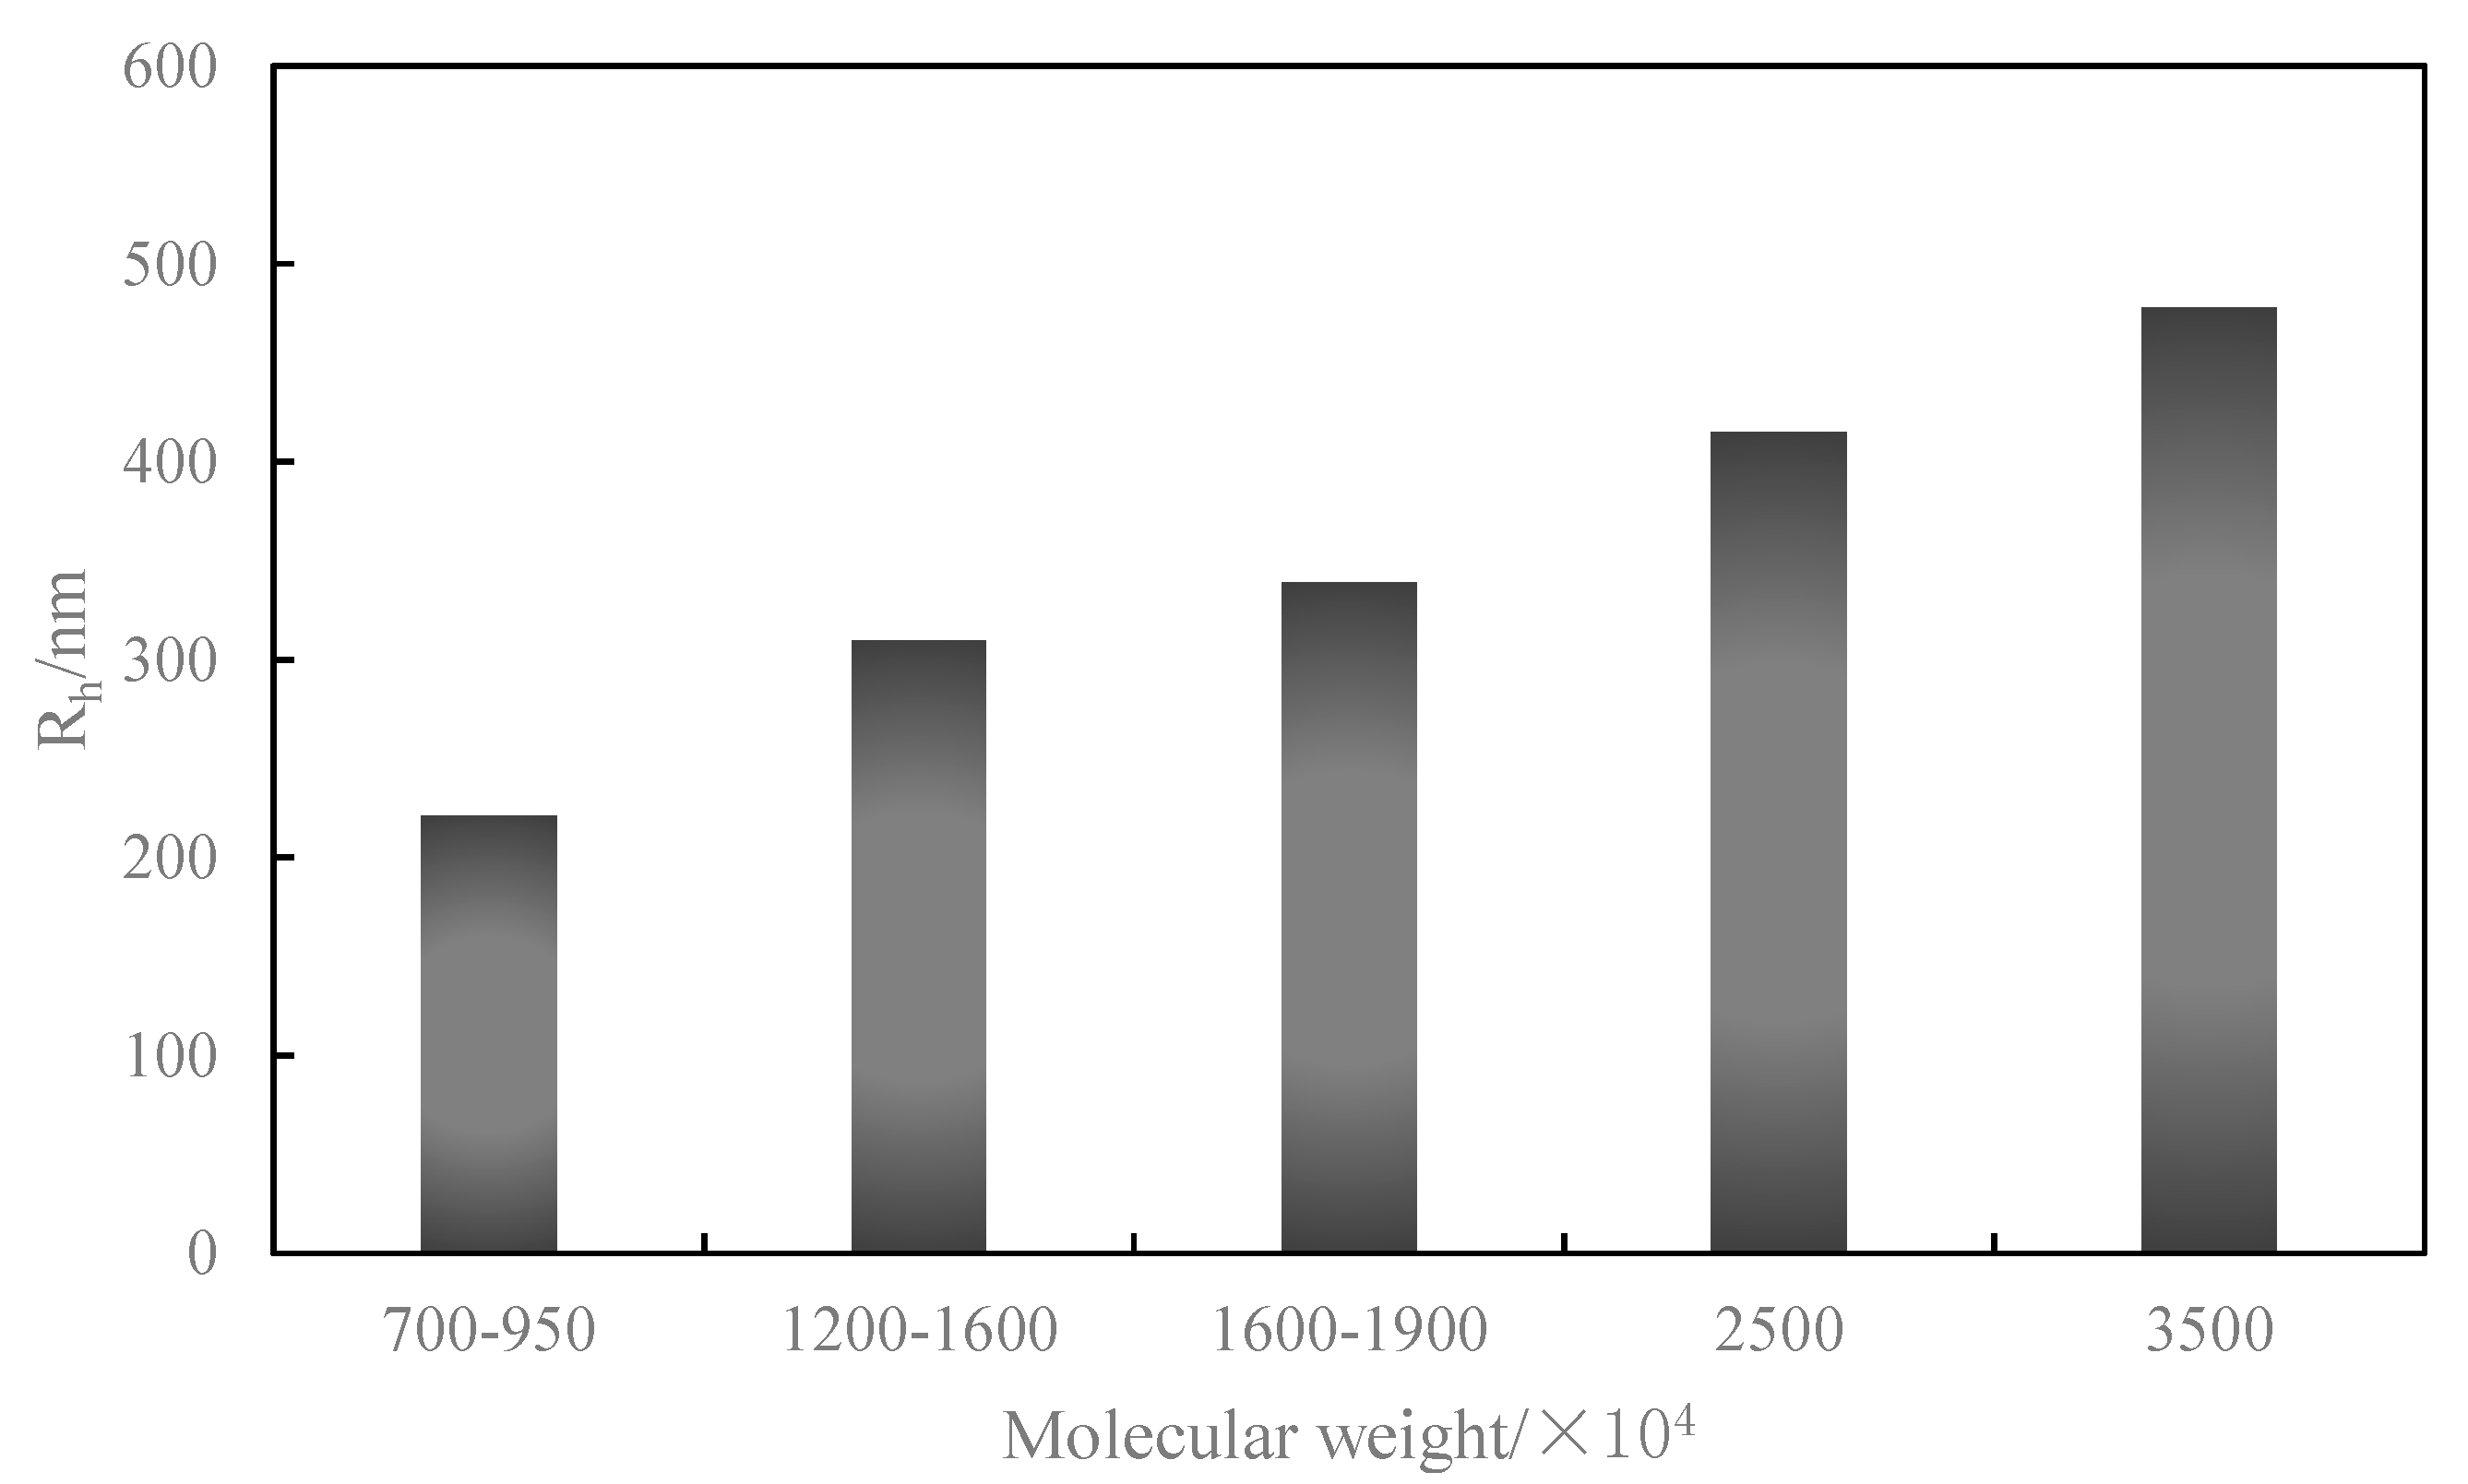
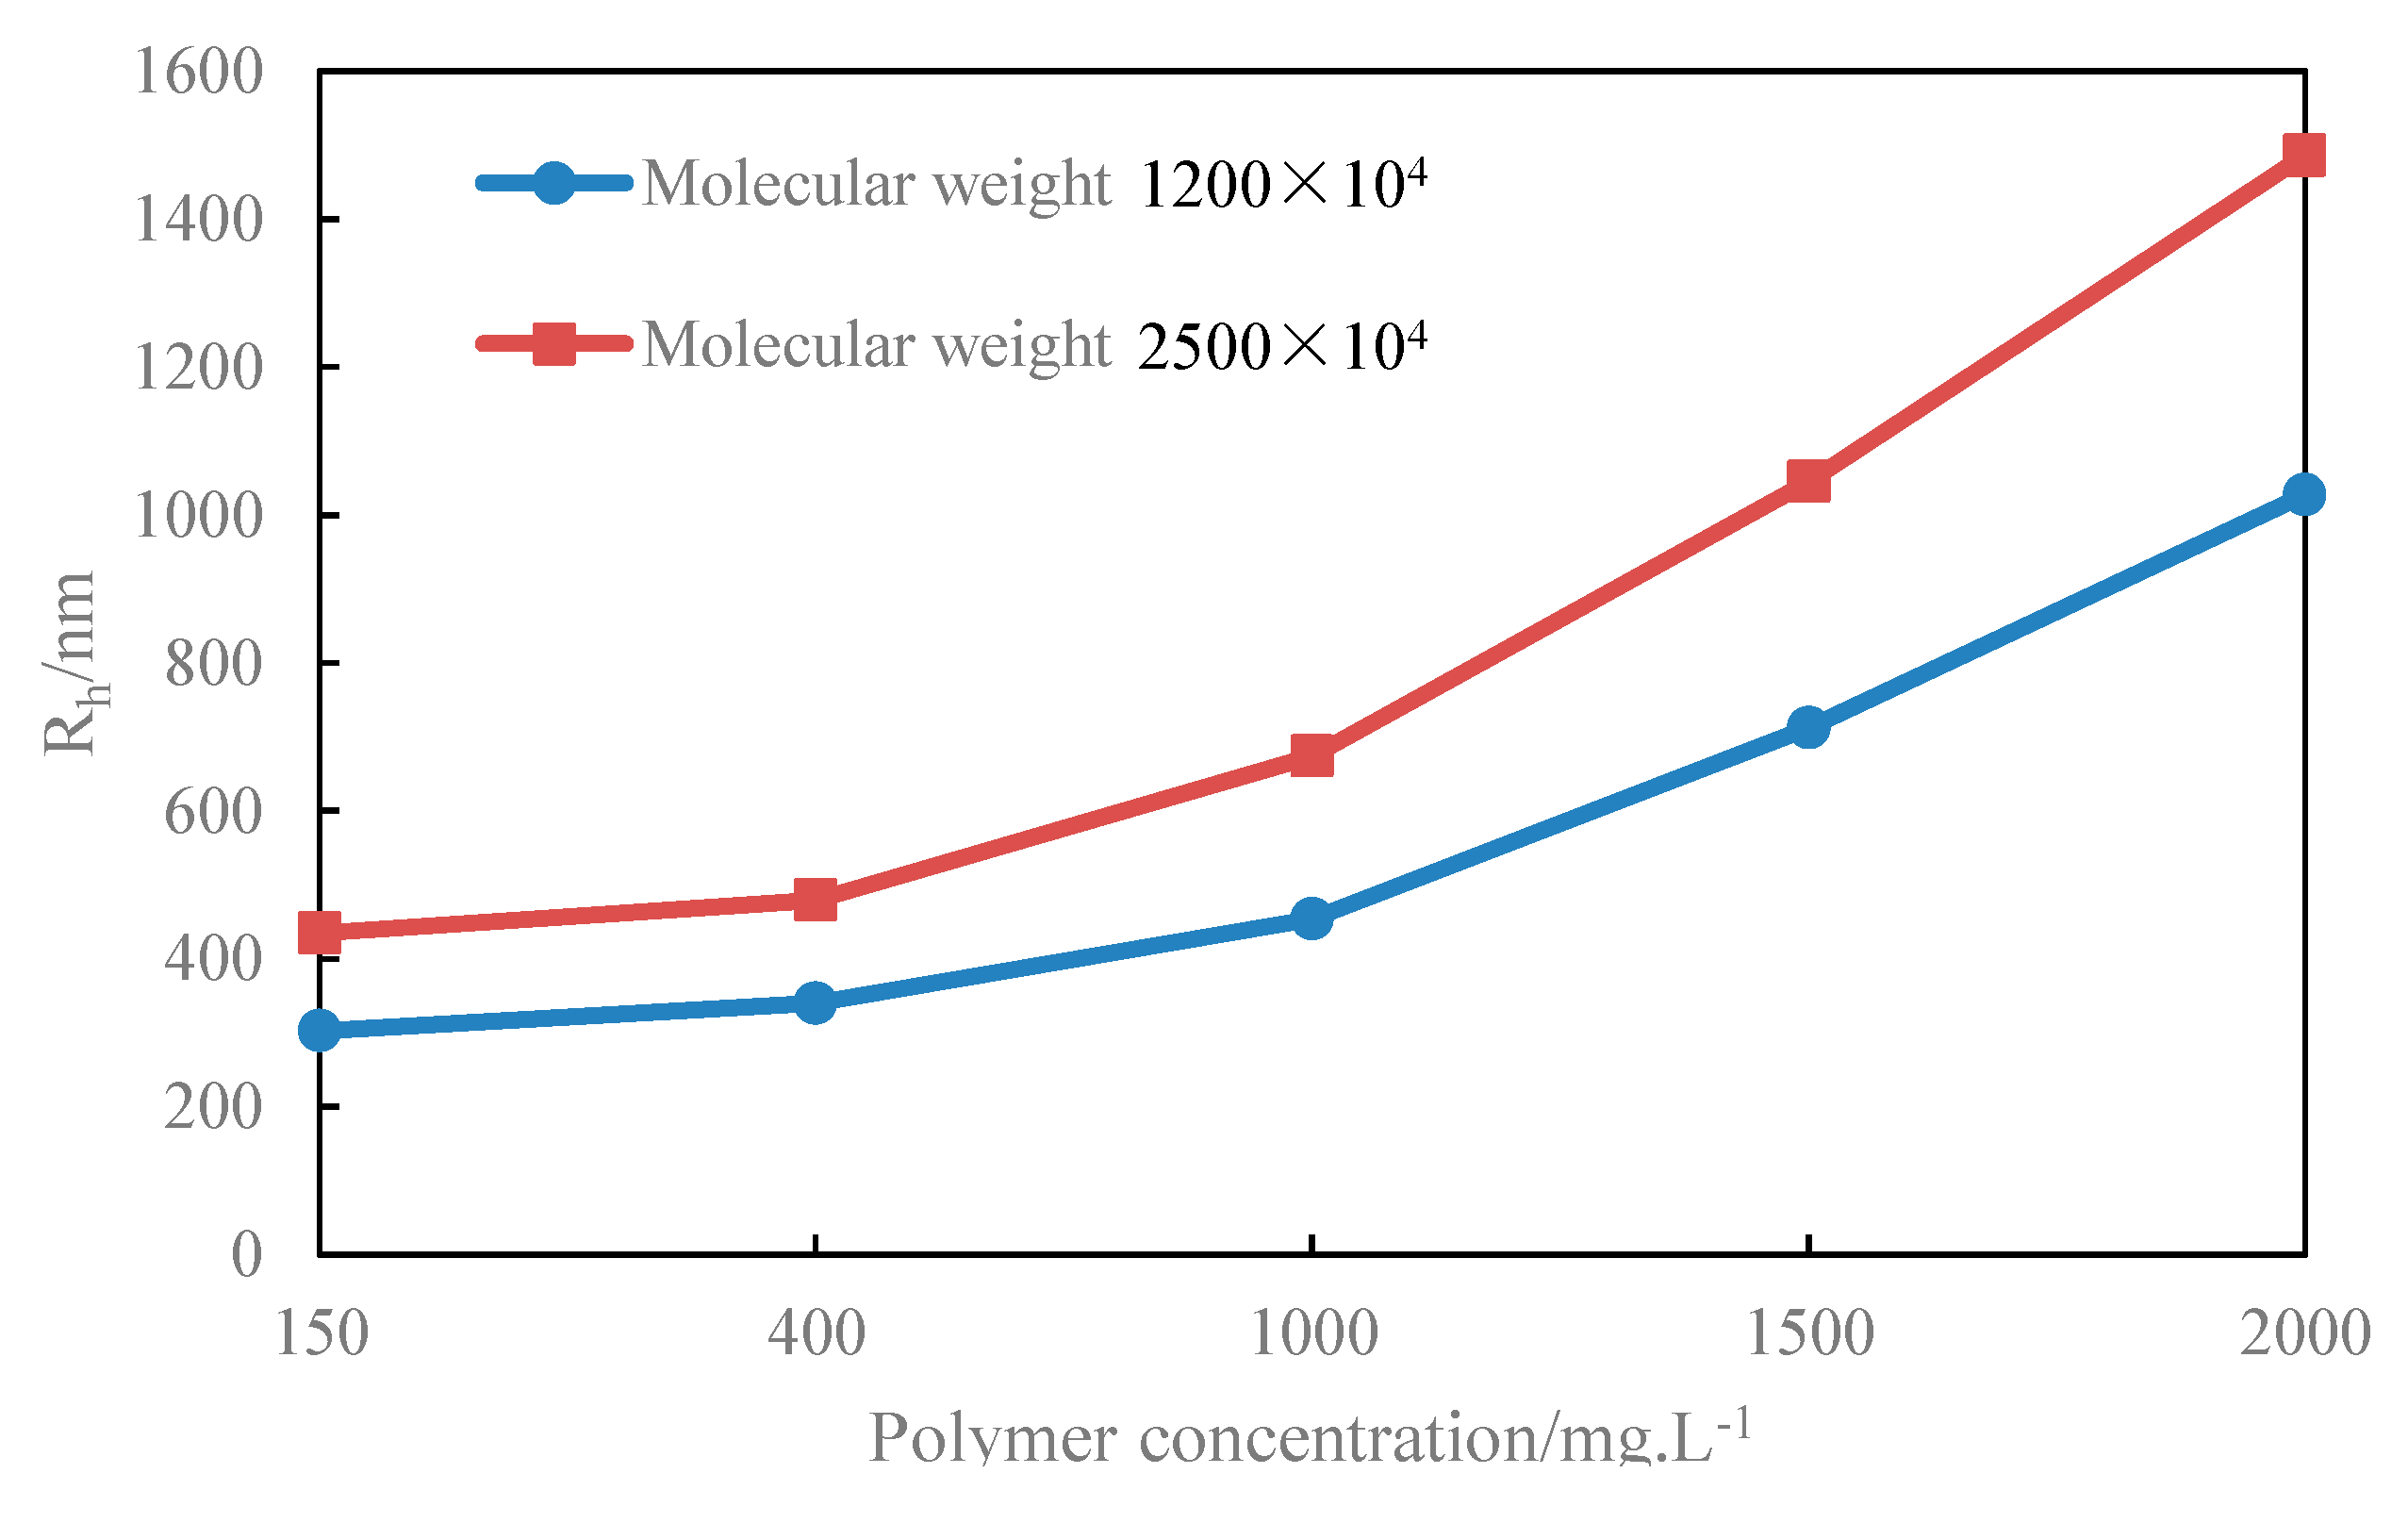
2.2.1. The Relationship between Rh and Polymer Molecular Weight

First, we studied the influence of polymer MW on MS. The salinity (NaCl) of water considered during this experiment is 4000 mg/L and the polymer concentration is 150 mg/L. It can be seen in Figure 1 that Rh increases significantly with the increase of MW. Under the conditions mentioned above, the Rh reaches 200 nm when the average viscosity MW is 700 × 104, and the Rh reaches 500 nm when the average viscosity MW is 3500 × 104. It can be seen that the Rh of polymer molecule became higher as the MW increased. This is due to the polymer molecular appearing as chain-like in water and there are lateral groups with strong polarity on chains, such as –CONH2 and –COONa. The hydrogen bonding is very strong, which results in crosslink between the chains of different molecules and makes up a space network structure. The chain length grows longer as the MW increases, the chains are more likely to intertwine to form a more complex network structure with high MW polymer.

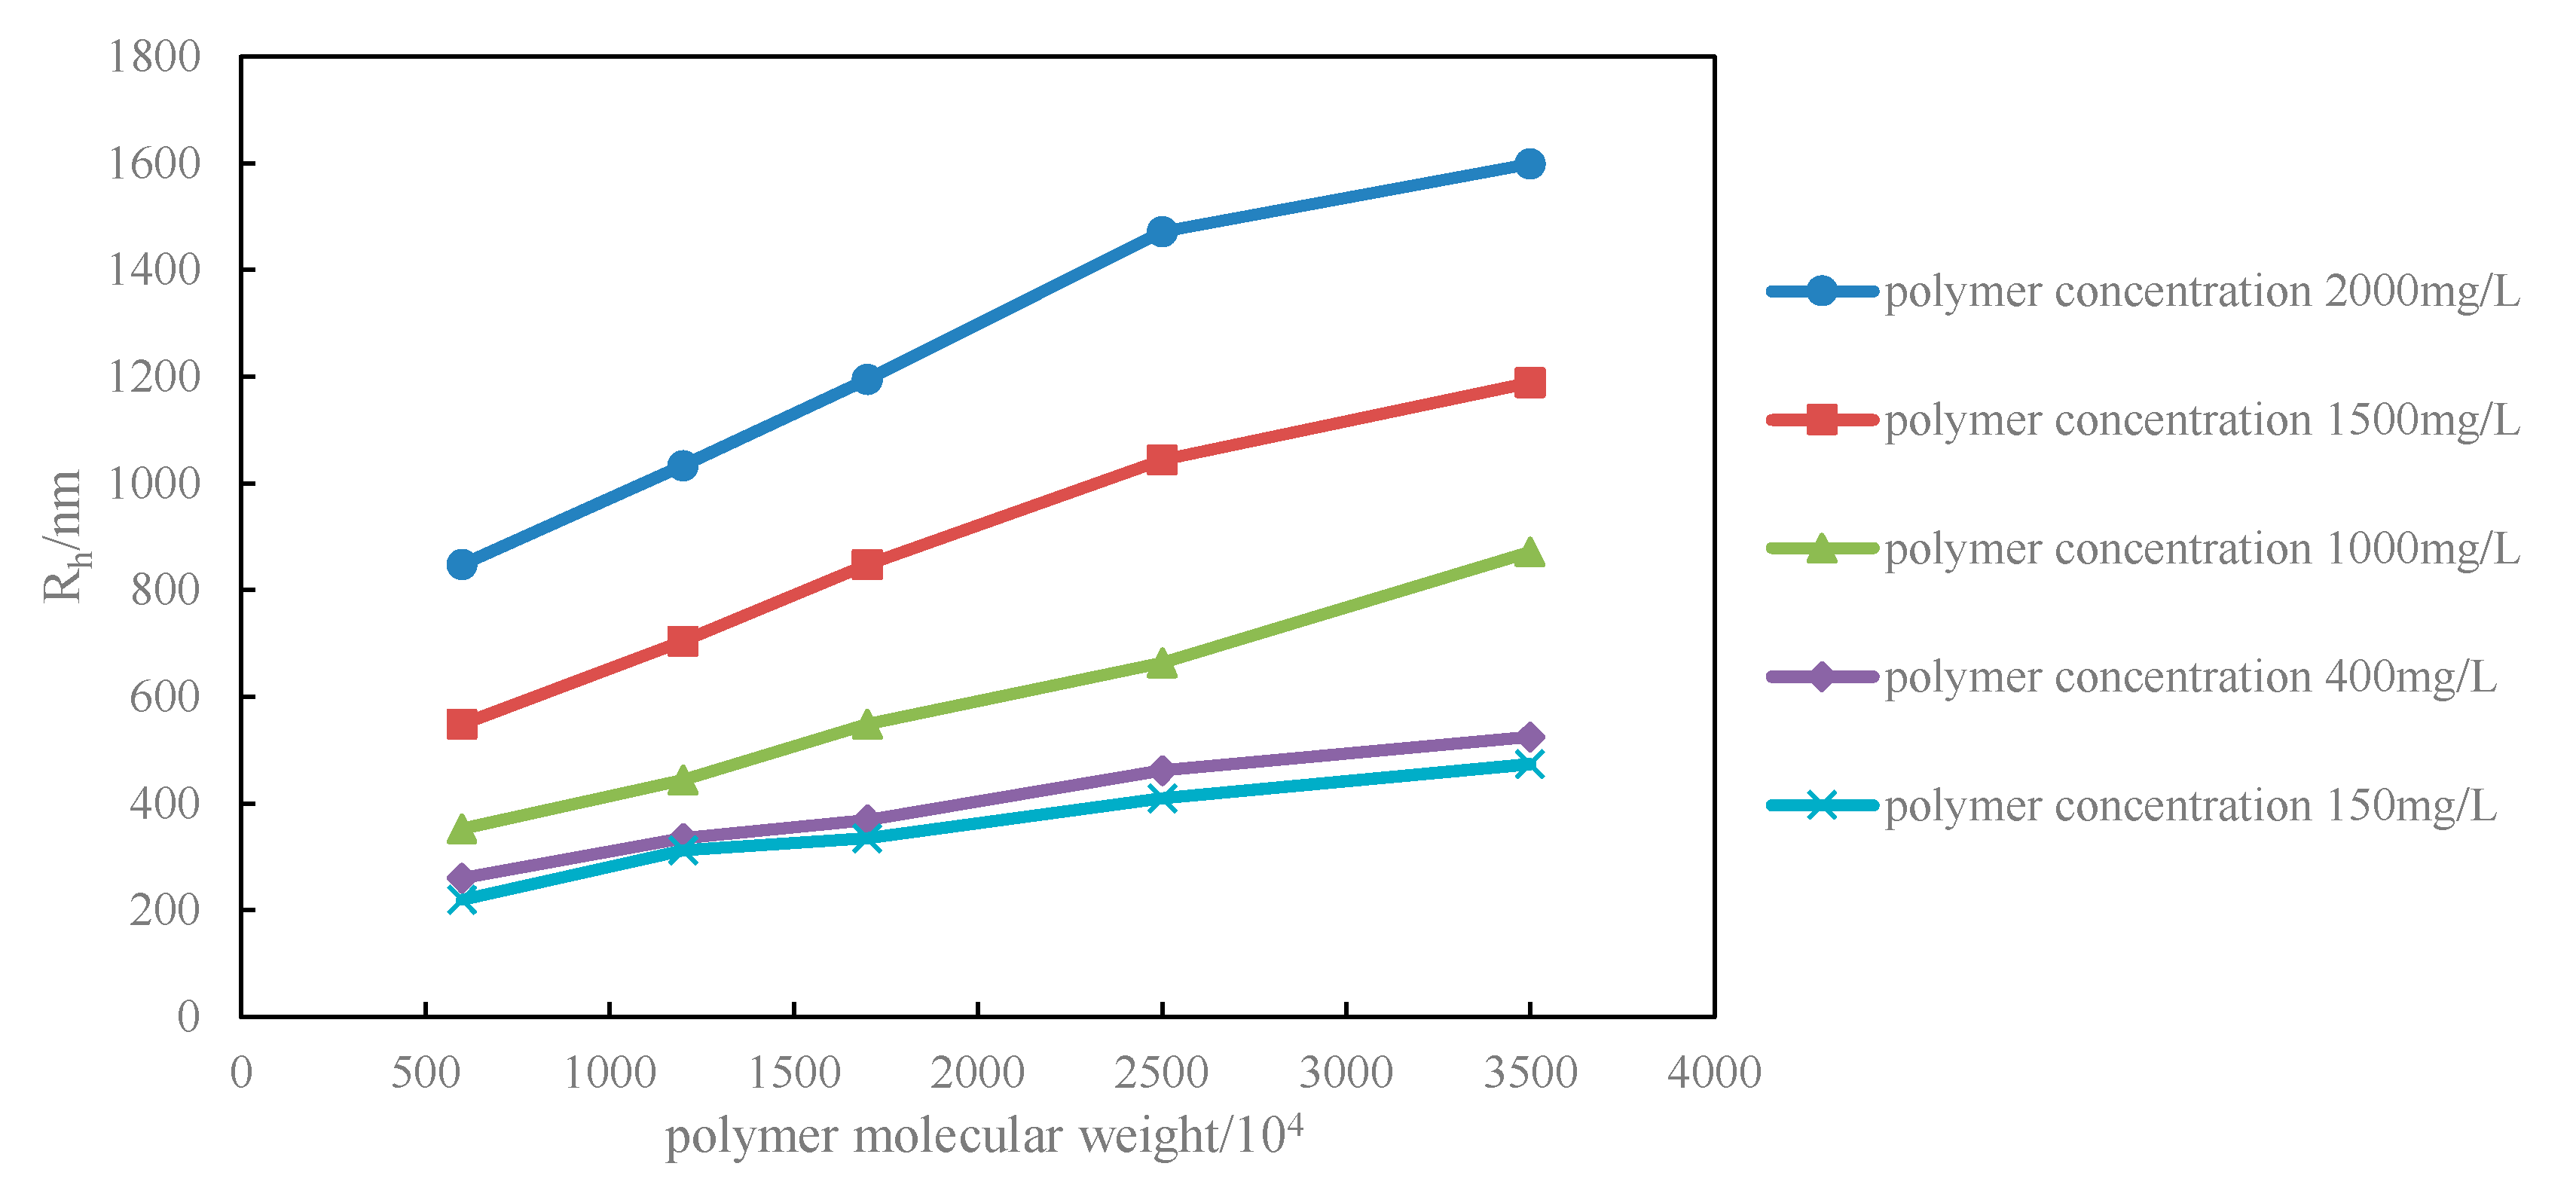
2.2.2. The Relationship between Rh and Polymer Concentration

The salinity of solution is also 4000 mg/L, and two kinds of polymers are chosen. The average viscosity MW of polymers is 1200 × 104 and 2500 × 104. The results are shown in Figure 2. It can be seen that Rh increases as the concentration increases. Along with the growth of MW, the impacts of concentration on Rh become greater. For the same MW, when the polymer concentration of 2000 mg/L is compared with 150 mg/L, the Rh is three times higher. It is because the molecules are relatively independent of each other when the polymer concentration is low, the chains rarely winding or interpenetrating, which results in smaller Rh. While the number of molecules increase as the concentration grows higher, the molecular coils are easily tangled. Therefore, the molecular coils are tangled and wrapped together as the concentration increases, which increases the Rh of polymer molecule.

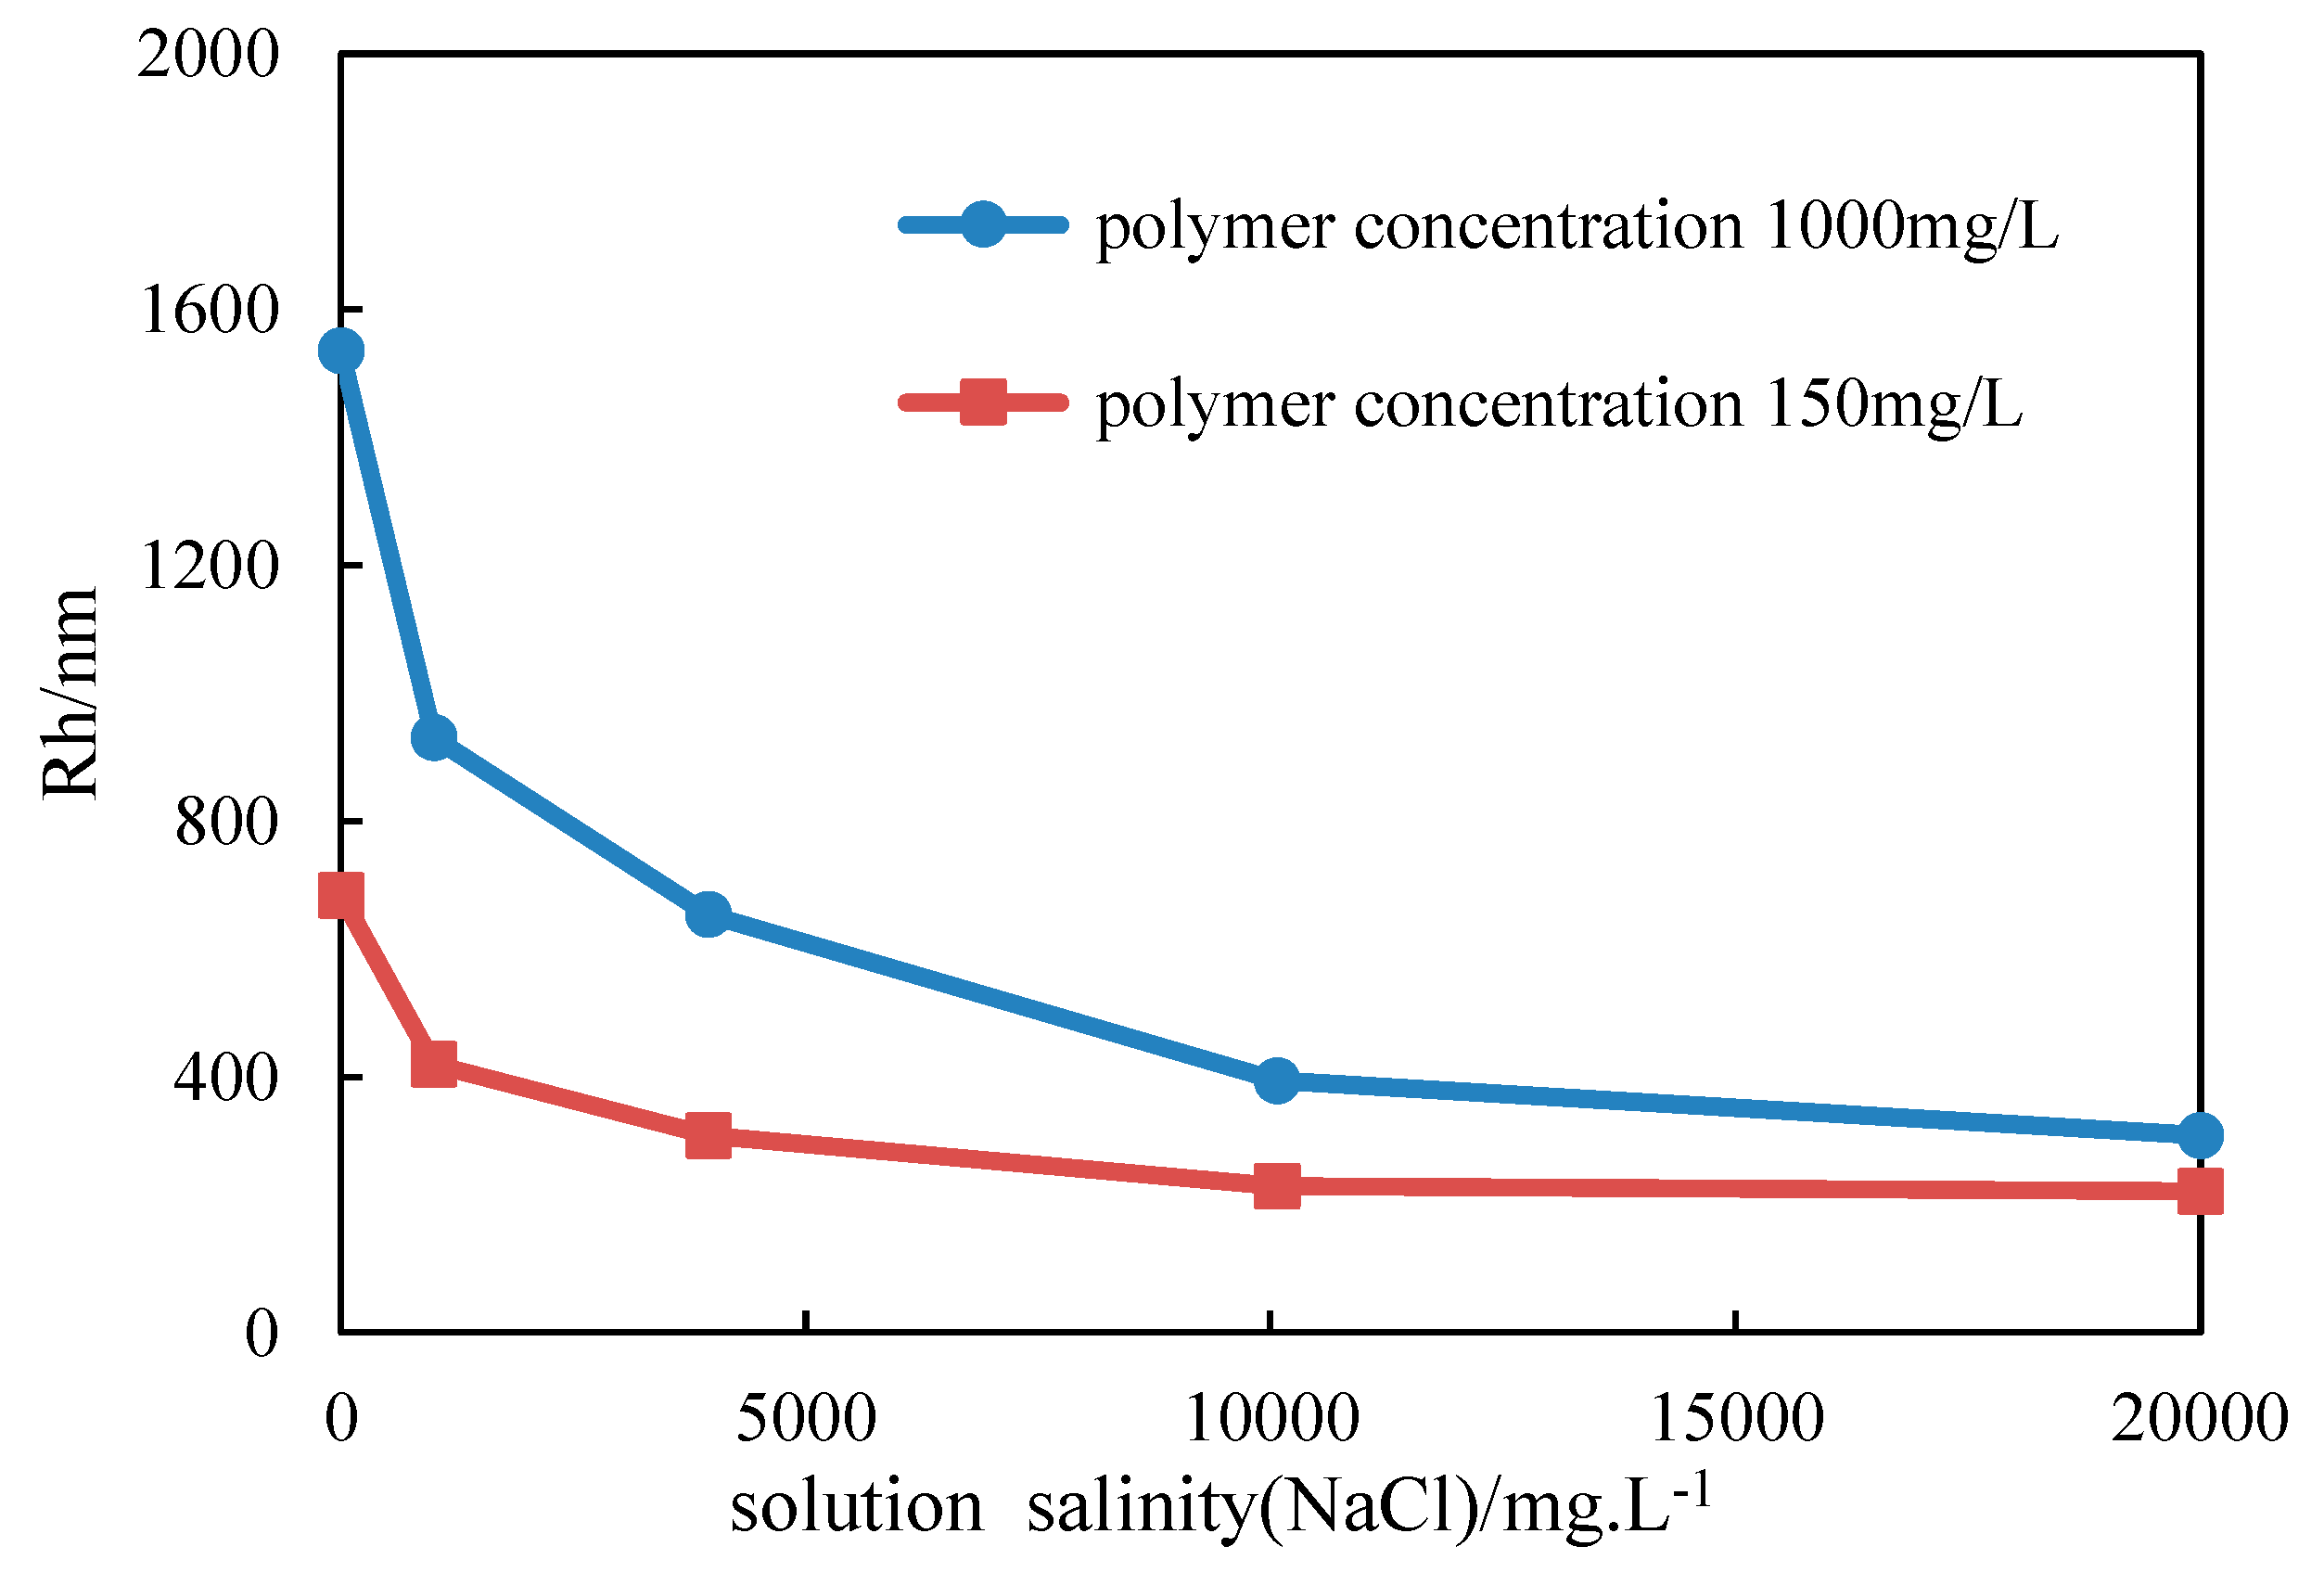
2.2.3. The Relationship between Rh and Salinity of Solution

As can be seen from the results presented in Figure 3, the Rh reduces significantly as the salinity of NaCl solution increases (polymer concentrations of 1000 mg/L and 150 mg/L). This phenomenon is caused by the salt effect of sodium ion. The salt in water results in the shrinkage of polymer molecular chain; the molecules are wound closer together, thus making the size of molecular clusters smaller. It is because the inorganic salt dissolved in water produces the effect of electrostatic shielding, which results in the decreasing of molecular repulsion, while the repulsive force is exactly the strength that keeps the molecule chain stretching. Figure 3 indicates that the molecule chains shrink significantly as the salinity of solution rises. When the solution salinity reaches 10,000 mg/L, the Rh tends to be constant, which shows that the molecule chains have shrunk to their limits.

2.2.4. The Combined Impact of Polymer Concentration and Molecular Weight

The Rh of polymer with different concentrations and MW (600 × 104, 1200 × 104, 1700 × 104, 2500 × 104, and 3500 × 104) was measured, with the solution salinity of 4000 mg/L. As shown in Figure 4, the Rh increases as the polymer concentration and MW rise, because both the increasing of MW and concentration are reasons for the increase in Rh. The higher the concentration, the greater the impact of MW on Rh. Similarly, the higher the MW, the greater the impact of concentration on Rh.

2.3. Experimental Study on the Relationship between Polymer Concentration/Molecular Weight and Core Permeability

2.3.1. Experimental Design

Most of the previously published experimental studies have only considered the influence of MW or concentration on injection [14,15,16]. Therefore, previous experiments were carried out with artificial cores and a certain polymer concentration. In order to show the impact of reservoir physical properties on the polymer injection ability and realize the personalized design of PF in various blocks, the natural cores from north and south of Daqing placanticline were chosen.
The relationship for polymer concentration/MW and reservoir permeability are obtained through a series of core injection experiments with different permeability. First, the polymer concentration is kept constant, and polymer MW is increased step by step. Secondly, the polymer MW is kept constant, and the polymer concentration is increased gradually. Thus, the relationship considering both the concentration and MW of various permeability cores are obtained through injection experiments. At last, five kinds of polymers with different MW are injected into a particular core from a certain block, and we obtained the relationship of polymer and reservoir permeability for a particular block.
The experimental procedure: The polymer solution was filtered using the slice of artificial cores, with a length of 0.5 cm, a diameter of 2.5 cm, and a gas permeability of 3.0 μm2. We flooded the cores (saturated with water and then oil) with polymer until the pressure is stable; then flooded cores with water until the pressure is stable. The flooding rate of injection experiments is 0.2 mL/min for the core of 10 cm length, and 0.6 mL/min for the core of 30 cm. Experimental apparatus are shown in Figure 5; during the experiment, all the flooding equipment was placed in the incubator at 45 °C except the hand pump and tranquil pump. The salinity of solution is 4000 mg/L, and the polymer concentration is 1000 mg/L. The determination of core-jam is that the pressure continues to rise after 10 PV of polymer injection, or the pressure of water flooding is higher than PF, which means the polymer injected before is blocking in the pores.

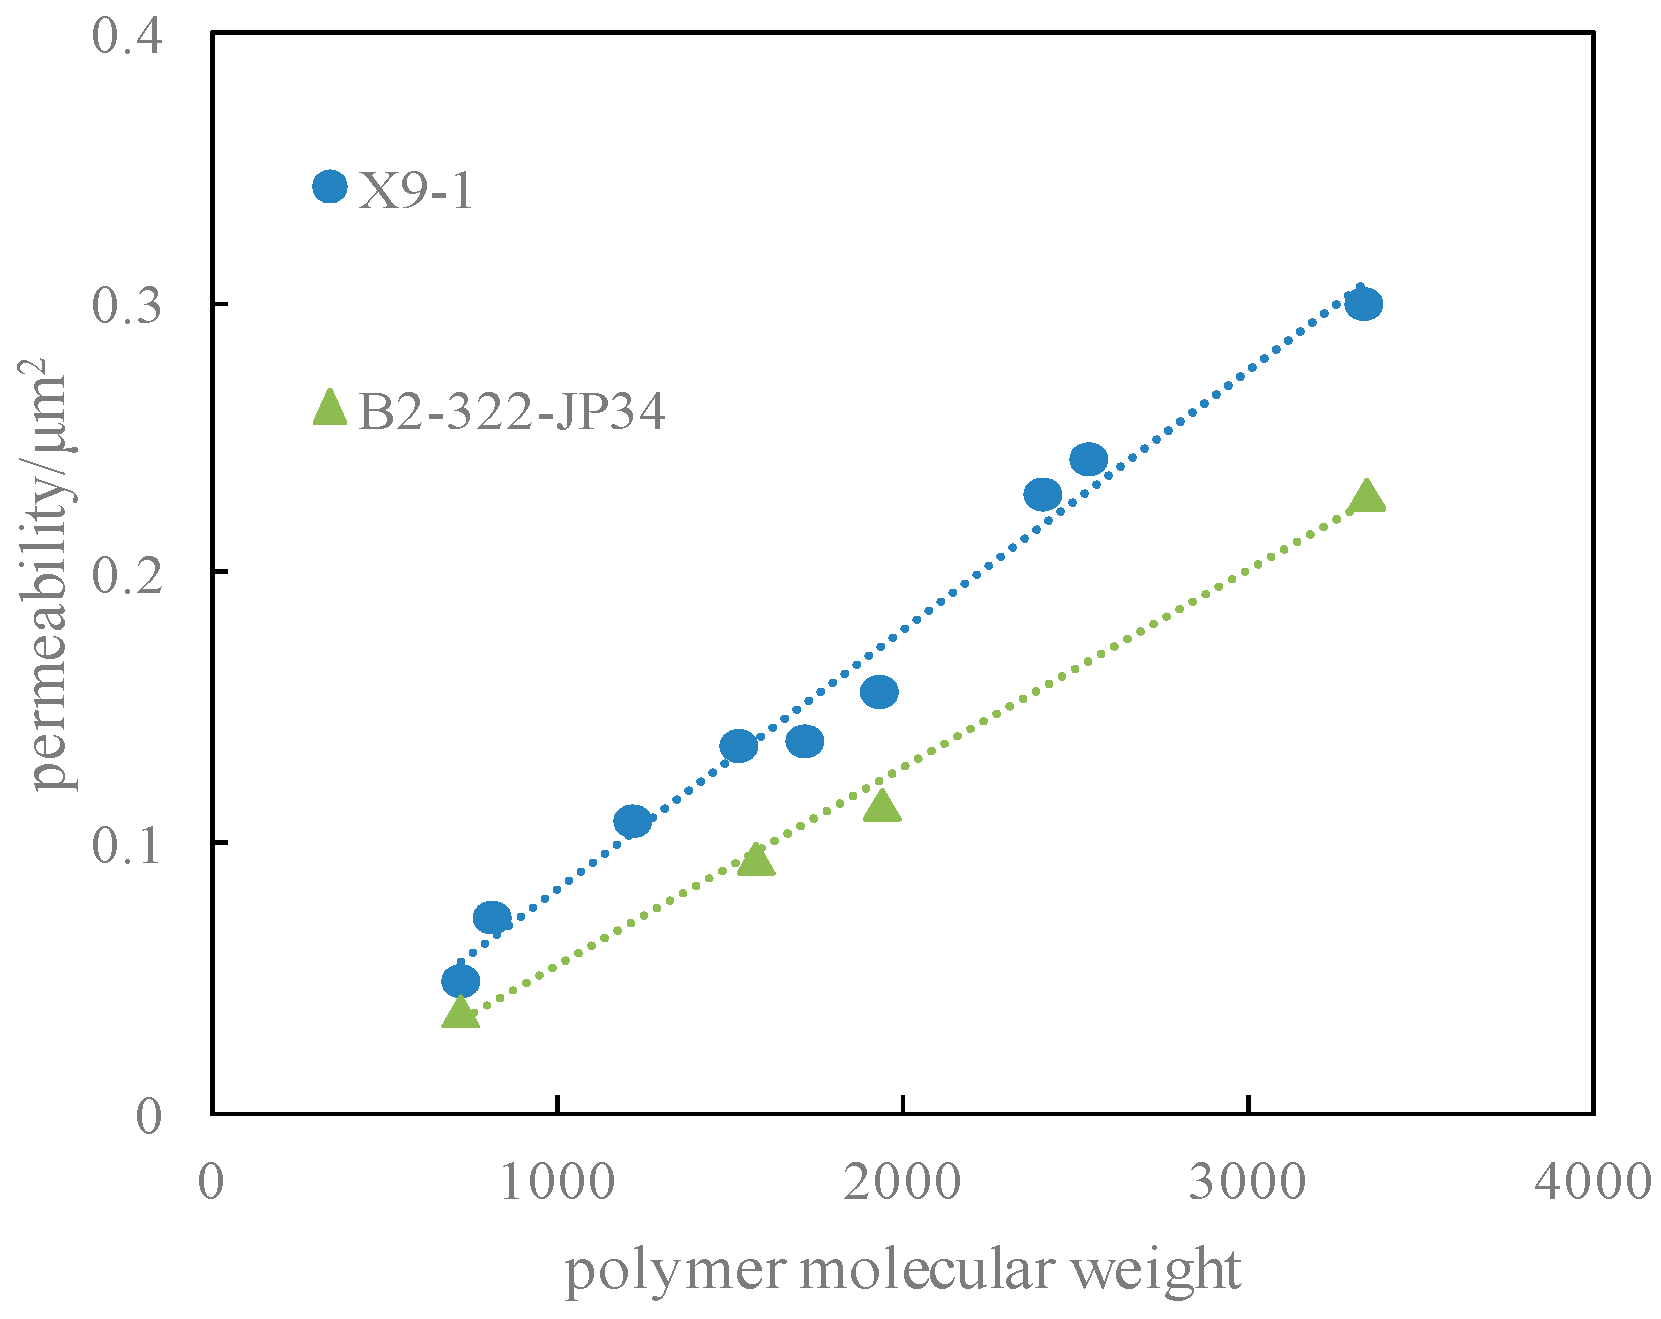
2.3.2. Results and Discussion

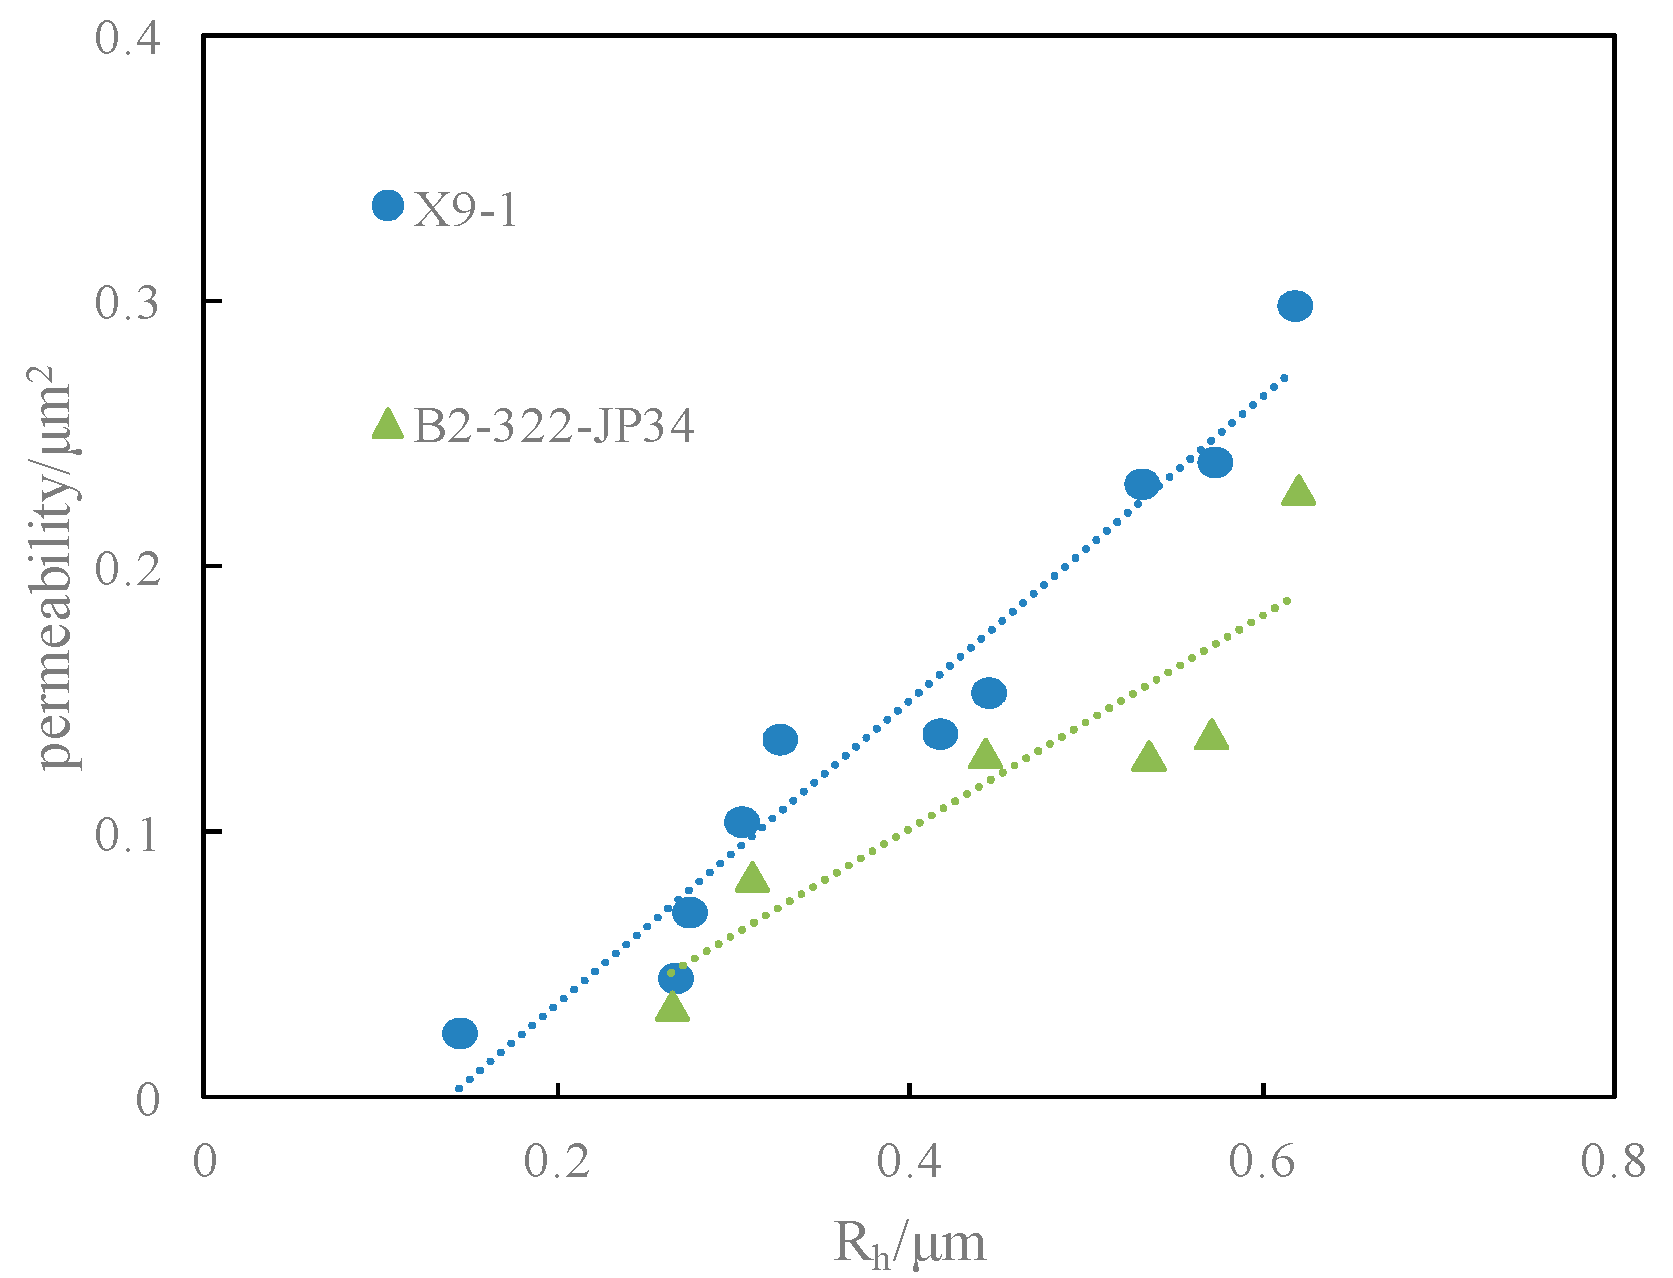
The Influence of Pore Structure

The core well X9-1 is in the south of Daqing oilfield and the core well B2-322-JP34 is in the north of Daqing oilfield. Three groups of pore structure parameters (Group. A, B, C), which are tested by constant-rate mercury injection experiments are shown in Table 1. The relationship between polymer MW/Rh and core-permeability are shown in Figure 6 and Figure 7. Each point in Figure 6 and Figure 7 represents a core of certain permeability. Combined with the pore structure parameters, the PF injection experiments show that the pore structure has an obvious influence on the relationship between polymer MW/Rh and reservoir permeability. For cores of similar permeability from different regions (2 cores in one group as shown in Table 1), the cores from north of the oilfield (B2-322-JP34) have bigger mainstream throat radius and structural coefficient, while the pore–throat ratio is smaller; thus, the injection capacity should be better. It is also proved by the injection experiments that the cores from the northern region have a better injection capacity than the southern region for the same reservoir permeability. The cores from the northern region (B2-322JP34) can be injected with polymer of high MW and larger Rh contrast to the southern cores of the same permeability (X9-1).
According to the charts shown above, the relationship between polymer MW and permeability of different regions can be obtained. The charts realize the personalized designs of PF for various regions.

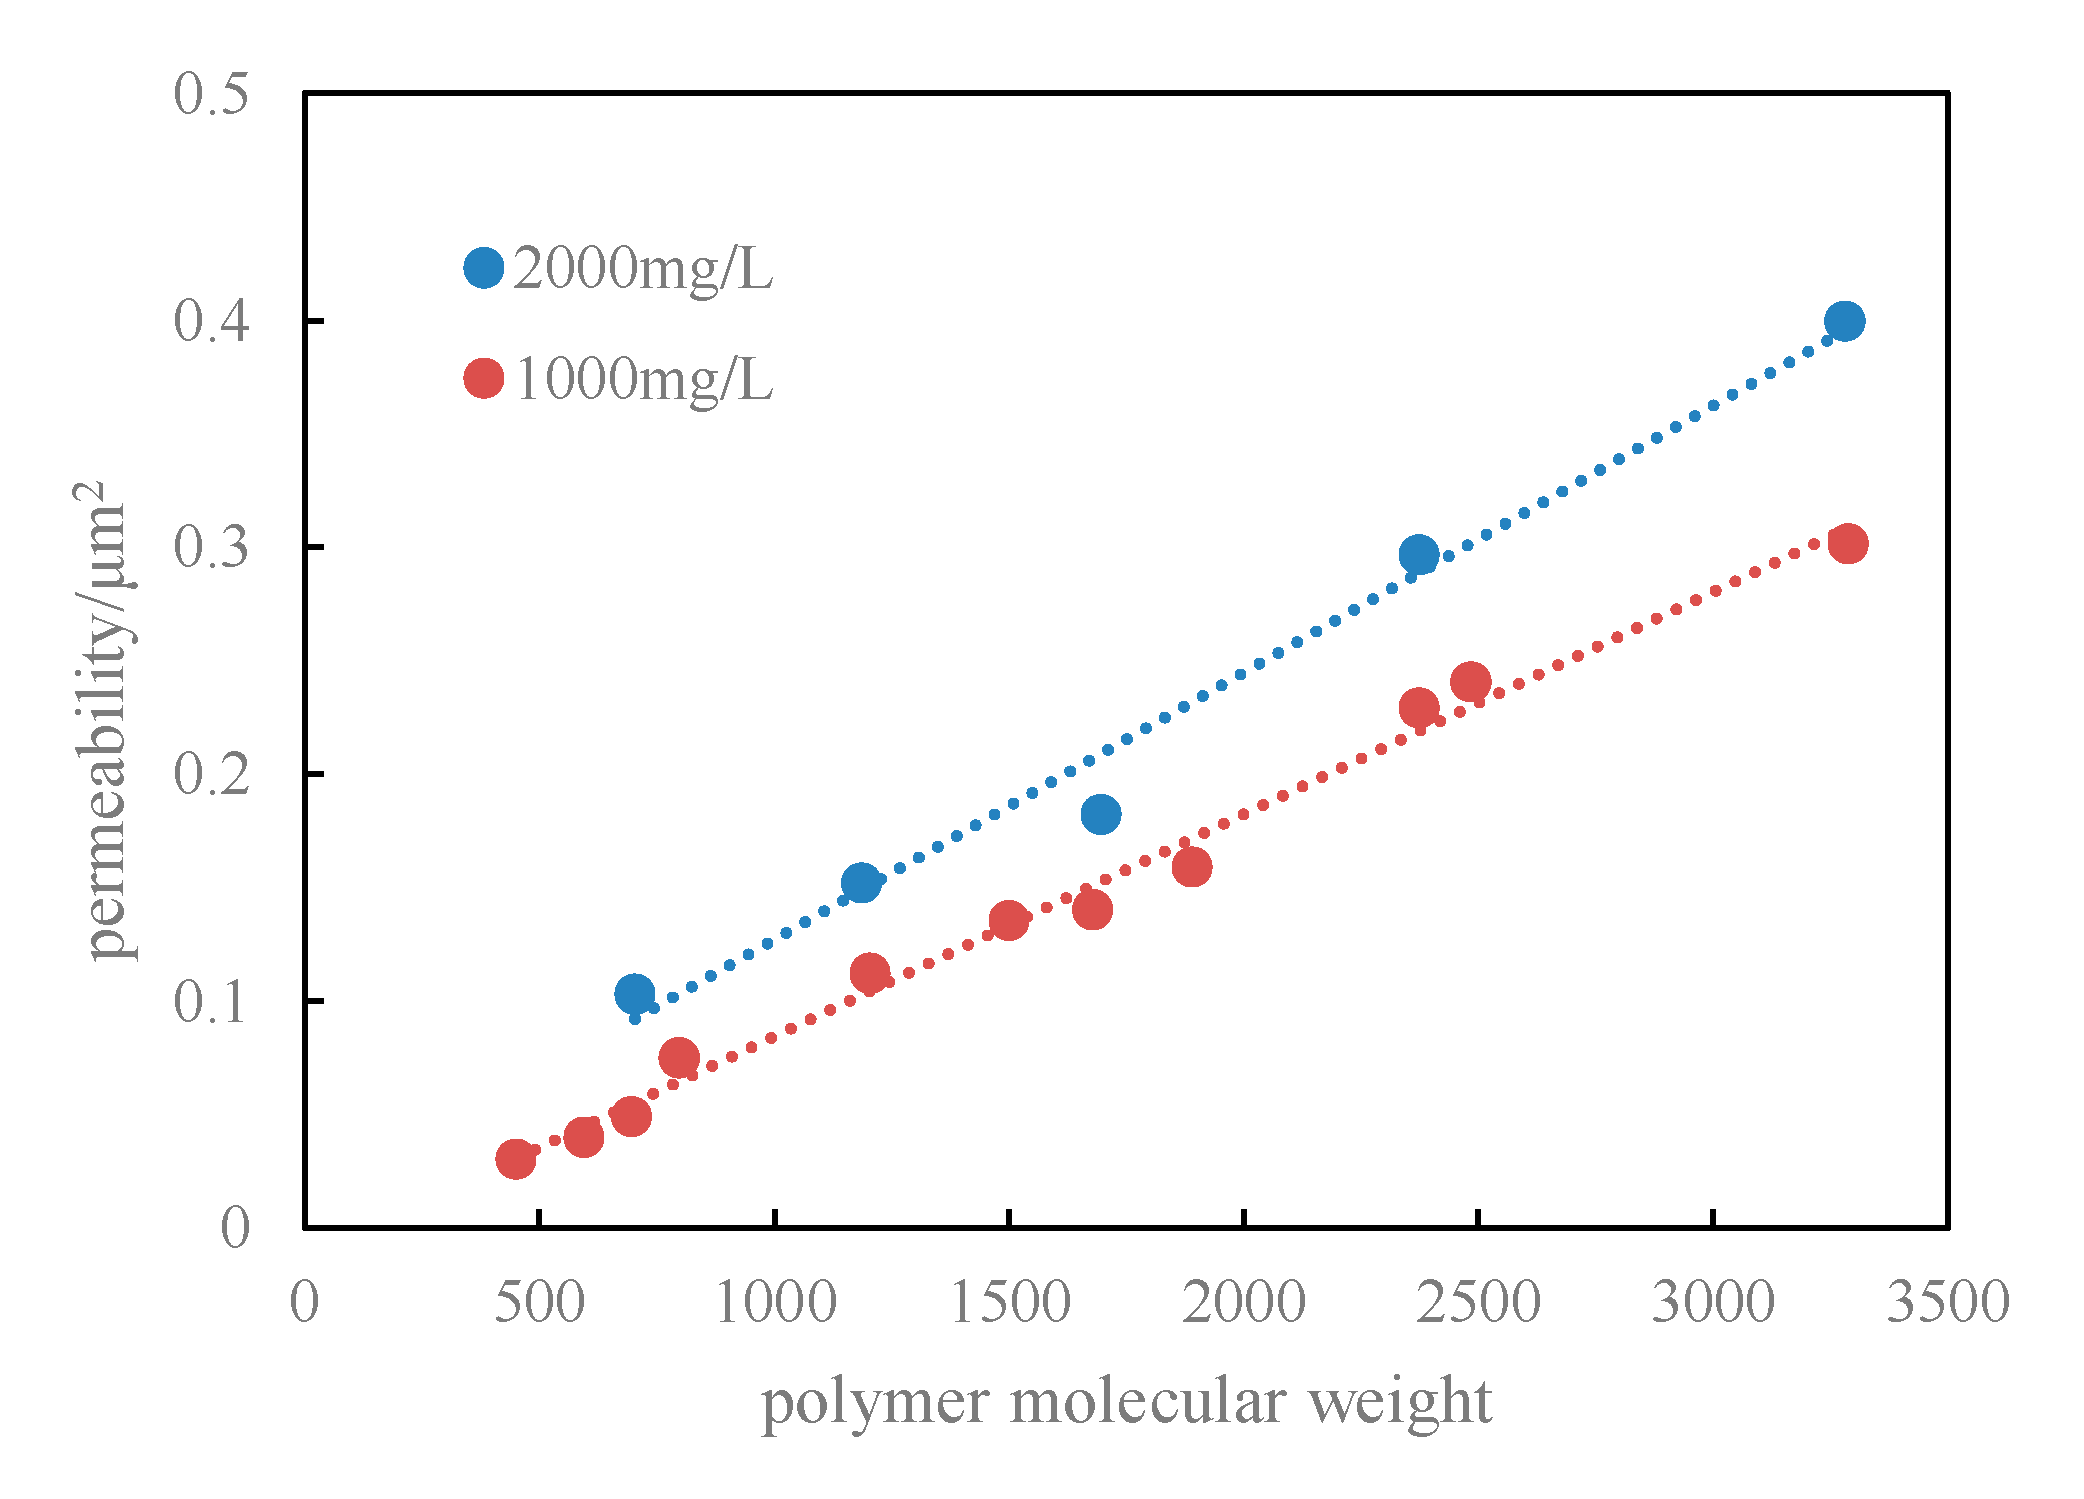
The Influence of Polymer Concentration

The influence of polymer with different concentrations is also studied through injection experiments, considering the natural cores from the same block. The obtained results are shown in Figure 8. It can be seen from these results that the injection capacity dramatically declines as the polymer concentration increases. As the polymer concentration increases from 1000 mg/L to 2000 mg/L, the matched core permeability correspondingly increases to about 30~100 × 10−3 μm2 for the polymers of different MW. The injection capacity of polymer with high concentration and low MW is almost equal to the polymer of low concentration and high MW. Therefore, the concentration and MW of polymer should be both taken into account while studying the injection capacity. From the microscopic point of view, the Rh value of polymer with high concentration is bigger. Hence, the pore radius and suitable permeability should be larger.

Synergetic Effects of Polymer MW and Concentration

The experiments show that the polymer MW and concentration have synergetic effects on injection capacity. For the same MW, the higher the polymer concentration, the values of Rh and viscosity grow higher, and the viscoelastic of polymer also increases. This is good for the layers that are matched with the polymer, whereas, for the layers that do not match, an increase in polymer concentration will reduce the injection ability, increase the inaccessible pores, and the production will get worse.

3. Experimental Studies of Alternating Injection

For the layers with low permeability and strong heterogeneity, which have difficulties with polymer injection, the alternating injection is considered to be effective for improving this condition. The alternating injection means injecting polymer with different MW or viscosity alternatingly into the layers. Such injection method is efficient for improving the producing degrees and reducing the amount of displacement agents [17]. The principle of alternating injection is that the different polymer slugs match with layers of different permeability. First, injecting the polymer slug of high viscosity will enter into the layers of high permeability, as it offers a lower resistance compared to the low permeability layers. The polymer solution of high viscosity will block the high permeability layers. Then injecting the polymer slug of low viscosity will enter the layers of low permeability. Therefore, the alternating injection can improve the mobility ratio and injection profile in heterogeneous formations.
The alternating injection experiments were carried out for verification, and the water injection profiles and alternating cycles were studied during the experiments.

3.1. Experiment Design

3.1.1. Experiment Conditions

The experimental conditions include HPAM made by the Daqing Refining & Chemical Company (Daqing, China), the MW is 1700 × 104 and 2500 × 104. The polymer solution is prepared with brine with a salinity of 900 mg/L. Later, the solution is stirred for 2 h and filtered using a five layers filter. Stimulated oil is prepared with Daqing crude oil and kerosene, and the viscosity is 9.3 mPa·s
There are two kinds of cores used in the experiments. First, two artificial homogeneous cores are connected in parallel to simulate heterogeneous layers. The size of each core is 30 cm × 4.5 cm × 4.5 cm, and absolute permeability of two cores are 800 × 10−3 µm2 and 200 × 10−3 µm2. In the second case, the artificial heterogeneous cores are used to simulate intraformational heterogeneity. The size of core is 30 cm × 4.5 cm × 4.5 cm, the permeability of high permeable layer is 800 × 10−3 µm2 and that of the low permeable layer is 200 × 10−3 µm2.

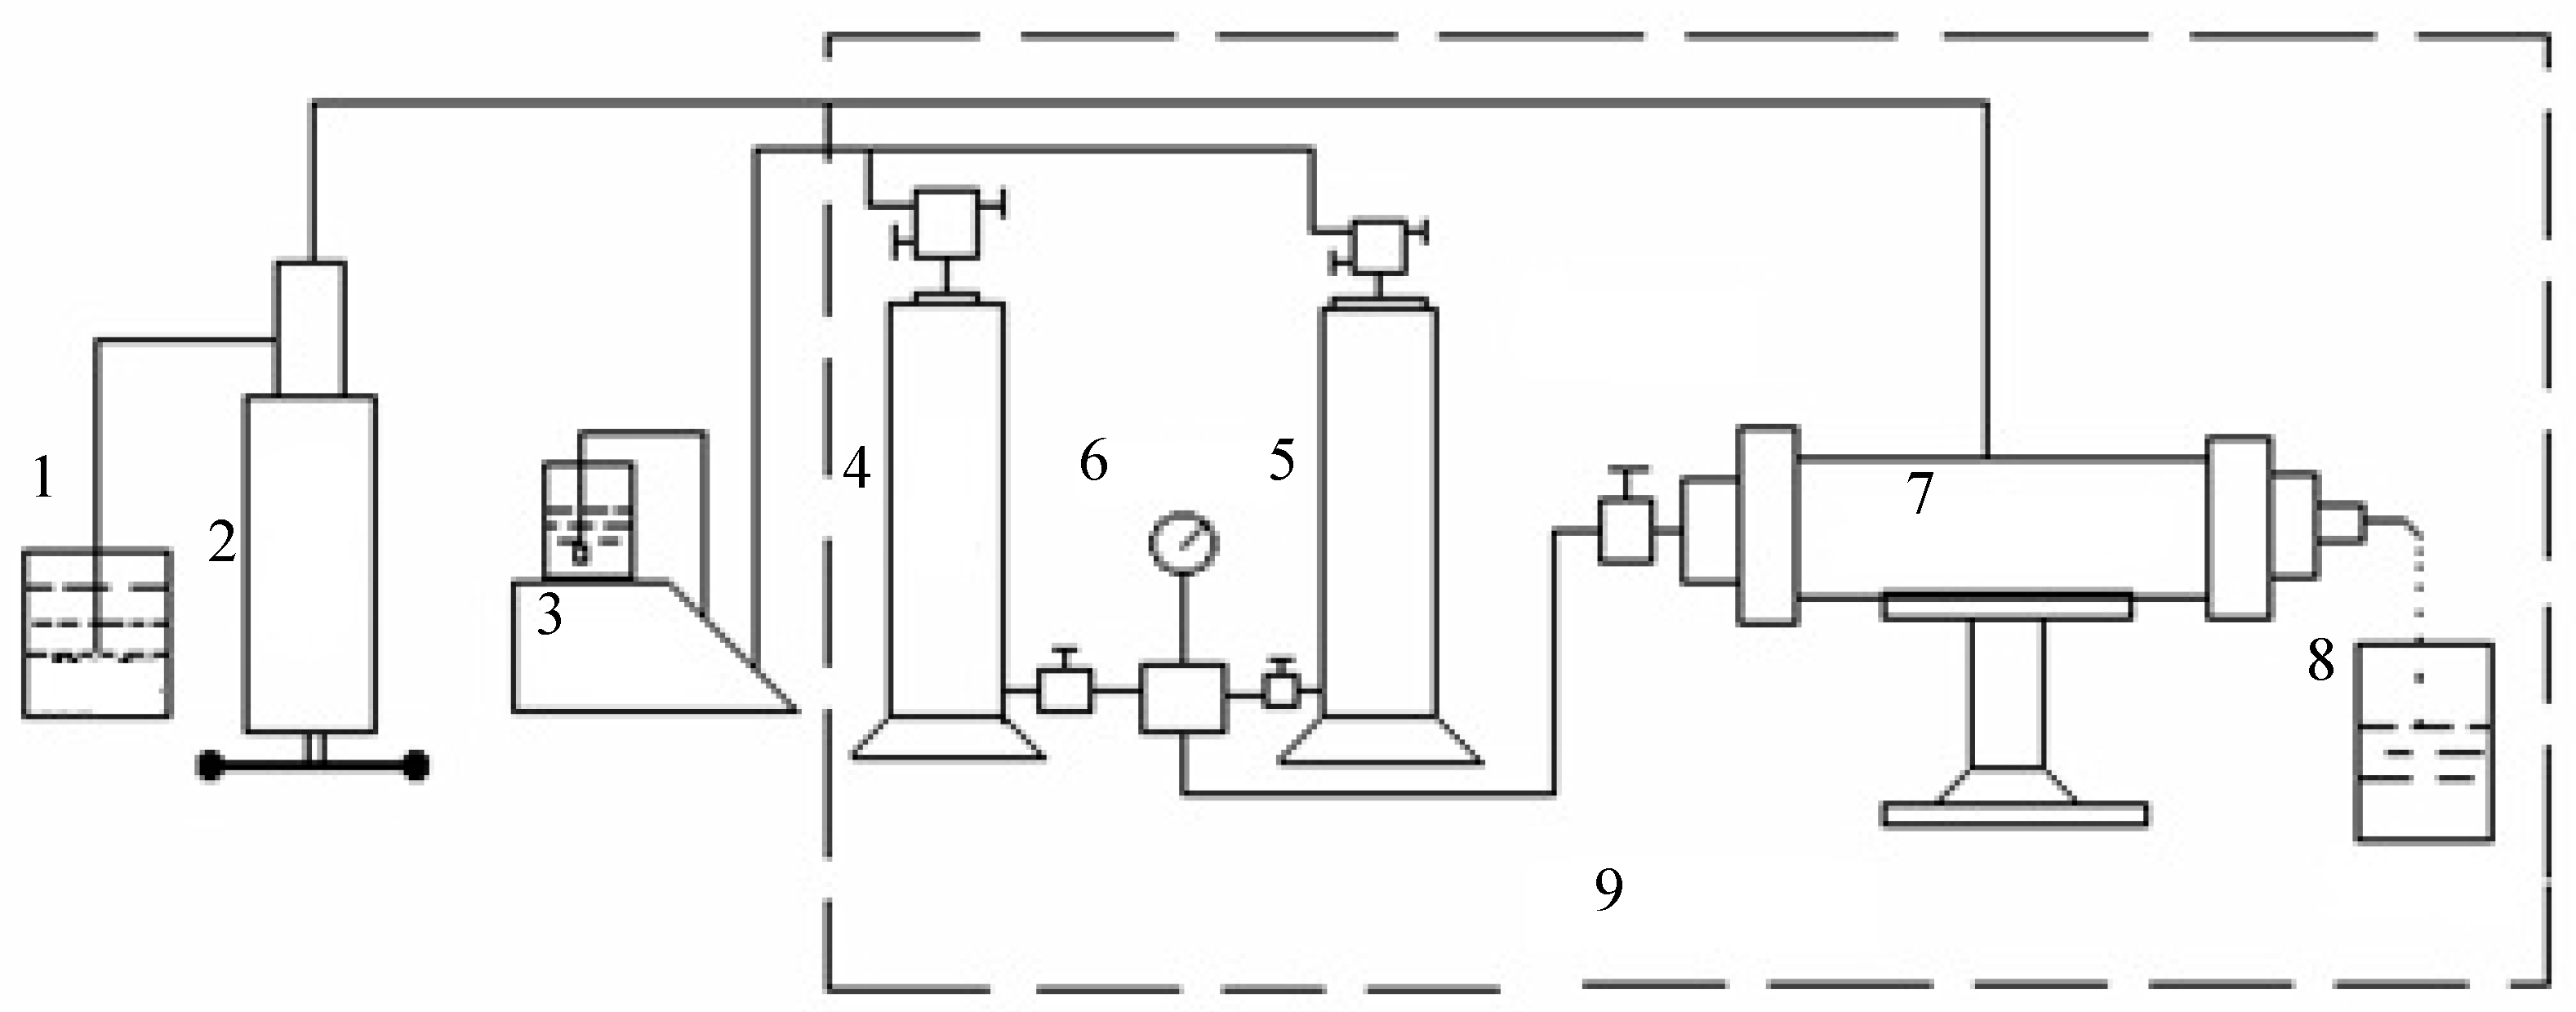
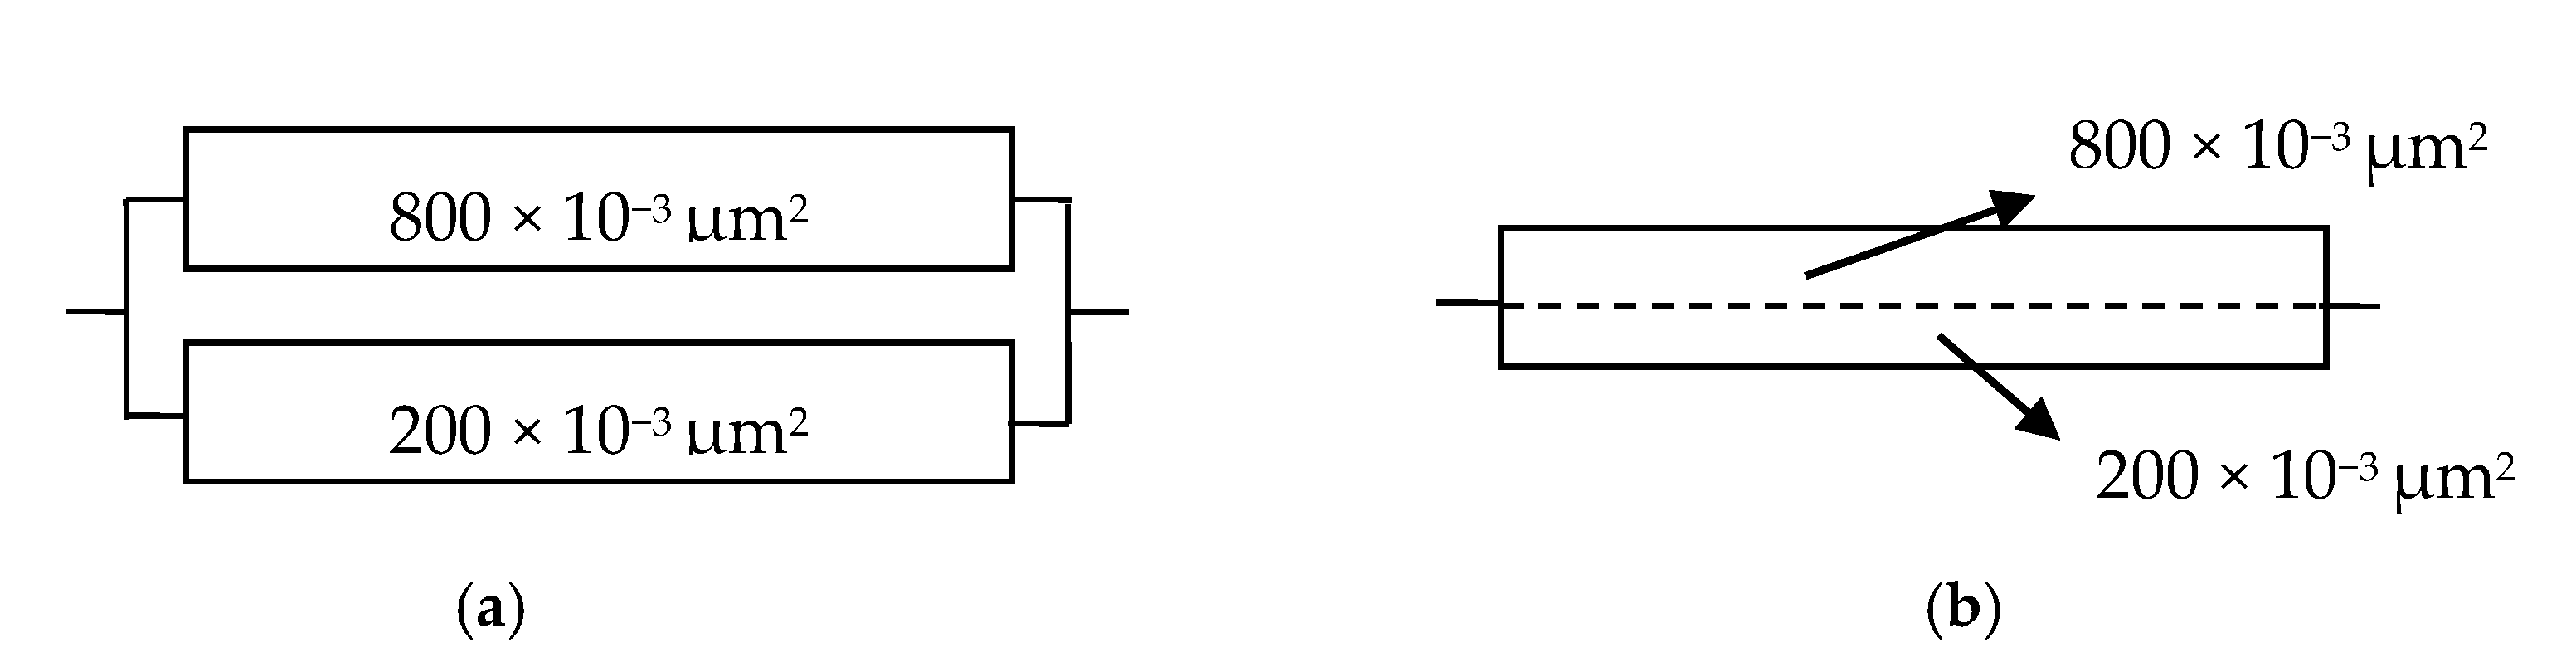
3.1.2. Experiment Setup

The volume of total polymer in the case of single-slug injection is 0.56 PV, two experiments with the high MW polymer (2500 × 104, 2000 mg/L, 185 mPa·s) and medium MW polymer (1700 × 104, 1000 mg/L, 43.7 mPa·s) are conducted separately. The volume of total polymer in the case of alternating slug injection is also 0.56 PV, injected the high MW polymer slug alternating with the medium MW polymer slug for the volume of 0.28 PV. The injection parameters are shown in Table 2 and Table 3.

3.1.3. Experimental Procedures

The experiment is divided into seven steps.
(1)
Vacuumize the core and saturate with water, and calculate the water permeability;
(2)
Water should be flooded until the pressure is steady, calculate the diversion rates of high and low permeability layers, and calculate the permeability ratio and permeability of each layer;
(3)
Saturate the core with oil and calculate the oil saturation;
(4)
Water should be flooded until the water cut of the produced liquid is 98%, and calculate the efficiency of water flooding;
(5)
The core should be flooded with polymer slug combinations (MW: 2500 × 104 and 1700 × 104) for a total of 0.56 PV in divided-flow experiments, calculate the diversion rates of high and low permeability layers. Injected a total volume of 2.24 PV for the experiment in Section 3.2.2, match the polymer with MW of 2500 × 104 injected first, then polymer with MW of 1700 × 104.
(6)
Further, water is allowed to flood until the water cuts of the produced liquid reach 98%;
(7)
At the end of the experiment, calculate the efficiency of PF and the total efficiency.

3.2. Results and Discussion

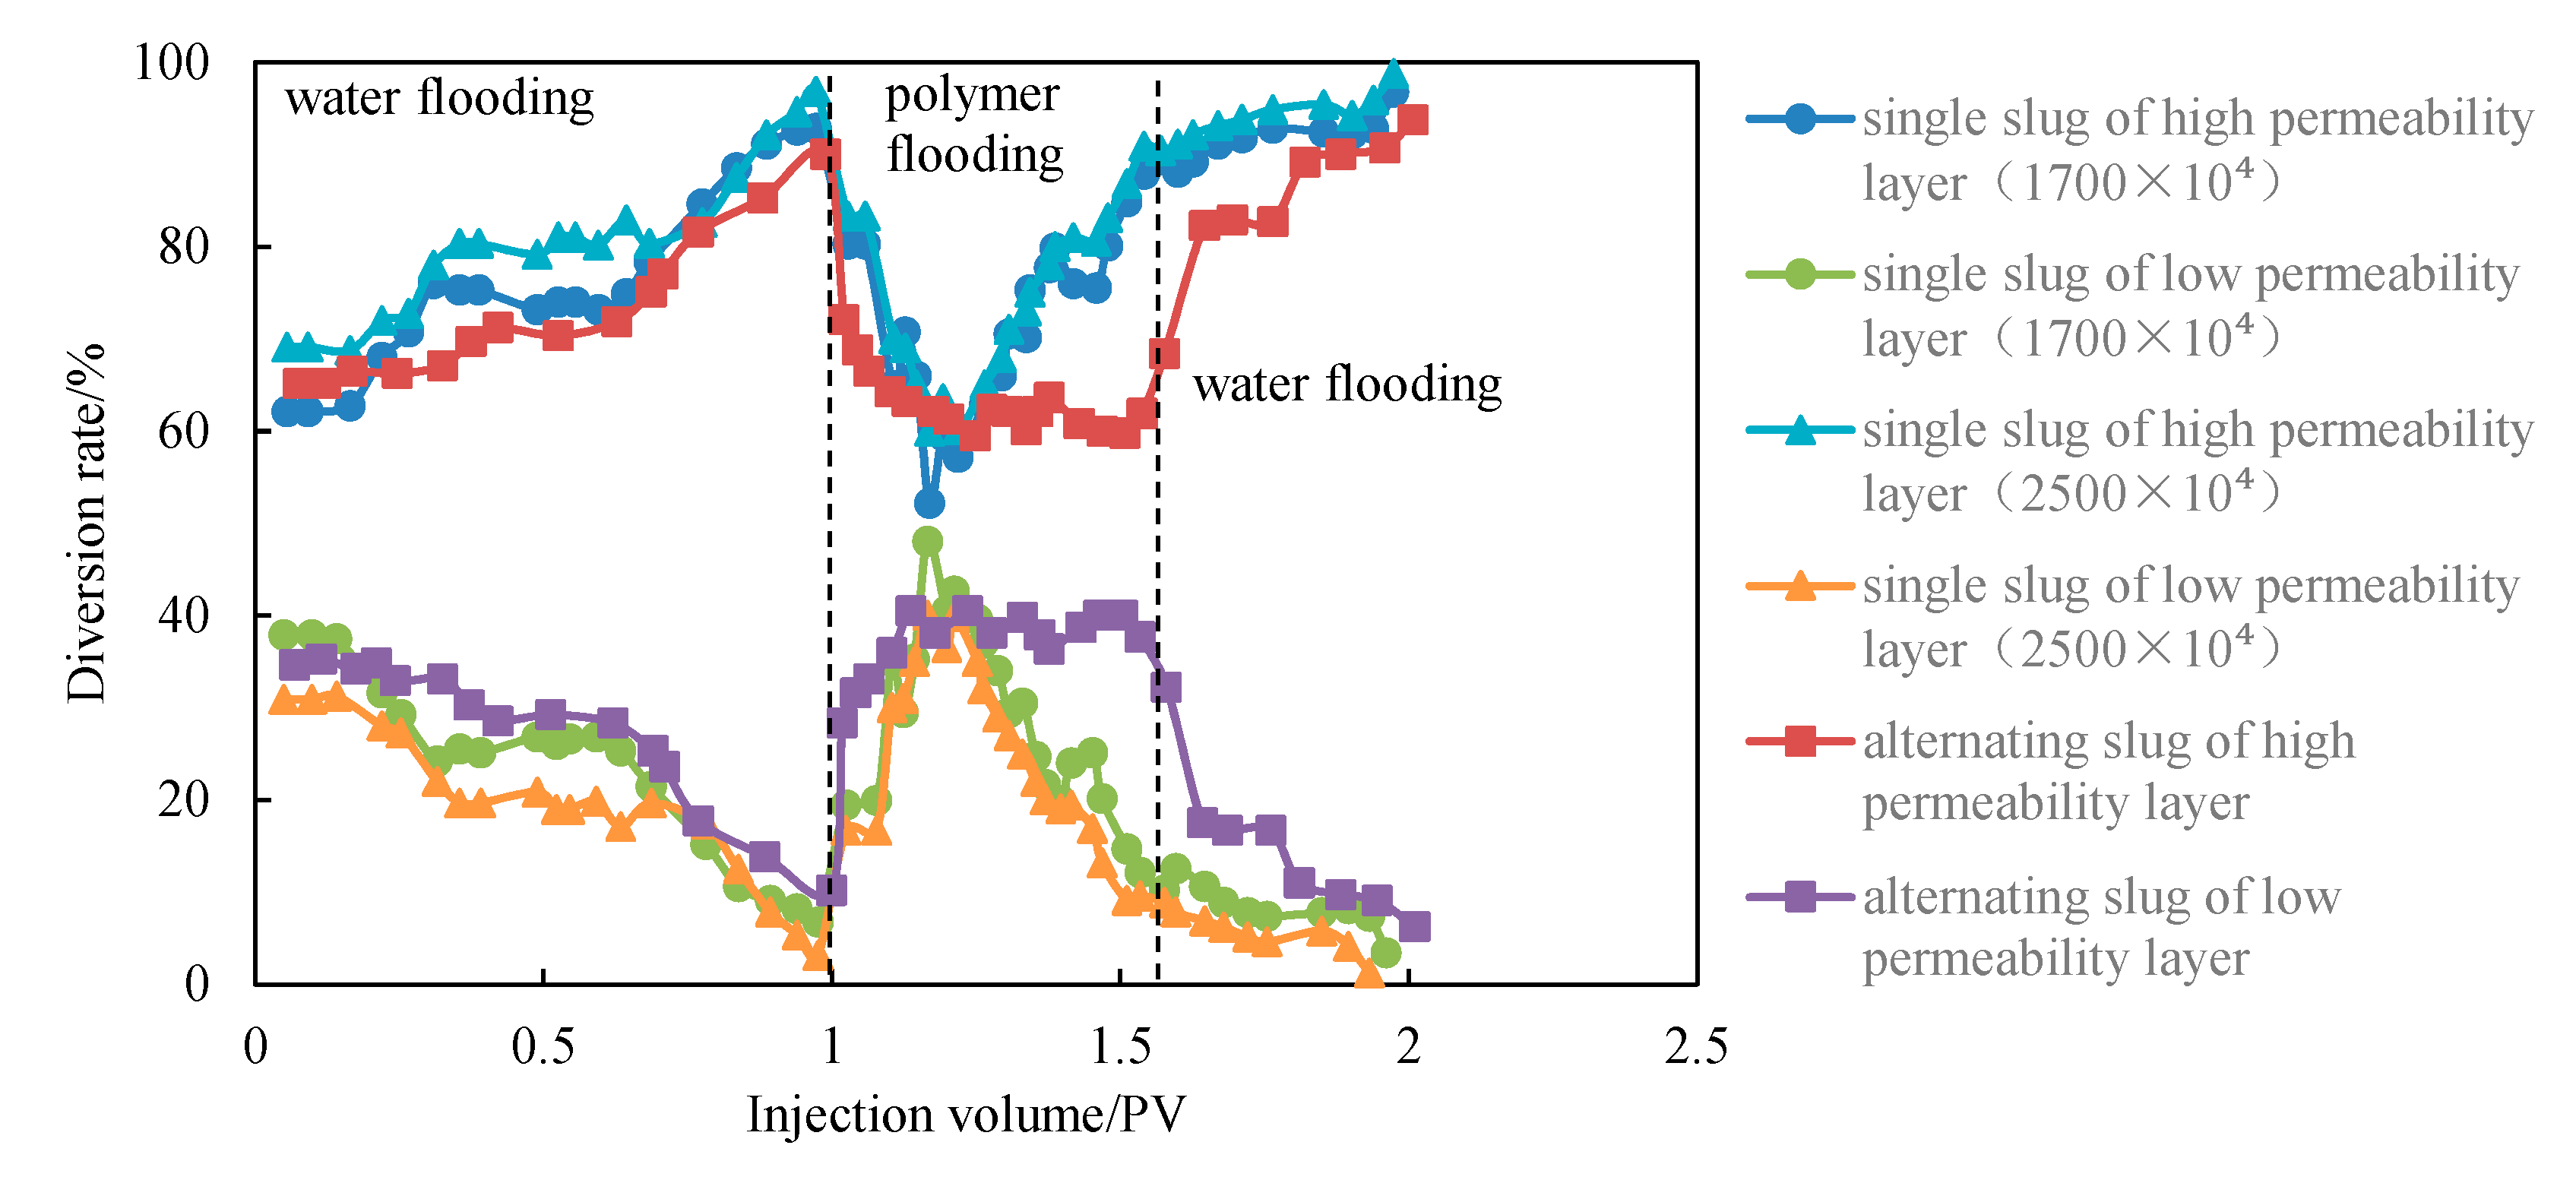
3.2.1. The Effects of Profile Inversion by Alternating Injection

The diversion rate is the percentage of instantaneous flow rate that takes part in the total flow, the curve plotted for diversion rate against injection is called diversion rate curve. The diversion rate curve can reflect the improvement of injection profile after PF. An ideal diversion rate curve for high and low permeable layers should be relatively flat, and the difference should not be huge, which means that the flooding fluid is equally distributed in each layer. The divided-flow experiments are carried out using the parallel core sets shown in Figure 9a, the experiments considering intraformational hetegeneous using the core shown in Figure 9b, and the diversion rate curves for single slug of MW 1700 × 104, 2500 × 104 and alternating slug are shown in Figure 10.
The experimental results are shown in Figure 10. The curve shows that the single-slug injection with high MW (2500 × 104) has little advantage than the polymer flooding with MW of 1700 × 104. The alternating slug mode tends to be more ideal compared to both the single-slug mode with different MW. The profile inversion is controlled by alternating injection, which also improves the liquid injection profile in heterogeneity layers, and increases the effective time of PF in low permeability layers.

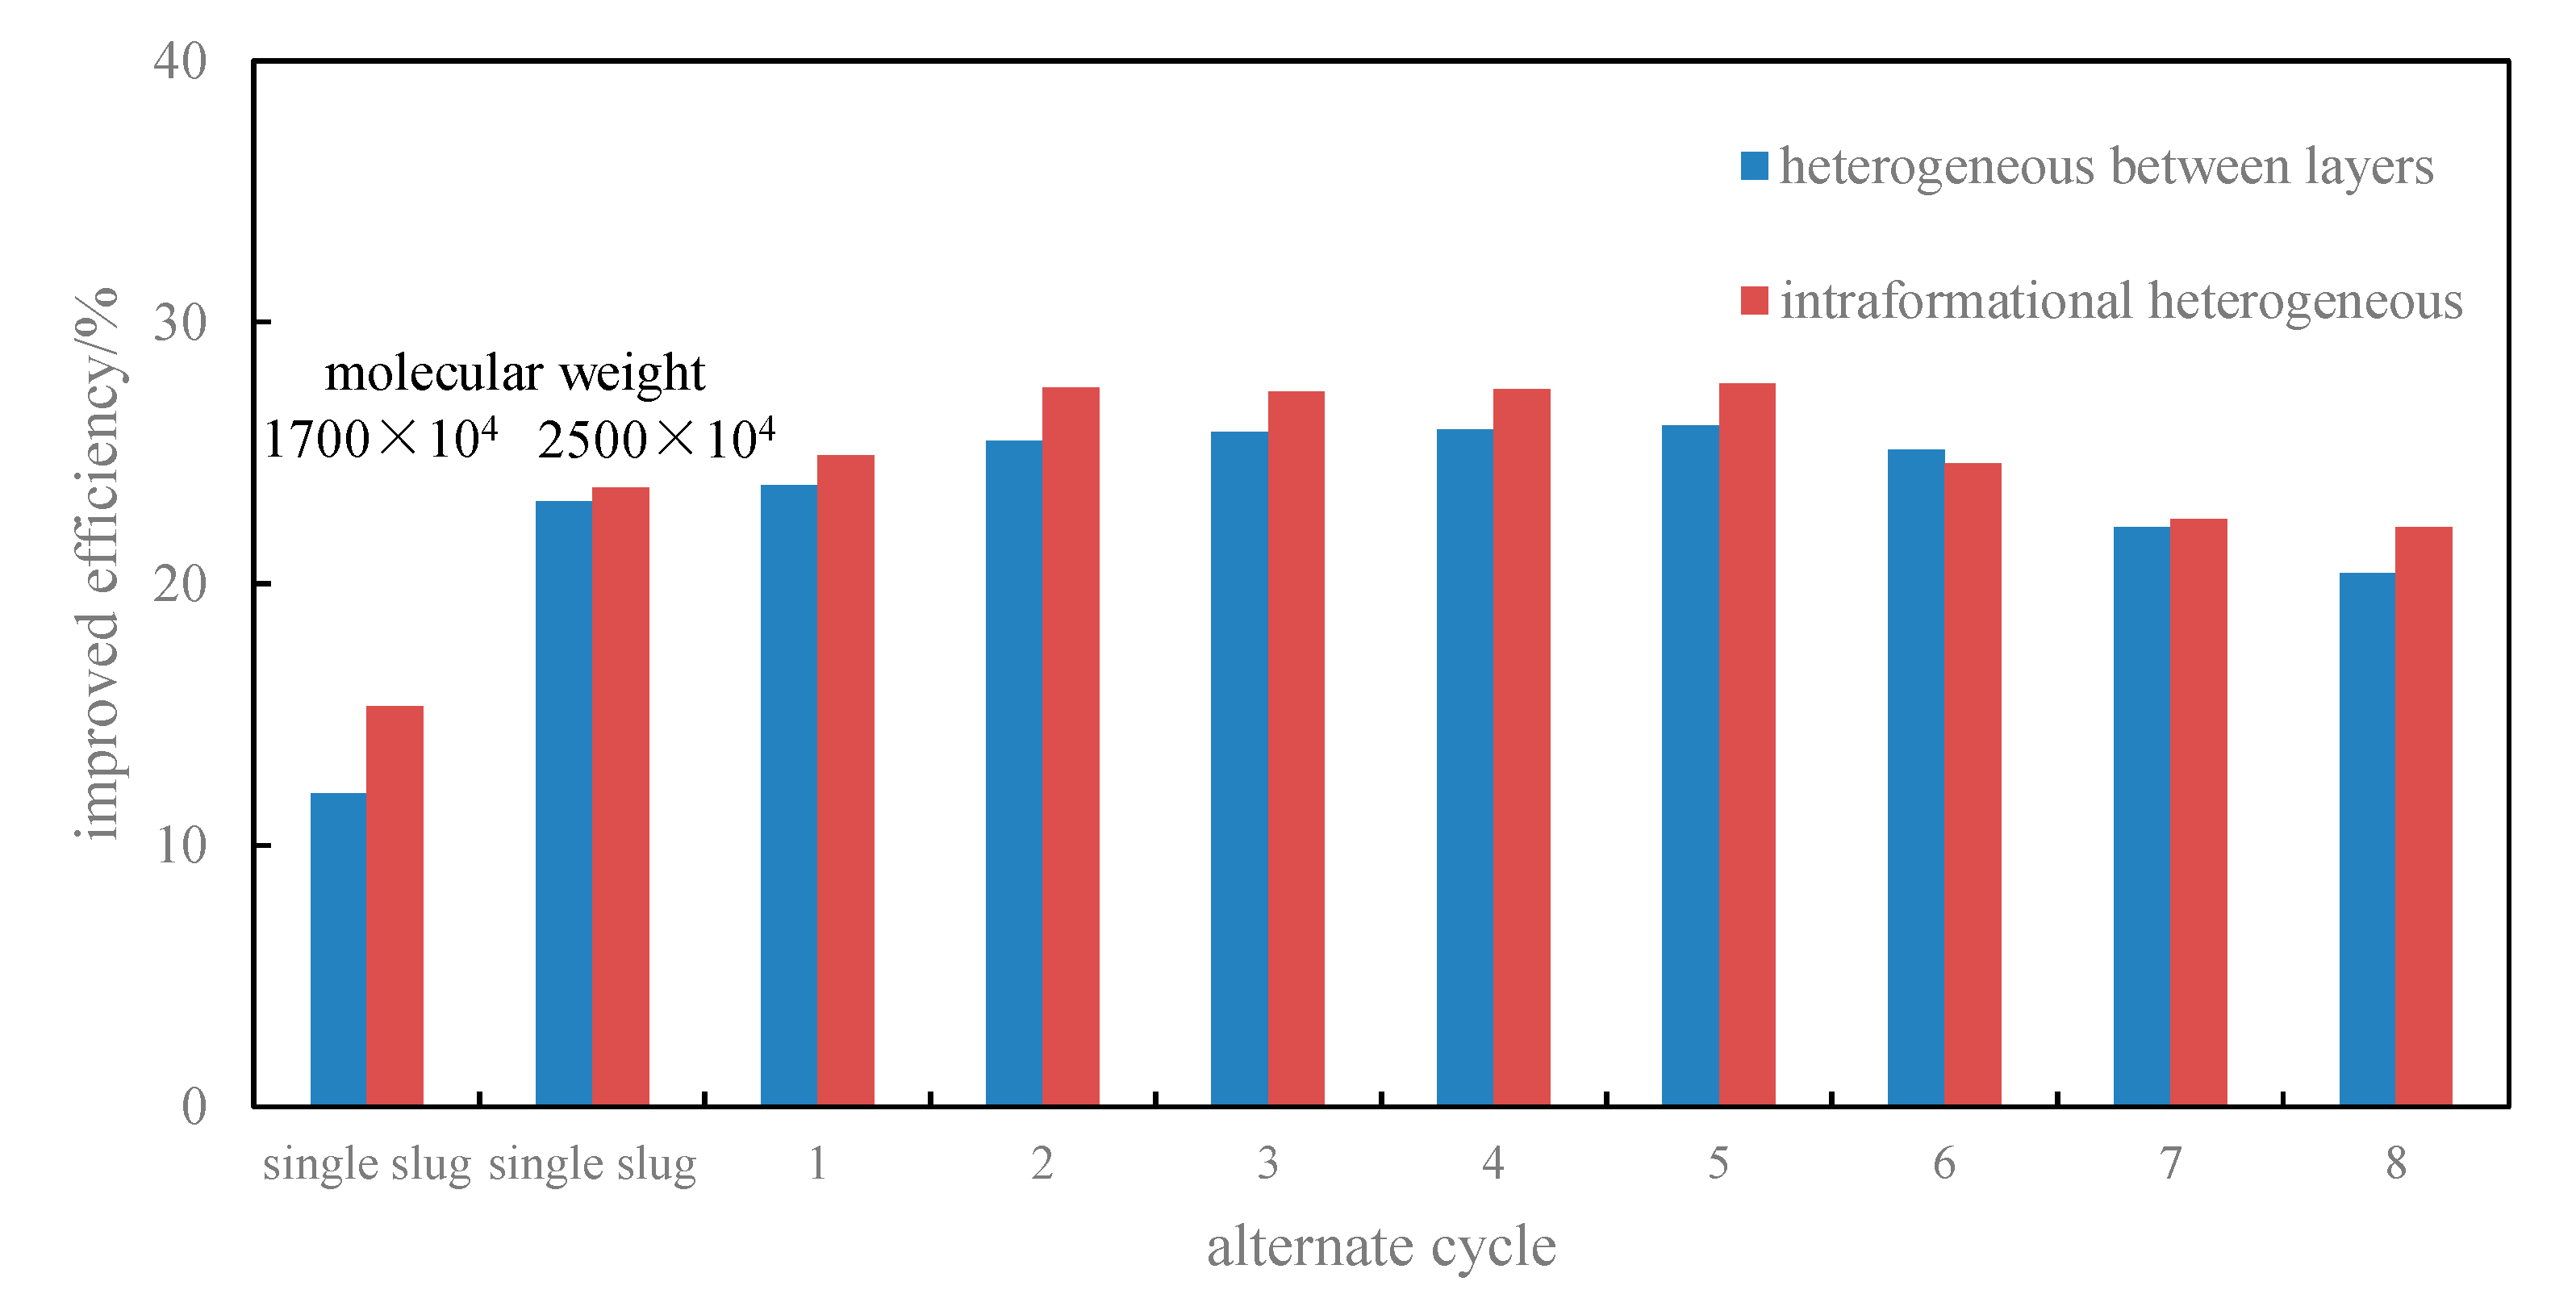
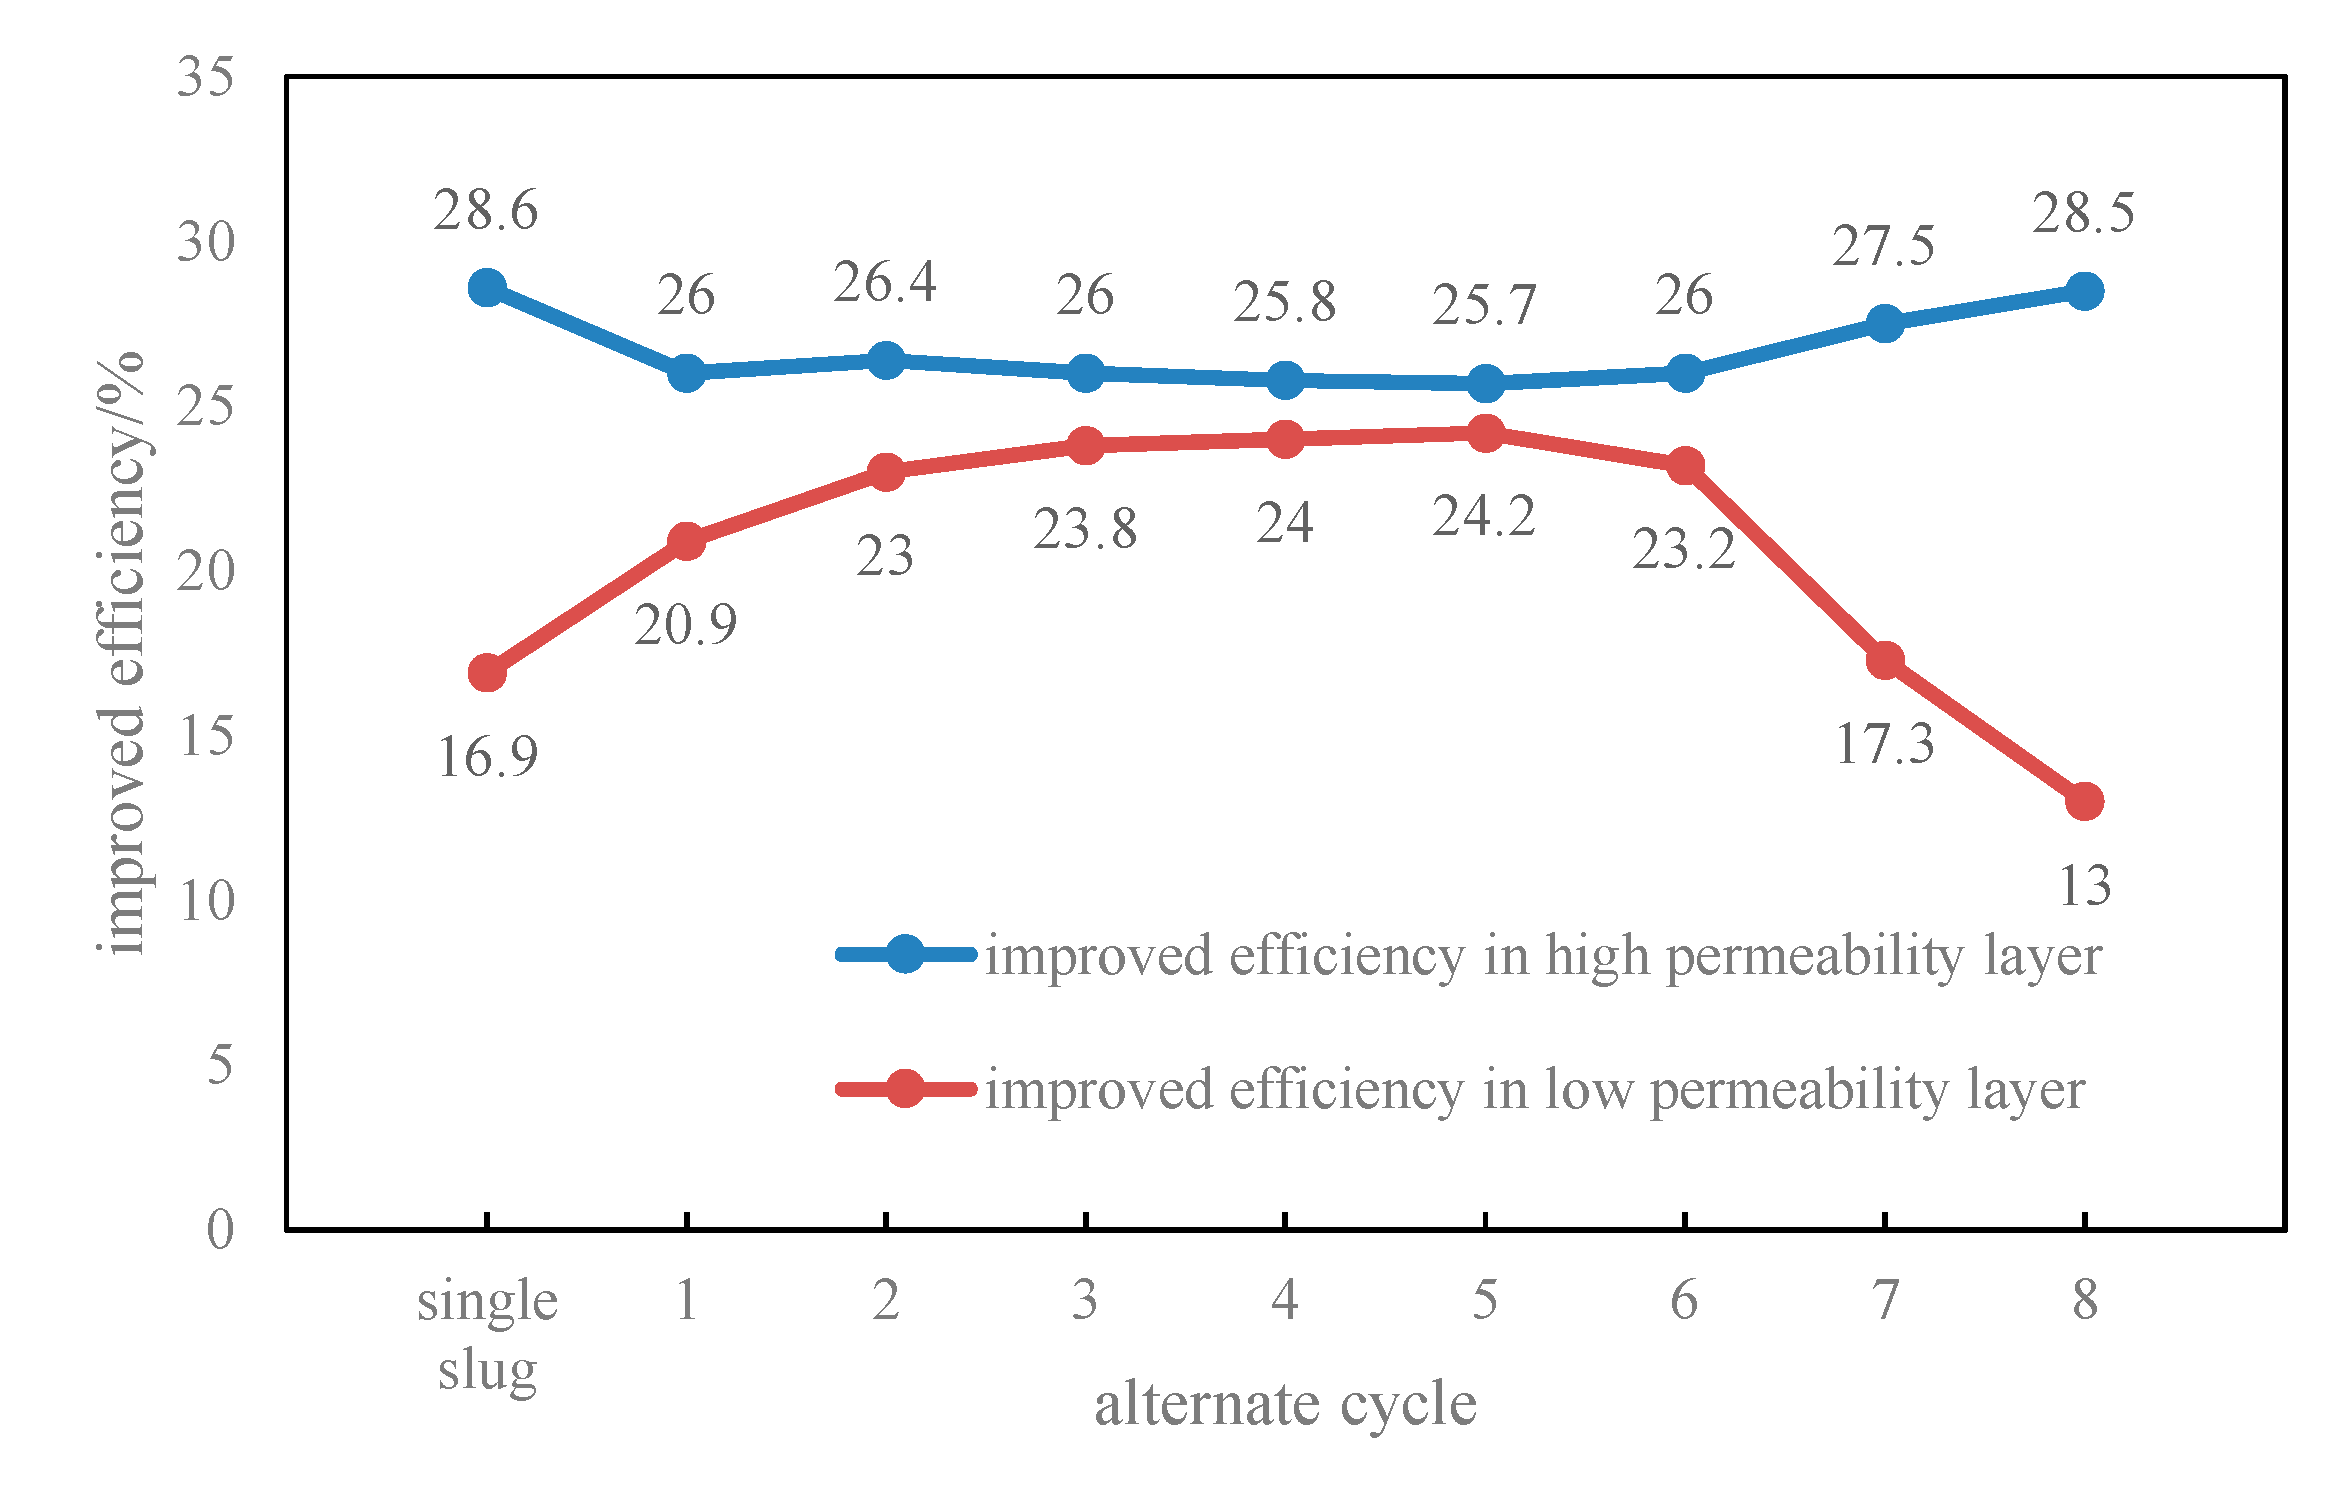
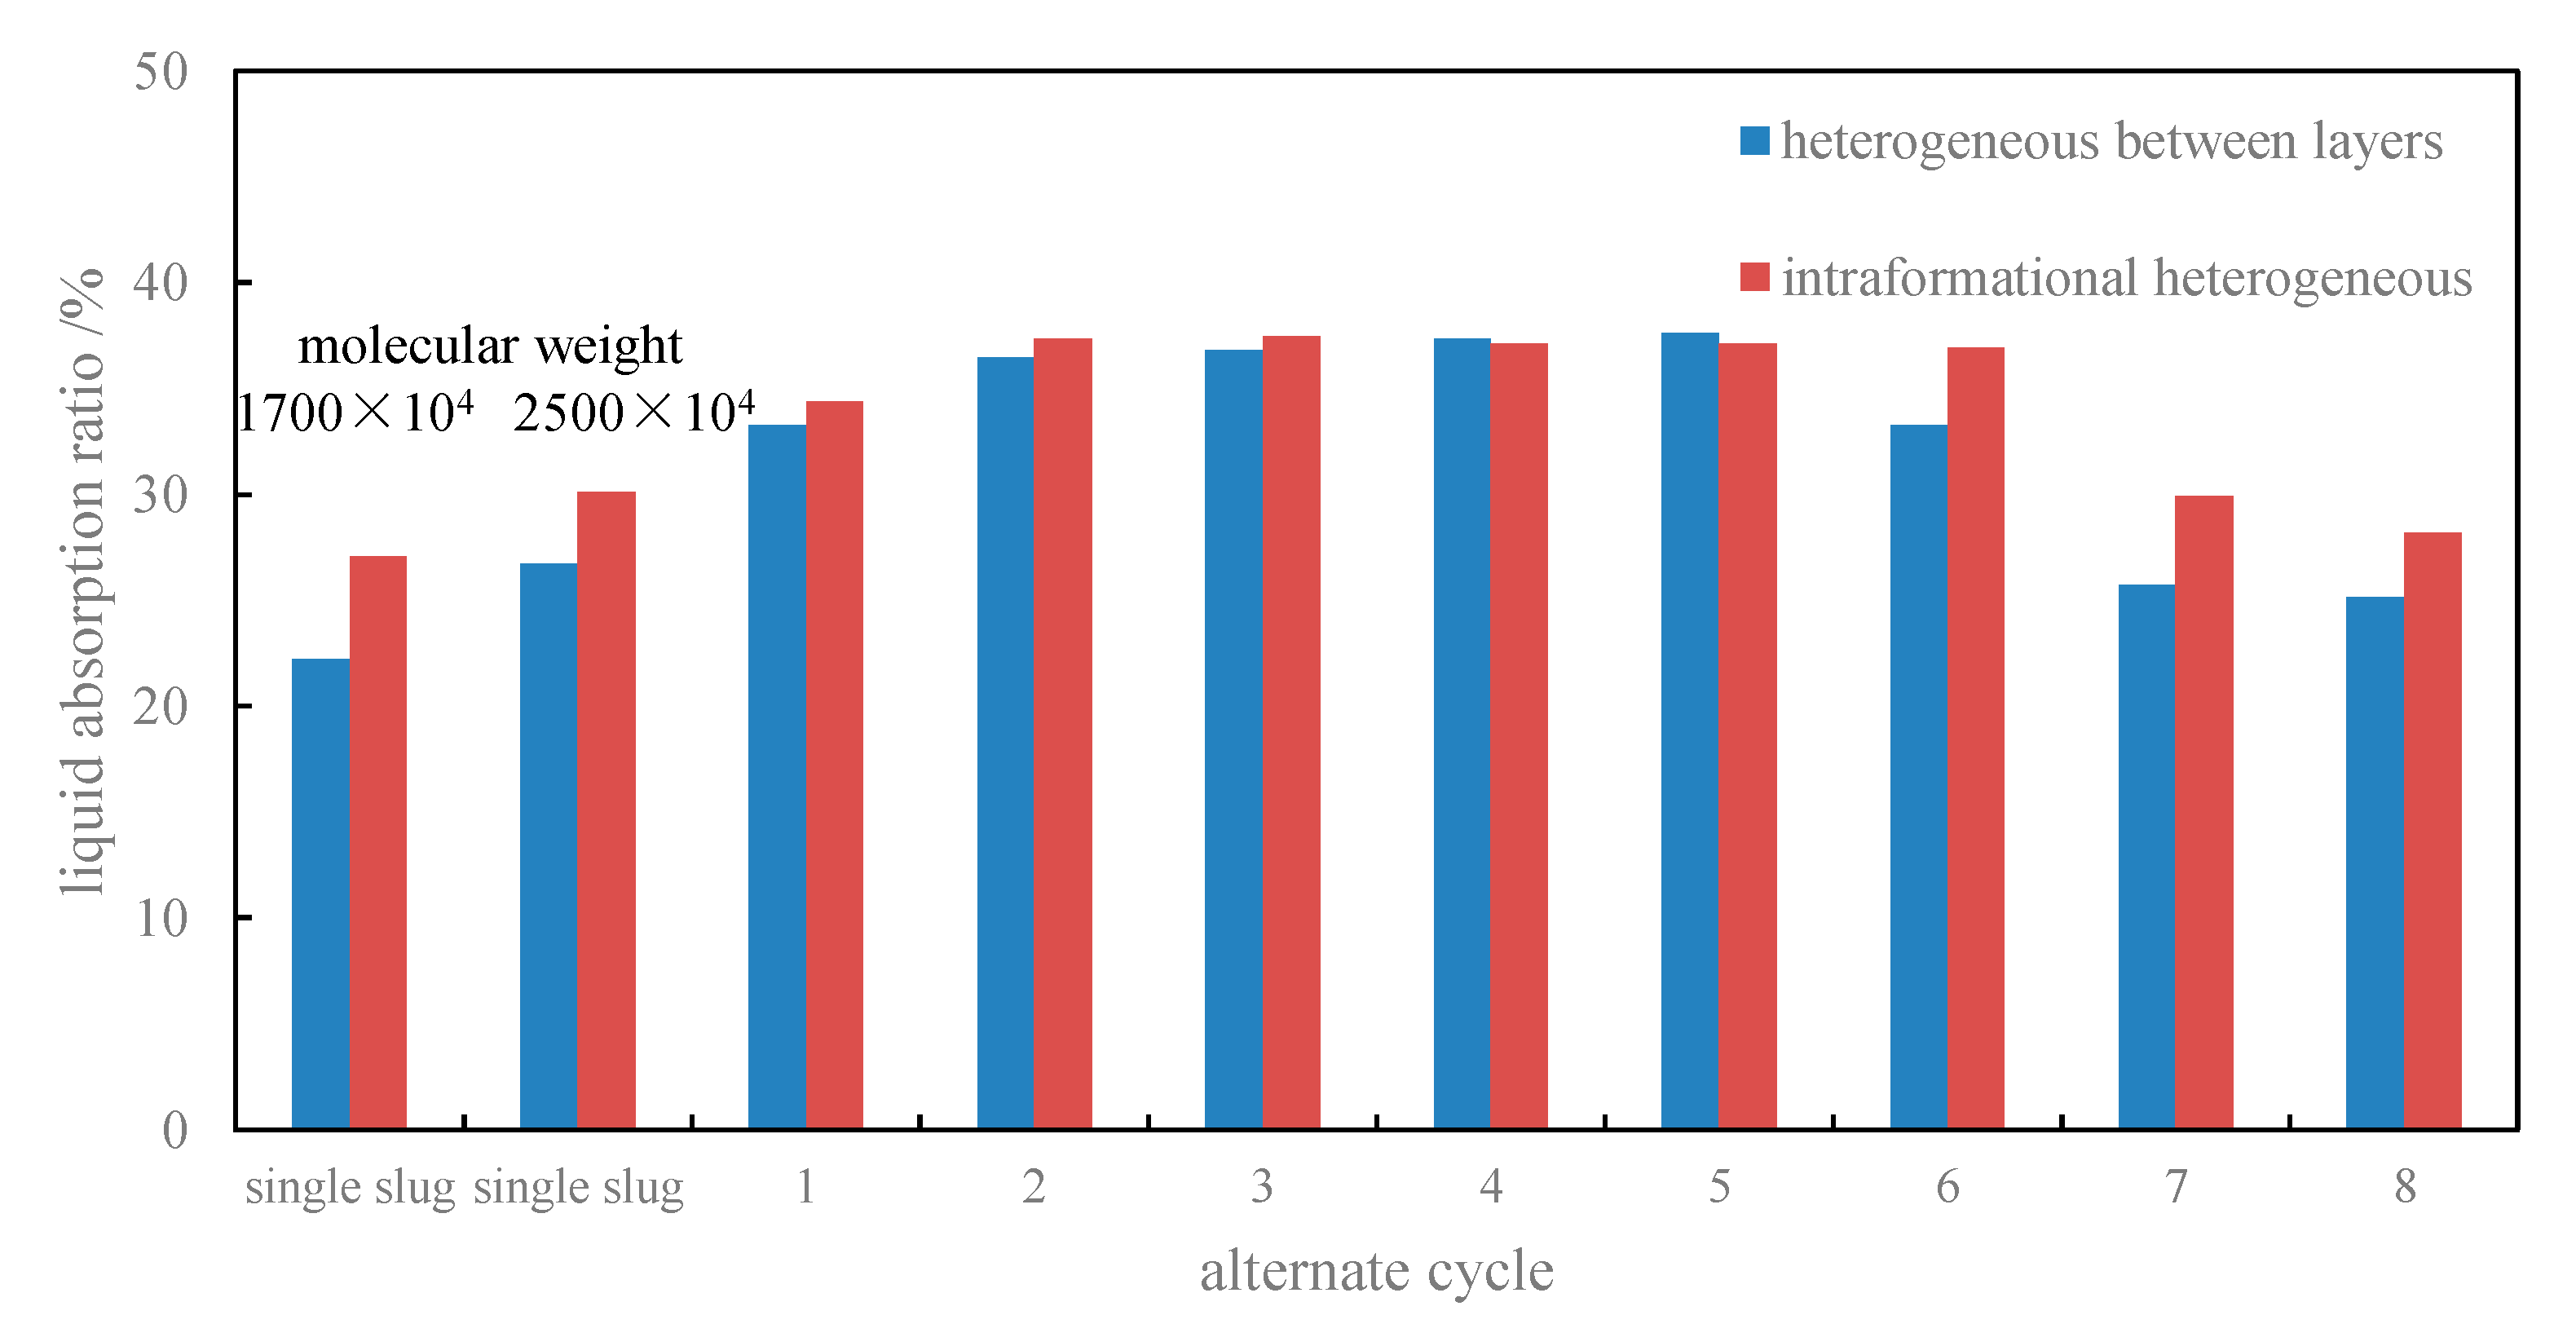
3.2.2. The Impacts of Alternate Cycles on Liquid Injection Profile

The contrast experiments of single-slug injection and alternating injection (total volume of 2.24 PV) are carried out, with both the cores shown in Figure 9, representing heterogeneous between layers and intraformational heterogeneity, respectively. The bar graph of liquid injection ratio changed over alternate cycles in the low permeable layer is given in Figure 11. The first two couples of bars represent the water injection profile of PF with medium and high MW for the single-slug case. It can be seen that the water injection profile has increased when the injection pattern has changed to alternating injection, irrespective of the profiles of heterogeneity between layers or intraformational heterogeneity. Moreover, comparing Figure 11 with Figure 12, the improvement of liquid absorption is agreed with the improved efficiency of alternating injection. It illustrates that the improvement of PF in heterogeneous layers depends on the production of low permeability layers. This is exactly the mechanism of alternating injection, which is making more use of low permeability layers. Figure 12 below shows that the improved efficiency continues to increase in the first five cycles and drops later from the sixth cycle. Thus, the alternating cycles should be less than six.
The improved efficiencies in both high and low permeability layers are shown in Figure 13. The alternating injection improves the efficiency of low permeability layers a lot, contrasting to the high permeability layers, which have little changes in efficiency. The efficiency of low permeability layers for single-slug injection improved by 16.9%, compared to water flooding. The efficiency of low permeability layers of alternating injection in each slug has improved the highest up to 24.2%, and the average increment is 21.17% for a single slug. Comparing with single-slug polymer injection, the alternating injection obtains an average efficiency increment of 4.275%, highest up to 7.3%. The improved efficiency of high permeability layers for single-slug injection was 28.6% compared with water flooding. The average improved efficiency of high permeability layers in alternating injection is 26.48%, a little bit lower than the single-slug case. It illustrates that the reduced liquid absorption in the high permeability layers has only a little effect on efficiency, but the increased liquid absorption in low permeability layers has a significant influence on its efficiency. Thus, the efficiency in low permeability layers shows a great change.
The experimental results show that a reasonable alternating cycle and slug size can improve the oil displacement efficiency in heterogeneous formation with an optimum limitation. On the condition of constant injection volume, a frequency alteration will lead to a small slug size; the polymer could not play the effect of blocking or closing the high permeability layers, which will result in a decrement in efficiency. It is found from the experiments that for a heterogeneous formation with a permeability ratio of four, the best efficiency can be obtained with alternate cycles of four or five.

4. Conclusions

(1)
The Rh of polymer increases as the MW and concentration increases, and decreases as the solution salinity increases. It is proved from the core blocking test that the relationship between polymer and cores of the same permeability are different due to the pore structure.
(2)
In the PF experiments on heterogeneous cores, the alternating injection can significantly improve the efficiency of low permeability layers by an average of 4.27%, compared to single-slug injection. However, the alternating injection has very little effect on the high permeable layers.
(3)
The experiments verified that the alternating injection increases the efficiency of heterogeneous formation, mainly by improving the efficiency of low permeability layers and the water injection profile.
(4)
The relationship of different regions in Daqing can be an important reference for PF design. During this study, the alternating injection proved to be effective in laboratory experiments. The alternating injection should be carried out as a field test and numerical simulation for further application.

Acknowledgments

This work was supported by Major Project of China National Science and Technology “New technology of reservoir reconstruction” (2016ZX05023005), and a Subject of PetroChina Company Limited. “Research and Application of Volume fracturing design implementation and evaluation technology”.

Author Contributions

Songyuan Liu designed the experimental scheme, and gave advises for the experimental analysis; Anqi Shen wrote the paper draft; Feng Qiu contributed in the results analyses; Shuang Liang writing the final version of the paper; Fengjiao Wang surpervised the work.

Conflicts of Interest

The authors declare no conflict of interest.

References

  1. Yan, J.X. Practice and knowledge of polymer flooding technique applied in Shengli petroliferous province. Oil Gas Recovery Technol. 2002, 9, 1–3. [Google Scholar]
  2. Wang, D.M.; Cheng, J.C.; Wu, J.Z.; Wang, J. Application of polymer flooding technology in Daqing Oilfield. Acta Pet. Sin. 2005, 26, 74–78. [Google Scholar]
  3. Guo, W.K.; Cheng, J.C.; Liao, G.Z. Present Situation and Direction of Tertiary Recovery Technique in the Future in Daqing Oilfield. Pet. Geol. Oilfield Dev. Daqing 2002, 21, 1–6. (In Chinese) [Google Scholar]
  4. Xu, Z.S.; Niu, J.G.; Liao, G.Z. Application and experience of polymer flooding in Daqing oilfield. Pet. Geol. Oilfield Dev. Daqing 2000, 19, 13–16. (In Chinese) [Google Scholar]
  5. Han, P.H.; Dong, Z.L.; Zhang, Q.R. Determination of reasonable polymer amount in polymer flooding. Pet. Geol. Oilfield Dev. Daqing 1999, 18, 40–41. (In Chinese) [Google Scholar]
  6. Qian, G.B.; Xu, C.F.; Chen, Y.K.; Wang, X.G.; Liu, H.X.; Lian, G.H. Microscopic Mechanism of Polymer Flooding in Glutenite Reservoir of Lower Karamay Formation in East District-7(1), Karamay Oilfield. Xinjiang Pet. Geol. 2016, 37, 56–61. (In Chinese) [Google Scholar]
  7. Wang, D.; Wang, G.; Wu, W.; Xia, H.; Yin, H. The Influence of Viscoelasticity on Displacement Efficiency—From Micro to Macro Scale. In Proceedings of the 2007 Annual Technical Conference and Exhibition, Anaheim, CA, USA, 11–14 November 2007. [Google Scholar]
  8. Huh, C.; Pope, G.A. Residual Oil Saturation from Polymer Floods: Laboratory Measurements and Theoretical Interpretation. In Proceedings of the 2008 SPE/DOE Improved Oil Recovery Symposium, Tulsa, OK, USA, 20–23 April 2008. [Google Scholar]
  9. Lu, X.G.; Gao, Z.H.; Zhao, X.J.; Yan, W.H. Distribution regularities of remaining of oil in hetegeneous reservoirs after polymer flooding. Acta Pet. Sin. 1996, 4, 55–61. [Google Scholar]
  10. Li, J.; Wu, L.J.; Shao, Z.B. The technical points of polymer flooding in formation type II of Daqing oilfield. J. Oil Gas Technol. 2005, 27, 394–396. (In Chinese) [Google Scholar]
  11. Ma, P.P. The Influence of Hydrolysis Degree to Salt Tolerance of Zwitterionic Polymer. Master’s Thesis, Southwest Petroleum University, Chengdu, China, 2014. [Google Scholar]
  12. Jin, Z.P. Basic principles and application of laser light scattering detector. Mod. Instrum. 2006, 10, 49–53. [Google Scholar]
  13. Yang, X.Y. The study of polymer molecular size by dynamic light scattering method. Oil-Gas Field Surf. Eng. 2014, 33, 13. (In Chinese) [Google Scholar]
  14. Liu, J.; Zhang, L.J.; Gao, W.D.; Yue, X.A.; Wang, N. Adaptability study on polymer solution in low permeability layer. Pet. Geol. Recovery Effic. 2010, 17, 71–73. [Google Scholar]
  15. Wei, J.G.; Ma, Y.Y. Flow regular pattern experiment of polymer solution in porous medium. J. Petrochem. Univ. 2016, 29, 23–26. [Google Scholar]
  16. Sheng, J.; Leonhardt, B.; Azri, N. Status of polymer flooding technology. J. Can. Petroleum Eng. 2015, 54. [Google Scholar] [CrossRef]
  17. Cao, R.B.; Wang, X.L.; Han, P.H. Multi-slug alternative injection method and field application of polymer flooding. Pet. Geol. Recovery Effic. 2012, 19, 71–73. [Google Scholar]
Figure 1. The relationship between polymer Rh and molecular weight (MW).
Energies 10 01018 g001
Figure 2. The relationship between Rh and polymer concentration.
Energies 10 01018 g002
Figure 3. The relationship between Rh and salinity of solution.
Energies 10 01018 g003
Figure 4. Rh of different polymer concentrations and MW.
Energies 10 01018 g004
Figure 5. Schematic of experiment. 1—storage bottle; 2—hand pump; 3—tranquil pump; 4—water container; 5—polymer container; 6—pressure gauge; 7—core holder; 8—measuring cylinder; 9—thermostat.
Energies 10 01018 g005
Figure 6. Relationship between polymer MW and permeability.
Energies 10 01018 g006
Figure 7. Relationship between polymer Rh and permeability.
Energies 10 01018 g007
Figure 8. Relationship between polymer MW and permeability.
Energies 10 01018 g008
Figure 9. Schematics of cores simulated heterogeneity. (a) Schema of artificial homogeneous cores for heterogeneous between layers; and (b) schema of artificial heterogeneous cores for intraformational heterogeneous.
Energies 10 01018 g009
Figure 10. Diversion rate curve of single slug and alternating slug.
Energies 10 01018 g010
Figure 11. Histogram of liquid absorption ratio in each slug.
Energies 10 01018 g011
Figure 12. Histogram of improved efficiency in each slug.
Energies 10 01018 g012
Figure 13. Improved efficiency in each slug for different layers.
Energies 10 01018 g013
Table 1. Pore structure parameters of the natural cores. (Results of constant-rate mercury injection experiments).
Group No.Well NameSample No.LayerPorosity/%Permeability/×10−3 μm2Throat Radius/µmPore Throat RatioMainstream Throat Radius/µmStructural Coefficient
AX9-12-2SII26.9083.66.2342.716.981.90
B2-322-JP3415-1SII27.9085.611.0926.758.724.19
BX9-16-2SIII26.72244.27.1346.126.710.76
B2-322-JP3415-2SIII28.06225.77.2743.9916.141.38
CX9-15-2SII27.80437.011.2629.798.860.45
B2-322-JP3410-2SII29.43438.311.6827.8216.152.36
Table 2. Experiment setup of single-slug and alternating slug injection for divided-flow experiments.
Injection PatternVolume of Total Polymer Injection (PV)Volume of One Slug (PV)MW (×104)Concentration (mg/L)Viscosity (mPa·s)
Single-slug0.56/25002000185
Single-slug0.56/1700100043.7
Alternating slug0.560.2825002000185
0.281700100043.7
Table 3. Experiment setup of single-slug and alternating slug injection in Section 3.2.2.
Injection PatternVolume of Total Polymer Injection (PV)Volume of One Slug (PV)MW (×104)Concentration (mg/L)Viscosity (mPa·s)
Single-slug2.24/25002000185
Single-slug2.24/1700100043.7
Alternating slug2.240.28 (4 times)25002000185
0.28 (4 times)1700100043.7

