CFD Analysis on the Air-Side Thermal-Hydraulic Performance of Multi-Louvered Fin Heat Exchangers at Low Reynolds Numbers


School of Mechanical Engineering, Kyungpook National University, Daegu 41566, Korea
*
Author to whom correspondence should be addressed.
Energies 2017, 10(6), 823; https://doi.org/10.3390/en10060823
Submission received: 5 April 2017
/
Revised: 7 May 2017
/
Accepted: 13 June 2017
/
Published: 18 June 2017
(This article belongs to the Section I: Energy Fundamentals and Conversion)
Abstract
:The air-side thermal-hydraulic performance of multi-louvered aluminium fin heat exchangers is investigated. A systematic numerical study has been performed to analyze the air-sde thermal hydraulic characteristics over a wide range of Reynolds number i.e., from 30 to 500. Air-side heat transfer coefficient and pressure drop were calculated and validated over the mentioned band of Reynolds numbers. The critical Reynolds number was determined numerically; and also the variation of flow pattern along with the air-side heat transfer coefficient and pressure drop in a multi-louvered heat exchanger associated with has been reported. Moreover, a parametric study of the multi-louvered aluminium fin heat exchangers was also performed for 36 heat exchanger configurations with the louver angles (19–31°); fin pitches (1.0, 1.2, 1.4 mm) and flow depths (16, 20, 24 mm); and the geometric configuration exhibiting the highest air-side heat transfer coefficient was reported. The air-side heat transfer coefficient and pressure drop results for different geometrical configurations were presented in terms of Colburn j factor and Fanning friction factor f; as a function of Reynolds number based on louver pitch.
1. Introduction
Fin and tube heat exchangers have been widely used throughout the world as condensers and evaporators for refrigeration and air conditioning applications. The thermal performance of the fin and tube heat exchanger is limited by several design factors like, wakes generated in the round tube, contact resistance and the distortion of the fins due to the tube expansion. The contact resistance problem can be solved by brazing the fins to the tube, but it still has its shortcomings. On the other hand, the flat tube louvered heat exchangers have been proven to be performance wise better by its counterpart due to its compactness, hence providing a large heat transfer area in a small space with high heat transfer coefficients. Over the years, multi-louvered fin and flat tube heat exchangers have replaced fin and tube heat exchangers. In the forced heat transfer, air-side thermal resistance is the key factor; however, the air-side thermal hydraulic performance of multi-louvered fin and flat tube heat exchangers depends on the louvered fin geometry such as fin and louver pitches, louver angle, and flow depth. Rigorous efforts have been made by the researchers to further improve its thermal performance by using experimental and numerical techniques.
Over the years, a number of heat transfer analyses have been performed in order to determine the air-side heat transfer coefficient and pressure drop in terms of Colburn j factor and fanning friction factor f. A large number of experiments were performed by Chang and Wang [1], Kim and Bullard [2,3] and Kim et al. [4,5] to calculate the air-side heat transfer and pressure drop data. Few investigators opted for the scaled up models for better understanding of flow patterns while others went for the numerical techniques to better predict the results to understand the shortcomings in experimental methods. Webb and Jung [6] compared the heat transfer ability of louvered fin flat tube geometry with fin tube geometry and reported that, for same air-side thermal capacity, only half of the volume is required in the case of louvered fin flat tube geometry. They performed experiments using six one row samples with Lα = 30°, 0.48 ≤ Lp/Fp ≤ 1 for 100 ≤ ReLp ≤ 2000.
Webb and Lee [7] further studied the louvered fin flat tube geometry and compared flat tube heat exchangers with round tube heat exchangers showing that less than half of the material was required for the same thermal performance using flat tube heat exchangers. The flow visualization study was performed first by Davenport [8], who predicted that the flow at low Reynolds number was not able to pass through two adjacent louvers of fin because of thick boundary layer generation around the louvers. Many researchers followed the trend afterward and investigated the air-side heat transfer coefficient and pressure drop. It should be mentioned here that the fin corrugation pattern (Z-shaped) used by the Davenport [9] is not common. Two different louver lengths of 7.8 and 12.7 mm were used while other louver dimensions were varied as 8° ≤ Lα ≤ 36° and 0.94 ≤ Lp/Fp ≤ 2.24 for Reynolds number range of 300 ≤ ReLp ≤ 4000. Later on, Achaichia and Cowell [10] confirmed this phenomenon, through heat transfer tests on 15 louvered fin flat tube geometries with the following specifications; 0.24 ≤ Lp/Fp ≤ 0.85 and 22° ≤ Lα ≤ 30° for 30 ≤ ReLp ≤ 1000. They proposed j and f correlations for the air side based on their own experimental data. Sunden and Svantesson [11] also proposed j and f factor correlations based on their experimental data collected from the tests carried out on six one row samples with 14° ≤ Lα ≤ 34° and 0.26 ≤ Lp/Fp ≤ 0.91 for Reynolds number ranging from 100 to 700.
Sahnoun and Webb’s [12] analytical model for heat transfer and friction data was validated by Chang and Wang [1]. They performed tests on 27 samples with the following geometric parameters; Lα = 28° and 0.60 ≤ Lp/Fp ≤ 0.85 for 100 ≤ ReLp ≤ 800. Chang and Wang [13,14,15] also developed a generalized j and f correlation for louver fin geometry with the help of a large dataset consisting of 91 samples. Louver geometry design for the locomotive company was proposed by Zhang and Lang [16]. They performed an experimental study on the scaled up models by varying louver angles and fin pitch values. Aoki et al. [17] conducted experiments on heat transfer characteristics of different louvered fin geometries, varying louver angles, louver pitches and fin pitches. They reported that the air-side heat transfer coefficient decreases at low Reynolds number as the fin pitch increases. In addition, the heat transfer coefficient increases with the increase in the louver angle, reaches a maximum value and then decreases. They reported the maximum values of air-side heat transfer coefficient at a louver angle of 28–30°. Air-side heat transfer coefficient and friction losses for high surface area density louvered fins and flat tube heat exchanger were investigated by Rugh et al. [18]. They developed j and f factor correlation and reported a 25% increase in heat transfer and an 110% increase in pressure drop for louvered fin geometry in comparison to the plain fin geometry.
Springer and Thole [19] performed both numerical and experimental studies to determine the flow behavior of different louvered fin configurations. They reported the flow characteristics at different Reynolds number values. Forty-five samples of louvered fin flat tube heat exchangers with different louver angles (15–29°), fin pitches (1.0, 1.2, 1.4 mm) and flow depths (16, 20, 24 mm) were experimentally tested for the air-side Reynolds number of 100–600 by Kim and Bullard [2]. A huge dataset of results was gathered, analyzed and the air-side heat transfer coefficient and pressure drop were reported in terms of Colburn j factor and Fanning friction f factor, as a function of Reynolds number. Dejong and Jacobi [20] investigated the phenomenon of vortex shedding in the louver geometry, the vortex shedding starts at the end louver and moves up with the increase in the Reynolds number. It was further reported that this vortex shedding phenomenon starts at a critical Reynolds number, and it decreases with the increase in louver angle and decrease in fin pitch. Kim and Cho [21] performed experiments on louvered fin flat tube geometry over a wide range of Reynolds numbers i.e., from 40 to 1000, on 12 samples with the following set of dimensions; 15° ≤ Lα ≤ 27°, 1.21 ≤ Lp/Fp ≤ 1.70 and fin pitches of (1.0, 1.2, 1.4 mm). They studied the critical Reynolds number by performing the experiments at air velocities as low as 0.3 m/s. It was reported that the critical Reynolds number is where the eddies and vortices start to appear around the louvers and there is a peak noticed in the Colburn j factor curve at this point and a fall-off of the j factor curve occurs as the Reynolds number is further decreased. Kim and Cho [21] reported that this critical Reynolds number is insensitive to the louver angle and decreases as the ratio of louver pitch to fin pitch decreases. They also asserted on the basis of their experimental results that existing correlations of critical Reynolds numbers do not predict the data adequately, but no new correlation of critical Reynolds number was proposed. They compared their results with the existing j and f correlations and new correlations were proposed as none of the previous ones fully predicted the data.
Further efforts were put up for the numerical study to gather detailed flow patterns over the louvered fin flat tube heat exchangers. Achaichia and Cowell [22] modeled one louver in the fully developed flow region applying periodic boundary condition and categorized the flow into duct directed and louver directed. At low velocities, the flow was mainly duct directed due to the thick boundary layers around the louvers while, at higher velocities, the flow was parallel to the louvers and was mostly louver directed. Flow efficiency was introduced by Webb and Trauger [23], and they used large scale models for flow visualization experiments. They explained it as the ratio of louver directed flow to the total flow through the fins. They further reported that the flow efficiency increases with the fin pitch decrease and the Reynolds number increase. A numerical time-dependent study of the two-dimensional and three-dimensional model of the louvered fin flat tube heat exchanger was done by Atkinson et al. [24]. Reportedly, a three-dimensional model presented better results than the two-dimensional model. Tafti et al. [25] studied the flow transition and the instabilities within the louvered fin flat tube heat exchanger. They conducted a two-dimensional, time-dependent study and reported that the instability noticed at the end louver moves upstream as the Reynolds number is increased. Perrotin and Clodic [26] performed a numerical study along with a small set of experiments. They also conducted a two-dimensional study to understand the turbulence in the louvered fin flat tube geometry with the increase in Reynolds number. They compared their results with previous studies in terms of j and f factors. An offset was noticed in the results since the two-dimensional model over-predicted the data due to unrealistic assumptions and a three-dimensional model under-predicted the data due to the limitations in mesh and computational resources.
The literature review shows that most of the experimental and numerical studies were performed for Reynolds numbers higher than 100. Only a couple of studies were found that focused on the low Reynolds number range i.e., below 100. Achaicha and Cowell [22] conducted the study that includes the air-side analysis of louvered fin flat plate heat exchangers up to a Reynolds number value of 30, but that was for geometries with Lp/Fp < 1.0. Later, Kim and Cho [21] presented an experimental study with Reynolds number values as low as 30, for louvered fin flat tube geometries with Lp/Fp > 1.0. Two separate Colburn j factor correlations were developed for Reynolds number values of higher and lower than 150. Although the existing correlations for critical Reynolds numbers were reported to be invalid, no new critical Reynolds number correlation was proposed. Table 1 shows the summary of the previously conducted studies on the louvered fin flat tube heat exchangers along with the geometric dimensions considered in each study. Recently, Shinde and Lin [27] performed an experimental study using 26 heat exchanger samples obtained from manufacturers of the United States, Europe, and Asia. The parameters of the heat exchangers were: fin pitch of 7–21.17 FPI, fin height of 5.6–10 mm, fin thickness of 0.08–0.17 mm, louver pitch of 0.9–2.44 mm, louver angle of 20–34°, louver length of 5.97–7.87 mm, tube height of 1.5–4.19 mm, tube depth of 12–30 mm, and fin depth of 12–30 mm. Air-side heat transfer and pressure drop data were reported for all 26 samples in terms of j and f factors and were compared. They also proposed two correlations for low () and high range () of Reynolds number for both j and f factors based on their experimental data. Table 2 shows the list of and factor correlations published by several authors until now along with operational limitations.
The present study numerically investigates the thermal hydraulic performance of multi-louvered fin and flat tube heat exchangers using 36 heat exchanger models with different louver angles (19–31°), flow depths (16, 20, 24 mm) and 1.21 ≤ Lp/Fp ≤ 1.70 over a Reynolds number range of 30 to 500. The heat transfer coefficient and pressure drop data for heat exchangers with different geometrical configurations are reported in terms of the Colburn j factor and Fanning friction factor f, as a function of Reynolds number based on the louver pitch. The geometric configuration showing best thermal performance for low Re range was reported. In addition, the effect of louvered fin parameters on the critical Reynolds number is investigated. Critical Reynolds number was determined numerically, and also the variation in flow pattern along with the thermal and hydraulic performance of microchannel heat exchanger associated with has been reported.
2. Geometry and Computational Model
2.1. Geometric Model
A total of 36 heat exchanger configurations having three different flow depths , three different fin pitches and four different louver angles were considered for numerical analysis. The fin thickness and louver pitch value for all computational models were kept constant at and respectively. The fin pitch parameter is varied by changing the thickness of three-dimensional computational domain. The analysis was performed under conditions mimicking the actual test environment. The inlet air temperature was fixed at 21 °C, and since the tube-side thermal resistance needs to be minimized in order to accurately predict the air-side heat transfer coefficient, the tube temperature was kept constant at across the flow depth. Geometric dimensions for the heat exchanger models used for analysis are mentioned in detail, in Figure 1 and Table 3.
The thermophysical properties of a three-dimensional steady-state model with air as fluid and aluminium as solid material are as follows. Air was used as an ideal gas and its thermal properties were calculated at the arithmetic mean air temperature within the computational domain. The air viscosity is calculated from the Sutherland Equation. Thermal conductivity of aluminium is 202.4 W/mK.
2.2. Governing Equations
A steady state laminar flow analysis was performed for all geometric models considering the fact that flow has been proven to be laminar in the compact heat exchangers up to Reynolds number value of 1200. The conservation of mass, momentum and energy equations used in an inertial reference frame for steady state conditions are shown in (1)–(3):
Continuity equation:
Momentum equation:
The energy equation in steady state conditions can be described as follows:
2.3. Numerical Schemes and Boundary Conditions
Steady state, absolute velocity formulation and pressure based setting were used to setup the cases while SIMPLE pressure velocity coupling was applied. A Least Square Cell-Based method was implemented for computing gradients. A second order for pressure and second order upwind discretization scheme were used for momentum and energy equations.
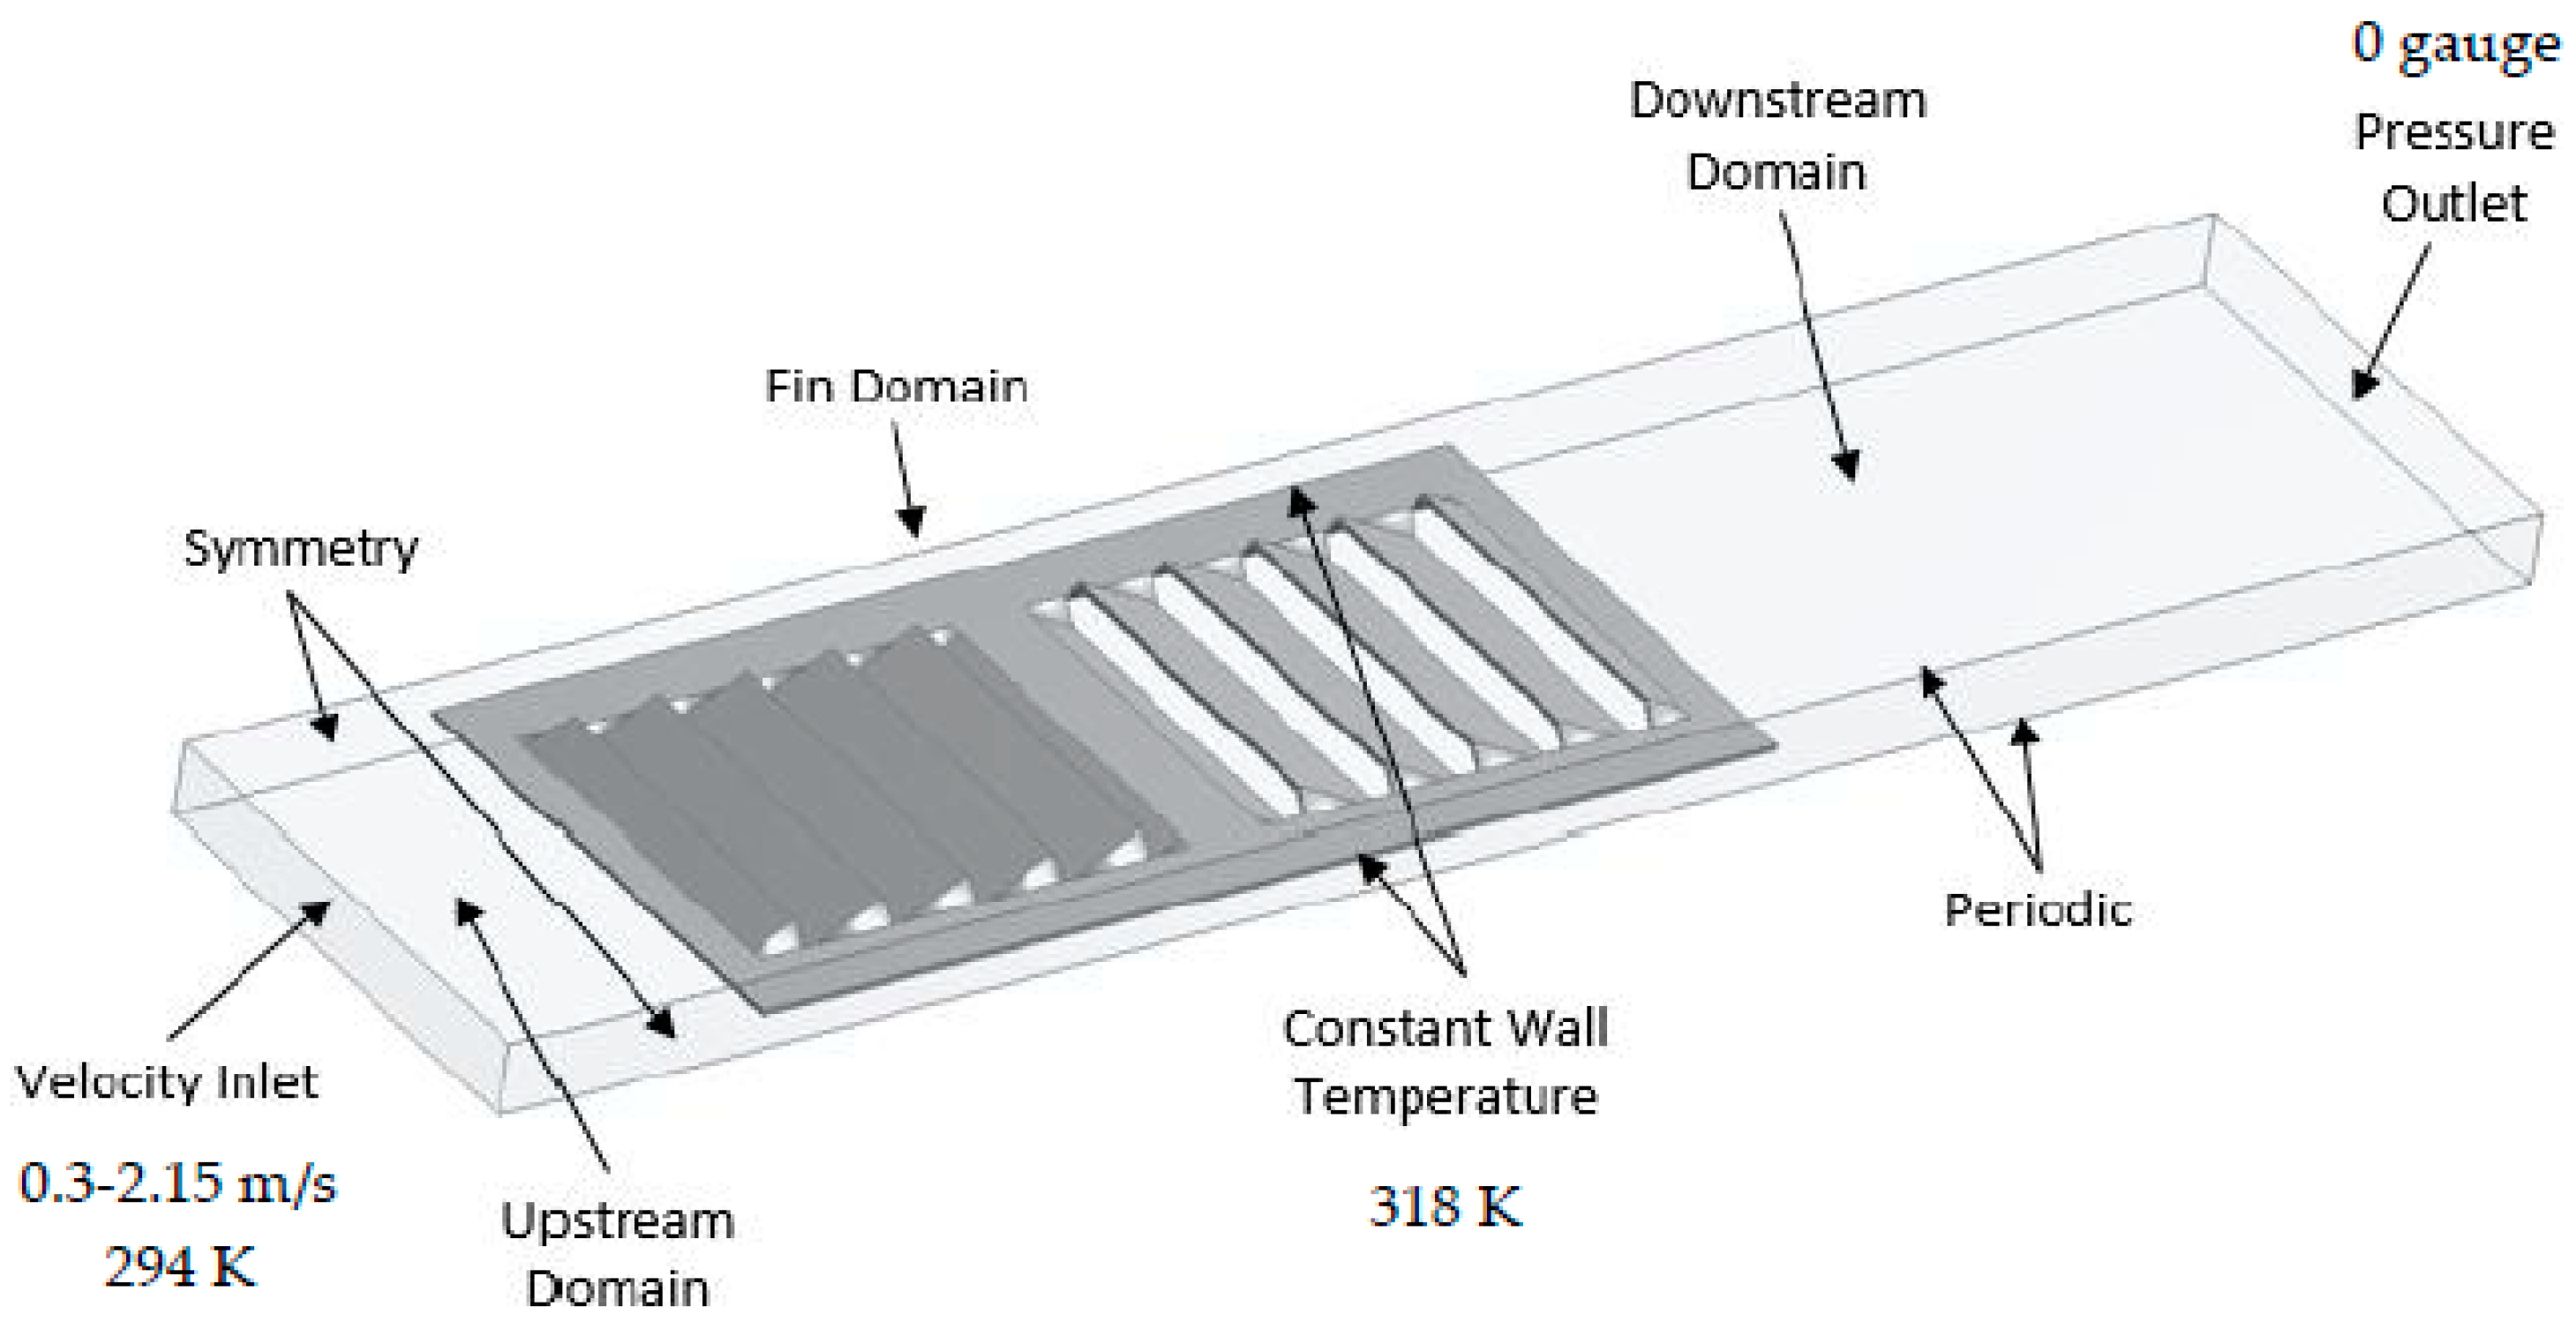
Velocity inlet and pressure outlet boundary conditions were applied to the air inlet and outlet. Frontal air velocity value of 0.3–2.15 m/s corresponding to the louver pitch based Reynolds number of 30–500 was applied at the air inlet boundary while zero gauge pressure was kept at the pressure outlet boundary. The air domain was divided into three sub-domains; upstream, downstream and fin domain. The width of the upstream domain and downstream domain was kept fixed at 5 mm (four times fin pitch) and 15 mm (ten times fin pitch), respectively. This was to ensure that there were zero gradients of temperature, pressure and velocity at the inlet and outlet boundaries. The pressure data was calculated by creating planes at the start and end of the fin in order to only consider the pressure drop within the louvered fin geometry. Only half of the fin was modeled considering the number of simulations and computational cost. Symmetry boundary condition was applied to the transverse faces of upstream and downstream air domains. Symmetry boundary conditions are used when the physical geometry of interest and the expected pattern of the flow/thermal solution have mirror symmetry, which helps to reduce the extent of a computational model to a symmetric subsection of the overall physical system. ANSYS Fluent 16 assumes a zero flux of all quantities across a symmetry boundary. A no-slip boundary condition was imposed on all solid walls and a constant tube wall temperature of 318 K was applied at the transverse face of the fin domain. A periodic boundary condition was used for longitudinal faces of air domain in order to mimic fully developed flow and heat transfer. Periodic boundary condition allows creating a non-conformal periodic boundary interface. This helps to predict heat transfer in periodically repeating geometries, such as compact heat exchangers, by including only a single periodic module for analysis. The detailed schematic of the boundary conditions is shown in Figure 2.
The boundary conditions are described as follows:
At the inlet, velocity inlet boundary condition:
At the front and back, i.e., transverse faces of the computational domain, symmetry boundary condition is used:
At the pressure outlet boundary condition:
At the fluid-solid interface:
represents the direction perpendicular to the cell face.
3. Results and Discussion
The conjugate heat transfer problem was solved in order to take fin conduction into account along with convection in air. The air-side heat transfer coefficient is calculated using the log mean temperature difference method for cross flow heat exchangers with both fluids unmixed, while the air-side heat transfer rate and air outlet temperature are computed numerically. The equations used for calculation of air-side heat transfer coefficient are shown in Equations (4)–(10):
Since the tube wall temperature is assumed constant the expression for log mean temperature difference reduces to the following:
and the air-side heat transfer coefficient is calculated using the heat transfer relation:
The air-side heat transfer coefficient is represented in terms of Colburn factor while air-side pressure drop is shown as Fanning friction factor , using the equation given below:
where
while
3.1. Grid Independence Study and Data Validation
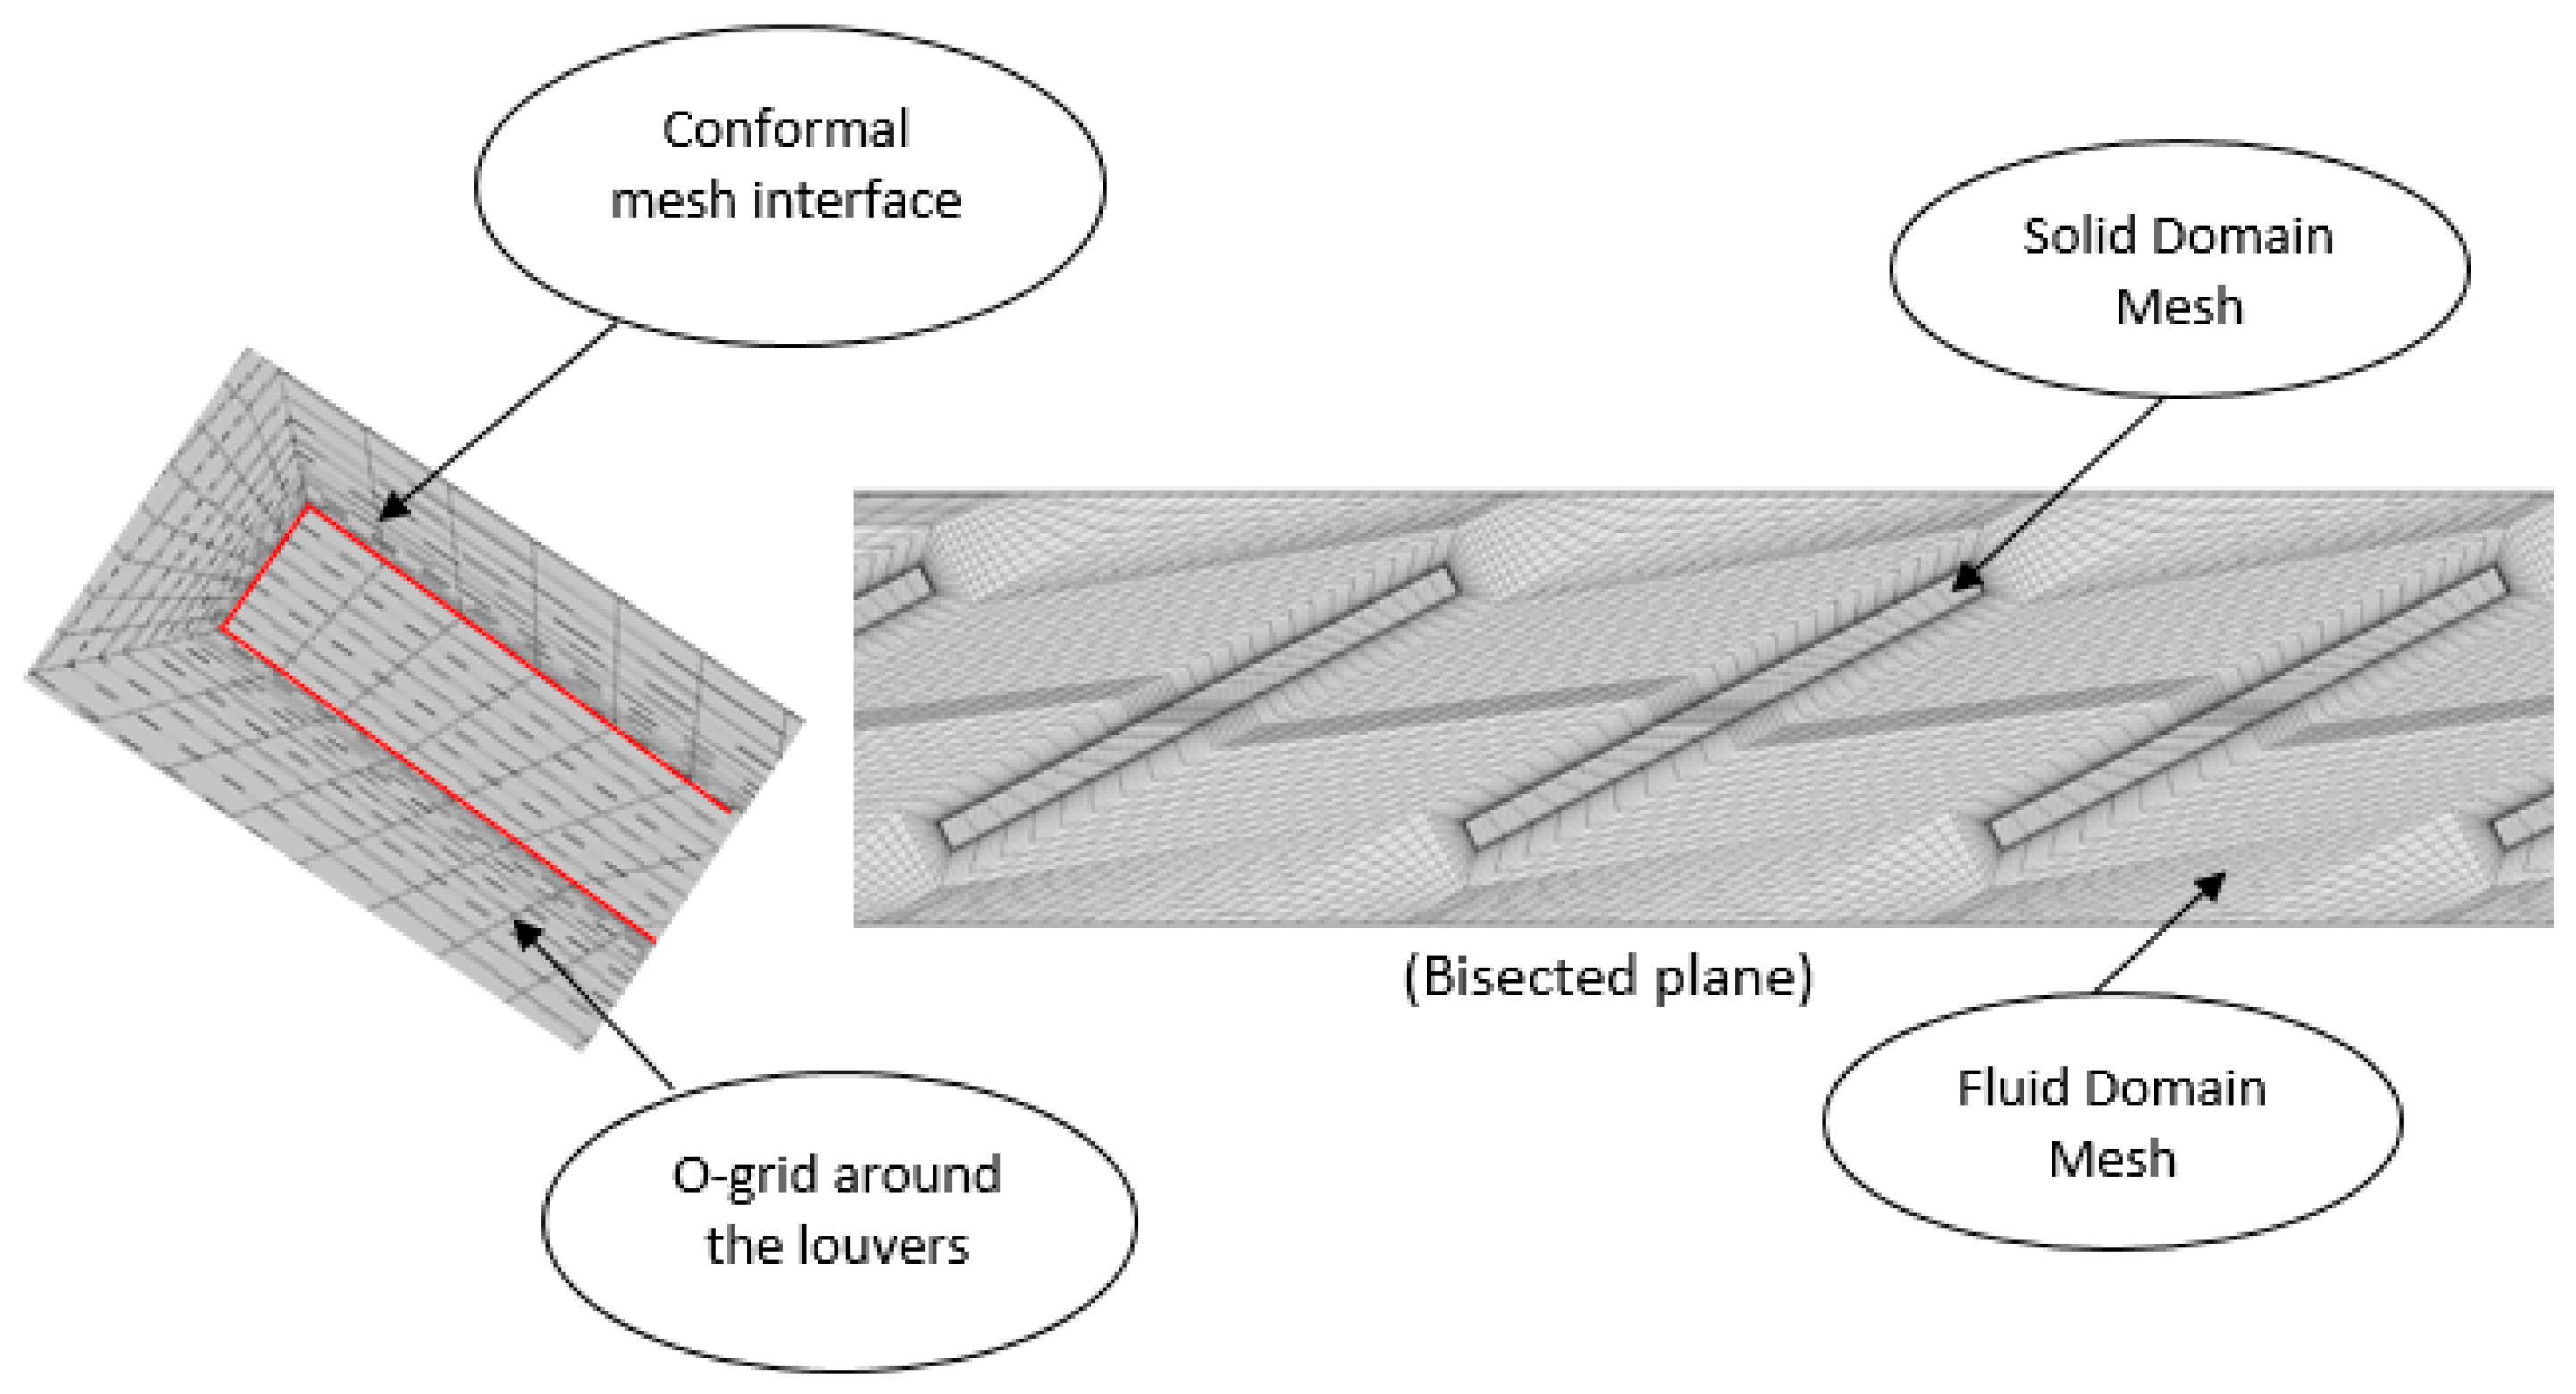
A computational model consisting of solid and fluid domains was discretized using hexahedral elements. The same mesh topology was used to ensure conformal mesh interface between the two domains in order to avoid interpolation losses. To resolve the thermal and viscous boundary layer effectively, O-grid was generated around the fins with varying near wall element sizes shown in Figure 3. Therefore, four different meshes were generated using ICEMCFD with the sizes of 0.9, 1.7, 2.5 and 4.4 million elements. A grid independence study was performed using one of the modeled louvered fin flat tube heat exchanger geometries with the following specifications: louver angle of 27°, Fp = 1.4 mm and Fd = 20 mm at the Reynolds number value of 350. The results gathered from all four meshes are reported in Figure 4. Considering the minuscule difference in the results between M3 and M4, at twice the computational cost and also accounting for a very large number of simulations, mesh M3 was selected. This was done to ensure that computational analysis of the multi-louvered fin flat tube heat exchanger was independent of different mesh adaptations and mesh sizes.
The near wall element sizes used to capture the boundary layer for four different meshes along with other mesh details are mentioned in Table 4.
3.2. Validation of Numerical Model
Three randomly selected louvered fin configurations from the experimental study performed by Shinde and Lin [27] were modeled and analyzed computationally. Samples 2 and 16 have the fin thickness value of while sample has the fin thickness value of 0.08 mm. The results were compared and reported in terms of nondimensionalized parameters, shown in Figure 5, and the two were found to be in good agreement. The j factor against low values of a louver pitch based Reynolds number that is agrees very well with the experimental data, but a small offset is noticed for the higher range of Reynolds number.
3.3. Effect of Fin Pitch
The effect of the fin pitch of the louvered fin was investigated by varying the fin pitch values at different louver angles. The results for air-side heat transfer coefficient are plotted in terms of Colburn j factor in Figure 6, Figure 7 and Figure 8 at three different flow depths of 16, 20 and 24 mm, respectively. The j factor increases with a decrease in fin pitch at high Reynolds number due to the reduction of boundary layer thickness, increasing the heat transfer, while, at a low Reynolds number, the boundary layer thickness is increased, reducing the heat transfer.
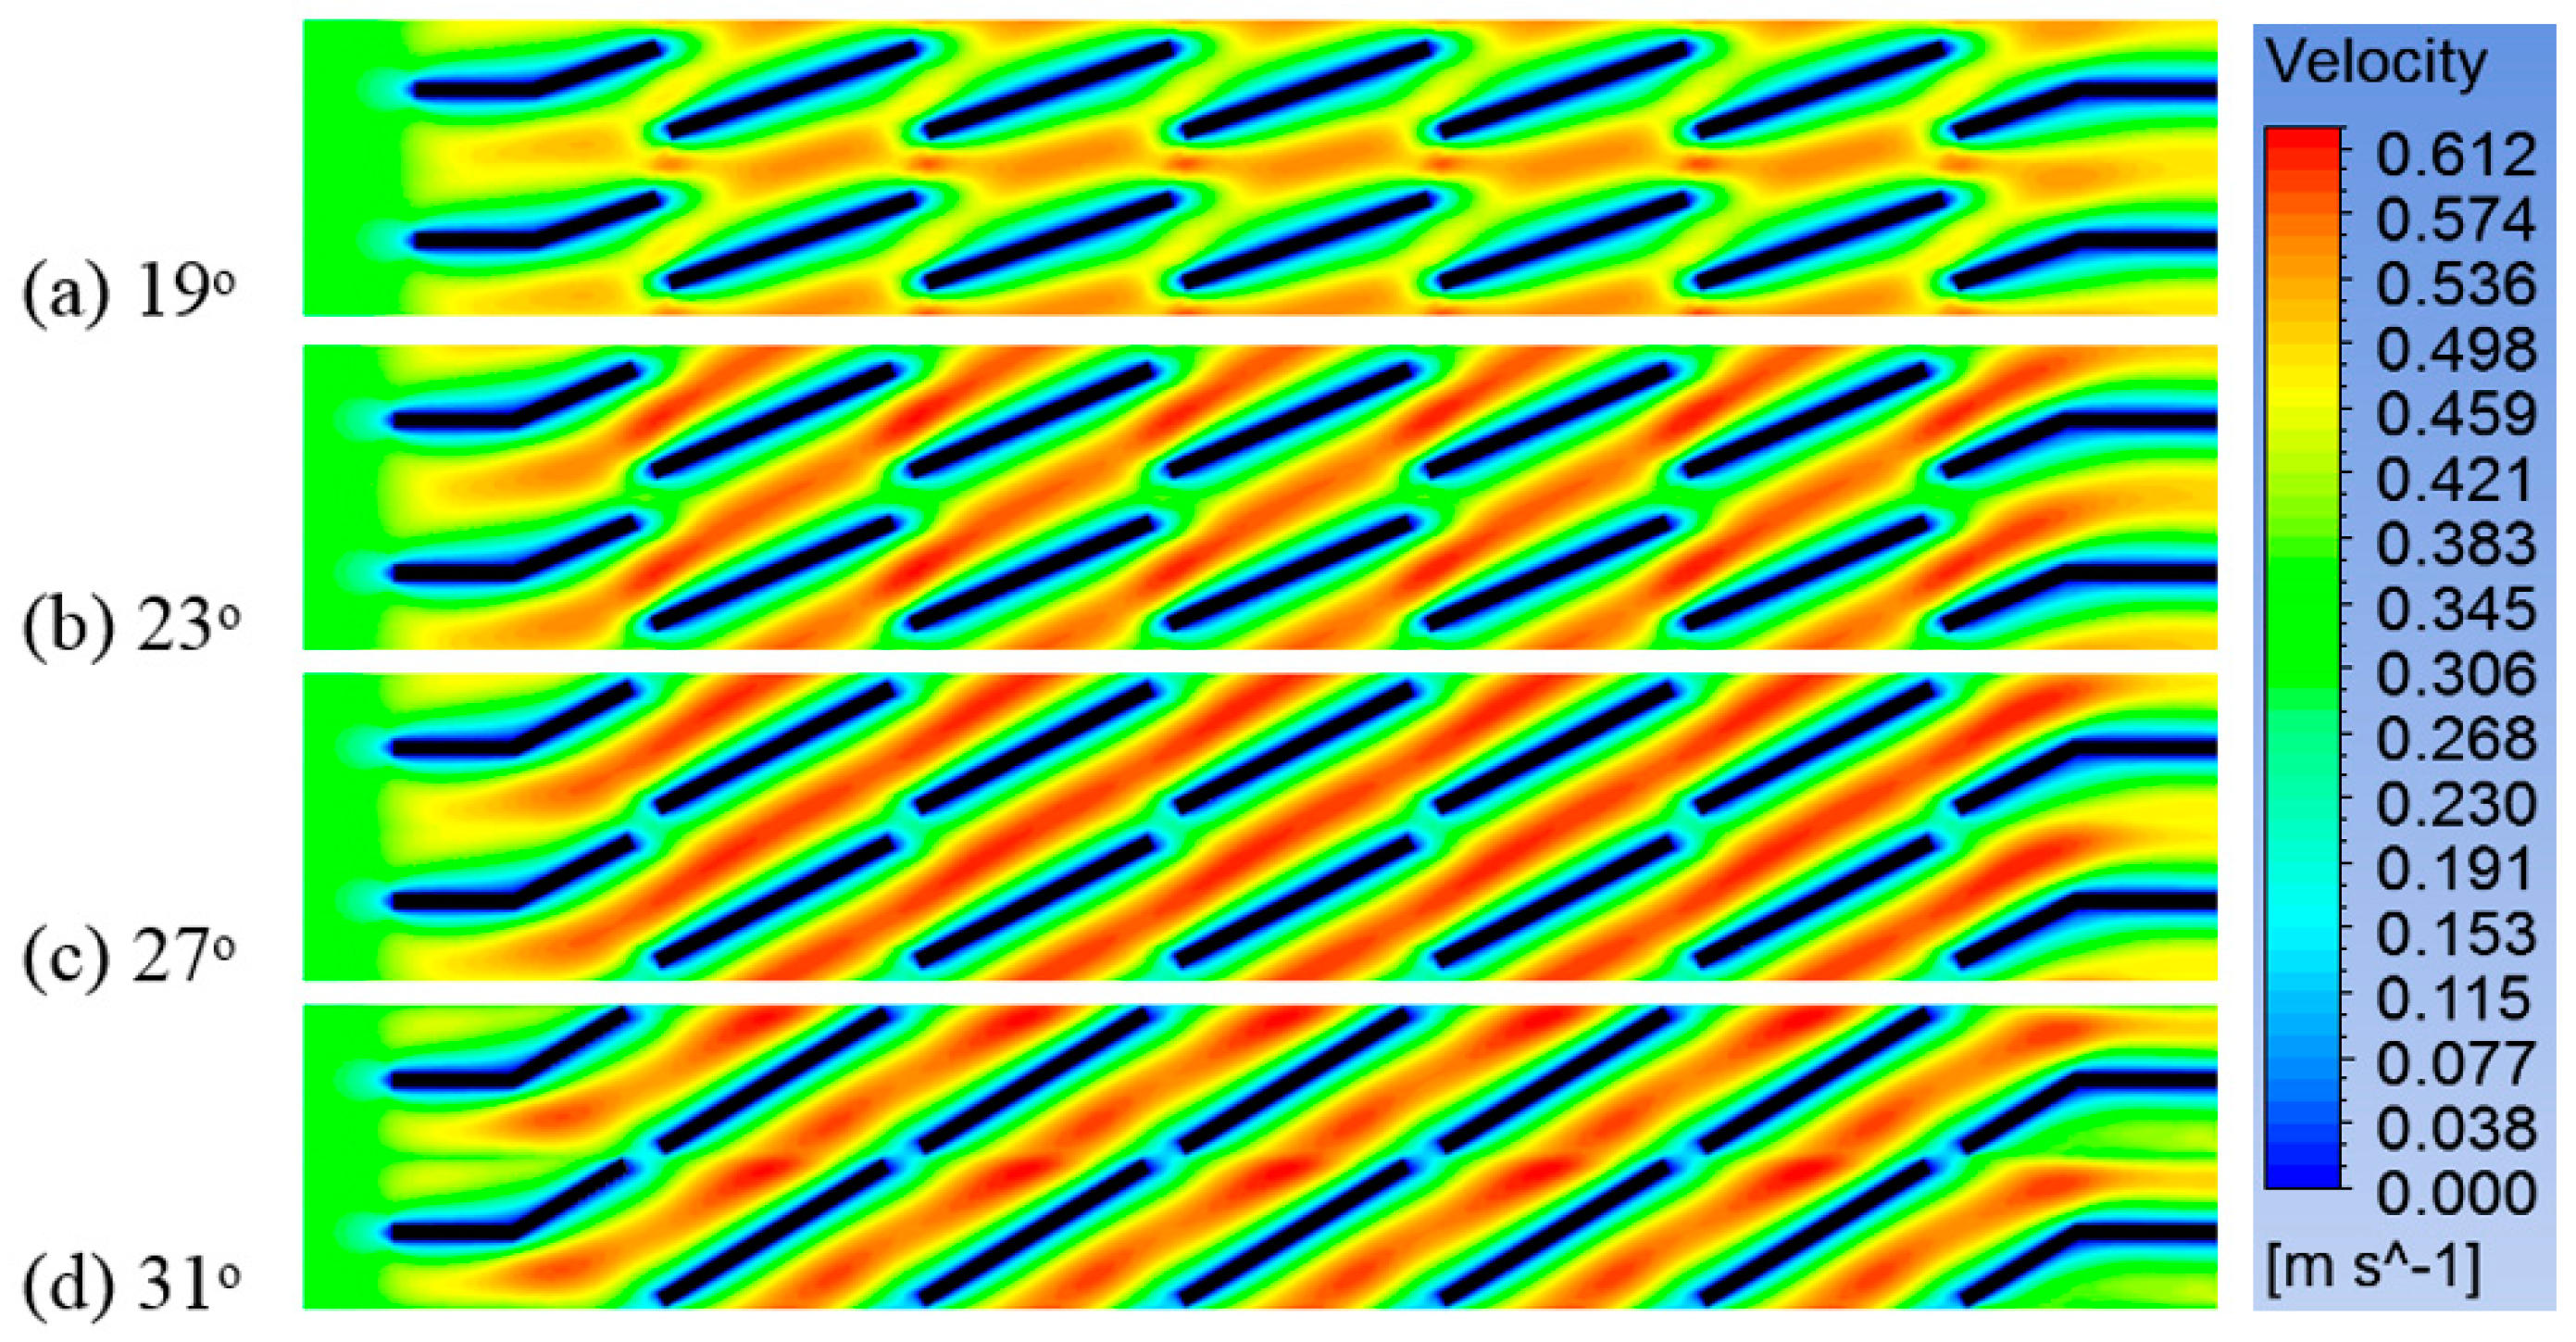
The air-side heat transfer coefficient is also strongly dependent on the relative angle between the corresponding louvers of adjacent fins. Whenever the louvers are oriented in a manner in which the upstream louver reduces the effective surface area of downstream louvers available for heat transfer, the thermal performance reduces drastically. Thermal performance deteriorates significantly at low Reynolds number when the configuration of the louvers is such that the louvers of adjacent fin rows are aligned. In such configuration, wake generated by the trailing edge of the upstream louver covers the downstream louver completely. Moreover, Figure 6 shows that as the louver angle increases, the offset between the j factor curves for different fin pitch reduces due to the alignment of the neighboring louvers. Fin pitch increase at high louver angles is also most likely to deteriorate the thermal performance since the flow is more likely to become duct directed with increasing fin pitch. The critical Reynolds number (fall-off of j factor) is only seen in the case of the fin geometry with fin pitch value of 1 mm. This fall off of j factor is due to the alignment of neighboring fin louvers at those louver angles. Since fin pitch is inversely proportional to the flow efficiency, the fin pitch increases flow becomes more duct directed. Louver configurations along with flow profile variation for different fin pitch values are shown in Figure 9. Webb and Trauger [23] introduced the flow efficiency as the ratio of actual (N) to ideal (D) transverse distance, shown in Equation (11):
The critical Reynolds number peak becomes more clear in Figure 7 and Figure 8, with flow depth of 20 and 24 mm, and this critical Reynolds number fall off disappears with the increase in louver angle. The critical Reynolds number is only seen for geometries with fin pitch of 1.0 and 1.2 mm. The underlying phenomenon for this j factor fall off is explained using Figure 10, which shows the change in boundary layer generation around the louvers for fin geometry with fin pitch and flow depth value of 1 mm and 24 mm, respectively, at four louver angles. It can be seen for louver angle 19°, 23° and 27° that the downstream louver is not placed in the wake of the upstream louver. This allows re-initialization of the boundary layer around the downstream louvers. In contrast, this re-initialization of boundary layer cannot be seen for louver angle of 31°, as the downstream louvers fall in the wake of the upstream louver. For geometry with fin pitch 1.0 mm and louver angle of 31°, the j factor curve shows a vast offset with other two curves associated with fin pitch values of 1.2 and 1.4 mm. This offset can be explained by the consequential deterioration of thermal performance caused by louver alignment, prohibiting the boundary layer re-initialization phenomenon. Figure 8 shows an interrelation between the flow depth and the fin pitch of the louver configuration when it comes to critical Reynolds number. The fall-off in the j factor curves also appears for the fin pitch 1.2 mm along with fin pitch value of 1.0 mm for the geometries with flow depth 24 mm. This may be because of change in flow pattern due to an increase in number of louvers.
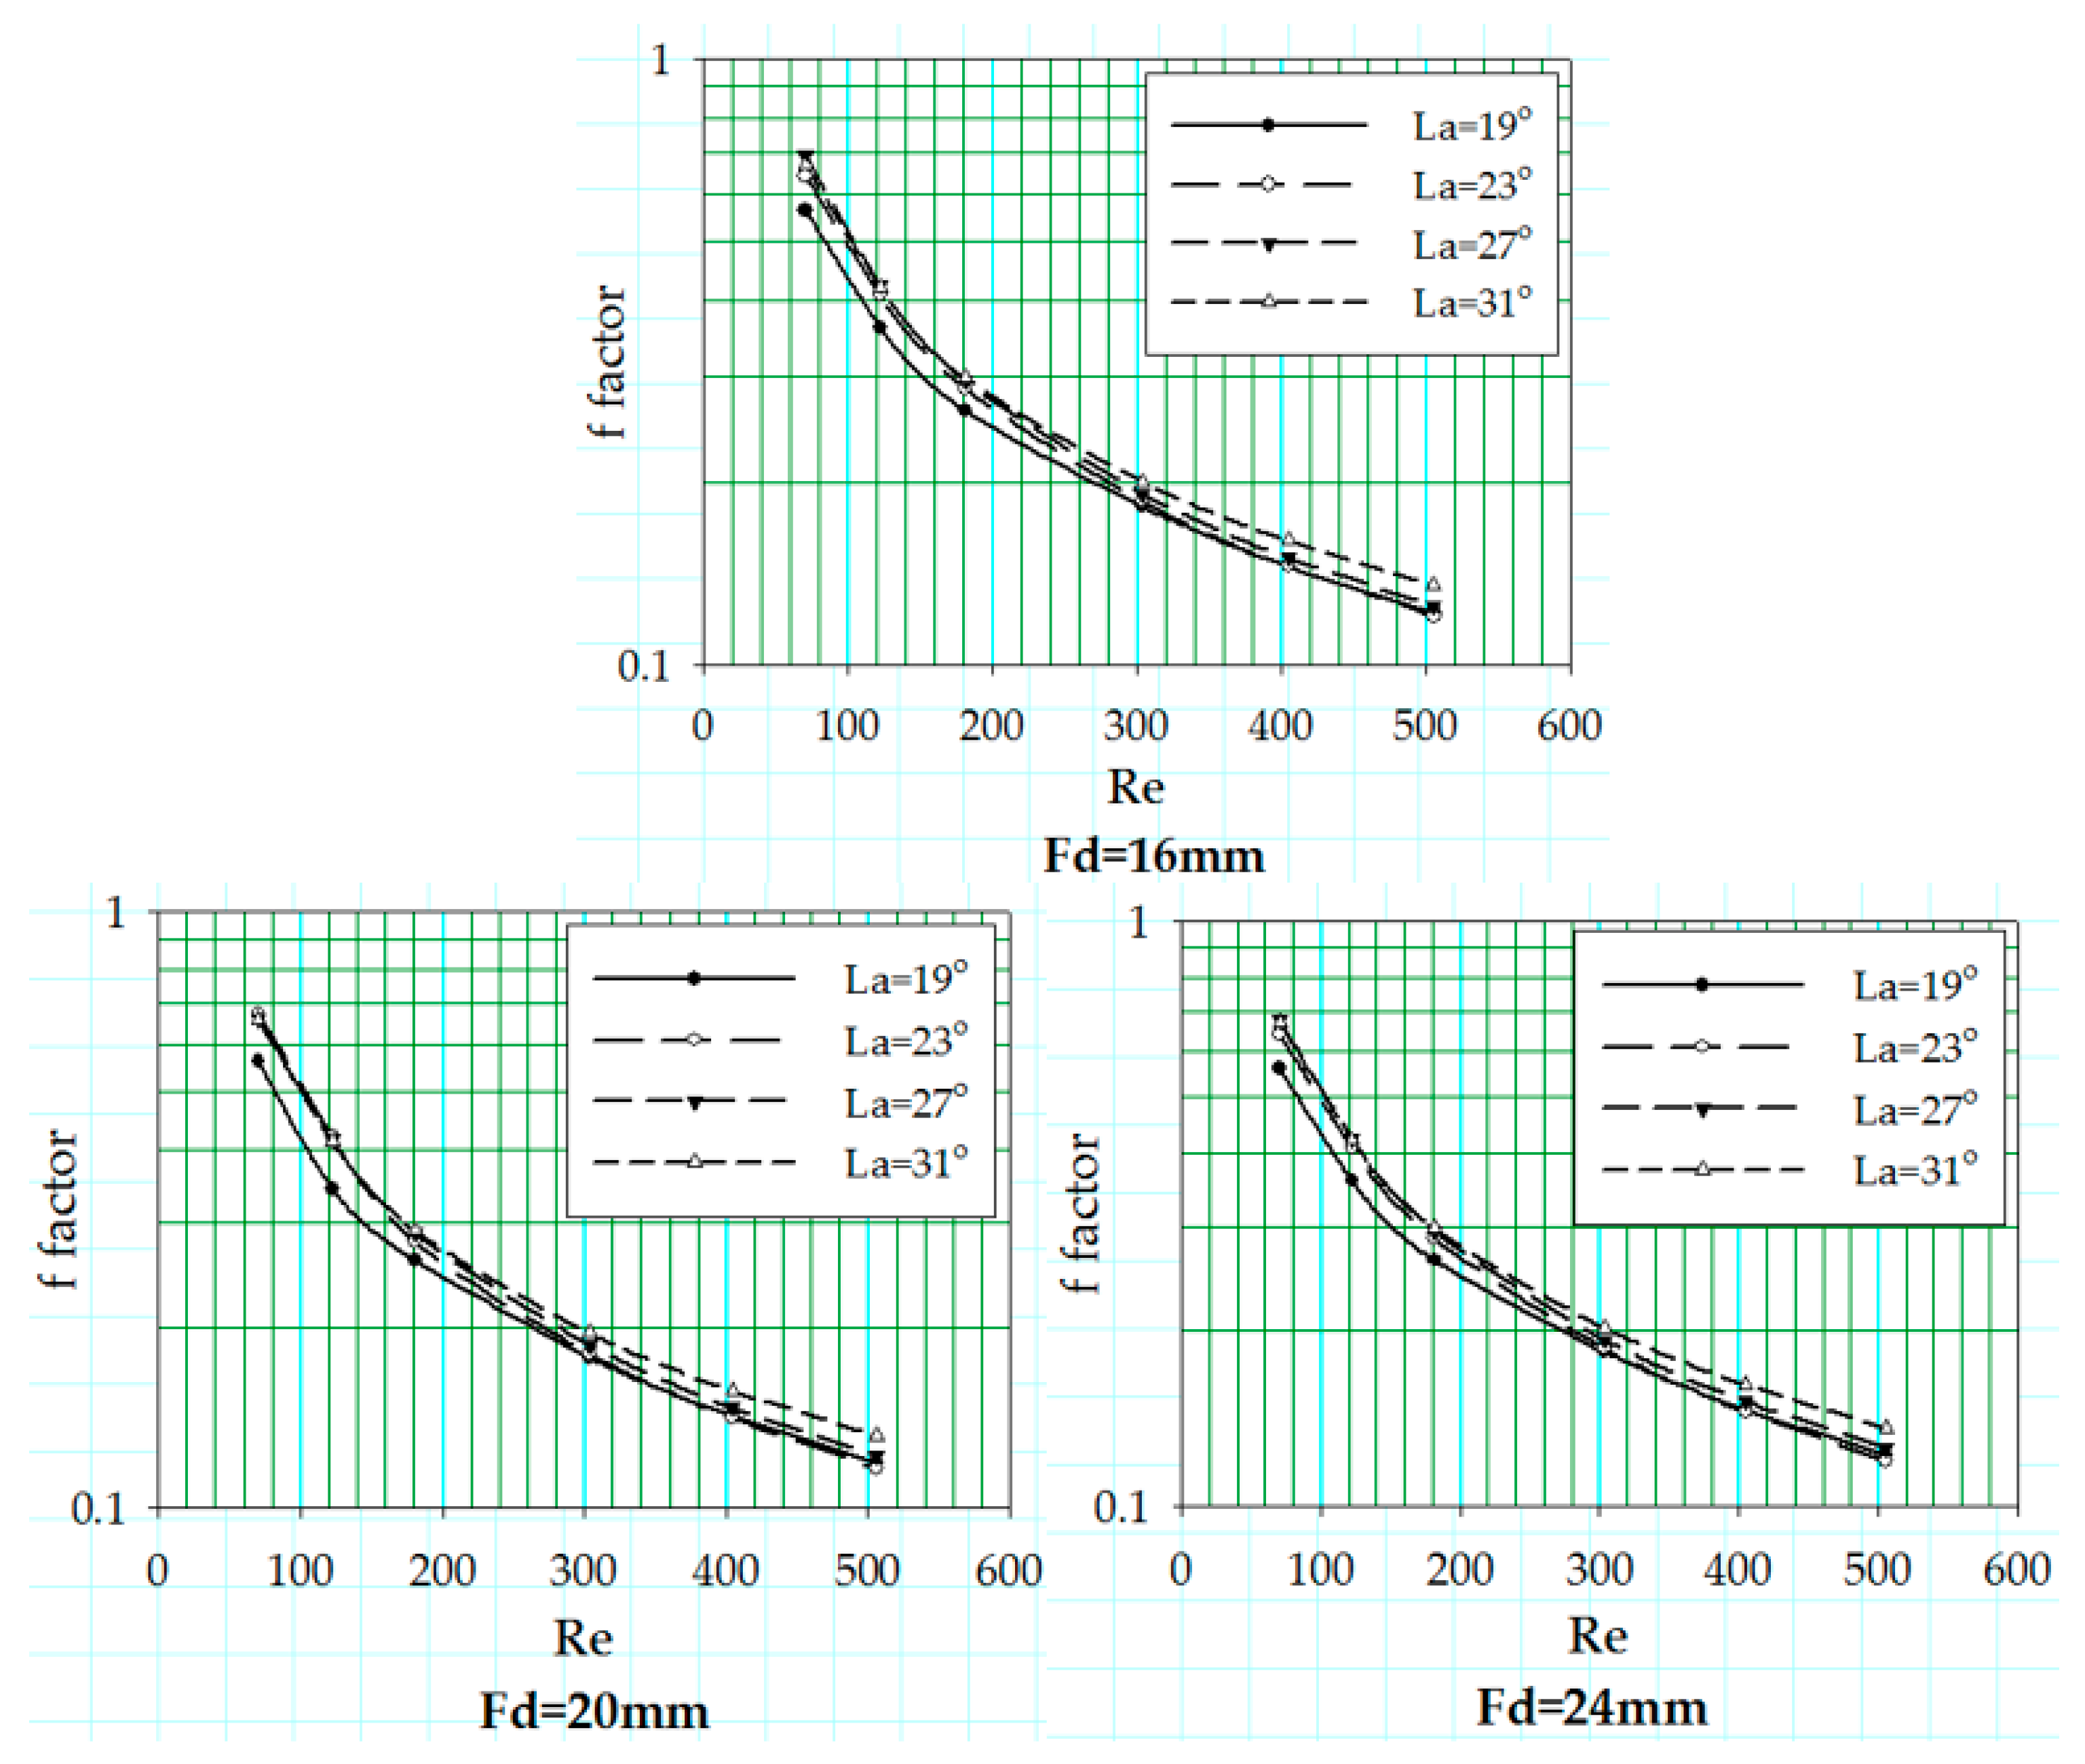
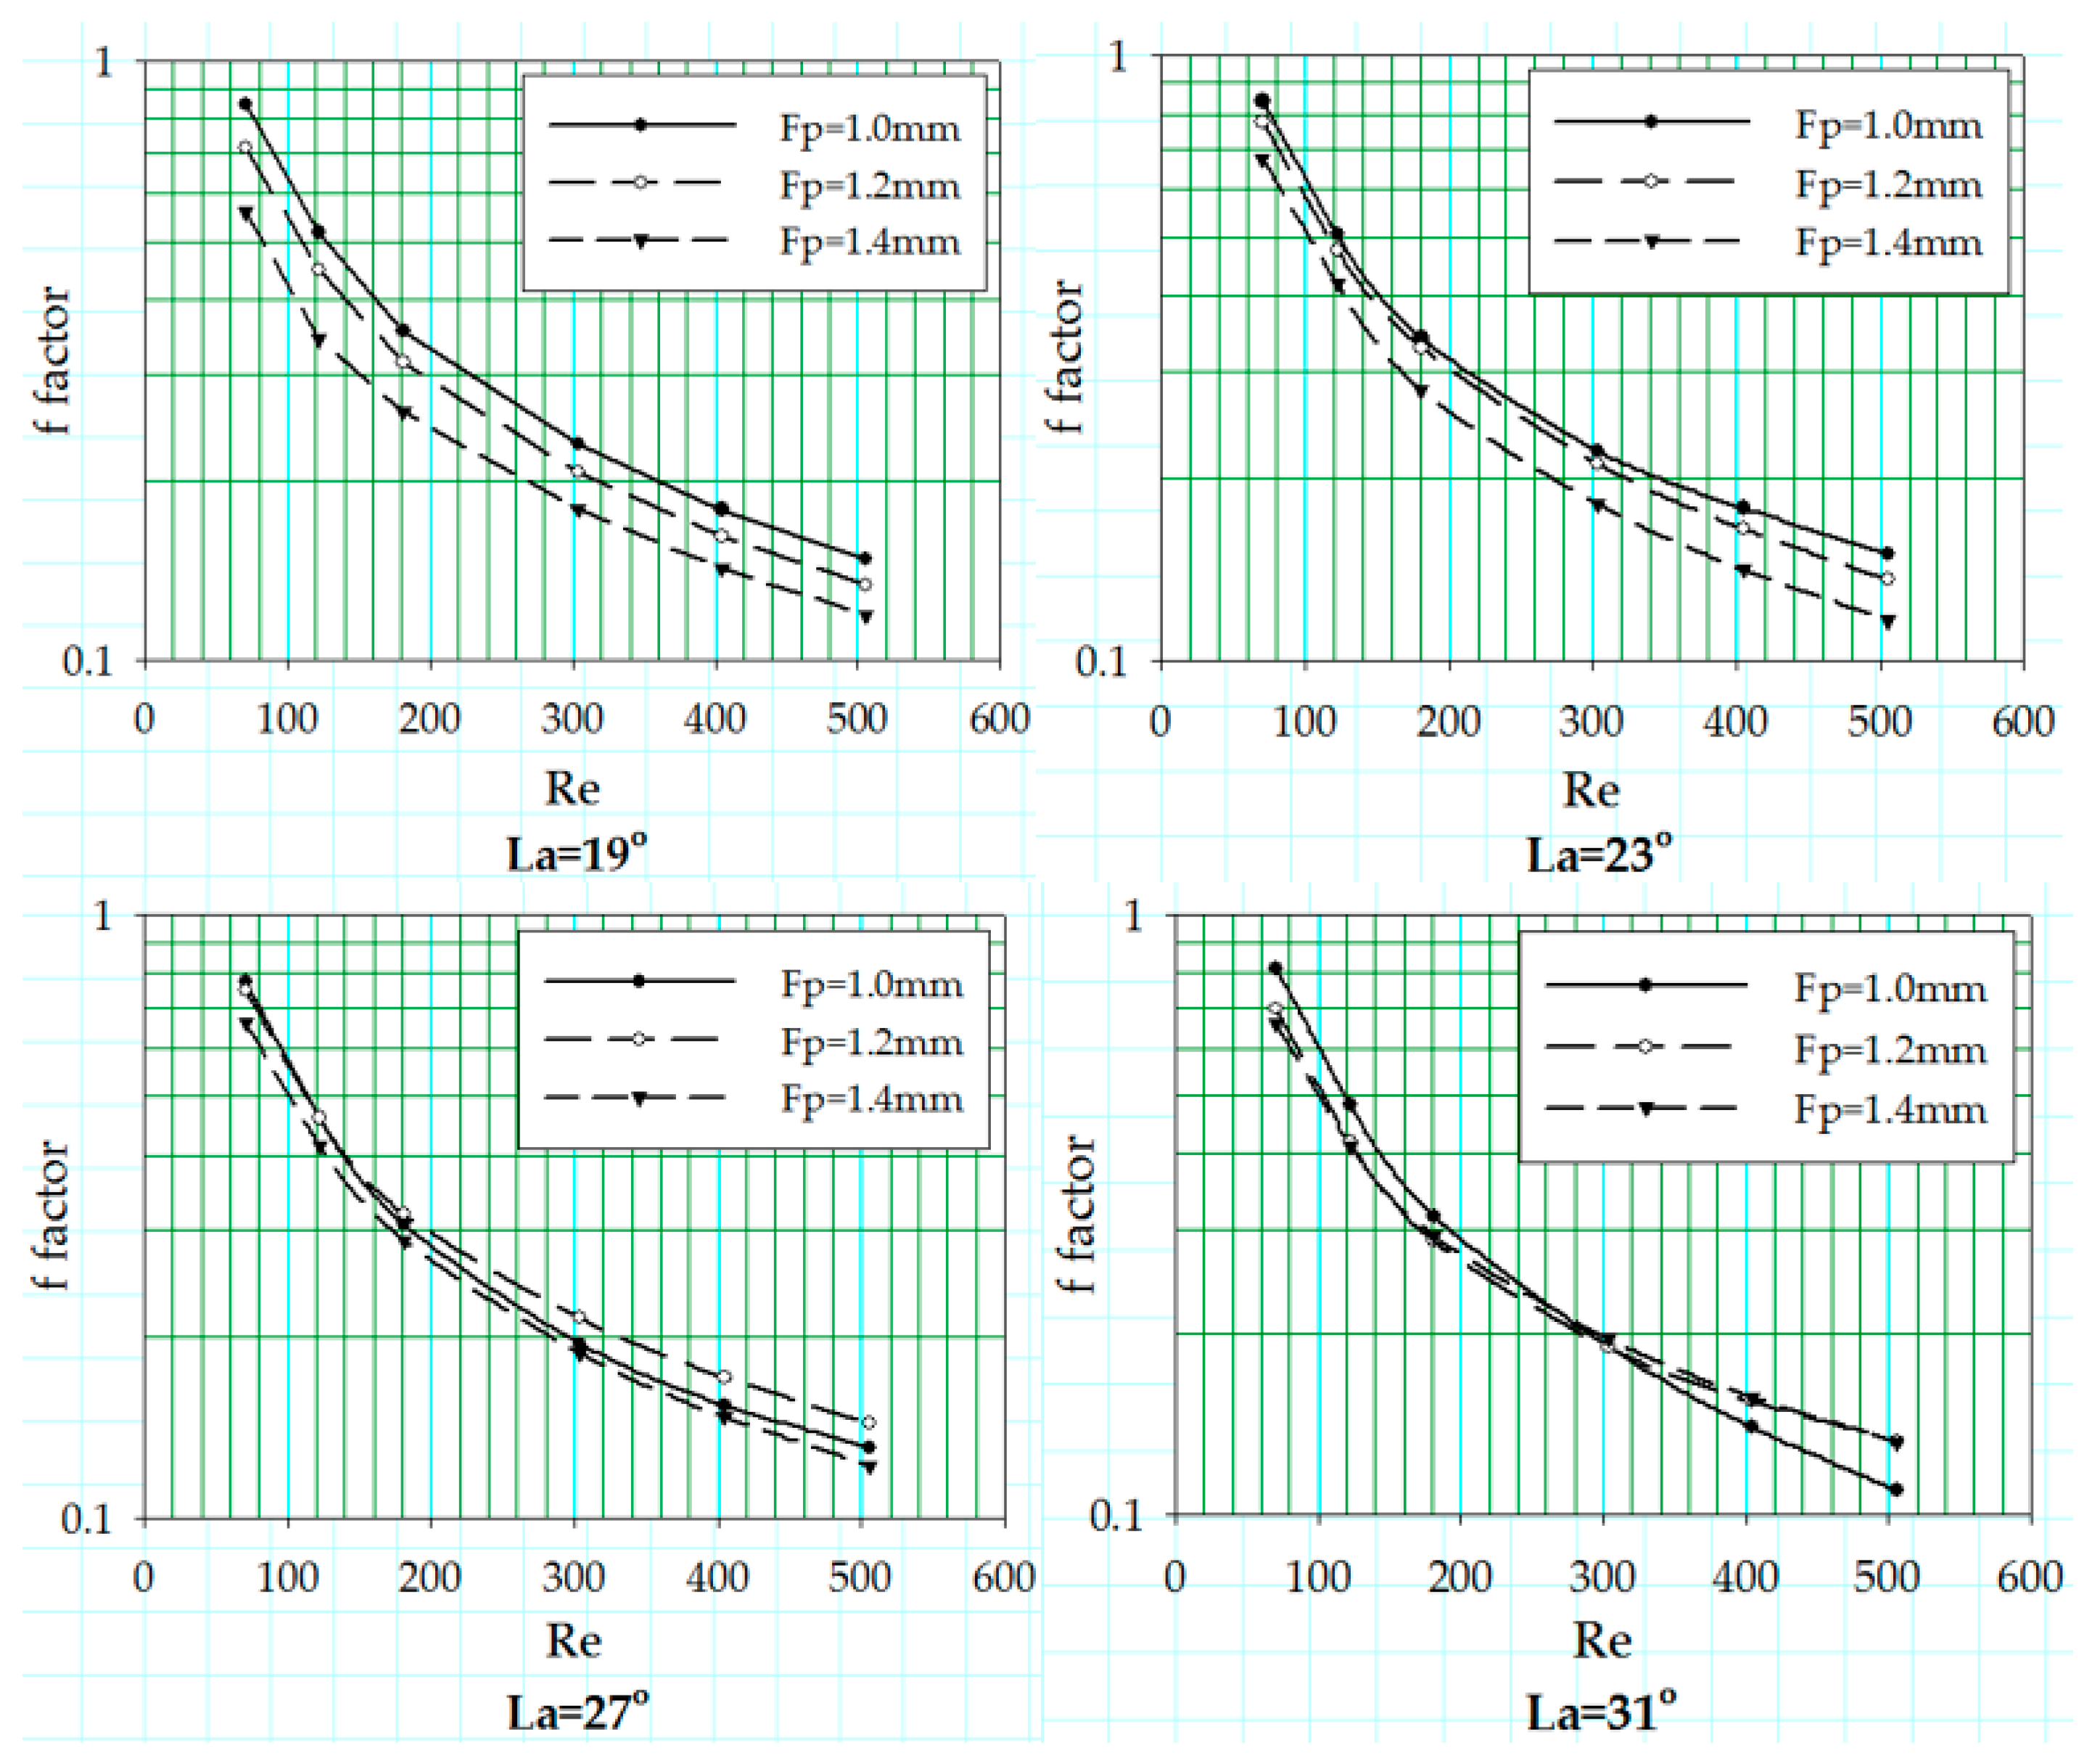
The Fanning friction factor values for different fin pitches are plotted as a function of Reynolds number at different louver angles ranging from 19 to 31° in Figure 11, while the flow depth is set constant at 20 mm. The results show that there is no change in f factor curves pattern associated with the change in fin pitch values, but it depicts a drop in the f factor values as the fin pitch values increase from 1.0 to 1.4 mm.
Figure 11 shows the f factor values at different louver angles with a variation of fin pitch, the f factor decreases with the increase in Reynolds number. The flow becomes aligned to the louvers with increasing Reynolds number resulting in low f factor values only due to the skin friction drag. While at low Reynolds number, form drag is also added to the skin friction drag consequently showing higher values of f factor. A clear offset is visible between the f factor curves associated with geometries with three different fin pitches for louver angle of 19° and it reduces as the louver angle increases. For geometries with fin pitch of 1.2 and 1.4 mm, the offset almost diminishes, reaching the louver angle of 27°, but their offset with 1 mm fin pitch geometry remains until the louver angle value of 31°.
3.4. Effect of Flow Depth
Figure 12 shows the air-side heat transfer coefficient in terms of j factor for the louvered fin geometries with fin pitch equal to 1.0 mm. A wide offset is noticed between the j factor curves corresponding to different flow depths at low Reynolds number, due to a significant decrease in thermal performance. This decrease is caused by the interference of upstream louver’s trailing edge with the boundary layer of downstream louver resulting in increased ineffective heat transfer surface area. This offset diminishes with the increase in Reynolds number because of reduction in boundary layer thickness around louvers. In the case of louver angle 31°, the adjacent fin louvers are completely aligned and fin pitch is so small that the trailing edge of the boundary layer created around the upstream louver does not get to dissipate and covers the rest of downstream louvers within its wake. This does not allow the downstream louvers to generate their respective boundary layers, badly affecting the thermal performance. The critical Reynolds number is only seen for the fin pitch of 1.0 and 1.2 mm when the louver angle is 19°, 23° and 27°; however, a critical Reynolds number peak can be seen for all three flow depths.
No change is observed in the f factor with a variation of flow depth, and f factor results for all three geometries with flow depths of 16, 20 and 24 mm overlap each other with a minuscule offset. In addition, the f factor values seem unresponsive to the change in louver angle, but a microscopic rise is noticed as the louver angle increases from 19 to 23°.
3.5. Effect of Louver Angle
3.5.1. Associated with Change in Fp
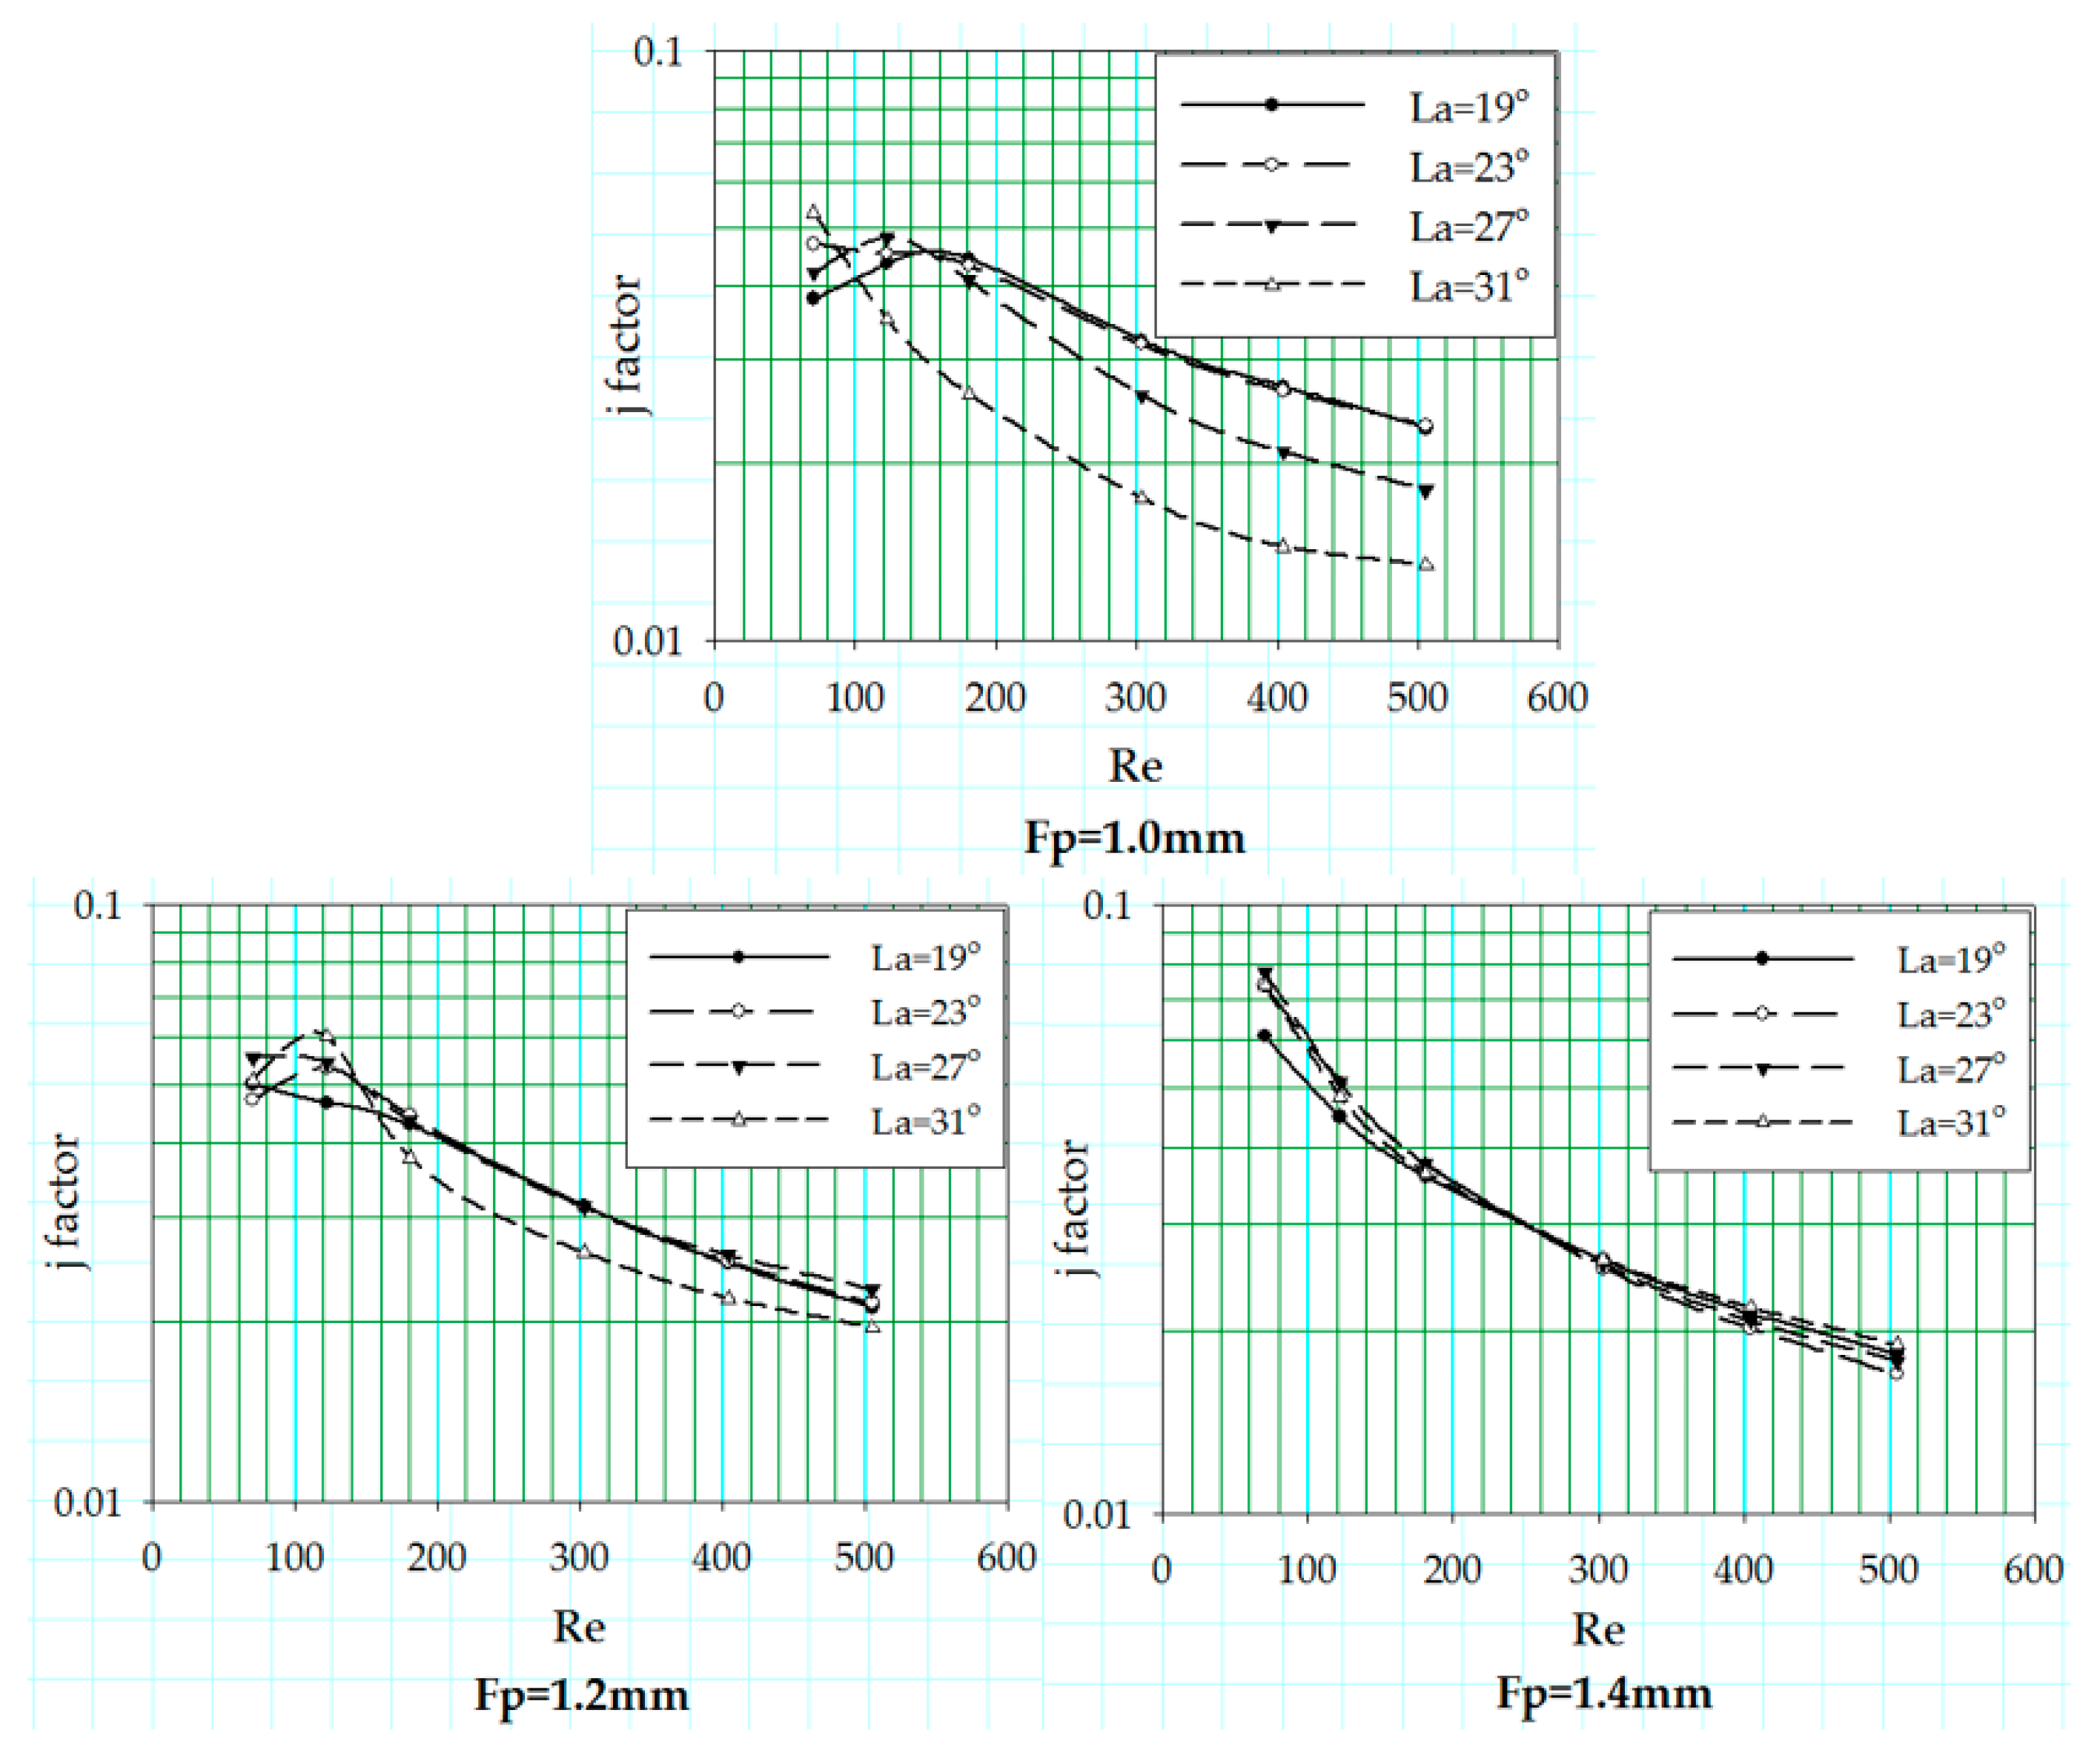
The change in the heat transfer coefficient in terms of Colburn j factor is reported for the variation in louver angle associated with three different fin pitch values at fixed flow depth of 24 mm. The trend of the j factor curves against the Reynolds number of aforementioned geometric sets is shown in Figure 13.
An offset between the j factor curves associated with different louver angles is noticed that reduces with the fin pitch increase from 1.0 to 1.4 mm. A crossover of the j factor curves for different louver angles is also observed. This crossover of the j factor curves is probably due to the change in louver configuration with the changing louver angles, shown in Figure 14. As the fin pitch values increase, this crossover moves downstream towards increasing Reynolds number. Large louver angles show huge offsets between j factor curves at small fin pitch values due to the interference of the upstream louver’s trailing edge with downstream louver. Whereas, at large values of fin pitch, the trailing edge of upstream louver diminishes in the wake region before the flow reaches the downstream louver, resulting in better thermal performance.
3.5.2. Associated with Change in Fd
The offset between the j factor curves at different louver angles was irresponsive to change in flow depth, but it decreased with the increase in fin pitch values.
In Figure 15, two prominent offsets are noticeable, at low Reynolds number and high Reynolds number. In the case of low Re, the f factor for louver angle 19° is solely due to the skin drag, but as the louver angle increases, form drag also makes a small contribution to the increase of friction factor. On the other hand, at high Reynolds number, this variation in form drag with increasing louver angle amplifies. The friction factor curves at all four louver angles show no response to the flow depth variation at all.
3.6. Critical Reynolds Number
Web and Trauger [23] established that the flow efficiency decreases below a certain value of Reynolds number with a decrease in Reynolds number, and they named this particular number the critical Reynolds number. Beyond this critical Reynolds number, the flow efficiency is independent of the Reynolds number. Kim et al. [33] reported that this phenomenon is attributed with the transition of flow pattern from duct- to louver-directed flow.
Critical Reynolds number is the Reynolds value where fall-off of the j factor curve is observed. Numerous efforts have been made to successfully predict the critical Reynolds number through correlations. Cowell et al. [34], and Webb and Trauger [23] presented their correlations for critical Reynolds number that are shown in Equations (12) and (13), respectively:
The comparison of the critical Reynolds numbers with the ones published in literature is shown in Table 5. The correlation presented by Cowell et al. [34] (for Lp/Fp ≤ 1) shows better results compared to the one formulated by Webb and Trauger [23] because of its dependency on the fin pitch parameter. Webb and Trauger [23] (for Lp/Fp ≤ 1.31) only associated the critical Reynolds number with louver angle, which predicts the critical Reynolds number values far from true values. Critical Reynolds number values predicted using Cowell et al. [34] correlation also show some offset, but they are relatively more accurate than those of Webb and Trauger [23]. The critical Reynolds number values calculated in this study are also compared with the ones published by Kim and Cho [21], and they performed an experimental study using geometries having Fd of 20 mm only. The present study results align well with their findings that critical Reynolds number is dependent on Fp value and relatively independent on louver angle. Moreover, the present study revealed that critical Reynolds number is also inversely proportional to the Lp/Fd. A detailed analysis is performed to understand the behavior of critical Reynolds number using thirty-six geometric configurations with different combinations of geometric parameters. Out of these thirty-six geometric samples, only twelve showed critical Reynolds numbers, which asserts that critical Reynolds number fall-off may not occur for all geometric configurations. The critical Reynolds number decreases with the increase in fin pitch value and is directly proportional to the flow depth parameter. Moreover, the critical Reynolds number increases with the increase in louver angle, it reaches a maximum value and then shows a drop as the louver angle is further increased. This value of louver angle at which the critical Reynolds number takes a fall is different for different fin pitch values and does not depend on the flow depth parameter at all.
4. Conclusions
The following conclusions are drawn on the basis of results extracted from the detailed computational study of louver parameters:
- Numerical results for low Re range reveal that the geometric configuration with Fp = 1 mm, Fd = 16 mm and Lα = 19° exhibited the best air-side thermal performance on the basis of heat transfer coefficient.
- Heat transfer rate is strongly dependent on the relative positioning of the louvers to the upstream louvers since the interference caused by the upstream louver can significantly reduce the effective heat transfer surface area of downstream louvers.
- Investigating the , it was found that the fall-off of j factor at low Re is completely reliant on arrangement of the adjacent fin louvers. This is because a thick boundary layer created around the upstream louver covers the downstream louvers completely at small fin pitch and large louver angles.
- shows strong dependency on (Lp/Fp) and relative independency on Lα when Fd is small. At higher Fd values, varies with variation in Lα.
- Critical Reynolds number rises with an increase in flow depth and a decrease in fin pitch values.
- A small drop in the value of is noticed with increase in louver angle up to a point where starts rising again.
- At high Reynolds number, j factor is found to be directly proportional to fin pitch, but for low Re, an inverse relationship is observed.
- Friction factor f rises with the increase in louver angle and decrease in fin pitch values.
Acknowledgments
This work was supported by the Korea Institute of Energy Technology Evaluation and Planning (KETEP) and the Ministry of Trade, Industry & Energy (MOTIE) of the Republic of Korea (No. 10052926).
Author Contributions
Arslan Saleem did the CFD analysis and drafted the manuscript. Man-Hoe Kim supervised the research and edited the manuscript. The authors read and approved the manuscript.
Conflicts of Interest
The authors declare no conflict of interest.
Abbreviations
| Nomenclature | |
| A | Area, m2 |
| Ac | Minimum free flow area, m2 |
| cp | Specific heat, J/kgK |
| D | Ideal transverse distance, m |
| E | Energy, J |
| f | Fanning friction factor |
| Fd | Flow depth, m |
| Fp | Fin pitch, m |
| H | Fin height, m |
| h | Air-side heat transfer coefficient, W/m2K |
| j | Colburn j-factor |
| k | Thermal conductivity, W/mK |
| Lα | Louver angle, deg |
| Ll | Louver height, m |
| Lp | Louver pitch, m |
| Nu | Nusselt number (hD/k) |
| N | Actual transverse distance, m |
| Nl | Number of louvers |
| Pr | Prandtl number |
| P | Pressure, Pa |
| Q | Heat transfer rate, W |
| ReLp | Louver pitch based Reynolds number |
| Recri | Critical Reynolds number |
| S1 | Non-louvered length at inlet and exit, m |
| S2 | Redirection louver length, m |
| T | Temperature, K |
| Tm | Log mean temperature |
| Vcri | Critical air velocity (ufrAfr/Ac), m/s |
| u | Velocity vector, m/s |
| UoAo | Overall thermal conductance, W/K |
| Greek letters | |
| δ | Fin thickness, m |
| Δ | Difference |
| ρ | Density, kg/m3 |
| η | Efficiency |
| Subscripts | |
| a | Air-side |
| c | Cold |
| cri | Critical |
| f | Fin |
| fr | Frontal |
| h | Hot |
| i | Inlet |
| o | Outlet |
| w | Wall |
References
- Chang, Y.J.; Wang, C.C. Air-side performance of brazed aluminium heat exchangers. J. Enhanc. Heat Transf. 1996, 3, 15–28. [Google Scholar] [CrossRef]
- Kim, M.H.; Bullard, C.W. Air-side thermal hydraulic performance of multi-louvered fin aluminium heat exchangers. Int. J. Refrig. 2002, 25, 390–400. [Google Scholar] [CrossRef]
- Kim, M.H.; Bullard, C.W. Air-side thermal performance of brazed aluminium heat exchangers under dehumidifying conditions. Int. J. Refrig. 2002, 25, 924–934. [Google Scholar] [CrossRef]
- Kim, M.H.; Youn, B.; Bullard, C.W. Effect of inclination on the air-side performance of a brazed aluminium heat exchanger under dry and wet conditions. Int. J. Refrig. 2001, 44, 4613–4623. [Google Scholar]
- Kim, M.H.; Song, S.M.; Bullard, C.W. Effect of inlet humidity condition on the air-side performance of an inclined brazed aluminium evaporator. Int. J. Refrig. 2002, 25, 611–620. [Google Scholar] [CrossRef]
- Webb, R.L.; Jung, S.H. Air-side performance of enhanced brazed aluminum heat exchangers. ASHRAE Trans. 1992, 98, 391–410. [Google Scholar]
- Webb, R.L.; Lee, H. Brazed Aluminum Condensers for Residential Air Conditioning. J. Enhanc. Heat Transf. 2001, 8, 1–14. [Google Scholar] [CrossRef]
- Davernport, C.J. Heat transfer and fluid flow in louvered triangular ducts. Ph.D. Thesis, Lanchester Polytechnic, Coventry, UK, 1980. [Google Scholar]
- Davernport, C.J. Heat Transfer and Flow Friction Characteristics of Louvered Heat Exchanger Surfaces. In Heat Exchangers: Theory and Practice; Hemisphere Pub/McGraw-Hill: Washington, DC, USA, 1983; pp. 387–412. [Google Scholar]
- Achaichia, A.; Cowell, T.A. Heat transfer and pressure drop characteristics of flat tube and louvered plate fin surfaces. Exp. Therm. Fluid Sci. 1988, 1, 147–157. [Google Scholar] [CrossRef]
- Sunden, B.; Svantessen, J. Correlation of j and f factors formulation-louvered heat transfer surfaces. In Proceedings of the Third UK National Heat Transfer Conference, Birmingham, UK, 16–18 September 1992; pp. 805–811. [Google Scholar]
- Sahnoun, A.; Webb, R.L. Prediction of heat transfer and friction for the louver fin geometry. J. Heat Transf. 1992, 114, 893–900. [Google Scholar] [CrossRef]
- Chang, Y.J.; Wang, C.C. A generalized heat transfer correlation for louver fin geometry. Int. J. Heat Mass Transf. 1997, 40, 533–544. [Google Scholar] [CrossRef]
- Chang, Y.J.; Hsu, K.C.; Lin, Y.T.; Wang, C.C. A generalized friction correlation for louver fin geometry. Int. J. Heat Mass Transf. 2000, 43, 2237–2243. [Google Scholar] [CrossRef]
- Chang, Y.J.; Chang, W.J.; Li, M.C.; Wang, C.C. An amendment of the generalized friction correlation for louver fin geometry. Int. J. Heat Mass Transf. 2006, 49, 4250–4253. [Google Scholar] [CrossRef]
- Zhang, H.H.; Lang, X.S. The experimental investigation of oblique angles and interrupted plate lengths for louvered fins in compact heat exchangers. Exp. Therm. Fluid Sci. 1989, 2, 100–106. [Google Scholar]
- Aoki, H.; Shinagawa, T.; Suga, K.K. An experimental study of the local heat transfer characteristics in automotive louvered fins. Exp. Therm. Fluid Sci. 1989, 2, 293–300. [Google Scholar] [CrossRef]
- Rugh, J.P.; Pearson, J.T.; Ramadhyani, S. A study of a very compact heat exchanger used for passenger compartment heating in automobiles. ASME Symp. Ser. 1992, 201, 15–24. [Google Scholar]
- Springer, M.E.; Thole, K.A. Experimental design for flow-field studies of louvered fins. Exp. Therm. Fluid Sci. 1998, 18, 258–269. [Google Scholar] [CrossRef]
- DeJong, N.C.; Jacobi, A.M. Localized flow and heat transfer interactions in louvered fin arrays. Int. J. Heat Mass Transf. 2003, 46, 443–455. [Google Scholar] [CrossRef]
- Kim, N.H.; Cho, J.P. Air-side performance of louver-finned flat aluminum heat exchangers at a low velocity region. Heat Mass Transf. 2008, 44, 1127–1139. [Google Scholar] [CrossRef]
- Achaichia, A.; Cowell, T.A. A finite difference analysis of fully developed periodic laminar flow in inclined louvered arrays. In Proceedings of the Second UK National Heat Transfer Conference, Glasgow, UK, 14–16 September 1988; pp. 883–888. [Google Scholar]
- Webb, R.L.; Trauger, P.E. Flow structure in the louvered fin heat exchanger geometry. Exp. Therm. Fluid Sci. 1991, 4, 205–217. [Google Scholar] [CrossRef]
- Atkinson, K.N.; Drakulic, R.; Heikal, M.R.; Cowell, T.A. Two and three dimensional numerical models of flow and heat transfer over louvered fin arrays in compact heat exchangers. Int. J. Heat Mass Transf. 1998, 41, 4063–4080. [Google Scholar] [CrossRef]
- Tafti, D.K.; Wang, G.; Lin, W. Flow transition in a multi-louvered fin array. Int. J. Heat Mass Transf. 2000, 43, 901–919. [Google Scholar] [CrossRef]
- Perrotin, T.; Clodic, D. Thermal hydraulic CFD study in louvered fin and flat tube heat exchangers. Int. J. Refrig. 2004, 27, 422–432. [Google Scholar] [CrossRef]
- Shinde, P.; Lin, C.-X. A heat transfer and friction factor correlation for low air-side Reynolds number applications of compact heat exchangers (1535-RP). Sci. Technol. Built Environ. 2016, 23, 192–210. [Google Scholar] [CrossRef]
- Chang, Y.J.; Wang, C.C.; Chang, W.J. Heat transfer and flow characteristics of automotive brazed aluminum heat exchangers. ASHRAE Trans. 1994, 100, 643–652. [Google Scholar]
- Jacobi, M.; Park, Y.; Zhong, Y.; Michna, G.; Xia, Y. High Performance Heat Exchangers for Air-Conditioning and Refrigeration Applications (Non-Circular Tubes). Air-Conditioning and Refrigeration Technology Institute, University of Illinois: Urbana, IL, USA, 2005; ARTI-21CR/605-20021-01. [Google Scholar]
- Dong, J.; Chen, J.; Chen, Z.; Zhou, Y. Heat transfer and pressure drop correlations for the multi-louvered fin compact heat exchangers. Energy Convers. Manag. 2007, 48, 1506–1515. [Google Scholar] [CrossRef]
- Li, W.; and Wang, X. Heat transfer and pressure drop correlations for compact heat exchangers with multi-region louver fins. Int. J. Heat Mass Transf. 2010, 53, 2955–2962. [Google Scholar] [CrossRef]
- Li, J.; Wang, S.; Zhang, W. Air-side thermal hydraulic performance of an integrated fin and micro-channel heat exchanger. Energy Convers. Manag. 2011, 52, 983–989. [Google Scholar] [CrossRef]
- Kim, M.-H.; Lee, S.Y.; Sunil, M.; Webb, R.L. Microchannel heat exchanger design for evaporator and condenser applications. Adv. Heat Transf. 2003, 37, 297–429. [Google Scholar]
- Cowell, T.A.; Heikal, M.R.; Achaichia, A. Fluid flow and heat transfer in compact louvered fin surfaces. Exp. Therm. Fluid Sci. 1995, 10, 192–199. [Google Scholar] [CrossRef]
Figure 1.
Geometric parameters.
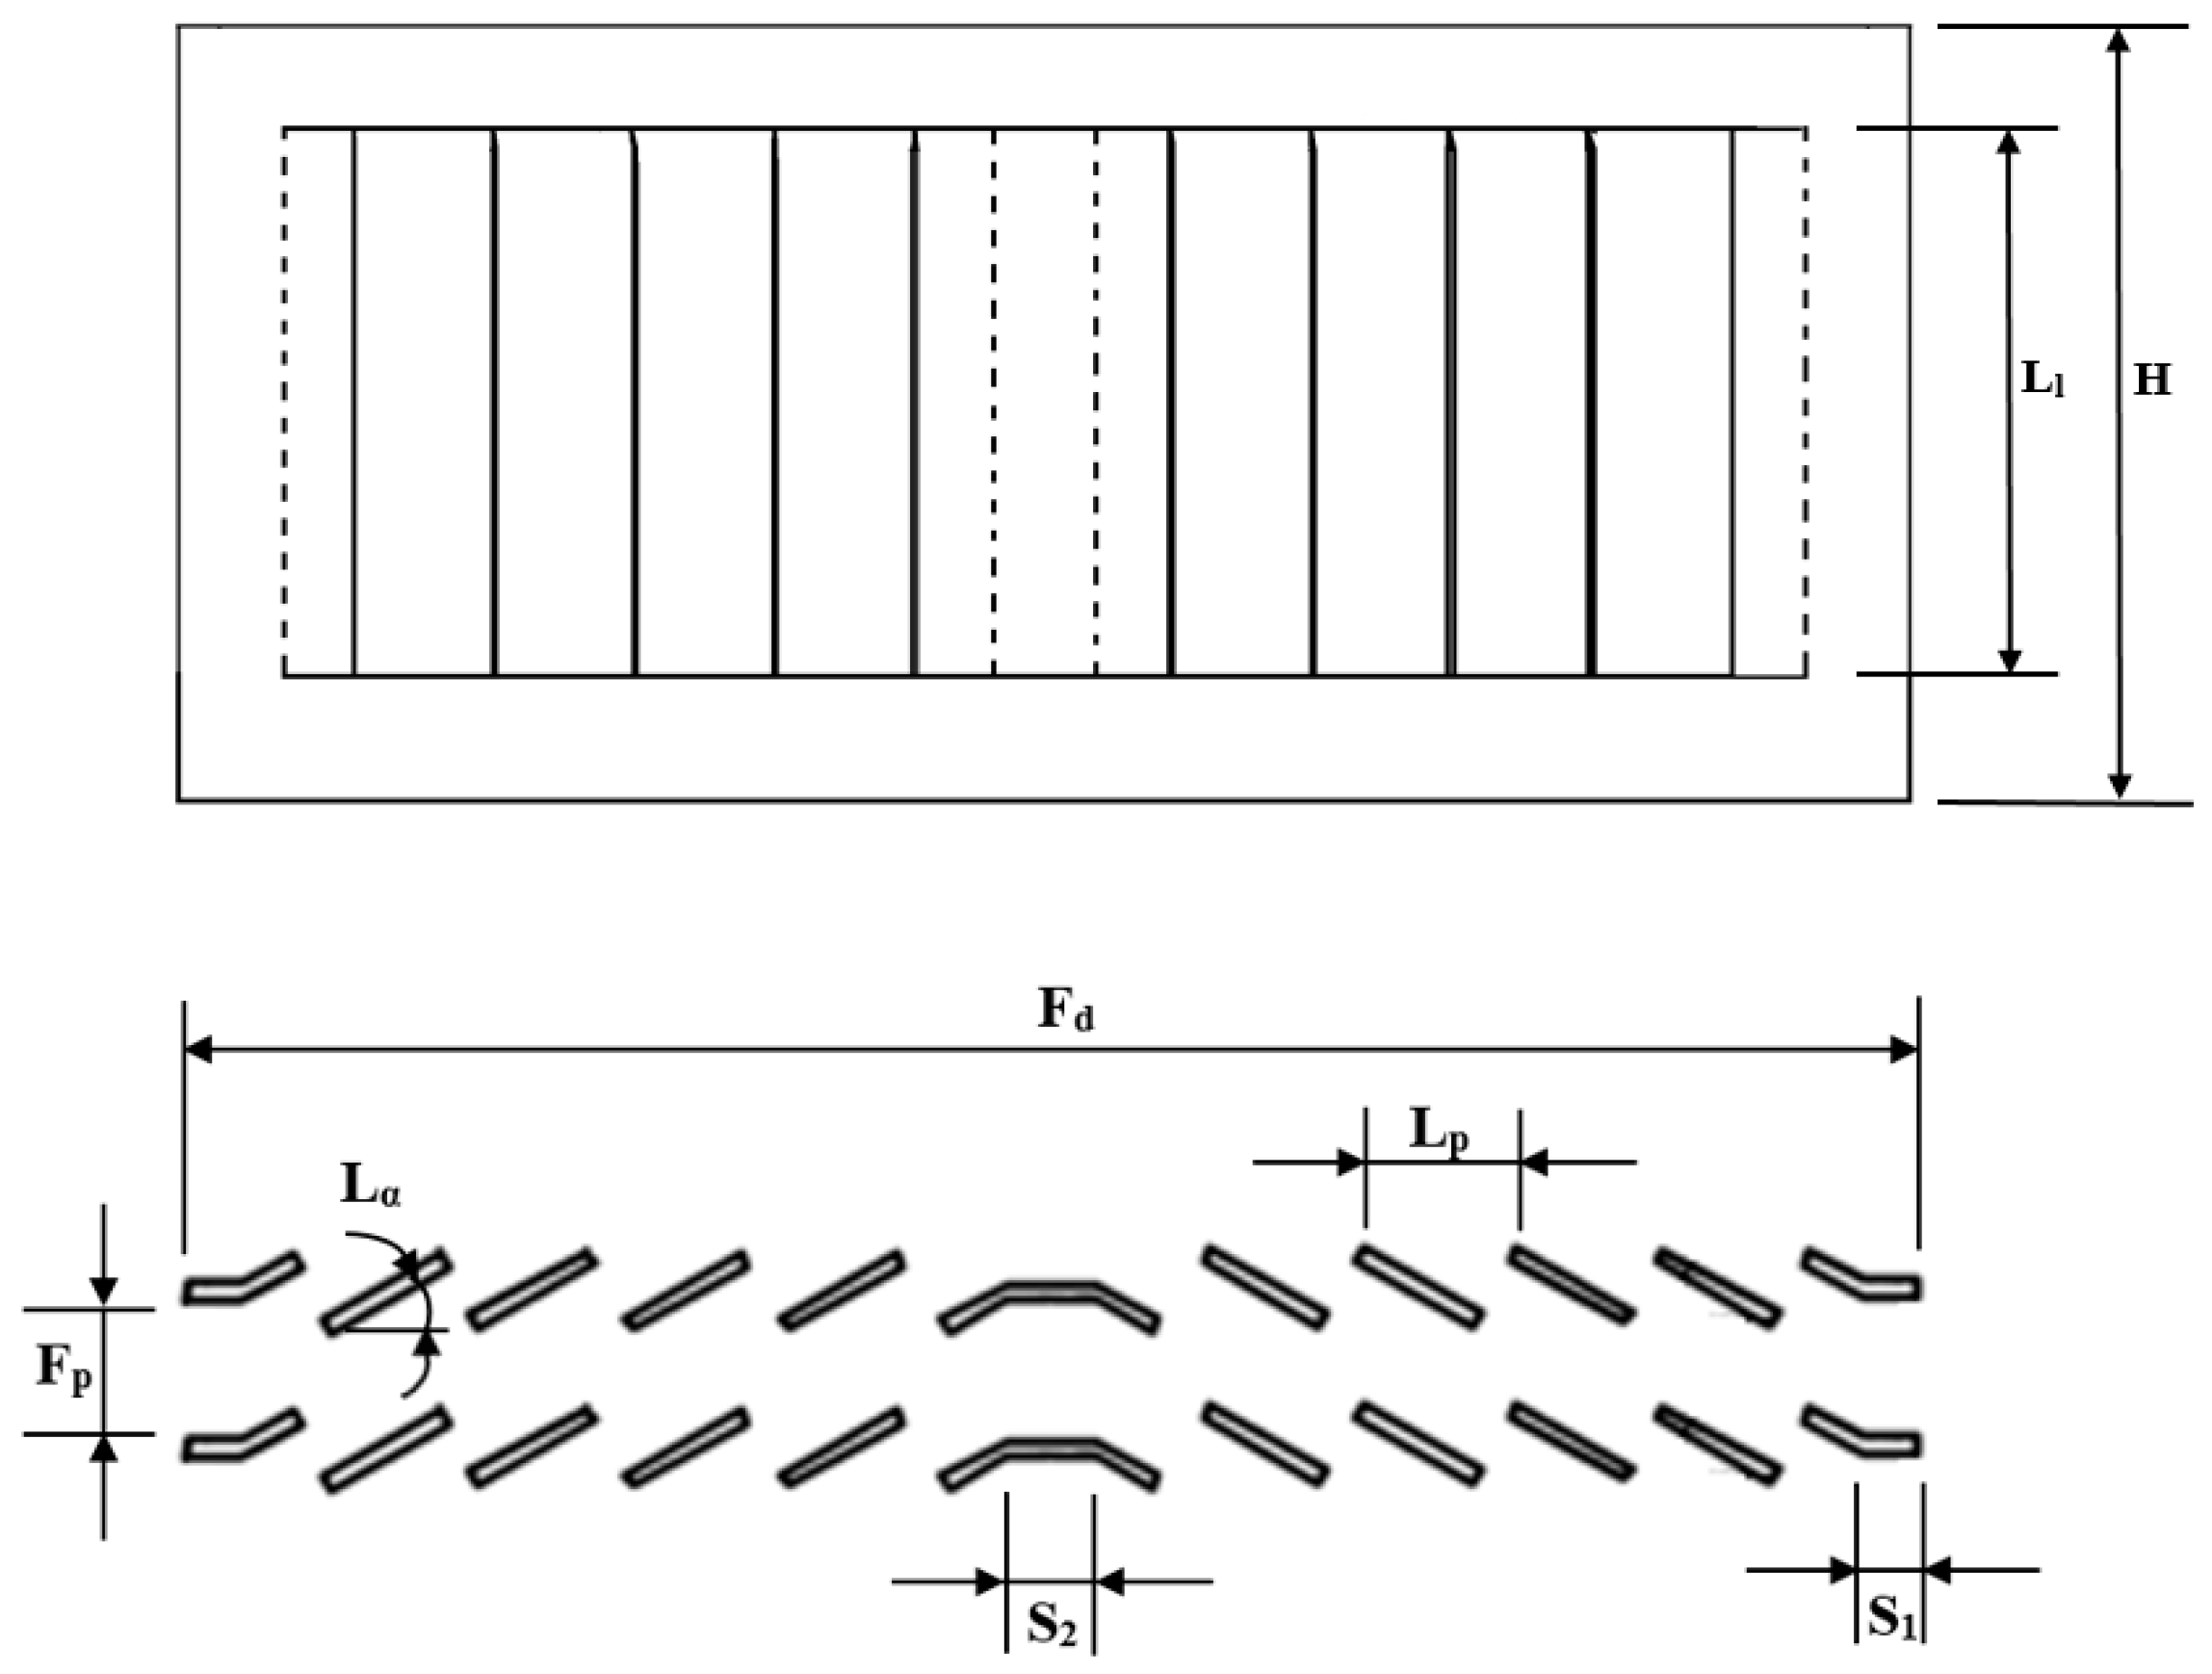
Figure 2.
Three-dimensional computational domain and boundary conditions.
Figure 3.
Mesh of the fluid and solid domain on a bisecting plane.

Figure 4.
Mesh Independence study.
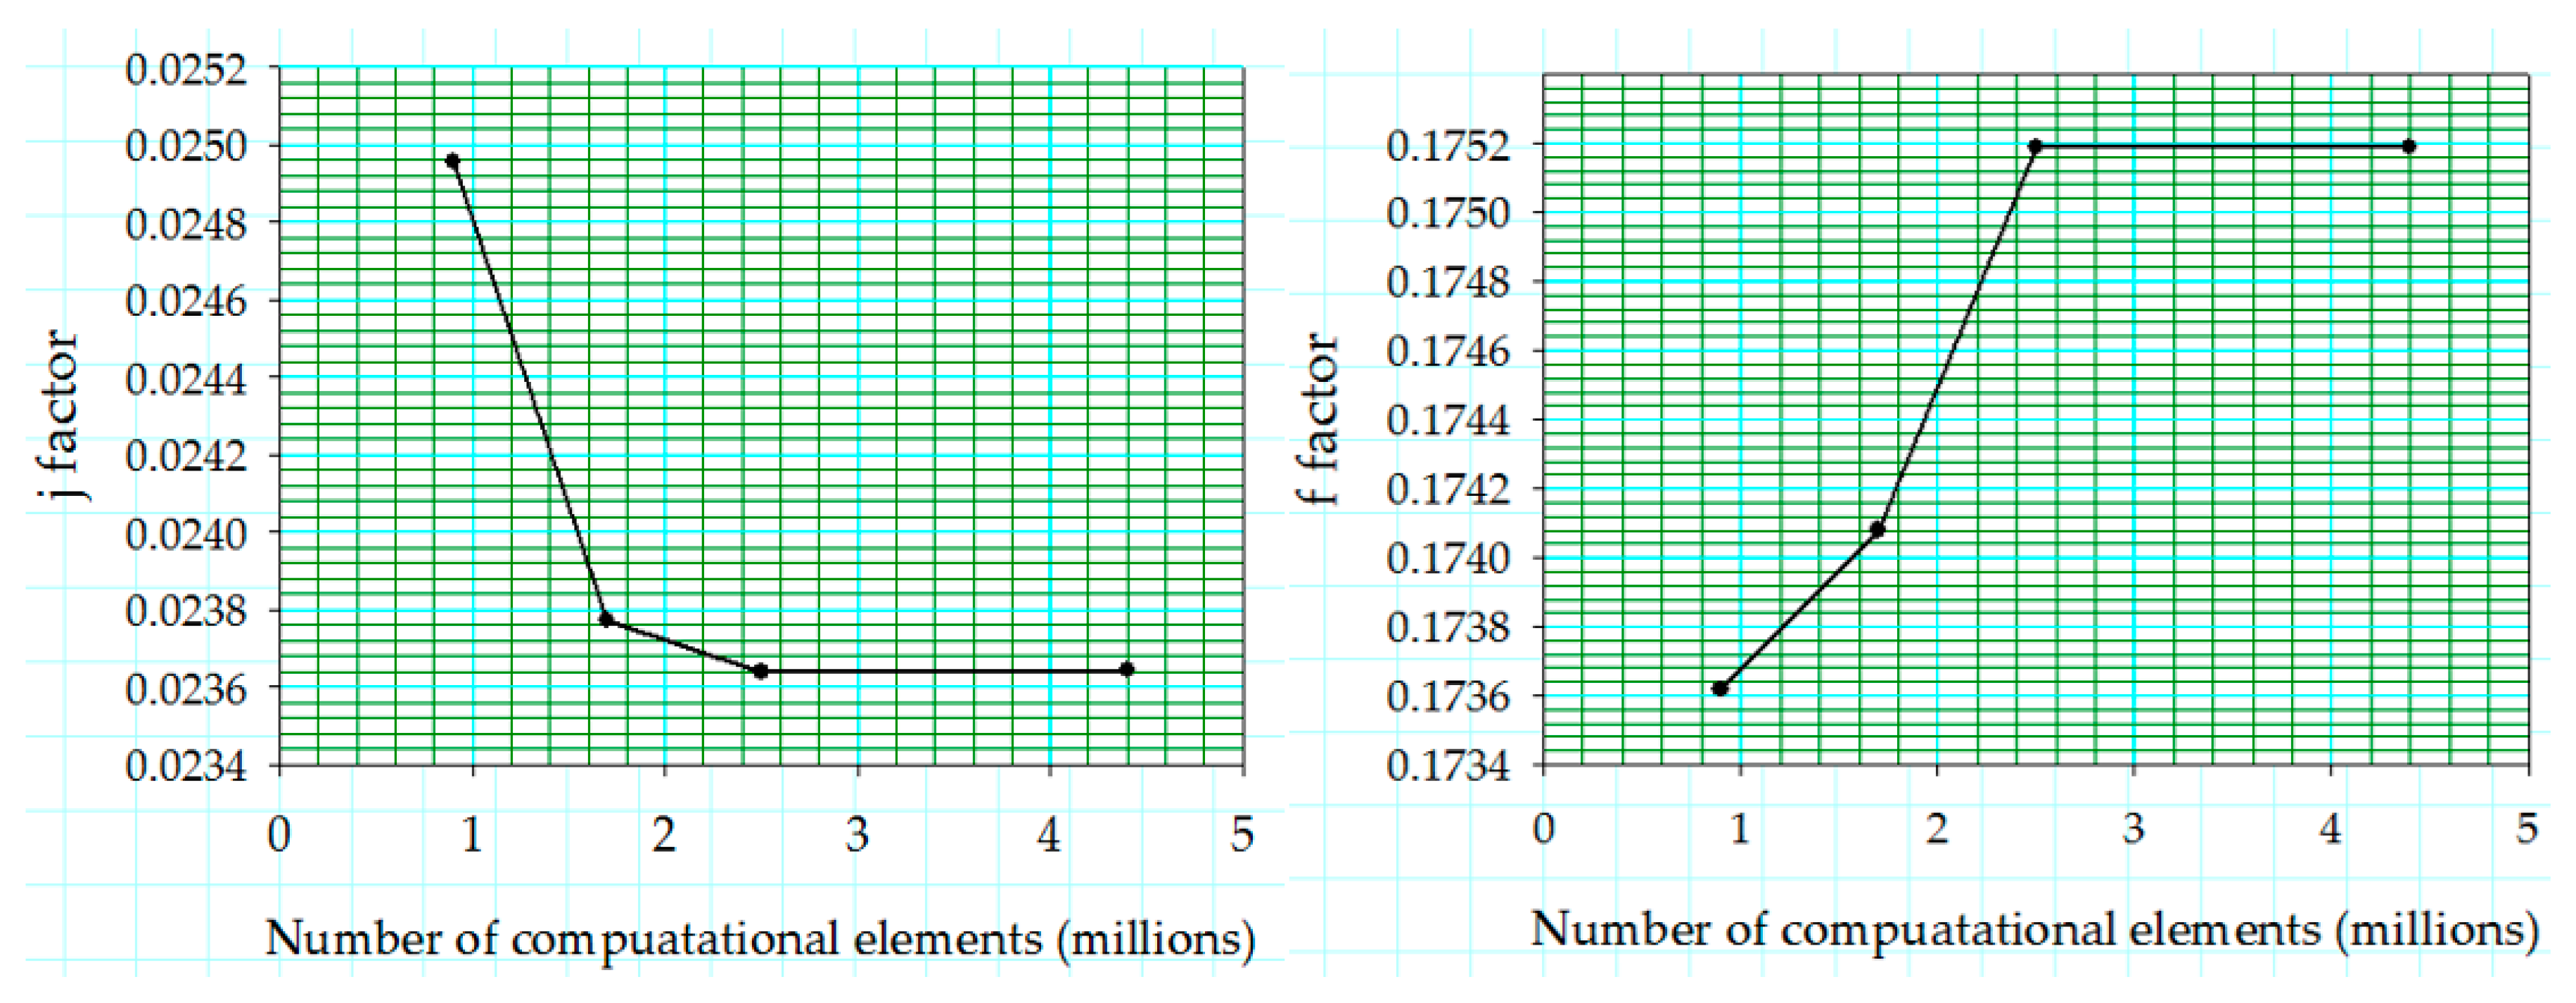
Figure 5.
Validation of numerical results with Shinde and Lin [27].
Figure 5.
Validation of numerical results with Shinde and Lin [27].
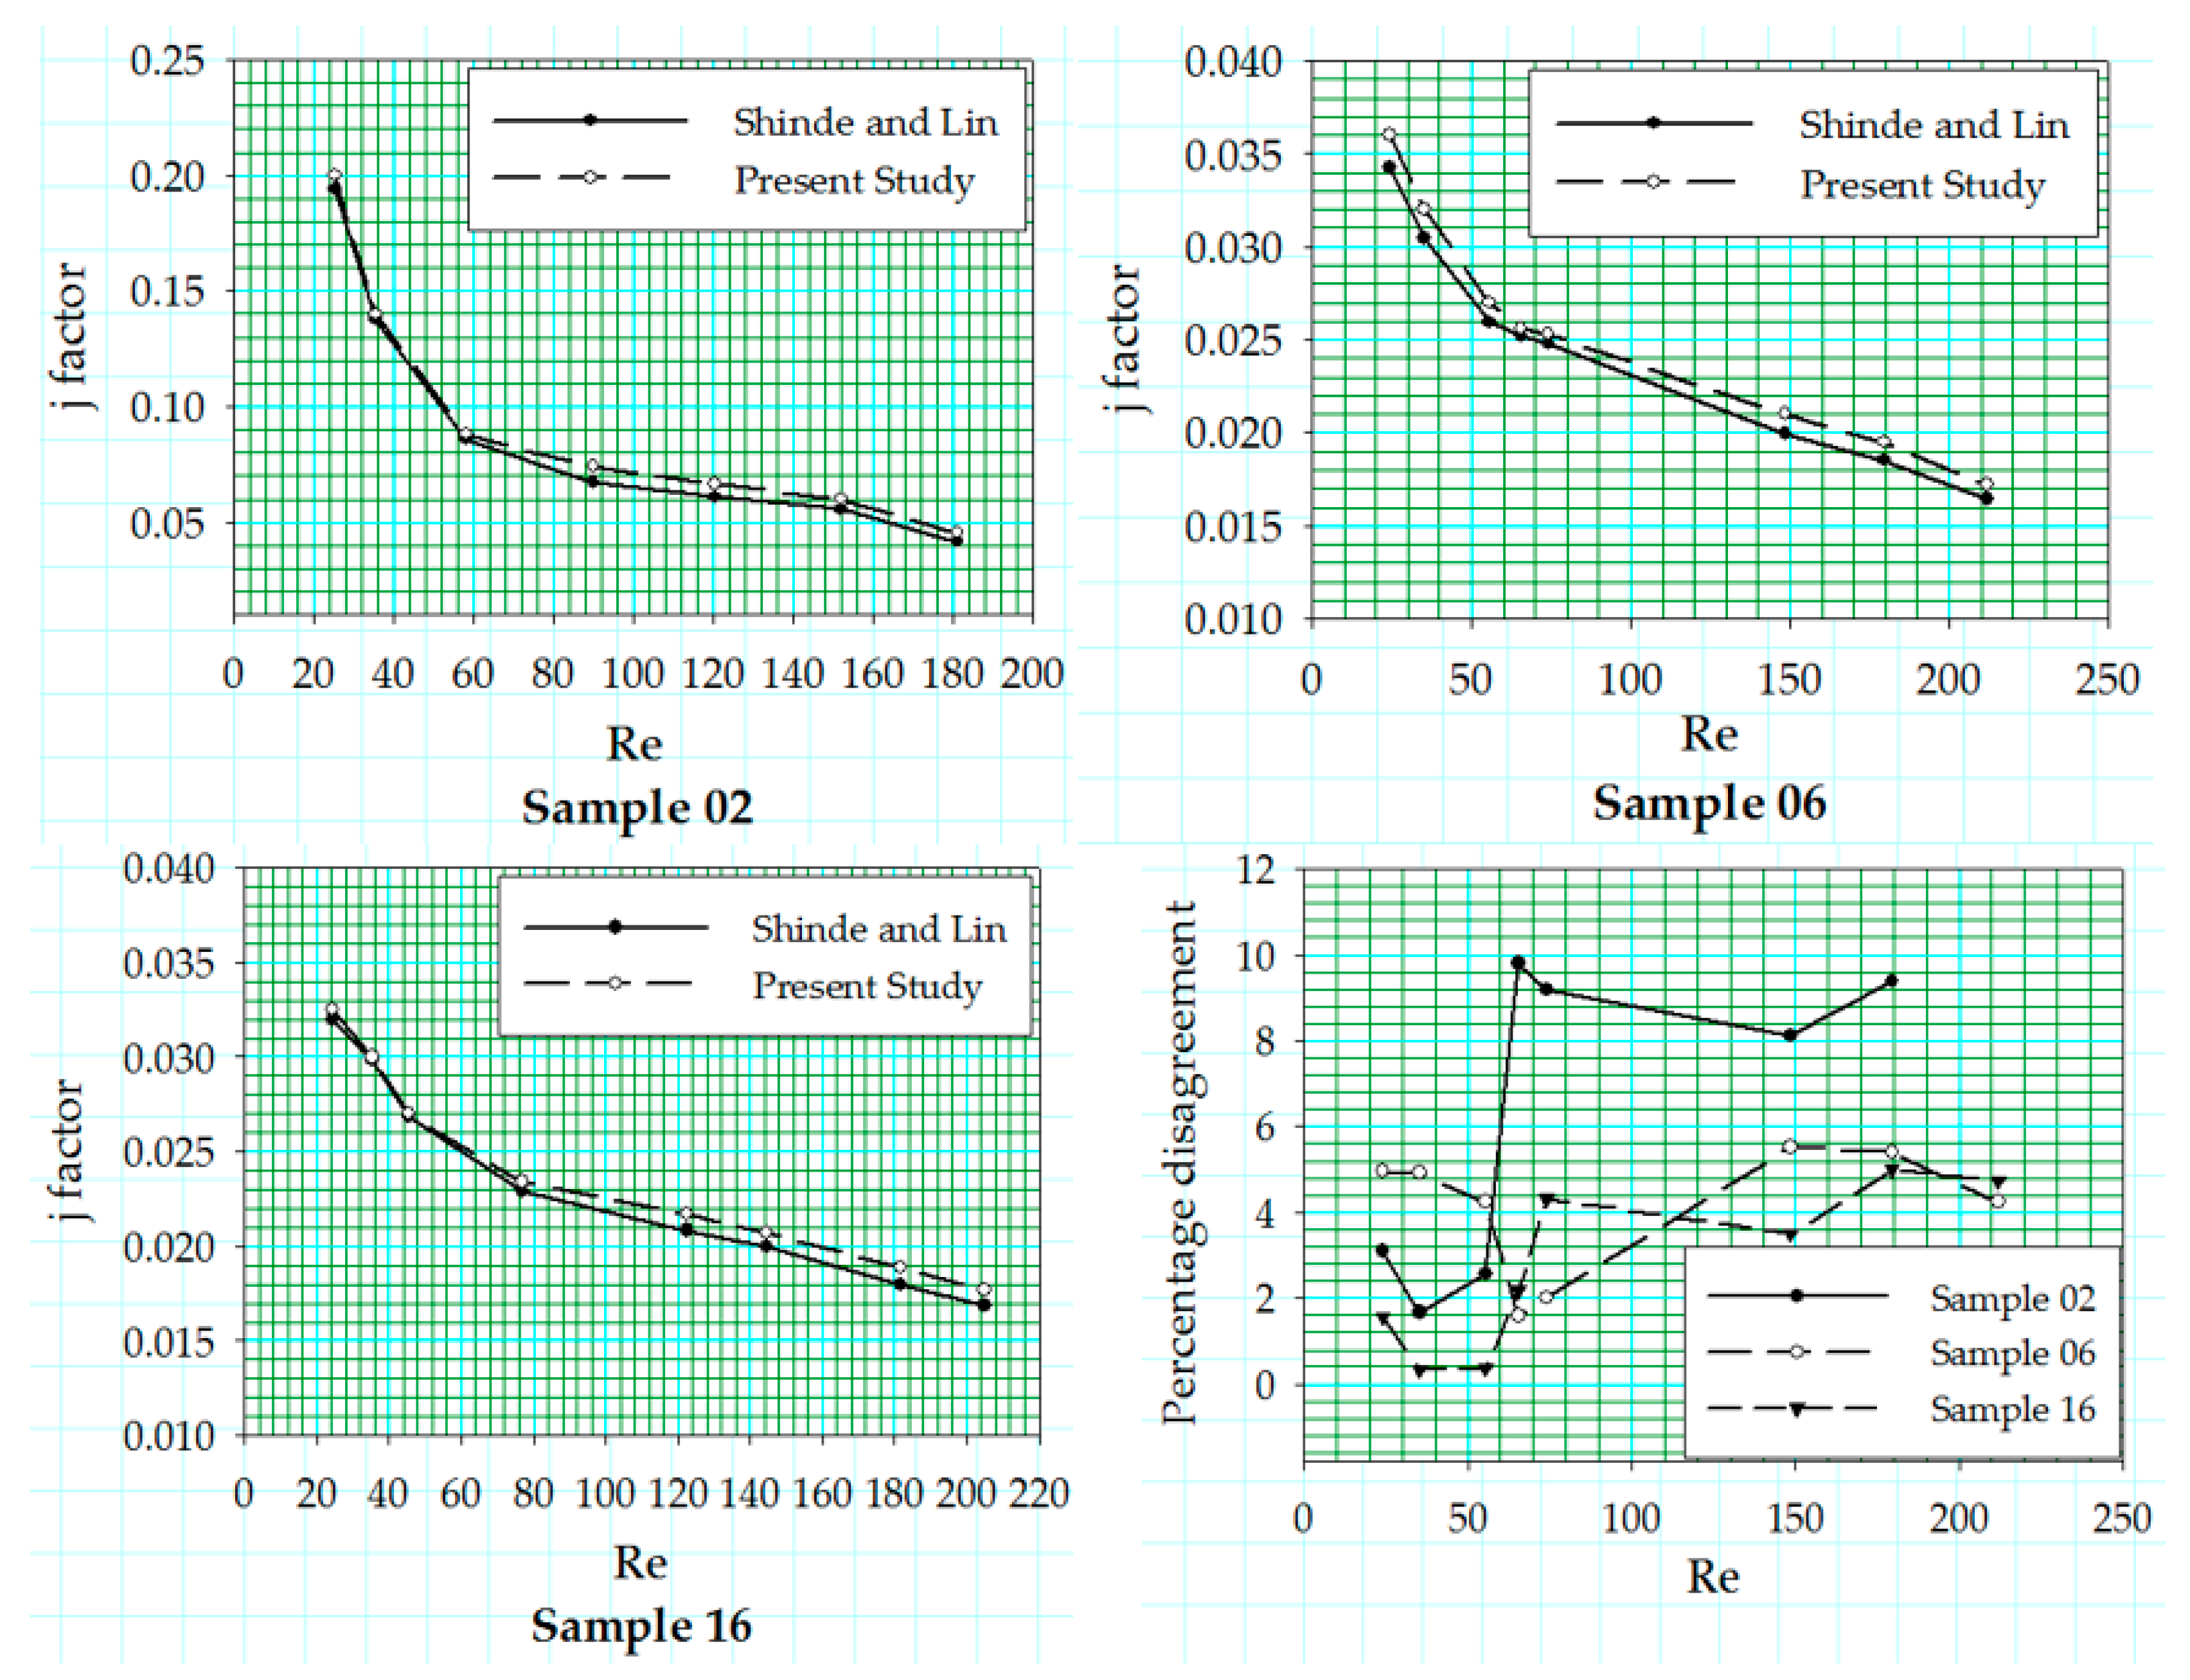
Figure 6.
j factor corresponding to fin pitch variation at different louver angles with Fd = 16 mm.
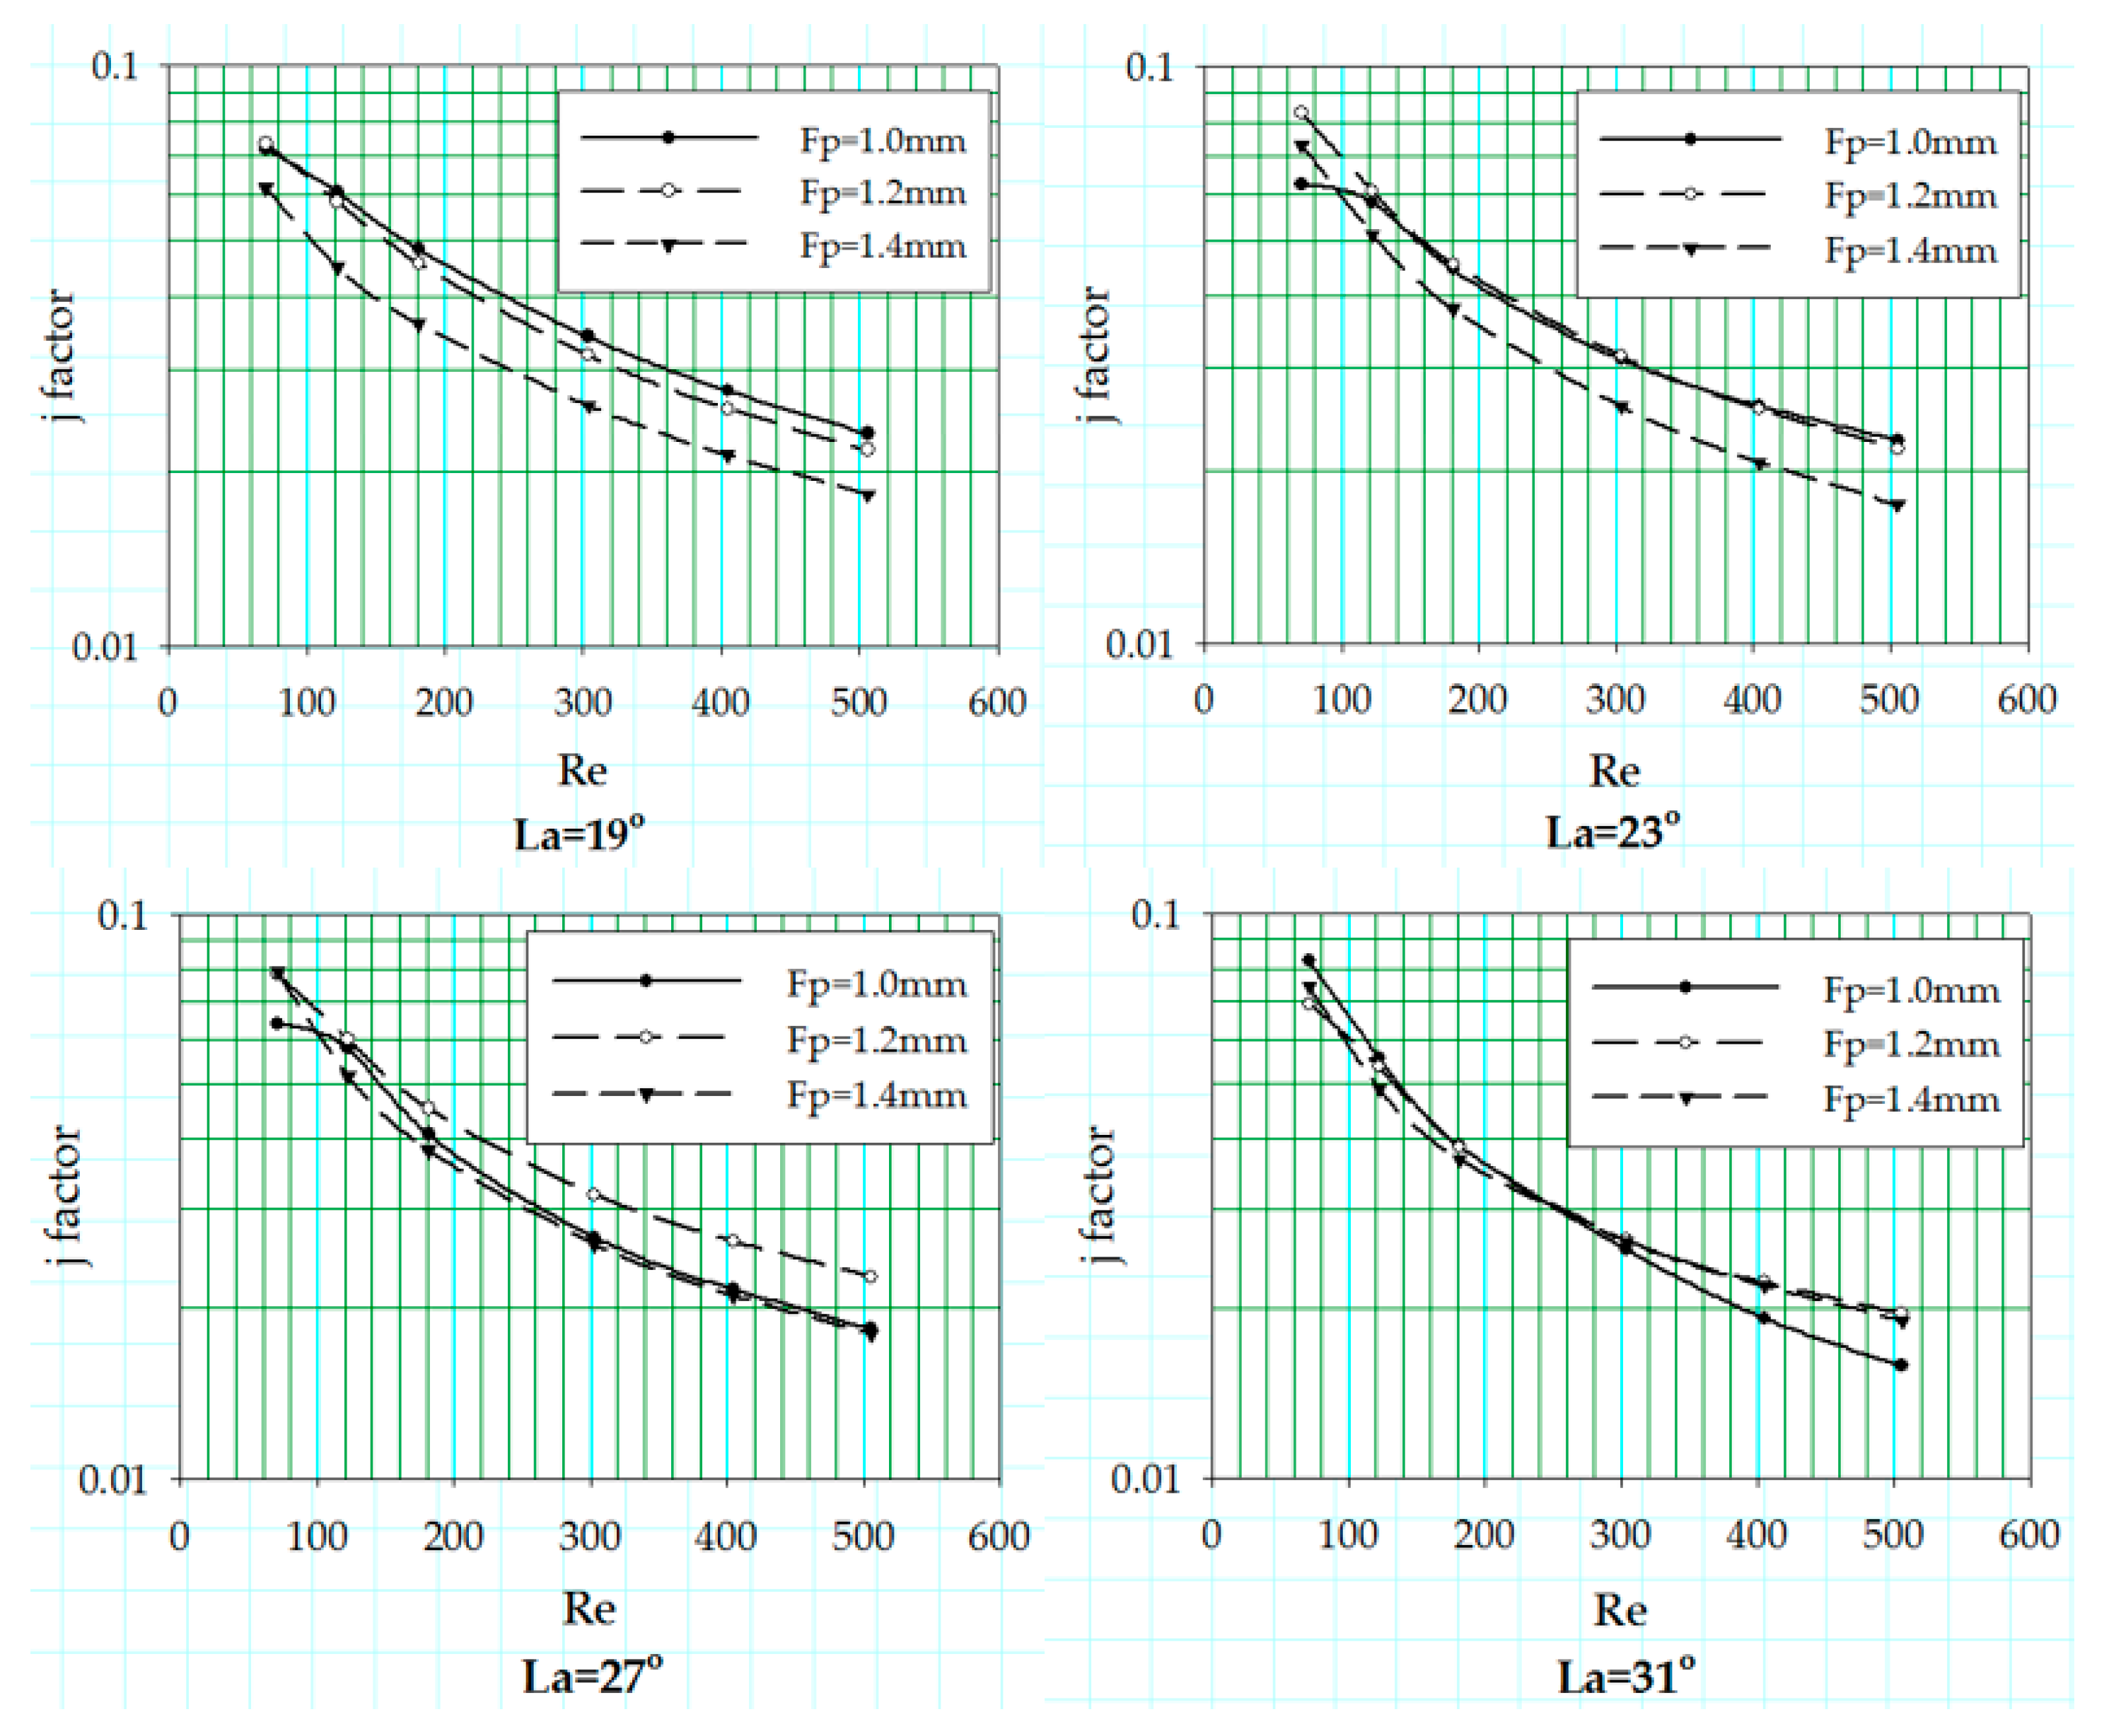
Figure 7.
j factor corresponding to fin pitch variation at different louver angles with Fd = 20 mm.
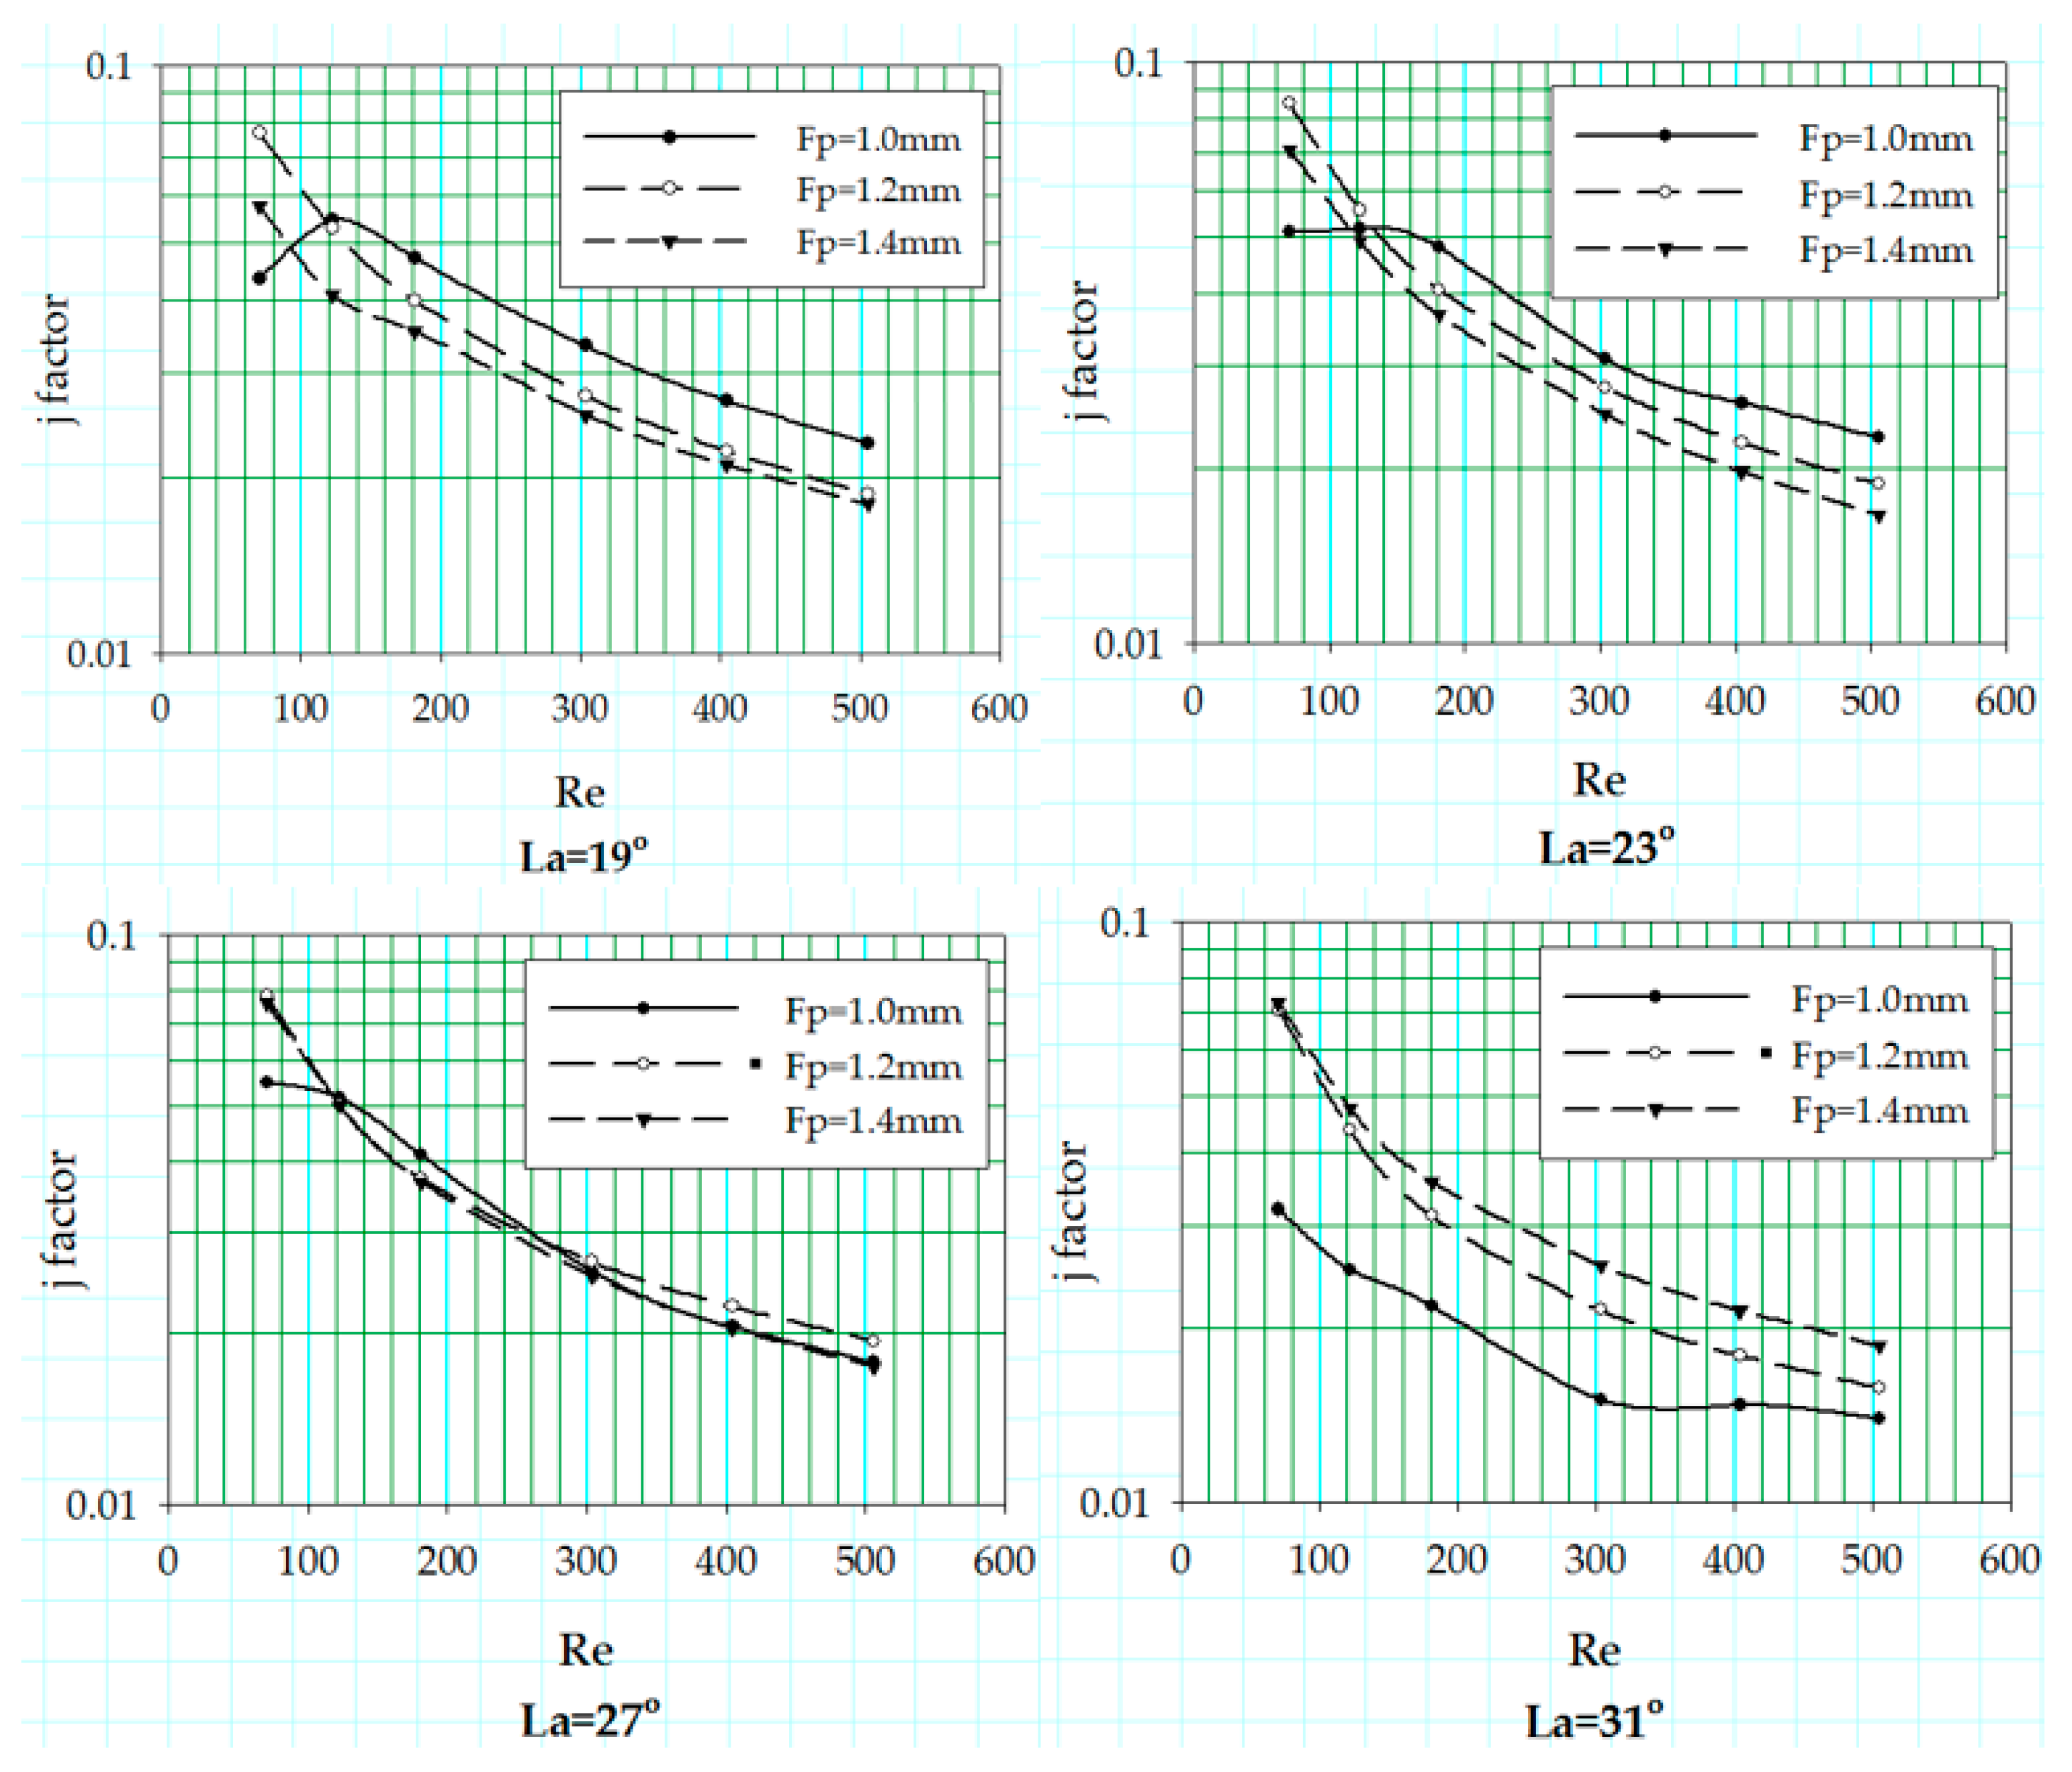
Figure 8.
j factor corresponding to fin pitch variation at different louver angles with Fd = 24 mm.
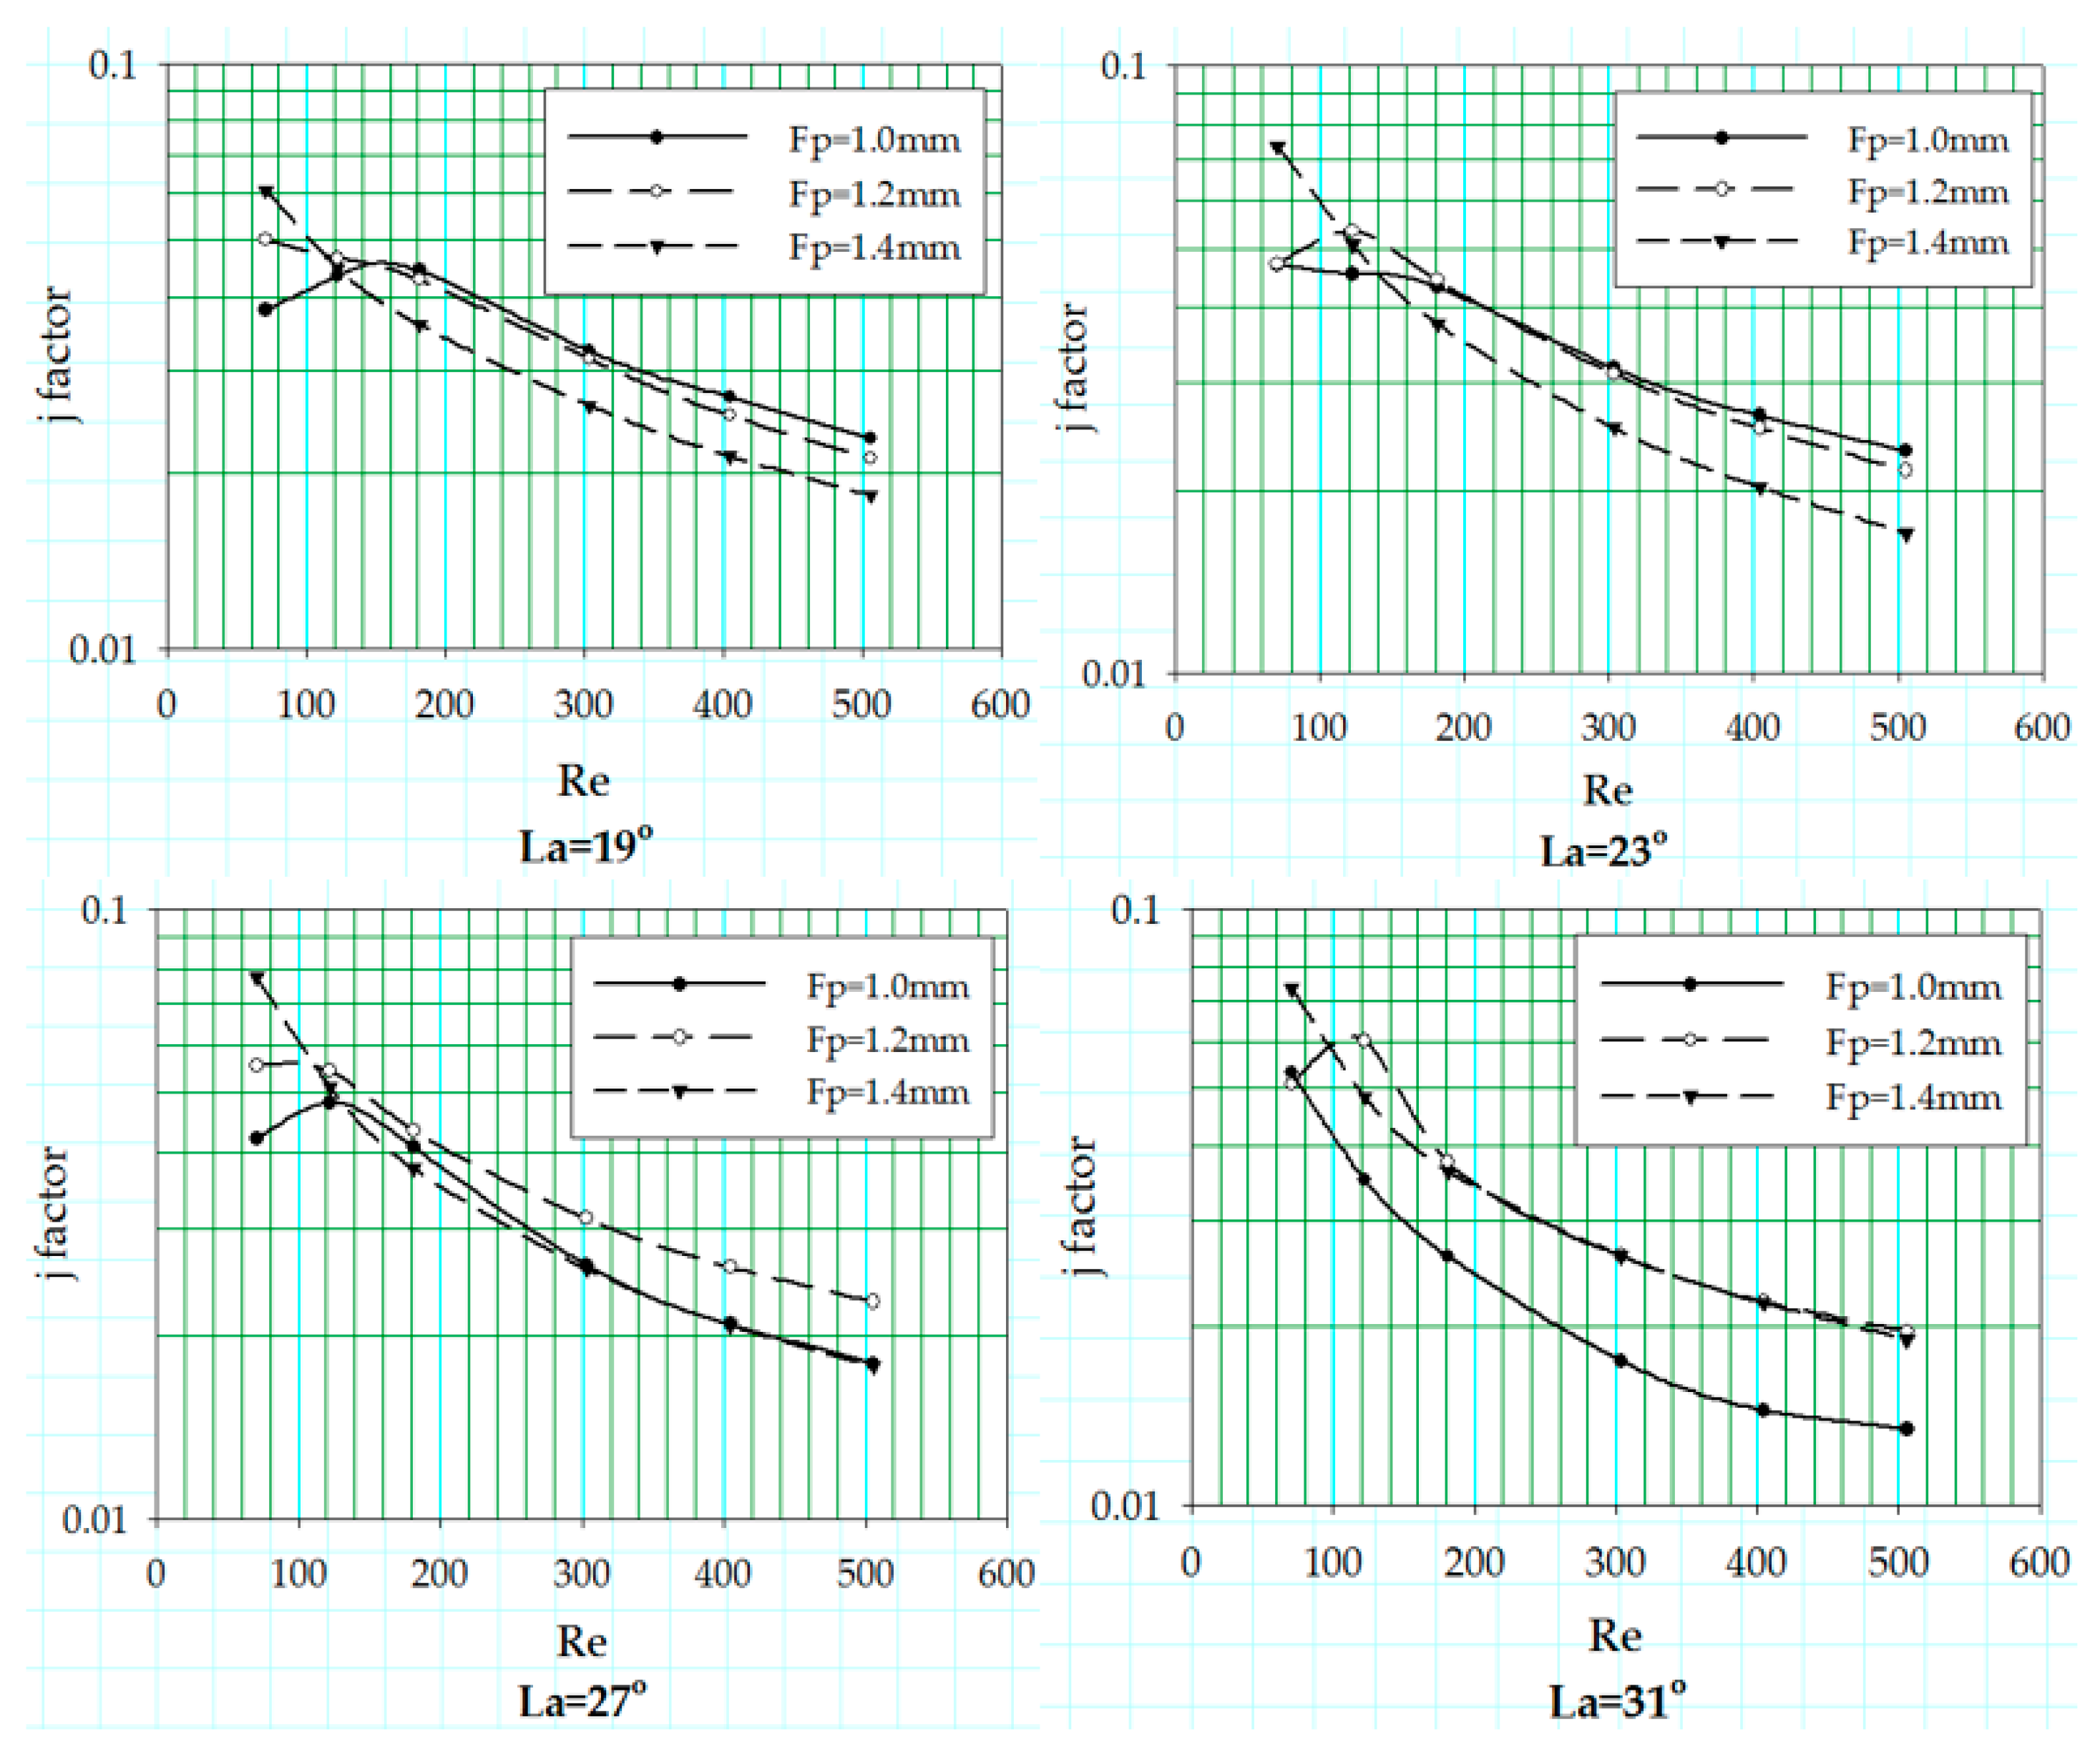
Figure 9.
Louver alignment with reducing Fp.
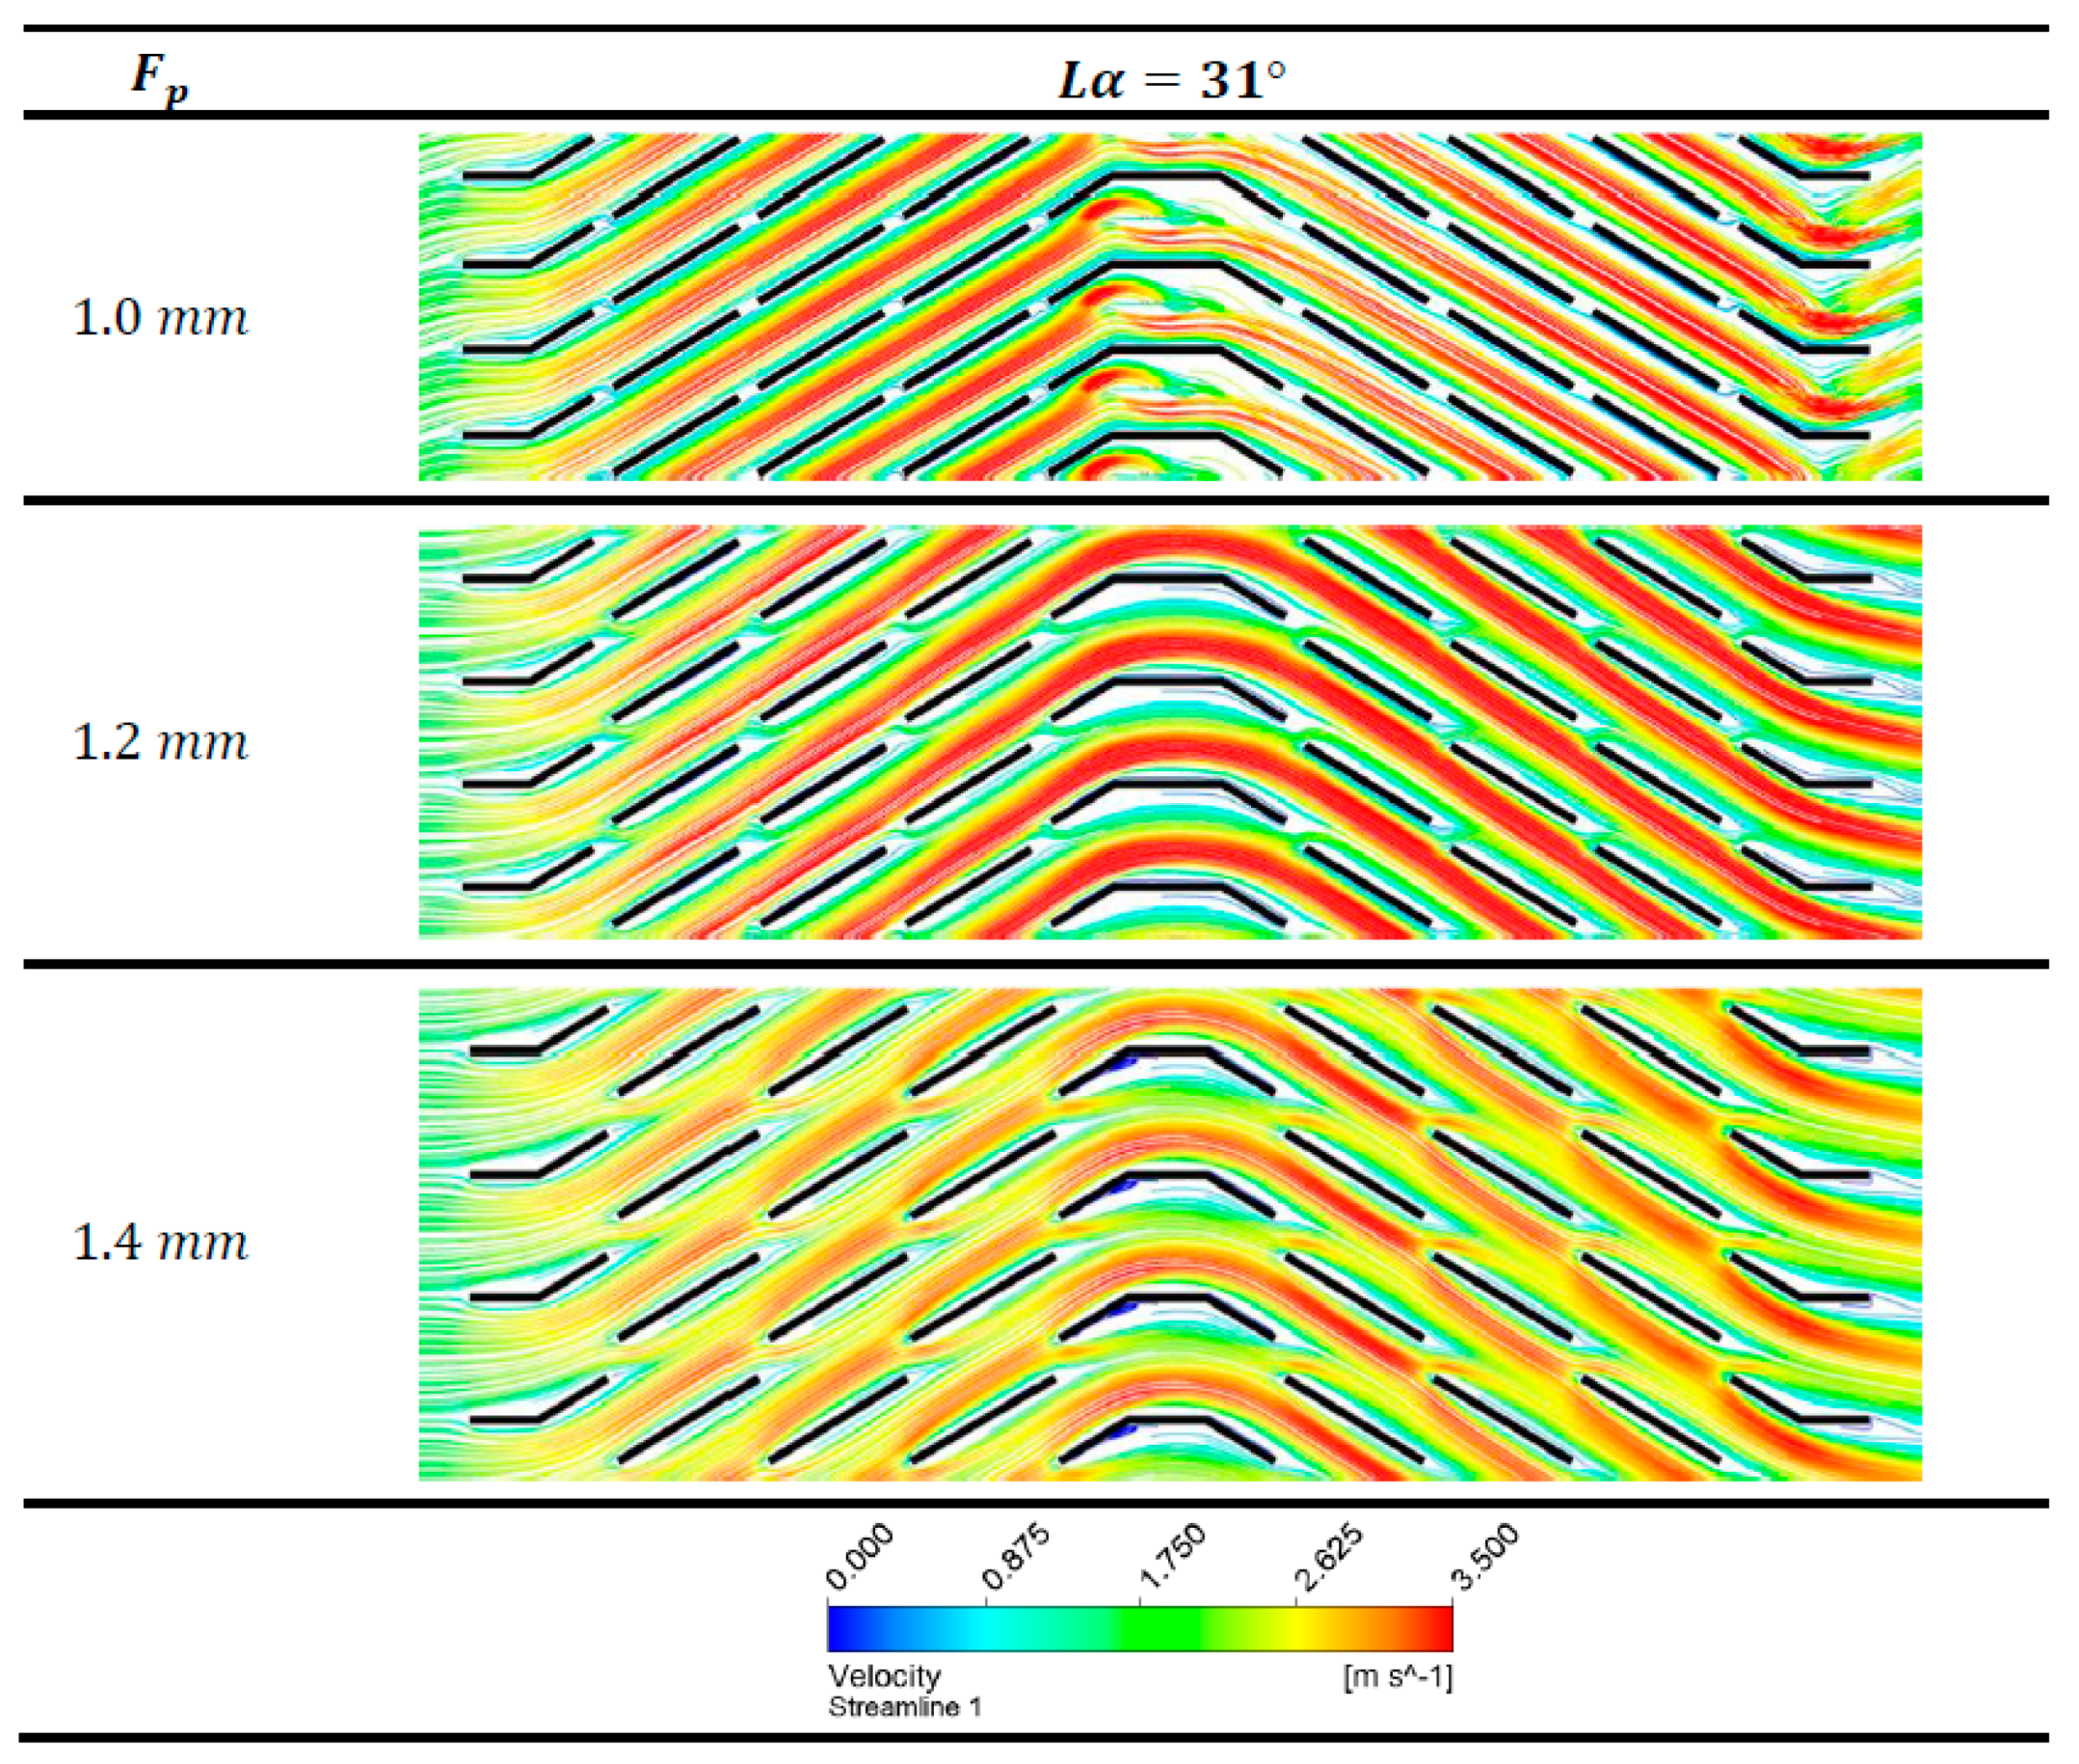
Figure 10.
Velocity contours for geometry with Fd = 24 mm and Fp = 1.0 mm at different louver angles.
Figure 10.
Velocity contours for geometry with Fd = 24 mm and Fp = 1.0 mm at different louver angles.

Figure 11.
f factor corresponding to fin pitch variation at different louver angles with Fd = 20 mm.
Figure 11.
f factor corresponding to fin pitch variation at different louver angles with Fd = 20 mm.

Figure 12.
j factor corresponding to flow depth variation at different louver angles with Fp = 1.0 mm.
Figure 12.
j factor corresponding to flow depth variation at different louver angles with Fp = 1.0 mm.
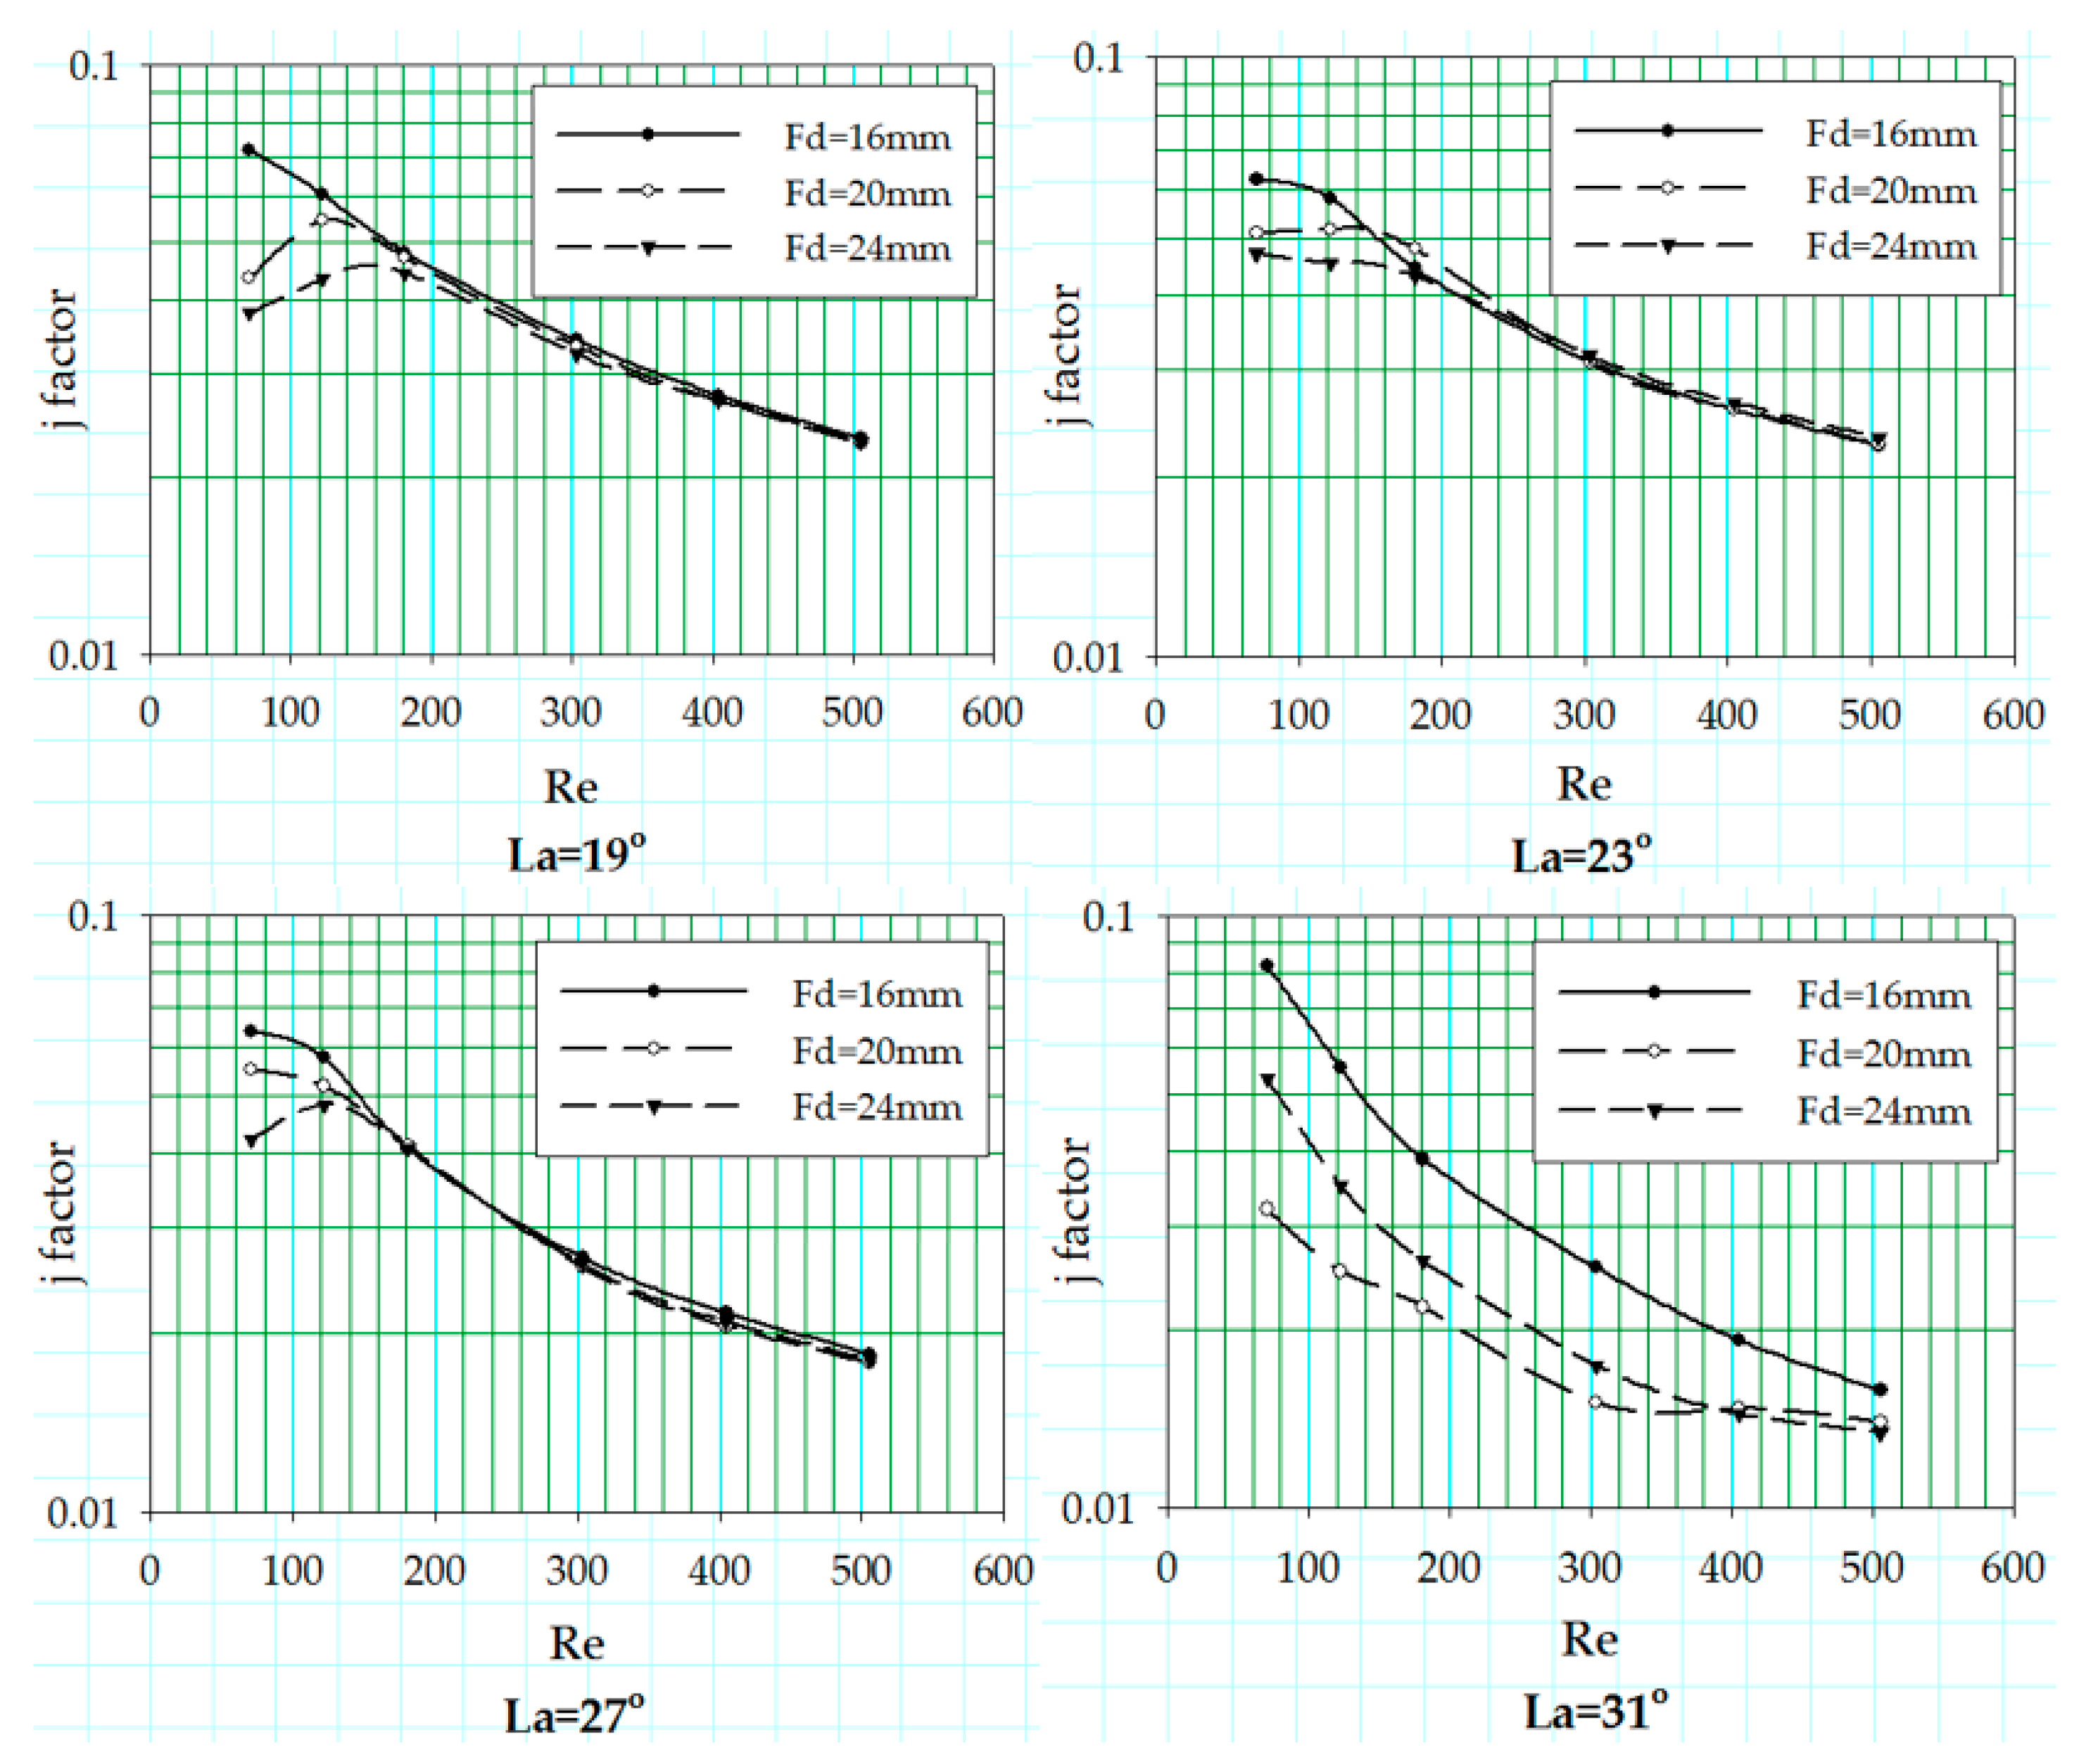
Figure 13.
j factor values corresponding to louver angle variation at different fin pitches with Fd = 24 mm.
Figure 13.
j factor values corresponding to louver angle variation at different fin pitches with Fd = 24 mm.

Figure 14.
Louver alignment between adjacent fins with increasing Lα.
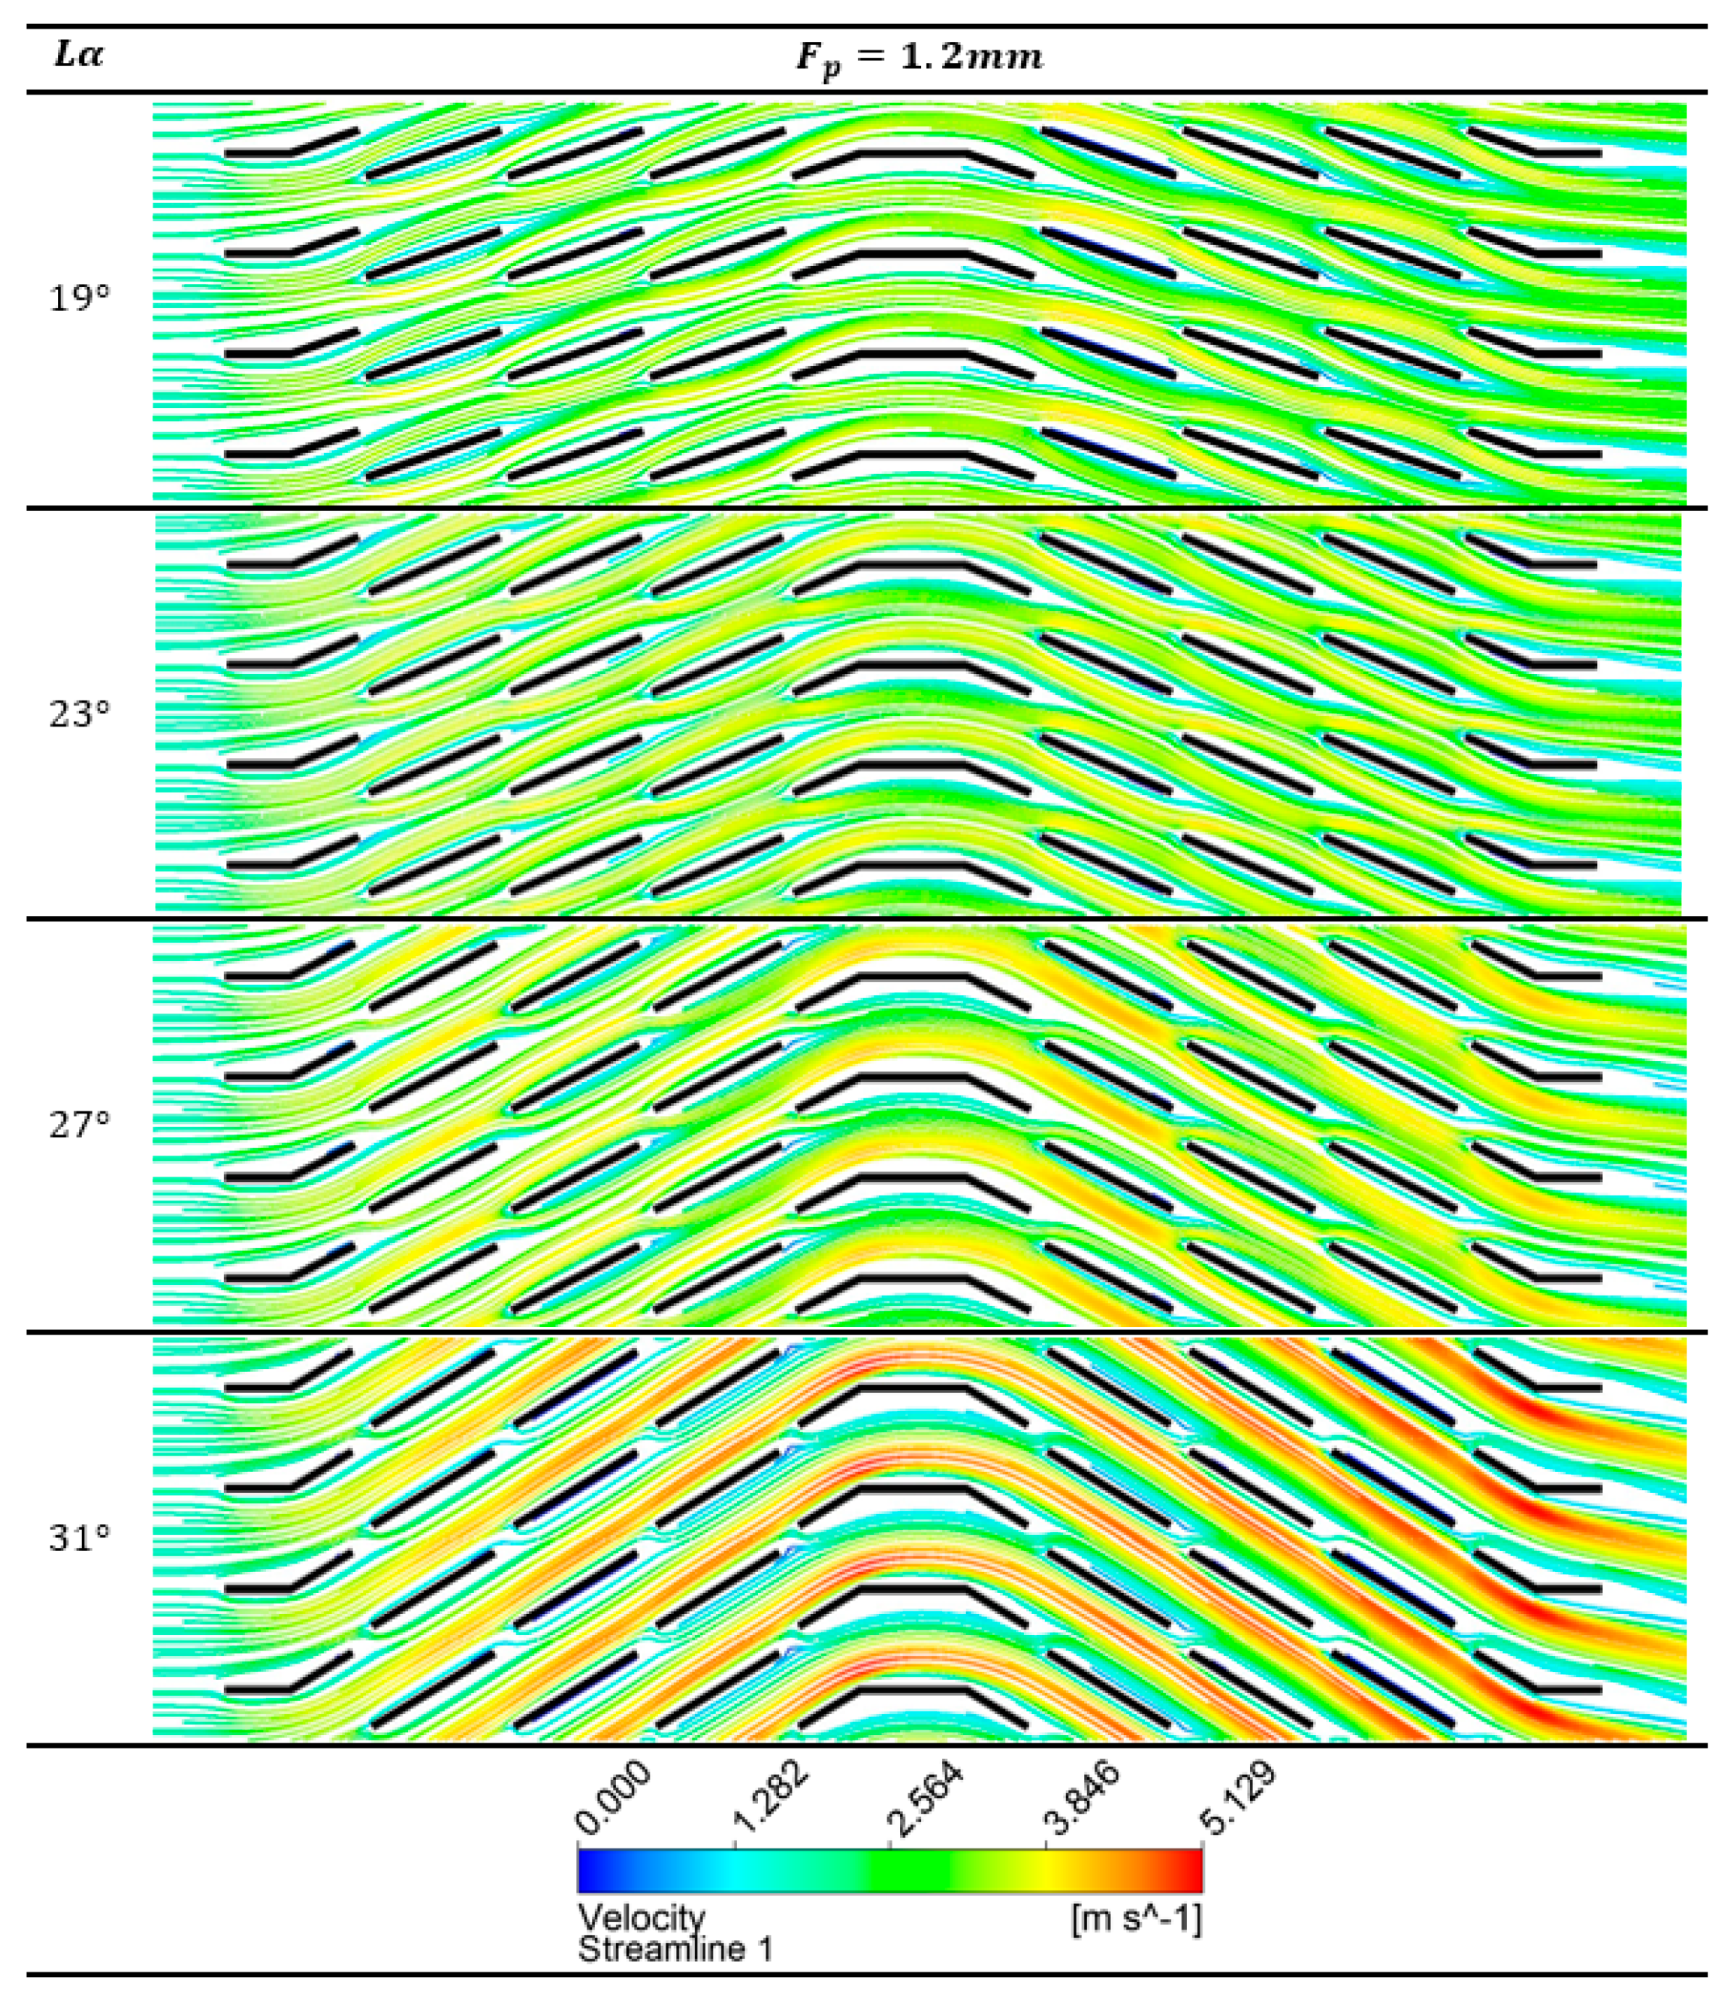
Figure 15.
f factor values corresponding to louver angle variation at different flow depths with Fp = 1.4 mm.
Figure 15.
f factor values corresponding to louver angle variation at different flow depths with Fp = 1.4 mm.

Table 1.
Literature review summary.
| Researchers | Lp (mm) | Lα (deg) | Fp (mm) | Fd (mm) | Lp/Fp | ReLp | Study |
|---|---|---|---|---|---|---|---|
| Webb and Jung [6] | 1.0–1.4 | 30 | 1.4–2.1 | - | 0.48–1.0 | 100–2000 | Experimental |
| Davenport [9] | 1.5–3.0 | 8–36 | 1.0–1.6 | - | 0.94–2.24 | 300–4000 | Experimental |
| Achaichia and Cowell [10] | 0.8–1.4 | 22–30 | 1.7–3.3 | 41.6 | 0.24–0.85 | 30–1000 | Experimental |
| Sunden and Svantesson [11] | 0.8–1.5 | 14–34 | 1.5–2.0 | - | 0.26–0.91 | 100–700 | Experimental |
| Chang and Wang [1] | 1.3–1.9 | 28 | 1.8–2.2 | 16–19 | 0.60–0.85 | 100–1000 | Experimental |
| Kim and Bullard [2] | 1.7 | 15–29 | 1.0–1.4 | 16–24 | 1.21–1.70 | 100–500 | Experimental |
| Kim and Cho [21] | 1.7 | 15–27 | 1.0–1.4 | 20 | 1.21–1.70 | 30–1000 | Experimental |
| Shinde and Lin [27] | 0.9–2.44 | 20–34 | 1.1–1.8 | 12–30 | 0.44–1.15 | 20–200 | Experimental |
| Present study | 1.7 | 19–31 | 1.0–1.4 | 16–24 | 1.21–1.70 | 30–500 | Numerical |
Table 2.
Published and correlations.
| S. No. | Authors | Correlations | Operation Range |
|---|---|---|---|
| 1. | Davenport [9] | | is louver height correlated for correlated for . |
| 2. | Achaichia and Cowell [10] | | Transverse tube pitch Correlated for . |
| 3. | Chang et al. [28] | | operational range . |
| 4. | Chang and Wang [13] | operational range . | |
| 5. | Chang et al. [14] | | Correlated for . |
| 6. | Kim and Bullard [2] | | Correlated for . |
| 7. | Jacobi et al. [29] | | and depend on the specimen. is correlation proposed in 1997. |
| 8. | Dong et al. [30] | | Correlated for . |
| 9. | Kim and Cho [21] | | First
correlation is valid for > while second one is valid for . is correlated for the entire Reynolds range. |
| 10. | Li and Wang [31] | | Operational for
is number of louver regions since the correlation is proposed for multi-region louvers. Re is based on hydraulic diameter. |
| 11. | Li et al. [32] | | is the hydraulic diameter. |
| 12. | Shinde and Lin [27] | | is tube height First and correlation is valid for Second and correlation is valid for . |
Table 3.
Geometric specifications of modeled heat exchangers.
| Fd (mm) | Fp (mm) | Lp (mm) | Lα (deg.) | Ll (mm) | H (mm) | S1 (mm) | S2 (mm) | Nl |
|---|---|---|---|---|---|---|---|---|
| 16 | 1.0, 1.2, 1.4 | 1.7 | 19, 23, 27, 31 | 6.4 | 8.15 | 1.70–1.79 | 0.77 | 8 |
| 20 | 1.0, 1.2, 1.4 | 1.7 | 19, 23, 27, 31 | 6.4 | 8.15 | 1.70–1.79 | 1.24 | 10 |
| 24 | 1.0, 1.2, 1.4 | 1.7 | 19, 23, 27, 31 | 6.4 | 8.15 | 1.70–1.79 | 1.79 | 12 |
Table 4.
Mesh properties.
| Properties | M1 | M2 | M3 | M4 |
|---|---|---|---|---|
| Element size near wall (m) | 1.80 × 10⁻⁵ | 6.42 × 10⁻⁶ | 4.12 × 10⁻⁶ | 2.57 × 10⁻⁶ |
| Max. element size (m) | 0.0002207 | 0.0001306 | 0.0001016 | 0.0000646 |
| No. of elements | 913,674 | 1,742,105 | 2,452,481 | 4,435,015 |
| No. of nodes | 844,560 | 1,638,900 | 2,323,584 | 4,240,800 |
| Computation time/10 iterations (s) | 170 | 316 | 466 | 931 |
Table 5.
Critical Reynolds number comparison.
| Lα | Fp = 1.0 mm (Lp/Fp = 1.70) | Fp = 1.2 mm (Lp/Fp = 1.42) | Fp = 1.4 mm (Lp/Fp = 1.21) | |||||||||
|---|---|---|---|---|---|---|---|---|---|---|---|---|
| 19° | 23° | 27° | 31° | 19° | 23° | 27° | 31° | 19° | 23° | 27° | 31° | |
| Fd = 16 mm (Lp/Fd = 0.106) | 70 | 70 | 70 | - | - | - | - | - | - | - | - | - |
| Fd = 20 mm (Lp/Fd = 0.085) | 130 | 140 | - | - | - | - | - | - | - | - | - | - |
| Fd = 24 mm (Lp/Fd = 0.071) | 160 | 130 | 130 | - | - | 130 | 120 | 130 | - | - | - | - |
| Kim and Cho [21] | 140 | - | 140 | - | 110 | - | 130 | - | 70 | - | - | 70 |
| Cowell et al. [34] | 258 | 213 | 182 | 158 | 261 | 215 | 183 | 159 | 264 | 217 | 184 | 160 |
| Web and Trauger [23] | 1405 | 1317 | 1247 | 1190 | 1405 | 1317 | 1247 | 1190 | 1405 | 1317 | 1247 | 1190 |
© 2017 by the authors. Licensee MDPI, Basel, Switzerland. This article is an open access article distributed under the terms and conditions of the Creative Commons Attribution (CC BY) license (http://creativecommons.org/licenses/by/4.0/).
Share and Cite
MDPI and ACS Style
Saleem, A.; Kim, M.-H. CFD Analysis on the Air-Side Thermal-Hydraulic Performance of Multi-Louvered Fin Heat Exchangers at Low Reynolds Numbers. Energies 2017, 10, 823. https://doi.org/10.3390/en10060823
AMA Style
Saleem A, Kim M-H. CFD Analysis on the Air-Side Thermal-Hydraulic Performance of Multi-Louvered Fin Heat Exchangers at Low Reynolds Numbers. Energies. 2017; 10(6):823. https://doi.org/10.3390/en10060823
Chicago/Turabian StyleSaleem, Arslan, and Man-Hoe Kim. 2017. "CFD Analysis on the Air-Side Thermal-Hydraulic Performance of Multi-Louvered Fin Heat Exchangers at Low Reynolds Numbers" Energies 10, no. 6: 823. https://doi.org/10.3390/en10060823
Note that from the first issue of 2016, this journal uses article numbers instead of page numbers. See further details here.