
Physical and Numerical Modeling of the Stability of Deep Caverns in Tahe Oil Field in China

Geotechnical and Structural Engineering Research Center, Shandong University, No. 17923, Jingshi Road, Jinan 250061, China
*
Author to whom correspondence should be addressed.
Energies 2017, 10(6), 769; https://doi.org/10.3390/en10060769
Submission received: 4 April 2017
/
Revised: 26 May 2017
/
Accepted: 27 May 2017
/
Published: 1 June 2017
(This article belongs to the Section L: Energy Sources)
Abstract
:Cave collapses emerge during the process of oil reservoir development, seriously affecting oil production. To reveal the collapse and failure mechanism of the carbonate cavern with a buried depth of 5600 m in Tahe Oil Field, using a self-developed ultra-high pressure model test system with the intelligent numerical control function, the model simulation material of carbonate rocks developed to carry out the 3D geo-mechanical model test. The model test and numerical results indicate that: (1) collapse and failure mechanism of the deep-buried caves mainly involve the failure mode of tensile shear. The rupture plane on the side wall is approximately parallel to the direction of maximum principal compressive stress. The V-type tension and split rupture plane then emerges. (2) In the process of forming holes in the model caverns, micro cracks are generated at the foot of the left and right side walls of the caverns, and the roof panels are constantly moving downward. The shorter the distance to the cave wall, the severer the destructiveness of the surrounding rocks will be. (3) The displacement of the top of the model cavern is relatively large and uniform, indicating that the cave roof moves downward as a whole. The area of the cavity suffering damage is 2.3 times as large as the cave span. The research results in this paper lay a solid test basis for revealing the cave collapse and failure mechanism in super depth.
1. Introduction
As the main development field of oil reserve, the fractured-vuggy reservoir is the focus area of oil exploitation for the future [1]. It is an important type of the carbonate reservoirs and accounts for 2/3 of proven oil reserves [2,3]. Since the discovery of the Tahe oil field in 1997, the oil output has risen from 3,900,000 tons to 83,600,000 tons in 2017 for these 20 years. Tahe oil field is buried 5300 m to 6200 m below. The buried depth of north-eastern part is 5300 m to 5500 m where the main oil deposit is normal oil. The buried depth of south-western part and main part is 5500 m to 6200 m where the main oil deposit is heavy oil. The viscosity of the oil is 894 MPa/s. The primary recovery technique of oil is the water flooding recovery which can achieve the goal of oil extraction. Tahe oil field mainly is composed of caves and large cracks. As the reservoir space, caves do not maintain the seepage capability. Instead, as the main seepage channel, cracks undertake the oil transmission between caves. As the formation pressure decreases during the oil extraction process, the cave collapses occur down-hole, which severely affects the oil production and the oil recovery of the reservoir [4,5,6].
The stability of deep underground caves is usually analyzed through the numerical simulation. It can analyze the cave stability, as well as the interaction among various caves [7,8,9,10]. However, with the increase of the depth, physical surroundings around the underground caves become complicated, and geometrical features, geologic characteristics and rock mechanic parameters are usually complicated variables [11]. All of these will make an uncertain environment. Therefore, the mentioned obstacles have brought great challenges to the numerical method of simulating fracture-cavity carbonate reservoir caves [12,13,14]. However, the physical model test can effectively solve these problems.
Well-designed experiments may yield important insights into behaviors that are not available from numerical simulations. The geo-mechanical model test is one of the most important means of physical model testing to investigate the stability of large-scale geotechnical engineering structures [15,16,17,18,19]. Once the similarity principles are satisfied, the geo-mechanical model test is expected to characterize the prototype quantitatively. Zhang et al. [20,21] developed a new model test system and studied operation risks of salt rock gas-storage through the model test. Zhu et al. [22] studied the interaction between different caverns of Shuangjiangkou hydropower station during excavation through model testing. In order to investigate the influence to the failure mode of surrounding rocks caused by the weak intercalated layer, Huang et al. [23] simulated the tunnel excavation through model testing. The test reveals that the weak intercalated layer influences the tunnel stability by increasing the destruction belts and causing the asymmetrical stress distributions. Zhang et al. [24] developed a new model large scale 3D geological model test system that can be used for multi-chamber stability analysis and studied the underground cavern group stability on the basis of this system. Liu et al. [25], through research found the rock deformation and strength characteristic play a critical role in the arch dam geo-mechanical model failure test. Ghabraie et al. [26] improved the monitoring method of the model test, making the model test data more diversified and more reliable. Feng et al. [27] considered all factors influencing the dam stability through the model test., and studied the dam foundation stability of the Jinping first stage hydropower station.
In response to the collapse and failure phenomenon of the cave in super depth (with a buried depth of 5000 to 7000 m), the ultra-high pressure model test system with intelligent numerical control function is developed and the model simulation material meeting the similar conditions is prepared. This is the first time systematically revealing the collapse and failure process, the failure mode and the failure law of a carbonate cave in a super depth and then comparing and analyzing the authenticity of the test result through the numerical method. The research result lays a solid test basis for revealing the collapse and failure mechanism of the cave in a super depth and has great theoretical significance and engineering application value.
2. Test
2.1. Test Equipment
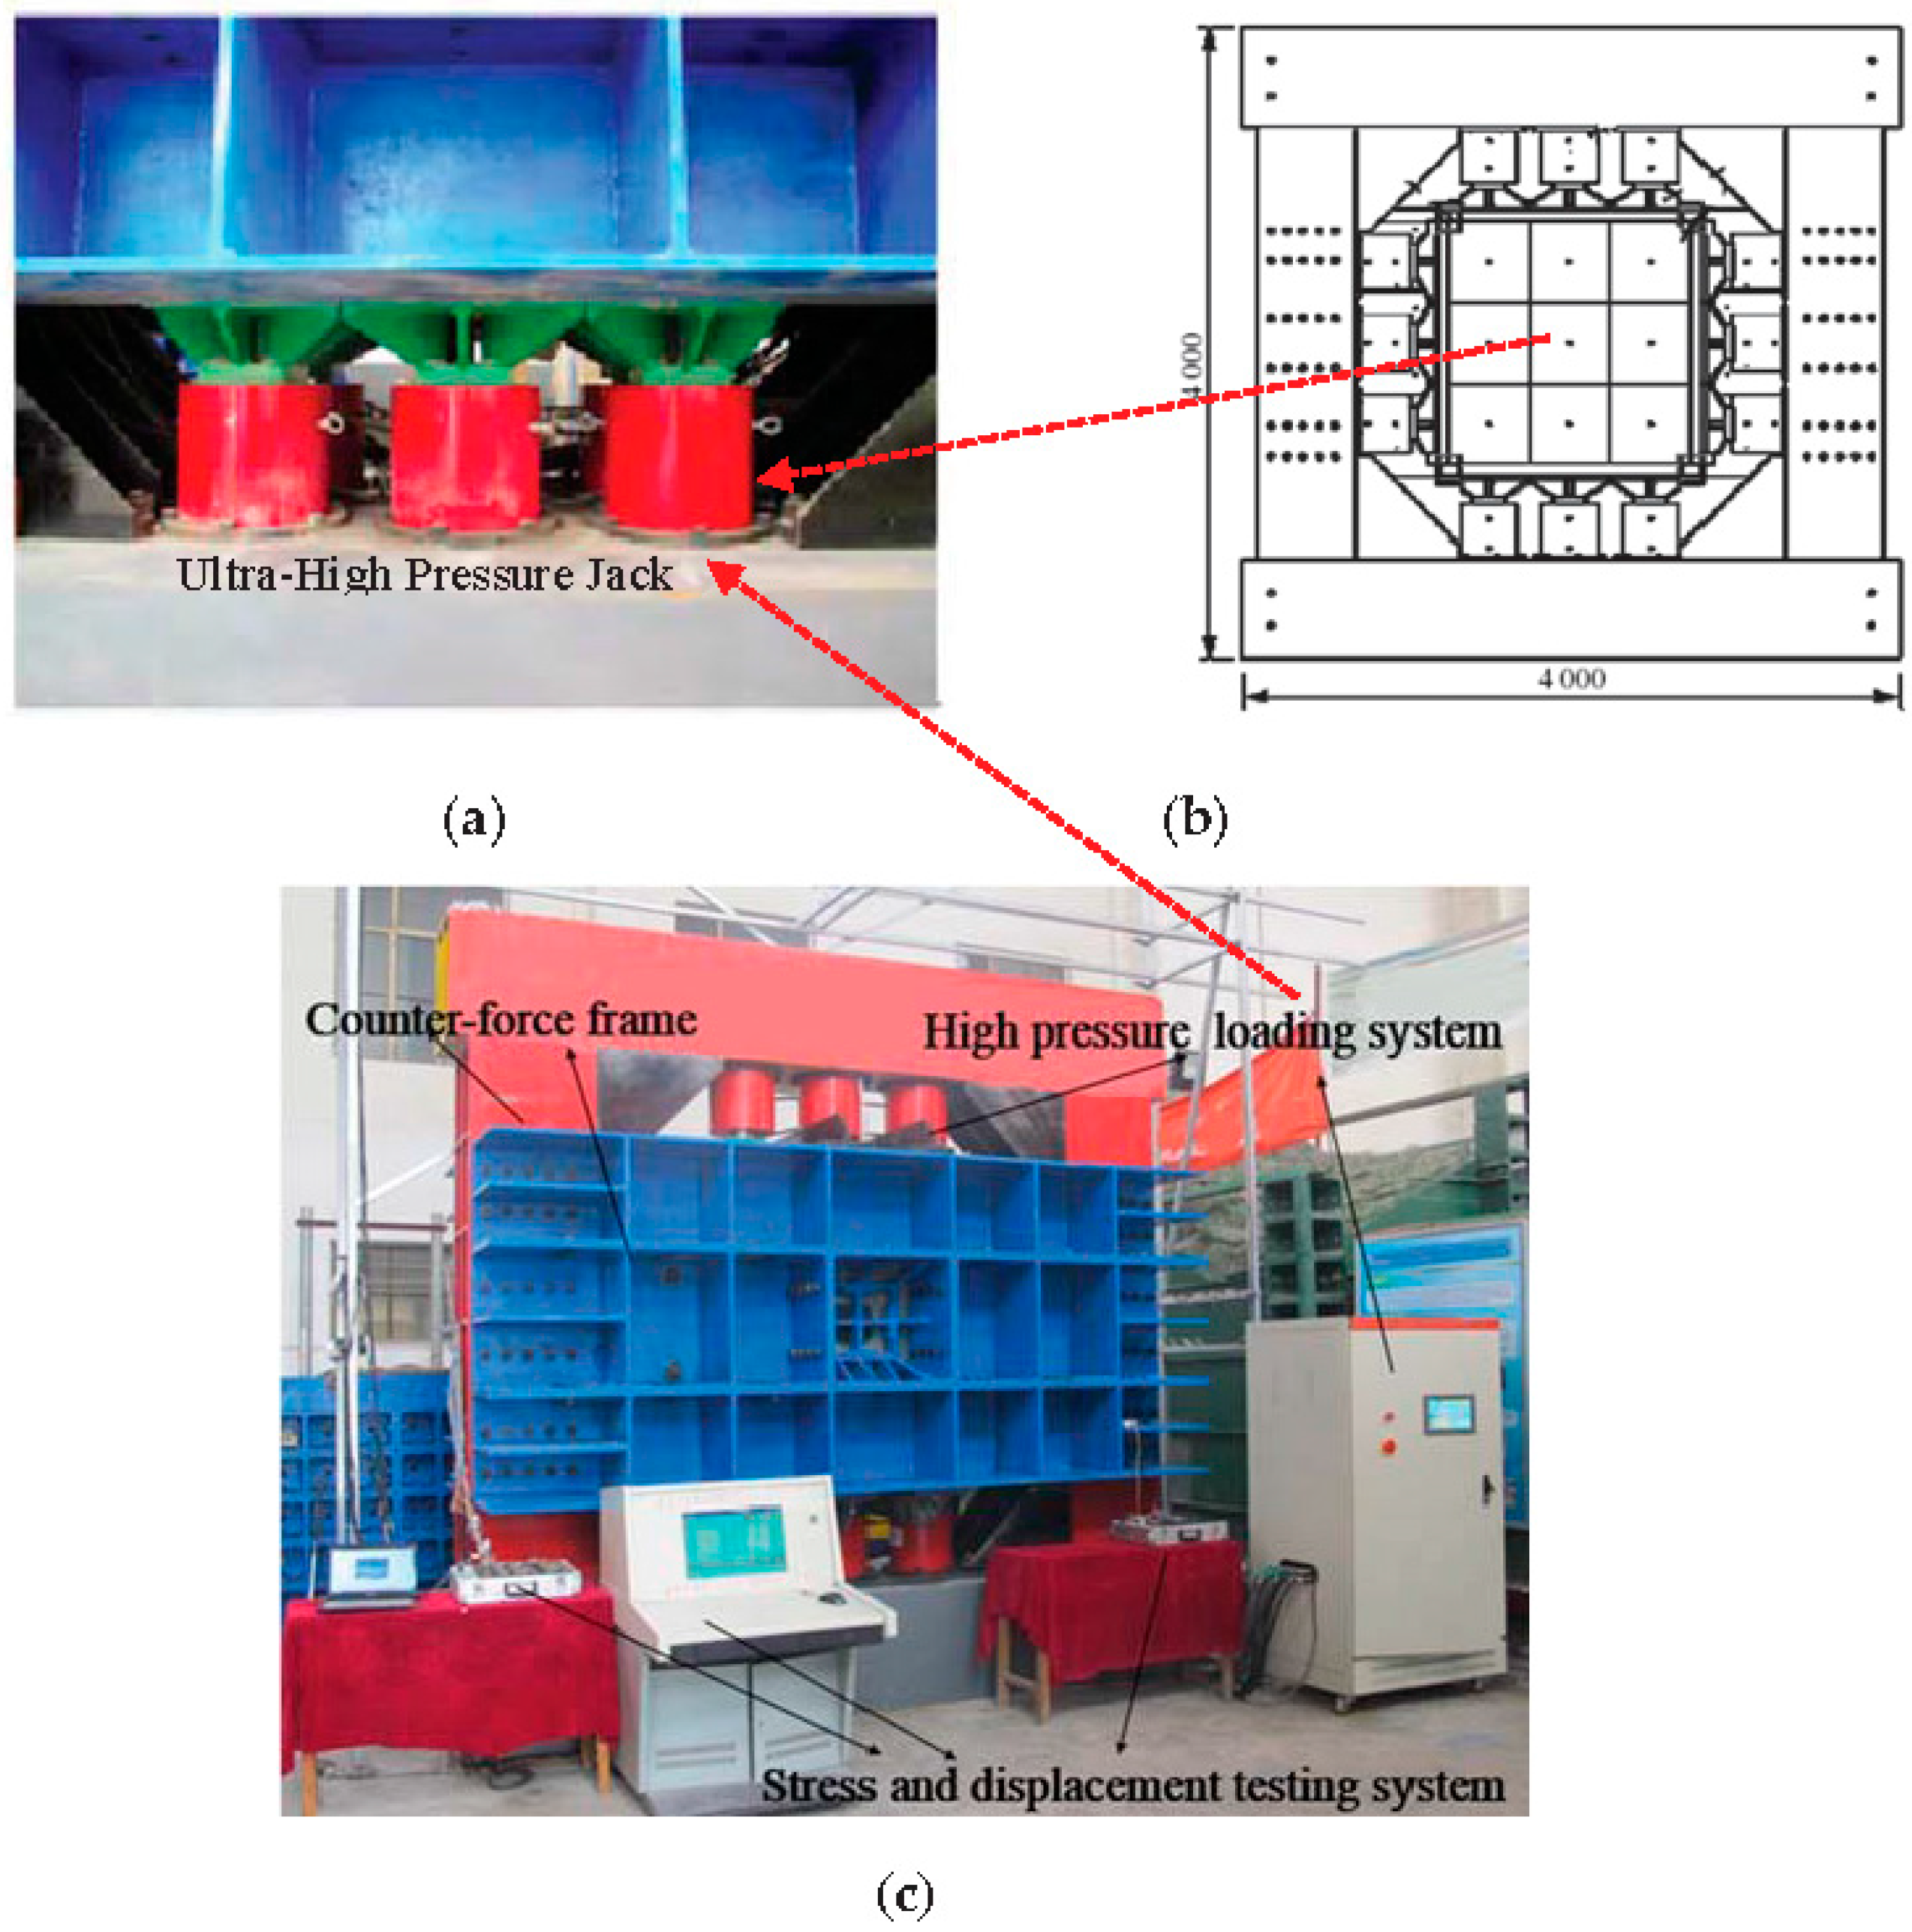
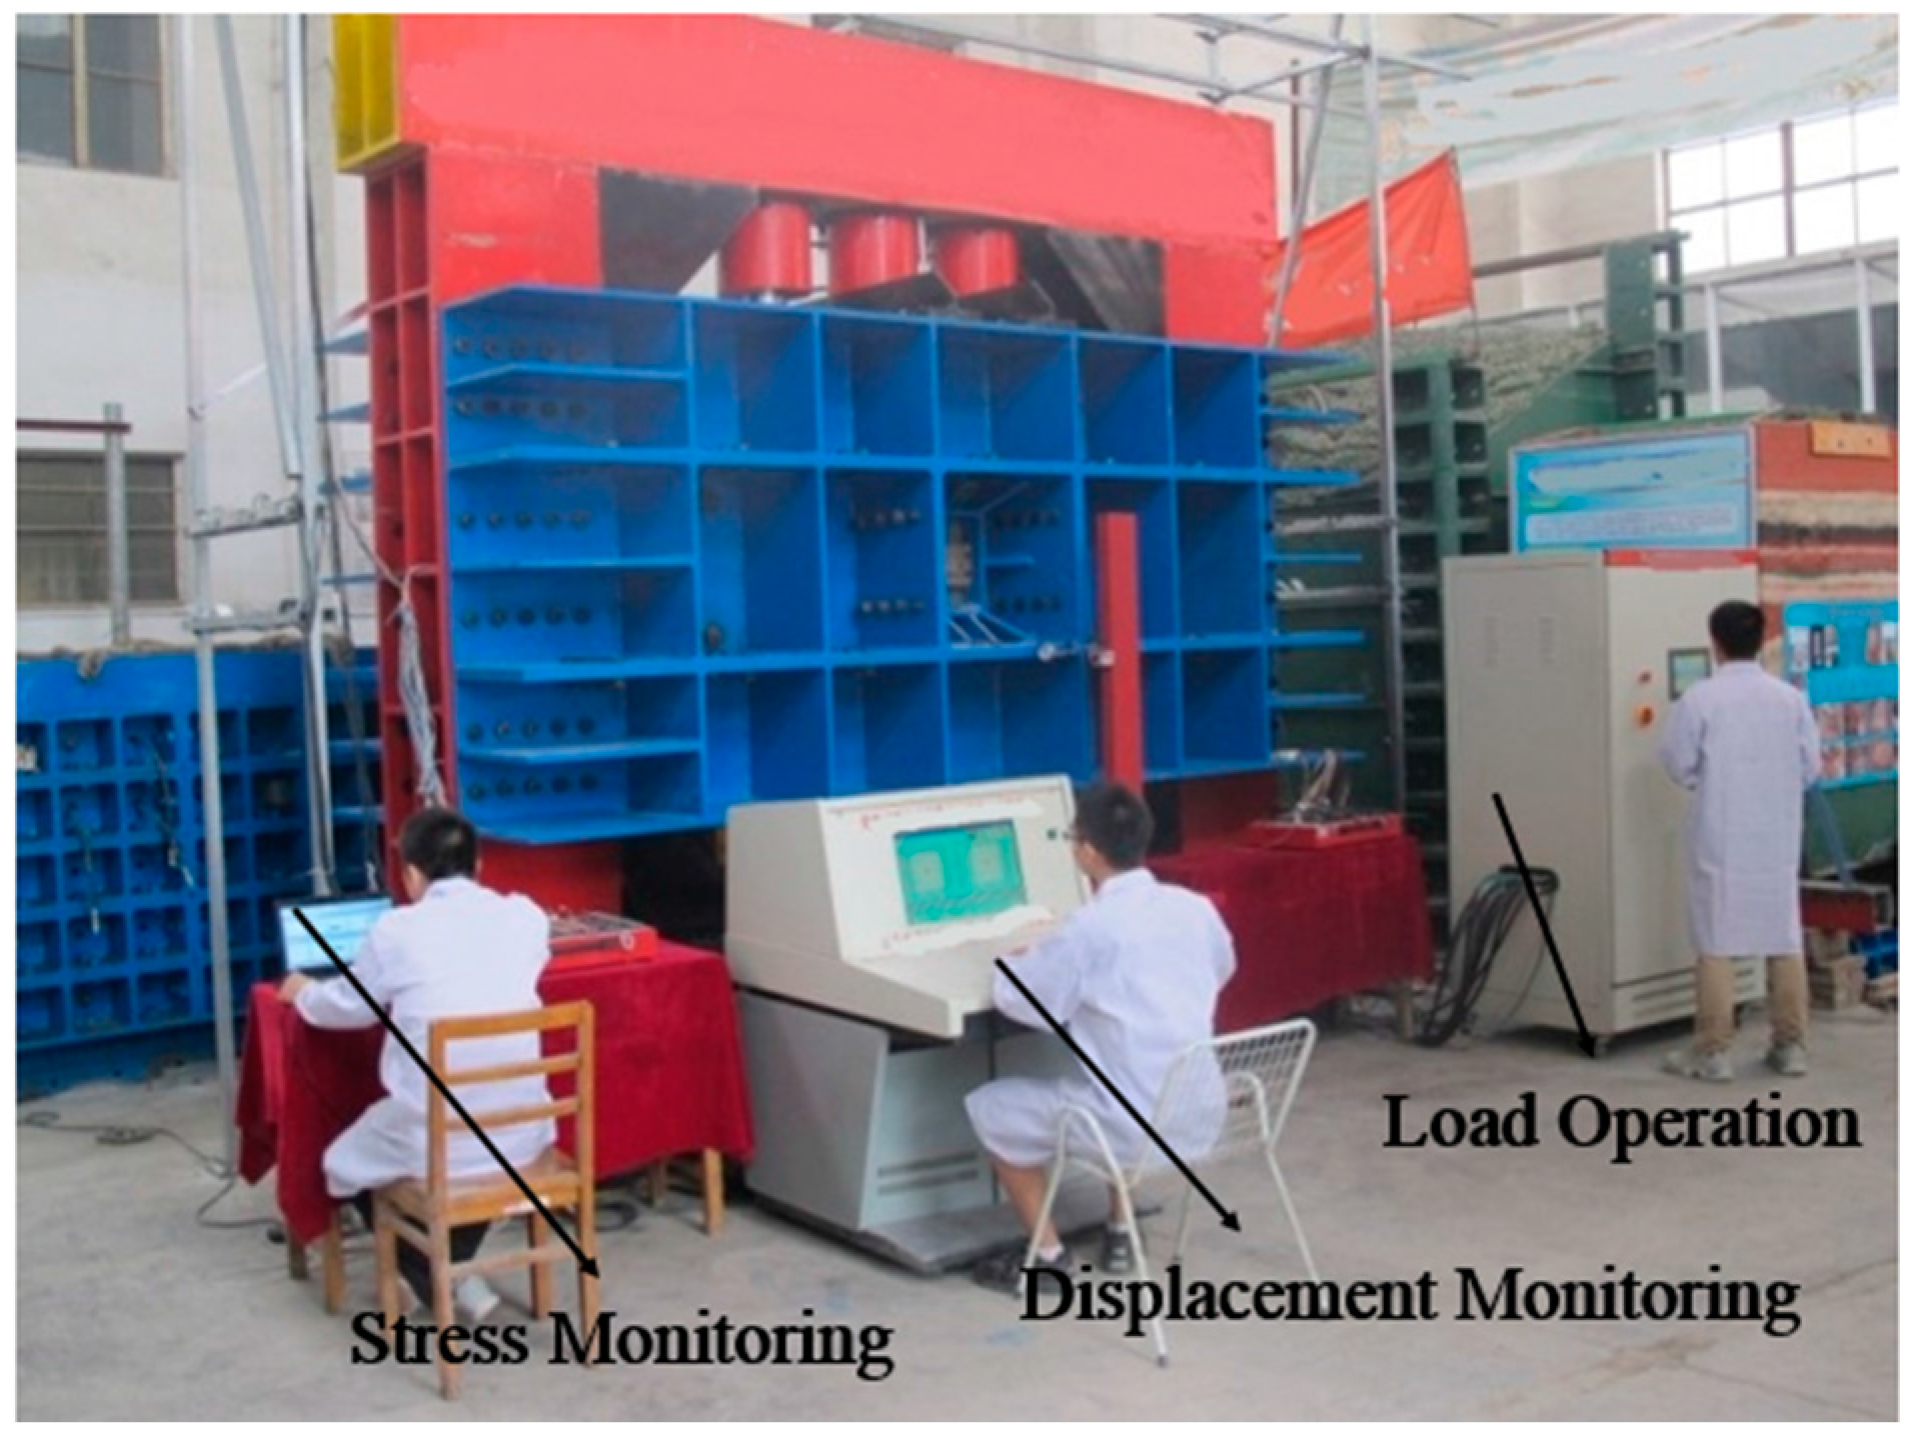
In order to carry out the 3D geological model test for cave collapse and failure with a super depth, the ultra-high pressure model test system with intelligent numerical control function is developed. As shown in Figure 1, this system is composed of six components listed as follows: the model counter-force frame; the ultra-high pressure jack system; the gradient high-pressure loading system; the automatic model displacement recording system; the model stress automatic test system. The high pressure equipment is specially designed in this test and its rated output is 60 MPa. There are in total 12 hydraulic jacks respectively set on the four sides of the equipment. The maximum power output of each hydraulic jack can reach 10,000 KN. The concrete arrangement pattern is shown in Figure 1. The whole system meticulously simulates the deformation and failure process of the cave buried under several thousand meters deep. It successfully achieves a digitized, visual and intellectualized non-linear simulation for the extra-deep cave collapse and failure under a condition of non-uniform loading or unloading. Besides, it provides a powerful and important technical equipment for studying the collapse and failure mechanism of the cave in super depth of 5000 to 7000 m deep.
2.2. Test Material
The model test conducted in this paper is based on the similarity theory to meet the similar conditions of the reduced scale test. The actual well-log information indicates that the span of uncharged vugs in the oil region is usually within 10 m. The geometric similarity scale of this model test was selected as 1:50 after taking the prototype cave scale and the model test loading system into account.
The similar material of this model test is the iron barites sand cementation material (IBSCM). The iron powder, the barite powder and the quartz sand are selected as the aggregate of IBSCM. Among these components the iron powder and the barite powder are fine aggregates while the quartz sand is coarse aggregate. Its regulator is the gypsum powder and its cementing agent is the rosin-alcohol solution (see Figure 2). The mechanical parameters of the IBSCM material can be adjusted through the change of the component concentration and the cementing agent solubility. Besides, the IBSCM holds many advantages such as the wide range of mechanical parameters’ variation, the stable property, the low cost, the speedy drying, the simple technique, nontoxic and harmless, etc. Because of the excellent properties of the IBSCM, it has been widely used, and a pretty good effect has been obtained in actual tests. Based on the similar conditions and the geomechanical characteristics of the carbonate rocks from the oil field (see Table 1), the modeled similar materials with similar conditions were obtained in the deformation and strength failure characteristics of the Ordovician carbonate rocks.
In order to conduct the test for the mechanical parameters of the similar material, various dimensions of specimens are need in line with the related mechanic test requirements. In the uniaxial and triaxial compression test, the specimen is a standard circular column with a diameter of 50 mm and a height of 100 mm. In the Brazilian splitting test, the specimen is a circular column with a diameter of 50 mm and a height of 50 mm. The fabrication technology procedures for the material specimen are listed as follows. First, after the ration and weighing measurement, put the refined iron powder, the barite powder and the quartz sand into the blender to stir evenly. Then, add into a certain concentration of rosin-medical medical alcohol solution for intensive mixing. Second, put the mixture into a mold with the pre-set pressure and corresponding dimensions for compaction. Third, with the completion of the specimen, it should be labeled and dried at room temperature. Finally, after the drying various tests for mechanical parameters can be conducted with the specimen.
The mechanical parameters including elastic modulus, Poisson’s ratio, compressive strength, tensile strength, cohesion and angle of internal friction of super depth carbonate rock and similar material are obtained through mechanical tests (see Table 1 and Table 2). The proportioning of model similarity materials is shown in Table 3. Figure 3 is the similar material specimens. Figure 4 is the test procedure of rock mechanics parameters.
The compression stress-strain curves are obtained after the uniaxial test for the similar material specimen of carbonate and the prototype rock (see Figure 5). It can be seen from Figure 5 that the compression stress-strain curves of the similar material all include three phases: the elastic deformation stage, the plastic deformation stage and the strain-softening stage. Among the three phases, the first one takes the smallest portion, while the second one lasts for a rather long time. As the stress climbs higher than the peak stress, the strain increases constantly. However, the stress gradually decreases, which shows the strain-softening property, as well as a rather strong ductility and deformation behavior. Finally, it goes into the remnant strength destroying phase. The contrast analysis shows that, the compression stress-strain curves of the similar material specimen of carbonate and the prototype rock basically remain similar, the peak strength and the residual strength all basically fulfill the similar condition demands.
It can be seen in Figure 6 that the prototype and the similar material both show a split failure mode in the uniaxial compression test while showing a shear failure mode in the triaxial compression mode. Therefore, the similar material in this thesis satisfies the similarity relation not only in strength property but also in deformation failure characteristic. Therefore, the physical and mechanical parameters of the model material prepared according to the material ratio in Table 3 satisfy the similar relationship with the mechanics parameters of the prototype rock. Therefore, the geo-mechanics model test for deep-buried karst caves’ collapse and destruction can be conducted with the assistance of the mentioned model similarity material.
2.3. Test Procedures
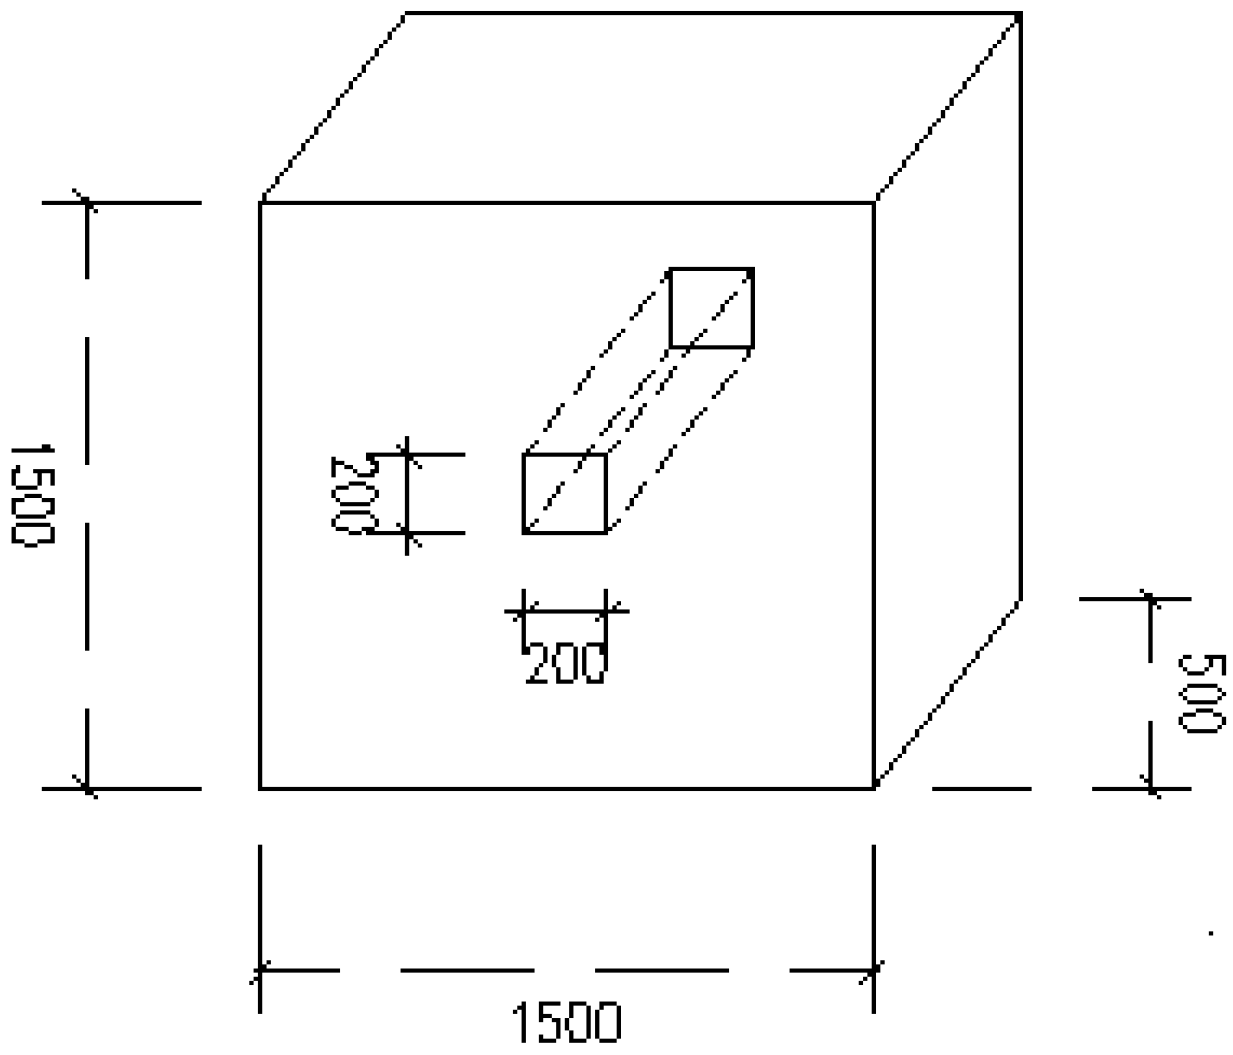
The prototype of the model test, 75 m in height (vertical direction), 25 m in length (axially parallel) and 75 m in width (vertical axis), was simulated. Accordingly, the similar ratio is 1:50; the size of the model is 0.5 m in length, 1.5 m in width and 1.5 m in height. The prototype of the karst cave was a rectangle cave with a height of 10 m, a width of 10 m and a length of 25 m. Therefore, the karst cave model, 0.2 m in length, 0.2 m in width and 0.5 m in height, was conducted. The schematic diagram of the model is shown in Figure 7.
The basic fabrication process of the model is material agitation, spreading in layers, layer-compacting, air drying layer by layer and measuring elements-burying. The fabrication process of the model is listed as follows. First of all, it must be determined how many layers are needed and how thick and heavy each layer shall be according to Table 3. Next, totally dissolve the rosin-medical alcohol solution and pour it into the material for blending. Put the similar material into the model to be paved evenly. Then, conduct the air drying for the compact material layer by layer with a high power fan. After complete air drying measuring elements-burying shall be carried out at the designed position. After this done, then follow the above steps to the next layer of the mode until the model is finally completed. The main fabrication process of the model is shown in Figure 8. The model cave is completed through excavation. Although this is not exactly the same as the actual situation, it will not impact the investigation of the collapse and failure mode as well as the failure law.
With the complement of the model fabrication, exert the stress at the model boundary according to the similar stress and keep a steady pressure for 24 h so that an initial high geo-stress field can be formed inside the model. Then keep excavating the model by stages along the cave axle until the whole model cave is cut-through and shaped up. During the process, the deformation and failure of the model cave should be observed. The test procedure photos of the model are shown in Figure 9.
3. Result of the Model Test
3.1. Cave Collapse and Failure Process
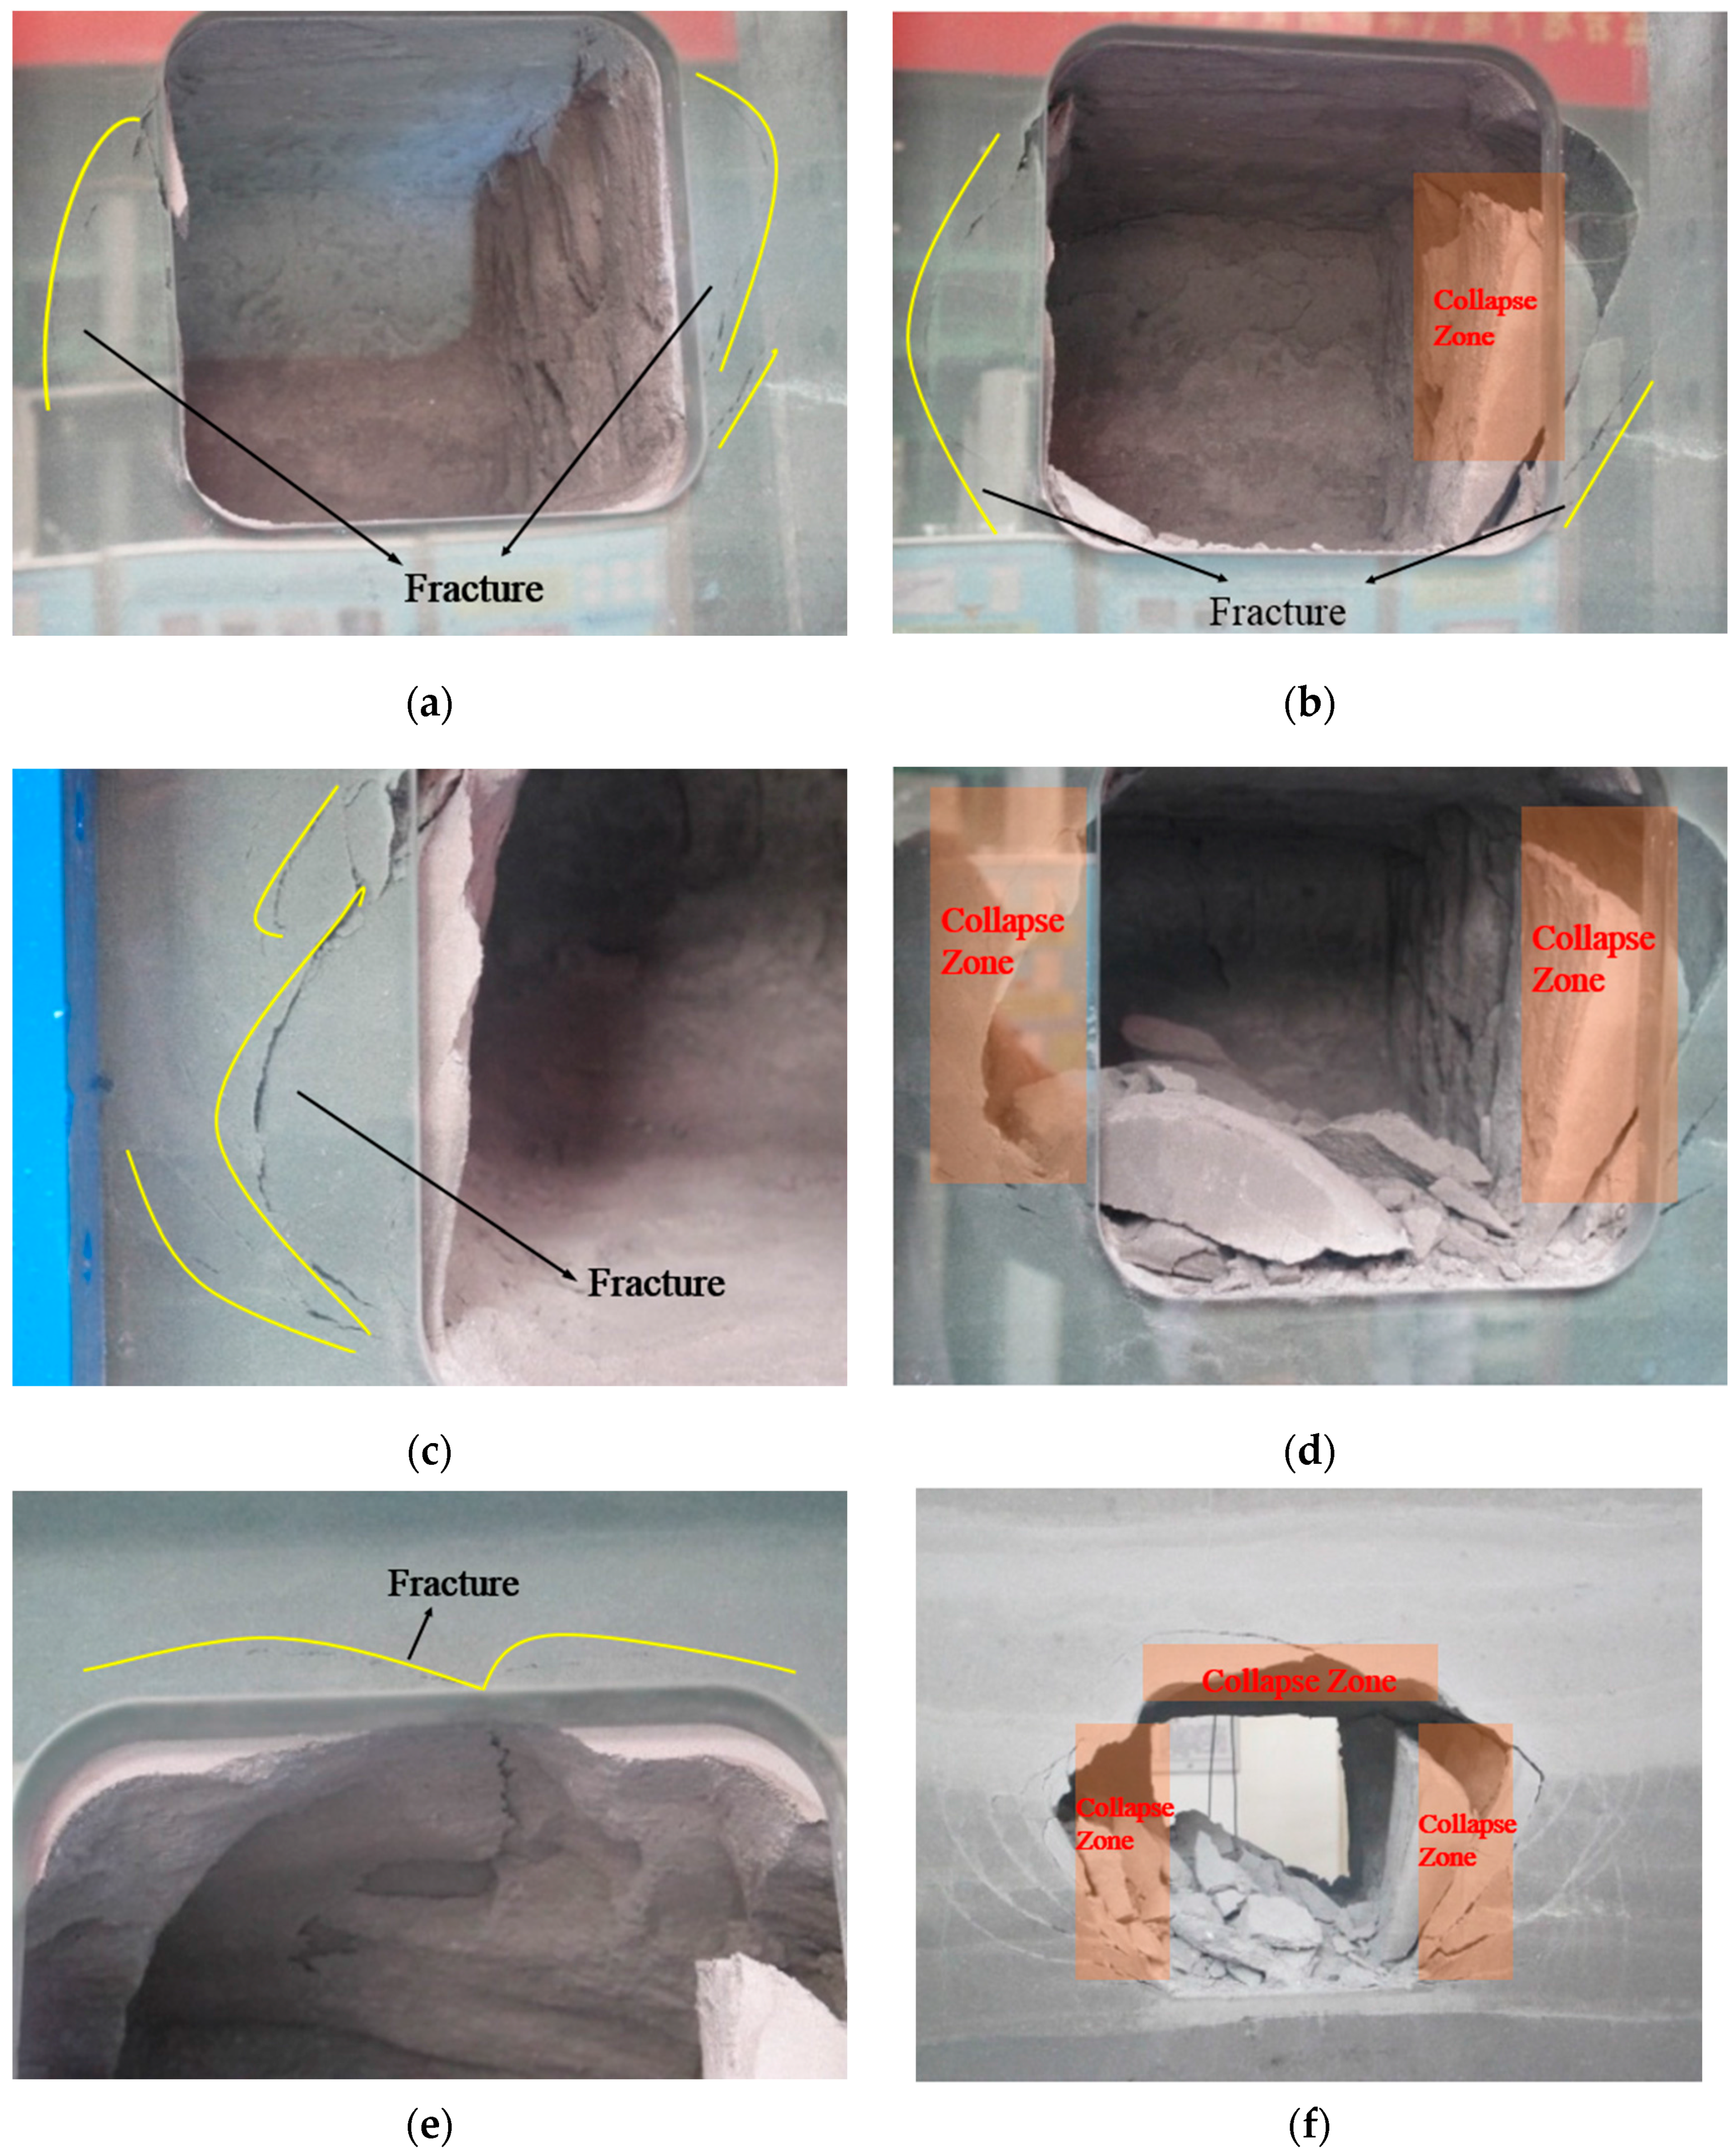
A real-time, dynamic, intuitive and clear observation of the whole process from the rectangle cave cavitation to its gradual failure and collapse can be obtained through the model test. Photographs of the model cave failure and collapse are shown in Figure 10.
It can be seen from Figure 10 that during the simulation process of the axial cavitation, microfissures first emerge at the toe of the left and right walls and the roof keeps moving down constantly. As time passes by, the microfissures gradually expand into several shear cracks along the left and right walls of the cave. When these shear cracks reach the cave top turning into large penetrating cracks the collapse and failure will finally appear on the side walls sequentially. Additionally, then, the roof of the cave cracks. Finally, under the high geo-stress the cave cracks expand upwards from the toe of the side walls and turn into several penetrating rupture belts, leading to the collapse and failure of the whole cave.
As the cave is buried in a stratum where the vertical stress is larger than the horizontal stress, tensile shear becomes the main failure mode of the cave here. The rupture plane of the cave side walls is approximately parallel to the direction of the maximum principal compressive stress, and finally, the V-type tension and split rupture plane appears.
3.2. Change Rules of Displacement and Stress around the Cavern
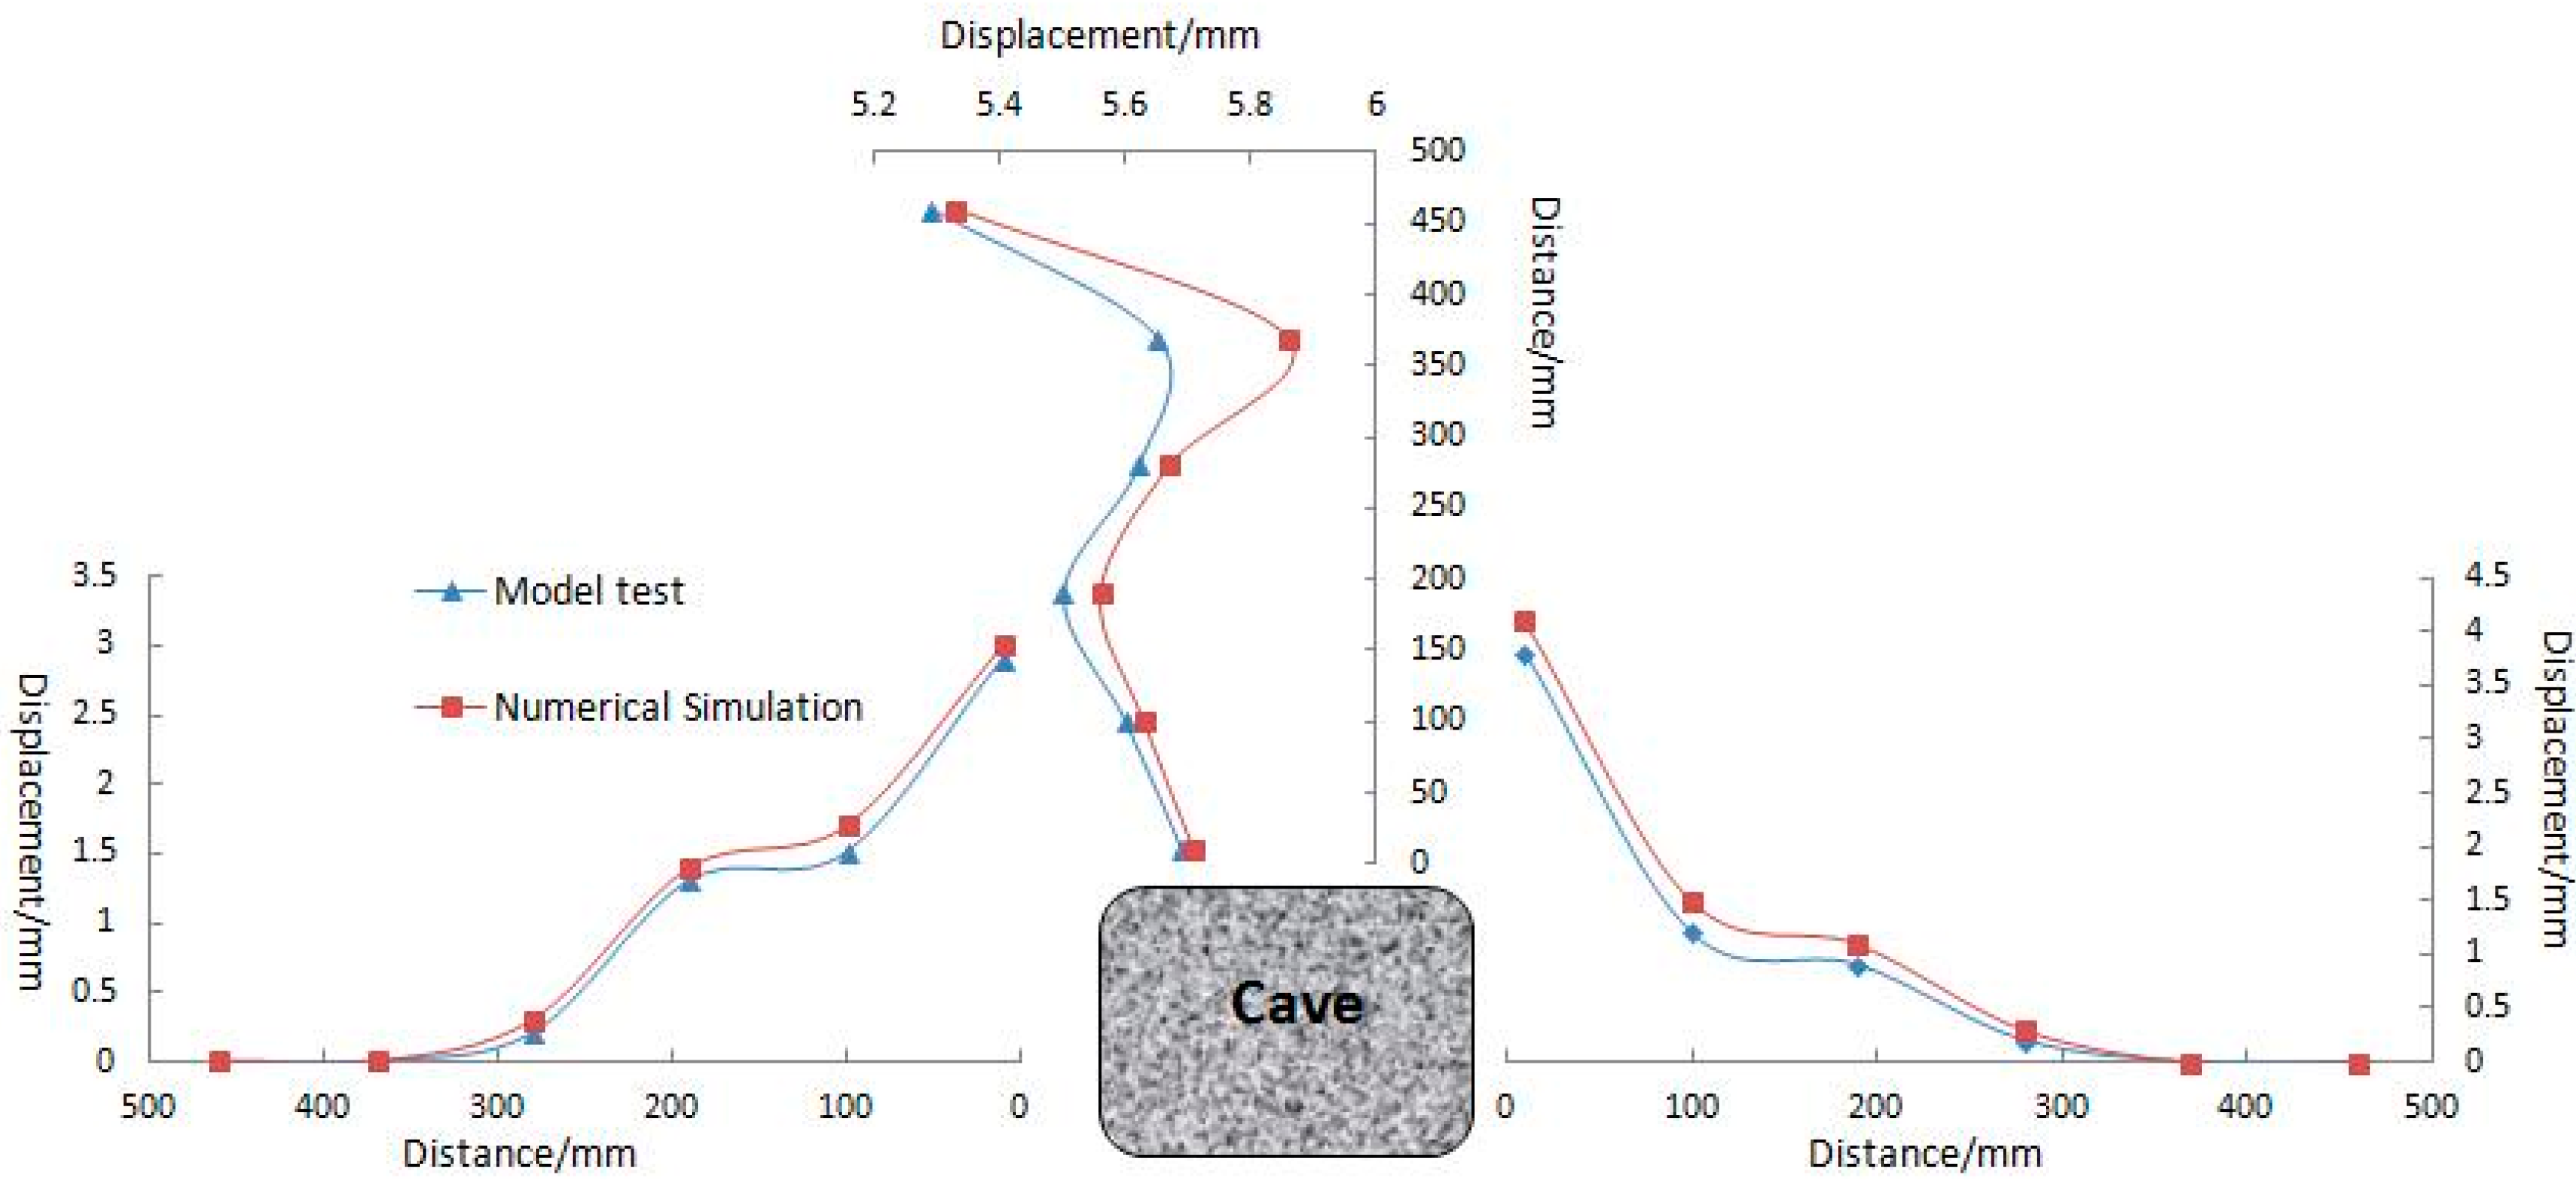
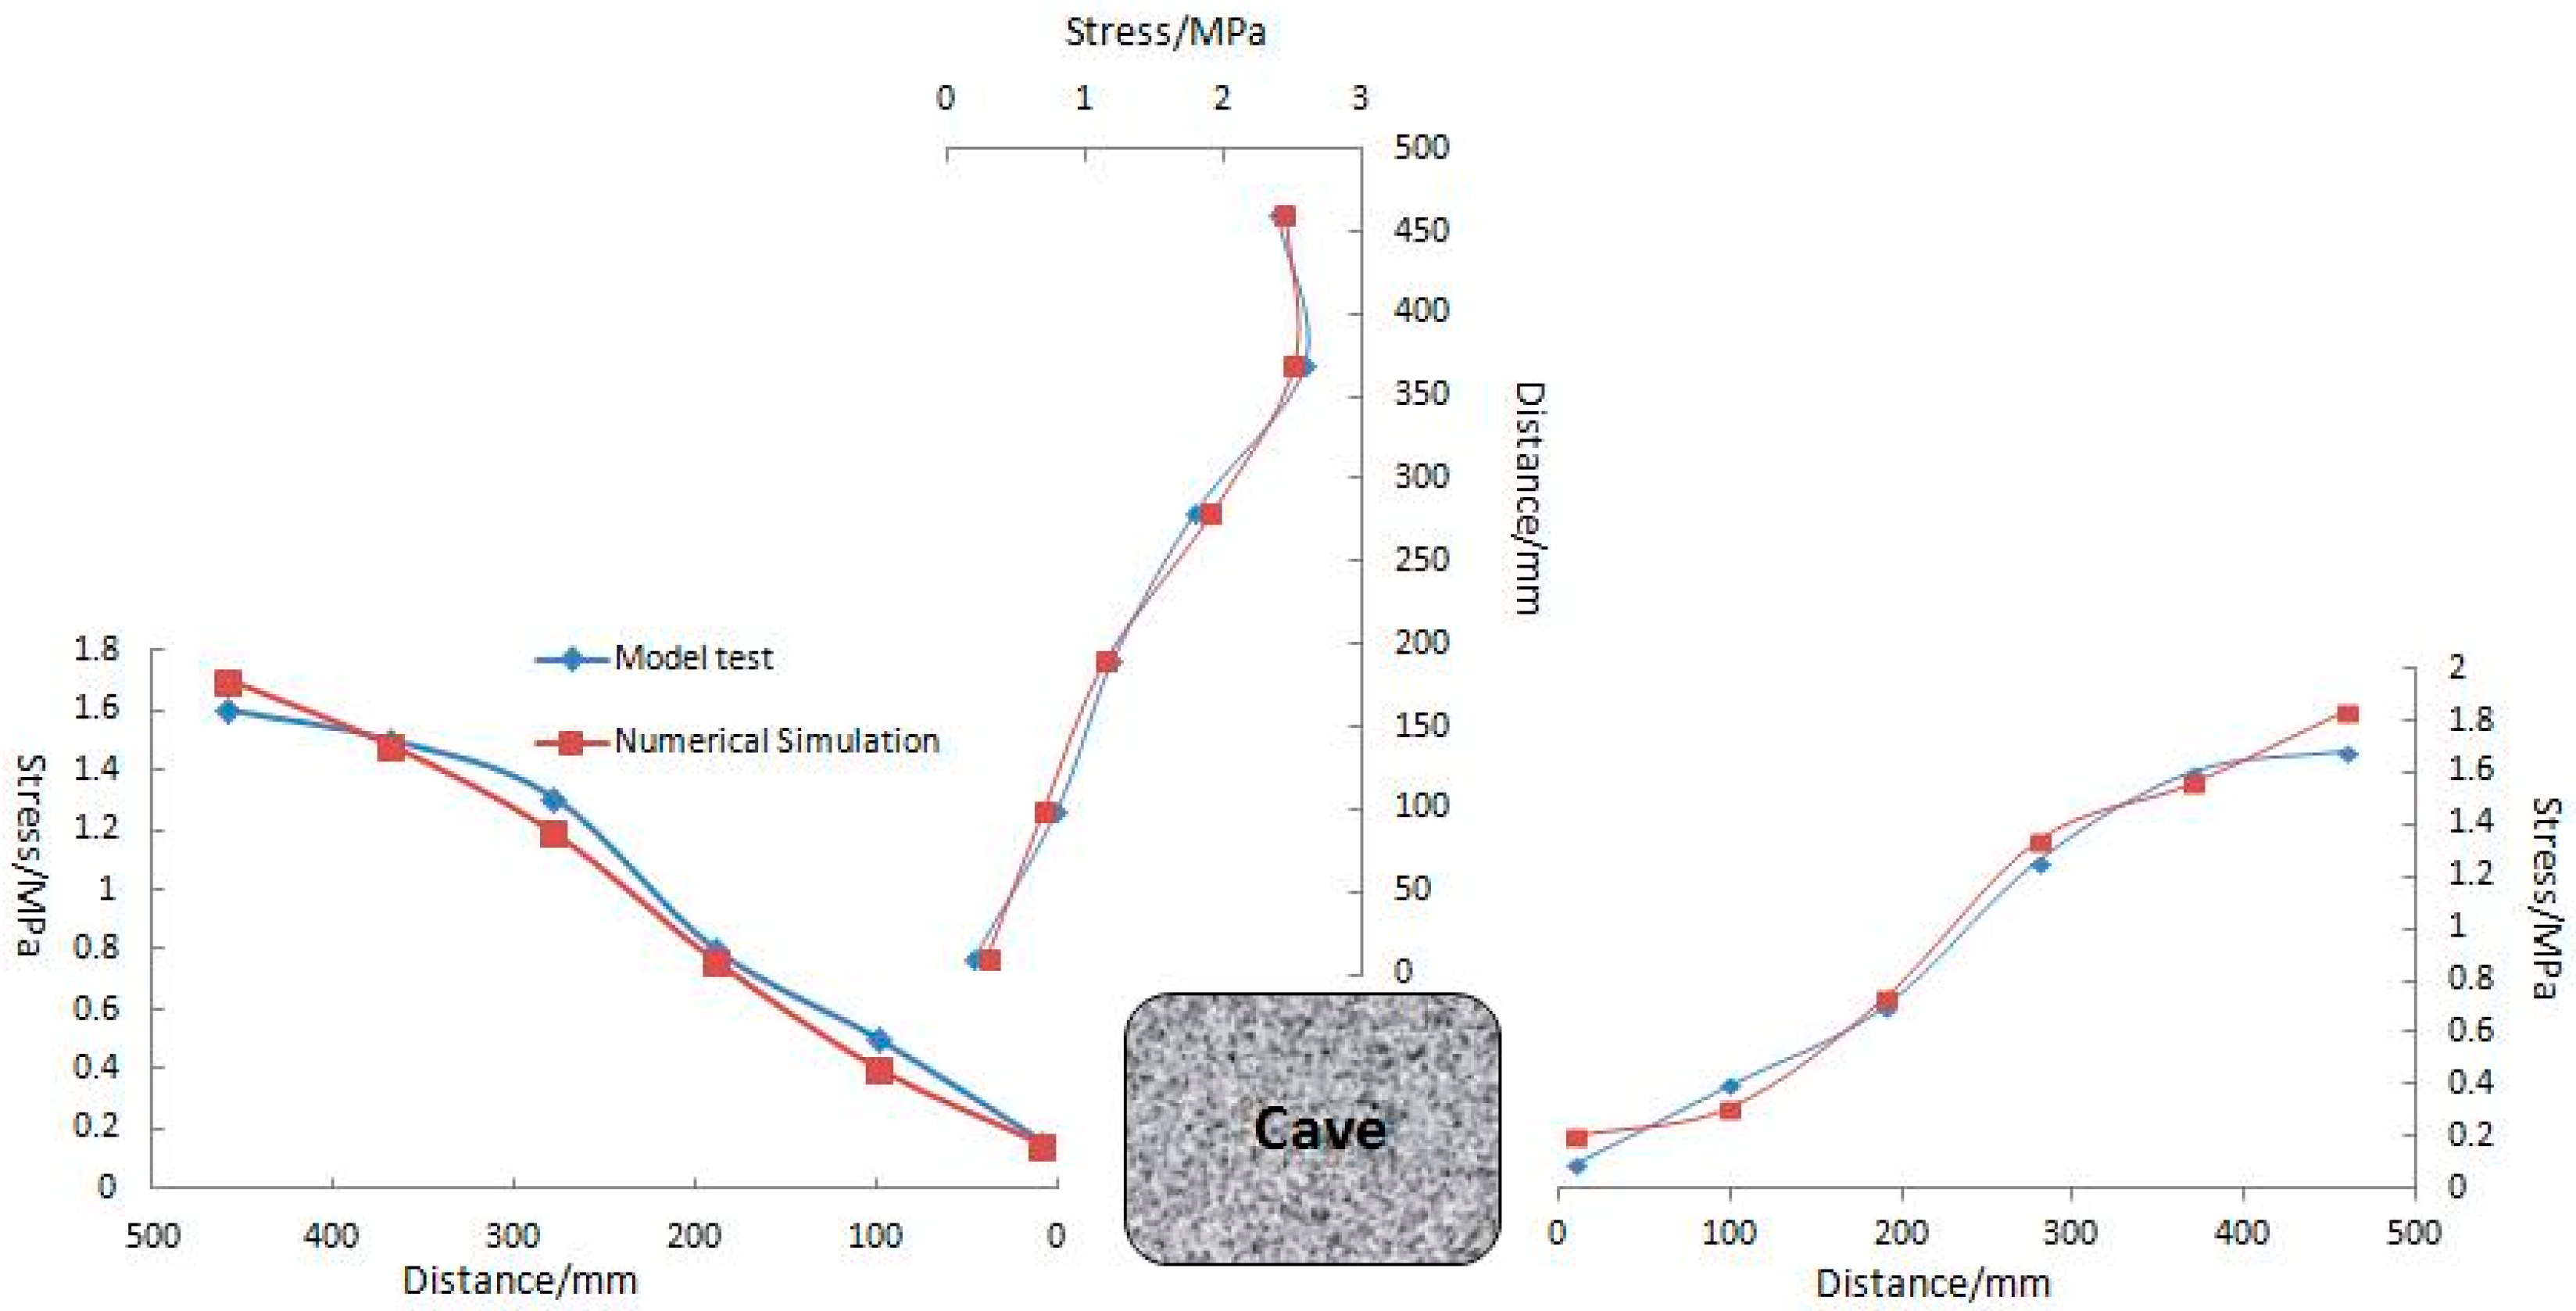
The displacement value around the model cavern is measured by the multi-point extensometer (see Table 4). The radical stress value around the model cavern is measured by the micro-pressure-cell (see Table 5).
The following results can be concluded from Table 4. The measure point displacement on the cave top is relatively large and rather uniform, which indicates that the cave roof moves down as a whole during the cavitation process. The measure point displacements on the left and right walls gradually decrease as their distance to the cave walls increases. The closest one to the wall has the relatively largest displacement, which indicates that the positions near the cave walls will be damaged most severely under the condition of deeply-buried high geo-stress. With the extension towards the outer cave, the displacement of the farthest measure point turns to zero. At this moment, the distance between the measure point and the cave walls is 46 mm, which indicates that this measure point is beyond the influence scope of the cave destruction. It can thus be seen that the influence scope of the cave failure and deformation is 2.3 times as large as the cave span. It can be seen from the analysis of Table 5 that the stress of the cave cycle measure point gradually decreases as the distance to the cave wall becomes larger. The result indicates that after the model cavitation is done, the stress of the model cave cycle will be released more severely as the distance to the cave wall decreases. The stress of the farthest measure point shows no change and its distance to the cave wall is 460 mm, which indicates that this measure point is beyond the influence scope of the cave destruction. It can thus be seen that the influence scope of the cave failure and deformation is 2.3 times as large as the cave span, which basically corresponded to the displacement variation law of the cave.
4. Numerical Analysis and Verification
4.1. Numeric Calculation Model
In order to verify the failure process in the model test, the collapse and failure process of the rectangle cave is calculated and analyzed by RFPA, which is a software to calculate and analyze the rock failure process based on the real failure analytical method and the finite element. One of RFPA’s advantages is the ability to solve discontinuous problems, such as the crack propagation and the huge deformation in engineering. RFPA can transfer the complicated nonlinear problem at the macro-level into a simple linear problem at the meso-level. Therefore, it is more efficient in solving discontinuous problems and is able to reflect the rock failure process more accurately. However, RFPA meets obstacles in solving sophisticated model problems, as it is a kind of simplified processing method.
With the assistance of RFPA based on the finite element method, two accomplishments should be pointed out in this thesis. First, the uniformity of material properties and the randomness of defects’ distribution are analyzed from the perspective of mesomechanics. Second, the numerical simulation of non-uniform materials failure process is eventually achieved with the help of the continuous medium method. To take the heterogeneous distribution of rock mechanical properties into account, Formula (1) is introduced in which m refers to the uniformity coefficient of the medium, and it reflects the uniformity degree of the materials.
This analytical method adopts the Mohr-Coulomb criterion containing tensile failure rules, which can be divided into the Maximum Tensile-Stress Criterion and the Mohr-Coulomb criterion. Its main function is to judge whether the element has met the tensile fracture criterion before judging this element as damaged or not. If not, it will continue working with the Mohr-Coulomb criterion. The expression of the tensile failure rule is as shown in Formula (2).
Therefore, with the assistance of RFPA, whole process of cave failure can be calculated and dynamically demonstrated with the above method. Figure 11 shows the numerical analysis model, as well as the boundary conditions of the cave. The additional stress caused by the overlying strata is replaced by the vertical stress P, which is the product of γ and H. γ refers to the average formation bulk density, and H refers to the actual buried depth of the cave. In this calculation, the roof thickness is 5 m, the cave span is 10 m and the mechanical parameters used in the calculation are shown in Table 1. The cave collapse process and the displacement around the cave as well as the stress variation are all obtained through the RFPA. Figure 11 is the numerical model and boundary conditions of the karst cave. Figure 12 is the process diagram of the model collapse.
4.2. Analysis of Calculation Results
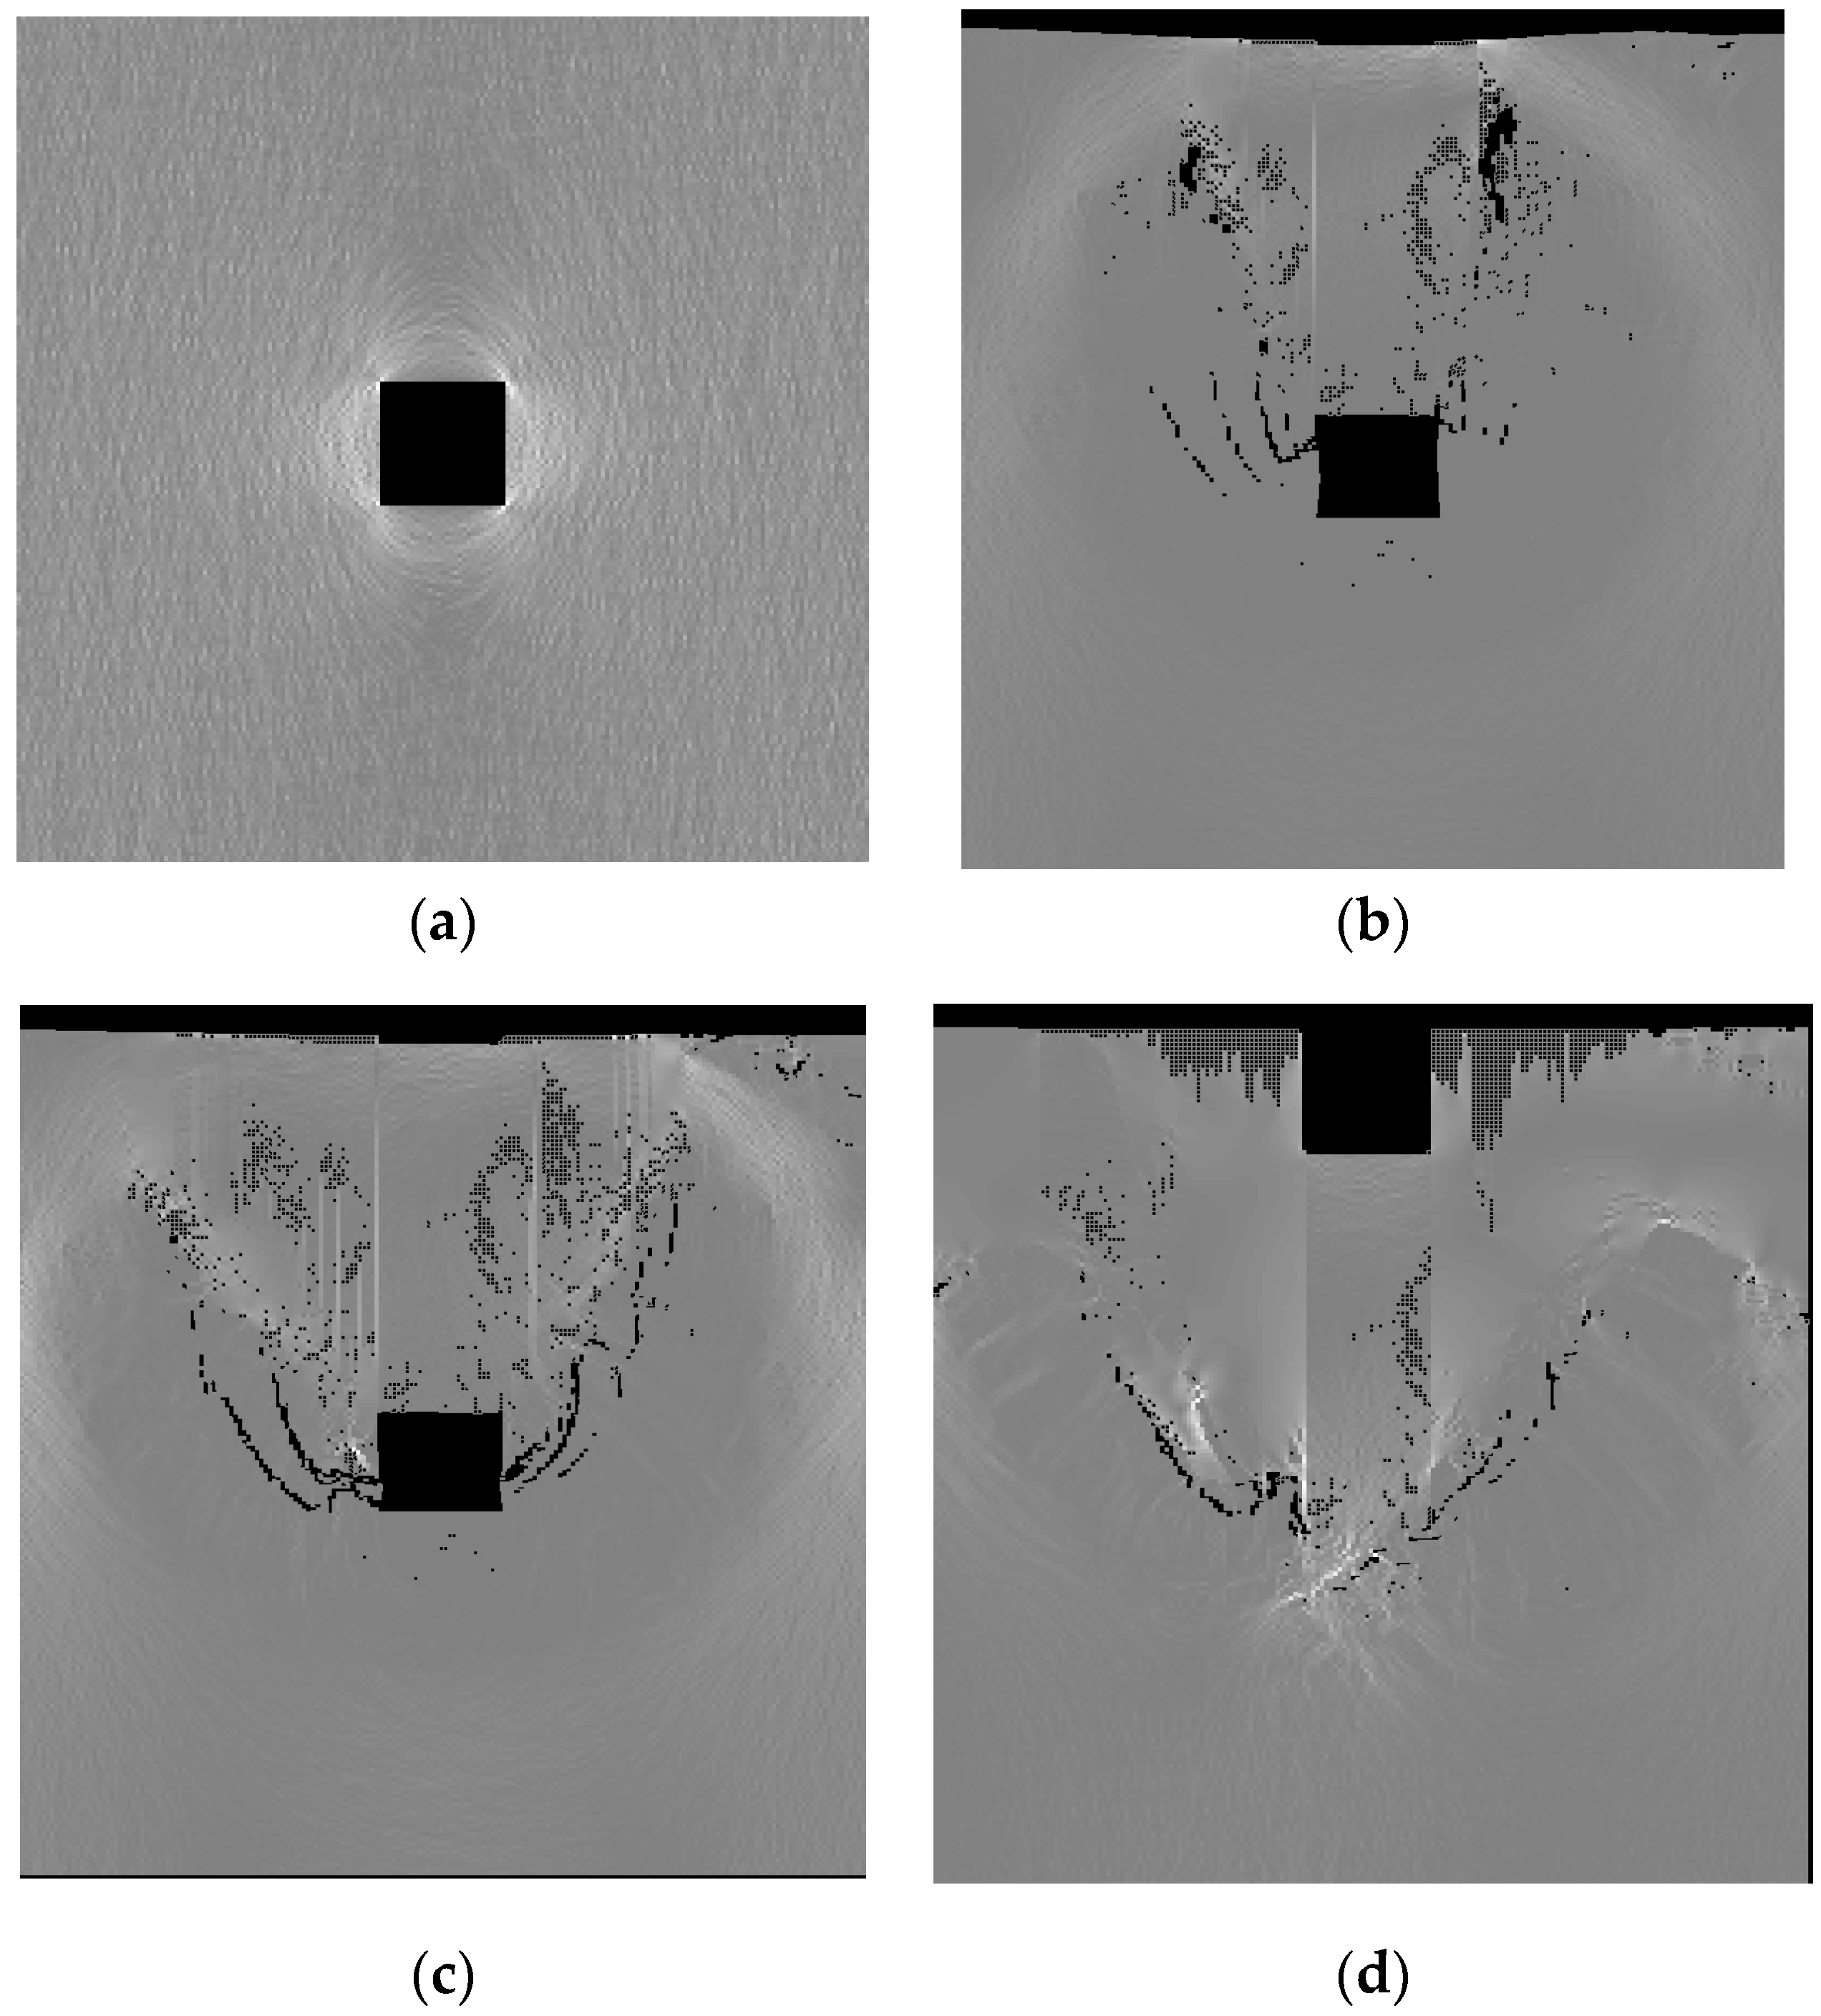
The RFPA can simulate the whole process well from the gradual failure of the roof to the final collapse. The stress concentration first appears around the cave, and then, the failure emerges on the roof. As the failure scope becomes larger, the roof eventually collapses, leading to the whole cave failure. The stress and displacement values around the model cavern are shown in Figure 13 and Figure 14.
It can be seen from the analysis of Figure 12 that during the cave collapse process, microfissures first emerged from both left and right walls and the roof keeps moving down constantly with failure. As time passes by, the microfissures gradually expand into several shear cracks along the left and right walls of the cave. Finally, under the high geo-stress the cave cracks expand upwards from the toe of side walls and turn into several shear cracks, leading to the collapse and failure of the whole cave. Tensile shear becomes the main failure mode of the cave here, and finally, the V-type tension and split rupture plane appears on lateral walls. The numerical calculation result basically corresponds to the model test result, which fully verifies the authenticity of the model test result. According to Figure 13 and Figure 14, the test values of displacement and stress around the cave are no different than the numerical calculation result and can well reflect their change law. Therefore, with the verification by the numerical calculation, the authenticity becomes more convictive, which provides a solid experimental basis for the future research of fractured-vuggy reservoir stability with a buried depth of more than 5000 m.
5. Conclusions
- The ultra-high pressure test equipment is developed, which can be used to carry out experimental research to study the collapse of the cave with a depth of more than 5000 m.
- Based on the theory of similarity, the model similar material which meets the similitude conditions with the prototype rock is developed in terms of the deformation characteristics as well as the strength failure characteristics. The mass ratio of iron powder, barite powder and quartz sand is 1:0.67:0.25. The concentration of rosin alcohol solution is 17%. The weight of rosin alcohol solution is 6% of the similar material total weight.
- The failure mechanism of the cave is determined through the model test and numerical calculations: the collapse process starts from the cracks emerging on left and right walls; then, the cracks run through the top, eventually causing the final collapse and failure. Shear failure is the primary failure mode, and the damage scope is 2.3 times as long as the cave span.
Acknowledgments
The research described in this paper was financially supported by the National major research and development program (No. 2016YFC0401804-03), the preliminary research project of the underground experimental project for the geological disposal of high-level radioactive waste (No. YK-KY-J-2015-25), the National Natural Science Foundation of China (No. 51279093) and Major national science and technology projects (No. 2011ZX05014).
Author Contributions
Chao Wang and Qiangyong Zhang conceived and designed the experiments; Chao Wang performed the experiments; Chao Wang and Qiangyong Zhang analyzed the data; Chao Wang and Wen Xiang wrote the paper.
Conflicts of Interest
The authors declare no conflict of interest.
References
- Huang, Z.Q.; Yao, J.; Wang, Y.Y. An efficient numerical model for immiscible two-Phase flow in fractured karst reservoirs. Commun. Comput. Phys. 2013, 13, 540–558. [Google Scholar] [CrossRef]
- Li, S.; Kang, Y.L.; Li, D.Q.; Lian, Z.H. Experimental and numerical investigation of multiscale fracture deformation in fractured–vuggy carbonate reservoirs. Arab. J. Sci. Eng. 2014, 39, 4241–4249. [Google Scholar] [CrossRef]
- Zhao, W.Z.; Shen, A.J.; Hu, S.Y.; Zhang, B.M; Pan, W.Q.; Zhou, J.G.; Wang, Z.C. Geological conditions and distributional features of large-scale carbonate reservoirs onshore China. Petrol. Explor. Dev. 2012, 39, 1–14. [Google Scholar] [CrossRef]
- Huang, Z.Q.; Yao, J.; Li, Y.J.; Wang, C.C.; Lv, X.R. Numerical calculation of equivalent permeability tensor for fractured vuggy porous media based on homogenization theory. Commun. Comput. Phys. 2011, 9, 180–204. [Google Scholar] [CrossRef]
- Xu, X.; Tian, S.S.; Xu, T.; Su, Y.X. The equivalent numerical simulation of fractured-vuggy carbonate reservoir. Appl. Mech. Mater. 2012, 110–116, 3327–3331. [Google Scholar] [CrossRef]
- Kang, Y.Z. Characteristics and distribution laws of paleokarst hydrocarbon reservoirs in palaeozoic carbonate formations in china. Nat. Gas Ind. 2008, 28, 1–12. [Google Scholar]
- Dong, Z.; Alfen, L.; Jun, Y. A single-phase fluid flow pattern in a kind of fractured-vuggy media. Pet. Sci. Technol. 2011, 29, 1030–1040. [Google Scholar] [CrossRef]
- Li, Y. The theory and method for development of carbonate fracture-cavity reservoirs in Tahe oilfield. Acta Pet. Sin. 2013, 34, 115–121. [Google Scholar]
- Zhou, H.; Wang, C.; Han, B; Duan, Z. A creep constitutive model for salt rock based on fractional derivatives. Int. J. Rock Mech. Min. Sci. 2011, 48, 116–121. [Google Scholar] [CrossRef]
- Nazary, M.S.; Nazokkar, K.; Chalaturnyk, R.J.; Mirzabozorg, H. Parametric assessment of salt cavern performance using a creep model describing dilatancy and failure. Int. J. Rock Mech. Min. Sci. 2015, 79, 250–267. [Google Scholar]
- Wang, T.; Yang, C.; Ma, H. Safety evaluation of salt cavern gas storage close to an old cavern. Int. J. Rock Mech. Min. Sci. 2016, 83, 95–106. [Google Scholar] [CrossRef]
- Duan, K.; Kwokc, C. Evolution of stress-induced borehole breakout in inherently anisotropic rock: Insights from discrete element modeling. J. Geophys. Res. Solid Earth 2016, 121, 2361–2381. [Google Scholar] [CrossRef]
- Wang, T.; Yang, C.; Shi, X. Failure analysis of thick interlayer from leaching of bedded salt caverns. Int. J. Rock Mech. Min. Sci. 2015, 73, 175–183. [Google Scholar] [CrossRef]
- Wang, G.; Guo, K.; Christianson, M.; Konietzky, H. Deformation characteristics of rock salt with mudstone interbeds surrounding gas and oil storage cavern. Int. J. Rock Mech. Min. Sci. 2011, 48, 871–877. [Google Scholar] [CrossRef]
- Ma, D.; Rezania, M.; Yu, H.S.; Bai, H.B. Variations of hydraulic properties of granular sandstones during water inrush: Effect of small particle migration. Eng. Geol. 2017, 217, 61–70. [Google Scholar] [CrossRef]
- Zhou, Z.; Cai, X.; Cao, W.; Li, X.; Xiong, C. Influence of water content on mechanical properties of rock in both saturation and drying processes. Rock Mech. Rock Eng. 2016, 49, 3009–3025. [Google Scholar] [CrossRef]
- Ma, D.; Li, Q.; Hall, M.R.; Wu, Y. Experimental investigation of stress rate and grain size on gas seepage characteristics of granular coal. Energies 2017, 10, 527. [Google Scholar] [CrossRef]
- Zhou, Z.; Cai, X.; Chen, L.; Cao, W.; Zhao, Y.; Xiong, C. Influence of cyclic wetting and drying on physical and dynamic compressive properties of sandstone. Eng. Geol. 2017, 220, 1–12. [Google Scholar] [CrossRef]
- Ma, D.; Miao, X.X.; Wu, Y.; Bai, H.B.; Wang, J.G.; Rezania, M.; Huang, Y.H.; Qian, H.W. Seepage properties of crushed coal particles. J. Pet. Sci. Eng. 2016, 146, 297–307. [Google Scholar]
- Zhang, Q.Y.; Duan, K.; Jiao, Y.Y.; Xiang, W. Physical model test and numerical simulation for the stability analysis of deep gas storage cavern group located in bedded rock salt formation. Int. J. Rock Mech. Min. Sci. 2017, 94, 43–54. [Google Scholar] [CrossRef]
- Zhang, Q.Y.; Zhang, X.T.; Wang, Z.C.; Xiang, W.; Xue, J.H. Failure mechanism and numerical simulation of zonal disintegration around a deep tunnel under high stress. Int. J. Rock Mech. Min. Sci. 2017, 93, 344–355. [Google Scholar] [CrossRef]
- Zhu, W.S.; Li, Y.; Li, S.C.; Wang, S.J.; Zhang, Q.B. Quasi-three-dimensional physical model tests on a cavern complex under high in-situ stresses. Int. J. Rock Mech. Min. Sci. 2011, 48, 199–209. [Google Scholar]
- Huang, F.; Zhu, H.; Xu, Q.; Cai, Y.; Zhuang, X. The effect of weak interlayer on the failure pattern of rock mass around tunnel-scaled model tests and numerical analysis. Tunn. Undergr. Space Technol. 2013, 35, 207–218. [Google Scholar] [CrossRef]
- Zhang, Q.B.; He, L.; Zhu, W.S. Displacement measurement techniques and numerical verification in 3D geomechanical model tests of an underground cavern group. Tunn. Undergr. Space Technol. 2016, 56, 54–64. [Google Scholar] [CrossRef]
- Liu, Y.; Guan, F.; Yang, Q.; Yang, R.; Zhou, W. Geomechanical model test for stability analysis of high arch dam based on small blocks masonry technique. Int. J. Rock Mech. Min. Sci. 2013, 61, 231–243. [Google Scholar] [CrossRef]
- Ghabraie, B.; Ren, G.; Zhang, X.; Smith, J. Physical modelling of subsidence from sequential extraction of partially overlapping longwall panels and study of substrata movement characteristics. Int. J. Coal Geol. 2015, 140, 71–83. [Google Scholar] [CrossRef]
- Fei, W.P.; Zhang, L.; Zhang, R.; Yang, R. Experimental study on a geo-mechanical model of a high arch dam. Int. J. Rock Mech. Min. Sci. 2010, 47, 299–306. [Google Scholar] [CrossRef]
Figure 1.
The ultra-high pressure intelligent control system for the 3D geo-mechanics model test system. (a) Ultra-high pressure Jack; (b) Jack layout; (c) High pressure equipment.
Figure 1.
The ultra-high pressure intelligent control system for the 3D geo-mechanics model test system. (a) Ultra-high pressure Jack; (b) Jack layout; (c) High pressure equipment.

Figure 2.
Component diagram of similar material.

Figure 3.
Model material specimen. (a) Uniaxial and triaxial specimen; (b) Brazilian splitting test specimen.
Figure 3.
Model material specimen. (a) Uniaxial and triaxial specimen; (b) Brazilian splitting test specimen.

Figure 4.
Test procedures. (a) The uniaxial compression test; (b) Brazilian splitting test; (c) The triaxial compression test.
Figure 4.
Test procedures. (a) The uniaxial compression test; (b) Brazilian splitting test; (c) The triaxial compression test.

Figure 5.
Uniaxial compression curves. (a) Similar material; (b) Prototype carbonate.
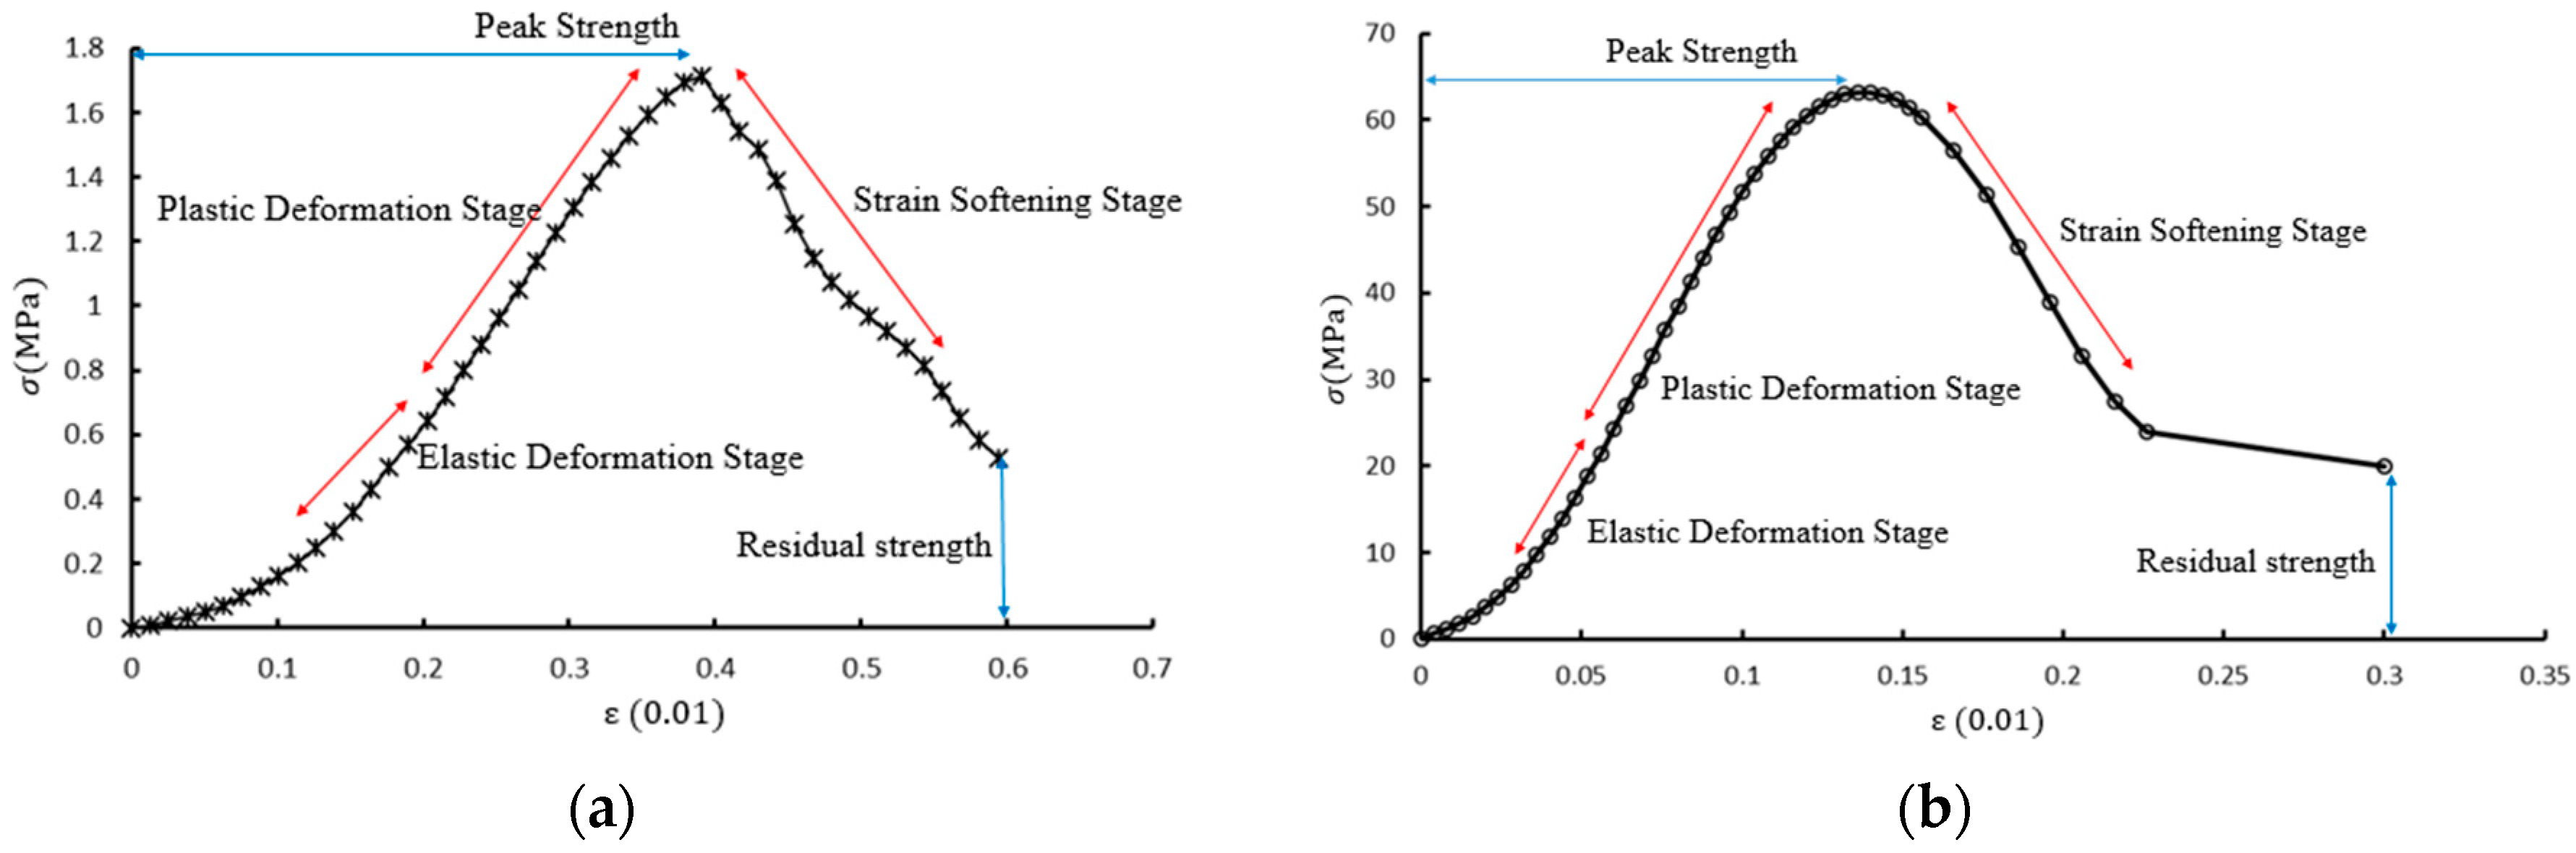
Figure 6.
The failure mode of the specimen. (a) The uniaxial compression failure mode of the prototype; (b) The uniaxial compression failure mode of similar material; (c) The triaxial compression failure mode of prototype; (d) The triaxial compression failure mode of the similar material.
Figure 6.
The failure mode of the specimen. (a) The uniaxial compression failure mode of the prototype; (b) The uniaxial compression failure mode of similar material; (c) The triaxial compression failure mode of prototype; (d) The triaxial compression failure mode of the similar material.

Figure 7.
Schematic diagram of the model (Unit: cm).

Figure 8.
The process photos of the model cave excavation. (a) Similar material preparation; (b) Padding; (c) Position-setting of test elements; (d) Burying multi-point extensometer; (e) Burying micro pressure-cell; (f) Layer-compacting.
Figure 8.
The process photos of the model cave excavation. (a) Similar material preparation; (b) Padding; (c) Position-setting of test elements; (d) Burying multi-point extensometer; (e) Burying micro pressure-cell; (f) Layer-compacting.
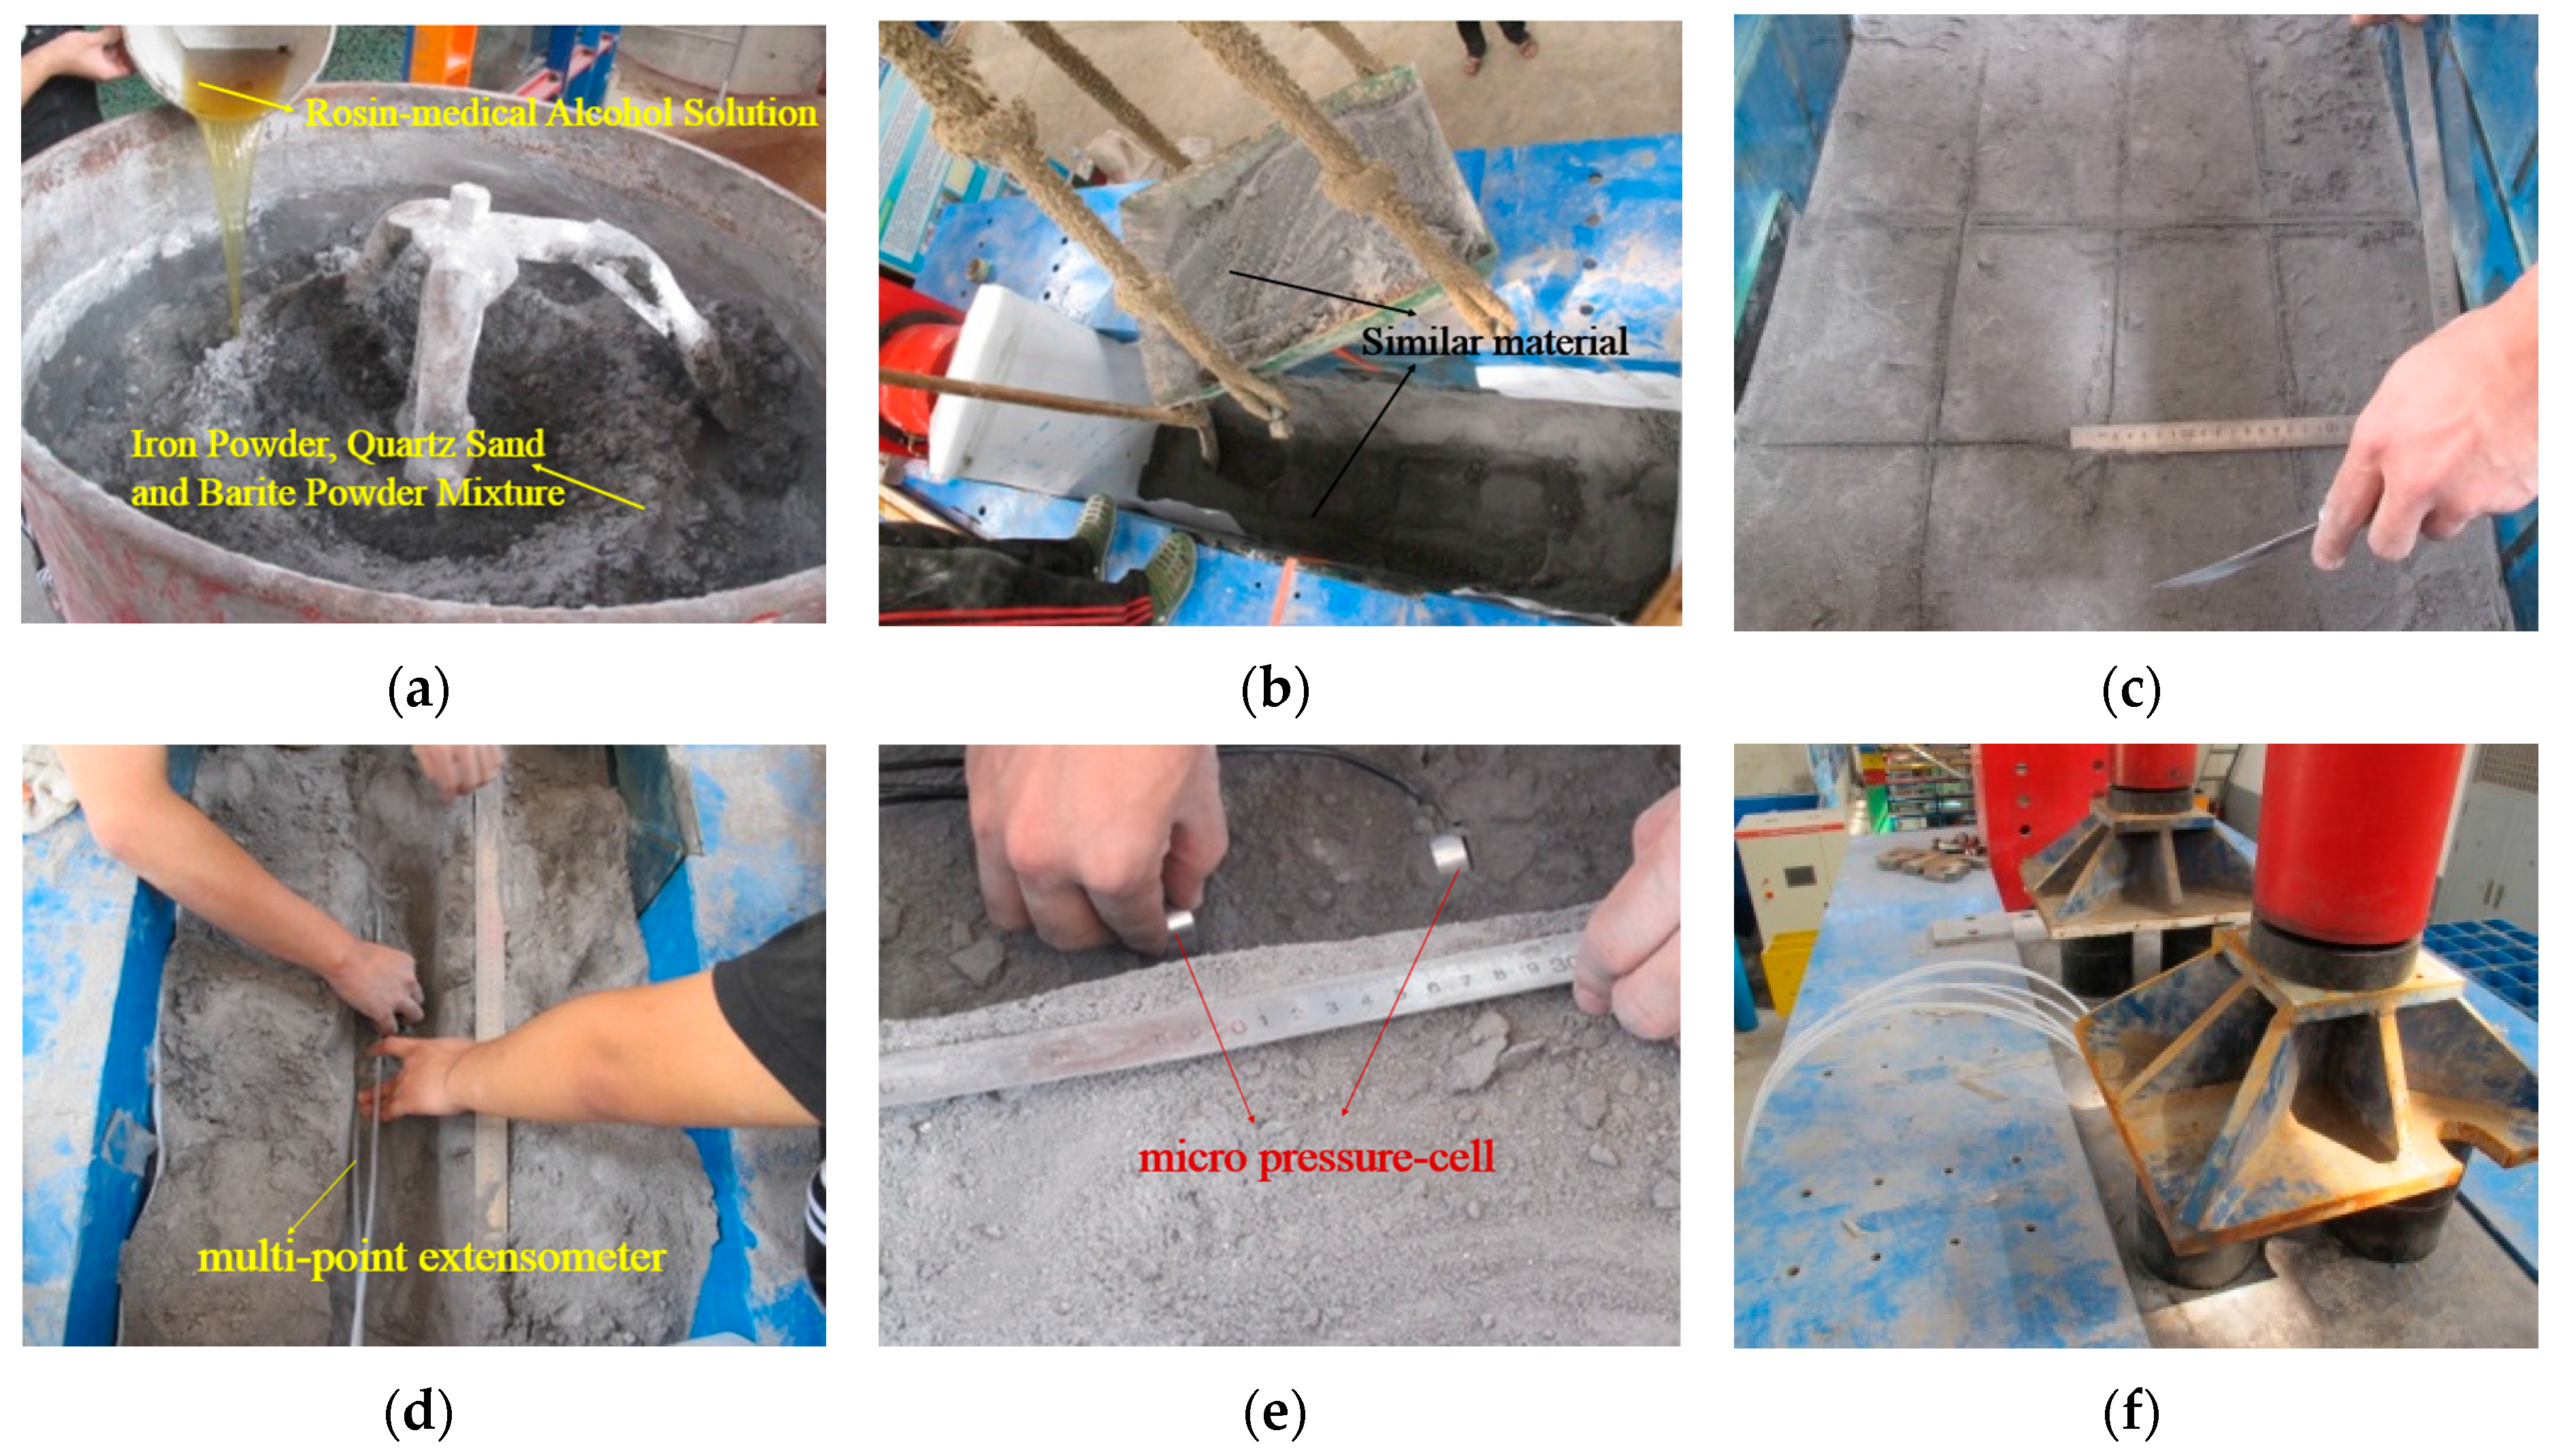
Figure 9.
Test procedure photos of the model.

Figure 10.
The collapse process of deep buried karst cave. (a) Cracks emerge on both side walls; (b) Cracks and collapses emerge on the right wall; (c) Cracks on the left wall expand; (d) Left wall collapses; (e) Cave roof collapses; (f) Overall state of cave collapse and failure.
Figure 10.
The collapse process of deep buried karst cave. (a) Cracks emerge on both side walls; (b) Cracks and collapses emerge on the right wall; (c) Cracks on the left wall expand; (d) Left wall collapses; (e) Cave roof collapses; (f) Overall state of cave collapse and failure.

Figure 11.
Numerical model and boundary conditions of the karst cave.
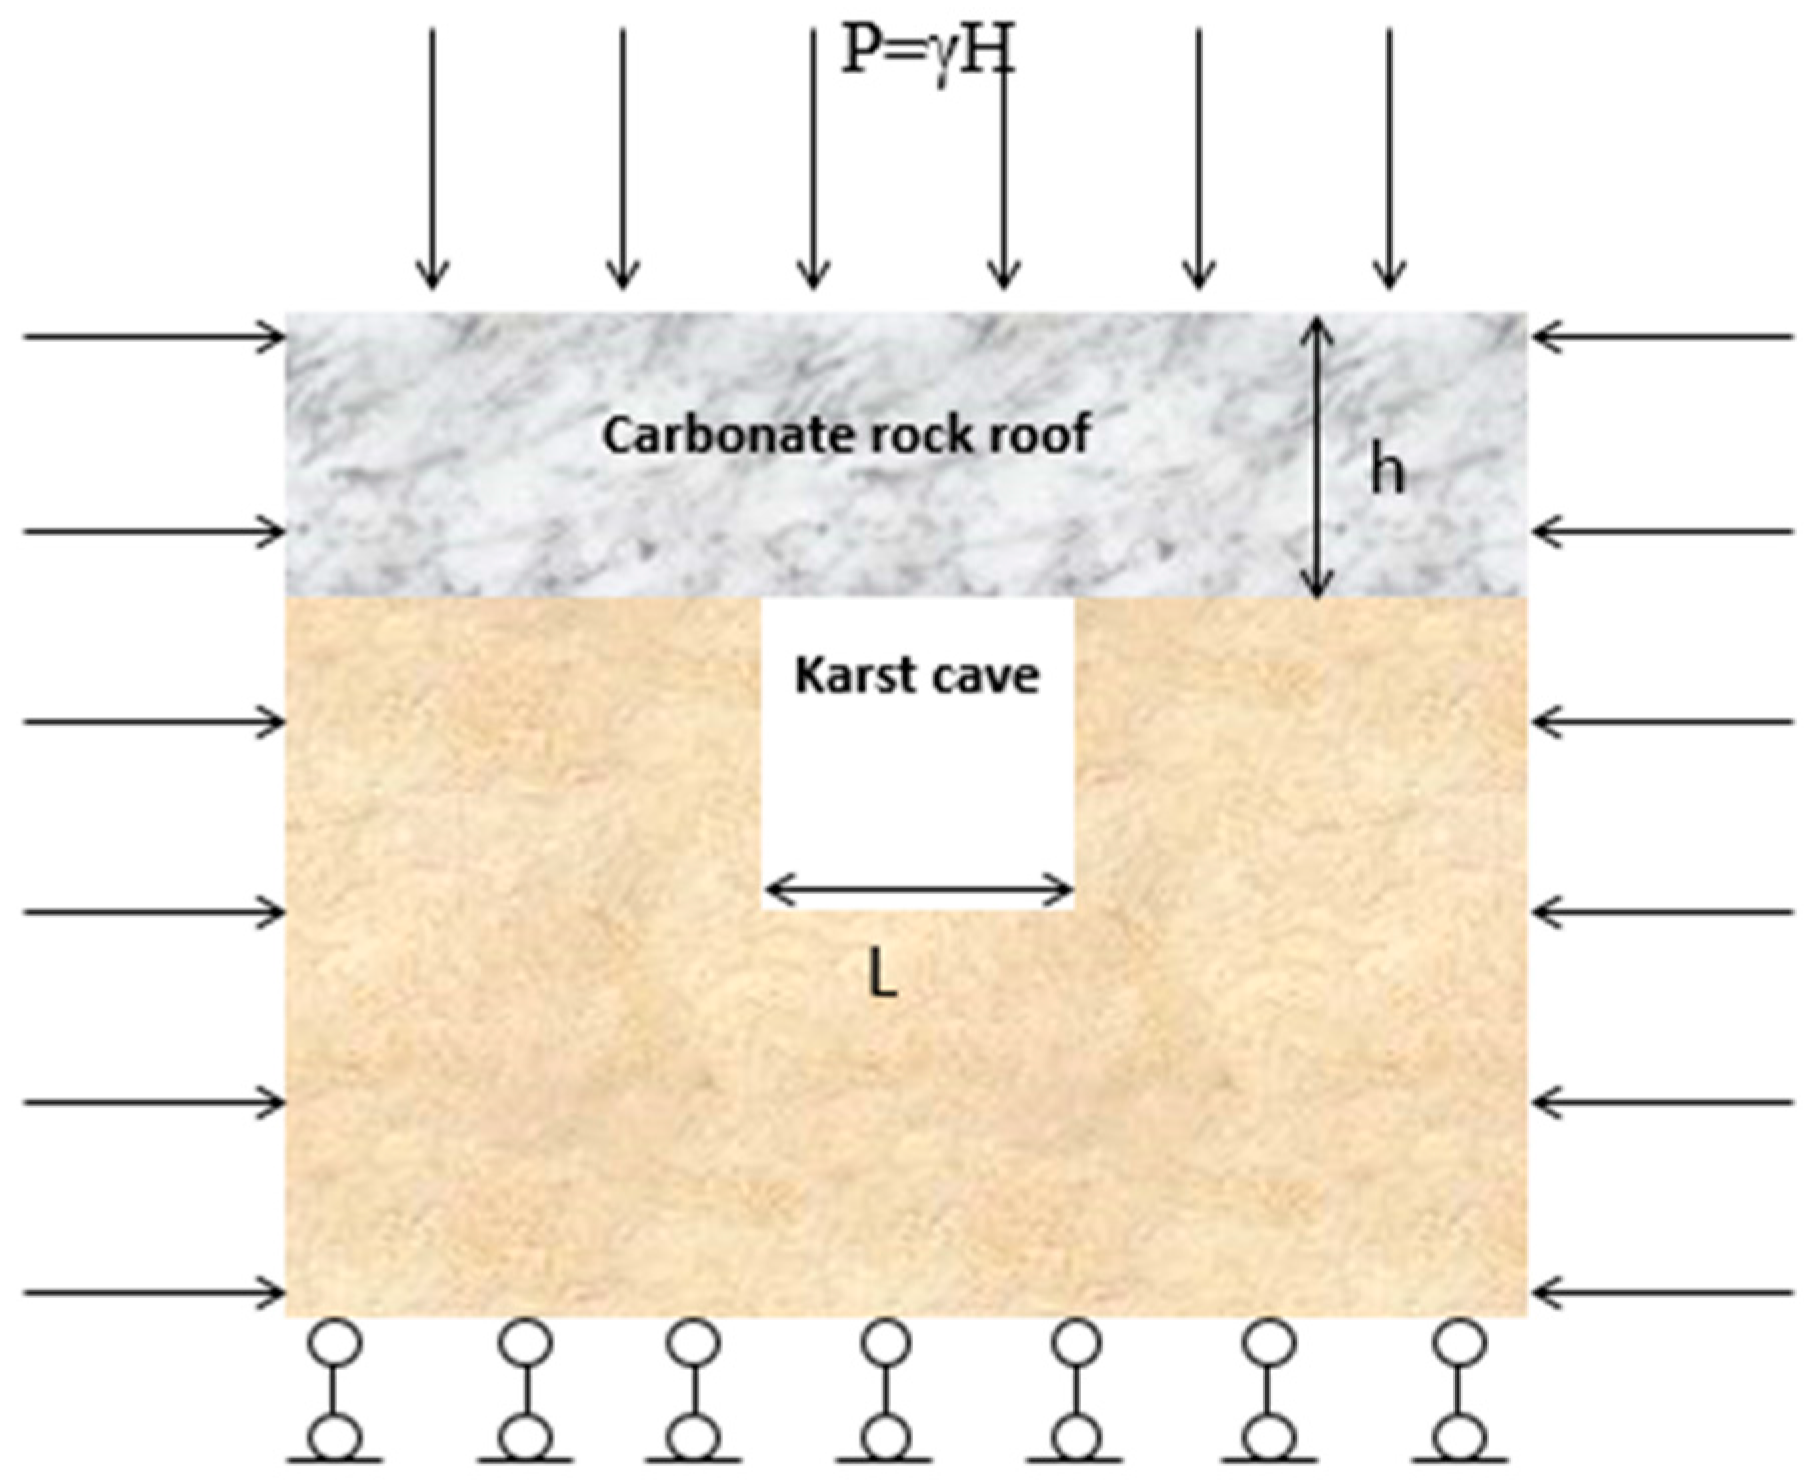
Figure 12.
Numerical calculation of the cave collapse process. (a) Stress concentration obviously appears around the cave; (b) Cracks appear on the left wall; (c) Cracks appear on the right wall; (d) Cave roof collapse.
Figure 12.
Numerical calculation of the cave collapse process. (a) Stress concentration obviously appears around the cave; (b) Cracks appear on the left wall; (c) Cracks appear on the right wall; (d) Cave roof collapse.

Figure 13.
Curve of the displacement around the cave.

Figure 14.
Curve of the stress around the cavern.


Table 1.
Physical and mechanical parameters of carbonate rock from the oil field.
| Bulk Density (KN/m3) | Poisson Ratio | Elasticity Modulus (MPa) | Compressive Strength (MPa) | Friction Angle (°) | Cohesive Stress (MPa) |
|---|---|---|---|---|---|
| 27 | 0.25 | 36,300 | 74.2 | 36.05 | 2 |
Table 2.
Physical and mechanical parameters of similar material.
| Bulk Density (KN/m3) | Poisson Ratio | Elasticity Modulus (MPa) | Compressive Strength (MPa) | Friction Angle (°) | Cohesive Stress (MPa) |
|---|---|---|---|---|---|
| 26.8–27.1 | 0.23–26 | 710–820 | 1.38–1.61 | 35.4–36.5 | 0.23–0.26 |
Table 3.
The material ratio of the similar material.
| I:B:S 1 | Rosin-Medical Alcohol Solution Concentration (%) | Percentage of the Rosin-Medical Alcohol Solution (%) |
|---|---|---|
| 1:0.67:0.25 | 17 | 6 |
1 I refers to the proportion of the refined iron powder; B refers to the proportion of the barite powder; S refers to the proportion of the quartz sand.
Table 4.
The displacement value around the model cavern.
| Measure point on the top | Distance to the top (mm) | 10 | 100 | 190 | 280 | 370 | 460 |
| Top replacement (mm) | 5.69 | 5.6 | 5.5 | 5.62 | 5.65 | 5.29 | |
| Measure point on the left wall | Distance to the left wall (mm) | 10 | 100 | 190 | 280 | 370 | 460 |
| left wall replacement (mm) | 3.8 | 1.2 | 0.9 | 0.2 | 0 | 0 | |
| Measure point on the right wall | Distance to the right wall (mm) | 10 | 100 | 190 | 280 | 370 | 460 |
| right wall replacement (mm) | 2.9 | 1.5 | 1.3 | 0.1 | 0 | 0 |
Table 5.
Radial stress value around the model cavern.
| Measure point on the top | Distance to the top (mm) | 10 | 100 | 190 | 280 | 370 | 460 |
| Top stress (MPa) | 0.2 | 0.8 | 1.2 | 1.8 | 2.6 | 2.4 | |
| Measure point on the left wall | Distance to the left wall (mm) | 10 | 100 | 190 | 280 | 370 | 460 |
| left wall stress (MPa) | 0.16 | 0.5 | 0.8 | 1.31 | 1.5 | 1.6 | |
| Measure point on the right wall | Distance to the right wall (mm) | 10 | 100 | 190 | 280 | 370 | 460 |
| right wall stress (MPa) | 0.1 | 0.4 | 0.7 | 1.26 | 1.6 | 1.68 |
© 2017 by the authors. Licensee MDPI, Basel, Switzerland. This article is an open access article distributed under the terms and conditions of the Creative Commons Attribution (CC BY) license (http://creativecommons.org/licenses/by/4.0/).
Share and Cite
MDPI and ACS Style
Wang, C.; Zhang, Q.; Xiang, W. Physical and Numerical Modeling of the Stability of Deep Caverns in Tahe Oil Field in China. Energies 2017, 10, 769. https://doi.org/10.3390/en10060769
AMA Style
Wang C, Zhang Q, Xiang W. Physical and Numerical Modeling of the Stability of Deep Caverns in Tahe Oil Field in China. Energies. 2017; 10(6):769. https://doi.org/10.3390/en10060769
Chicago/Turabian StyleWang, Chao, Qiangyong Zhang, and Wen Xiang. 2017. "Physical and Numerical Modeling of the Stability of Deep Caverns in Tahe Oil Field in China" Energies 10, no. 6: 769. https://doi.org/10.3390/en10060769
Note that from the first issue of 2016, this journal uses article numbers instead of page numbers. See further details here.