Article

Policy and Environmental Implications of Photovoltaic Systems in Farming in Southeast Spain: Can Greenhouses Reduce the Greenhouse Effect?

by
Angel Carreño-Ortega
1,*,
Emilio Galdeano-Gómez
2,
Juan Carlos Pérez-Mesa
2 and
María Del Carmen Galera-Quiles
3
1
Department of Engineering, Escuela Superior de Ingeniería, Agrifood Campus of International Excellence (CeiA3), University of Almería, Ctra. Sacramento s/n, 04120 Almería, Spain
2
Department of Economic and Business, Agrifood Campus of International Excellence (CeiA3), University of Almería, Ctra. Sacramento s/n, 04120 Almería, Spain
3
TECNOVA Foundation, Almería 04131, Spain
*
Author to whom correspondence should be addressed.
Energies 2017, 10(6), 761; https://doi.org/10.3390/en10060761
Submission received: 21 January 2017 / Revised: 5 May 2017 / Accepted: 25 May 2017 / Published: 31 May 2017

Abstract

:
Solar photovoltaic (PV) systems have grown in popularity in the farming sector, primarily because land area and farm structures themselves, such as greenhouses, can be exploited for this purpose, and, moreover, because farms tend to be located in rural areas far from energy production plants. In Spain, despite being a country with enormous potential for this renewable energy source, little is being done to exploit it, and policies of recent years have even restricted its implementation. These factors constitute an obstacle, both for achieving environmental commitments and for socioeconomic development. This study proposes the installation of PV systems on greenhouses in southeast Spain, the location with the highest concentration of greenhouses in Europe. Following a sensitivity analysis, it is estimated that the utilization of this technology in the self-consumption scenario at farm level produces increased profitability for farms, which can range from 0.88% (worst scenario) to 52.78% (most favorable scenario). Regarding the Spanish environmental policy, the results obtained demonstrate that the impact of applying this technology mounted on greenhouses would bring the country 38% closer to reaching the 2030 greenhouse gas (GHG) target. Furthermore, it would make it possible to nearly achieve the official commitment of 20% renewable energies by 2020. Additionally, it would have considerable effects on the regional socioeconomy, with increases in job creation and contribution to gross domestic product (GDP)/R&D (Research and Development), allowing greater profitability in agrifood activities throughout the entire region.

1. Introduction

The development of renewable energy sources and the substitution of conventional energies have become prime objectives in many countries [1]. The reduction of pollutants and the availability of localized energy, which is often cheaper, constitute the key advantages of committing to investments in renewables in specific regions. One such energy source is photovoltaic (PV) energy, which is used in areas that receive considerable sunlight, a climate condition which considerably favors other sectors such as tourism and agriculture [2,3].
Regarding agriculture, several authors have proposed combining energy production using solar panels with food crops on the same land unit [4], and also optimizing economic productivity of the agrivoltaic systems themselves [5]. Only a few recent studies have shown interest in implementing PV systems in the farming sector [6,7,8,9,10,11]. This lack of popularity is quite often due to the existence of traditional economic and technical barriers, in addition to widespread skepticism towards new technologies, especially when dealing with small-scale farmers [12,13]. However, at present, the aforementioned obstacles do not prove to be so evident from a technical and competitive point of view [14], nor for individual farmers, e.g., via cooperatives, and there are quite often changes in attitude among growers with respect to environmental concerns [2]. This new promising context has been observed in several studies for Spain [3], but one predominant characteristic in this case is that, perhaps paradoxically, one of the main barriers lies in policy and legislation.
Spain is one of the countries that has made the greatest advances in the use of renewable energies in recent decades. Such energy sources represent over 42% of the country’s current electrical supply. However, the last regulations truly attempting to boost renewables came in 2007 with the Royal Decree-Law 661/2007. Furthermore, there has been a visible stagnation in terms of policies promoting this type of energy, particularly since 2010, which coincided with the economic recession which is still ongoing. In addition, recent regulations demonstrate the obstacles facing future development of these types of energies, specifically Royal Decree-Law 24/2013 for the Electrical Sector and all those that followed. In conjunction with this political change, external pressure from large electric companies in the country is patent, with considerable investments in conventional energy still being made and substantial government aid for infrastructure of the electric network. Consequently, this has caused a continuous price increase over the last several years which consumers have had to bear. In addition, these new regulations could influence Spain’s achievement of its renewable energies objective for 2020 and the reduction of greenhouse gases (GHGs) by 2030 according the European Union (EU) policy framework for climate and energy [15].
Notwithstanding these previously-cited impediments, solar energy-based sources offer important potential, especially in the Mediterranean region of Spain [3]. By combining this simple fact with the knowledge that new, more cost-effective technologies exist, as is the case with photovoltaic plastic [14], it becomes quite clear that the expansion of this type of energy is imminent.
In the southeast of Spain, particularly coastal areas in the provinces of Almeria, Granada, Malaga and Murcia, horticultural farming in greenhouses has been in practice since the late-1950s. These farming areas are comprised of small family farms (around 19,000), each with an average size of 2 hectares, and have a combined surface area of 41,092 ha [16,17]. This system has led the region to specialize in agrifood production of various crops (mainly tomato, pepper, cucumber, eggplant, zucchini, melon and watermelon), accounting for 24% of the gross domestic product (GDP) and 28% of employment. This structure has had an impact on the distribution of income among family-run farms on a regional basis. It has also greatly influenced the activities from numerous sectors that are either directly or indirectly related to agriculture, primarily secondary and industrial services. Moreover, many consumers in the region could take advantage of this energy, considering the relatively reasonable investment costs with respect to other European countries [18]. Furthermore, this energy would have major environmental impacts as it would shape the country’s future energy policies, not to mention its positive effects on both local and regional development. As for this last point, the socioeconomic benefits must be considered as they provide added value to the farming sector, promoting the creation of jobs, and, more importantly, producing a significantly more balanced distribution of generated income, not to mention creating an energy source near points of consumption.
Studies in this line have been conducted in an international context. Some examples include research on maximizing the use of greenhouse structures and obtaining renewable energies using cogeneration of CO2 in the cases of Holland [19] and Canada [20], and PV technology in the cases of Italy [21] and Spain [14,22]. Nevertheless, there have still not been any studies in Spain focused on the environmental and socio-economic implications that the production of PV energy could have in this sector from macro and microeconomic perspectives.
The objectives of this study are: (a) to review the current policies on renewable energies in Spain and evaluate the current context surrounding photovoltaic energy; and (b) to analyze the effects that exploiting photovoltaic potential entails in greenhouse farming in southeast Spain. To do so, the methodology followed is a sensitivity analysis, which allows the development of several cost–benefit scenarios approach applied at farm level and to analyze environmental and socioeconomic impacts on a regional and national scale.

1.1. PV Greenhouses

Although the idea of applying PV panels to agricultural production has been studied since 1982 [4], specific works on the use of such panels with greenhouses are much more recent. In these systems, solar panels are mounted on greenhouse rooftops and are connected by cables to an inverter, which allows energy to be fed into the grid [23] or to be instantly consumed by the farm itself. Another system variation consists of installing batteries or accumulators that make it possible to use stored energy as it is needed.
Some of the main advantages worth mentioning include grower savings in energy costs and the environmental benefits offered by a renewable energy source in terms of its reduction of CO2 emissions. The current energy consumption of the greenhouses in southeast Spain is 13,986 kWh per hectare and year [24], and the current emissions produced by this sector would disappear if solar energy was used.
Regarding the environmental benefits of the greenhouses, some works exist [25] which demonstrate that greenhouses in Almería (with low energy consumption) display an efficient use of resources and obtain a favorable ecological footprint, especially in terms of water usage. Another benefit presented in the literature is the albedo effect of the greenhouses towards reducing global warming. In contrast, there are no publications which analyze the reduction of CO2 emissions through the utilization of PV greenhouses, an aspect that will be addressed in the present work.
Additionally, energy production on greenhouse rooftops does not require any ground space as it is the greenhouse itself that occupies farmland. This differentiates such systems from traditional solar power plants dedicated exclusively to producing energy and which must invest in the purchase or leasing of land for their facilities. In contrast, PV greenhouses are able to eliminate this investment.
The solar energy produced by greenhouses can be used in a vast range of ways. Some examples include supplying power for the operation of climate control systems, artificial lighting, refrigeration and heating, activation of motors and electrovalves, among others [26,27,28,29,30]. In addition to purely agricultural applications, the use of solar panels to produce energy for sale would diversify grower income and thereby improve both the rural economy and access to electric energy in rural areas. In turn, it would help to reduce dependence on fossil fuels and decrease CO2 emissions [31,32]. Furthermore, an additional benefit lies in the fact that this energy production system does not require any ground space as it is the greenhouse itself that occupies land.
On the other hand, the primary disadvantage of using PV panels on greenhouses is that they project shadows over the crops, thereby reducing solar radiation inside the greenhouse that could affect productivity. Therefore, photovoltaic greenhouses must only shade a percentage of the roof surface so as to optimize economic productivity.
Apart from the works cited in previous paragraphs, few other studies exist on this subject. The first of these studies, in 2009 [33], conducted research with a PV greenhouse that was utilized as a banana drying shed. In the same year [34] a work was published that developed a mathematical model to study the effectiveness of a heat exchanger in a greenhouse. Also in 2009 [35], the idea was set forth to install solar panels on greenhouses as a way of producing more energy.
Later, in 2010 [36], several authors published a study on a solar photovoltaic–electrolyzer–fuel cell hybrid power system integrated with a floriculture greenhouse. That same year [37] various authors conducted research on the shade produced by a photovoltaic greenhouse system. The following year, in 2011 [38], a number of authors concluded that the use of PV greenhouses with tomato crops in regions with high radiation, such as the southeast of Spain, would not decrease production as long as the shade percentage did not surpass 9.8%.
In 2012 [39], several authors confirmed the influence of shade produced in a PV greenhouse on the growth of Welsh onions (Allium fistulosum L.). That same year [14] various authors modeled a photovoltaic greenhouse system. Also in 2012 [40], a greenhouse was tested which featured photovoltaic, transparent, translucent and colored panels in order to determine which of these was ideal for plant growth. Again in the same year [41], a number of authors analyzed whether installing a photovoltaic greenhouse was indeed a positive investment opportunity or if it was even viable. Finally, in 2015 [42] various authors studied two different types of glass greenhouses (Venlo and asymmetrical) with the goal of modeling microclimate.

1.2. Normative Context and Photovoltaic Energy Policy in Spain

In the last decade, Spain was one of the countries that most actively promoted the generation of electricity using renewable energy sources (Figure 1). This positioned the country, in 2008 and 2009, as first in thermosolar capacity in the world (as well as fourth in wind power) and one of the foremost producers of PV energy [1]. During this time, the expansion of these technologies was propelled by rather favorable regulations (e.g., Royal Decree-Law 661/2007), that included a series of subsidies for investments and a system for sale price stability. However, government budget deficits, along with the deficit of the electric sector, brought about a progressive reversal of these types of policies that had once been the driving forces behind renewable energies (Figure 2).
This change in policy can be observed in terms of the budget cuts made to subsidies as of 2010. With the introduction of Royal Decree-Law 1/2012, restrictive measures were implemented which included the reduction of hours that photovoltaic solar systems could function, the end of sale of energy produced at a market pool price plus interest, and a considerable decrease in incentives for the construction of new production installations. Subsequently, following Royal Decree-Law 24/2013 of the Electricity Sector and Royal Decree-Law 413/2014, which regulates energy production from renewable sources, an even more radical change took place, making it tremendously difficult to maintain the profitability of PV systems and all other renewables. Although this legislation deals with so-called “reasonable profitability”, particularly for systems installed prior to these regulations, it eliminates compensation for investments, reduces production time, and places limits on electricity sale prices by applying highly restrictive bands and coefficients to rises and falls depending on market prices.
Currently, Royal Decree-Law 900/2015 regulates self-consumption electrical systems and the production of renewable energy. This regulation, which has colloquially been dubbed “the Sun Tax”, establishes a series of additional costs for both self-consumption systems and for surplus production. These taxes, or so-called “tolls”, require installers to make payments to maintain their connection to the electric grid. And, although a gradual reduction of these tolls is being considered for small-scale self-consumption systems until 2021, there is currently (2016 to 2018) a cost overrun linked to these taxes which must be paid by those who invest in renewable energies. See Table A1 in Appendix A.
In the European context, the use of renewable energies has been considered, for some time, to be a key element for achieving energy efficiency, and thereby securing a reduction of environmental pollution. This is specifically established by Directive 2009/28/CE. However, this is absolutely not the case for Spanish policy. More recently, another essential part of the EU framework on environmental actions is the “Policy Framework for Climate and Energy in the period from 2020 to 2030” established by the European Council [15]. This agreement should be fully in force the entire EU by 2021, and its objectives include:
(1)
A 40% reduction of GHGs by 2030, with respect to the values of 1990.
(2)
The share of renewable energy in the total consumption in 2030 should be at least 27% (again, compared to 1990 values).
In this regard, the Spanish government has made a commitment to ensuring that 20% of total energy consumption comes from renewables by the year 2020 [44,45]. Nevertheless, no changes have been observed in Spanish energy regulations so far.
One of the political arguments for not investing in renewable energies in recent years is linked to the deficit of the general electric grid. This deficit is estimated at €25 billion, and it is the large national electric companies that, in theory, bear this burden, alleging that it is a matter of investments costs made in the electric grid that have yet to be recovered. However, no audit of these figures has been conducted so far and this argument has been impeding the entrance of any new operators into the system, particularly those using renewable energies [46,47].
A second argument concerns investment costs, and the fact that considerable budget aid would be needed from the government. This notion is gravely mistaken according to the estimates of the Photovoltaic Electricity Cost Maps of European Commission [18], bearing in mind also, that in the case of photovoltaics, technology costs have decreased by 75% in recent years.
In addition, it is indicated that Spain’s energy production capacity has surpassed its domestic demand and in recent years (since 2007, specifically) the Spanish electric system has become a net energy exporter. However, it is observed that the price of electricity charged to consumers has not ceased to rise during this time, increasing 67% from 1995 to 2015. This context makes Spain one of the countries with the highest electricity costs (EUR/kWh) in the EU [18]. Moreover, energy imports, despite remaining at lower levels than in the past, have continued to maintain a considerable volume. These imports come predominantly from neighboring countries like France, mainly in the form of nuclear energy (7.029 GWh imported in 2015). It is also predicted that domestic demand will begin to rise again in the years to come, once the economic recession has been overcome and the GDP starts to increase, based on the fact that there is an elasticity relationship > 1 with energy demand [46].

2. Materials and Methods

This work seeks to develop a model that makes it possible to predict whether the utilization of solar panels on greenhouses is economically viable. Subsequently, this model would allow us to analyze various scenarios.
Another goal is to determine what environmental and socioeconomic impacts would be caused by a hypothetical, massive implementation of this technology in the southeast of Spain, and its political implications. This would be done by using trend analysis in different scenarios.

2.1. Model: Profitability Analysis of Renewable PV Production System in Greenhouse Horticulture

To determine the economic viability of using this technology on greenhouses, it is proposed that the savings in energy consumption be calculated and then compared to the economic performance achieved on the farm. This comparison is expressed in terms of profitability increase.
I r = A e F p × 100
where,
  • Ir (%): profitability increase;
  • Ae (€/year): annual energy savings;
  • Fp (€/year): farm annual profit.
Savings in energy costs will be represented by the expression:
A e = ( E p ×   P e ) A a
where,
  • Pe (€/kWh): consumer electricity price;
  • Aa (€/year): annual investment recovery;
  • Ep (kWh/year): integral of energy produced in a year.
The integral for the energy produced in a year will be calculated as the product of the installed power capacity multiplied by the production ratio,
E p   =   P i   ×   γ
where,
  • Pi (kWp): installed power;
  • γ (kWh/kWp): production ratio (energy yield).
The installed power capacity on greenhouse roofs will also be determined by the percentage of cover (% of shade) and the technical and geometric characteristics of the PV modules utilized. This will be calculated using the following expression:
P i   =   S i   ×   R s   ×   β S p   ×   10 5
where,
  • Si (m2): greenhouse surface area;
  • Rs (%): percentage of shade or cover with PV modules over the total greenhouse surface area;
  • β (Wp): power of roof-mounted PV module;
  • Sp (m2): area of installed PV module.
At the same time, we will calculate annual recovery Aa using the following expression:
A a = C o × i × ( 1 + i ) n ( 1 + i ) n 1
where,
  • Co (€): initial PV investment;
  • i (integer value): capital cost;
  • n (years): lifespan of PV panels.
The initial photovoltaic investment will be the product of the installed power capacity multiplied by the unit cost of acquisition and installation:
C o   =   P i   ×   C u
where,
  • Cu (€/kWp): PV Unit cost.
On the other hand, farm annual profit can be calculated as:
F p = S i × ϕ × ( P ϕ C ϕ )
where,
  • ϕ (kg/m2): yield;
  • Pϕ (€/kg): selling price;
  • Cϕ (€/kg): production cost.
By integrating expressions (1), (2), (3), (4), (5), (6) and (7), we obtain the model, which is reduced to the following expression:
I r = R s × β × ( P e C u i × ( 1 + i ) n ( 1 + i ) n 1 ) S p × ϕ × ( P ϕ C ϕ ) × 10 3
For specific cases when the photovoltaic panel installation on a greenhouse is intended exclusively for self-consumption, the shade percentage (Rs) can be reduced so that the energy produced equals the energy consumed by the farm and adjacent home.
The equality can be expressed with the following equation:
E p = ( S i 10 5 × E g ) + E h
where,
  • Eg (kWh): greenhouse energy consumption per year and hectare;
  • Eh (kWh): adjacent home energy consumption per year.
By substituting Ep for the expression (3), (4) and determining Rs, we can obtain the shade percentage necessary to satisfy the energy needs for self-consumption.
R s = ( S p × 10 5 ) × [ ( E g × S i 10 5 ) + E h ] S i × β × γ
Additionally, we can calculate the production cost of each kilowatt-hour by means of the following expression:
C e = A a E p
where,
  • Ce (€/kWh): cost in euros of produced kilowatt-hour.
By integrating expressions (11), (3), (4), (5) and (6), we obtain the production cost of greenhouse roof-mounted PV energy, which is reduced to the following expression:
C e =   C u × i × ( 1 + i ) n γ × [ ( 1 + i ) n 1 ]
The present work will also deal with the topic of reducing GHG emissions in a hypothetical scenario in which all greenhouses in southeast Spain (41,092 ha) would cover 10% of their total surface with solar panels. This scenario would also assume the hypothesis that the clean energy produced would substitute that which is currently provided by the local coal-fired power plant.
It would also be considered that the same type of solar panels used in the simulated scenarios would be utilized in the sensitivity analysis (BOSCH-240Wp); said panels have a surface area of 1.66 m2 each.
Therefore, solar energy production on greenhouses, based on the hypothesis presented, is represented by the following expression:
G ep = S t × β × γ S p
where,
  • Gep (kWh/year): greenhouse electric production;
  • γ (kWh/kWp): production ratio (energy yield); (1437.78 in Almería)
  • Sp (m2): area of installed PV module;
  • β (Wp): power of roof-mounted PV module;
  • St (has): total greenhouse surface.
Given that the coal emission factor is 1.09 tCO2Eq/MWh and PV emission factor is 0.0 tCO2/MWh, the reduction of GHG emissions would be 1.09 tCO2Eq for each MWh produced by solar panels, which is represented by the following expression:
R GHG = 1.09 × G ep 10 3
where,
  • RGHG (tCO2Eq): reduction of GHG emissions.

2.2. Scenarios and Trend Analysis

The prediction model presented in this article allows comparison of future alternatives based on different strategies for energy policies and subsidies for investments in PV in agriculture. The intention is to highlight any possible variability. One major source of uncertainty in the model is linked to the input parameters, some of which are quite variable, as is the case of the sale price of produce.
A sensitivity analysis is carried out to identify how the model results respond to changes in prices and costs, thereby determining the most sensitive variables. This makes it possible to: (1) study the variability among the model results, produced by the uncertainty of the input parameters; and (2) obtain information about the factors that possess the greatest potential to increase farm profitability, which are linked to the most sensitive parameters.
This analysis can be conducted using various approaches, which range from a simple simulation of one single factor at a specific moment to other broader methods that are generally based on the Monte Carlo method [48]. The analysis utilized in this article was developed using an approximation of finite differences based on central differences [49]. This method assigns initial values, which are either most probable or most frequent, to input variables based on average statistical data, depending on each case. Thus, each input variable is subject to a minor change, while the rest of variables remain constant at their nominal value.
The model considers 10 inputs variables and utilizes one single output variable, namely the increase in farm profitability. Yet, in the specific case of applying the model to simulate the self-consumption scenario, one of these 10 variables (shade percentage) simultaneously depends on four other new variables, bringing the total number of independent variables to 13.
However, the simulated scenarios in this analysis will be carried out by merely modifying the variables considered to be more sensitive (five variables), leaving the other eight variables constant in the form of parameters (m = 8).
Simulations will be conducted for the scenario of self-consumption by either increasing or decreasing the sensitive variables by a percentage over their base value, oscillating between ±20% and ±50%, exactly as shown in Table 1. The simulation will be carried out in a 1.8-hectare greenhouse with tomato crops which uses Bosch 240-Wp photovoltaic modules, each with a surface area of 1.66 m2. The same scenarios will be simulated but with the simple distinction that a 50% subsidy of the photovoltaic investment will be considered (with a maximum subsidy of €120,000).
The model will be utilized to simulate the behavior of a farm’s profitability increase with different greenhouse dimensions (2500 m2, 5000 m2, 7538 m2, 10,000 m2, 18,000 m2, 20,000 m2, 25,000 m2, 30,000 m2 and 35,000 m2) in the self-consumption scenario, bearing in mind the existence of the previously mentioned subsidies, or lack thereof.
In addition to the sensitivity analysis, a scenario analysis is carried out to examine trends and consider several possible futures concerning GHG emissions in relation to future applications of renewable energies usage and the impact on various socioeconomic variables. On the other hand, impacts on GDP, employment and R&D (Research and Development) investments were studied based on the proportional relationship between these variables and the investment in PV technologies obtained in the analysis of the renewables sector [52,53], which uses the input–output tables of the Spanish economy.
Taking into account that unforeseeable future aspects can cause considerable variability in the results of the forecast model (such as future EU GHG policies or economic and technological factors), multiple input figures are herein utilized to represent the simultaneous variation of different input parameters. Furthermore, the sensitivity analysis described above is utilized to quantify the impacts on energy savings and the effects on profitability in the farming sector, bearing in mind the characteristics of different crops grown in the greenhouses of the region studied.

2.3. Features and Variables for Implementation of PV Systems in Southeast Spain

This geographical region is characterized by the presence of low energy-consumption greenhouses, similar to southern Italy, southern Greece, northern Morocco and vast areas of Turkey. In contrast, the exact opposite occurs in greenhouses in northern Europe, especially in Holland, where energy consumption is far greater than in countries to the south. This difference exists because at lower latitudes there are more hours of sunlight (3600 h/year) and, as a result, the requirements to satisfy the photoperiod is very low and temperatures are milder in the winter, decreasing the need for heating systems.
This sunlight time differential presents enormous potential in terms of energy production. It offers an opportunity to exploit natural climate conditions while saving electric costs through the production of photovoltaic electrical energy using solar panels mounted on greenhouse roofs. This would represent an annual energy yield (kWh per kWp installed) that nearly doubles that of the solar energy potential of greenhouse areas in Holland. For example, a 1-kWp photovoltaic system installed in Almería (Spain) would produce 1730 kWh of energy annually, while in Holland this number decreases to 919 kWh/year [54]. However, experiments carrying out testing on this technology mounted on greenhouses in Almería [14] registered a somewhat lower value of 1437.78 kWh/year. This figure may possibly be more realistic as it provides for losses due to the accumulation of dust, the conversion efficiency of the inverters, PV module temperature, mismatch, the cable and reflection losses.
This situation means that photovoltaic installations in the Mediterranean region are capable of reducing the costs of photovoltaic energy production to nearly half of the other horticultural regions in EU, where farmers must to use another type of energy, such as gas or some other fossil fuel. In the last decade, the main problems of implementing this technology have been in both investment costs and low efficiency rates of photovoltaic panels available on the market. Nevertheless, it must be noted that these factors have been improving in recent years, and this trend also continues today [55].
At present, photovoltaic investment requires an outlay of approximately €1700/kWp installed [18], for a system with a lifespan of between 22 and 25 years. As for installations mounted on greenhouses, there exists the option of incorporating accumulators for self-sustaining systems, with market prices at €1725.70/kWp and a lifespan of 23 years.
The previous data were used to calculate the energy production cost of systems on greenhouse roofs. The value obtained was €0.072/kWh, which does not prove competitive for sale on the wholesale energy market, where daily pool prices are at a much lower price of around €0.05/kWh [56].
On the other hand, in several EU countries there is public aid to promote this type of installation [57] including for the farming sector. There is an ongoing international debate about the advantages and disadvantages of subsidizing specific types of energy with the aim of reducing CO2 emissions. This kind of financial aid already exists in most countries in some form or another, with worldwide energy subsidies figures reaching approximately US$5.3 trillion in 2015 [58]. Such financial support includes a measure aimed at renewable energy sources which supply both a farm and its adjacent home. In Spain, however, recent regulations have been designed to remove financial assistance on that basis that subsidizing the price of renewable energies increases the price of electricity for consumers. Yet, support policies aimed at technological or innovation investment in farming simply do not generate additional costs to electricity bills. For example, some regions in the Mediterranean have allocated aid for the modernization of farms and for recruiting young people for agricultural and livestock activities. This particular financial assistance subsidizes up to 50% of investments (BOJA-Boletín Oficial de la Junta de Andalucía, 30 May 2016, regulations for the allocation of subsidies on a competitive basis to support investments in farms [59]), with a maximum limit of €120,000, and it can also be applied to the installation of renewable energies. These types of policies could be particularly important as they do not subsidize the commercialization of energy produced. Instead, they favor self-consumption energy, which reduces costs and, as a result, increases farm profitability.
In addition, there is another drawback to installing high-power systems on greenhouses. This has to do mainly with the fact that the amount of shade cast by the photovoltaic panels could reduce production and, as a result, farm profitability. Studies were carried out in southeast Spain on greenhouses growing tomato to test this possibility [38]. It was demonstrated that, with the climate conditions and solar radiation present in this region, photovoltaic panels shade around 10% (9.8%) of greenhouse area and there is no reduction in crop yield (Figure 3). Incidentally, new lines of research were opened thanks to the great deal of interest aroused by the results of the study described above.
Calculations were made to determine the maximum photovoltaic power that could be installed on greenhouses in southeast Spain without surpassing the shade percentage cited above. Greenhouse surface area was also taken into consideration and then linked to energy production price. The maximum installable power, in this case, is the present-day energy production potential, given that in the last ten years there have been significant improvements in the efficiency of photovoltaic panels [55,60] (Figure 4). For this reason, it is expected that in the near future it will be possible to obtain greater energy production with the identical shade area (9.8%).
However, with the current energy policies in force described previously, the feasibility of generating photovoltaic energy for sale and supply to the general grid is quite limited due to the pool price allocation of wholesale prices. The latter, on average, are somewhat lower than the prices which could be achieved with systems mounted on greenhouses, even though growers must pay for their own electric consumption from the grid at much higher prices, which are around €0.16/kWh.
The difference between wholesale energy prices and the consumer price makes it much more viable to invest in these technologies nowadays if they are intended for self-consumption of a greenhouse and its adjacent home. This is possible with the installation of accumulators that allow energy generated to be stored for later use. The goal is to reduce costs and thereby increase the farm profitability.
This increased farm profitability is evaluated using different cost–benefit scenarios in the following subsection.

3. Results and Discussion

3.1. Cost-Profit Analysis of Photovoltaic Systems on Greenhouses Roof

A sensitivity analysis is carried out using an average-sized greenhouse (1.8 ha), in a self-consumption scenario with the most common crop (tomato), and an annual energy consumption ascending to 40,688.8 KWh/year [24,52] in non-heated greenhouses. This value includes the average consumption of the adjacent single-family home. This low energy cost represents €0.36/m2, in contrary to the higher energy costs for heated greenhouses, which rise to €3.24/m2 [62].
Precisely as can be observed in Table 2, the most sensitive variables are those that correspond purely to agriculture. These include crop sale price and crop production cost, a 20% rise or fall in either of which causes rather major variations in all cases. A similar situation, albeit less marked, occurs with the electricity price charged to consumers.
On the other hand, the least sensitive variables in the study case are interest rate and photovoltaic installation cost. These two variables are essential and highly sensitive in a standard photovoltaic installation, in fact they are the most sensitive, but in greenhouse-mounted installations the variables associated with crops are even more so and that is why these data are obtained.
It is worth highlighting that in normal conditions (base case) and for an average-sized greenhouse (1.8 ha), roof-mounted photovoltaic energy production increases the profitability of a farm by 9.89%, and even 14.1% in cases where investment is subsidized.
These increases in profitability also occur in greenhouses of different dimensions (Table 3). However, the relationship between profitability increase and greenhouse dimensions inversely decreases as greenhouse size increases. The same takes place with regard to the effect caused by subsidies, which have a considerable impact on small-scale farms (more than 6% difference in modal surface and smaller greenhouses). This progressively decreases as greenhouse surface area increases (more than 4% in greenhouses larger than 2.5 ha).
In all cases, even in those where the variables were highly penalized (e.g., interest rate is increased by 50%, and consumer electricity price is reduced by 20%), it was determined that positive profit increases were produced, varying between 0.88% and 37.07%. These figures both increased in cases where subsidies were received, oscillating between 5.10% and 52.78%.
These significant differences demonstrate that combining PV energy production with intensive greenhouse farming produces an effect that goes beyond simply increasing profitability. Energy production also acts to stabilize farm income by compensating for the high volatility of profits from crops, which are strongly influenced by sensitive variables. Consequently, during years in which local crop prices are low, or in which for whatever reason production costs rise, the savings in energy self-consumption costs could reach up to 37.07% of total profit (and up to 52.78% in cases where investments are subsidized).

3.2. Environmental and Socioeconomic Implications

3.2.1. Implications in Spanish Energy Policy

Considering the total area of the greenhouse roofs currently existing in southeast Spain, if the potential maximum PV energy production were actually achieved, it would considerably reduce the gap that separates Spain from the objectives set out in the 2030 Energy Strategy [15,63].
As expounded above, the objective is to achieve a 40% reduction in greenhouse gas emissions by the year 2030 for the entire EU, with respect to levels registered in 1990. They also aim to ensure a minimum of 27% of energy consumption comes from renewable sources, as well as a series of other goals. At the same time, the 2030 Energy Strategy urgently emphasizes that it is crucial to mobilize all means necessary to achieve the goal of reducing greenhouse gases by 10% (with respect to values from 2005). If this were not achieved, it would have to be fulfilled prior to 2020, specifically by Spain, Portugal and the Baltic State, which are the Member States that have not achieved a minimum level of integration in the internal energy market. In fact, Spain has made a commitment to ensuring that at least 20% of total energy consumption comes from renewable sources by the year 2020.
If we consider, for example, that 10% of the 41,092 ha of greenhouses existing in southeast Spain were to be covered by photovoltaic modules, the potential maximum energy production generated, using current technology, would be 8507 GWh/year (Table 4), which equates to 731.47 ktep.
This energy production could substitute that of the local thermal power plant (Carboneras, Almería), which operates on coal combustion and boasts an installed power capacity of 1159 MW and a production of 6000 GWh/year. It would also reduce the output of other similar stations nearby by half.
The total energy consumption in Spain (2014), including consumption for non-energy purposes, was 83,525 ktep, of which 13,294 ktep came from renewable sources [44]. This means that the ratio of renewables only reaches 15.85%, far from the 20% set as the objective for Spain in 2020 [63].
Based on the data for renewable energy production out of total energy consumed in Spain between the years 2009 and 2014 [15,
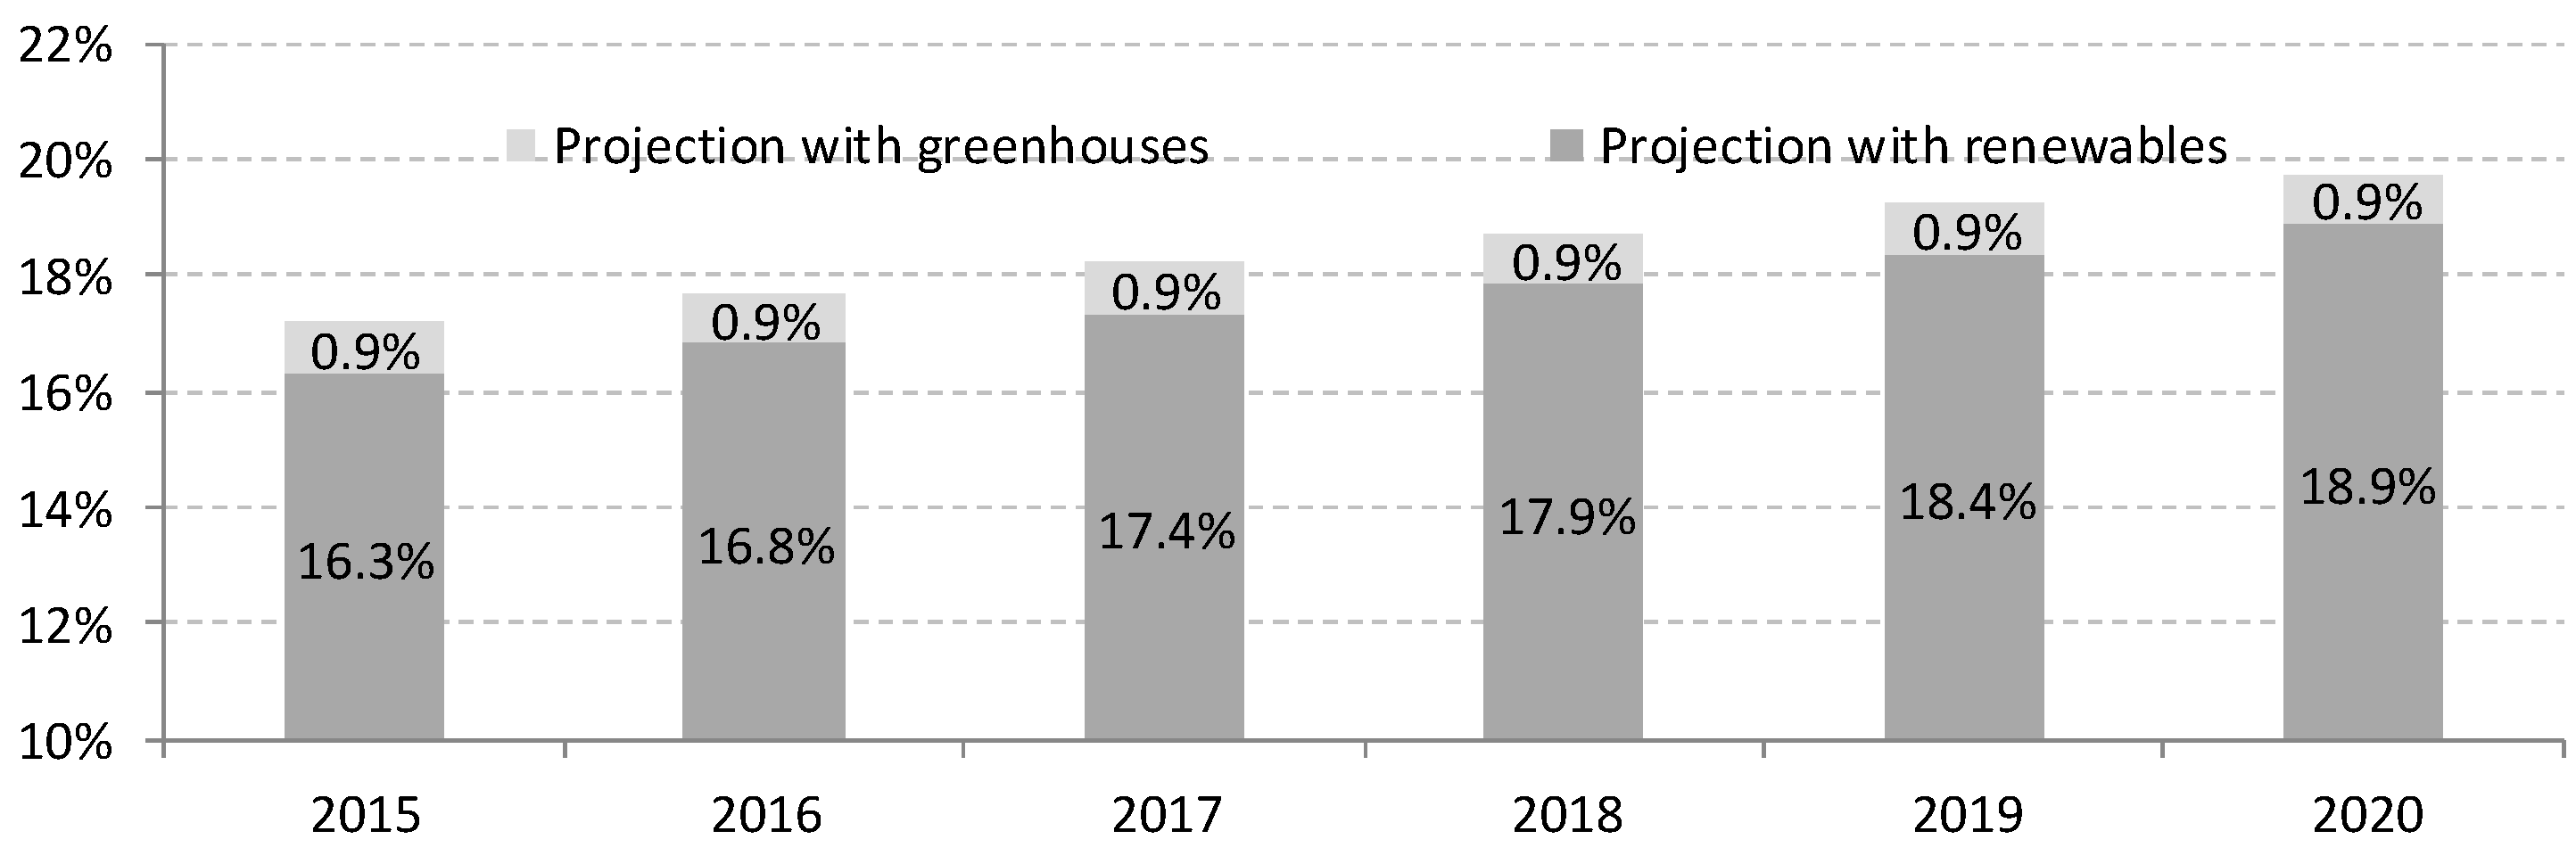
44], a linear projection of the trend for these years was made to estimate percentages of renewable energy that will be reached between 2015 and 2020. It is first considered that increased energy efficiency will compensate for final energy consumption during the period 2015–2020, which will cause a theoretical stabilization of final energy consumption, with figures similar to those of 2014. This projection (Table 5 and Figure 5) reveals increases in renewable energy which are inferior to those necessary to meet the objective (20%).
However, the Figure 6 would be altered by incorporating greenhouse-mounted PV energy production to substitute thermal power plants. Some 731.47 ktep (0.9% of the total energy consumption in Spain, 83,525 ktep) would be added to the total output of renewable. Consequently, the mere adoption of this measure would narrow the gap between the 2020 objective by more than a fourth with respect to 2014 (Figure 6), considerably helping to meet this officially established goal (20%).
In addition to this support, the promotion of PV technology in greenhouses would produce a positive environmental effect by reducing GHG emissions in the atmosphere, which also constitutes an objective to be achieved in the 2030 Strategy. The substitution of thermal power plants which use coal combustion with energy produced on the greenhouses located in the same area of influence would represent a reduction of slightly less than 10 million tons of CO2Eq each year.
The aforementioned value (Table 6) refers to the real GHG emissions produced during energy production. However, for the purposes of making comparisons with other scientific studies, it is standard procedure to also determine the carbon footprint (CFOE) produced, which considers the amount of GHG emissions, quantified in CO2Eq/kWh throughout an entire lifespan. In the particular case of photovoltaic systems, it is necessary to take into account many factors, from the mining of raw materials to the manufacture of components, for example, the modules and structures, battery acid, connection cables, charge inverters and controllers, shipping, maintenance and, finally, recycling. The CFOE value varies according to the installed power capacity on the greenhouses [64]. If we consider a greenhouse of average dimensions (1.8 ha) with an installation of 260 kWp, the carbon footprint would register somewhere between 0.4 and 0.6 kgCO2Eq/kWh. By extrapolating these data to the potential energy production in southeast Spain, and using an average value of 0.5 KgCO2Eq/kWh, we obtain a carbon footprint value of 4.76 million tons of CO2Eq.
Nevertheless, assuming that Spain fulfills its commitments for 2030 and its intermediate stage by 2020, a standardized value for all EU countries of 0.0 tCO2/MWh GHG emissions will be utilized for photovoltaics. This correlates to a reduction of 9.3 million tons of CO2Eq annually, which would bring figures closer to Spain’s official objective. More specifically, the commitment of the European Union as a whole consists of reducing greenhouse gases by 40% by the year 2030, using data from 1990 as reference. This emissions reduction is calculated for each of the member states, which, at the same time, carry out plans corresponding to specific economic sectors to decrease emissions.
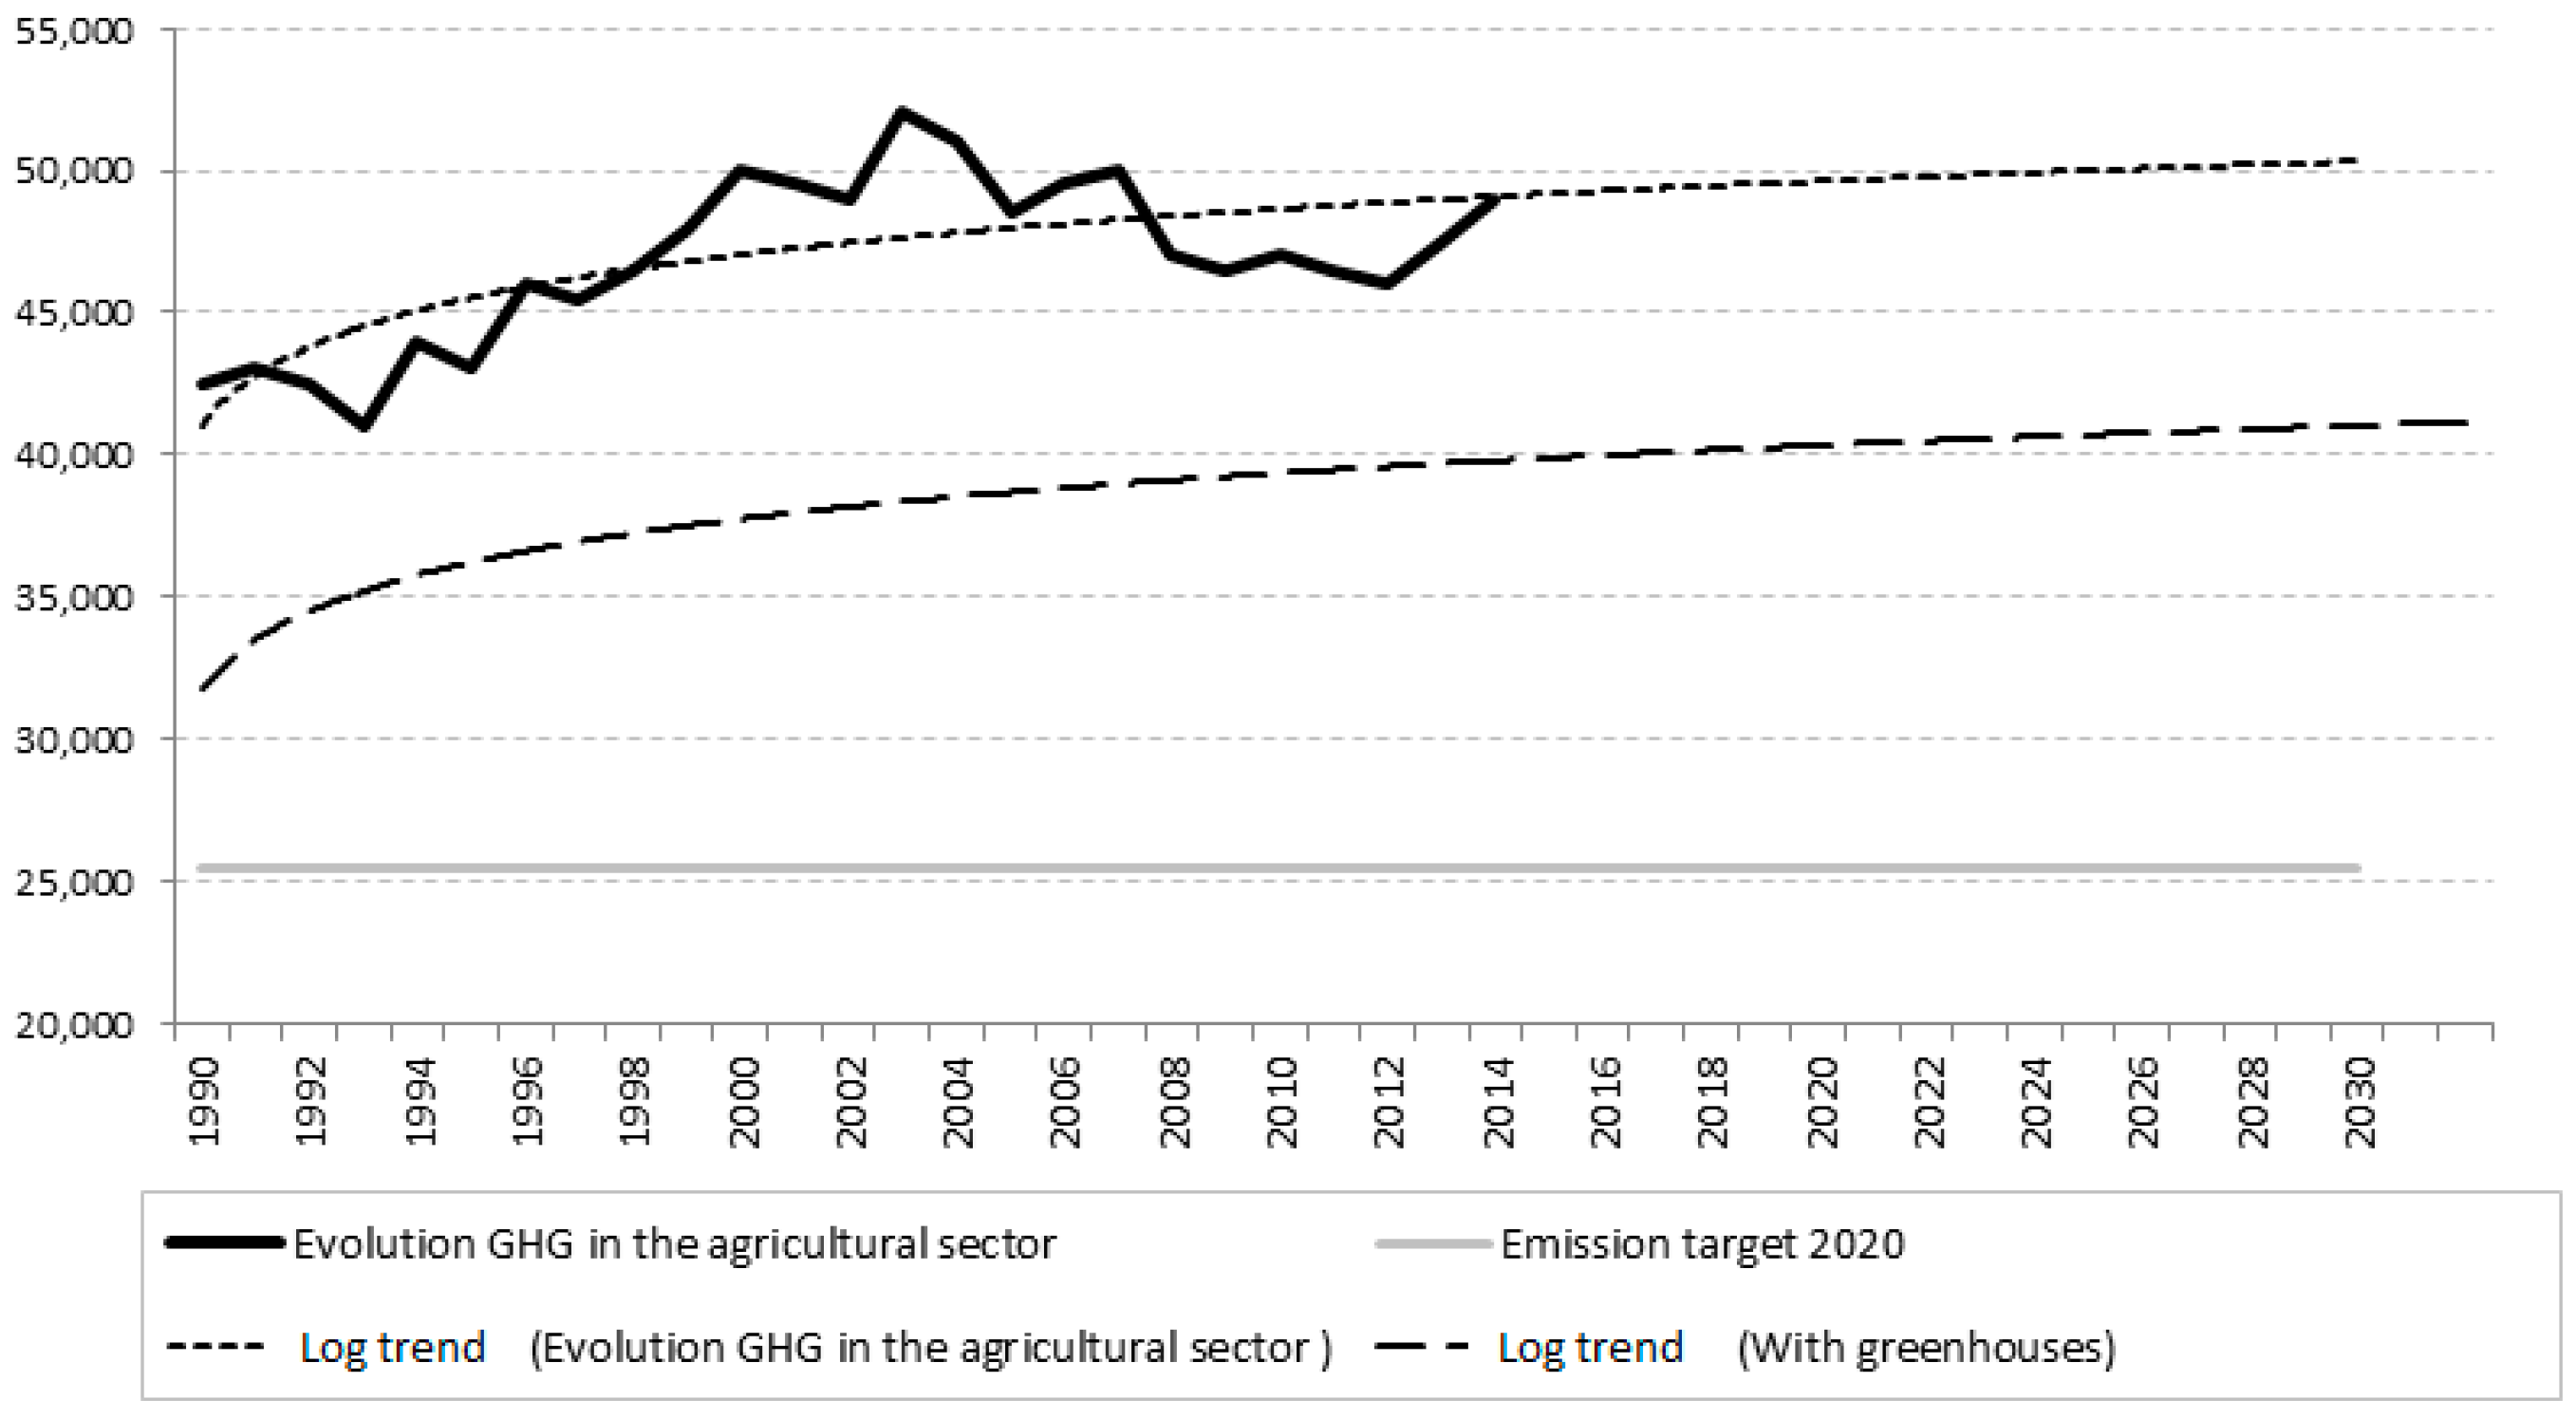
In the specific case of the agricultural and livestock sector in Spain, the emissions trend is rather discouraging. By observing the data registered from 1990 to 2014 [65], it is seen that numbers had continually been on the rise, increasing from 42.5 to 49 MtCO2Eq (Figure 7) when the objective was actually to lower this number to 25.5 MtCO2Eq [65]. Based on the data for GHG emissions in the agricultural sector from 1990 to 2014, a logarithmic projection of the trend was made to estimate the levels which will be reached in the year 2030 (Figure 7). The value obtained was nearly 50 MtCO2Eq, which represents a difference that is 24 MtCO2Eq greater than the official objective.
In this way, the contribution of photovoltaic production on greenhouses towards the fulfillment of objectives in the agricultural sector could be pivotal as it could reduce emissions by 9.3 MtCO2Eq, decreasing the difference cited above by 40% (Figure 7). For this reason, the adoption of measures aimed at implementing this technology on greenhouses would significantly contribute towards meeting the commitments to the 2030 Strategy.

3.2.2. Implications in Regional Socioeconomic Development

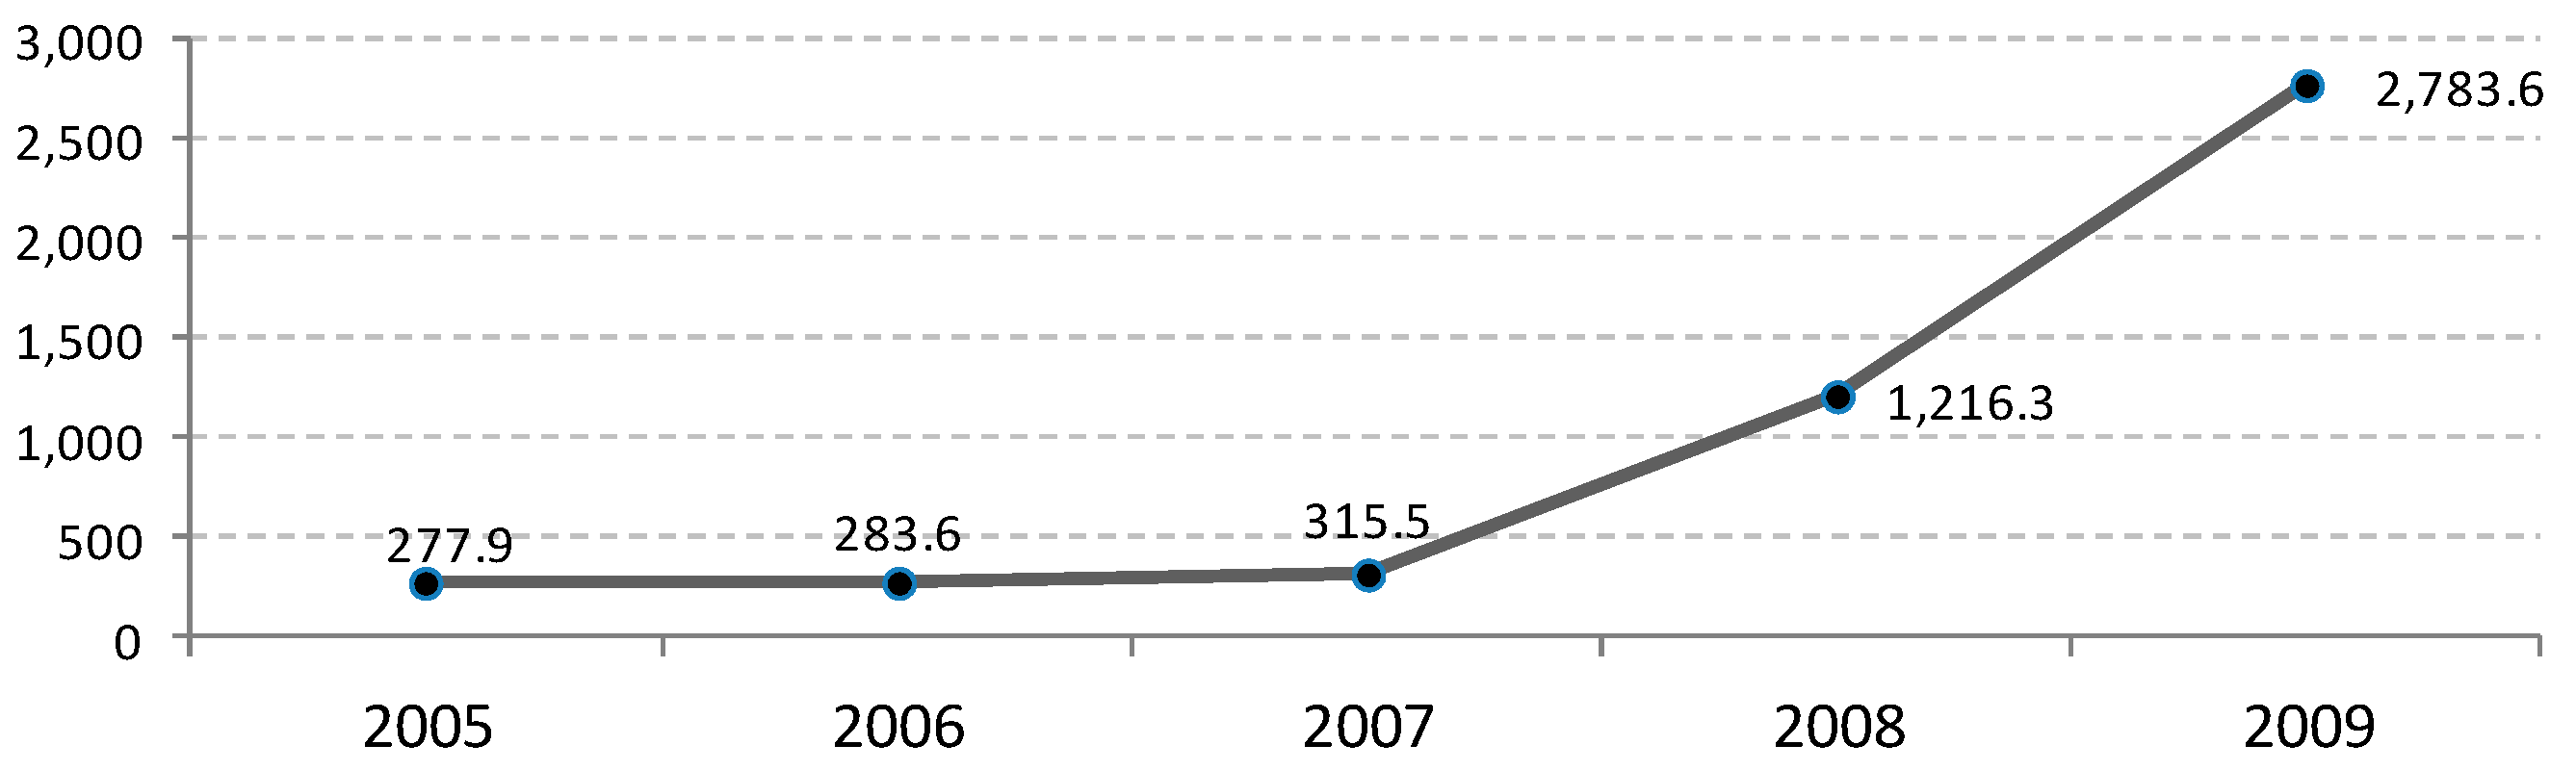
Contribution forecasts for PV energy, in terms of production and consumption, were conducted in 2011 by the Institute for Energy Diversification and Saving [
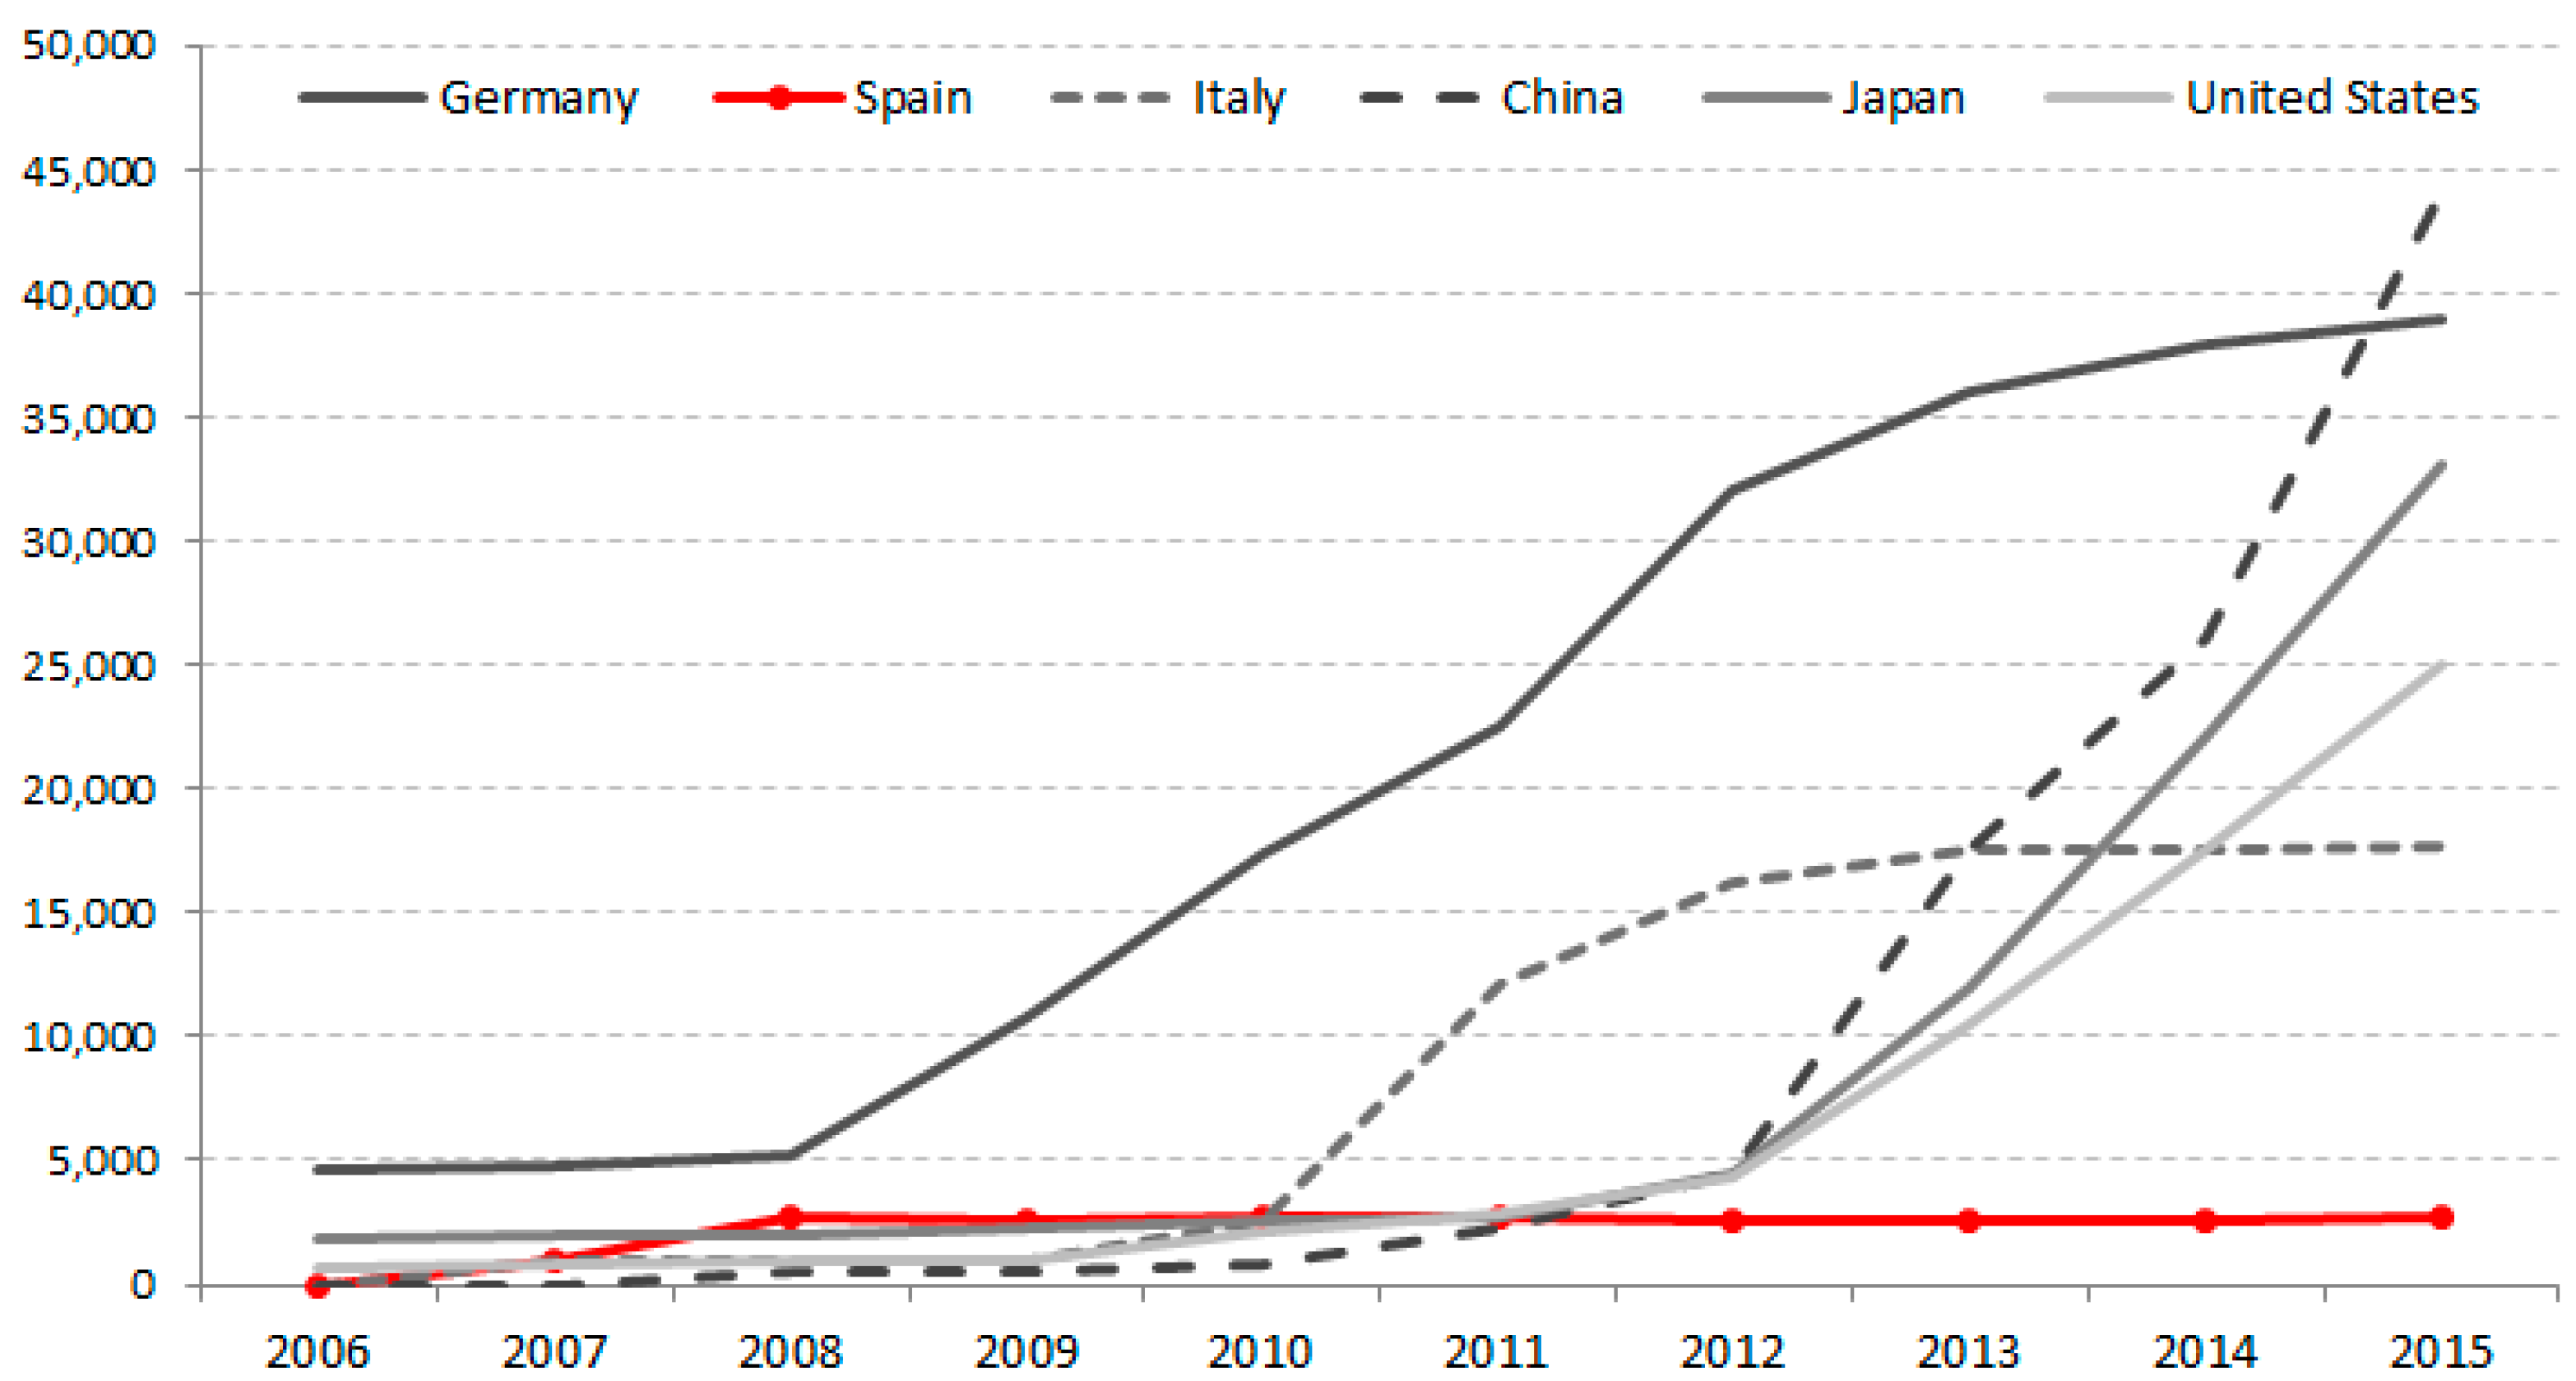
52]. This analysis revealed that if photovoltaic growth had continued in the last decade (Figure 8), the GDP would have increased by approximately 2% for Spain as a whole by the year 2020, correlating to an increase in direct income of 3784.3 million euros. However, this growth trend and forecasts were severely hindered by the new energy policies referred to earlier.
While making forecasts in these fields is complicated, especially when there are major changes on a macroeconomic scale (as described in the case of Spain), various studies corroborate the positive effect of renewable energies development on specific socioeconomic variables. In one of these studies, Apergis and Payne analyzed 20 countries in the OECD (Organisation for Economic Co-operation and Development) during 1985–2005 and discovered a positive relationship between consumption of renewables and GDP growth [66]. More specifically they found that a 1% increase in consumption translated to an increase of 0.76% in national GDP. Similarly, Sadorsky also obtained a positive relationship between consumption and income per capita in a study of 18 developing economies [67]. Furthermore, a study of G7 countries by Tugcu revealed a causal relationship between renewable and economic growth [68]. However, other studies found no conclusive results [69], particularly in the case of Spain, although the aforementioned study ended in 2004, which is why the IDAE (Instituto para la diversificación y ahorro de la energía) utilized data from 2005 onward [52]. By using the 2005–2010 trend impacts, this study elaborated forecasts for 2015 and 2020, which were then extrapolated to 2030 [53].
Utilizing these references for the Spanish case, while bearing in mind the current context of new legislation, a forecast is made for the impact of PV electricity generated on greenhouses in the southeast of the country (
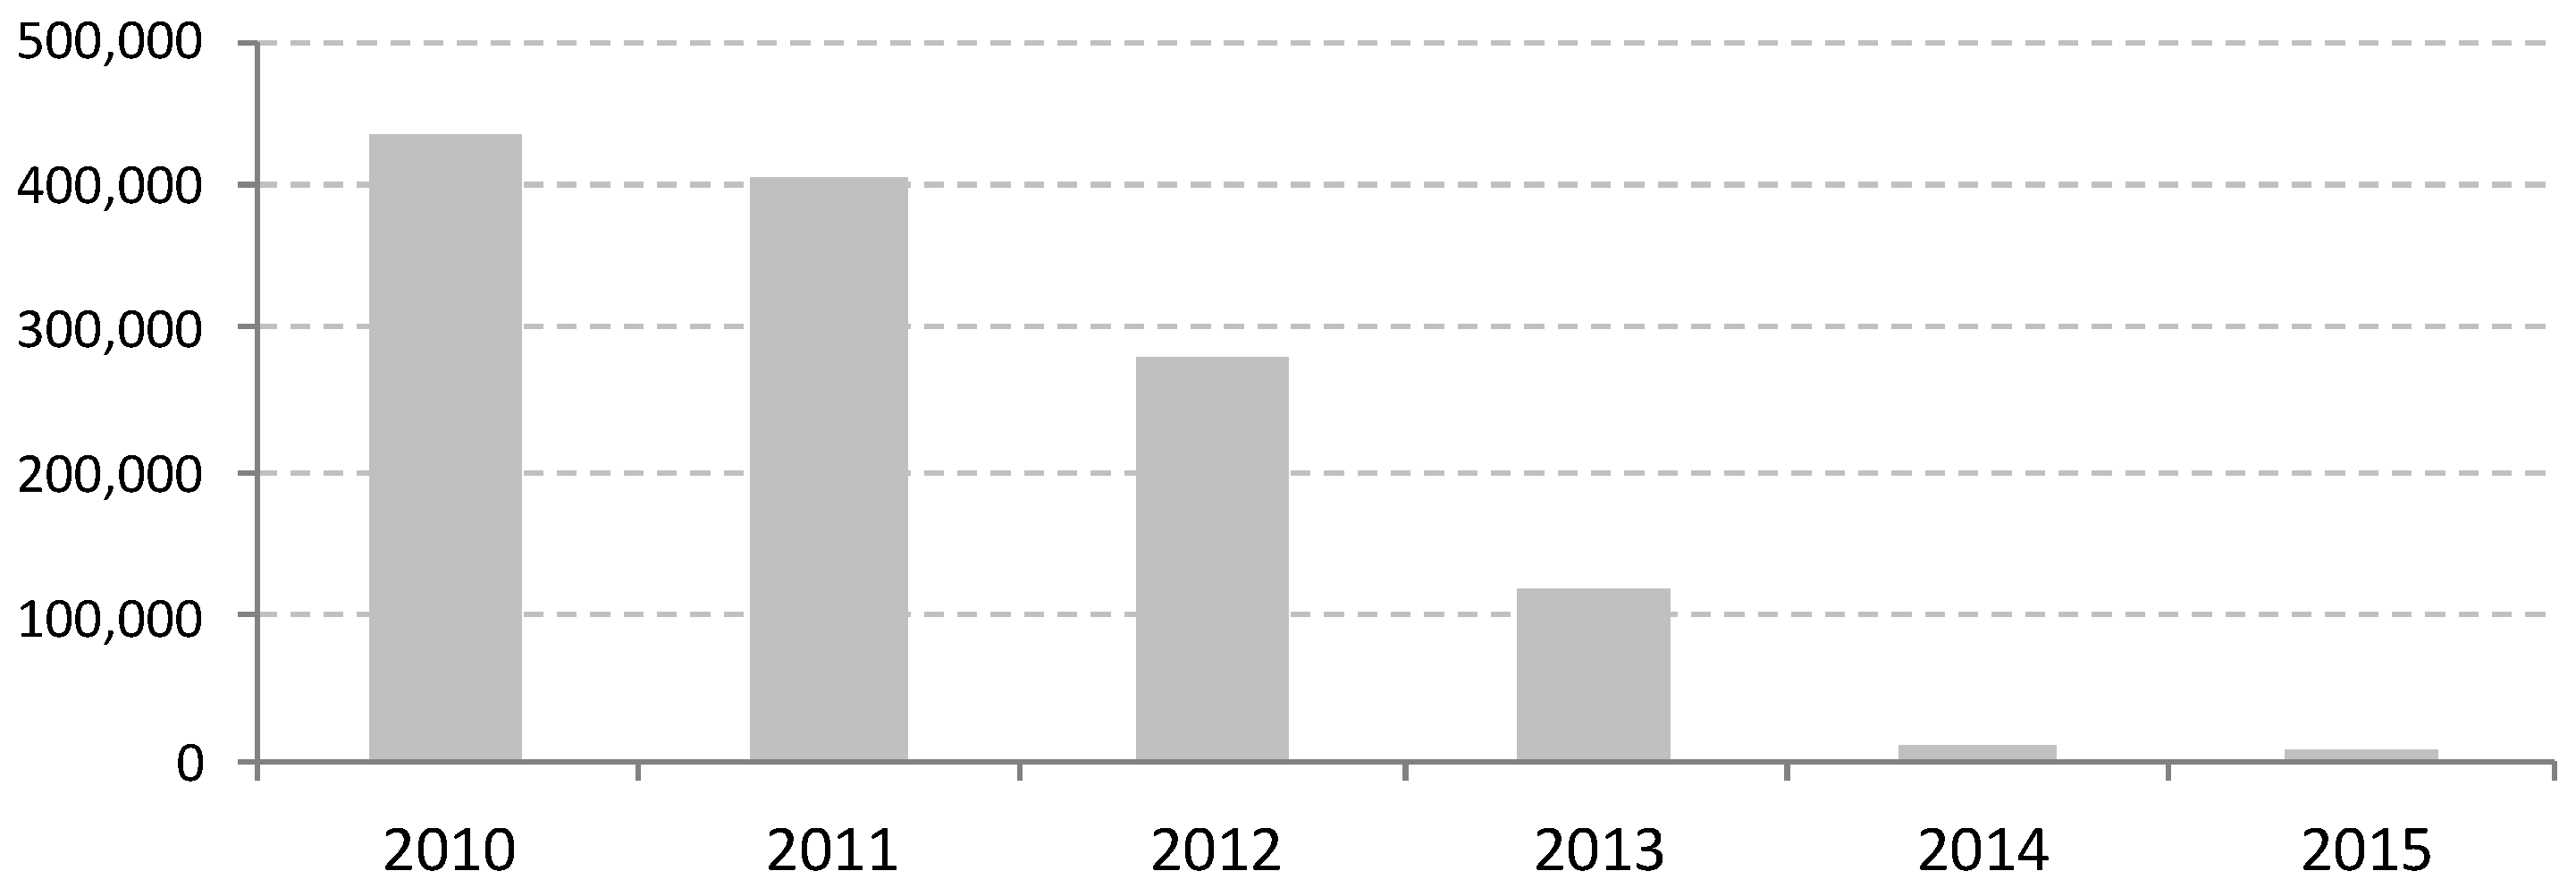
Table 7). In this way, the forecasts by IDAE are based on an installation scenario featuring a new minimum power of approximately 1000 MW annually [52], reaching 2020 with an installed power capacity of 8367 MW (14,316 GWh generated). However, with the actual political framework during that time, the new installed power from 2010 to 2015 was 1258 MW (Figure 2), far from the prediction mentioned above. On the other hand, when we consider installation of the proposed systems on greenhouses, we observe that the power capacity that can be installed over the next five years is 5917 MW (144 kWp/hectare × 41,092 hectares). This would move Spain closer to 85.76% of the scenario envisioned by some papers for the year 2020 [52,53].
PV energy represents 27.9% of employment for all renewables and is one of the types that contribute most to R&D (1.9% of GDP) [70]. In this regard, these figures position the energy sector near the EU28 average [15]. Although Spain’s energy sector represents a higher percentage of its GDP than the rest of the EU28, this same sector is still far behind the EU28 average in terms of employment and R&D spending [68].
Other specific effects must also be considered in terms of social and national impact [53]. On one hand, several studies qualify job creation in renewable energies as stable and high quality employment: more than 80% of job positions have indefinite contracts, which require either high qualifications (31% higher education) or medium qualifications (24% official studies); the average salary is 52% higher than in the rest of the economy and superior to the average in industrial sectors [52,70]. Furthermore, a positive impact is also observed with regard to the employment of young people [71].
In general, this energy constitutes a way of complementing income generation, not only for its impact on the socioeconomic variables indicated, but also through energy savings, both nationally and regionally. However, it is precisely this regional impact which would achieve the greatest effect in terms of support and consolidation of an “agrifood-energy” sector, with direct repercussions on the industrial and secondary services linked to this sector [72]. As indicated earlier, this impact would create a vast distribution of income, with very low distribution costs given the proximity of key consumers.

3.2.3. Economic Impact on Southeast Spain Greenhouse Sector

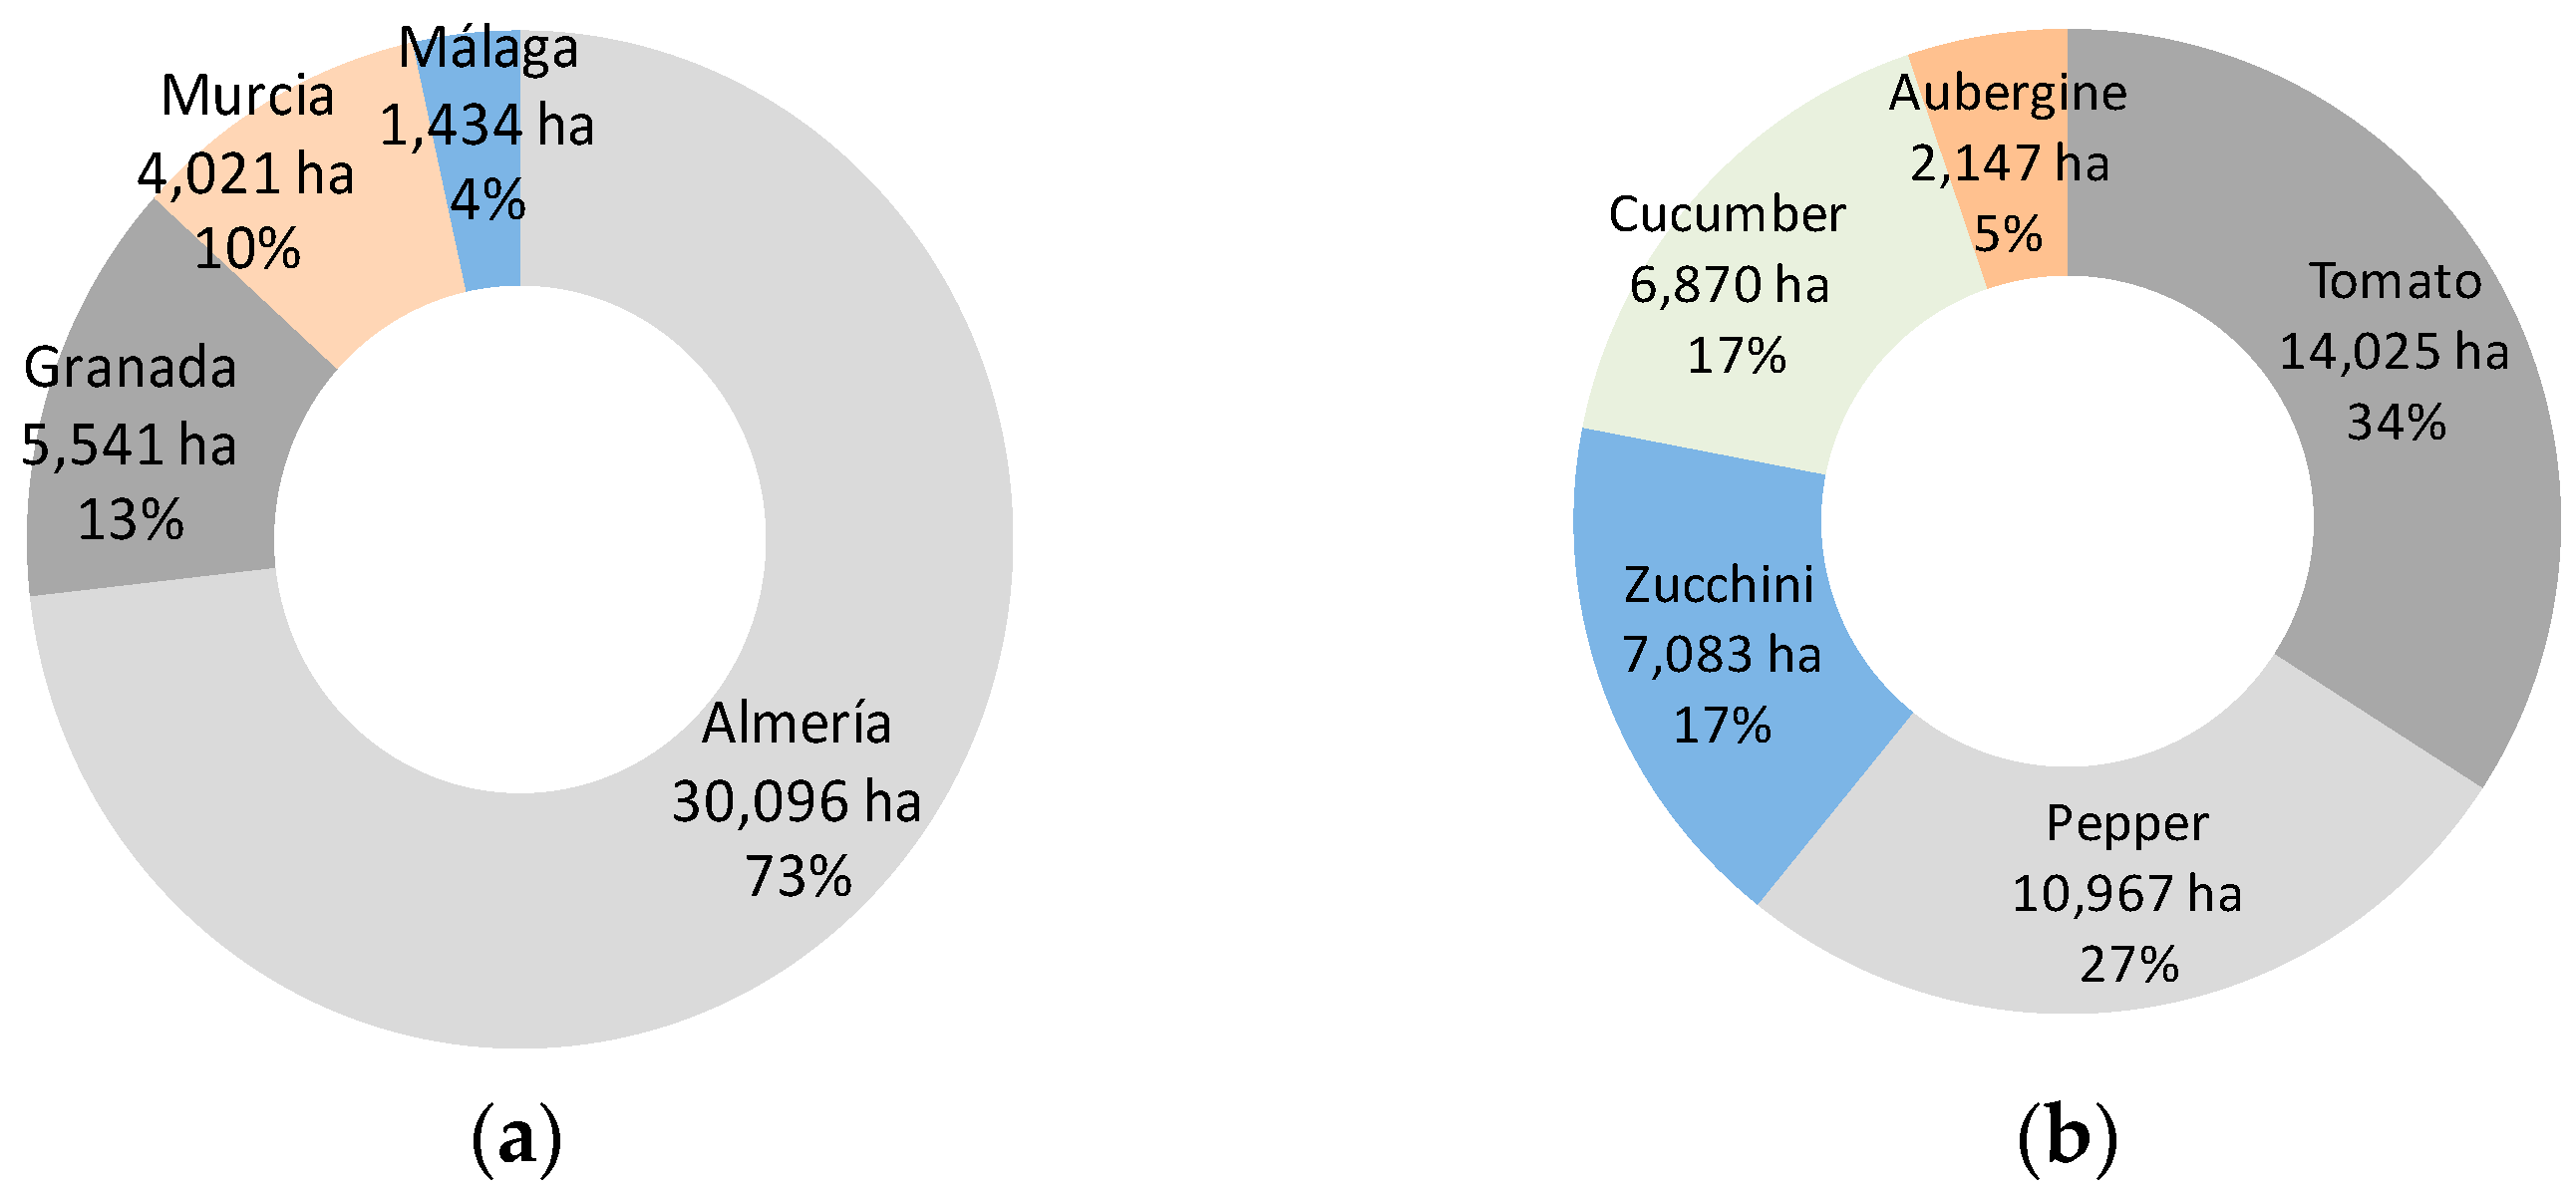
In this line, estimation is carried out below of the consequences of generalized PV energy usage for the whole of the horticultural farming in the southeast Spain that represents 95% of Spanish horticultural crops in greenhouses. This will be calculated in terms of monetary energy savings, while applying only a minimum amount to supply self-consumption of 1.09%, and taking into account the main greenhouse crops (long cycle crops are: tomato, pepper, cucumber, eggplant and zucchini). Figure 9 shows how the province of Almería represents more than 73% of greenhouse area in southeast Spain, and tomato and pepper alone constitute 61% of the total. Considering standard farm size, production and average prices of energy consumption per crop, it is possible to calculate the savings that would be achieved by implementing this technology throughout the entire sector.
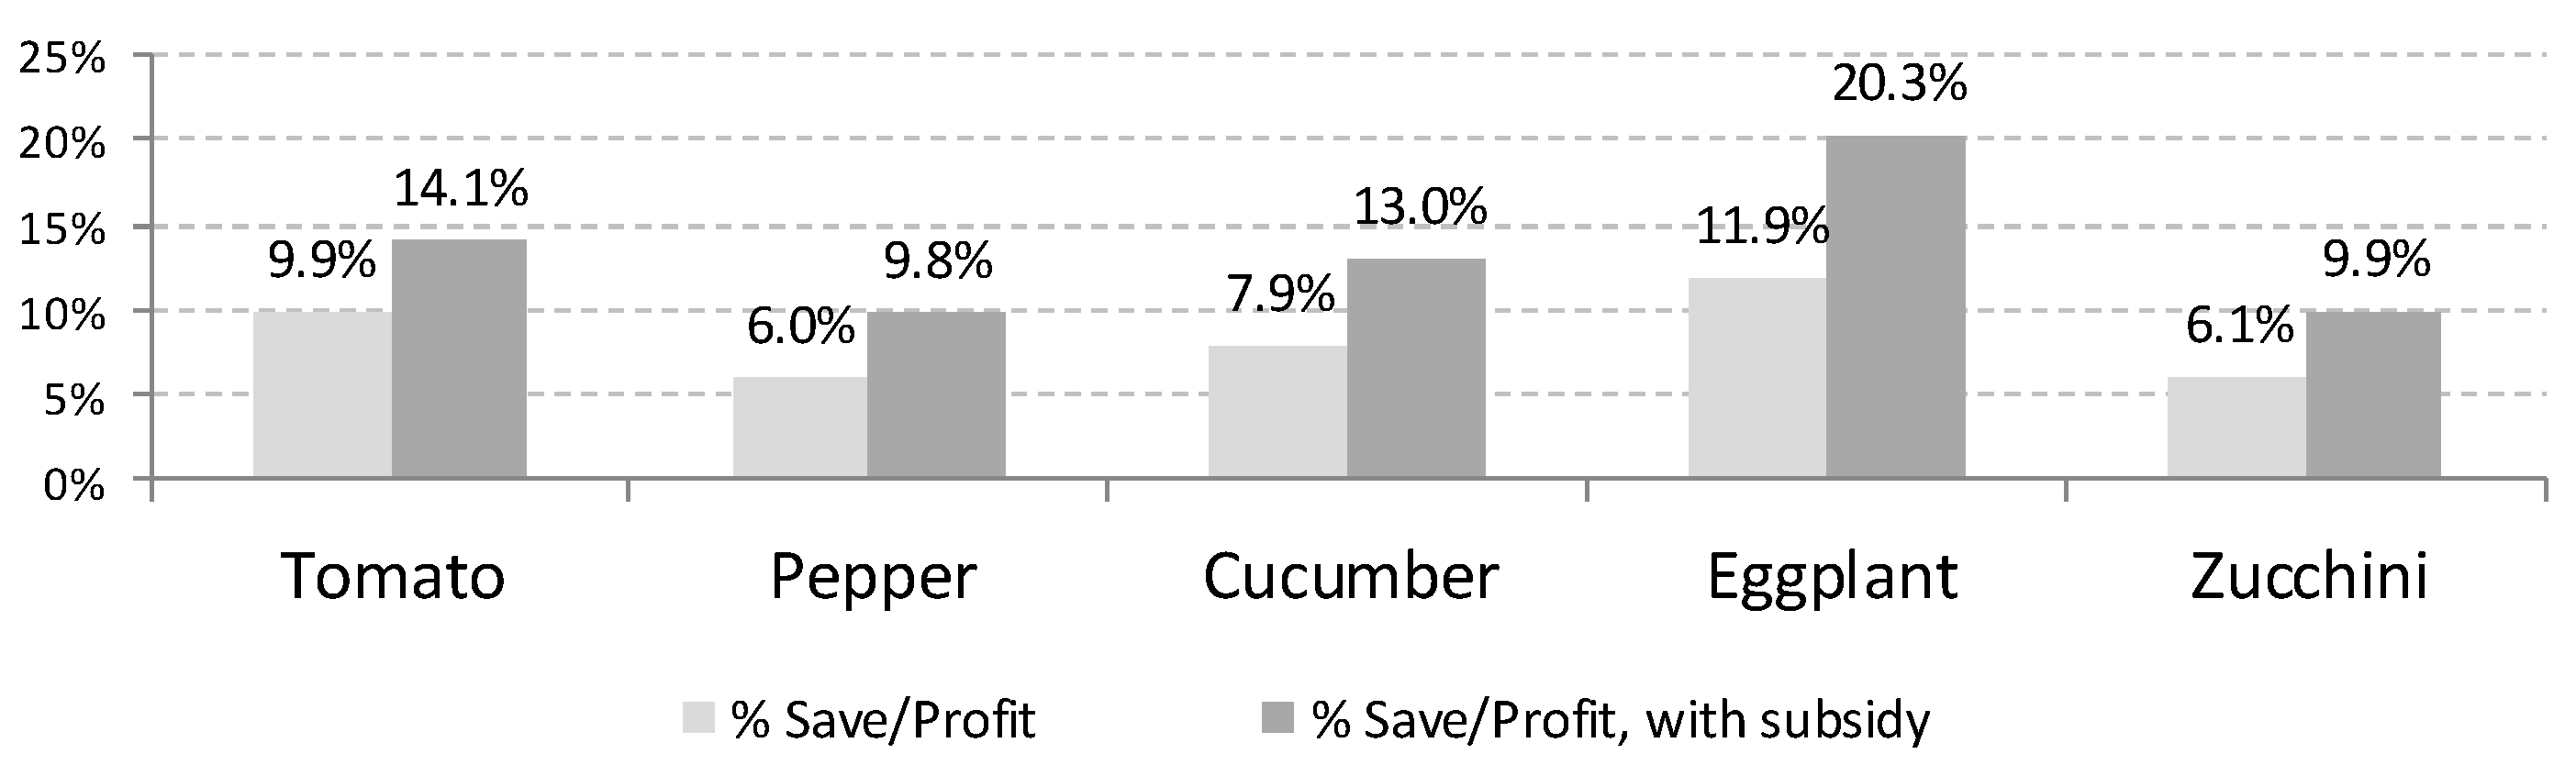
Figure 10 displays the savings for each crop in relative terms (according to base case). The savings over annual profit, depending on the type of crop, oscillate between 6% for pepper (9.8% with aid) and 11.9% for eggplant (20.3% if subsidies exist). The absolute savings vary between €3470 in tomato without subsidies (€4940 if we consider that subsidies exist) and €2320 in cucumber (€3740 with subsidies). It must be noted that the implementation of PV energy would be of special interest given the potential profit growth for growers specializing in tomato, eggplant and zucchini.
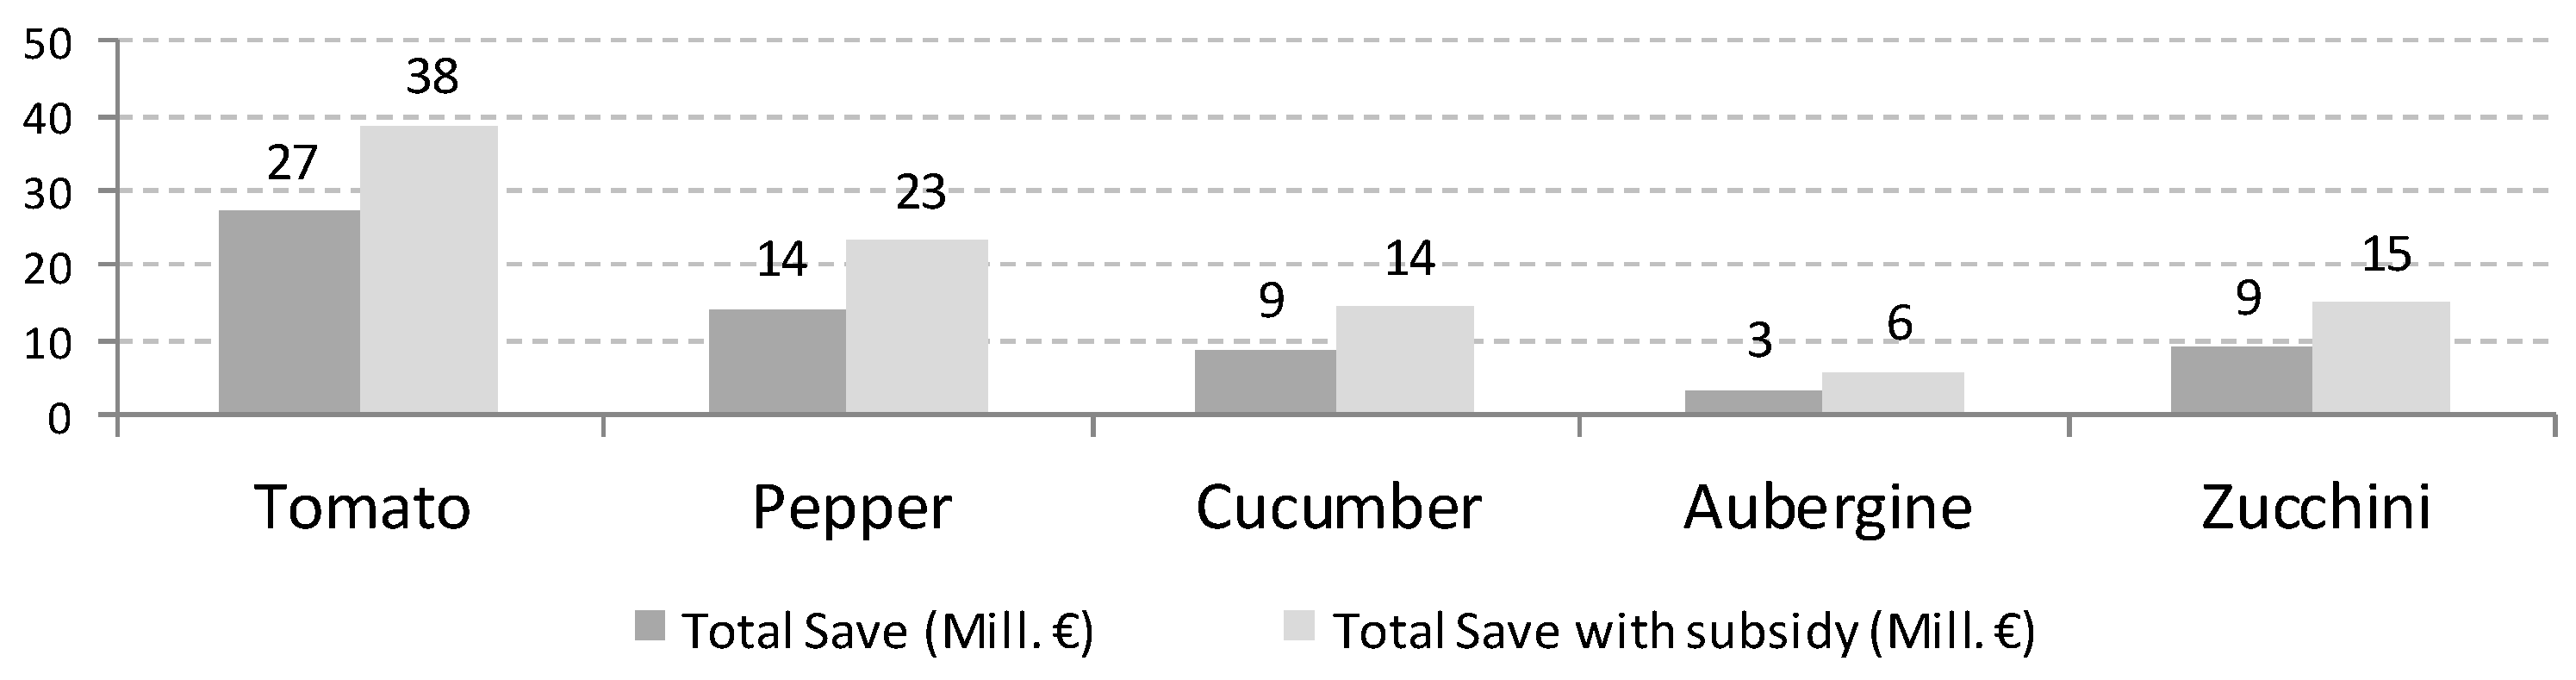
Taking into account the entire production area (Figure 11), the total savings would be €62 million without any aid. This represents 7.8% of all sector profits (which reach €795 million). The crop that most contributes to the sector is tomato (€27 million) due to a larger farming surface area (14,025 hectares). The products which follow in terms of importance are pepper, zucchini and cucumber, the latter two with similar figures (hovering around €15 million in savings). If subsidies are taken into consideration, this would imply savings that would reach €96 million (12.1% of all sector profits).
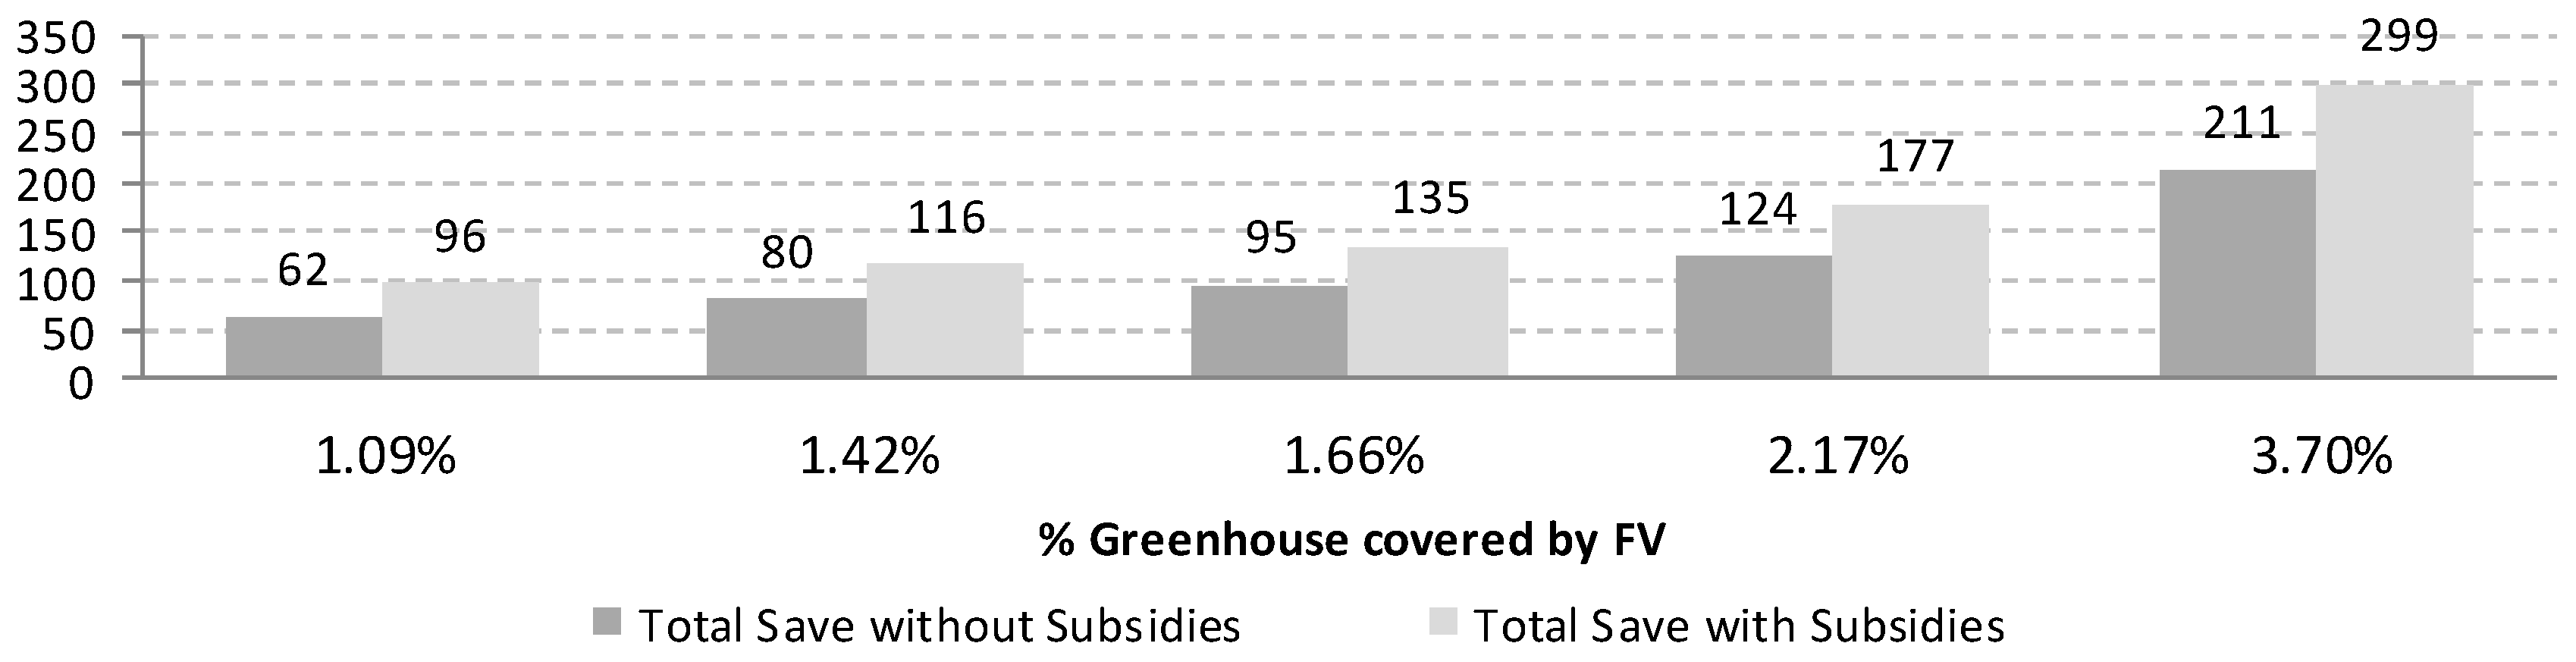
Figure 12 shows the sector’s savings in euros as a result of the increased area of greenhouses with PV panel installations (18,000 m2). As can be seen, by merely rising from 1.09% of the area to 3.7%, savings would increase by 240% (considering the presence of aid), reaching €299 million, that is, 38% all profits combined. In general, the implementation of this technology would absolutely ensure profitability in a highly variable sector, as is agriculture.

4. Conclusions

Within the context of the EU28, various approaches have been established in terms of energy strategy and climate change for the years to come. However, there is an absence of lines of action regarding these issues in Spanish energy policy. This is clearly visible in the fact that, on one hand, the forecasts and commitments for 2020 will finish far below the initially established objectives and, on the other hand, there is a lack of clearly defined strategies to fulfill the commitment for 2030.
A general analysis of the effects of current policies clearly reveals that investments in renewables in Spain have become stagnant. As a consequence, and most importantly, exploitation of PV energy has been halted, while investments in this type of energy have tended to progressively increase in the rest of Europe and elsewhere. The short-term impact of this situation on the Spain’s general energy context represents a reversal in the movement to substitute pollutant energies as well as a decrease in the capacity to fulfill to the commitments concerning climate and energy in the European Union framework.
So far this work has focused on the concept of the specific application of solar photovoltaics to agriculture. The analysis of the socioeconomic and environmental impacts of the application of PV technologies using greenhouse structures in the Mediterranean area reveals:
  • The use of this technology in the scenario of self-consumption produces increases in profitability for the farm. These increases vary in the scenarios evaluated, ranging from 0.88% to 52.78%.
  • Regarding the effects on Spanish environmental policy, the implementation of this technology on greenhouses would reduce the foreseeable gap with respect to the objective reducing GHGs for 2030 by 38%. Additionally, PV technology would make it possible to almost completely achieve the commitment of 20% renewable energies by 2020.
  • From the macroeconomic point of view, the effects on job creation, and the contribution to regional GDP and to R&D could be important. This would also improve the performance of the agrifood sector in the form of energy savings distributed throughout the region.
In general, the data obtained in the present article reveal the enormous potential that PV energy has in the near future in combination with greenhouses. Nevertheless, this promising scenario requires that changes be made to Spanish energy policy, which, according to various important technical reports, is foreseen to be aimed at:
  • Foreseeable improvements in policies and regulations to promote renewable energies in substitution of fossil fuel consumption, as well as green taxes which penalize the latter.
  • Gradual elimination of obstacles restricting self-consumption in order to create greater social pressure against the so-called “Sun Tax”. At present, this elimination has been achieved in low-power installations, and this value is forecast to continue to rise.
Although the present study is limited to a specific region in Spanish territory and its estimations were made for the current context, which is characterized by a lack of precise energy policy strategies, the approaches it presents could perhaps be applied in other regions in the Mediterranean that feature vast potential for PV energy, e.g., Italy or Turkey, given the considerable solar radiation, and in those regions, e.g., China, with a concentration of greenhouses that, in some cases, have already started implementing similar technologies.
In this way, future works could focus on the comparative analysis of experiences and a review of energy policies in different international contexts. Alternatively, analyses can be conducted on the implications of applying PV systems in certain auxiliary activities of agriculture, such as recycling plants, packaging cooperatives or those aimed at water usage efficiency and increased water supply, e.g., desalinization plants with solar energy, which constitutes one of the primary concerns in certain agricultural regions in the Mediterranean environment.

Acknowledgments

This research was partially funded by Spanish MCINN and FEDER aid (project ECO2014-52268-P) and by the Andalusian Regional Government (project SEJ-2555, Consejería de Economía, Innovación y Ciencia). The authors are also grateful for the support received from C-BIRD project, Cooperative Business and Innovative Rural Development (project 611490, FP7-PEOPLE-2013-IAPP).

Author Contributions

Angel Carreño-Ortega performed and analyzed the cost-profit analysis and environmental results for PV panels on greenhouses. Emilio Galdeano-Gómez designed and analyzed the implications in regional socioeconomic development and wrote the conclusions. Juan Carlos Pérez-Mesa preformed, analyzed and wrote all data concerning the economic impact on the southeast Spain greenhouse sector. María del Carmen Galera-Quiles wrote the introduction and state of the art.

Conflicts of Interest

The authors declare no conflict of interest. The founding sponsors had no role in the design of the study; in the collection, analyses, or interpretation of data; or in the writing of the manuscript and the decision to publish the results.

Appendix A

Table A1. Taxes for self-consumption of renewables (from January 2016).
TOLLSTemporary Charge for Self-Consumption Energy (€/kWh)
201620172018201920202021
a 2.0 A (Pc ≤ 10 kW)0.049033-----
2.0 DHA (Pc ≤ 10 kW)0.0631410.008907----
2.0 DHS (Pc ≤ 10 kW)0.0639130.0094050.008767---
2.1 A (10 < Pc ≤ 15 kW)0.060728-----
2.1 DHA (10 < Pc ≤ 15 kW)0.0740790.018282----
2.1 DHS (10 < Pc ≤ 15 kW)0.0748510.0213010.014025---
3.0 A (Pc > 15 kW)0.0293990.0193340.011155---
b 3.1 A (1 kV to 36 kV)0.0226560.0151000.014197---
6.1 A (1 kV to 30 kV)0.0188490.0161960.0115340.125180.0132670.008879
6.1 B (30 kV to 36 kV)0.0188490.0138900.0109810.0119050.0128710.008627
6.2 (36 kV to 72.5 kV)0.0201380.0161940.0116910.0116960.0119960.008395
6.2 (72.5 kV to 145 kV)0.0224980.0174140.0123190.0118240.0119530.008426
6.4 (Higher or equal to 145 kV)0.0188490.0131380.0109810.0111040.0115370.008252
Source: Royal Decree-Law 900/2015; a Power (Pc); b Tension.

References

  1. REN21. Renewables 2015 Global Status Report; REN21 Secretariat: Paris, France, 2015. [Google Scholar]
  2. Brudermann, T.; Reinsberger, K.; Orthofer, A.; Kislinger, M.; Posch, A. Photovoltaics in agriculture: A case study on decision making of farmers. Energy Policy 2013, 61, 96–103. [Google Scholar] [CrossRef]
  3. European Commission. PVGIS Project; Joint Research Centre, Institute for Energy and Transport: Ispra, Italy, 2013; Available online: http://re.jrc.ec.europa.eu/pvgis/solres/solrespvgis.htm (accessed on 15 October 2016).
  4. Goetzberger, A.; Zastrow, A. On the coexistence of solar-energy conversion and plant cultivation. Int. J. Sol. Energy 1982, 1, 55–69. [Google Scholar] [CrossRef]
  5. Dupraz, C.; Marrou, H.; Talbot, G.; Dufour, L.; Nogier, A.; Ferard, Y. Combining solar photovoltaic panels and food crops for optimising land use: Towards new agrivoltaic schemes. Renew. Energy 2011, 36, 2725–2732. [Google Scholar] [CrossRef]
  6. Radulovic, V. Are new institutional economics enough? Promoting photovoltaics in India’s agricultural sector. Energy Policy 2005, 33, 1883–1889. [Google Scholar] [CrossRef]
  7. Borges Neto, M.R.; Carvalho, P.C.M.; Carioca, J.O.B.; Canafístula, F.J.F. Biogas/photovoltaic hybrid power system for decentralized energy supply of rural areas. Energy Policy 2010, 38, 4497–4506. [Google Scholar] [CrossRef]
  8. Mekhilef, S.; Faramarzi, S.Z.; Saidur, R.; Salam, Z. The application of solar technologies for sustainable development of agricultural sector. Renew. Sustain. Energy Rev. 2013, 18, 583–594. [Google Scholar] [CrossRef]
  9. Marrou, H.; Wery, J.; Dufour, L.; Dupraz, C. Productivity and radiation use efficiency of lettuces grown in the partial shade of photovoltaic panels. Eur. J. Agron. 2013, 44, 54–66. [Google Scholar] [CrossRef]
  10. Marrou, H.; Guilioni, L.; Dufour, L.; Dupraz, C.; Wery, J. Microclimate under agrivoltaic systems: Is crop growth rate affected in the partial shade of solar panels? Agric. Forest Meteorol. 2013, 177, 117–132. [Google Scholar] [CrossRef]
  11. Harshavarhan, D.; Pearce, J.M. The potential of agrivoltaic systems. Renew. Sustain. Energy Rev. 2016, 54, 299–308. [Google Scholar] [CrossRef]
  12. Reuss, M.; Schuerzinger, H.; Schulz, H. Practical application of photovoltaics in agriculture and horticulture. In Clean and Safe Energy Forever; Horigome, T., Kimura, K., Takakura, T., Nishino, I., Fujii, I., Eds.; Elsevier Ltd.: Amsterdam, The Netherlands, 1990; Volume 1, pp. 277–281. [Google Scholar]
  13. Jager, W. Stimulating the diffusion of photovoltaic systems: A behavioural perspective. Energy Policy 2006, 34, 1935–1943. [Google Scholar] [CrossRef]
  14. Pérez-Alonso, J.; Pérez-García, M.; Pasamontes-Romera, M.; Callejón-Ferre, A.J. Performance analysis and neural modelling of a greenhouse integrated photovoltaic system. Renew. Sustain. Energy Rev. 2012, 16, 4675–4685. [Google Scholar] [CrossRef]
  15. European Commission. A Policy Framework for Climate and Energy in the period from 2020 to 2030 (COM(2014)); Communication from the Commission to the European Parliament, the Council, the European Economic and Social Committee and the Committee of the Regions; European Commission: Brussels, Belgium, 2014. [Google Scholar]
  16. Consejería de Agricultura, Pesca y Desarrollo Rural. Superficie Agraria y Producción 2015; Junta de Andalucía: Sevilla, Spain, 2016.
  17. Consejería de Agua, Agricultura y Medio Ambiente. Superficie Hortofrutícola; Región de Murcia: Murcia, Spain, 2016.
  18. Ossenbrink, H.; Huld, T.; Jäger Waldau, A.; Taylor, N. Photovoltaic Electricity Cost Maps; JRC Scientific and Policy Reports; European Commission: Brussels, Belguim, 2013. [Google Scholar]
  19. Daniels, B.W.; Boerakker, Y.H.A.; van der Welle, A.J.; Wetzels, W. High-Efficiency Cogeneration in the Netherlands; Prepared for the Dutch Ministry of Economic Affairs; Energy Research Centre of the Netherlands: Petten, The Netherlands, 2007. [Google Scholar]
  20. Kramp, D.; Hesener, J. Advancing British Columbia’s Greenhouse Sector with GE Greenhouse CHP and BC Hydro’s Standard Offer; BC Greenhouse Growers: Surrey, BC, Canada, 2011. [Google Scholar]
  21. Sgroi, F.; Tudisca, S.; Di Trapani, A.M.; Testa, R.; Squatrito, R. Efficacy and efficiency of Italian energy policy: The case of PV systems in greenhouse farms. Energies 2014, 7, 3985–4001. [Google Scholar] [CrossRef]
  22. Fundazioa, E. Greenhouses and solar power: Crop testing with a special photovoltaic panel for greenhouses. Science Daily. 11 January 2012. Available online: http://www.sciencedaily.com/releases/2012/01/120111103858.htm (accessed on 15 October 2016).
  23. Silva Herran, D.; Nakata, T. Design of decentralized energy systems for rural electrification in developing countries considering regional disparity. Appl. Energy 2012, 91, 130–145. [Google Scholar] [CrossRef]
  24. Consejería de Agricultura, Pesca y Desarrollo Rural. Greenhouse Consumption 2014–2015; Junta de Andalucía: Sevilla, Spain, 2015.
  25. Galdeano-Gómez, E.; Aznar, J.A.; Pérez-Mesa, J.C. Sustainability dimensions related to agricultural-based development: The experience of 50 years of intensive farming in Almería (Spain). Int. J. Agric. Sustain. 2013, 11, 125–143. [Google Scholar] [CrossRef]
  26. Al-Shamiry, F.M.S.; Ahmad, D.; Sharif, A.R.M.; Aris, I.; Janius, R.; Kamaruddin, R. Design and development of photovoltaic power system for tropical greenhouse cooling. Am. J. Appl. Sci. 2007, 4, 386–389. [Google Scholar] [CrossRef]
  27. Carlini, M.; Honorati, T.; Castellucci, S. Photovoltaic greenhouses: Comparison of optical and thermal behavior for energy savings. Math. Probl. Eng. 2012, 2012, 743764. [Google Scholar] [CrossRef]
  28. Esen, M.; Yuksel, T. Experimental evaluation of using various Renew Energy sources for heating a greenhouse. Energy Build. 2013, 65, 340–351. [Google Scholar] [CrossRef]
  29. Rocamora, M.C.; Tripanagnostopoulos, Y. Aspects of PV/T solar system application for ventilation needs in greenhouses. Acta Hortic. 2006, 719, 239–246. [Google Scholar] [CrossRef]
  30. Yano, A.; Tsuchiya, K.; Nishi, K.; Moriyama, T.; Ide, O. Development of a greenhouse side-ventilation controller drive by photovoltaic energy. Biosyst. Eng. 2007, 96, 633–641. [Google Scholar] [CrossRef]
  31. Al-Ibrahim, A.; Al-Abbadi, N.; Al-Helal, I. PV greenhouse system—System description, performance and lesson learned. Acta Hortic. 2006, 710, 251–264. [Google Scholar] [CrossRef]
  32. Cossu, M.; Murgia, L.; Ledda, L.; Deligios, P.A.; Sirigu, A.; Chessa, F.; Pazzona, A. Solar radiation distribution inside a greenhouse with south-oriented photovoltaic roofs and effects on crop productivity. Appl. Energy 2014, 133, 89–100. [Google Scholar] [CrossRef]
  33. Janjai, S.; Lamlert, N.; Intawee, P.; Mahayothee, B.; Bala, B.K.; Nagle, M.; Muller, J. Experimental and simulated performance of a PV-ventilated solar greenhouse dryer for drying of peeled longan and banana. Sol. Energy 2009, 83, 1550–1565. [Google Scholar] [CrossRef]
  34. Nayak, S.; Tiwari, G.N. Theoretical performance assessment of an integrated photovoltaic and earth air heat exchanger greenhouse using and energy analysis methods. Energy Build. 2009, 41, 888–896. [Google Scholar] [CrossRef]
  35. Minuto, G.; Bruzzone, C.; Tinivella, F.; Delfino, G.; Minuto, A. Photovoltaics on greenhouse roofs to produce more energy. Inf. Agrar. Suppl. 2009, 65, 16–19. [Google Scholar]
  36. Ganguly, A.; Mistra, D.; Gosh, S. Modeling and analysis of solar photovoltaic-electrolyzer-fuel cell hybrid power system integrated with a floriculture greenhouse. Energy Build. 2010, 42, 2036–2043. [Google Scholar] [CrossRef]
  37. Yano, A.; Kadowaki, N.; Furue, A.; Tamaki, N.; Tanaka, T.; Hiraki, E. Shading and electrical features of a photovoltaic array mounted inside the roof of an east west oriented greenhouse. Biosyst. Eng. 2010, 106, 367–377. [Google Scholar] [CrossRef]
  38. Ureña-Sánchez, R.; Callejón-Ferre, A.; Pérez-Alonso, J.; Carreño-Ortega, A. Greenhouse tomato production with electricity generation by roof-mounted flexible solar panels. Sci. Agric. 2013, 69, 233–239. [Google Scholar] [CrossRef]
  39. Kadowaki, M.; Yano, A.; Ishizu, F.; Tanaka, T.; Noda, S. Effects on greenhouse photovoltaic array shading on Welsh onion growth. Biosyst. Eng. 2012, 111, 290–297. [Google Scholar] [CrossRef]
  40. Kuo, Y.C.; Chiang, C.M.; Chou, P.C.; Chen, H.J.; Lee, C.Y.; Chan, C.C. Applications of building integrated photovoltaic modules in a greenhouse Northern Taiwan. J. Biobased Mater. Bioenergy 2012, 6, 721–727. [Google Scholar] [CrossRef]
  41. Poncet, C.; Muller, M.M.; Brun, R.; Fatnassi, H. Photovoltaic greenhouses, non-sense or a real opportunity for the greenhouse systems? In Proceedings of the XXVIII International Horticultural Congress on Science and Horticulture for People (IHC2010): International Symposium on Greenhouse 2010 and Soilless Cultivation, Lisbon, Portugal, 22–27 August 2010; pp. 75–77. [Google Scholar]
  42. Fatnassi, H.; Poncet, C.; Bazzano, M.M.; Brun, R.; Bertin, N. A numerical simulation of the photovoltaic greenhouse microclimate. Sol. Energy 2015, 120, 575–584. [Google Scholar] [CrossRef]
  43. International Renewable Energy Agency. Renewable Energy Generation Costs; IRENA: Abu Dhabi, UAE, 2015. [Google Scholar]
  44. Ministerio de Industria, Energía y Turismo. Plan de Acción Nacional de Energías Renovables de España (PANER) 2011–2020; Ministerio de Industria, Energía y Turismo: Madrid, Spain, 2015.
  45. European Commission. Country Factsheet Spain; Communication from the Commission to the European Parliament, the Council, the European Economic and Social Committee, the Committee of the Regions and the European Investment Bank; European Commission: Brussels, Belgium, 2015. [Google Scholar]
  46. Rojas, A.; Tubío, B. La retribución de las energías renovables: Retos e incertidumbres. Cuadernos de Información Económica 2015, 245, 73–83. [Google Scholar]
  47. André, F.; De Castro, L.; Cerdá, E. Las energías renovables en el ámbito internacional. Cuadernos Económicos de ICE 2012, 83, 11–37. [Google Scholar]
  48. Uusitalo, L.; Lehikoinen, A.; Helle, I.; Myrberg, K. An overview of methods to evaluate uncertainty of deterministic models in decision support. Environ. Model. Softw. 2015, 63, 24–31. [Google Scholar] [CrossRef]
  49. Saltelli, A.; Chan, K.; Scott, E. Sensitivity Analysis; John Wiley & Sons, Ltd.: Chichester, UK, 2000. [Google Scholar]
  50. Eurostat. Energy Prices in the EU in 2016. Available online: http://ec.europa.eu/eurostatl (accessed on 12 November 2016).
  51. Branker, K.; Pathak, M.J.M.; Pearce, J.M. A review of solar photovoltaic levelized cost of electricity. Renew. Sustain. Energy Rev. 2011, 15, 4470–4482. [Google Scholar] [CrossRef]
  52. Instituto para la Diversificación y Ahorro de Energía. Impacto Económico de las Energías Renovables en el Sistema Productivo Español; Estudio Técnico PER 2011–2020; IDAE; Ministerio de Industria, Energía y Turismo: Madrid, Spain, 2011.
  53. Martínez Martín, M.I.; Cámara Sánchez, A.; Guilló Rodríguez, N.; Fernández e Beaumont, I. El Impacto de las Energías Renovables en la Economía con el Horizonte 2030; Abay Analistas Económicos y Sociales for Greenpeace: Vancouver, BC, Canada, 2014. [Google Scholar]
  54. Joint Research Center, Ispra, Italy. PVGIS (c). European Communities, 2001–2012. Available online: http://re.jrc.ec.europa.eu/pvgis/ (accessed on 10 November 2016).
  55. National Renewable Energy Laboratory. 2016. Available online: http://www.nrel.gov/ncpv/images/efficiency_chart.jpg (accessed on 20 October 2016).
  56. Informe Anual de Precios. 2015. Available online: http://www.omie.es/inicio/publicaciones/informe-anual (accessed on 15 October 2016).
  57. Dusonchet, L.; Telaretti, E. Economic analysis of different supporting policies for the production of electrical energy by solar photovoltaics in western European Union countries. Energy Policy 2010, 38, 3297–3308. [Google Scholar] [CrossRef]
  58. Coady, D.; Parry, I.; Sears, L.; Shang, B. How Large are Global Energy Subsidies? The International Platform of Luwdig-Maximilian University´s Center for Economics Studies and the IFO Institute: Munich, Germany, 2016. [Google Scholar]
  59. Consejería de Agricultura, Pesca y Desarrollo Rural. Precios y Productividades de la Campaña 2014/15; Observatorio de Precios de la Consejería de Agricultura de la Junta de Andalucía: Sevilla, Spain, 2016.
  60. NCPV National Center for Photovoltaics (NCPV) at the National Renewable Energy Laboratory (NREL) USA, 2016. Available online: http://www.nrel.gov/ncpv/images/efficiency_chart.jpg (accessed on 17 October 2016).
  61. Cengiz, M.S.; Mamiş, M.S. Price-efficiency relationship for photovoltaic systems on a global basis. Int. J. Photoenergy 2015, 2015, 256101. [Google Scholar] [CrossRef]
  62. Becerril, H.; de los Rios, I. Energy Efficiency Strategies for Ecological Greenhouses: Experiences from Murcia (Spain). Energies 2016, 9, 866. [Google Scholar] [CrossRef]
  63. European Commission. A Strategy for Smart, Sustainable and Inclusive Growth (COM(2010)); Communication from the Commission Europe 2020; European Commission: Brussels, Belgium, 2010. [Google Scholar]
  64. Bortolini, M.; Gamberi, M.; Grazziani, A.; Pilati, F. Economic and environmental bi-objective design of an off-grid photovoltaic-battery-diessel generator hybrid energy system. Energy Convers. Manag. 2015, 106, 1024–1038. [Google Scholar] [CrossRef]
  65. Ministerio de Agricultura, Alimentación y Medio Ambiente. Comunicación al Secretariado de la Convención Marco de NNUU sobre Cambio Climático, España, Inventario Nacional de Emisiones de Gases de Efecto Invernadero 1990–2014; Secretaría de Estado de Medio Ambiente: Madrid, Spain, 2016.
  66. Apergis, N.; Payne, J.E. Renewable energy consumption and economic growth: Evidence from a panel OECD countries. Energy Policy 2010, 38, 656–660. [Google Scholar] [CrossRef]
  67. Sadorsky, P. Renewable energy consumption and income in emerging economies. Energy Policy 2009, 37, 4021–4028. [Google Scholar] [CrossRef]
  68. Tugcu, C.T.; Ozlturk, I.; Aslain, A. Renewable and non-renewable energy consumption and economic growth revisited: Evidence from G7 countries. Energy Econ. 2012, 34, 1942–1950. [Google Scholar] [CrossRef]
  69. Silva, S.; Soares, I.; Pinho, C. The impact of renewable energy sources on economic growth and CO2 emissions—A SVAR approach. Eur. Res. Stud. J. 2012, 15, 133–144. [Google Scholar]
  70. Garí, M.; Arregui, G.; Candela, J.; Estrada, B.; Medialdea, B.; Pérez, S. Estudio sobre el Empleo Asociado al Impulso de las Energías Renovables en España 2010; ISTAS, Comisiones Obreras: Madrid, Spain, 2010. [Google Scholar]
  71. Burgillo, M.; Del Río, P. An empirical analysis of the impact of renewable energy deployment on local sustainability. Renew. Sustain. Energy Rev. 2009, 13, 1314–1325. [Google Scholar]
  72. Roca, L.; Sánchez, J.A.; Rodríguez, F.; Bonilla, J.; De La Calle, A.; Berenguel, M. Predictive control applied to a solar desalination plant connected to a greenhouse with daily variation of irrigation water demand. Energies 2016, 9, 164. [Google Scholar] [CrossRef]
Figure 1. Photovoltaic (PV) potential installed in the world (in MW) [43].
Energies 10 00761 g001
Figure 2. New PV potential installed in Spain (in kW) [44].
Energies 10 00761 g002
Figure 3. PV panels mounted on greenhouse roof. TECNOVA foundation experimental PV greenhouse (Almería).
Energies 10 00761 g003
Figure 4. Price and efficiency rates development for different PV technologies [61].
Energies 10 00761 g004
Figure 5. Spain´s renewable energy target 2020 [15,63] (Authors’ calculation from 2015 to 2020).
Energies 10 00761 g005
Figure 6. Projection renewables contribution with greenhouses (Authors’ calculation).
Energies 10 00761 g006
Figure 7. Spanish emissions trend in agricultural and livestock sector (MtCO2Eq) ([65], Authors’).
Energies 10 00761 g007
Figure 8. Trend of PV sector contribution to Spanish gross domestic product (GDP) in millions of real euros (basis 2010), for the period 2005–2009 [52].
Energies 10 00761 g008
Figure 9. Distribution of area of greenhouses (hectares) in southeast Spain. (a) Percentage distribution by province; and (b) Percentage distribution by crop.
Energies 10 00761 g009
Figure 10. Savings % according to the profit of each crop.
Energies 10 00761 g010
Figure 11. Savings (million €) in horticultural sector in southeast Spain using PV systems.
Energies 10 00761 g011
Figure 12. Savings (million €) in horticultural sector in southeast Spain using PV systems.
Energies 10 00761 g012
Table 1. Base values of sensitivity analysis.
Model Input Parameters Unmodified in the Simulation (m = 8)Base ValueIncrease and Decrease (%) Simulation
γ (kWh/kWp): Production ratio (energy yield)1437.78 (in Almería) 4-
Si (m2): Greenhouse surface area18,000-
β (Wp): Power of roof-mounted PV module240-
Sp (m2): Area of installed PV module1.66-
n (years): Lifespan of PV panels23 5-
ϕ (kg/m2): Yield13 (tomato production) 1-
Eg (kWh): Greenhouse energy consumption per year and hectare13,986 1-
Eh (kWh): Adjacent home energy consumption per year15,514 6-
Sensitive Variables 5Base ValueIncrease and Decrease (%) Simulation
i (integer value): Capital cost3%±50%
Pφ (€/kg): Selling Price0.53 (tomato, original price) 1±20%
Cφ (€/kg): Production cost0.38 (tomato, production cost) 1±20%
Pe (€/kWh): Consumer electricity price0.1573 (electricity price) 2±50%
Cu (€/kWp): PV unit cost1725.7 (installation cost PV) 3±20%
Table 2. Sensitivity analysis (1.8 ha).
Unsubsidized InvestmentSubsidized Investment
Farm Profit k€Energy Production k€Profitability Increase %Farm Profit k€Energy Production k€Profitability Increase %
Baseline case35.13.479.89%35.14.9414.10%
Interest rate
Increased by 50% (3 + 1.5%)35.138.55%35.14.7113.42%
Reduced by 50% (3 − 1.5%)35.13.911.11%35.15.1614.70%
Tomato, starting price
Increased by 20% (0.53 + 0.11)60.843.475.70%60.844.948.12%
Reduced by 20% (0.53 − 0.11)9.363.4737.07%9.364.9452.78%
Tomato production cost
Increased by 20% (0.38 + 0.08)16.383.4721.18%16.384.9430.16%
Reduced by 20% (0.38 − 0.08)53.823.476.45%53.824.949.18%
Consumer electricity price
Increased by 50% (0.16 + 0.08)35.16.8419.49%35.18.3123.68%
Reduced by 50% (0.16 − 0.08)35.10.310.88%35.11.795.10%
Photovoltaic unit cost
Increased by 20% (1725 + 345)35.12.888.21%35.14.6513.25%
Reduced by 20% (1725 − 345)35.14.0611.57%35.15.2414.93%
Table 3. Profitability variation depending of greenhouse dimensions (self-consumption scenario).
Surface m2% ShadeProfitability Increase without SubsidiesProfitability Increase with Subsidies
25003.733.5247.78
50002.1719.6628.02
75381.6615.0421.44
10,0001.4212.8718.34
18,0001.099.8814.08
20,0001.059.5113.56
25,0000.978.7912.53
30,0000.928.3411.88
35,0000.898.0611.49
Table 4. Energy production estimation for a 10% greenhouse area covered by PV modules (Authors’ calculation).
Greenhouse Electric ProductionValue
Area PV modules used1.66 m2
PV Module potential240 Wp
Number of PV modules per ha600 uds
Installed power capacity per ha144 kWp
Production ratio in southeast Spain1437.78 kWh/kWp
Electric production per ha207,040 kWh/year
Electric production 41,092 ha8507 GWh/year
Table 5. Projection of renewable energies (ktep) 2015–2020 (Authors’ calculation).
Year201520162017201820192020
Projection13,61414,03214,53314,95115,36815,786
% of energy on pool16.3%16.8%17.4%17.9%18.4%18.9%
Table 6. Reduction of GHG emissions for 10% greenhouse area covered by PV modules ([52], Authors’). GHG: greenhouse gas.
GHGValue
Reduction coal electricity8507 GWh/year
Coal emission factor1.09 tCO2/MWh
PV emission factor0.0 tCO2/MWh
Reduction GHG emissions9,272,630 tCO2
Table 7. Impact on GDP, employment and R&D: forecasts for 2020. Estimates based on [52,53].
New Installed PowerContributions to GDP bContribution to EmploymentContribution to R&D b
Greenhouses5917 MWDirect impact c3245.4Direct c40,75961.15
Rest of country a1258 MWIndirect impact d855.4Indirect d18,341
Total7175 MWTotal 4100.8Total employment59,100
a The installed power is only considered until 2015; b Constant millions of euros (basis 2010); c Direct effects: production, installation and operation of new PV energy plants; d Indirect effects: link to other sectors and industries indirectly involved un investments in new plants and energy distribution.

