
Optimizing the Renewable Energy Potential: Myth or Future Trend in Romania


1
Faculty of Banking and Finance, Accountancy and Business Administration, Titu Maiorescu University, Calea Vacaresti Street, No. 189, Bucharest 040051, Romania
2
Faculty of Economic Sciences, Valahia University, Carol I Bvd, No. 2, Targoviste 130024, Romania
3
Faculty of Management in Production and Transports, Politehnica University of Timisoara, Remus Street, No. 14, Timisoara 300289, Romania
*
Author to whom correspondence should be addressed.
Energies 2017, 10(6), 759; https://doi.org/10.3390/en10060759
Submission received: 9 March 2017
/
Revised: 10 May 2017
/
Accepted: 25 May 2017
/
Published: 29 May 2017
(This article belongs to the Special Issue Sustainable and Renewable Energy Systems)
Abstract
:This paper investigates the potential of Romanian renewable energy across energy production and consumption definitions. Moreover, it presents a model that estimates the regional evolution of renewable energy diffusion, focusing primarily on hydro energy. Statistics showed that Romanian consumers have a key role in developing the renewable energy market, while it is also very important to ensure the ability of renewable energy suppliers to accommodate this demand. Sample data and econometric analysis were applied to delineate factors influencing Romanian consumers’ awareness about renewable energy. The findings highlighted a strong connection between those who bear the cost of renewable energy development and the actual beneficiaries of a clean environment; in that sense, they identify the major drivers and barriers for renewable energy diffusion in Romania. The results of this research could be used for further research in the area of implementing renewable energy projects in the region.
1. Introduction
For most of the 20th century, in many societies, the issue of sustainability was neglected, as industrialization and economic growth took precedence over the preservation of the environment using renewable energy and the need to ensure a fair standard of living for people across the world [1,2].
In order to ensure sustainable development, one of the EU’s objectives is CO2 reduction. Therefore, the EU follows a strict framework regarding climate and energy policies until 2020. The main goals are reducing greenhouse gas emissions (GGE), ensuring energy supply, supporting economic growth, competitiveness and employment through efficient and advanced technologies from the point of view of costs and resource usage [3].
The EU set a number of short- and long-term quantitative climate and energy targets for its member countries, notably the 20-20-20 climate and energy targets, the 2030 framework for climate and energy policies and the roadmap for moving towards a low-carbon economy in 2050. A recent report expects a significant increase in final energy demand (FED), particularly in the transport and services sectors [4,5].
According to the data available in the National Renewable Energy Action Plan, the biggest amount of energy obtained from renewable resources in the total consumption was registered in 2010 in: Sweden (47.9%), Latvia (32.6%), Finland (32.2%), Austria (30.1%), Portugal (24.6%), Estonia (24.3%) and Romania (23.4%). The lowest percentages were registered in Malta (0.4%), Luxemburg (2.8%), Great Britain (3.2%) and Holland (3.8%), while the EU average percentage was 12.4%. According to the targets assumed through the Energetic Strategy of Romania in 2007–2020, Romania’s objective is to reach 40% until 2020 [6].
The progress registered in this area in some EU countries is so significant that it might be possible for renewable energy production facilities to be closed because of overproduction [7,8,9,10,11]. One of these countries is Romania. The premise encouraging this progress was that supporting renewable energy would lead to a drop in electric energy prices.
The premise according to which renewable energy would lead to decreasing energy prices proved to be false [12,13]. The average market price for 1 MWh is higher than in the past and compared to the competitors, both in the EU and the Black Sea region. Thus, the industrial consumers have paid in 2016 21% more per MWh compared with 2014. In the USA, the average cost of energy paid by companies (USD/MWh) is less than 40, in Germany 50 and in France 60, and in Romania, it is 80 (USD/MWh). Considering the electricity price in Romania, more than 30 $/MWh are solely subsidies, like the eco-taxes for renewable energy and cogeneration, transportation and infrastructure tariffs. This makes the Romanian industry less and less competitive. Currently, intensive energy industries (such as metallurgy, aluminum processing industry), which have invested over 10 billion Euros in the Romanian economy and employed more than 500,000 people, are obliged to support sectors in renewable energy that create no more than a few thousand jobs [14].
Romania’s entry into the EU in 2007 accelerated the growth, although the country was badly hit by the 2009–2010 financial crises. Between 1995 and 2013, Romania’s per capita income increased by 73%, more than twice as fast as Germany (28%) and the EU average (30%). Over the past decade, the country’s real gross domestic product (GDP) and household disposable income per capita grew yearly on average by 3.5% the first and 7.2% the latter, well above the average rate of the EU as a whole [15].
According to the Green Paper, until 2030 [16], producing energy entirely from renewable sources is encouraged in the EU electricity system. Therefore, for Romania, the issues of a lack of continuity are solved, as well as improving cooperation among member states, in order to reach targets. Connecting the gross electricity markets in Romania will lead to integrating renewables into the electricity system, as well as introducing some intelligent electricity networks, which should offer opportunities for adjusting the production, managing the network, storage and consumption to the changing situation of the markets. In order to integrate renewables, big investments will be necessary in the transport and distribution networks, including through border infrastructure, in order to complete the internal market for energy [16].
At the same time, the price of renewables will become cost effective, and the use of support schemes is going to be limited to technologies and areas that still need their use. These schemes should be elaborated in a manner permitting the avoidance of overcompensation, to improve cost efficiency and to encourage the significant reduction of greenhouse gas emissions [17].
From this perspective, the major objectives of the energy policy in Romania follow the five directives for energy from the 2020 Strategy: (1) developing an integrated energy market at the pan-European level; (2) improving energy efficiency; (3) ensuring safety in providing and supplying energy for European consumers and (4) improving innovation in the European energy sector; (5) growing the EU’s role as a major actor in the international energy market [14].
Covering the growth of demand in primary and final energy in Romania will be possible through an increased use of renewables and through imports of primary energy resources. The renewable energy sources hold an important energy potential, and they deliver unlimited availabilities of use at the local and national level. Their usage should take into account three important issues: accessibility, availability and acceptability. This means that, from the point of view of the capacity of electricity and heat production, they are not upgraded to the operating parameters allowing efficient use of energy resources during the production process [18].
The goal of this research is to investigate the renewable energy potential of Romania, and it presents a model to estimate the region’s evolution of renewable energy diffusion, focusing on hydro energy (Central Transylvanian Basin). It is important to note that, in Romania and in other emerging countries, the subject of renewable energy (such as solar, wind, hydropower, geothermal and biomass) reveals that in the overgrowing development of renewable energy and for creating a regional energy market, the benefits and real costs must be taken into consideration, which was implied [19].
The following research questions have been formulated: Can renewable energy represent a pathway to reduce the external energy dependence of Romania? Could future renewable energy systems be analyzed with the aid of economic and environmental indicators in the case of time variance? Should policymakers, investors and other stakeholders have tools for implementing the policies, investments and measures for renewable energy business functioning?
The structure of this article is as follows: Firstly, the study discloses an analysis of renewable energy potential in Romania in order to reveal the areas that have the highest potential of wind energy, solar energy, hydro energy, biomass and geothermal energy. The next sections describe the research methodology, with associated findings, and provide a discussion of the results. The final section presents the conclusions reached from the study.
The research was conducted using a large variety of sources, such as statistics, research reports or articles, and it will be used in order to develop a complex software, which will analyze the renewable energy potential of the regions.
2. The Potential of Renewable Energy Sources in Romania
Renewables have a significant ramification on the utility’s strategy and investments. The traditional strategy for utilities harkens back to their beginnings for how to deal with base and variable or peak load demand. Its present version is to have a base load (nighttime demand) satisfied by coal and nuclear operating at full power continuously day and night throughout the year except for downtime for maintenance. Higher daytime demand is chiefly satisfied by layering various types of natural gas plants starting with high energy-efficient and high-cost co-generating plants that may operate 10–12 h a day [20]. A less costly and less energy-efficient conventional natural gas generating plant may satisfy daytime electricity demand for 4–10 h per day. Some conventional natural gas plants may operate for less time to cover daily peak demand. Annual peak demand for electricity may last for a few hours each day over the course of 2–3 months, usually during times of extremely hot weather to satisfy air conditioning demand. Generators for meeting annual peak demand tend to be low energy efficient and low capital cost, epitomized by gas turbines, which are essentially jet engines attached to generators [21].
The renewable energy support scheme approved by Romania was one of the most generous among the EU countries, especially for the wind and photovoltaic energy. This scheme follows the award of over 10 billion Euros for 10 years to investors in this field. Romania set as a target 24% of energy consumption coming from renewable sources in 2020 [22].
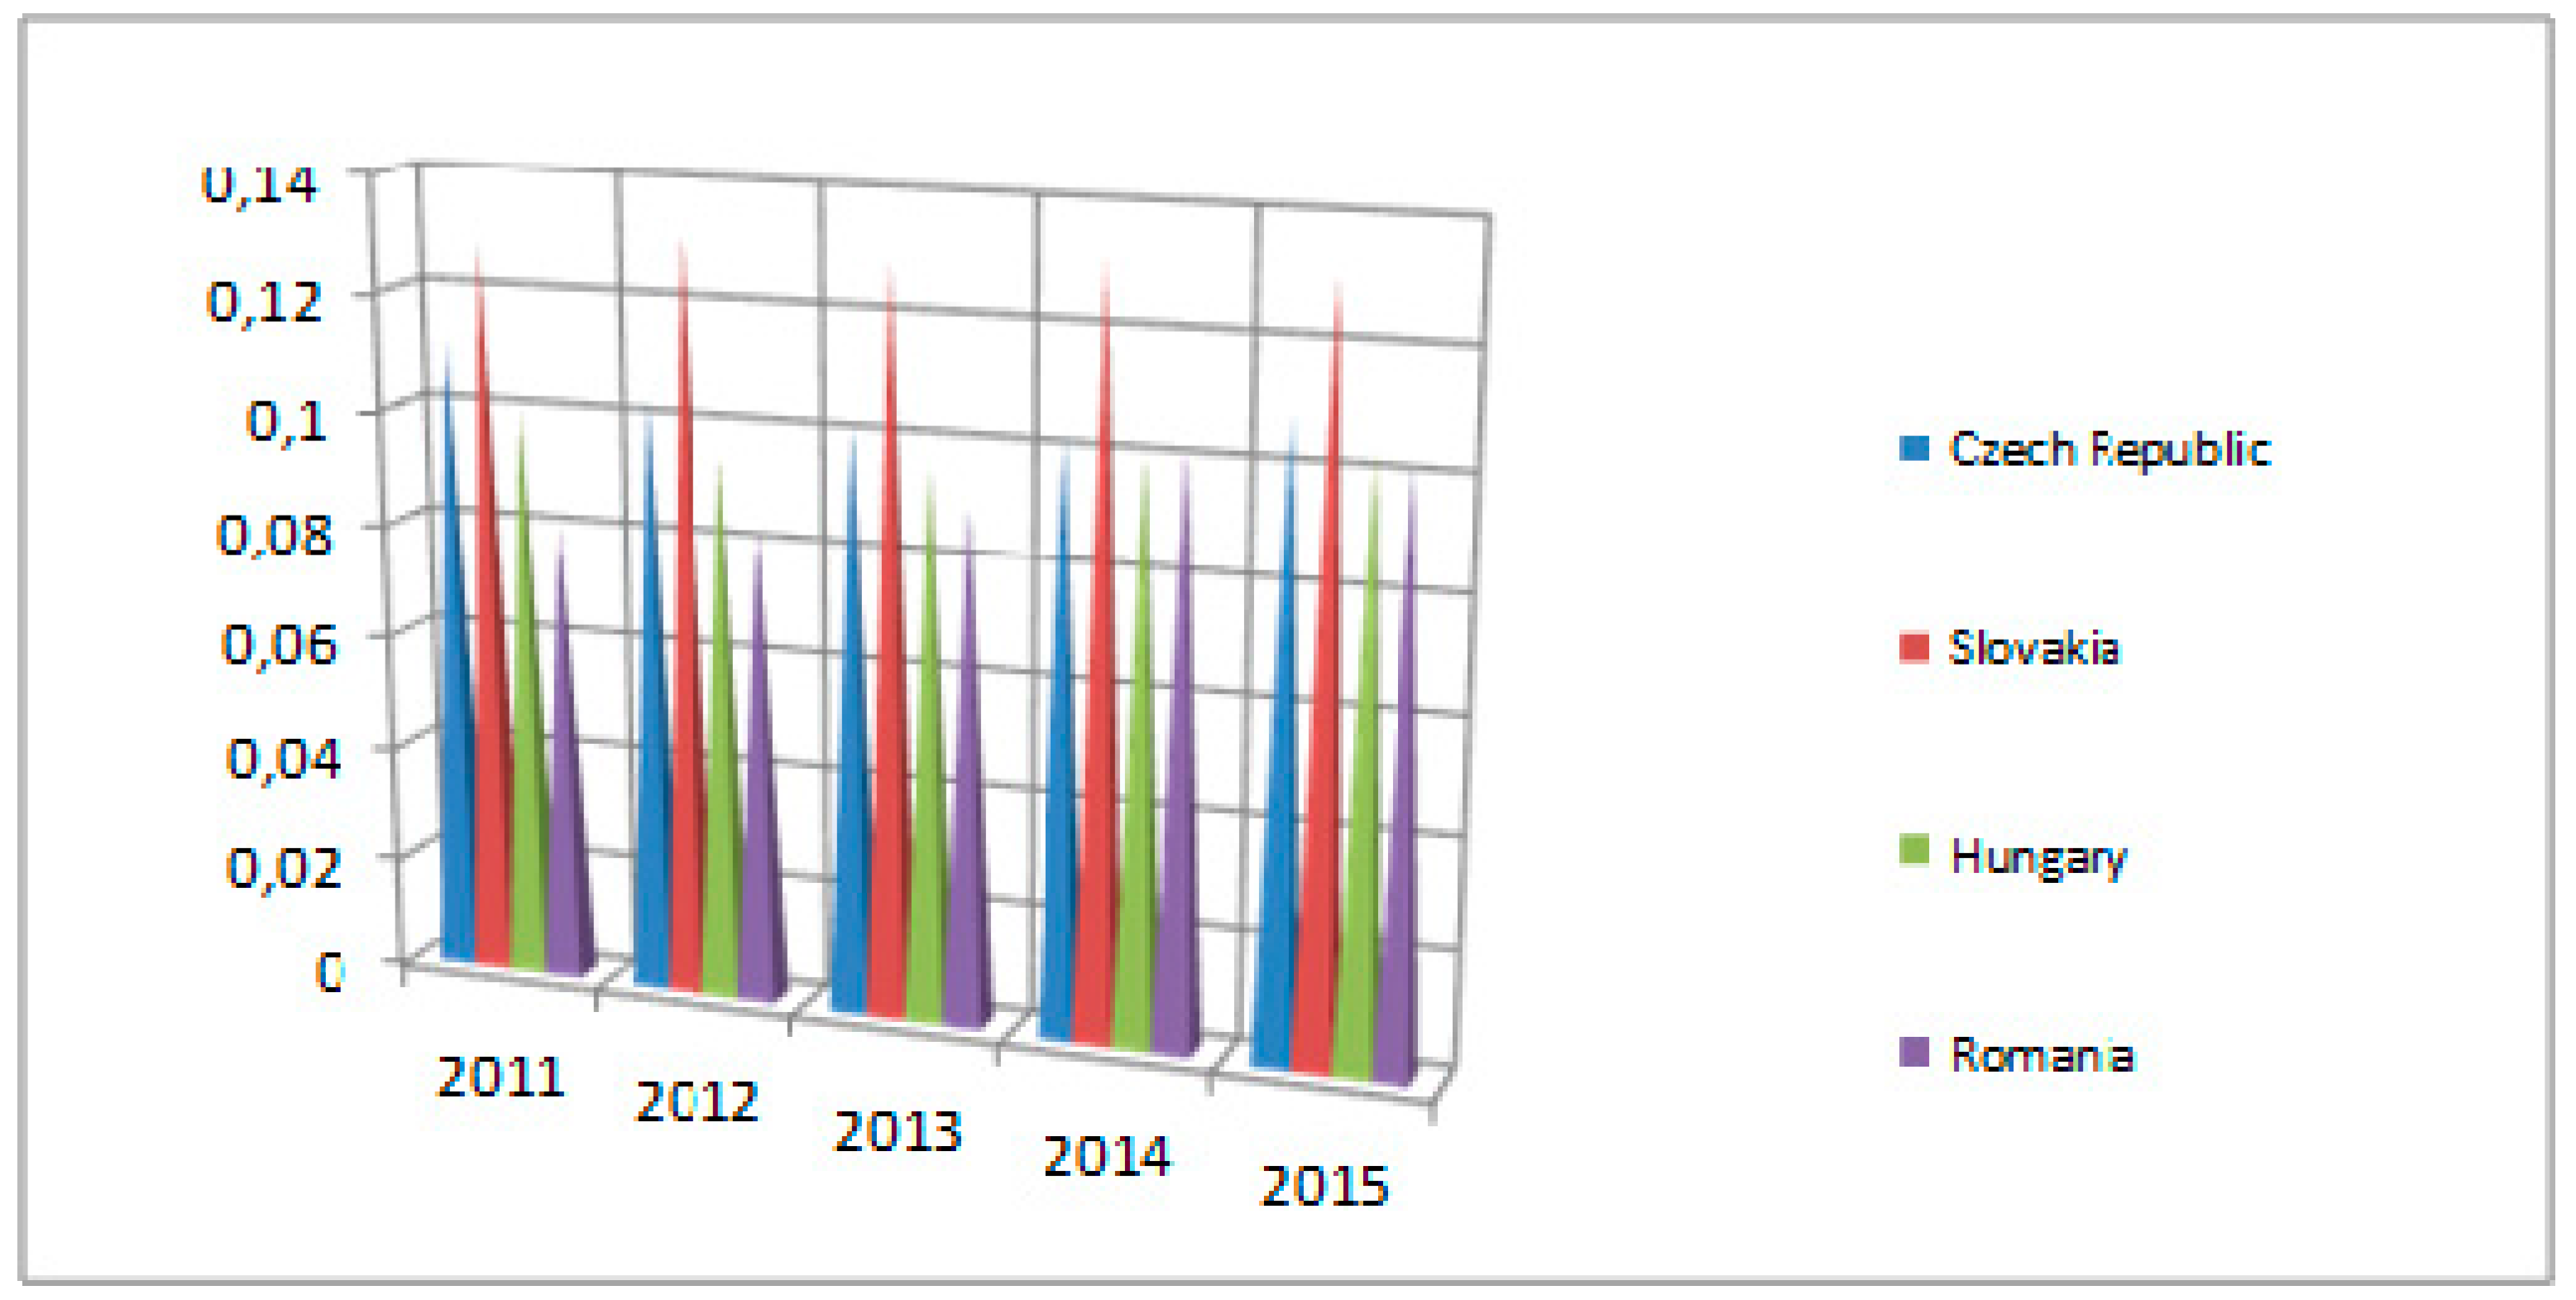
Nevertheless, The Eurostat data reveal that between the second half of 2014 and the second half of 2015, electricity prices for households decreased in 12 EU Member States. The largest price increase among EU member states between the second semester of 2014 and the second semester of 2015 was observed in Poland (+4%), Bulgaria and the United Kingdom (both over +3%), while prices went down significantly in Cyprus (26%), Malta (23%), and Greece (11%). In the Czech Republic, Slovakia and Hungary, electricity from renewable energy sources is supported by a feed-in-tariff system. The electricity prices for industry in EUR/kWh are shown in Figure 1.
These disparities are likely to be influenced by a number of socioeconomic factors, including variations in disposable income and electricity prices, but also by climate, lifestyles, average household size and the energy efficiency of dwellings, among others [24]. The comparison between the 2015 and 2016 prices is made with national currency prices in order to exclude changes in national currency to Euro exchange rates for non-Euro member states.
On the other hand, analyzing the national energy sector starting from the description of the current situation allowed the elaboration of a specific Strengths, Weaknesses, Opportunities, And Threats (SWOT) analysis [25], with a diagnosis and a prognosis role for future development:
- (a)
- Strengths: competitive advantages generated by the existence of renewable energy resources; extensive resources of lignite with extensive possibilities of usage in the production of energy; long and rich experience within the sector; complex and diverse infrastructure in the energy sector: national networks of electric energy transmission, natural gases, oil, petroleum products, refining plants, shipping and important port capacity in the Black Sea.
- (b)
- Weaknesses: inefficient management, high commercial losses and reduced level of debt collection, which creates financial blockage for production, distribution and transmission companies in the field; relying on electricity imports in the critical situation of the malfunctioning of the national energy system; pollution caused by the mining sector and electro-thermal plants and the lack of financial resources to modernize these plants; limited capacity of the energy sector to take over innovative results in the absence of financial resources to ensure access to the latest technologies.
- (c)
- Opportunities: growing consumption as the economy exceeds the economic crisis; foreign companies’ interest to invest in the sector; increasing the share of renewable energy as a result of the application of the support scheme for renewable energy; discovering new deposits of energy resources.
- (d)
- Threats: increases in the price of primary energy resources on the world market; discontent of industrial and public consumers about the potential increase in energy prices; possible difficulties in elaborating and implementing an efficient mechanism to collect debts.
The SWOT analysis reveals the complexity of the system, regarding the technical capacities, but also the main weak points and threats of the sector. The evolution of renewable energy production has had an accelerated rhythm based on the implementation of an important support scheme and of an increasing potential of resources, which draw the interest of important international companies in the field [25].
The Romanian renewable energy support scheme provides for the granting of green certificates to producers of green energy. The green certificate is a document that certifies a quantity of 1 MWh of electric energy produced by renewable energy sources. Two green certificates for wind energy, three for micro hydro and six for solar energy were awarded before mid-2013. Transparent and non-discriminatory rules regarding the costs of grid connection and reinforcement, as well as a reasonable and precise timetable for receiving and processing requests for grid connection are required. In addition, promoting the renewable energy system requires the purchase of mandatory quotas that supply electricity produced from these sources for sale to consumers. The renewable energy suppliers must buy a certain number of green certificates, and they transfer to the final bills the cost of the acquisition of such certificates. This way, the end users (i.e., population and industry) are the ones who actually pay subsidies for renewable energy [26].
This regulation has been regarded by investors in renewable energy as a threat to their business plans. In fact, this legislation contains elements of state aid, and the European Commission has not approved the changes. Therefore, Romania risks entering the infringement procedure and even paying penalties [27]. The excessive support for the production of renewable energy exerted strong pressure on both the producers of traditional energy and the end users and caused an adverse effect in some industries, particularly the energy-intensive industries [28]. The ability to export in neighboring regions is at less than half of what would be needed [29].
Accordingly, analysis and strategic policies are developed; the consolidation of internal market is promoted, which should include electrical energy, natural gases, oil and petroleum products, solid fuels and nuclear energy; the consolidation of energy infrastructure at the European level is supported; the external energy policy of the European Union is promoted and developed; innovation in energy technology is supported; the application of existing EU legislation is monitored, and new legislative proposals are made; the exchange of best practices is encouraged, and information for interested parties are offered; all these through [15].
Considering a quota of electricity production using fossil resources over 50%, the Romanian Government put into practice the strategy of energy renewable sources’ potential at the national level. In Romania, the total potential of renewable energy resources is over more than 11 million, which represents about 30% from the total primary energy supply (solar energy, wind power, biomass or hydropower and geothermal energy). A major issue of renewable energy (especially wind and photovoltaic energy) is its instability. Intensified wind led numerous times to a wind energy production too high compared to the demand [30,31,32].
Romania supports the actions based on political consensus, a consistent high-level approach and best industry practices, in order to address the triad competitiveness-climate change-security. The relief configuration is quite extended, comprising all three major forms, from Carpathians heights to the lowlands, the Danube Delta and the Black Seaside, beside the picturesque views of the highland regions of Danube. The renewable energy sources hold an important energy potential, and they deliver unlimited availabilities of use at the local and national level. Their use should be made on the basis of three important premises: accessibility, availability and acceptability.
According to [33], regarding the evaluation of the present energy potential of renewable sources in Romania (solar, wind, biomass, micro-hydro, geothermal power) and the identification of the best locations to develop investments in the production of nonconventional electric energy, the special interest areas for electric power energy applications of solar energy depending on solar radiation on a horizontal surface are: the surfaces with the highest potential (Dobrogea and a big part of the Romanian Plain); the surfaces with good potential (the north of the Romanian Plain, the Getic Plateau, Oltenia and Muntenia, the Sub-Carpathians, a part of the Danube Valley, the south and the central area of Moldavian Plateau, the west hills and plain and the west of Transylvania, where the solar radiation on a horizontal surface is situated between 1300 and 1400 MJ/m2); the surfaces with average potential, i.e., less than 1300 MJ/m2 (the biggest part of the Transylvanian Plateau, the north of Moldavian Plateau).
In the mountain area, the variation of direct solar radiation in the territory is very high, the negative landform being favorable to fog persistence and diminishing thus the sunshine duration, while the positive landforms, depending on their orientation to the Sun and the dominant direction of air circulation, determine an increase or decrease of direct solar radiation. In normal conditions, a solar and heat collector normally operates from March–October, with the efficiency ranging between 40% and 90%.
As for the areas with the highest wind power potential to allow development of renewable energy production, there are three main areas: the mountain areas, the Dobrogea Plateau-Black Seaside and the northeastern part of the country, with an average wind speed of 4–8 m/s. The estimated wind potential is around 14,000 MWh installed capacity, generating around 23 TWh per year.
The geothermal energy reserve that can be operated at about 167 thousand toe (7000 × 106 GJ/year). The temperature of the hydro-geothermal sources (exploited by drilling-extraction) in “low enthalpy” geothermic conditions ranges between 25 °C and 60 °C (deep waters) and for the medium temperature varies between 60 °C up to 125 °C (“mezo-thermal waters”). About 70 hot water drills (temperature over 60 °C) are in operation in different geographical areas, locally used for covering the local heating and hot water needs for domestic use in residential, public and industrial buildings, agricultural or animal farms, etc. The favorable areas for geothermal resources are considered the areas in the western plain (for geothermal waters to produce thermal energy) and the geothermal systems in Northern Carpathians: Oaş-Gutâi-Ţibleş and Călimani-Gurghiu-Harghita (potential areas for geothermal energy needed to produce electric energy).
Romania has also great potential in terms of the exploitation of vegetable waste resulting from agriculture, but their exploitation should not bring about negative effects upon farmland, and the development of the capacity to produce renewable energy based on biomass usage should be made by respecting a balance between the farmlands used to grow cereals and the lands used for energy plants, in order not to cause an increase in the prices of food products. The biomass potential is very high because the altitude of the relief determines a vertical leveling of the vegetation, with three levels of forestry vegetation.
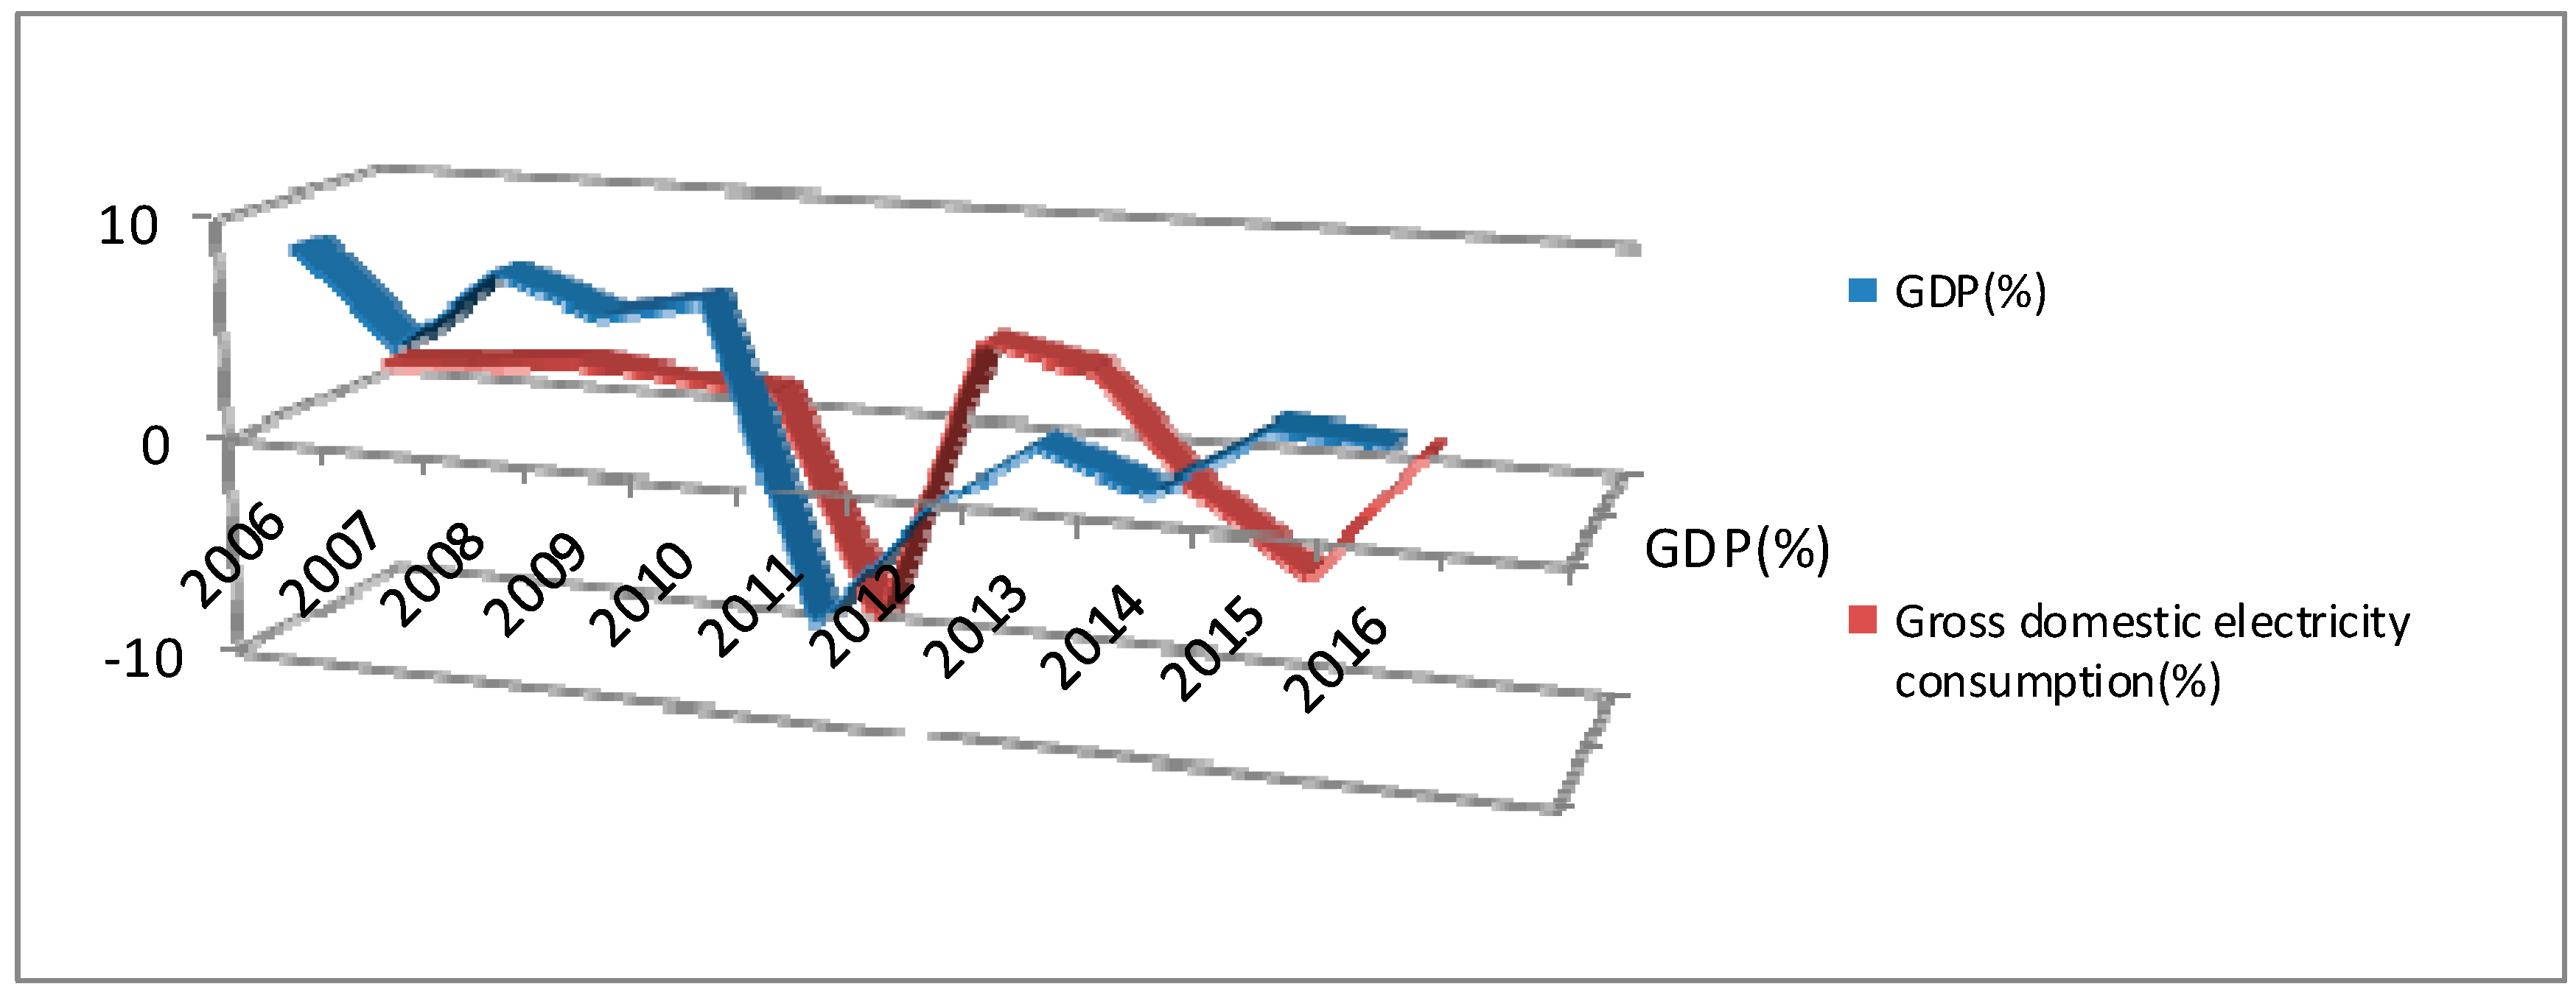
Recently, a decoupling of the energy consumption’s evolution from the gross domestic product (GDP) has occurred. Thus, despite the GDP growth, the energy consumption decreased. For example, we have highly modern capacities (such as the Petrom thermal power station) that no longer function. Figure 2 presents the correlation between GDP and gross national electricity consumption in Romania.
The Romanian Law No. 139/2010 [35] amended and supplemented support projects in renewable energy through the system of green certificates, which allow investors to recover investments in a very short time and to obtain additional income generated from the production of electricity. The promotion system based on green certificates aims to stimulate the development of renewable energy production, while the current production technologies imply higher financial costs as compared to conventional power production. According to the national plan of action in renewable energy, the financial mechanism implied by the granting of green certificates is based on the transfer of financial costs towards the consumer (population or economic operators) for whom the renewable energy component is reflected in the value of electricity bills.
Therefore, the burden borne by Romanian consumers is larger. Together with the massive wind energy development, a net surplus was recorded in 2015, and it has been exported. Nevertheless, when the wind stops, Romania has to import energy. The introduction of renewable energy must be done accompanied by “compensation” for its instability [36]. One solution would have been the hydropower plant with pumped storage in the Tarnita project, designed to store extra energy by placing the water high in the dam. Afterward, in situations like an energy deficit in the system, when the energy demand is higher, the waterworks may have produced the energy needed to balance the deficits of the national energy system [37].
As stated by the Energy Strategy of Romania in 2007–2020, the transmission and system operator intended investments of two billion Euros. For a good functioning of the electric distribution network (EDN), for its rehabilitation and modernization, as well as for the new plants needed to ensure safe supplies for consumers, the amount of four billion Euros is needed in the period from 2007–2020. These Romanian strategic objectives are divided into three main categories: energy safety, sustainable development and competitiveness. Energy safety implies the increase of energy security by ensuring the necessary resources of energy and by limiting the dependency of imported energy resources. Sustainable development is strived for by promoting production based on renewable resources and increasing energy efficiency. Competitiveness refers to the development of competitive markets for electricity, natural gas, oil, uranium, green certificates and emissions trading of greenhouse gas and energy services [38,39].
The low rate of debt collection from companies and households is another problem that structurally affects the functioning of the energy system [40]. The phenomenon increased during the economic crisis and affected, even more, the operators’ capacity to run effective investment programs, which should ensure the functioning of the system continuously and safely.
3. Research Methodology
In agreement with the aim of this paper, the following research objectives were formulated: establishing the indicators used in the energy sector; establishing the work hypotheses for assessing the economic and environmental indicators (the hypothesis of renewable energy parameters with random variables and uniform distribution); analyzing the renewable energy development in the case of energy parameters with random variables and a uniform distribution; establishing the confidence intervals by analyzing the input and output variances for the hypothesis; establishing the correlation between the results of the hypothesis.
The specific energy sector indicators used to carry out the research presented in this paper are: efficiency, levelized cost of electricity, energy return on energy investment, the energy payback time, cumulative energy demand, external energy dependency and performance renewable energy cost index.
It is important to note the way in which the following various economic and environmental indicators have been calculated
- Efficiency (Ef) = defined as the electricity generated by power installed, and in this case, it calculates the amount of electricity generated per kW installed [41];
- Levelized cost of energy (LCOE) = the average cost over the lifetime of the plant per MWh of electricity generated [42];
- Energy return on energy investment (EROI) = the ratio between the energy obtained from a system and primary energy invested in upstream activities [43];
- Energy payback time (EPBT) = the length of time a system must operate before it recovers the energy invested throughout its lifetime [43];
- Cumulative energy demand (CED) = the ratio between all energy required to build, maintain and supply and the final energy product generated during the life span [44];
- The external energy dependency (EED) has the formula: the ratio between imported energy and total energy required [45];
- Performance cost index (PCI) = the ratio between planned energy costs and incurred energy costs [46].
Under these circumstances, it is necessary to approach renewable energy in a different manner, namely by taking into account that the renewable energy outcomes (the output) undergo deviations just like the energy input and that this will have an impact on the renewable energy performance parameters.
In order to analyze the energy indicators in the case of time deviations in the Ω intervals, (−5%; +5%), (−10%; +10%), (−15%; +15%), (−20%; +20%), (−25%; +25%), the following hypothesis was formulated: the hypothesis of hydro energy parameters having random variables with a uniform distribution.
This hypothesis consists of establishing the confidence interval using algebraic operations and the 3 method.
For the proposed model, we assume that the link between the Z random vector and the X variables (where X is the variable value and a is the constant value) takes the following forms [47]:
Typical resulting values:
The confidence interval is quantified by using the 3σ method in correlation with the standard deviation. By establishing the confidence interval and subsequently the length of the interval, we can analyze the energy output in relation to the mean input value.
The economic and environmental indicators previously calculated will be analyzed using the main statistical indexes [48] with a view toward establishing the tolerance intervals.
Thus, a mean is calculated for each analyzed indicator, using the well-known formula:
After having calculated the mean, the distribution will also be computed using the formula:
The confidence interval for the proposed study is calculated using the most utilized 95% result guaranteed probability (Z0.025 = 1.96).
The confidence interval helps identify the upper and lower limits between which the variations have no effect on the renewable energy outcomes.
The evaluation of the main economic and environmental indicators starts at the initial moment, based on data only relevant for energy firms that produce hydro energy: the Central Transylvanian Basin, which has the highest renewable energy potentiality in Romania (the Annual activity report of the National Regulatory Authority for Energy, 2016 [49]).
As shown in Table 1, at the initial moment t0, the analyzed indicators show that the hydro energy is running smoothly from the point of view of the economic efficiency and the levelized cost of energy. Furthermore, because there are no deviations, one can also notice that the performance cost index is 1, which indicates a perfect implementation of the analyzed hydro energy.
The intention of applying the hypothesis is that of analyzing the hydro energy in order to establish the correlations between the input and the output variables. Based on this, it will be possible to identify the actions to be undertaken in order for the hydro energy to reach its objectives without extra costs.
After having defined the initial moment, the authors move on to the next element of interest. The field of renewable energy is represented by the “added value”, i.e., the difference between the results obtained from the hydro energy and the “input” factors.
4. Results and Discussion
A coherent energy policy is obviously required. The renewable energy support and implementation policy should be introduced together with consumer protection measures, especially for large consumers, and necessarily accompanied by compensation units [50].
Although the potential environmental benefits of renewable energy sources are widely accepted, it is necessary that the Romanian authorities reconsider the imbalances generated by renewable energy subsidies. Industrial energy consumers should not be disadvantaged while developing their business in Romania; therefore, they should not pay more than a fair price for renewable energies.
The results obtained are represented including the main indicators (efficiency, levelized cost of energy, energy return on energy investment and performance cost index), as well as their evolution in relation to the mean value in Table 2.
It can be noted that in the case of a uniform distribution, the hydro energy output is the same as the input in the case of small variances ((−5%; +5%); (−10%; +10%); (−15%; +15%)) and that the output is different compared to the hydro energy input when the variations are bigger ((−20%; +20%); (−25%; +25%)).
As part of the re-industrialization plan in Europe, the norms stipulate that Member States shall provide exemptions for eco-taxes that may amount to 80–85%. Romania should be in line with the current European Union and global tendencies and focus on the long-term economy. Consequently, it should provide the right treatment for local industries, thus supporting competitiveness.
The review of the present situation of the Romanian energy sector brings into the discussion an essential element, namely the efficiency of the energy system, which should focus on the following objectives or action directions:
- Increasing energy efficiency for industrial and household consumers. The Romanian industry is characterized by an increased consumption on the same unit product much higher than the European average, and consequently, the energy bill for the Romanian plant is higher. Thus, it is necessary to promote programs that stimulate the energy efficiency of economic operators.
- Developing methods to increase the energy efficiency of residential buildings, to reduce the costs of energy bills for the population.
- Implementing modern managing methods at the level of energy companies with state capital. Initiatives for the selection of private managers have been inefficient and did not lead to significant improvement of state companies’ performance.
- Another objective is increasing energy independence through the reactivation of the potential of existing deposits and opening new deposits.
If measures are not taken so that the industrial consumers pay a fair price, the alternative is rather disquieting, since Romania could face a massive shutdown of production sectors and general activity reduction for industrial companies. Regarding domestic consumers, the increase in energy bills will exceed the income increase by 2018. Therefore, the vulnerable consumers’ group will grow appreciably, and consequently, the number of necessary welfare funds will increase.
Given that Romania has already reached the target of producing renewable energy six years earlier and some EU member states have not reached the targets imposed, a solution for Romania would be to renegotiate the scheme approved for Romania and increasing subsidies for this type of energy.
5. Conclusions
The renewable energy sector should be a dynamic sector, to actively support the country’s economic development and reduce the gaps with the European Union. There is a significant potential in Romania for wind and biomass, as well as for further hydro expansion, particularly small-scale hydro (i.e., Moldavia, Carpathian Mountains, Transylvania and Sub-Carpathians). The more renewables are introduced into the system, the greater the costs in the form of subsidies. Industrial and household consumers bear an excessive burden in supporting renewable energy in Romania, but largely, this energy is exported.
Anyway, the most important topics on the use of renewable resources in Romania that were mirrored in environmental organizations are those concerning the location of wind farms and the construction of small hydropower plants in protected areas. Most often, NGOs have no problems directly with producers or investors, but with the authorities that need to implement the legislation.
In the case of time variation, where Ω is (±5%, ±10%, ±15%, ±20%, ±25%), the error of the final result is related to time, as this parameter is cumulated with the others. If all of the parameters had been considered to be variable, then the results would have also been variable. The findings highlighted a strong connection between those who bear the cost of renewable energy development and the actual beneficiaries of a clean environment; in that sense, they identify the major drivers and barriers for renewable energy diffusion in Romania.
The results of the econometric model indicate the future potential of renewable energy options and the connection between long-run marginal generation costs. In the short term, if appropriate financial incentives (green certificates) are set to overcome the gap between the dynamically changing costs and the market price for (conventional) electricity, then the non-economic barriers (excessive bureaucracy, weak legal framework, corruption, lack of qualified personnel, lack of transparency in decision making, network transmission/distribution) are removed. On the other hand, due to the increasing costs of green certificates, large industrial consumers began to complain that their competitiveness is affected and have threatened to close down certain capacities and relocate others.
The results of the research will be used in order to develop a complex software, which will analyze renewable energy potential starting from the possible variables, developing the roadmaps depending on the impact of the respective variables, analyzing the specific indicators, so that in the end, a possible response can be formulated to the risks to which the policymakers, investors and other stakeholders are exposed.
Furthermore, in Romania, the system of the promotion of energy from renewable energy sources has been introduced without performing an impact study to accompany this system and without introducing compensation schemes for the renewable energy’s instability, especially wind and photovoltaic solar energy. Currently, a number of adverse consequences of introducing a renewable energy support scheme is being recorded. Energy suppliers are forced to purchase certificates, but they pass the costs on the final bill paid by consumers, both population and industry. Renewable energy producers receive these green certificates to get a win in addition to energy prices. Energy suppliers are forced to purchase certificates, but they pass the costs on the final bill paid by consumers, both population and industry. However, green certificates gain value when trading and not when issuing, which will remove some of the pressure on the cash flows of operators in the field. On the other hand, due to the increasing costs of green certificates, large industrial consumers began to complain that their competitiveness is affected and have threatened to close down certain capacities and relocate others. Therefore, it is necessary to revise the scheme for supporting renewable energy [51].
For all that, from the point of view of the population and industrial consumers, the pressure of the bill cost should drop, at least in the short and medium term, a fact that could have a positive effect on the maintenance of industrial products’ competitiveness. According to the national plan of action in renewable energy, the financial mechanism implied by the granting of green certificates is based on the transfer of financial costs towards the consumer (population or economic operators) for whom the green energy component is reflected in the value of electricity bills. Though, given that Romania has the lowest energy prices due to the increasing demand for less expensive energy exports, there is a risk of further increasing energy prices in Romania. If Romanian consumers support the burden of excessive renewable energy and this energy is consumed outside the country, it would be fair for these costs to be borne by the actual consumers abroad, as well.
Still, limitations that can influence further development of renewable energy production are connected to two elements of a technical nature:
- The technical capacity of the network to absorb energy (connection points, posts and electric power stations). In this case, project developers are the ones who assume, from their own funds, all of the expenses related to the network connection, the connection to the already existing network, the construction of new stations or modernizing the already existing ones).
- Ensuring reserve capacity in order to balance fluctuations registered by the production of renewable energy, which implies dimensioning reserve capacity through investments in plants that use conventional sources of energy.
Author Contributions
All authors contributed equally to this work. Ionica Oncioiu has designed the research, results, discussions, and conclusions. Eugenia Grecu has contributed to the research, graphics, discussions, and conclusions. Marius Petrescu and Anca Gabriela Petrescu performed the research and analyzed the data. All authors read and approved the final manuscript.
Conflicts of Interest
The authors declare no conflict of interest.
References
- Knight, K.W.; Schor, J.B. Economic Growth and Climate Change: A Cross-National Analysis of Territorial and Consumption-Based Carbon Emissions in High-Income Countries. Sustainability 2014, 6, 3722–3731. Available online: https://www.mdpi.com/2071-1050/6/6/3722 (accessed on 1 October 2016).
- Guerrero-Liquet, G.C.; Sánchez-Lozano, J.M.; García-Cascales, M.S.; Lamata, M.T.; Verdegay, J.L. Decision-Making for Risk Management in Sustainable Renewable Energy Facilities: A Case Study in the Dominican Republic. Sustainability 2016, 8, 455. Available online: https://www.mdpi.com/2071-1050/8/5/455 (accessed on 2 October 2016). [CrossRef]
- Moutinho, V.; Moreira, A.C.; Silva, P.M. The driving forces of change in energy-related CO2 emissions in Eastern, Western, Northern and Southern Europe: The LMDI approach to decomposition analysis. Renew. Sustain. Energy Rev. 2015, 50, 1485–1499. Available online: http://dx.doi.org/10.1016/j.rser.2015.05.072 (accessed on 2 October 2016). [CrossRef]
- European Commission Strategy (2030). Secure, Competitive, and Sustainable Energy. Available online: https://ec.europa.eu/energy/en/topics/energy-strategy (accessed on 5 October 2016).
- World Bank. Summary of Sector Rapid Assessments and Recommendations for Incorporating Climate Actions in the 2014–2020 Sectoral Operational Programs in Romania. Component B Synthesis Report. Available online: http://documents.worldbank.org/curated/en/448101468293732426/Rom-226-nia-Programul-privind-schimbarile-climatice-si-o-crestere-economica-verde-cu-emisii-reduse-de-carbon-rezumat-si-al-recomandarilor-de-238-n-programele-operationale-sectoriale-2014-2020-componenta-B (accessed on 5 October 2016).
- Energetic Strategy of Romania for 2007–2020. Available online: http://www.google.ro/url?sa=t&rct= j&q=&esrc=s&source=web&cd=1&ved=0ahUKEwjy1-iLwIDRAhXFCSwKHRuaDZ0QFggYMAA&url=http%3A%2F%2Fwww.minind.ro%2Fenergie%2FSTRATEGIA_energetica_actualizata.pdf&usg=AFQjCNENN5xJt5-MHuOhOwv5uUqAMw46aA&sig2=KBDFyrpUg2Mg5xAO3gvmCg&bvm=bv.142059868,d.bG (accessed on 5 October 2016).
- Robaina Alves, M.; Moutinho, V. Decomposition analysis and Innovative Accounting Approach for energy-related CO2 emissions intensity over 1996–2009 in Portugal. Energy 2013, 57, 775–787. [Google Scholar] [CrossRef]
- Hatzigeorgiou, E.; Polatidis, H.; Haralambopoulos, D. Energy CO2 Emissions for 1990–2020: A Decomposition Analysis for EU25 and Greece. Energy Source Part A 2010, 32, 1908–1917. Available online: http://dx.doi.org/10.1080/15567030902937101 (accessed on 10 October 2016). [CrossRef]
- González, P.F.; Moreno, B. Analyzing driving forces behind changes in energy vulnerability of Spanish electricity generation through a Division index-based method. Energy Convers. Manag. 2015, 92, 459–468. Available online: http://dx.doi.org/10.1016/j.enconman.2014.12.083 (accessed on 10 October 2016).
- Andreoni, V.; Galmarini, S. Decoupling economic growth from carbon dioxide emissions: A decomposition analysis of Italian energy consumption. Energy 2012, 44, 682–691. Available online: http://dx.doi.org/10.1016/j.energy.2012.05.024 (accessed on 12 October 2016). [CrossRef]
- Gowreesunker, B.L.; Tassou, S.A. The Impact of Renewable Energy Policies on the Adoption of Anaerobic Digesters with Farm-Fed Wastes in Great Britain. Energies 2016, 9, 1038. Available online: https://www.mdpi.com/1996-1073/9/12/1038 (accessed on 12 October 2016). [CrossRef]
- Rotaru, A.; Kolev, C. Addressing issues of geoenvironmental risks in Dobruja, Romania/Bulgaria. Environ. Eng. Manag. J. 2010, 9, 961–969. [Google Scholar]
- Hvelplund, F. Political prices or political quantities? A comparison of renewable energy support systems. New Energy 2001, 5, 18–23. [Google Scholar]
- European Commission Strategy (2020). Secure, Competitive, and Sustainable Energy. Available online: https://ec.europa.eu/energy/en/topics/energy-strategy (accessed on 2 November 2016).
- European Commission. Eurostat. Available online: http://ec.europa.eu/eurostat/web/energy/data/energy-balances (accessed on 2 November 2016).
- Green Paper: A 2030 Framework for Climate and Energy Policies. Available online: http://eur-lex.europa.eu/legal-content/EN/TXT/?uri=CELEX%3A52013DC0169 (accessed on 2 November 2016).
- Rasheed, M.B.; Javaid, N.; Ahmad, A.; Jamil, M.; Khan, Z.A.; Qasim, U.; Alrajeh, N. Energy Optimization in Smart Homes Using Customer Preference and Dynamic Pricing. Energies 2016, 9, 593. Available online: https://www.mdpi.com/1996-1073/9/8/593 (accessed on 5 November 2016). [CrossRef]
- Ministry of Economy, Commerce and Business Environment. Available online: https://nato.mae.ro/en/romania/319 (accessed on 2 November 2016).
- Santoyo-Castelazo, E.; Azapagic, A. Sustainability assessment of energy systems: Integrating environmental, economic and social aspects. J. Clean. Prod. 2014, 80, 119–138. [Google Scholar] [CrossRef]
- Zhao, H.; Guo, S. External Benefit Evaluation of Renewable Energy Power in China for Sustainability. Sustainability 2015, 7, 4783–4805. Available online: https://www.mdpi.com/2071-1050/7/5/4783 (accessed on 30 October 2016). [CrossRef]
- Dong, J.-F.; Wang, Q.; Deng, C.; Wang, X.-M.; Zhang, X.-L. How to Move China toward a Green-Energy Economy: From a Sector Perspective. Sustainability 2016, 8, 337. Available online: https://www.mdpi.com/2071-1050/8/4/337 (accessed on 30 October 2016). [CrossRef]
- SA 33134—Romania—Green Certificates to Promote Electricity Production from Renewable Energy Sources, Promoting Renewable Published in the EU Official Journal No. 244/23.08.2011, Brussels. C (2011) 4938. Available online: ec.europa.eu/competition/state_aid/cases/240906 (accessed on 25 October 2016).
- European Commission. Eurostat. Available online: http://ec.europa.eu/eurostat/web/energy/methodology/annual (accessed on 10 November 2016).
- Environmental Indicator Report 2016—In Support to the Monitoring of the 7th Environment Action Programme. Available online: https://www.eea.europa.eu/publications/environmental-indicator-report-2016/#parent-fieldname-title (accessed on 30 November 2016).
- Boteanu, C.M. Balanced Scorecard in the Romanian Energy Sector; LAP LAMBERT Academic Publishing Gmbh & Co.KG: Saarbrücken, Germany, 2016; pp. 85–92. [Google Scholar]
- Government Emergency Ordinance No. 57/2013 Regarding Amending and Supplementing Law No. 220/2008—The System for Promoting Energy Production from Renewable Energy Sources, Published in Romanian Official Monitor, Part I, No. 335 from 12th of June, 2013. Available online: http://www.romania-insider.com/p-tax-flash-approval-of-geo-572013/ (accessed on 30 October 2016).
- Grecu, E. New technologies-between business and environmental protection in Romania. Environ. Eng. Manag. J. 2014, 13, 1873–1879. [Google Scholar]
- Karydis, M. Public attitudes and environmental impacts of wind farms: A review. Glob. NEST J. 2013, 15, 581–600. [Google Scholar]
- Rusu, L.; Butunoiu, D. Evaluation of the wind influence in modeling the Black Sea wave conditions. Environ. Eng. Manag. J. 2014, 13, 305–314. [Google Scholar]
- Gipe, P. Wind Energy Basics, A Guide to Home- and Community-Scale Wind-Energy Systems, 2nd ed.; Chelsea Green Publishing Company: White River Junction, VT, USA, 2009; pp. 119–147. [Google Scholar]
- Zhang, H.; Zheng, Y.; Zhou, D.; Zhu, P. Which Subsidy Mode Improves the Financial Performance of Renewable Energy Firms? A Panel Data Analysis of Wind and Solar Energy Companies between 2009 and 2014. Sustainability 2015, 7, 16548–16560. Available online: https://www.mdpi.com/2071-1050/7/12/15831 (accessed on 12 November 2016).
- Won, J.; Choi, H.-J.; Lee, H.; Choi, H. Numerical Investigation on the Effect of Cementing Properties on the Thermal and Mechanical Stability of Geothermal Wells. Energies 2016, 9, 1016. Available online: https://www.mdpi.com/1996-1073/9/12/1016 (accessed on 10 November 2016). [CrossRef]
- Stefanscu, C.; David, I.; Vlad, I.; Visescu, M.; Beilicci, E. Potential Resources and Opportunities for Alternative Energy Production in Central Romania. In Proceedings of the 15th International Multidisciplinary Scientific GeoConference SGEM 2015, Albena, Bulgaria, 18–24 June 2015; Available online: www.sgem.org/ (accessed on 25 November 2016).
- Romanian National Institute of Statistics. Available online: https://statistici.insse.ro/shop/?page=ipc1&lang=ro/ (accessed on 3 December 2016).
- Law No. 139/2010 Concerning the Modification and Completion of Law No. 220/2008 for Establishing the System to Promote the Production of Energy from Renewable Energy Sources. Available online: http://faolex.fao.org/cgi-bin/faolex.exe?rec_id=115096&database=faolex&search_type=link&table=result&lang=eng&format_name=@ERALL/ (accessed on 30 November 2016).
- Pramo, J. Wind Energy Engineering; McGraw-Hill Professional: New York, NY, USA, 2010; pp. 41–63. [Google Scholar]
- Hemami, A. Wind Turbine Technology; Cengage Learning, Clifton Park: New York, NY, USA, 2011; pp. 25–59. [Google Scholar]
- Vandevyvere, H.; Stremke, S. Urban Planning for a Renewable Energy Future: Methodological Challenges and Opportunities from a Design Perspective. Sustainability 2012, 4, 1309–1328. Available online: https://www.mdpi.com/2071-1050/4/6/1309 (accessed on 6 December 2016). [CrossRef]
- Cai, S.; Chen, X.; Bose, I. The many faces of Green Energy from agriculture. Int. J. Bus. Data Commun. Netw. 2012, 8, 52–59. [Google Scholar] [CrossRef]
- Hufen, J.A.M. Cheat Electricity? The Political Economy of Green Electricity Delivery on the Dutch Market for Households and Small Business. Sustainability 2017, 9, 16. Available online: https://www.mdpi.com/2071-1050/9/1/16 (accessed on 10 January 2017). [CrossRef]
- Martins, F.; Felgueiras, C. RES efficiency indicators. J. Clean Energy Technol. 2015, 3, 261–264. [Google Scholar] [CrossRef]
- UK Department of Energy & Climate Change, Electricity Generation Costs, 2013. Available online: https://www.gov.uk/government/publications/decc-electricity-generation-costs-2013 (accessed on 20 December 2016).
- Bhandari, K.P.; Collier, J.M.; Ellingson, R.J.; Apul, D.S. Energy payback time (EPBT) and energy return on energy invested (EROI) of solar photovoltaic systems: A systematic review and meta-analysis. Renew. Sustain. Energy Rev. 2015, 47, 133–141. [Google Scholar] [CrossRef]
- Modahl, I.S.; Raadal, H.L.; Gagnon, L.; Bakken, T.H. How methodological issues affect the energy indicator results for different electricity generation technologies. Energy Policy 2013, 63, 283–299. [Google Scholar] [CrossRef]
- Burgess, G.; Fernández Velasco, J.G. Materials, operational energy inputs, and net energy ratio for photobiological hydrogen Production. Int. J. Hydrogen Energy 2007, 32, 1225–1234. [Google Scholar] [CrossRef]
- Ifrim, A.M. Mathematical Tools in Quality Engineering—Application in PM; LAP Lambert Academic Publishing: Saarbrücken, Germany, 2016; pp. 62–71. [Google Scholar]
- Popescu, M.O.; Panait, V. Product Quality and Reliability; MatrixRom: București, Romania, 2003; pp. 112–187. [Google Scholar]
- Craiu, M. Mathematical Statistics. Theory and Problems; MatrixRom: București, Romania, 1999; pp. 47–52. [Google Scholar]
- National Regulatory Authority for Energy, Annual Activity Report 2016. Available online: http://www.anre.ro/ro/energie-electrica/rapoarte/rezultate-monitorizare-piata-energie-electrica/20161467098100 (accessed on 7 January 2017).
- Shum, K.L. Renewable Energy Technology—Is It a Manufactured Technology or an Information Technology? Sustainability 2010, 2, 2382–2402. Available online: https://www.mdpi.com/2071-1050/2/8/2382 (accessed on 29 December 2016). [CrossRef]
- Stamatescu, I.; Arghira, N.; Făgărăşan, I.; Stamatescu, G.; Iliescu, S.S.; Calofir, V. Decision Support System for a Low Voltage Renewable Energy System. Energies 2017, 10, 118. Available online: https://www.mdpi.com/1996-1073/10/1/118 (accessed on 10 January 2017). [CrossRef]
Figure 1.
Electricity prices for industry in EUR/kWh. Source: authors’ representation based on information extracted from Eurostat, 2015 [23].
Figure 1.
Electricity prices for industry in EUR/kWh. Source: authors’ representation based on information extracted from Eurostat, 2015 [23].

Figure 2.
Correlation between GDP and gross national electricity consumption in Romania. Source: authors’ representation based on information extracted from the Romanian National Institute of Statistics [34].
Figure 2.
Correlation between GDP and gross national electricity consumption in Romania. Source: authors’ representation based on information extracted from the Romanian National Institute of Statistics [34].


Table 1.
Centralization of the main economic and environmental indicators at the t0 moment.
| Efficiency | Levelized Cost of Energy | Energy Return on Energy Investment | Energy Payback Time | Cumulative Energy Demand | External Energy Dependency | Performance Cost Index |
|---|---|---|---|---|---|---|
| 3 | 1 | 0 | 0 | 0 | 0 | 1 |
Source: elaborated by the authors using the input data from the Annual activity report of National Regulatory Authority for Energy, 2016 [49].
Table 2.
Confidence intervals and the mean corresponding to the indicators.
| The Economic and Environmental Indicators | ±5% | ±10% | ±15% | ±20% | ±25% |
|---|---|---|---|---|---|
| Efficiency | |||||
| lower limit | 3.02 | 3.05 | 3.0 | 2.1 | 2.0 |
| upper limit | 3.15 | 3.31 | 3.2 | 3.2 | 3.12 |
| mean value | 3.13 | 3.19 | 3.1 | 2.7 | 2.5 |
| Levelized cost of energy | |||||
| lower limit | 0.92 | 0.90 | 0.91 | 0.88 | 0.97 |
| upper limit | 1.03 | 1.01 | 1.03 | 1.32 | 1.42 |
| mean value | 1.00 | 0.96 | 0.93 | 1.08 | 1.18 |
| Energy return on energy investment | |||||
| lower limit | −0.01 | −0.02 | −0.10 | −0.22 | −0.26 |
| upper limit | 0.02 | 0.01 | 0.10 | 0.19 | 0.78 |
| mean value | 0.002 | −0.01 | −0.006 | 0.007 | 0.210 |
| Performance cost index | |||||
| lower limit | 0.85 | 0.89 | 0.73 | 0.65 | 0.59 |
| upper limit | 1.01 | 1.05 | 1.1 | 1.04 | 1.00 |
| mean value | 0.94 | 1.00 | 1.00 | 0.7 | 0.77 |
Source: elaborated by the authors using the input data from the Annual activity report of National Regulatory Authority for Energy, 2016 [49].
© 2017 by the authors. Licensee MDPI, Basel, Switzerland. This article is an open access article distributed under the terms and conditions of the Creative Commons Attribution (CC BY) license (http://creativecommons.org/licenses/by/4.0/).
Share and Cite
MDPI and ACS Style
Oncioiu, I.; Petrescu, A.G.; Grecu, E.; Petrescu, M. Optimizing the Renewable Energy Potential: Myth or Future Trend in Romania. Energies 2017, 10, 759. https://doi.org/10.3390/en10060759
AMA Style
Oncioiu I, Petrescu AG, Grecu E, Petrescu M. Optimizing the Renewable Energy Potential: Myth or Future Trend in Romania. Energies. 2017; 10(6):759. https://doi.org/10.3390/en10060759
Chicago/Turabian StyleOncioiu, Ionica, Anca Gabriela Petrescu, Eugenia Grecu, and Marius Petrescu. 2017. "Optimizing the Renewable Energy Potential: Myth or Future Trend in Romania" Energies 10, no. 6: 759. https://doi.org/10.3390/en10060759
Note that from the first issue of 2016, this journal uses article numbers instead of page numbers. See further details here.