
Effect of Gas Velocity Distribution on Heat Recovery Process in Packed Bed of Plate-Shaped Slag

Steel Research Laboratory, JFE Steel Corporation, 1 Kokan-cho, Fukuyama, Hiroshima 721-8510, Japan
*
Author to whom correspondence should be addressed.
Energies 2017, 10(6), 755; https://doi.org/10.3390/en10060755
Submission received: 31 March 2017
/
Revised: 22 May 2017
/
Accepted: 23 May 2017
/
Published: 28 May 2017
Abstract
:A new twin-roll continuous slag solidification process and heat recovery process from a slag packed bed was developed for utilization of the waste heat of steelmaking slag. Plate-shaped slag with the thickness about 7 mm was successfully produced in a pilot plant, and the sensible heat of the slag was recovered by blowing air into the slag chamber. However, the gas distribution inside the slag packed bed was unclear because of the unique shape of the slag plates, and this remained a concern for further scale-up designing of the slag chamber. Therefore, in order to estimate the gas distribution in the packed bed, a simple computational fluid dynamics (CFD) model which considers the wall effect around the inner wall of the chamber was developed, and this model was fitted to the results of laboratory-scale velocity distribution measurements. The results showed that the gas velocity distribution was properly estimated, and the intensity of the wall effect was similar in both cases. As the next step, the gas velocity distribution and its effect on the slag heat recovery process in a pilot-scale slag chamber were evaluated with the assistance of the CFD simulation model. The simulation results were compared with the measured data obtained in a pilot-scale test, and as the result, a similar wall effect was also observed in the pilot-scale chamber. However, the intensity of the wall effect was limited enough to prevent serious deterioration of the uniformity of the gas distribution.
1. Introduction
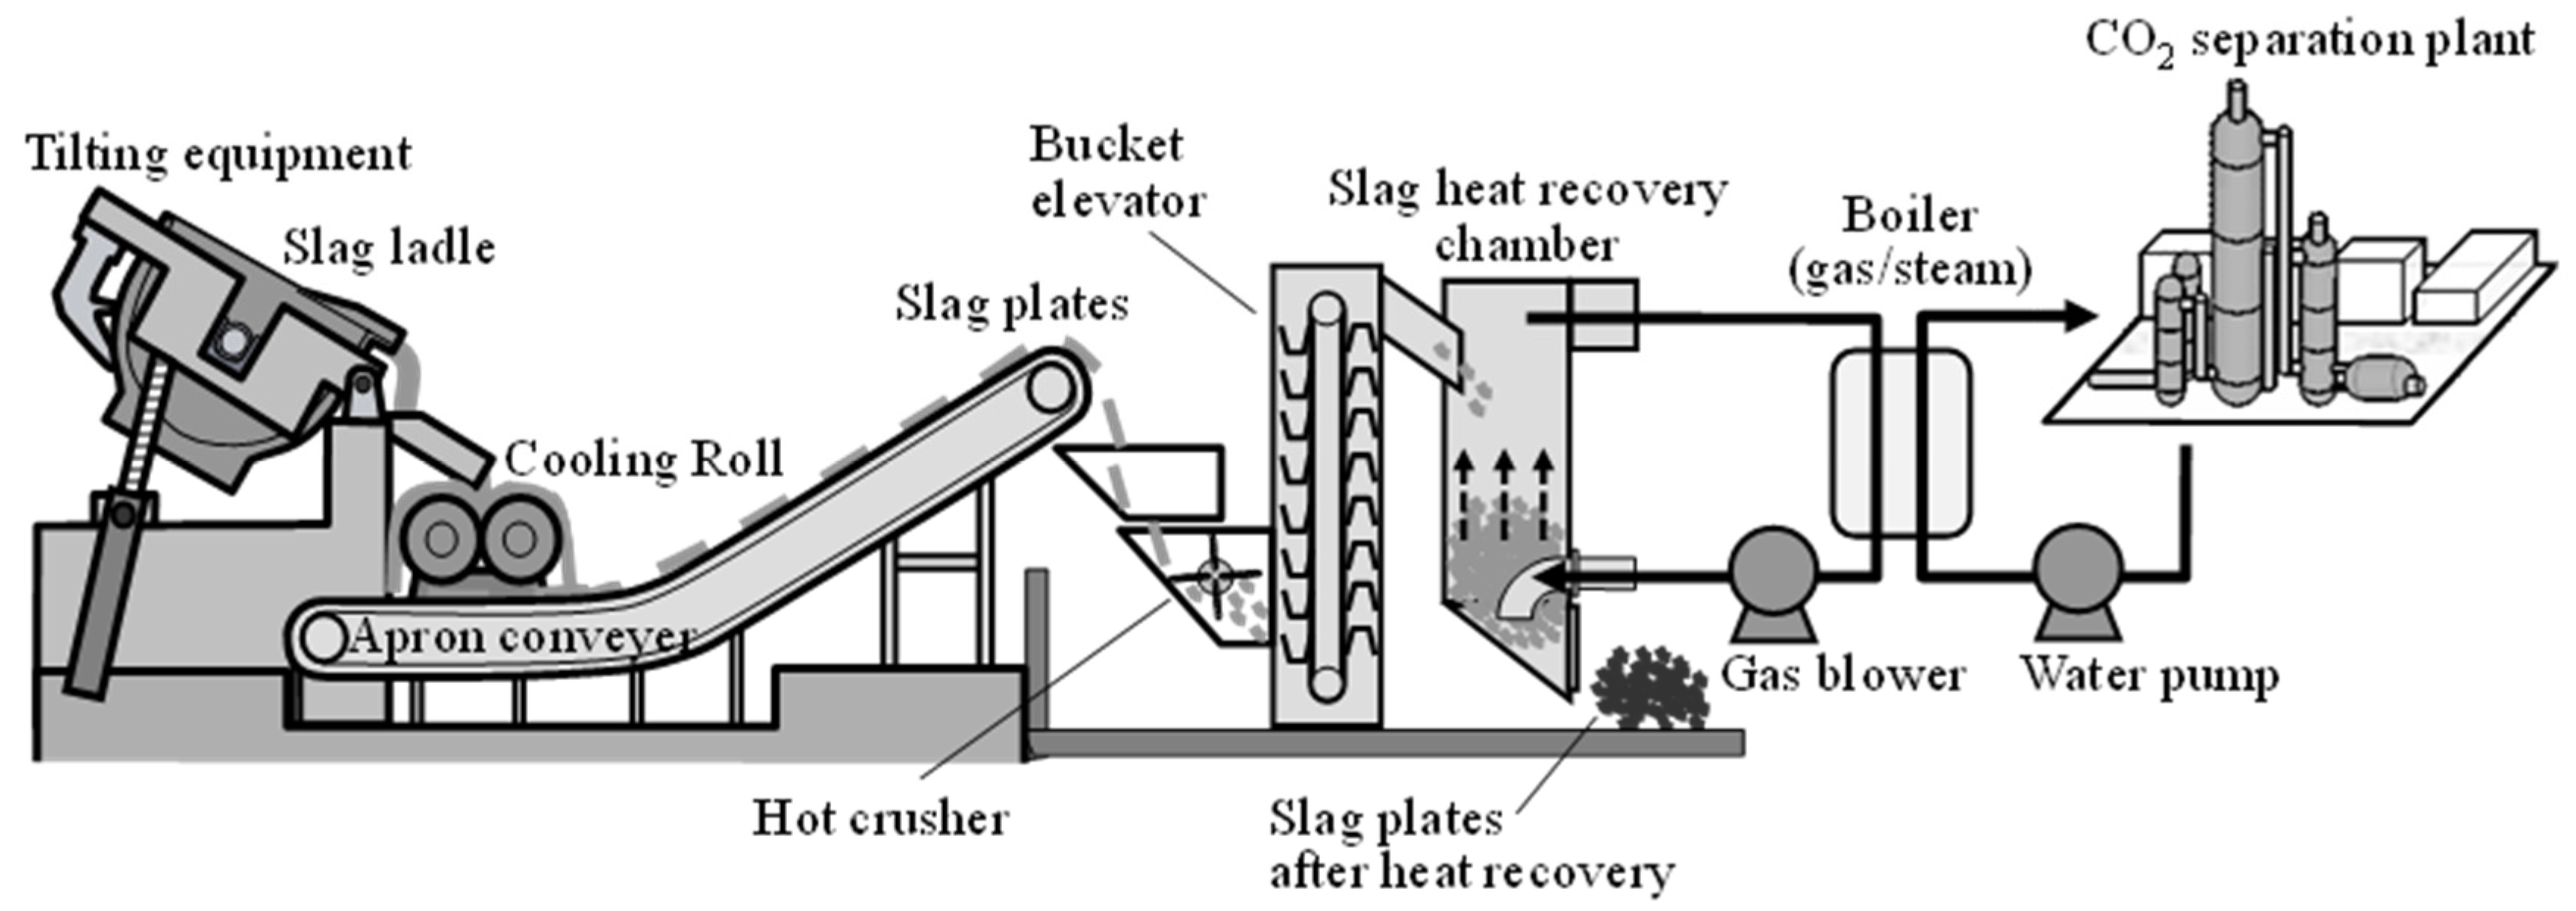
Because the steelmaking process is one of the major CO2 sources among all Japanese industries, further energy savings is needed in order to reduce CO2 emissions from steel works. The major Japanese steel companies have participated in the COURSE50 National Project since FY2008 under a commitment of New Energy and Industrial Technology Development Organization (NEDO) to achieve a 30% reduction in CO2 from steel works [1,2,3,4]. Steelmaking slag, which is produced as a by-product of the steel refining process, possesses a great amount of heat in the molten state and is considered to be a promising heat resource for future utilization. As a part of the COURSE50 project, the authors developed a new process for heat recovery from steelmaking slag in order to utilize this huge amount of thermal energy [5]. Figure 1 shows the process drawing of the COURSE50 slag heat recovery system, including a CO2 separation plant as a target process for heat utilization. In this process, molten slag, which has a temperature of above 1673 K, is solidified continuously on the surface of water-cooled rolls to produce plate-shaped slag of approximately 1373 K. These slag plates are transferred directly to the slag chamber in a high-temperature state for heat recovery, which is another feature of this process. The temperature drop during the slag transportation from the end of the apron conveyer to the slag chamber is negligible owing to its short transportation time within 25 s. In the future plan, the heat recovered from this slag will be utilized for regeneration of the CO2 absorbent in the CO2 separation plant, which requires a huge amount of thermal energy.
Because of the lower heat conductivity of the slag compared to other packed materials such as coke, shape control of the slag during solidification is important for obtaining high temperature gas from the hot slag. Solidifying the slag in a plate-like shape reduces the heat transfer distance in the slag thickness direction, which has the effect of reducing the decrease in heat recovery caused by the slower heat conduction inside the slag. Tobo et al. [6] investigated the optimum operating conditions of a twin-roll continuous slag solidification plant (hereafter ‘twin-roll plant’) for production of plate-shaped slag with the average thickness about 7 mm. With this thickness of the slag, the Biot number of the slag during heat recovery at the slag charging temperature of 1373 K is estimated to be about 0.02, which is small enough to neglect the effect of the heat conduction inside the slag plate. The heat transfer characteristics from the packed bed of plate-shaped slag were also evaluated, and a reliable heat transfer coefficient for the surface of packed plate-shaped slag was proposed empirically [7].
When considering scale-up designing of the slag heat recovery chamber, the gas distribution inside the slag packed bed is important for achieving higher efficiency in heat recovery. Significant deterioration of the gas distribution would require an unnecessary enlargement of the plant size due to the lower heat recovery ratio or a longer process time to recover the same amount of heat. From fundamental studies of packed bed properties, it is well known that the shape of the packed materials affects the efficiency of heat transfer and the flow properties inside the bed, especially when the chamber-to-bed diameter ratio is small [8,9,10]. This is usually called the “wall effect” since it is closely related to the restricted packing condition in the vicinity of the inner wall. Recent research on packed bed properties includes many reports of computer simulations by the discrete element method (DEM) and computational fluid dynamics (CFD). Considering the convenience of modeling, most of these studies were carried out with packed materials having the ideal spherical shape. Singhal et al. [11] conducted a detailed analysis of the heat transfer behavior inside densely packed beds of monodisperse spherical particles by using a DEM random packing model and CFD simulation. In their work, the wall effect was intentionally removed by extracting a small sub-region from the center of the larger bed in order to focus on the flow properties under stable packing conditions. Beer et al. [12] evaluated the heat transfer properties of a DEM generated pebble bed in which the spherical particles were randomly packed in a box designed for the experiment. In their work, the wall effect was considered carefully, and the numerically calculated porosity distribution inside the bed was introduced as one of the results. The intensity of the wall effect generally changes depending on the size of the chamber or the packed materials [13]. Rebughini et al. [14] used a DEM random packing model to evaluate the effect of the tube-to-particle diameter ratio on the void fraction in micro-packed bed reactors. In case of a small tube-to-particle diameter ratio, the wall effect is clearly observed as an increase of the void fraction. Das et al. [15] also thoroughly evaluated the wall effect of a packed bed of spherical particles in slender columns. The radial porosity distributions in many cases with different tube-to-particle diameter ratios were introduced in their work, along with the effect of the radial porosity distribution on the pressure drop and heat transfer properties inside the beds. Most of the DEM random packing models focused on the gas flow behavior inside a small chamber or a sectioned region inside a large bed. However, industrial-scale DEM and CFD simulations have also been attempted in some cases [16], although they were conducted under many assumptions about the shape and behavior of the packed materials.
Experimental measurements of the properties of packed beds have also been carried out. Liu et al. investigated the heat transfer performance in a packed bed of sintered particles by using the naphthalene sublimation technique and found that the shape of the packed materials affected the prediction accuracy of the Nusselt number in case of irregular particles [17]. They also introduced the relationship between the porosity and the sphericity of the packed materials, which changes significantly depending on the packing conditions. Tian et al. [18] measured the pressure drop in a packed bed of irregularly shaped sintered ore particles at the laboratory scale. In their work, although the radial gas velocity distribution above the bed was not measured, the influence of the wall effect on pressure drop was carefully investigated under different gas superficial velocity conditions.
Figure 2 shows the plate-shaped slag samples selected randomly after actual production at our slag heat recovery pilot plant. The measured average thickness and long side length of the slag samples are written on the picture. Because of the unique shape of the slag, the packing condition and the gas velocity distribution in the slag packed bed were not estimated in previous studies of a packed bed with ideal spherical particles. Our major concern was a serious degradation of the uniformity of gas distribution inside the bed owing to the piling up effect and the complicated gas flow path through the bed. The properties of a packed bed of non-ideal particles having complicated shapes and/or a particle size distribution are still under discussion. As examples of simulation-based studies of packed beds of non-ideal particles, a DEM random packing model with ellipsoids or rings was examined recently [19,20], although in this case the column sizes were relatively small compared to the particle size. These are very challenging studies compared to the simulations with traditional ideal spheres, but their applications are limited at present because of the small chamber size or the monodisperse particle assumed in these cases.
When a packed bed is designed with particles having a non-ideal shape, measurements of both the radial porosity distribution and the gas velocity distribution also provide meaningful insights into the properties of the bed. The traditional method for measuring the radial porosity distribution in a packed bed of non-ideal particles was a destructive technique using resin consolidation and dissection, combined with image analysis of the cross section [21,22]. The major advantage of this method is that it is applicable to non-ideal shaped particles like crushed plates, cylindrical particles, wood chips, and so on. These porosity measurements are conducted mainly at the laboratory scale owing to the cost of machining for dissection of the bed. Radial gas velocity distribution measurements have also been carried out by various methods, but in many cases, the objects of these measurements were ideal spherical particles. Measurement by the scanning hot-wire anemometer is one convenient and useful method for measuring the gas velocity profile above a packed bed [23].
In the following research, we investigated the gas velocity distribution inside and outside a packed bed of plate-shaped particles at both the laboratory scale and the pilot scale, and evaluated the intensity and the influence of the wall effect. The primary goal of this work was to estimate the effect of the gas distribution inside the slag packed bed on the heat recovery process, especially in case of scale-up designing of the heat recovery chamber. This article is organized as follows: Section 2 introduces the results of the laboratory-scale gas velocity measurement above a packed bed of plate-shaped samples conducted as a basic study. In the same section, we also evaluate the accuracy of a simple CFD model for estimating the gas distribution inside a chamber having a packed bed as the base model of the scale-up simulation. The topic of the next Section 3 is the pilot-scale slag heat recovery chamber. Here, we conducted both pilot-scale slag heat recovery tests and CFD simulations at the same scale, and compared these results for better understanding of the scale-up effect. Section 4 presents the conclusions of this study.
2. Gas Velocity Distribution in Laboratory-Scale Packed Bed of Plate-Shaped Samples
2.1. Laboratory-Scale Gas Velocity Measurements
The first step of this work was measurement of the gas velocity distribution above a packed bed of plate-shaped materials at the laboratory scale. To simplify the evaluation, single-shaped samples were used in the experiment to clarify the effect of shape differences. The left side of Figure 3 shows a schematic drawing of the experimental apparatus for this measurement. The steel chamber was designed with the inner diameter of 300 mm. Considering the small chamber size, flat tiles with a rectangular shape were prepared to simulate the plate-shaped slag in the experiment (hereafter, these flat tiles are called “plate-shaped samples”). The long side length of the plate-shaped samples was 22.5 mm, which was designed to be smaller than 1/10 of the chamber diameter 300 mm so as to create regular packed bed having enough randomness. These samples were sized to 8 mm × 22.5 mm × 22.5 mm by dividing 8 mm × 22.5 mm × 149 mm flat tiles with both a sanding machine and a chisel. The center photo in Figure 3 shows the steel chamber used in this experiment.
The plate-shaped samples were packed into the chamber, in which a perforated plate for air blowing was placed at the bottom of the bed in order to blow air into the bed uniformly. On the tapered wall of the top of the chamber, a rotating rod that was driven by reduction gears was placed coaxially to turn a hot-wire anemometer (MODEL 6034, KANOMAX, Andover, NJ, USA) with a constant rotation angular velocity. The gear was connected directly to a pulley, and was rotated by pulling a string on the pulley at a constant speed. The radial position of the anemometer probe (r in Figure 3) was kept constant by the fixed arm bar during the rotation. The gap between the probe and the top level of the packed bed was set to be 50 mm. After starting both the turning of the anemometer and the measurement of the gas velocity, air was blown from the bottom of the chamber at the flow rate of 200 L/min. Table 1 shows the experimental conditions of this measurement. The radial position of the probe was changed by the length of the arm bar in each measurement. As the chamber has an inner radius of 150 mm, the radial position of 140 mm means that the gap between the inner wall and the probe was kept at 10 mm during the rotation. Since the rotation speed was constant at 1.71 rpm in all the measurements, the peripheral velocity of the probe changed depending on the selected arm length. The measurement was conducted after reaching stable gas flow condition to minimize the effect of instability caused by the complex gas flow through the packed bed during measurements.
The effect of non-ideal shaped particles is sometimes discussed by using the following equivalent particle size. The equivalent spherical volume diameter ds is calculated by Equation (1). The equivalent particle diameter dp (also called the Sauter mean diameter) in Equation (2) means the sphere size that has the same volume/surface area ratio as a particle of interest. When considering the effect of the surface heat transfer phenomena of irregularly-shaped particles, dp is sometimes used preferably in the modeling. Sphericity is defined by the following Equation (3), and means the irregularity of the particle shape. These values are also listed in Table 1.
2.2. Laboratory-Scale Gas Velocity Measurements—Results and Discussion
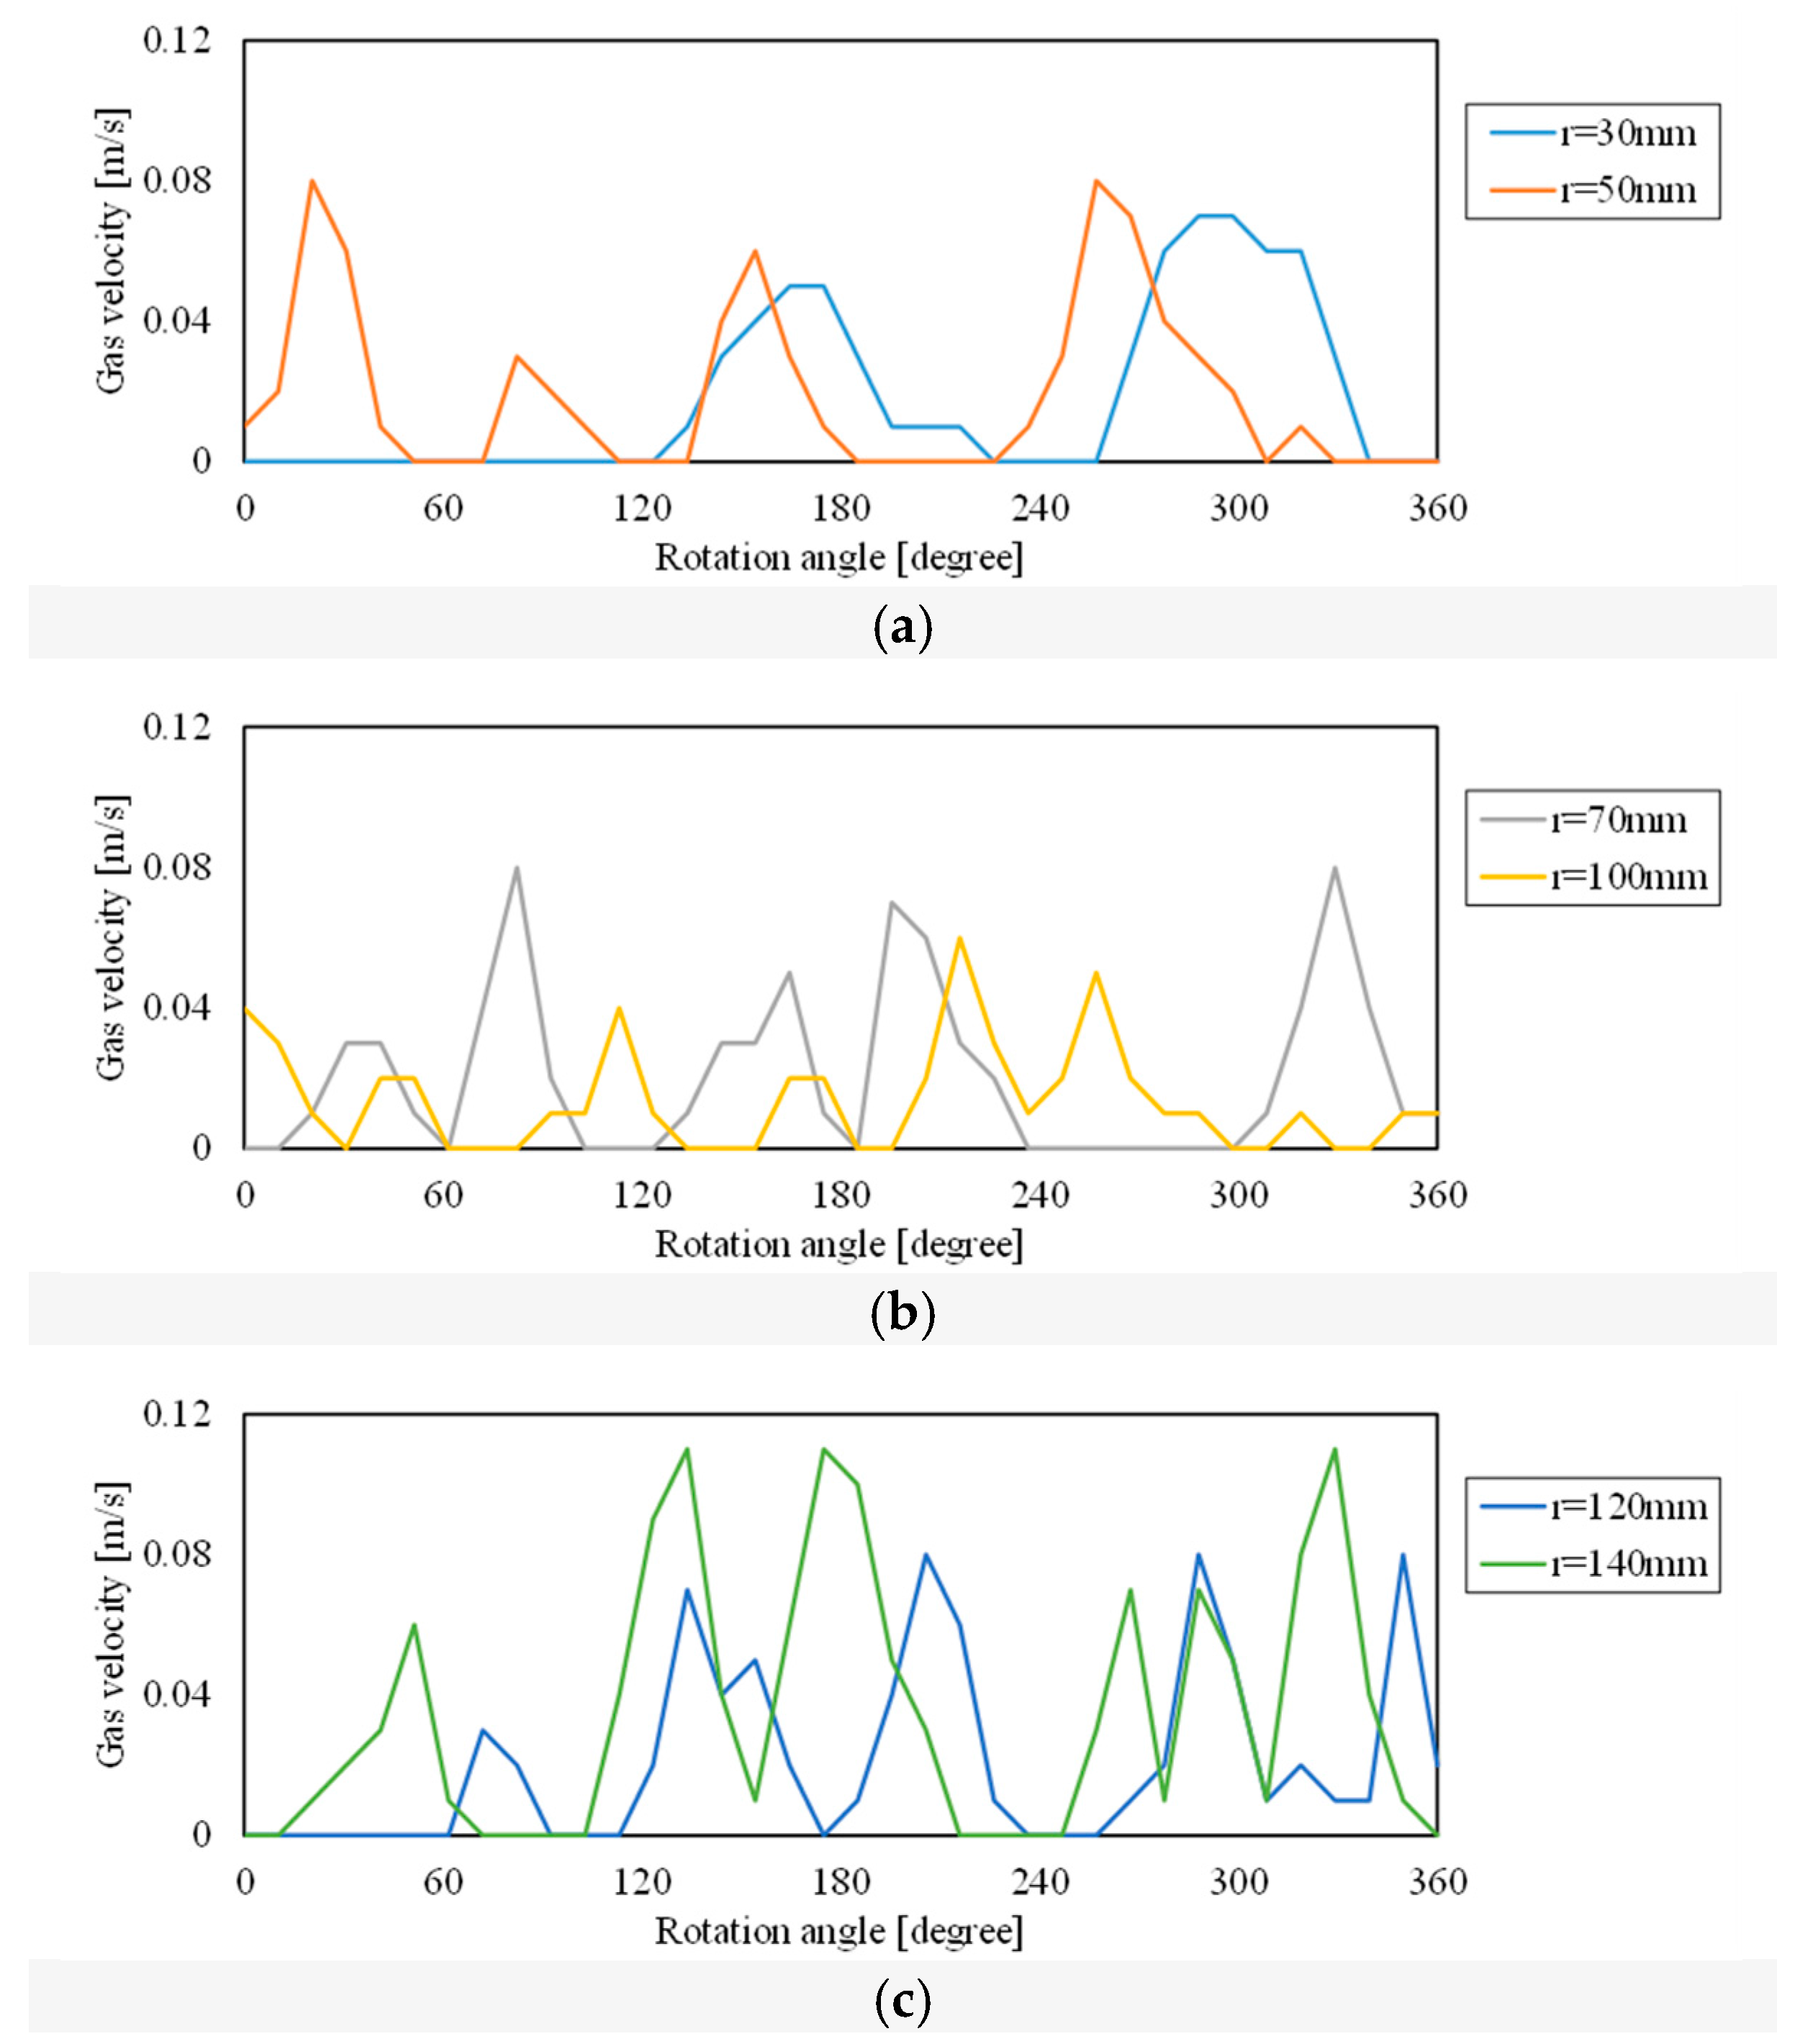
Figure 4a–c shows the gas velocity profiles measured by the experimental apparatus described above during one revolution of the probe at different radial positions. The fluctuation of these results were attributed to the gas blocking effect by the covering samples that were placed horizontally at the top of the packed bed. The higher gas flow rate was observed above the place where the gas flowing pass was not blocked by the covering samples. On the other hand, the gas blowout was completely blocked, which resulted in the measured gas velocity of almost zero, at the place where the covering samples were directly blocking the gas flowing pass. This phenomenon is intensively observed in the case of plate-shaped particles with flat surfaces, and this is the reason why circumferential scanning of the probe is reasonable in this case compared to the transversal method used with spherical particles by Raichura [23]. The largest gas velocity among the results from Figure 4a–c was observed at r = 140 mm, where the gap between the anemometer probe and the inner wall was 10 mm.
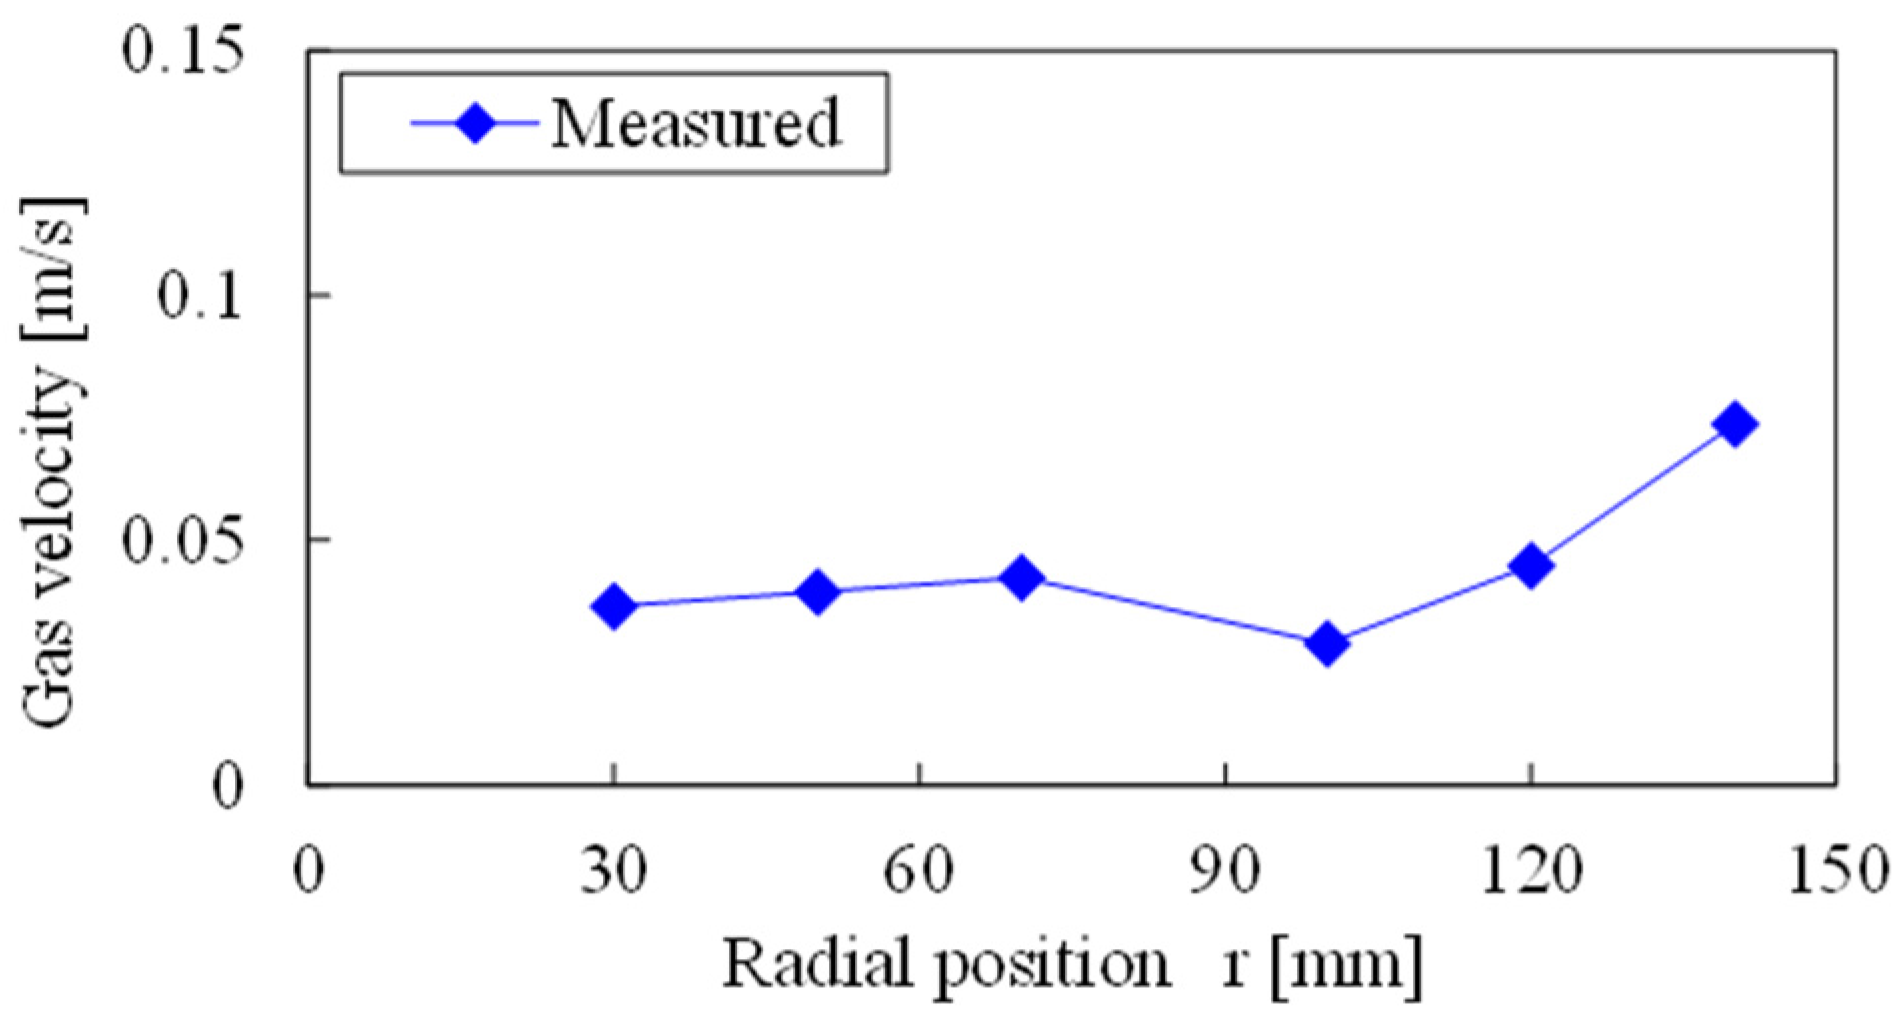
Figure 5 shows the radial distribution of the average gas velocity at each r distance. The local gas velocity increase due to the wall effect is clearly observed at the right end of the graph. The intensity of the wall effect seems to be nearly on the same level as that with the other packed materials introduced in previous studies by both experimental measurements and/or calculations.
2.3. Laboratory-Scale CFD Simulation
To make a simplified model for estimation of the gas distribution inside the packed bed of plate-shaped particles, we conducted CFD simulations of the same laboratory-scale chamber by 2D axisymmetric steady state analysis with ANSYS FLUENT 14.0. The CFD calculation was conducted based on the following mass conservation equation, Equation (4), and the momentum conservation equation, Equation (5), (i.e., Navier-Stokes equation for incompressible fluid) that were solved by using SIMPLEC algorism for pressure-velocity coupling [24].
Mass conservation equation:
Momentum conservation equation:
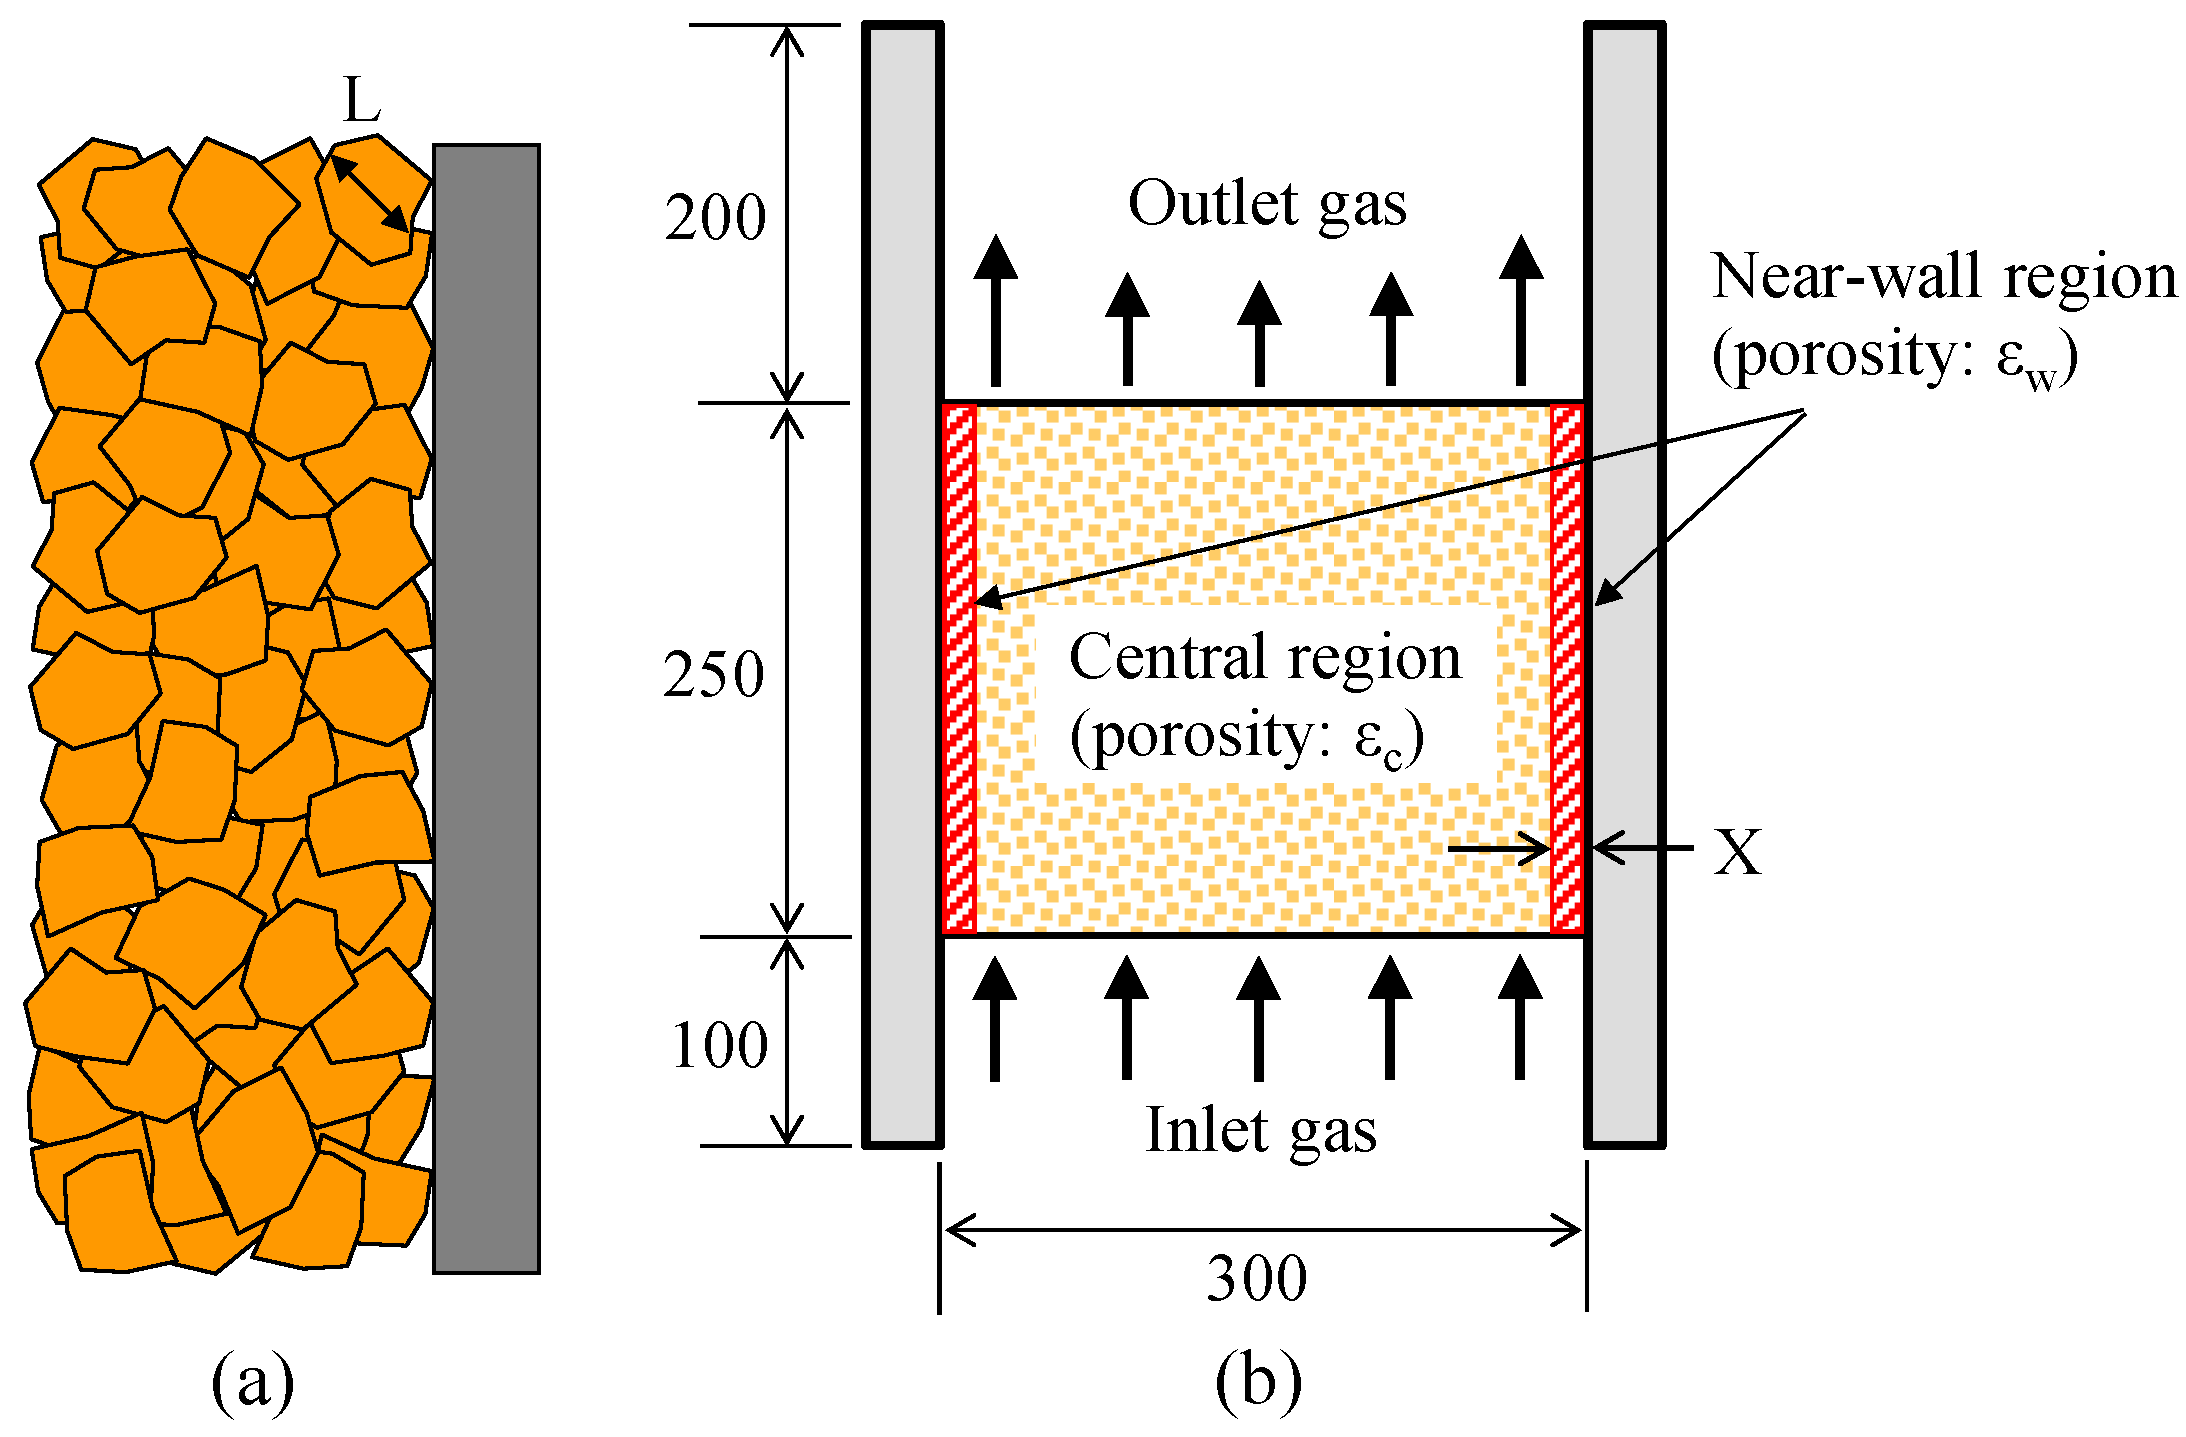
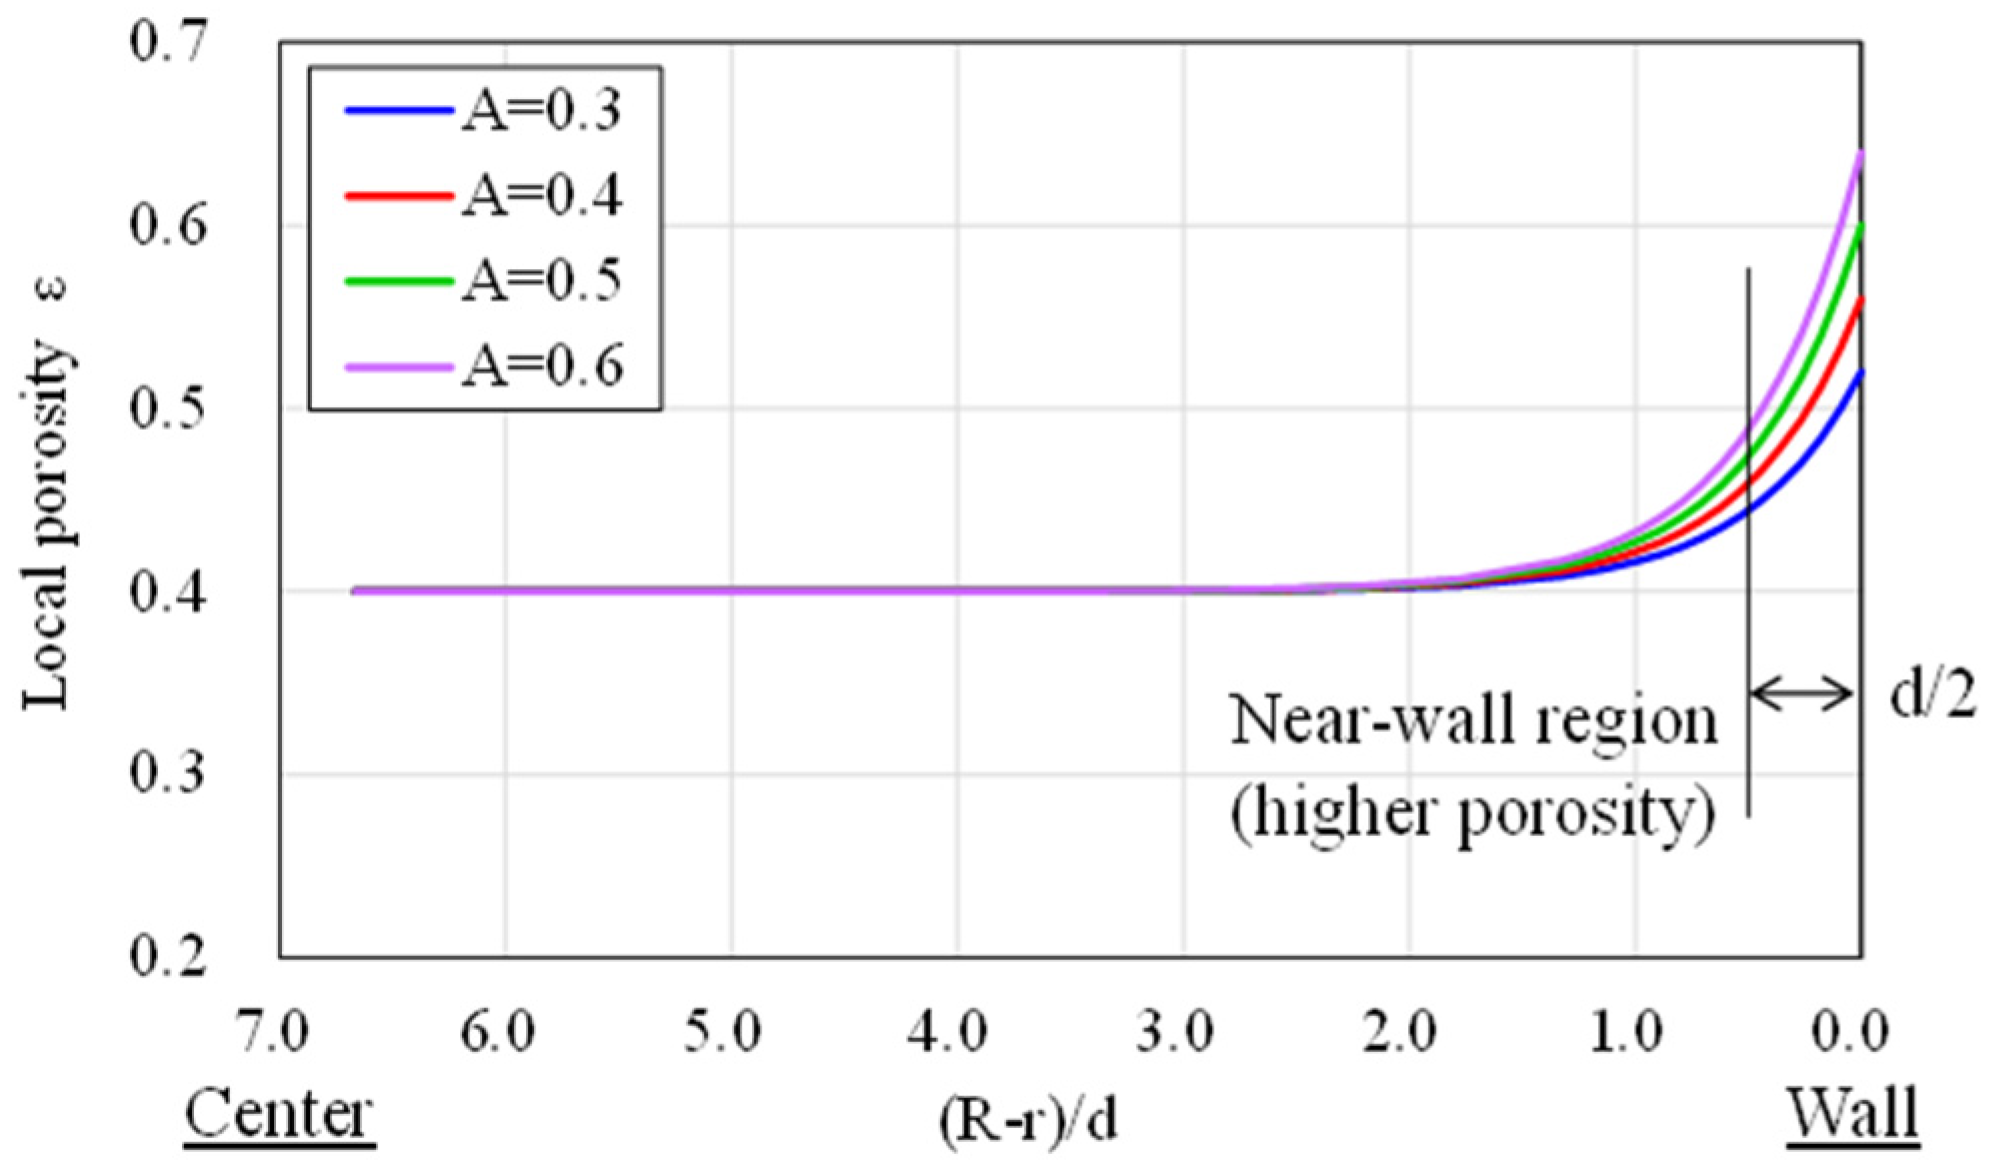
The right side of Figure 6 shows a drawing of a modeled chamber. The left side of Figure 6 shows a schematic image of the porosity distribution around the inner wall of the chamber. As mentioned above, the bed porosity is increased locally in the vicinity of the inner wall due to the wall effect. From the previous studies of the radial porosity distribution inside packed beds of non-ideal shaped particles, it is already known that the influence of the wall effect on non-ideal shaped particles is weaker than that on ideal spherical shaped particles, which creates strong oscillation of the radial porosity distribution in the vicinity of the wall [21]. This difference is considered to be the result of the anisotropic packing condition depending on the shape of the particles. Therefore, simple modeling by separating the “near-wall region” having porosity of εw and “central region” having porosity of εc in the porous medium was adopted to simplify the model [25]. The thickness of the near-wall region (X in Figure 6) can be estimated by the following porosity function shown in Equation (6), which is defined within the distance from the column wall [26,27,28]. The parameter A decides the porosity increment in the vicinity of the wall, which is usually decided empirically.
Figure 7 shows the calculated radial porosity distribution with different A values. Regardless of the A value, the higher porosity region emerges within a distance of 1d from the wall and is more prominent within 0.5d, as illustrated in Figure 7. Therefore, it is convenient to define the near-wall region having higher porosity εw as the region within the radial distance of 0.5d from the inner wall.
Table 2 shows the calculation conditions used in this analysis. The bold italic data in the table are the boundary conditions for this simulation. The chamber was modeled with 11,826 cells having quadrilateral meshes. The bed property was defined as a porous medium having a heating surface area, which was calculated by multiplying the estimated number of samples per unit volume and the surface area of a sample. In general, plate-shaped particles have relatively lower sphericity, and as the result, they have a tendency to stack horizontally under the effect of gravity in the packed bed. Therefore, in this simulation, the long side length of the particle L was used to represent the particle size d prior to the equivalent spherical volume diameter ds so as not to underestimate the wall effect, especially in case the sphericity is much lower than one. Accordingly, the thickness of the near-wall region x was set to be 0.5L in the following simulation. In our experimental setup, the plate-shaped samples have a relatively smaller long side length L against the plate thickness compared to that of the actual plate-shaped slag in Figure 2, which results in the small difference between L and ds in Table 1. Therefore, the model itself does not change significantly if L was used instead of ds in the laboratory-scale study. The porosity of the near-wall region εw, which is related to the A value in Equation (6), was assumed to be 1.4 times larger than that of the central-region εc with reference to the measured radial porosity profile in a packed bed of plate-shaped samples obtained by Montillet et al. [21]. This is equivalent to the A value of 0.4 in Figure 7. The value of the porosity of the central-region εc in Table 2 was obtained by the bulk average porosity measured previously from the sample packing weight, packing height, and sample density.
2.4. Laboratory-Scale CFD Simulation—Results and Discussion
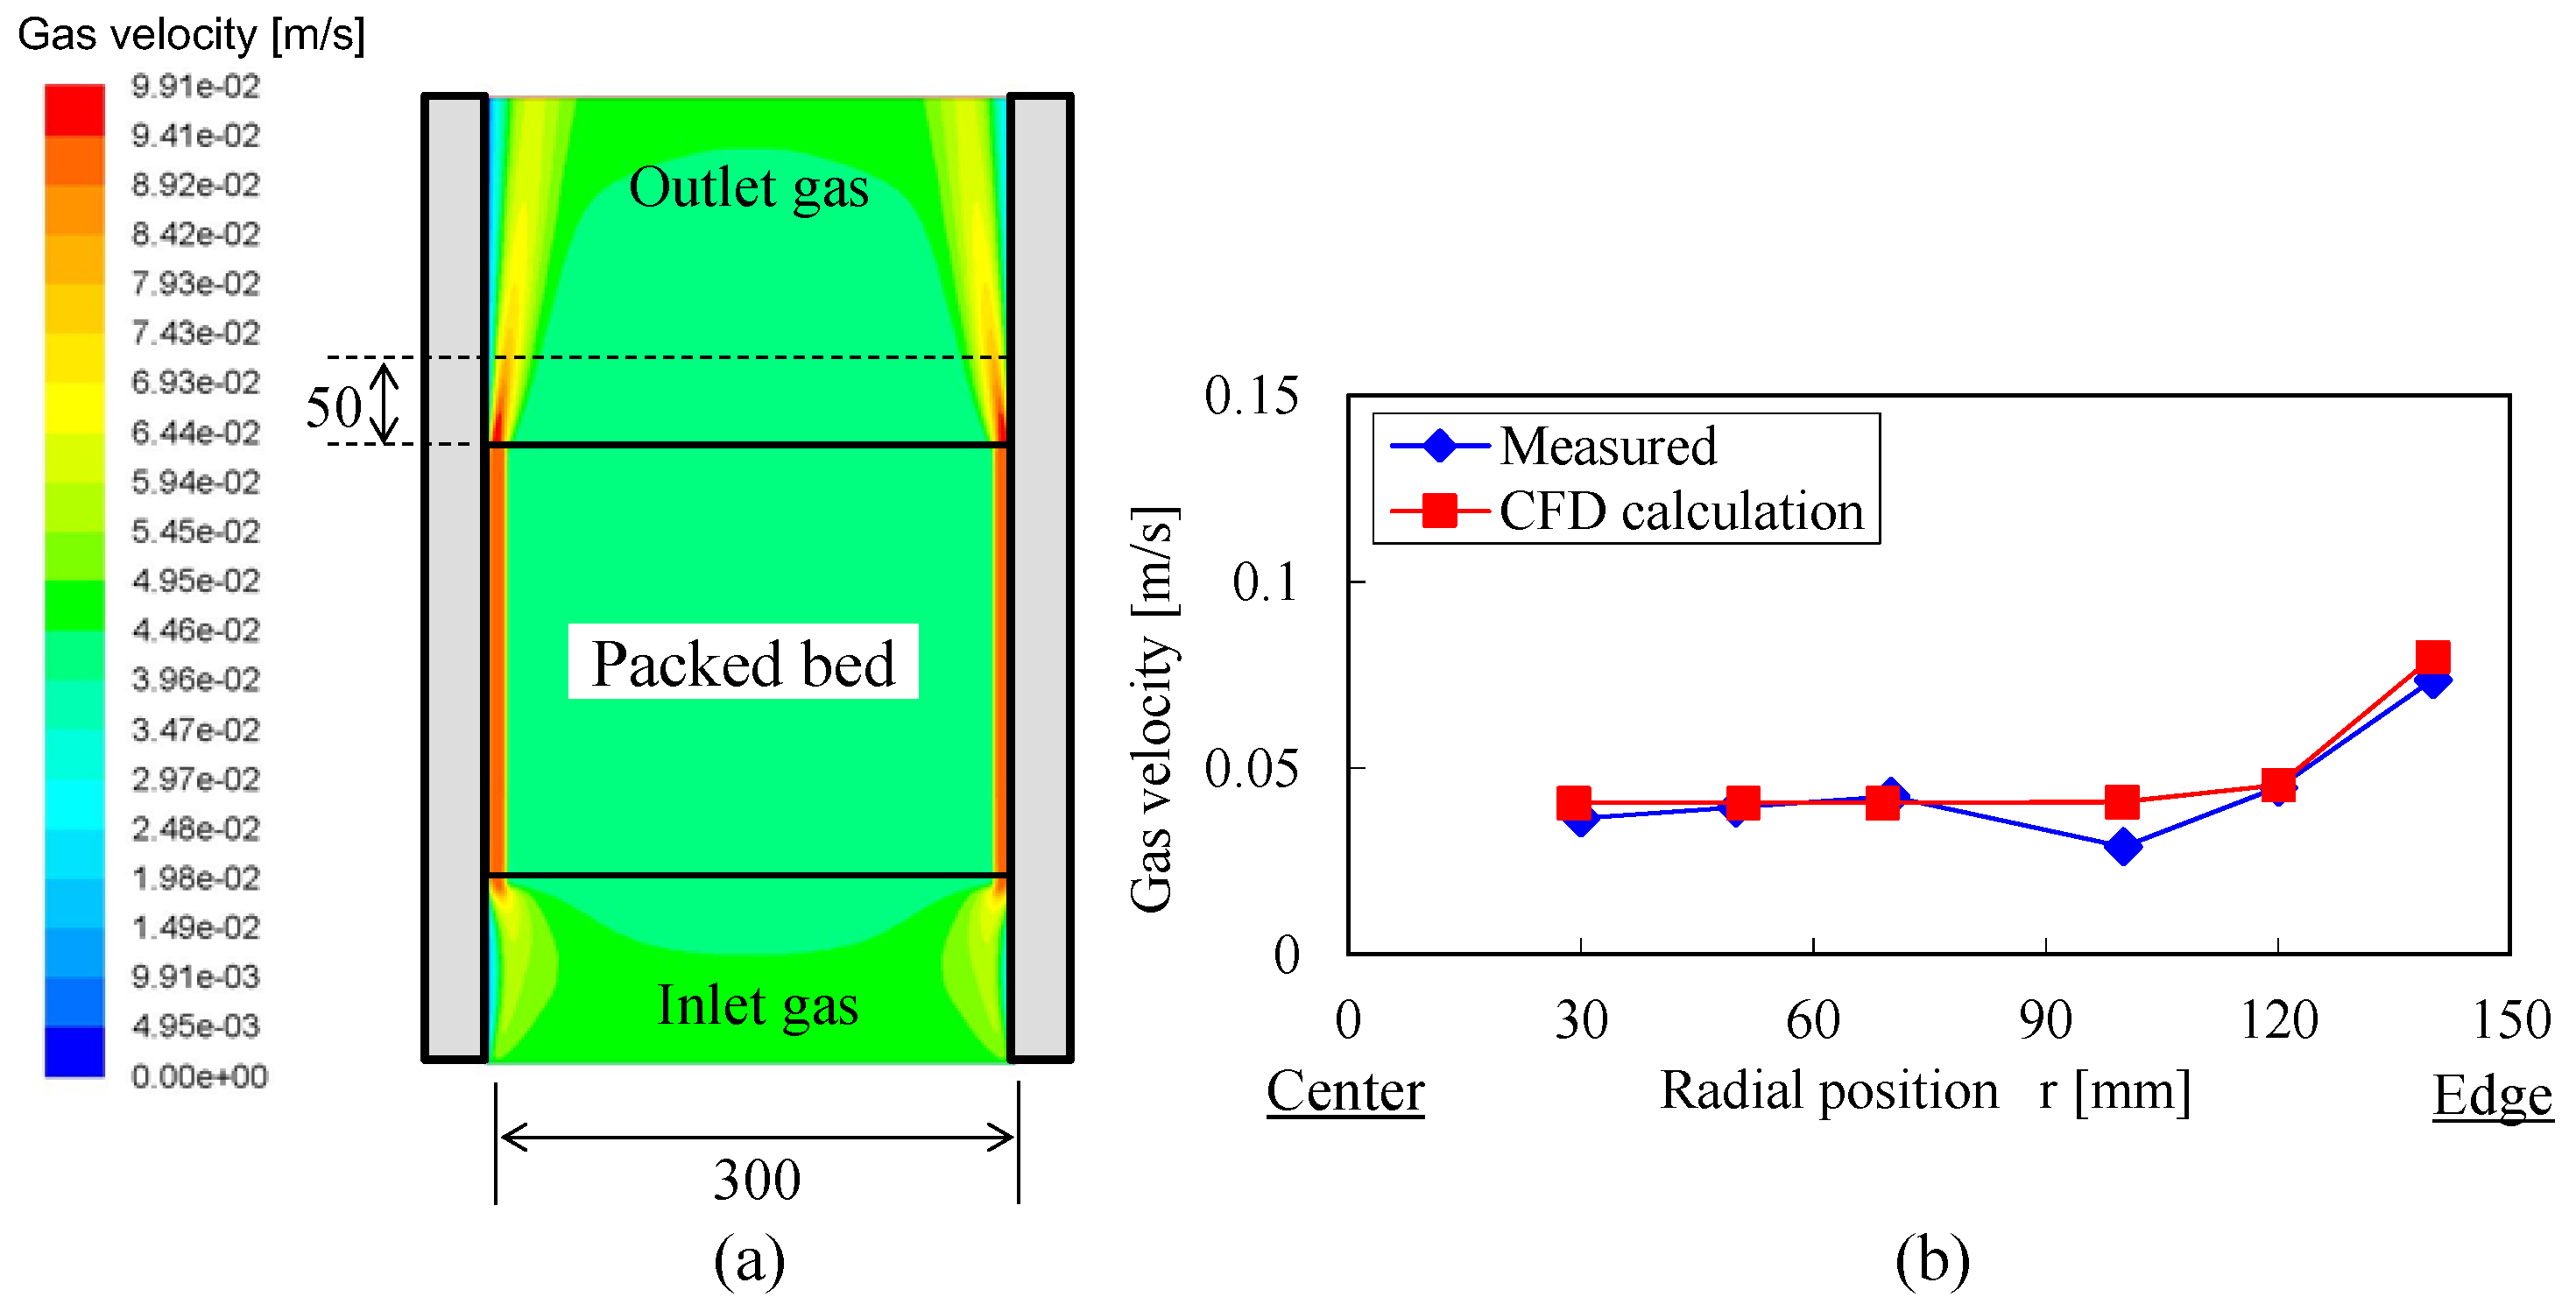
The left side of Figure 8 shows the gas velocity distribution illustrated by color contours, in which the wall effect is visually observed. The right side of Figure 8 shows the radial gas velocity distribution above the packed bed obtained by both the experiment and the CFD simulation.
To compare the experimental and simulation results under equal conditions, the simulation result used here was the value at 50 mm above the top line of the packed bed (dotted line on the left side of Figure 8), which is equal to the height of the probe in the experiment. The local gas velocity increase due to the wall effect was observed with similar intensity, which verified the validity of the simple CFD model even for packed materials with a plate-like shape. The measured gas velocity around the center of the bed was almost equal to the calculation result and was also almost equal to the gas superficial velocity calculated from the inlet gas flow rate of 0.047 m/s, meaning that the local gas velocity increase observed in this measurement did not affect the gas distribution significantly at this scale. It was estimated that the random packing condition and the effect of friction between the samples prevented local piling up of the samples, and as the result, many porosities were retained inside the bed and were sufficient to distribute the gas through the bed. Additionally, the chamber-to-particle diameter ratio D/d in this chamber was designed to be higher than 10, which is generally considered to be sufficient to reduce the wall effect.
3. Gas Velocity Distribution and Heat Recovery Efficiency in Pilot-Scale Slag Packed Bed
3.1. Pilot-Scale Slag Heat Recovery Tests
After evaluating the gas velocity distribution at the laboratory scale, a pilot-scale test was conducted with a newly-constructed slag heat recovery pilot plant as the next step. Figure 9 shows the exterior of the plant. As explained in Figure 1, this pilot plant consists of two individually designed plants, the Twin-roll plant and the Slag heat recovery plant. The plant specifications are listed in Table 3. The left side of Figure 9 shows the actual operation of the Twin-roll plant. Molten slag with a temperature above 1673 K was poured between the two water-cooled rolls by tilting the slag ladle transferred from the steelmaking shop, and the slag was solidified continuously on the surface of these rolls. The solidified plate-shaped slag was then removed from the roll surface at the side of the roll by the effect of gravity. After the plate-shaped slag was transported by the apron conveyer, the slag was crushed for easier charging into the slag heat recovery chamber. After charging the slag, air was blown into the heat recovery chamber. Table 4 shows the representative operation conditions of the pilot test. The ladle tilting speed of 1 mm/s was controlled by a tilting machine with a large enough capacity to load a 60 t slag ladle. The rotation speed of the cooling rolls was set to 10 rpm, which maintained stable slag pick-up behavior on the roll surfaces during operation. The amount of slag charged and the height of the slag packed bed were controlled by stopping continuous charging of the slag at the proper timing, which was determined by viewing the monitoring camera located on the upper side of the chamber to observe the level of the charged slag.
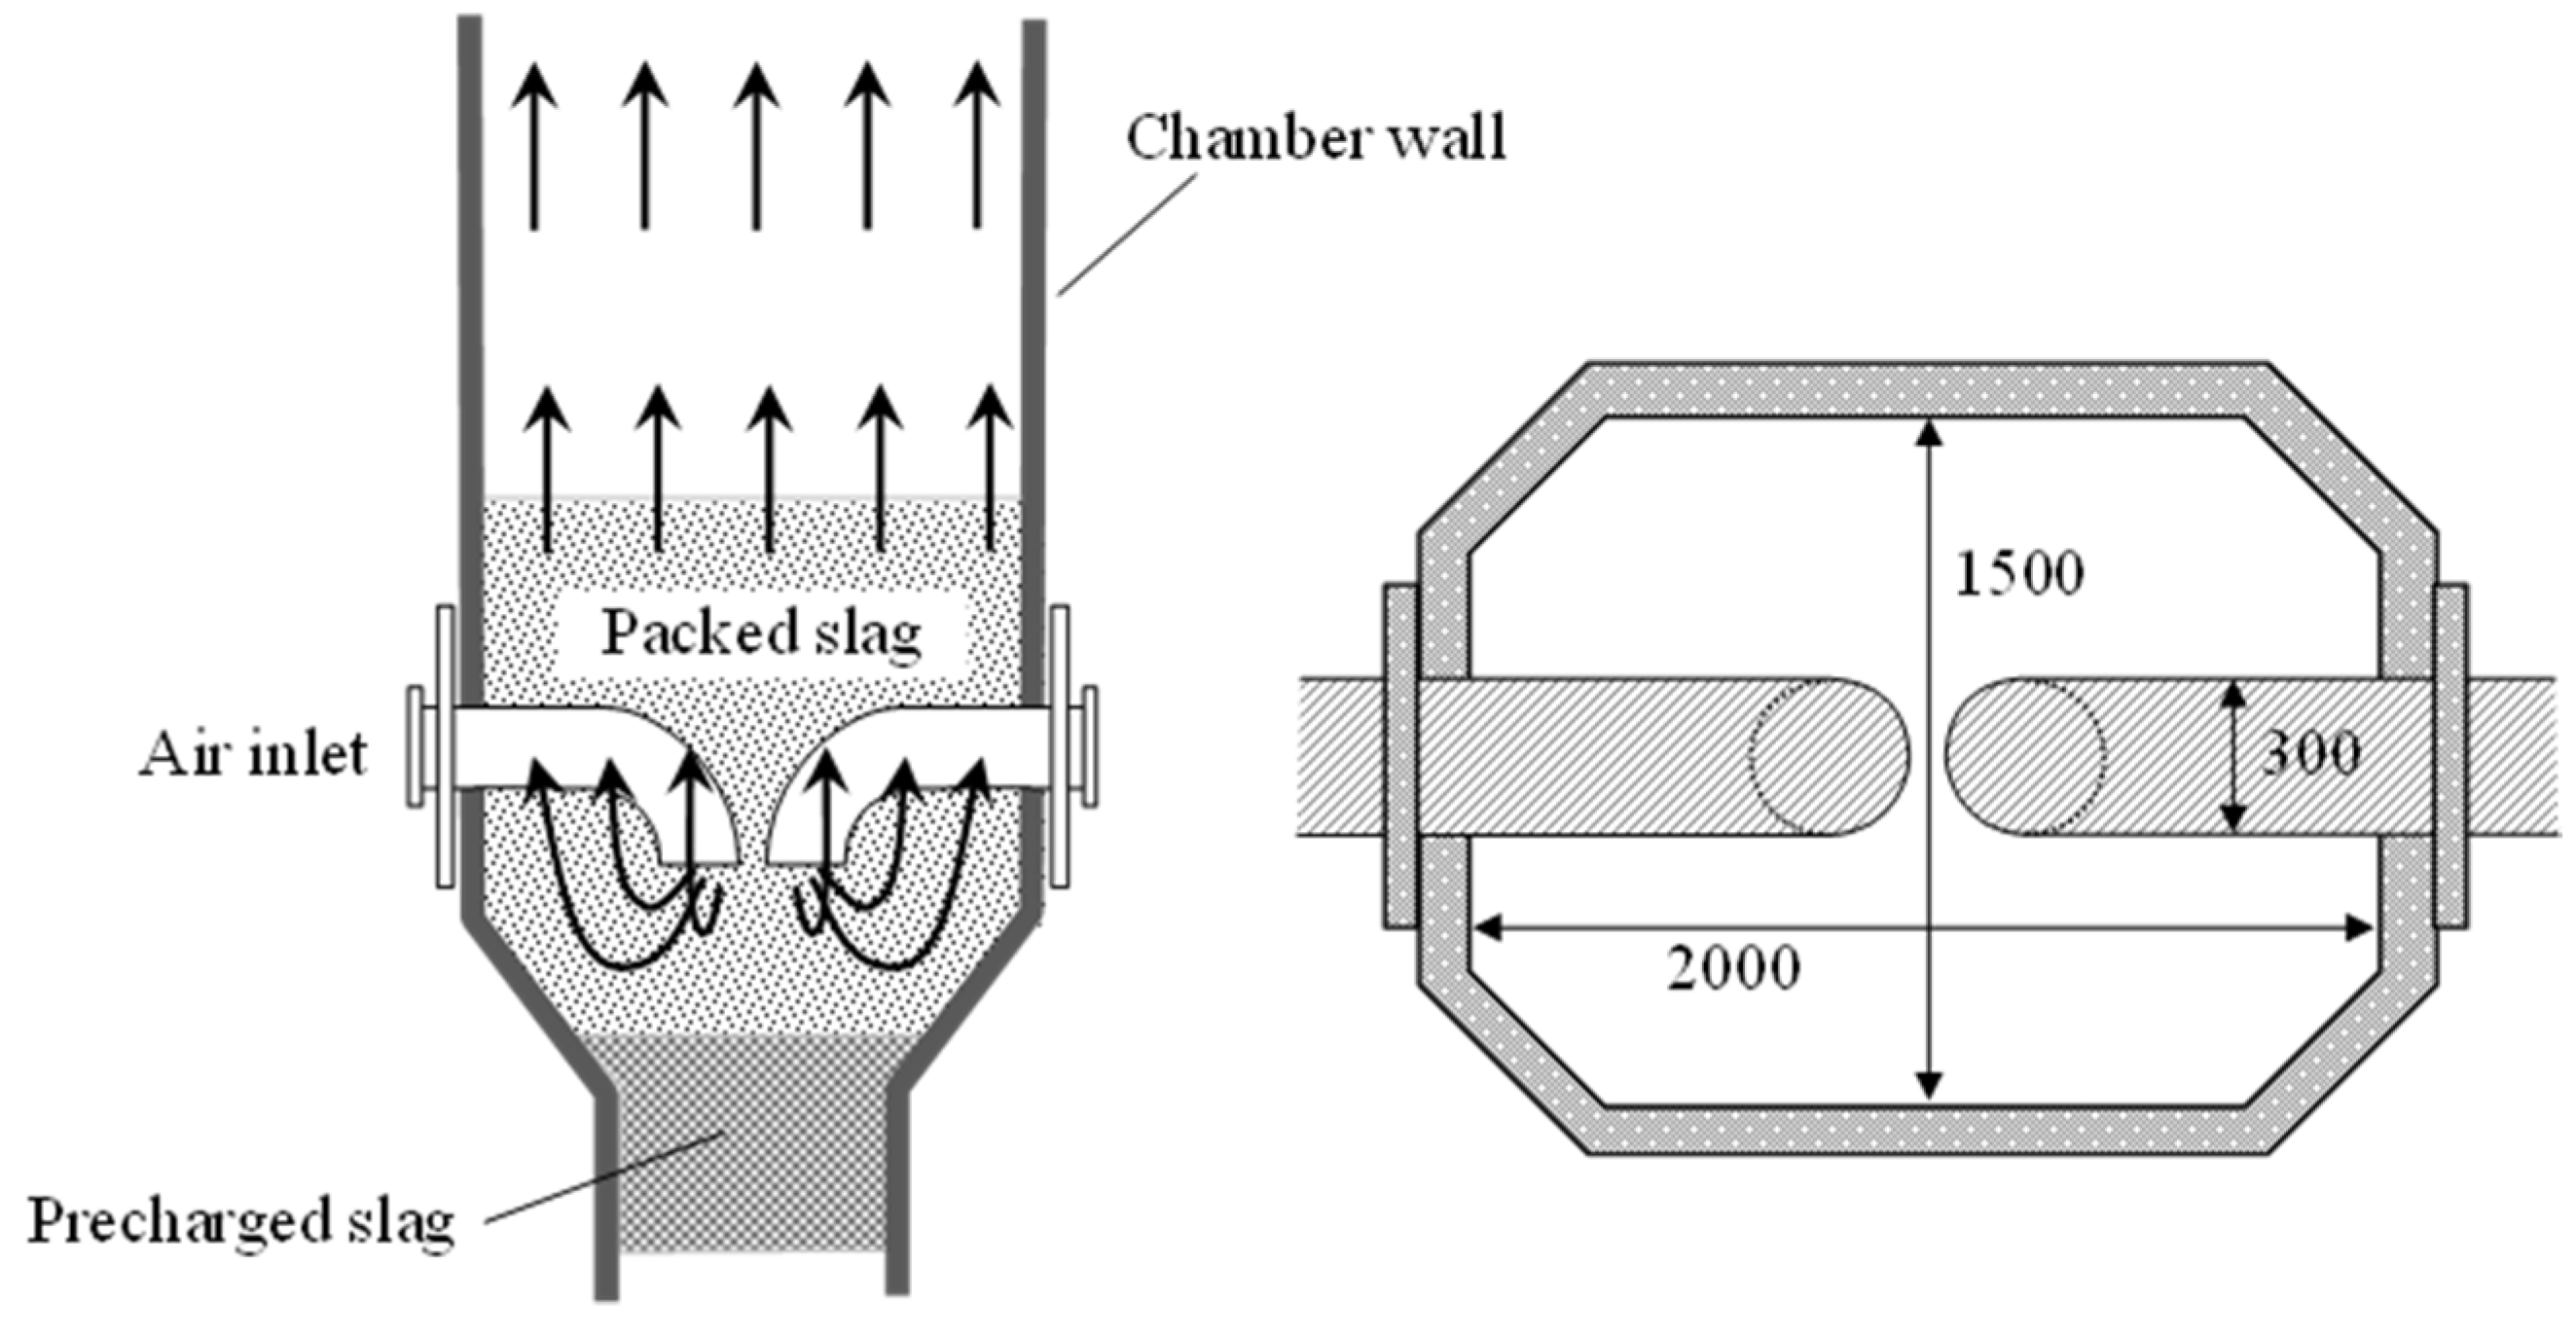
The right side of Figure 10 shows the horizontal cross section of the slag heat recovery chamber. Because of the lower gas pressure inside the chamber, the cross section was designed with an octagonal shape. For simplicity, the slag discharge device at the bottom of the chamber is omitted from the drawing.
Precharged slag is placed at the bottom of the chamber. This slag is charged in the cold state before starting hot slag charging in order to protect the slag discharging device from the thermal load of the hot slag. The heat recovery gas (air) is blown from the ends of two blast pipes inserted into the heat recovery chamber. The pipe ends are located close to the center of the chamber cross section to improve the uniformity of the gas distribution inside the slag packed bed. Each blast pipe has an elbow inside the chamber to blow the gas downward to the slag packed bed so as not to prevent introduction of gas into the center of the bed. The inlet gas flows as a reversing current around the pipe end and ascends through the packed bed. During the actual heat recovery process, the gas velocity increases gradually as heat recovery proceeds due to the effect of thermal expansion of the gas.
3.2. Pilot-Scale CFD Simulation
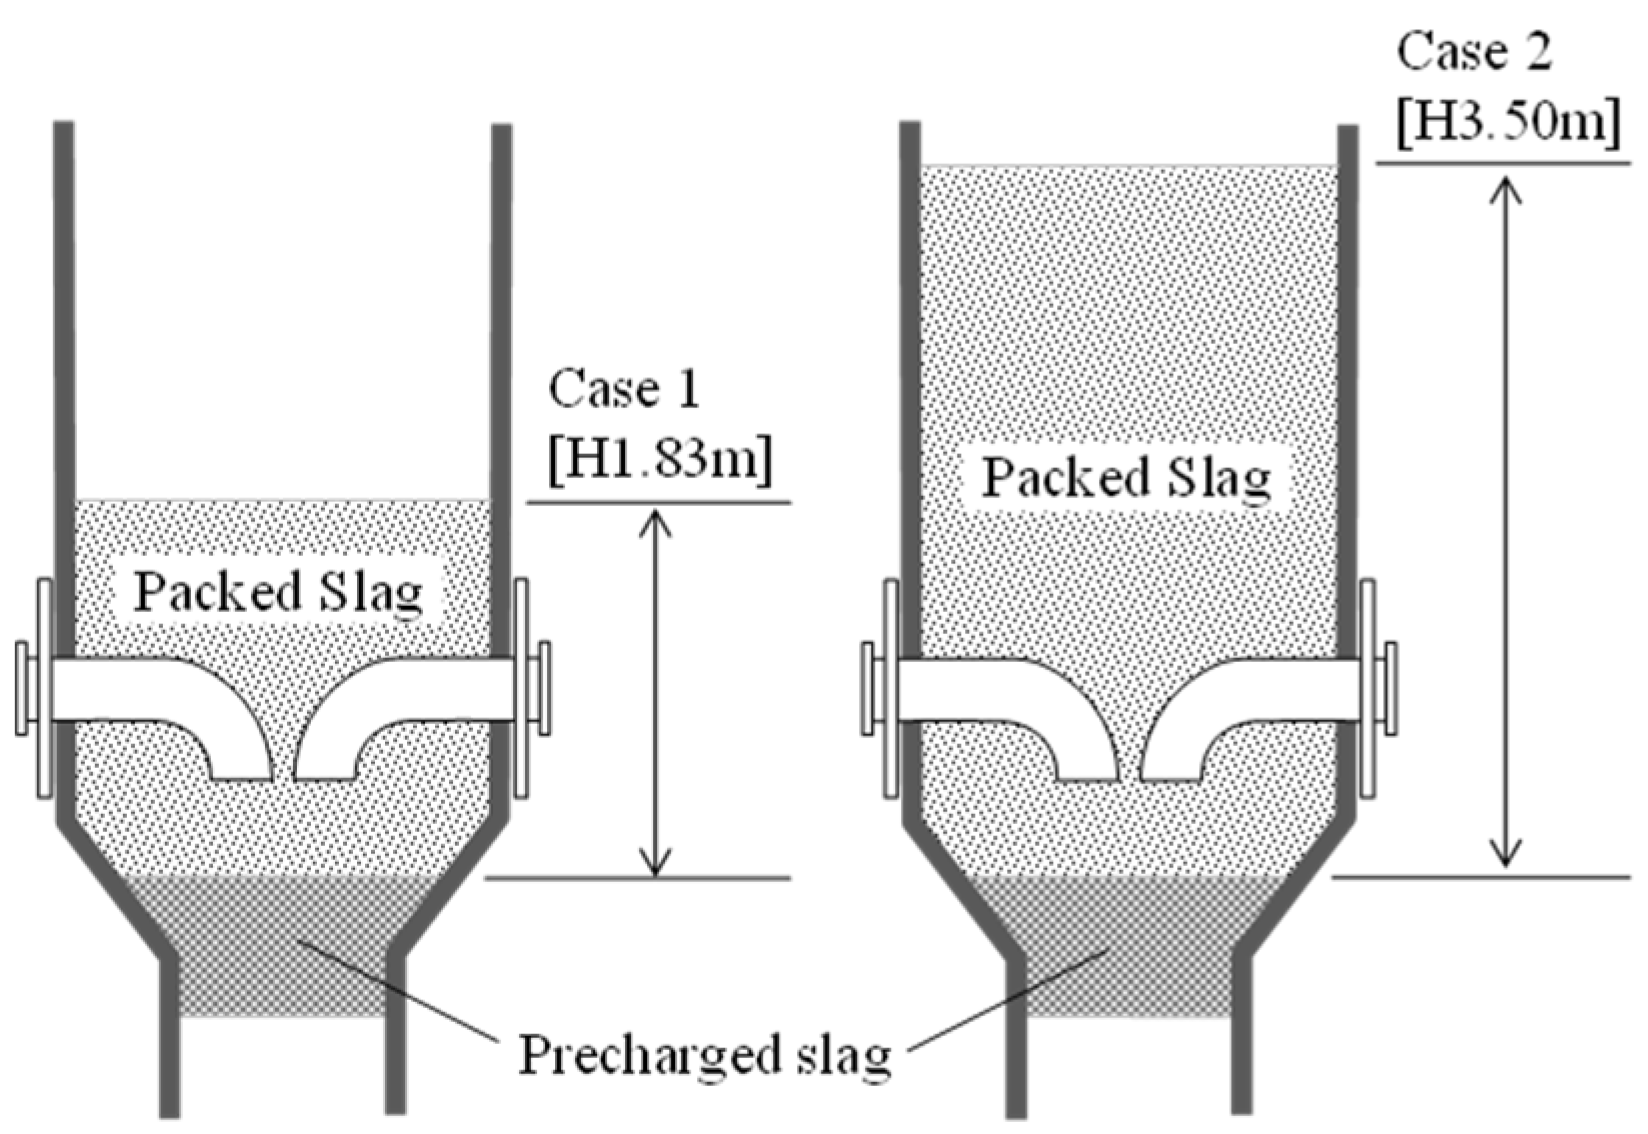
To estimate the gas distribution during slag heat recovery, pilot-scale CFD simulations were also conducted by 3D transient calculations. From Table 5, Table 6 and Table 7 show the conditions of the pilot-scale CFD simulations. The bold italic types in Table 5 are the boundary conditions for these simulations. The gas incompressibility was assumed also in these cases considering the small gauge pressure of below 20 kPa inside the slag chamber during heat recovery operations. The dimensions of the packed slag and its heating surface area were defined by the average size of the randomly-selected slag plates from actual production. In these simulations, the porosity of the bed was defined in the same manner as in the above-mentioned laboratory-scale CFD simulation model. Accordingly, the slag packed bed model was created by a porous medium having both the central-region with bulk average porosity and the near-wall region with higher porosity defined within the thickness of X = 0.5L from the wall. The near-wall region was created along all the surfaces of the inner walls and the blast pipes that were in contact with the packed slag. The porosity increment in the near-wall region was assumed to be the same as that in the laboratory-scale model. The chamber and the slag packed bed were modeled with approximately 3.09 million cells having polyhedral meshes by using ANSYS SpaceClaim 2012 and GAMBIT2.4.6. Figure 11 shows the height of the modeled slag packed bed. Two simulation cases with different slag packing heights were examined in order to evaluate the effect of scale-up designing of the chamber. Case 1 simulated the actual pilot test under the same operation conditions as in Table 4 to ensure the validity of the assumptions of the simulation model. Case 2 was examined to estimate the case of scale-up operation with a higher slag packing height and higher gas flow rate.
This pilot scale simulation was a hot state model including heat exchange between the heat recovery gas and the hot slag. In this case, the following energy equation, Equation (7), which included the transferred heat from slag to gas Qht, was solved along with the Equations (4) and (5). The Qht was calculated by the following heat transfer equation, Equation (8), in which the heat transfer coefficient h was defined as a user-defined function. To simulate the heat recovery behavior in the packed bed of plate-shaped slag, it is important to define the proper heat transfer coefficient h in the porous medium model, which is equivalent to the actual gas-to-plate heat transfer phenomenon. In general, the local Nusselt number Nux for heat transfer on an infinite flat plate can be estimated by Johnson-Rubesin’s equation, which is shown here as Equation (9) [29].
To apply this equation to small flat plates like the plate-shaped slag in this study, we used the average Nusselt number Num in Equation (10), which was obtained by integration of Equation (9) in the range from x = 0 to L. The average heat transfer coefficient hm was calculated by Equation (11), in which the average Nusselt number Num was multiplied by a correction factor β. In this pilot-scale model, the value of β was assumed to be 0.42, which was deduced empirically in our previous work [7].
Energy equation:
Heat transfer equation:
The pressure drop inside the bed was calculated by Ergun’s equation, Equation (12), which is commonly used for packed bed simulations:
3.3. Pilot-Scale CFD Simulation—Results and Discussion
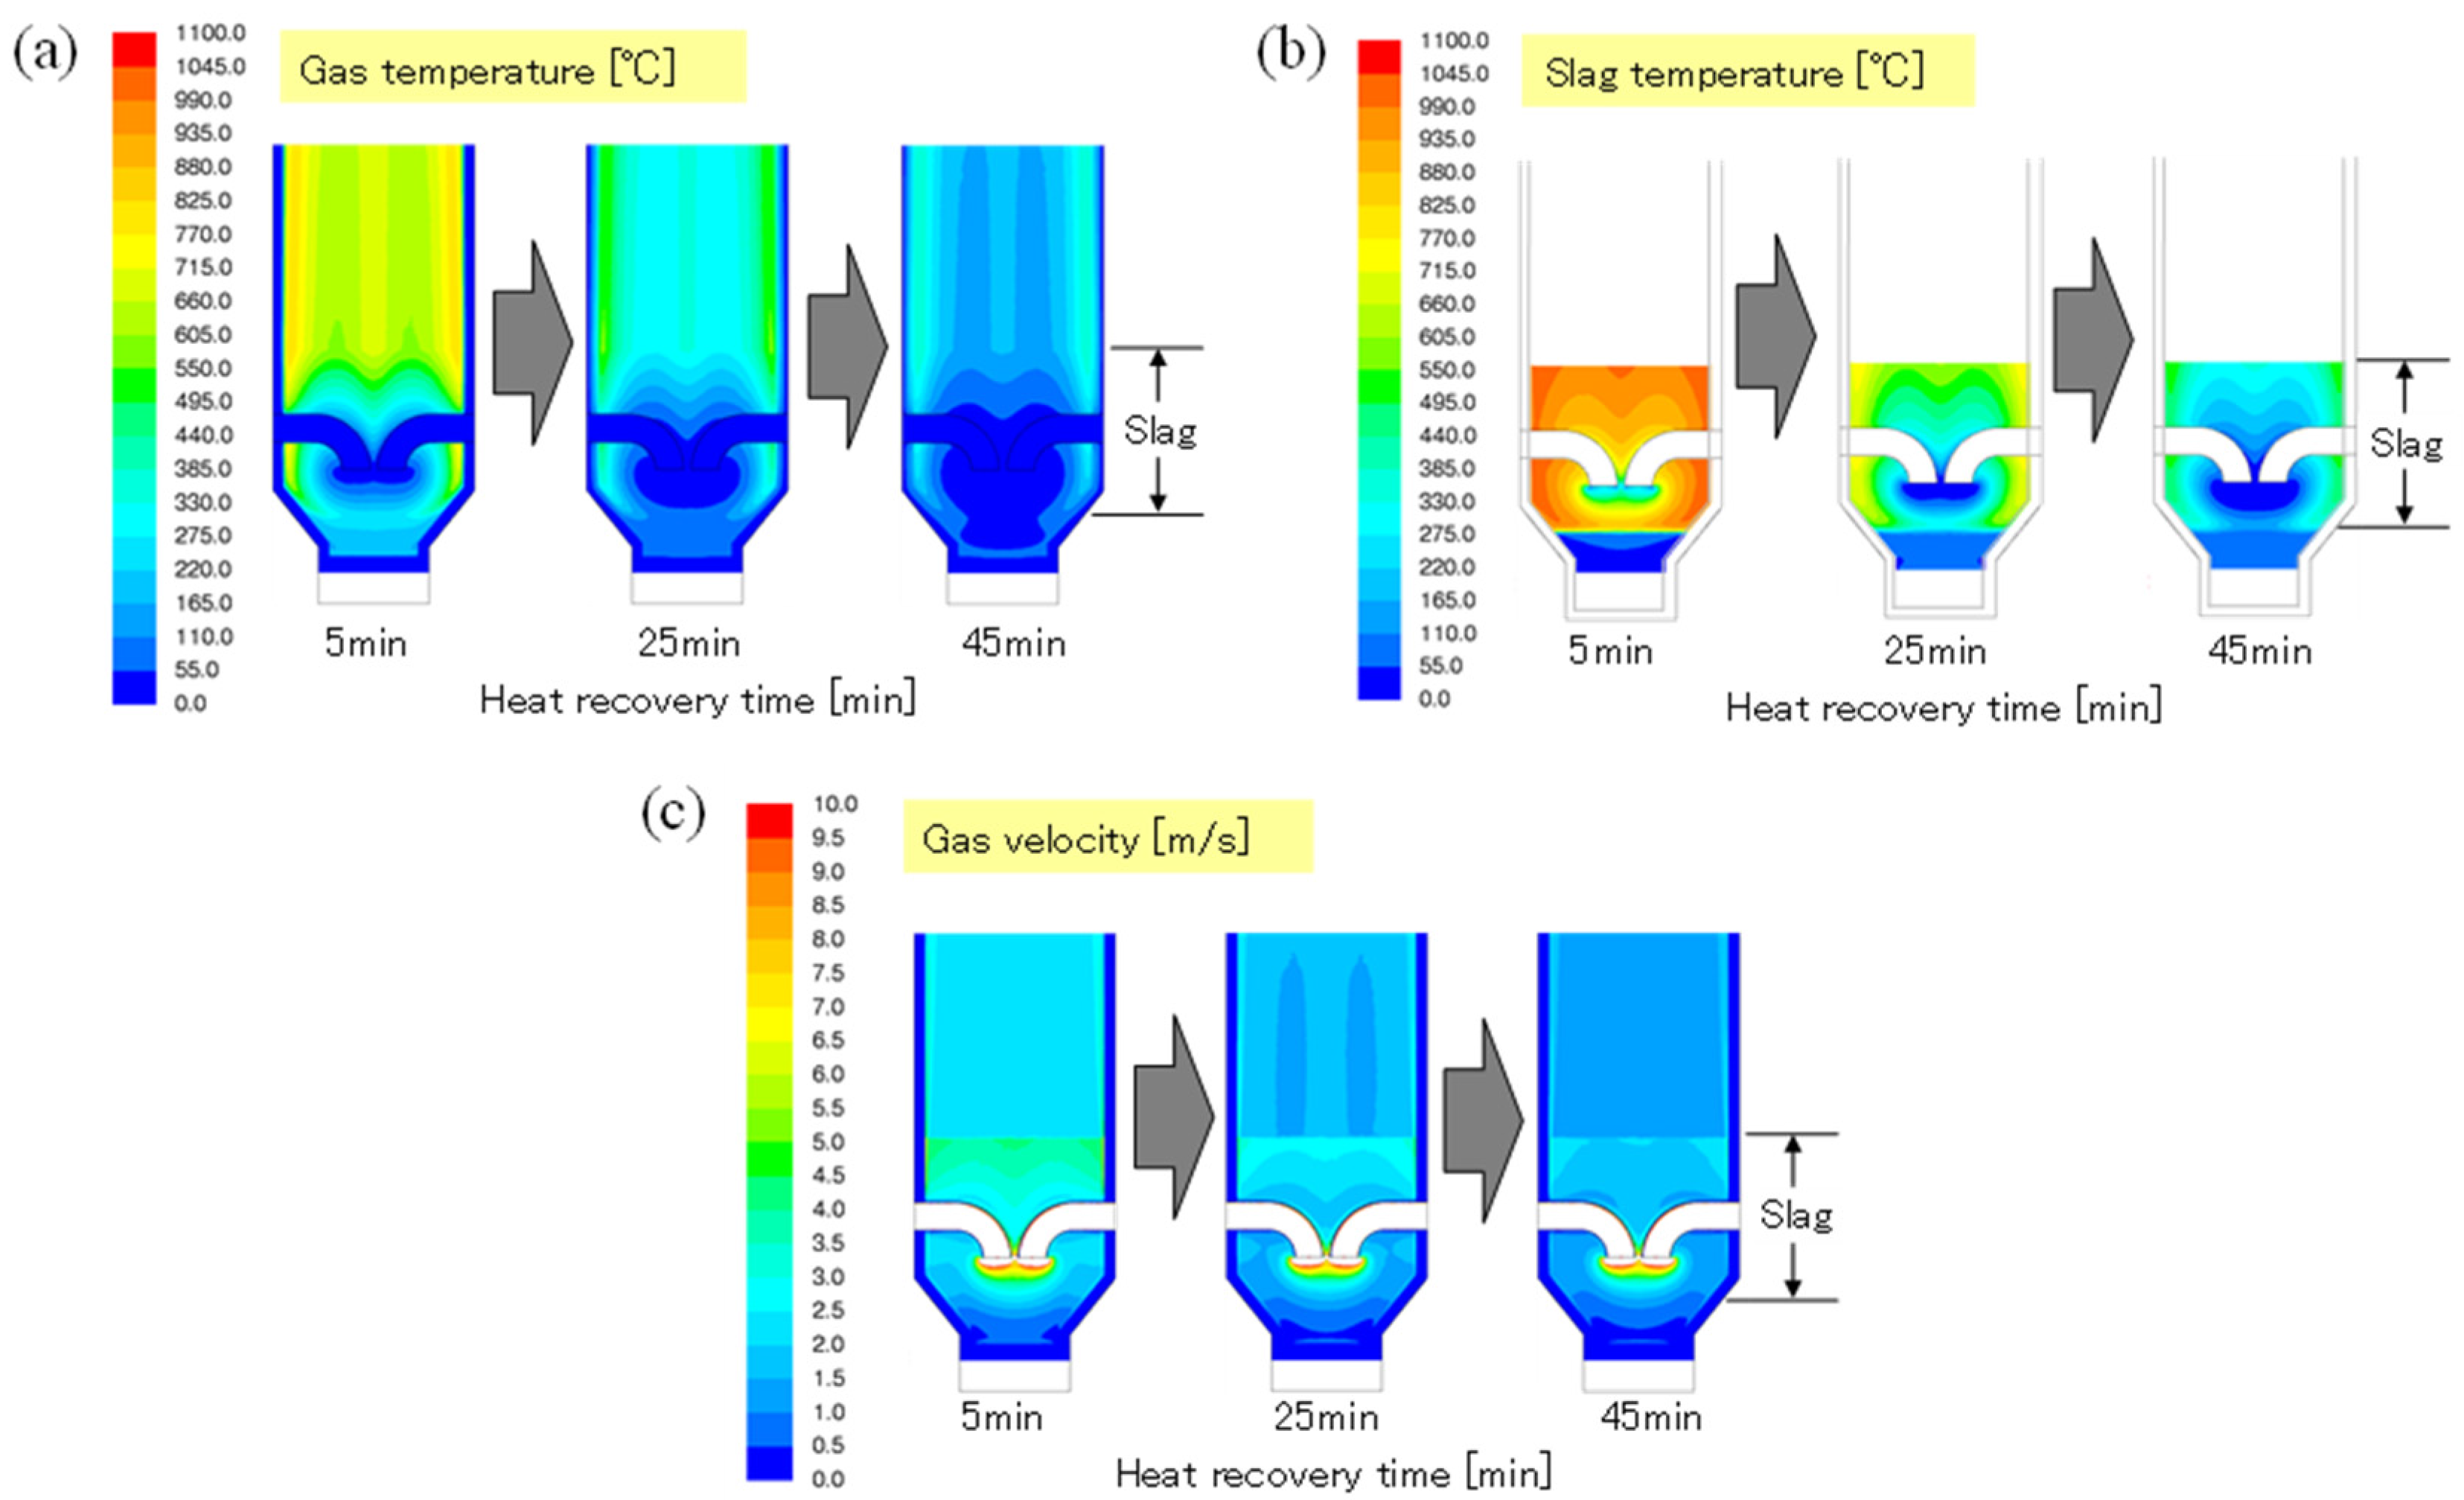
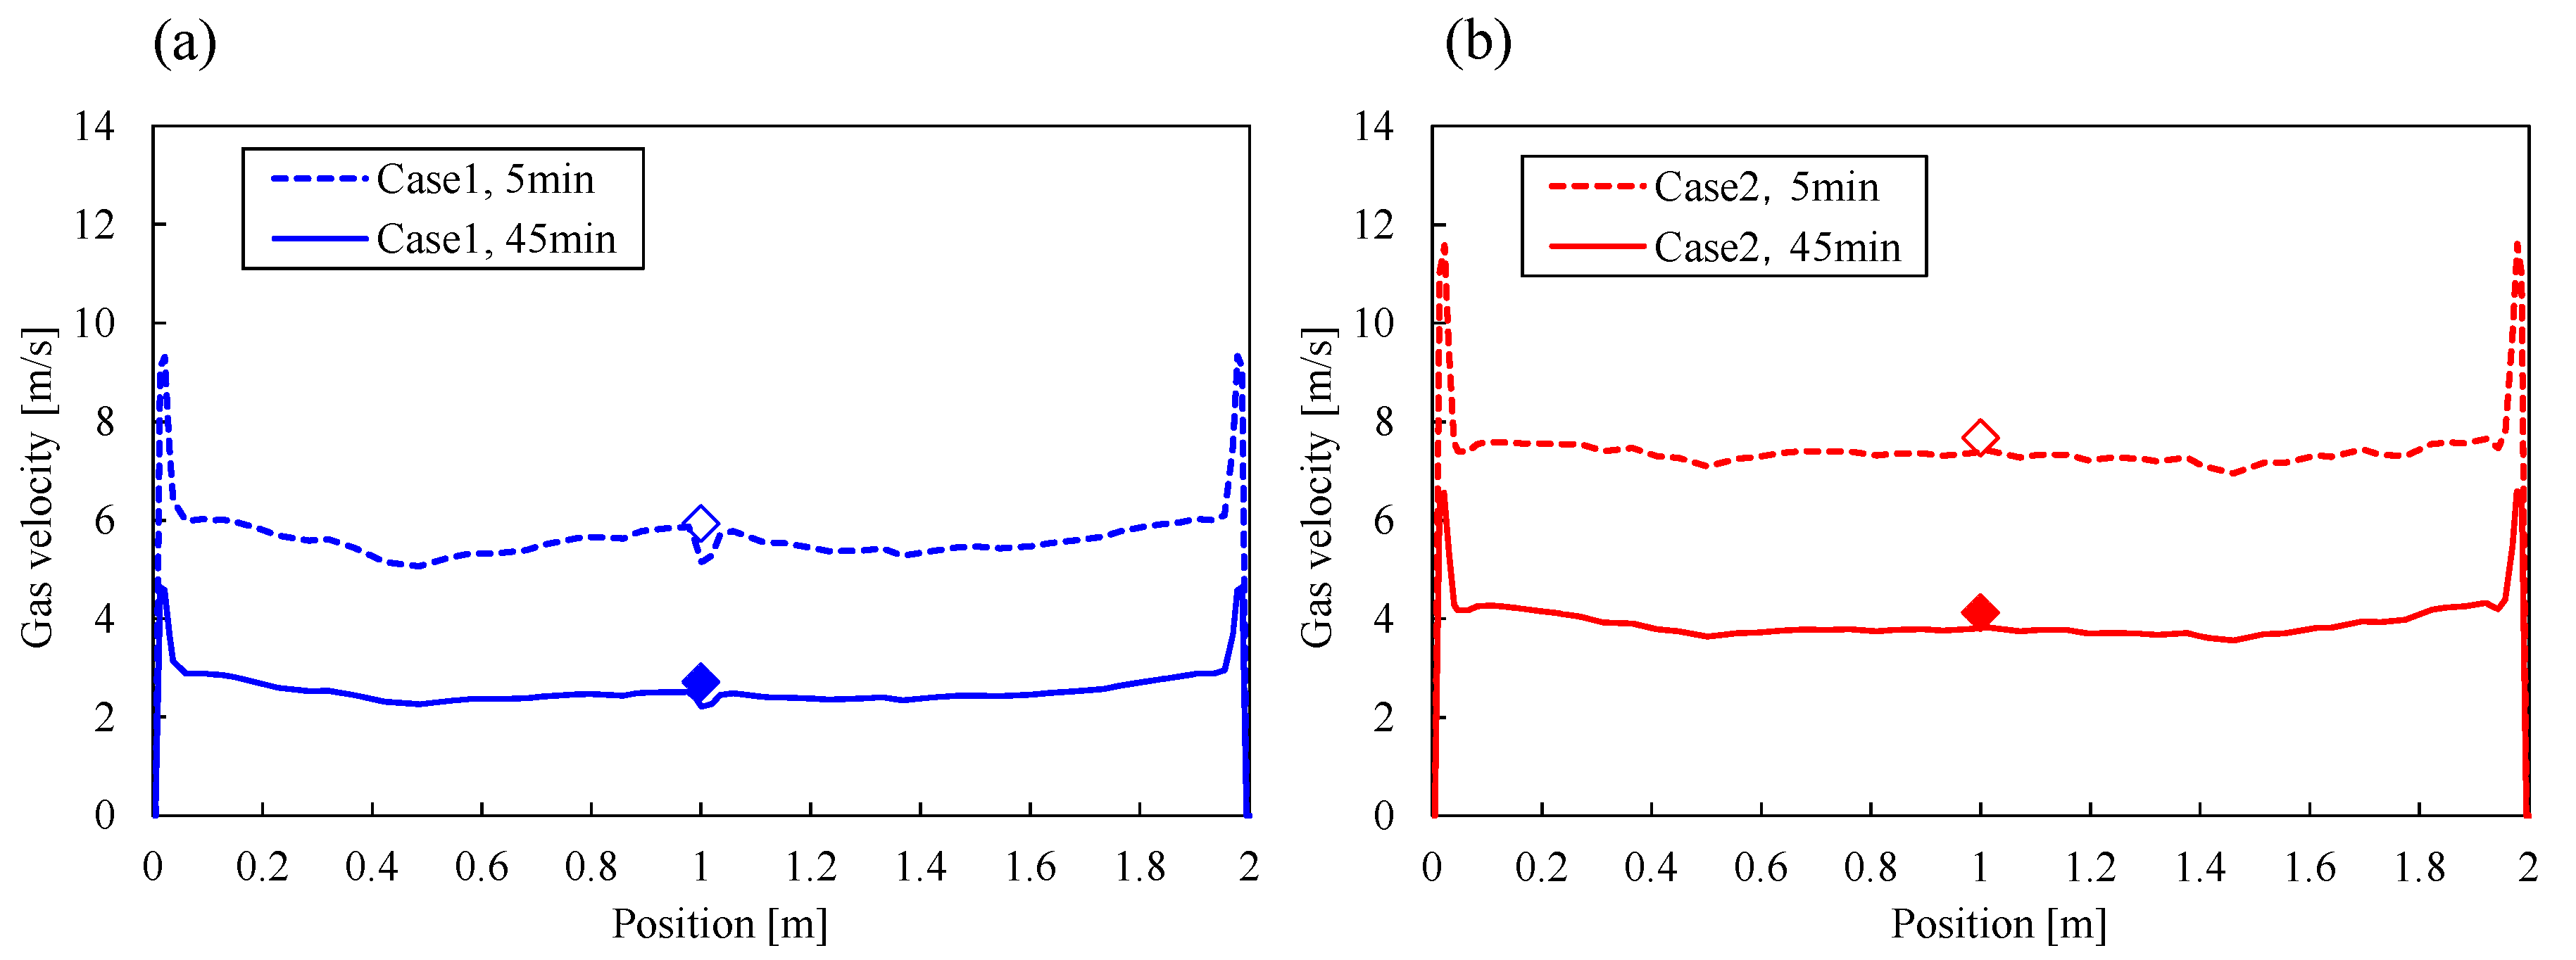
Figure 12 and Figure 13 show the results of the pilot-scale CFD simulations. For each calculation case, the gas temperature, the gas velocity, and the slag temperature are drawn individually by color contours at different output timings from 5 min to 45 min. The slag below the gas inlet holes are cooled rapidly by the effect of both the lower inlet gas temperature and its higher velocity at the local region around the gas inlet holes. The inlet gas diffuses radially into the other region of the slag packed bed along with the temperature increase by the heat recovery from slag and gradually goes up through the bed. The results of both the gas temperature and the slag temperature in the vicinity of the inner wall are relatively higher than those in the other region. These higher values are caused by the longer gas diffusion length from the blast pipe ends, which were centered in the bed, because the amount of heat recovered along the gas flowing path increased with the longer diffusion length. The gas velocity in Case 2 shows a smaller distribution in the width direction compared to that in the vertical direction. It is observed that the gradational change of gas velocity is more prominent into the height direction and is less into the width direction especially at the upper part of the slag packed bed, meaning that the blasted gas from two pipes becomes a regularly distributed gas flow after going up through the bed. The increase of gas velocity at the upper part of the chamber is the result of gas temperature increase rather than the effect of gas distribution. Figure 14 shows the calculated gas velocity distribution at the top of the slag packed bed in the long side width direction of the chamber cross section. The marks plotted at the center of the graph are the average values of the results. As in the laboratory-scale CFD simulation, the local gas velocity increase in the vicinity of the wall is observed in both graphs, and is due to the effect of the higher porosity of the near-wall region. The fluctuation of the gas velocity distribution in the other region is relatively small. The calculated gas velocity at the center of the chamber is almost equal to the average value, meaning that significant degradation of the uniformity of gas distribution by the wall effect does not occur in the pilot-scale chamber. This is the same as the results of the laboratory scale evaluations, and is achieved as a result of the higher D/d ratio against the chamber inner dimension D and the particle size d (L in this case). The intensity of the near-wall gas velocity increase changes with the heat recovery time. This is caused by the difference in the thermal expansion of the gas during heat recovery, which changes depending on the remaining slag heat. The near-wall gas velocity increase is especially noticeable in the high temperature state, although the effect on the gas velocity at the center of the bed is still limited at this chamber scale. By comparing the results of Case 1 and Case 2, the difference of slag packed bed height has little to do with the relative intensity of near-wall gas velocity against constant region. It is due to the local pressure increase caused by the strong edge-flow that has a counter-effect to restrain the propagation of excessively strong edge-flow and therefore mitigates the wall-effect on the overall flow balance inside the packed bed. It ensures the uniformity of the gas distribution also in case of scale-up chamber designing in height direction.
3.4. Comparison with Results of Pilot-Scale Test
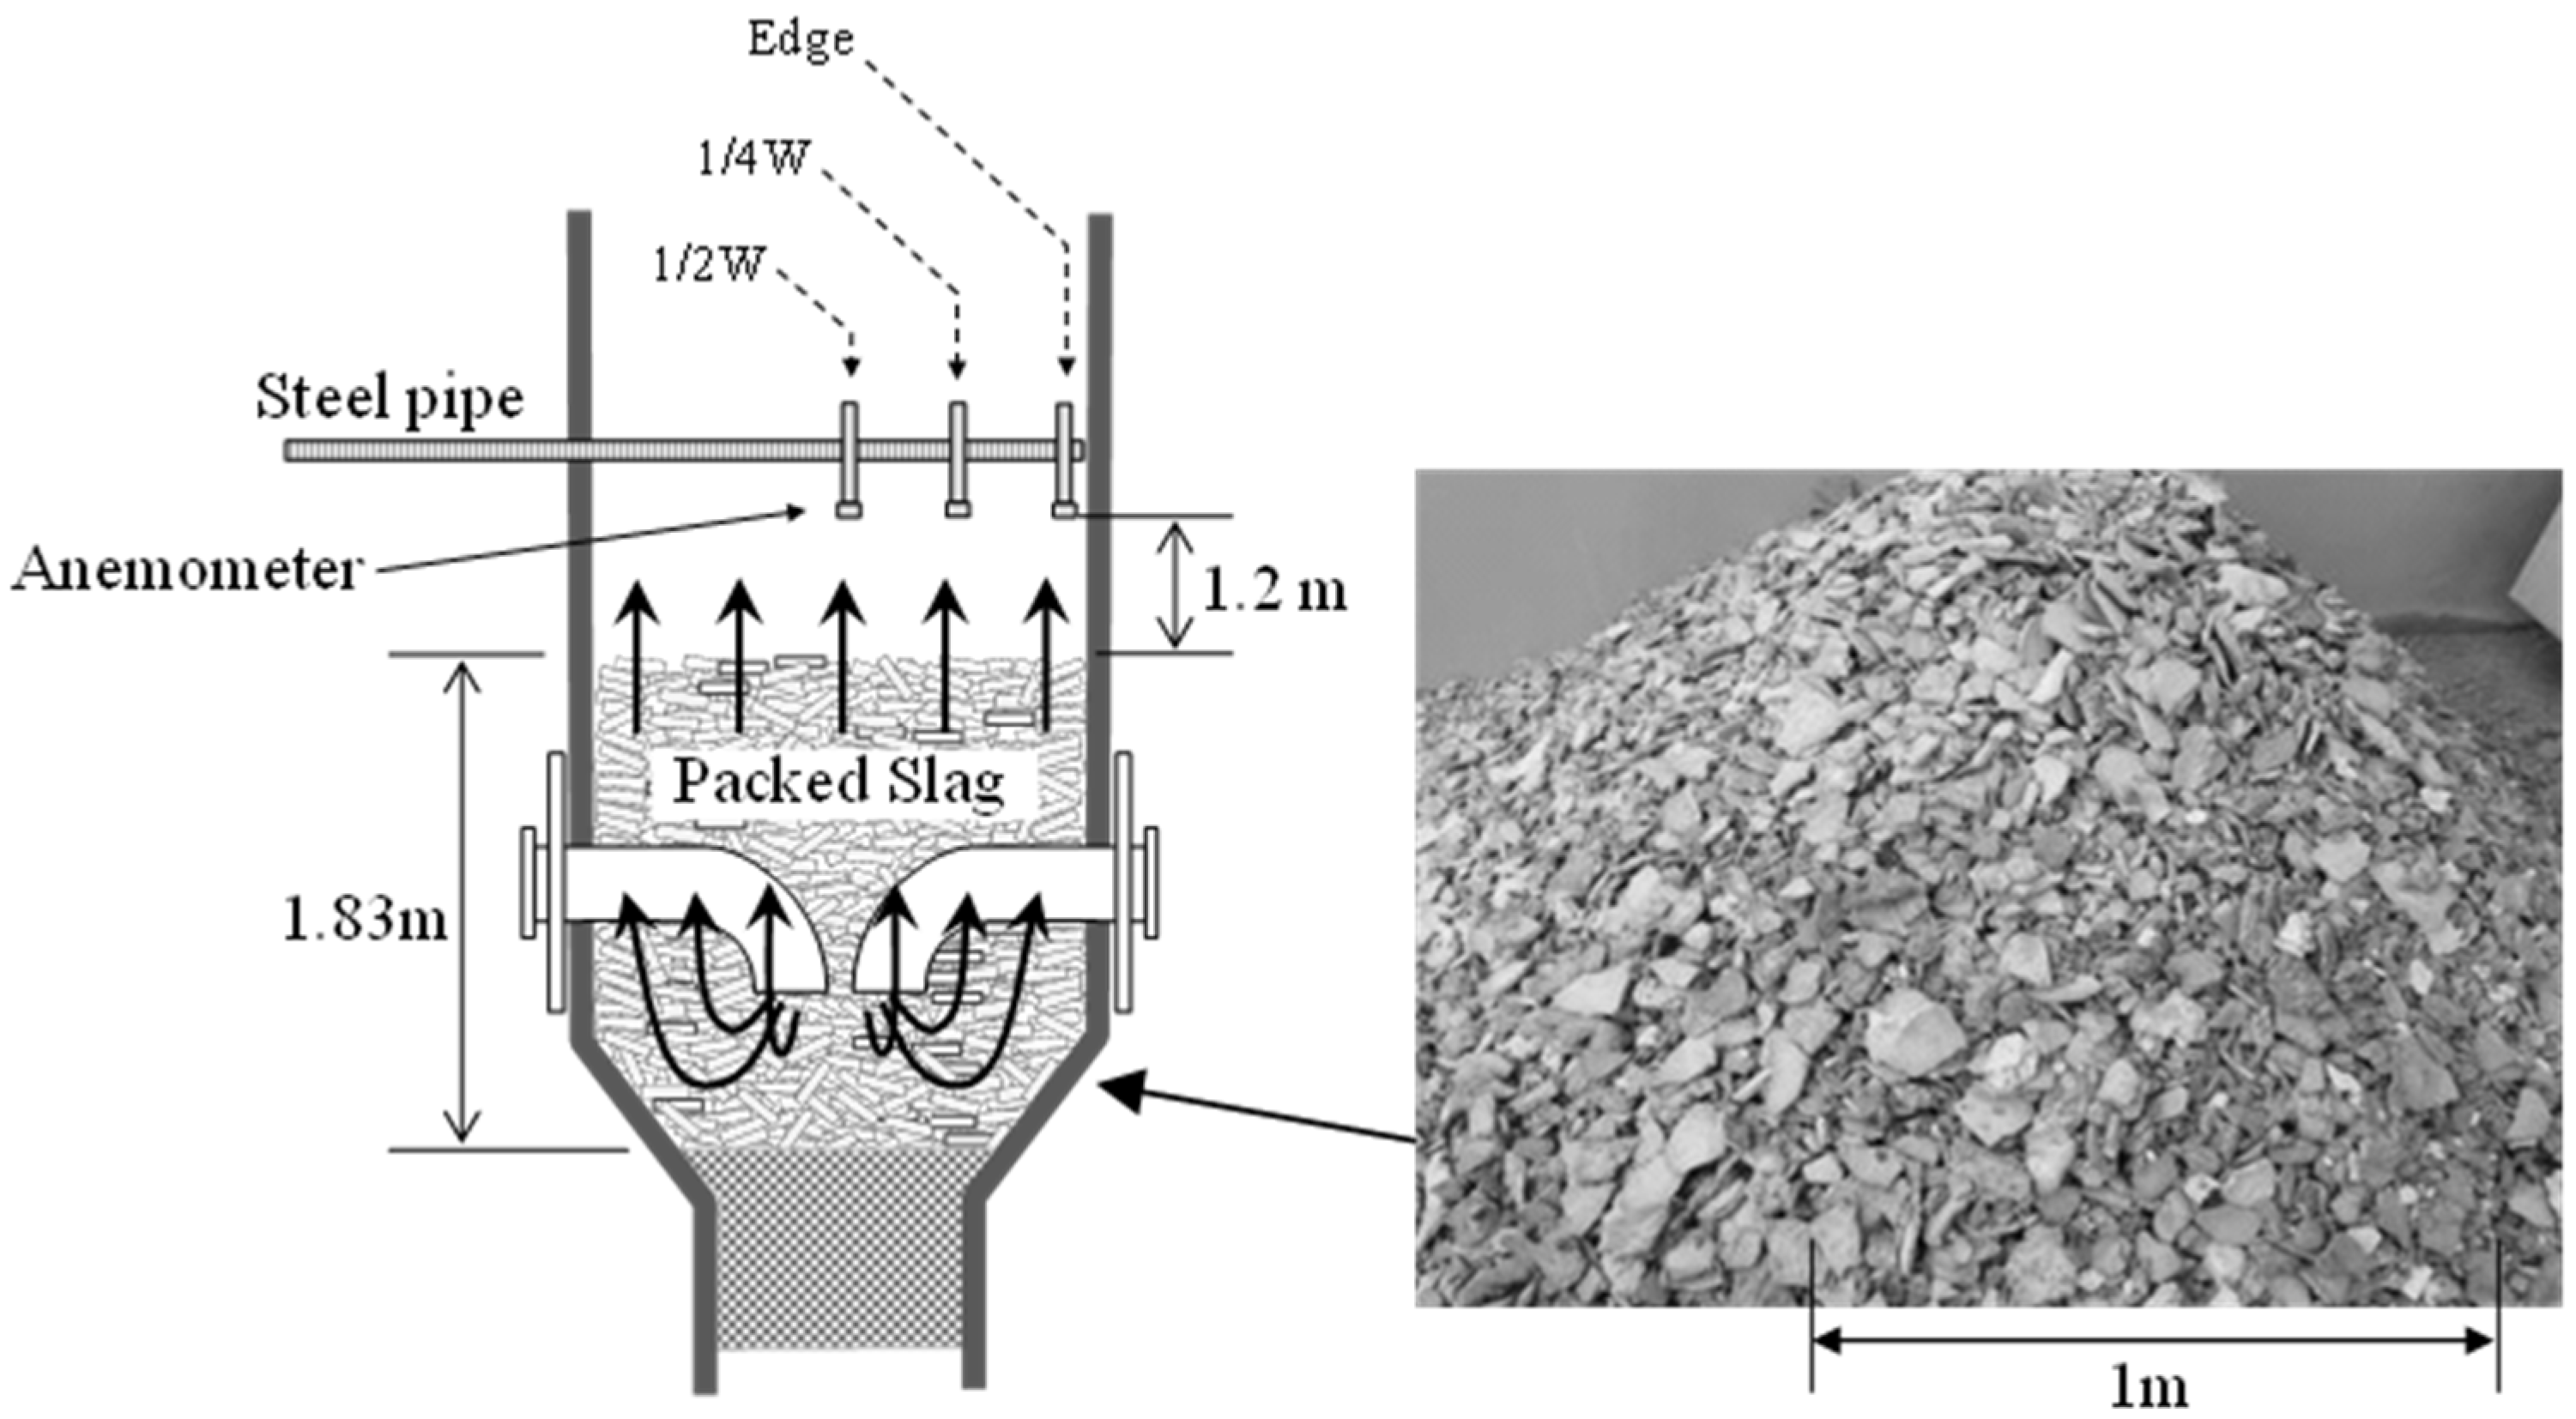
The gas velocity distribution above the slag packed bed was measured after finishing the heat recovery pilot test in the cold state. Figure 15 shows the measurement method in the pilot-scale chamber. The anemometer was suspended on a steel pipe and was placed in the hollow space of the chamber. The horizontal position of the anemometer probe was arranged to be Edge (50 mm from inner wall), 1/4 W or 1/2 W against the long side width of the chamber cross section W. The gap between the probe and the top level of the slag packed bed was about 1.2 m. After setting the anemometer, air was blown from the blast pipes to measure the gas velocity at the probe. In this measurement, the cable from the anemometer was led through the pipe hole to connect it to a laptop computer outside of the chamber.
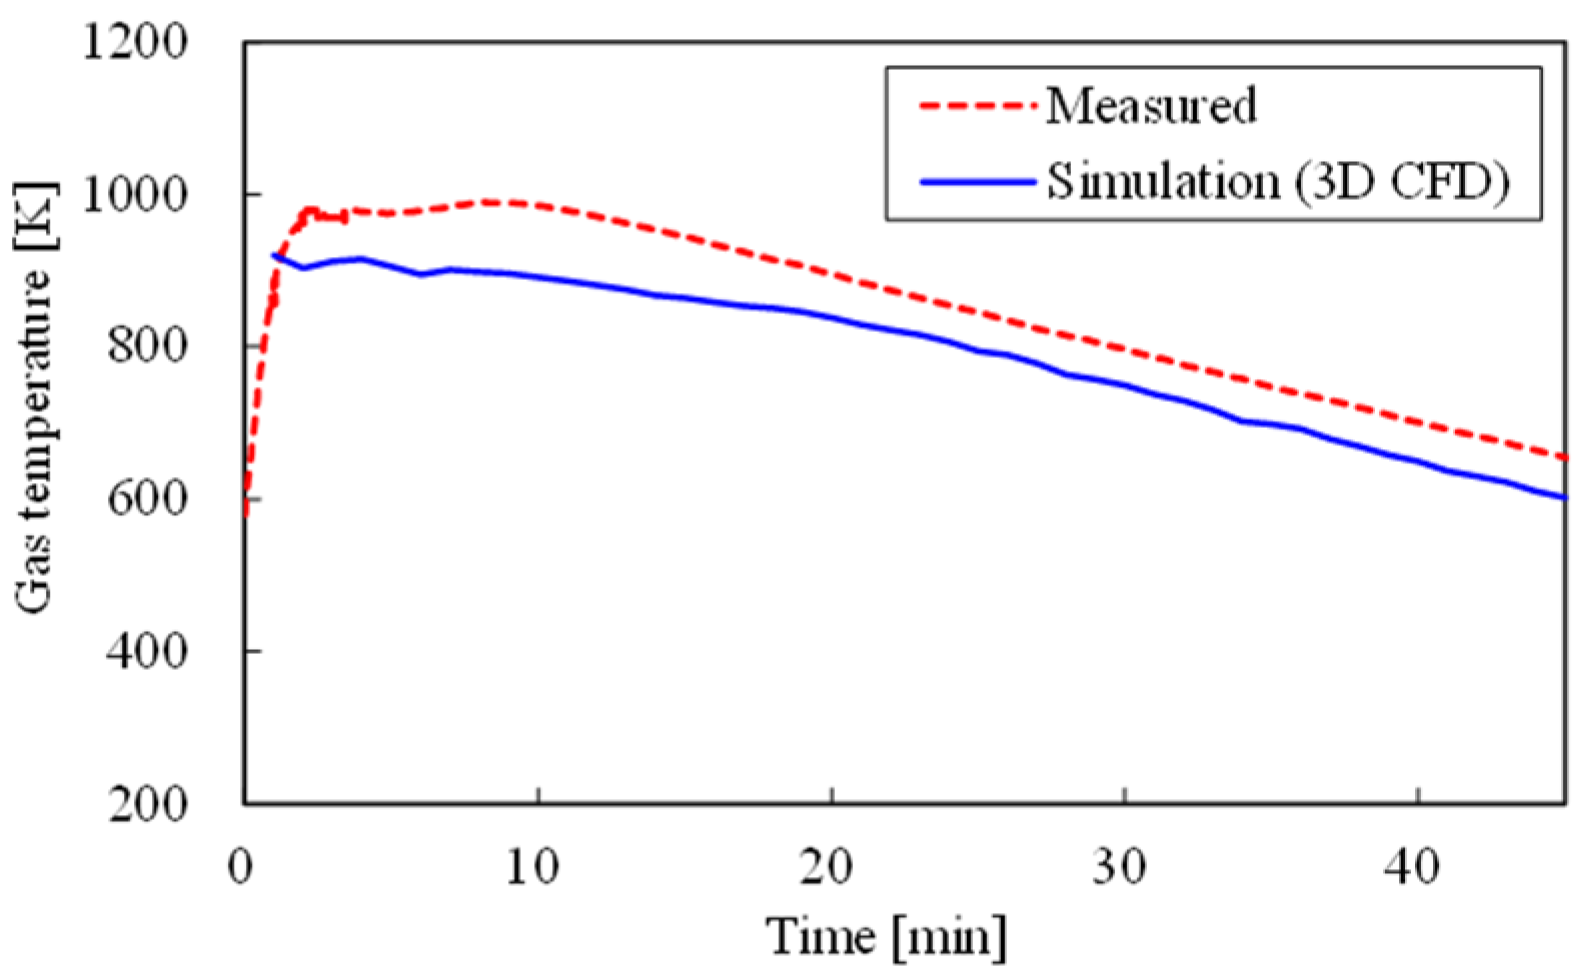
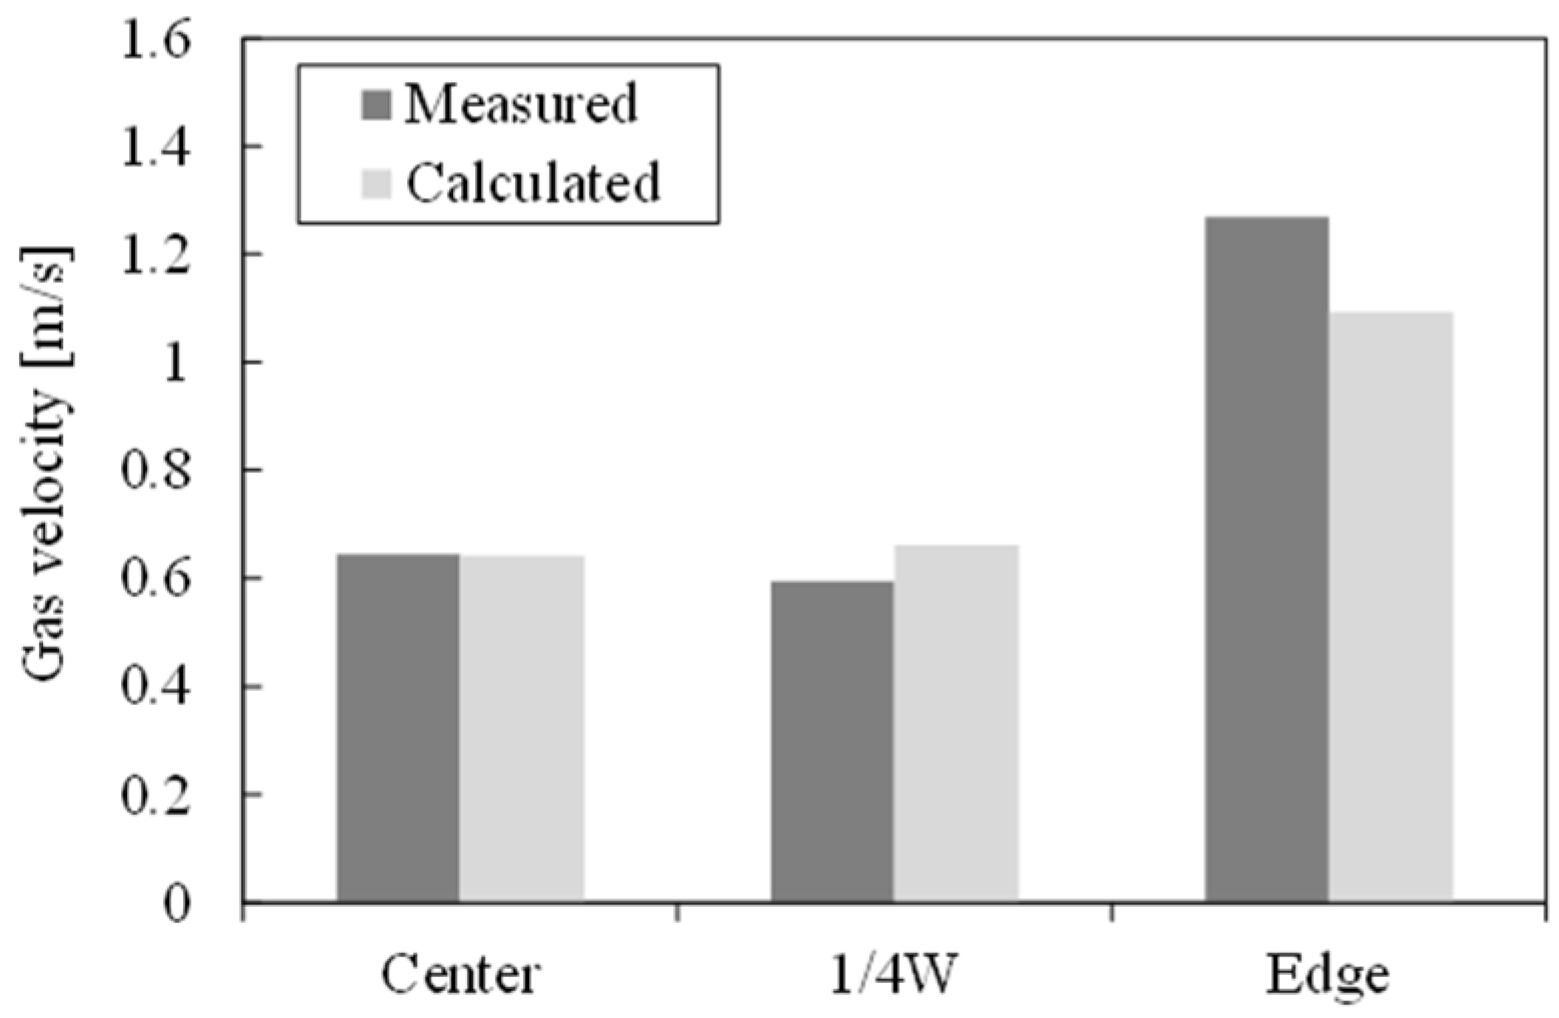
Figure 16 shows the measured gas velocity above the slag packed bed inside the chamber in comparison with the CFD simulation result in the cold state. Although the results include fewer point data because of the limited access to the inner space of the chamber, the measured gas velocity roughly agreed with the simulation results. The wall effect was observed with similar intensity even in case of the pilot-scale plant with actual plate-shaped slag. Figure 17 shows the gas temperature profile obtained by both the pilot test measurement and the CFD simulation for Case 1, which was conducted at the same scale. In the pilot test, the gas temperature after slag heat recovery was measured by a thermocouple suspended in the upper duct of the chamber, where the gas temperature distribution inside the duct was negligibly small. A similar curve shape of the gas temperature profile was obtained by CFD simulation, although a small difference was observed from the actual gas temperature profile measured in the pilot test. From the nearly-parallel displacement of these two graphs, it is estimated that the difference was caused by the difference in the initial slag temperatures in the actual pilot test and the CFD simulation. However, the similarity of these graphs confirms that the process time of the actual slag heat recovery plant can be estimated by using this CFD simulation model. The gas temperature profile of actual plant operation would be affected by some operational conditions like the particle size distribution and the slag inlet temperature. But, when considering the possibility of the installation of buffering process in actual plant, the slag heat recovery plant is expected to be operational in case the declining curve shape of the recovered gas temperature is estimated with this accuracy.
4. Conclusions
The uniformity of the gas distribution inside a packed bed of plate-shaped slag and its effect on the slag heat recovery process were discussed in this work. As a basic study, the gas velocity distribution above a packed bed of plate-shaped samples was measured at the laboratory scale by circumferential scanning of a hot-wire anemometer. As the result, an increase in the local gas velocity in the vicinity of the inner wall was observed. This result was similar to that obtained with other packed materials having various shapes. A simple CFD model was then created to estimate the gas flow distribution inside and outside the bed, and the validity of the model was confirmed by comparing the simulation results with the experimental results. Based on these results, a pilot-scale slag heat recovery test was conducted to evaluate the gas velocity distribution in the pilot-scale chamber. The local gas velocity increase caused by the wall effect was also observed in the pilot-scale chamber. The intensity of the velocity increase due to the wall effect was similar to that estimated by the pilot-scale CFD simulation. The influence of the wall effect on the uniformity of the gas distribution was limited owing to the larger chamber-to-particle size ratio D/d. Although the degree of the gas velocity increase near the wall changed with heat recovery time, the effect on the radial gas velocity distribution was still limited. In the scale-up simulation case with higher slag packed bed height, the height difference had little to do with the intensity of near-wall gas velocity.
In the actual design of the slag heat recovery plant, the region where the packed slag contacts to the wall depends on the structure of the selected plant. A continuous type heat recovery plant like a rotating sinter cooler, for example, could minimize the contact area because it has only sidewalls of two opposite edge side, though it requires larger space for plant installation. The vertical tower type like our slag heat recovery pilot plant is easier to construct, but an unlimited increase the height of the chamber is not feasible due to the enlarged pressure loss inside the packed bed. Additionally, the shape of slag is also important to reduce the wall-effect because the region of influence is obviously defined by both the size and the packing condition of the slag particles. Crushing the slag to small pieces could possibly become one of the effective method to reduce the wall-effect, but it sometimes causes significant increase of pressure loss inside the slag packed bed. On the other hand, the total heat recovery surface area increases in case of fine crushing, which is effective to recover high temperature gas. In this article, the shape of both the slag particles and the slag chamber were fixed for the simplicity of discussion. But there are many options by customizing the spec of the hot crusher and the chamber shape. The further investigation is desired to maximize the total performance of slag heat recovery plants with careful consideration of the regularity of the gas flow distribution inside the slag chamber.
Nomenclature
| ds | Equivalent spherical volume diameter |
| dp | Equivalent particle diameter |
| ρ | Density |
| m | Mass |
| S | Surface area |
| V | Volume |
| φ | Sphericity |
| p | Pressure |
| t | Time |
| v | Gas velocity |
| τ | Shear stress |
| ε | Local porosity |
| ε0 | Bulk porosity |
| d | Particle size |
| R0 | Radius of the bed |
| r | Radial position |
| A | Constant |
| Nu | Nusselt number |
| Pr | Prandtl number |
| Re | Reynolds number |
| λ | Thermal conductivity of the fluid |
| α | Heat transfer coefficient on the surface of the particle |
| h | Heat transfer coefficient in the bed |
| β | Correction factor |
| L | Long side length of a slag particle |
| Δp | Pressure drop in the bed |
| μ | Dynamic viscosity of the fluid |
Subscripts
| a | Apparent |
| f | Fluid |
| p | Particle |
| x | Local value at x |
| m | Mean |
| L | Integrated within the range from x = 0 to x = L |
| s | Superficial |
Acknowledgments
This research was supported as a part of the project of New Energy and Industrial Technology Development Organization (NEDO) in Japan, “Environmentally Harmonized Steelmaking Process Technology Development (COURSE50) Step 2.”
Author Contributions
Nobuyuki Shigaki conducted all the experiments and simulations and wrote this article; Sumito Ozawa supported the operation of slag heat recovery pilot plant and data analysis; Ikuhiro Sumi supervised the entire project and approved this article.
Conflicts of Interest
The authors declare no conflict of interest.
References
- Miwa, T.; Okuda, H. CO2 ultimate reduction in steelmaking process by innovative technology for cool Earth 50 (COURSE50). J. Jpn. Inst. Energy 2010, 89, 28–35. [Google Scholar]
- Tonomura, S. Outline of course 50. Energy Procedia 2013, 37, 7160–7167. [Google Scholar] [CrossRef]
- Ujisawa, Y.; Tonomura, S.; Ishiwata, N.; Nabeshima, Y.; Saito, K. CO2 breakthrough program by COURSE50 in Japanese steel industry sector. In Energy Technology Roadmaps of Japan: Future Energy Systems Based on Feasible Technologies Beyond 2030; Springer: Berlin, Germany, 2016; pp. 431–439. [Google Scholar]
- Hayashi, M.; Mimura, T. Steel industries in Japan achieve most efficient energy cut-off chemical absorption process for carbon dioxide capture from blast furnace gas. Energy Procedia 2013, 37, 7134–7138. [Google Scholar] [CrossRef]
- Tobo, H.; Shigaki, N.; Hagio, Y. Development of heat recovery system from steelmaking slag. JFE Tech. Rep. 2014, 19, 126–132. [Google Scholar]
- Tobo, H.; Ta, Y.; Kuwayama, M.; Hagio, Y.; Yabuta, K.; Tozawa, H.; Tanaka, T.; Morita, K.; Matsuura, H.; Tsukihashi, F. Development of continuous steelmaking slag solidification process suitable for sensible heat recovery. ISIJ Int. 2015, 55, 894–903. [Google Scholar] [CrossRef]
- Shigaki, N.; Tobo, H.; Ozawa, S.; Ta, Y.; Hagiwara, K. Heat recovery process from packed bed of hot slag plates. ISIJ Int. 2015, 55, 2258–2265. [Google Scholar] [CrossRef]
- Nijemeisland, M.; Dixon, A.G. Comparison of CFD simulations to experiment for convective heat transfer in a gas-solid fixed bed. Chem. Eng. J. 2001, 82, 231–246. [Google Scholar] [CrossRef]
- Logtenberg, S.A.; Nijemeisland, M.; Dixon, A.G. Computational fluid dynamics simulations of fluid flow and heat transfer at the wall-particle contact points in a fixed-bed reactor. Chem. Eng. Sci. 1999, 54, 2433–2439. [Google Scholar] [CrossRef]
- Kwapinski, W. Combined wall and thermal effects during non-isothermal packed bed adsorption. Chem. Eng. J. 2009, 152, 271–276. [Google Scholar] [CrossRef]
- Singhal, A.; Cloete, S.; Radl, S.; Quinta-Ferreira, R.; Amini, S. Heat transfer to a gas from densely packed beds of monodisperse spherical particles. Chem. Eng. J. 2017, 314, 27–37. [Google Scholar] [CrossRef]
- De Beer, M.; Du Toit, C.G.; Rousseau, P.G. A methodology to investigate the contribution of conduction and radiation heat transfer to the effective thermal conductivity of packed graphite pebble beds, including the wall effect. Nucl. Eng. Des. 2017, 314, 67–81. [Google Scholar] [CrossRef]
- Yang, J.; Wu, J.; Zhou, L.; Wang, Q. Computational study of fluid flow and heat transfer in composite packed beds of spheres with low tube to particle diameter ratio. Nucl. Eng. Des. 2016, 300, 85–96. [Google Scholar] [CrossRef]
- Rebughini, S.; Cuoci, A.; Maestri, M. Hierarchical analysis of the gas-to-particle heat and mass transfer in micro packed bed reactors. Chem. Eng. J. 2016, 289, 471–478. [Google Scholar] [CrossRef]
- Das, S.; Deen, N.G.; Kuipers, J.A.M. A DNS study of flow and heat transfer through slender fixed-bed reactors randomly packed with spherical particles. Chem. Eng. Sci. 2017, 160, 1–19. [Google Scholar] [CrossRef]
- Natsui, S.; Takai, H.; Nashimoto, R.; Kikuchi, T.; Suzuki, R.O. Model study of the effect of particles structure on the heat and mass transfer through the packed bed in ironmaking blast furnace. Int. J. Heat Mass Transf. 2015, 91, 1176–1186. [Google Scholar] [CrossRef]
- Liu, Y.; Wang, J.; Cheng, Z.; Yang, J.; Wang, Q. Experimental investigation of fluid flow and heat transfer in a randomly packed bed of sinter particles. Int. J. Heat Mass Transf. 2016, 99, 589–598. [Google Scholar] [CrossRef]
- Tian, F.Y.; Huang, L.F.; Fan, L.W.; Qian, H.L.; Yu, Z.T. Wall effects on the pressure drop in packed beds of irregularly shaped sintered ore particles. Powder Technol. 2016, 301, 1284–1293. [Google Scholar] [CrossRef]
- Rong, L.W.; Zhou, Z.Y.; Yu, A.B. Lattice–Boltzmann simulation of fluid flow through packed beds of uniform ellipsoids. Powder Technol. 2015, 285, 146–156. [Google Scholar] [CrossRef]
- Marek, M. Numerical simulation of a gas flow in a real geometry of random packed bed of Raschig rings. Chem. Eng. Sci. 2017, 161, 382–393. [Google Scholar] [CrossRef]
- Montillet, A.; Coq, L.L. Characteristics of fixed beds packed with anisotropic particles—Use of image analysis. Powder Technol. 2001, 121, 138–148. [Google Scholar] [CrossRef]
- Hamel, S.; Krumm, W. Near-wall porosity characteristics of fixed beds packed with wood chips. Powder Technol. 2008, 188, 55–63. [Google Scholar] [CrossRef]
- Raichura, R.C. Pressure drop and heat transfer in packed beds with small tube-to-particle diameter ratio. Exp. Heat Transf. 1999, 12, 309–327. [Google Scholar] [CrossRef]
- Van Doormaal, J.P.; Raithby, G.D. Enhancements of the SIMPLE method for predicting incompressible fluid flows. Numer. Heat Transf. 1984, 7, 147–163. [Google Scholar] [CrossRef]
- Achenbach, E. Heat and flow characteristics of packed beds. Exp. Ther. Fluid Sci. 1995, 10, 17–27. [Google Scholar] [CrossRef]
- Benenati, R.F.; Brosilow, C.B. Void fraction distribution in beds of spheres. AIChE J. 1962, 8, 359–361. [Google Scholar] [CrossRef]
- Vortmeyer, D.; Schuster, J. Evaluation of steady flow profiles in rectangular and circular packed beds by a variational method. Chem. Eng. Sci. 1983, 38, 1691–1699. [Google Scholar] [CrossRef]
- Tobis, J.; Vortmeyer, D. The near-wall channelling effect on isothermal constant-pattern adsorption. Chem. Eng. Sci. 1988, 43, 1363–1369. [Google Scholar] [CrossRef]
- Johnson, H.A.; Rubesin, M.W. Aerodynamic Heating and Convective Heat Transfer - Summary of Literature Survey. Trans. ASME 1949, 71, 447. [Google Scholar]
Figure 1.
Process drawing of COURSE50 Slag heat recovery system.

Figure 2.
Plate-shaped slag produced by pilot plant.
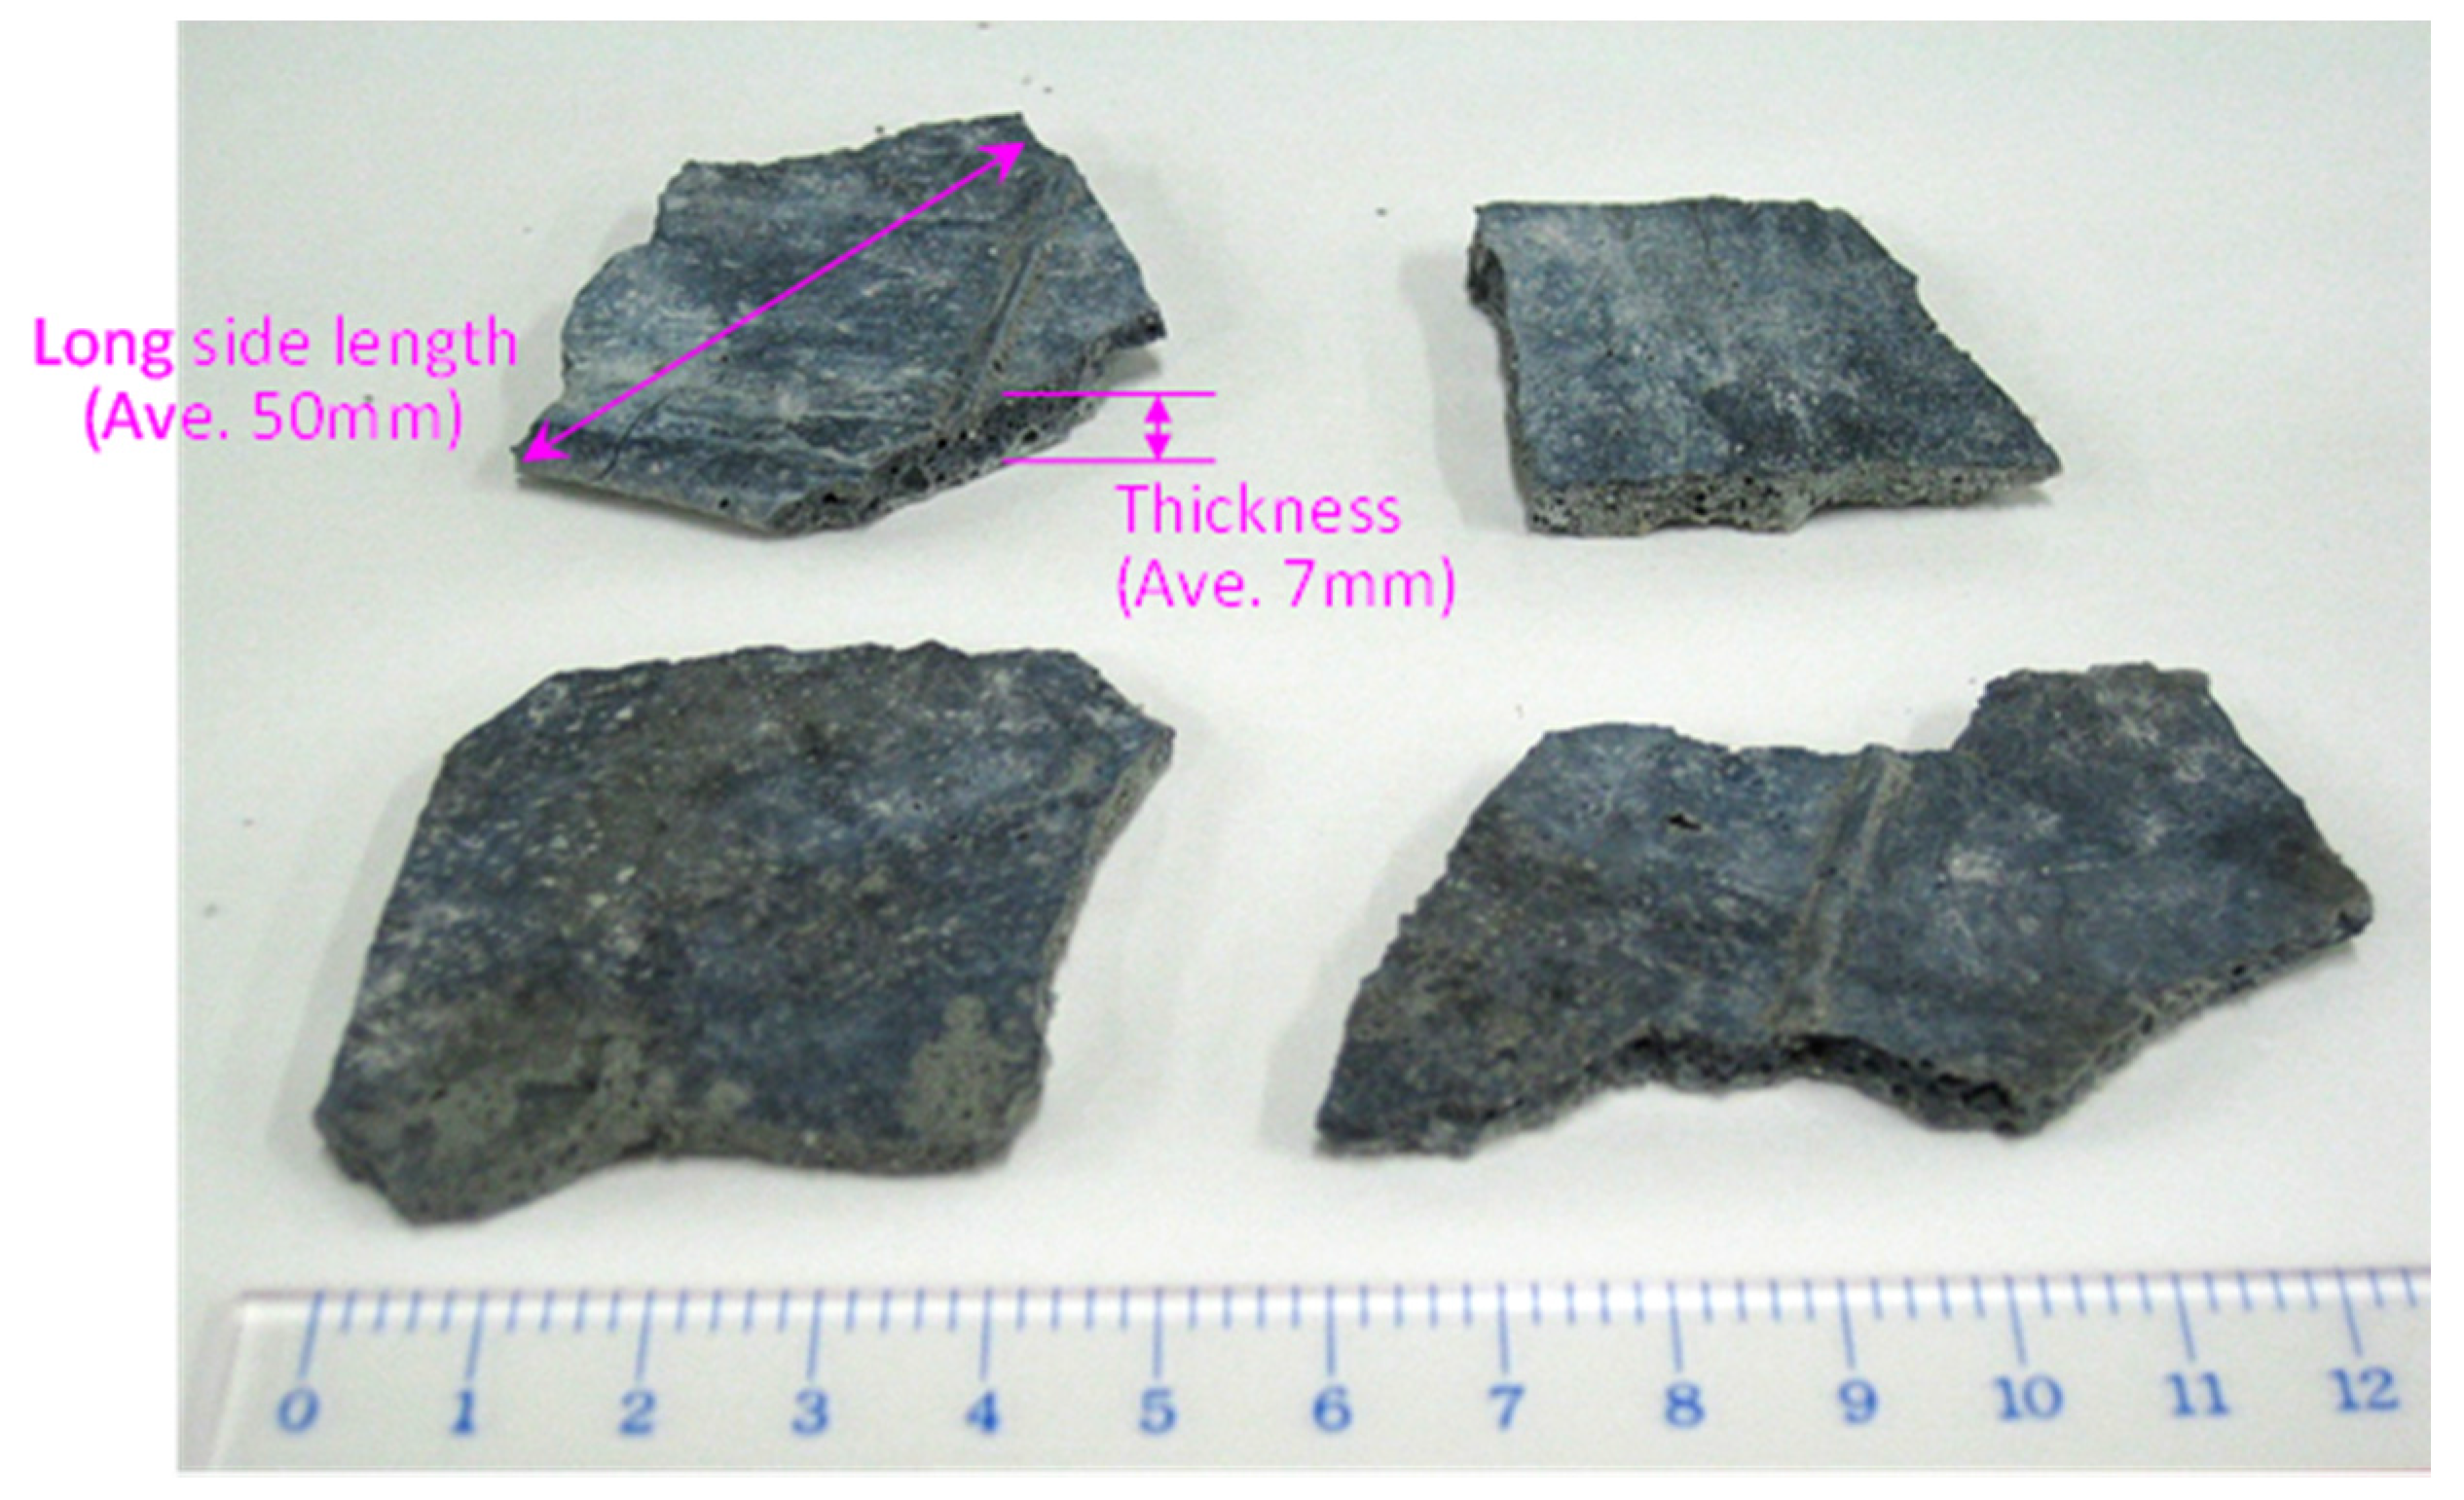
Figure 3.
Experimental apparatus for measurement of gas velocity distribution above packed bed of plate-shaped samples: (a) schematic drawings of experimental setup; (b) photo of experimental apparatus and (c) top view of packed samples.
Figure 3.
Experimental apparatus for measurement of gas velocity distribution above packed bed of plate-shaped samples: (a) schematic drawings of experimental setup; (b) photo of experimental apparatus and (c) top view of packed samples.
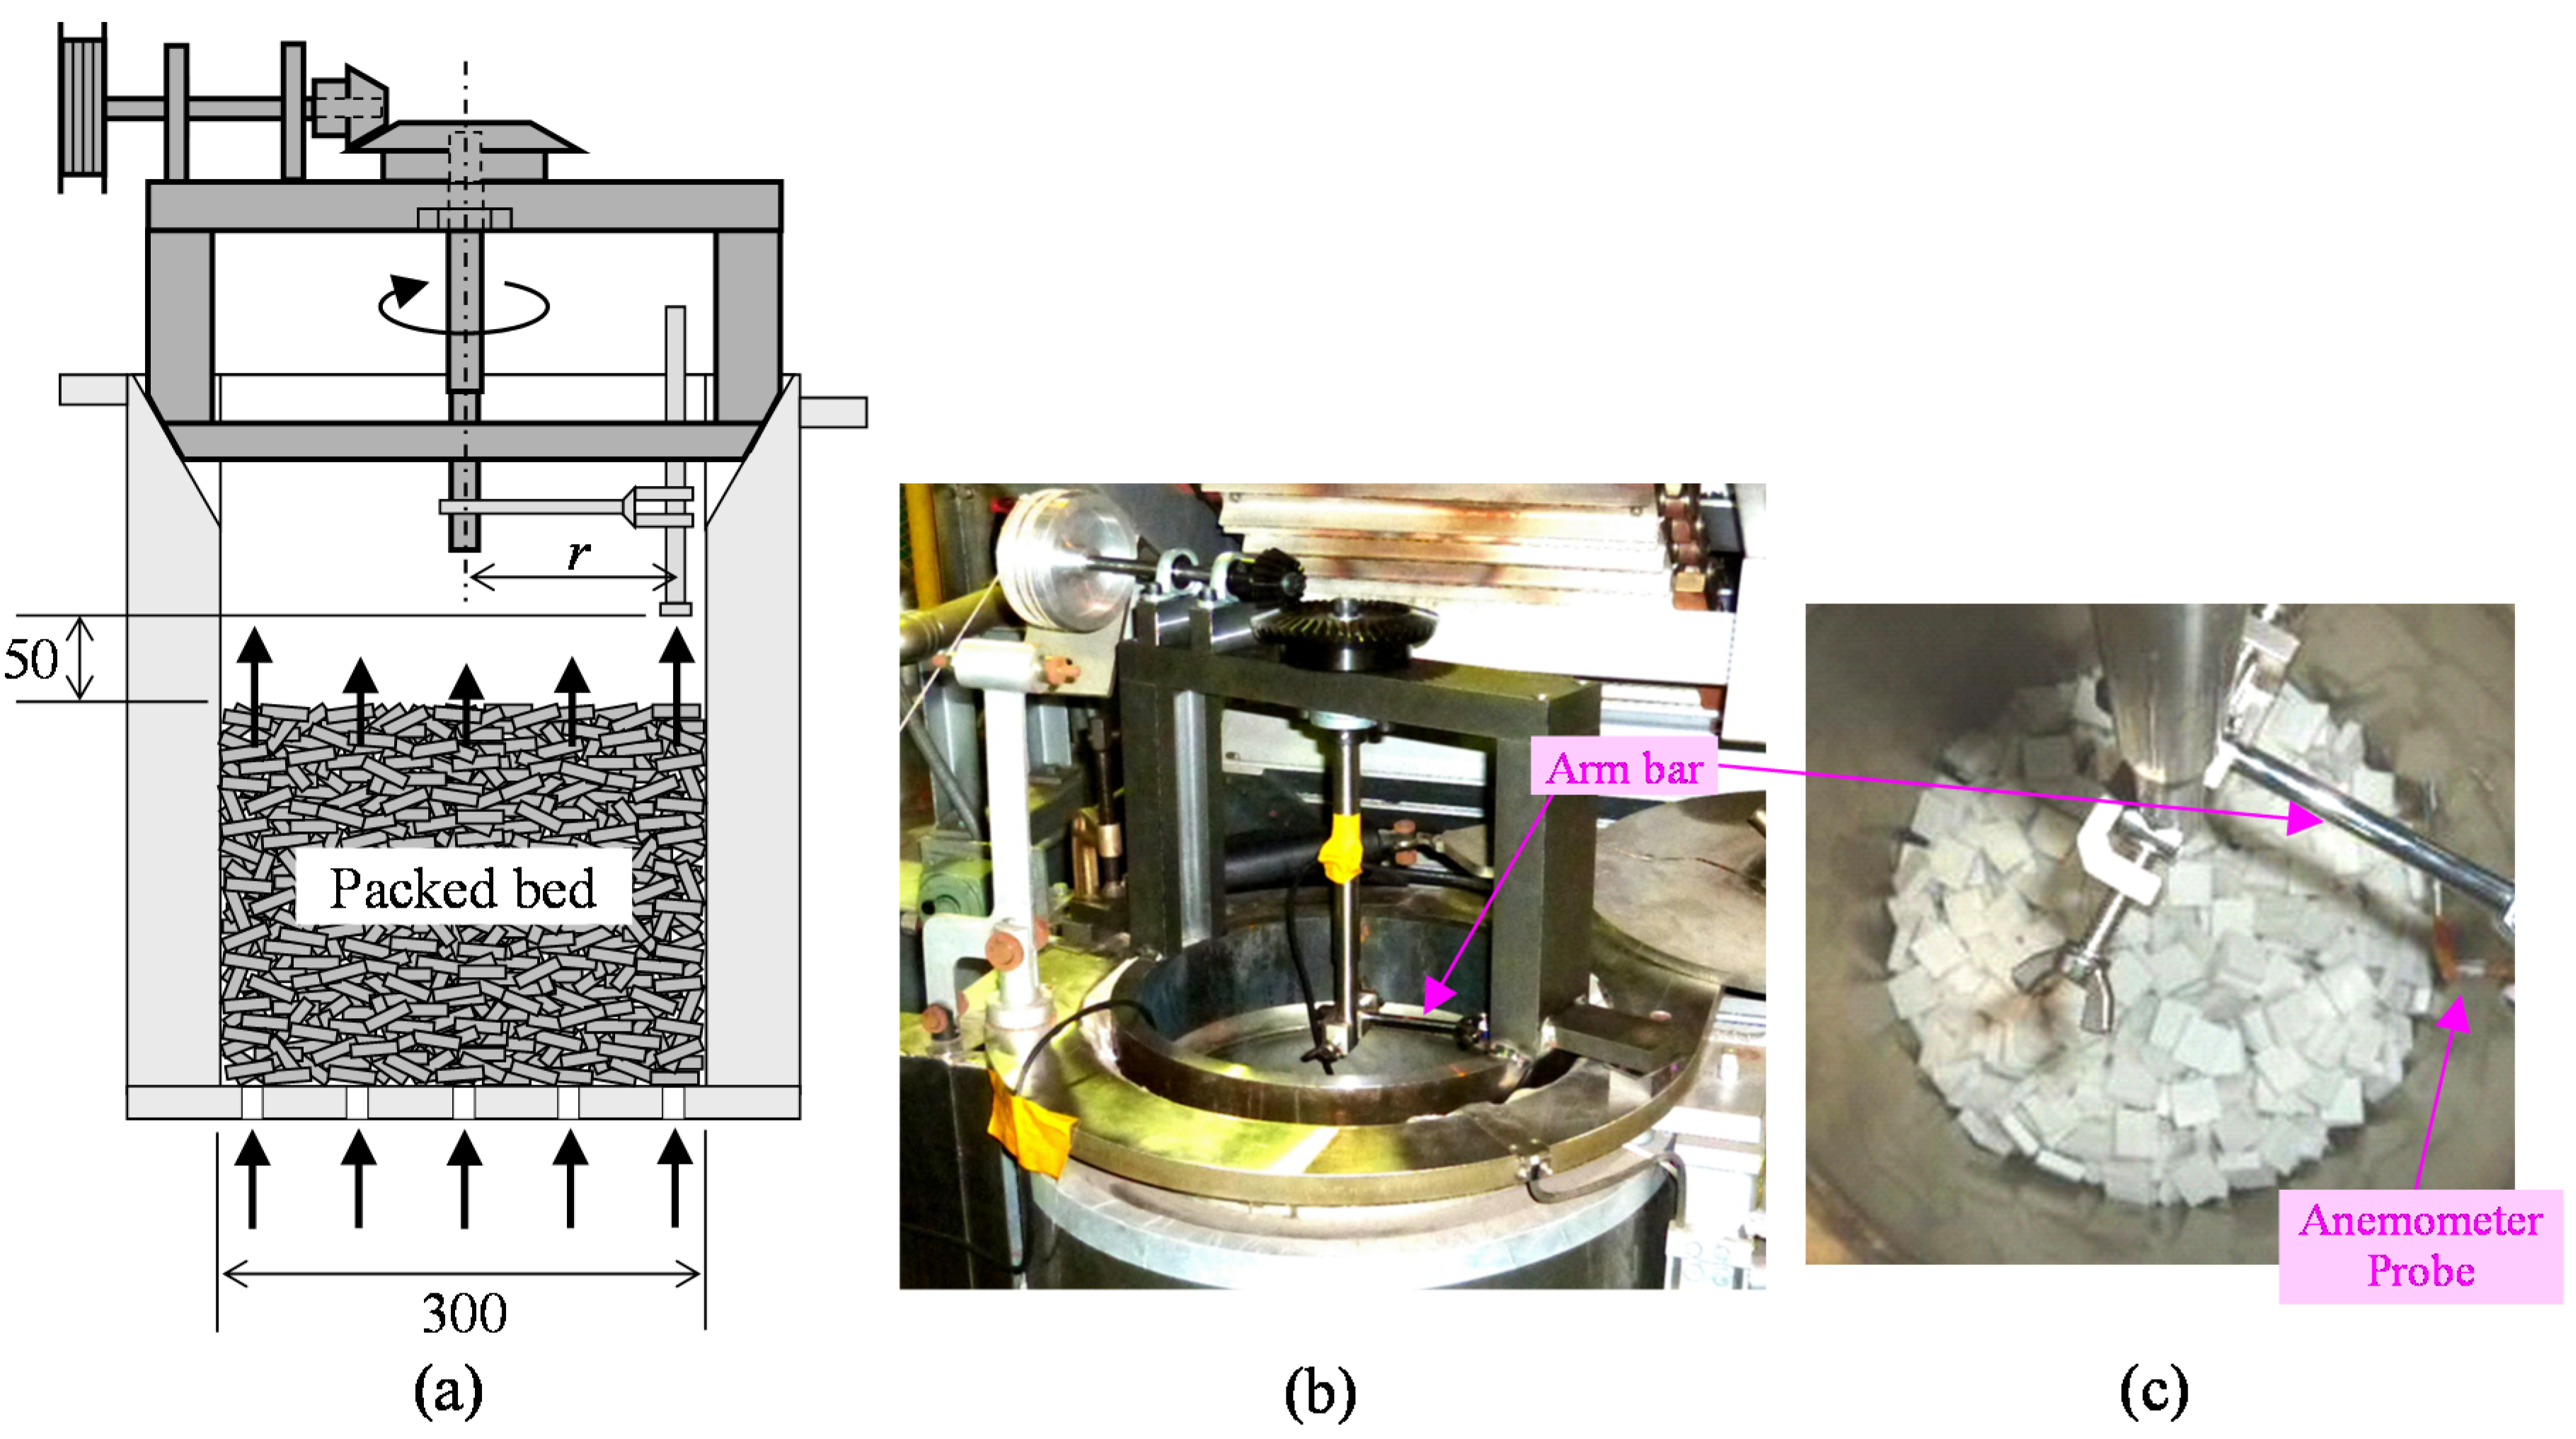
Figure 4.
Circumferential gas velocity distribution measured by experimental apparatus: (a) r = 30 mm, 50 mm; (b) r = 70 mm, 100 mm and (c) r = 120 mm, 140 mm.
Figure 4.
Circumferential gas velocity distribution measured by experimental apparatus: (a) r = 30 mm, 50 mm; (b) r = 70 mm, 100 mm and (c) r = 120 mm, 140 mm.

Figure 5.
Radial gas velocity distribution obtained by experimental measurements.
Figure 6.
Laboratory-scale CFD simulation model to calculate gas velocity distribution inside and outside chamber: (a) schematic image of packing condition around inner wall of chamber; and (b) schematic drawing of modeled region.
Figure 6.
Laboratory-scale CFD simulation model to calculate gas velocity distribution inside and outside chamber: (a) schematic image of packing condition around inner wall of chamber; and (b) schematic drawing of modeled region.
Figure 7.
Calculated radial porosity distribution with different A values.
Figure 8.
Results of laboratory-scale CFD simulation: (a) color contours of gas velocity distribution; and (b) radial gas velocity distribution obtained by experimental measurements and CFD simulation.
Figure 8.
Results of laboratory-scale CFD simulation: (a) color contours of gas velocity distribution; and (b) radial gas velocity distribution obtained by experimental measurements and CFD simulation.
Figure 9.
Exterior of pilot plants: (a) Twin-roll plant, (b) Slag heat recovery plant.
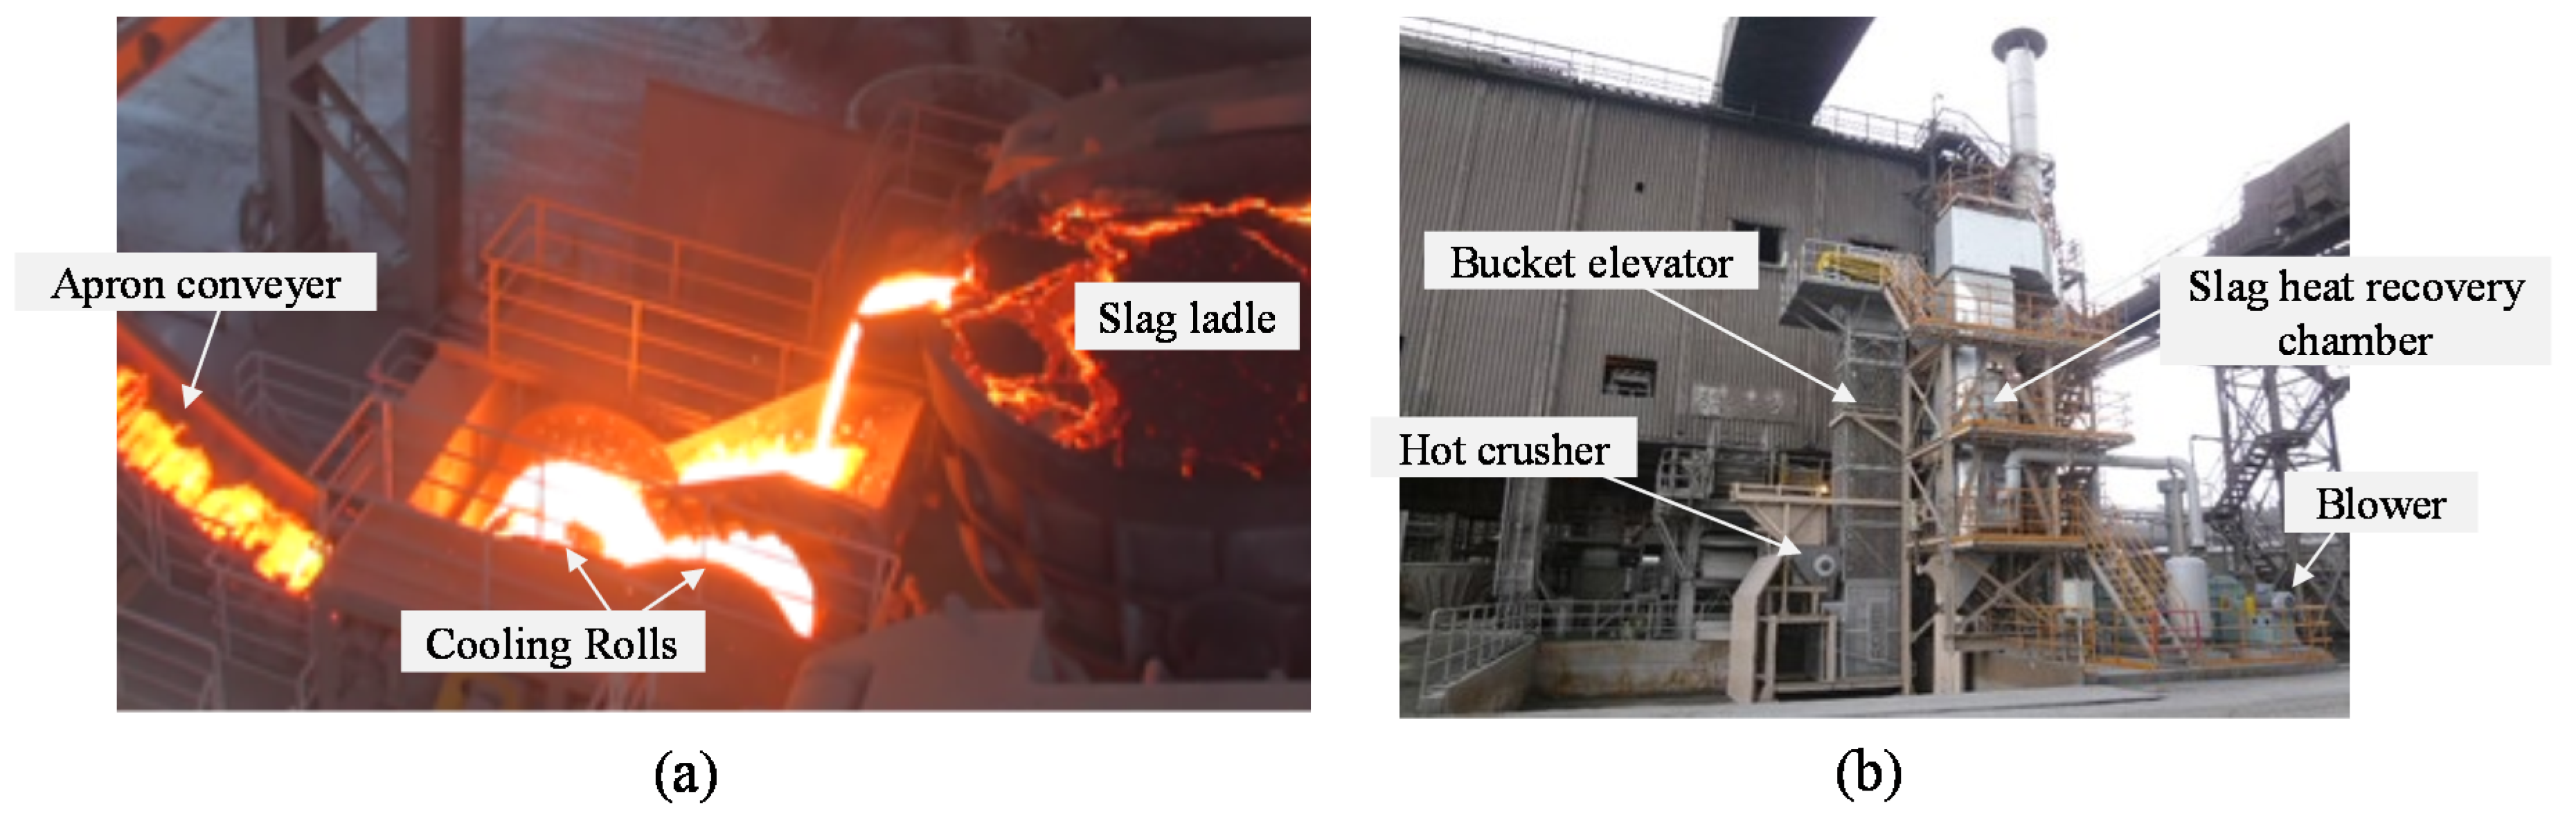
Figure 10.
Vertical and horizontal cross sections of pilot-scale slag heat recovery chamber.
Figure 11.
Level of slag packed bed in two cases of CFD simulations.

Figure 12.
Result of Case 1 simulation: (a) gas temperature; (b) slag temperature and (c) gas velocity.
Figure 12.
Result of Case 1 simulation: (a) gas temperature; (b) slag temperature and (c) gas velocity.

Figure 13.
Result of Case 2 simulation: (a) gas temperature; (b) slag temperature and (c) gas velocity.
Figure 13.
Result of Case 2 simulation: (a) gas temperature; (b) slag temperature and (c) gas velocity.
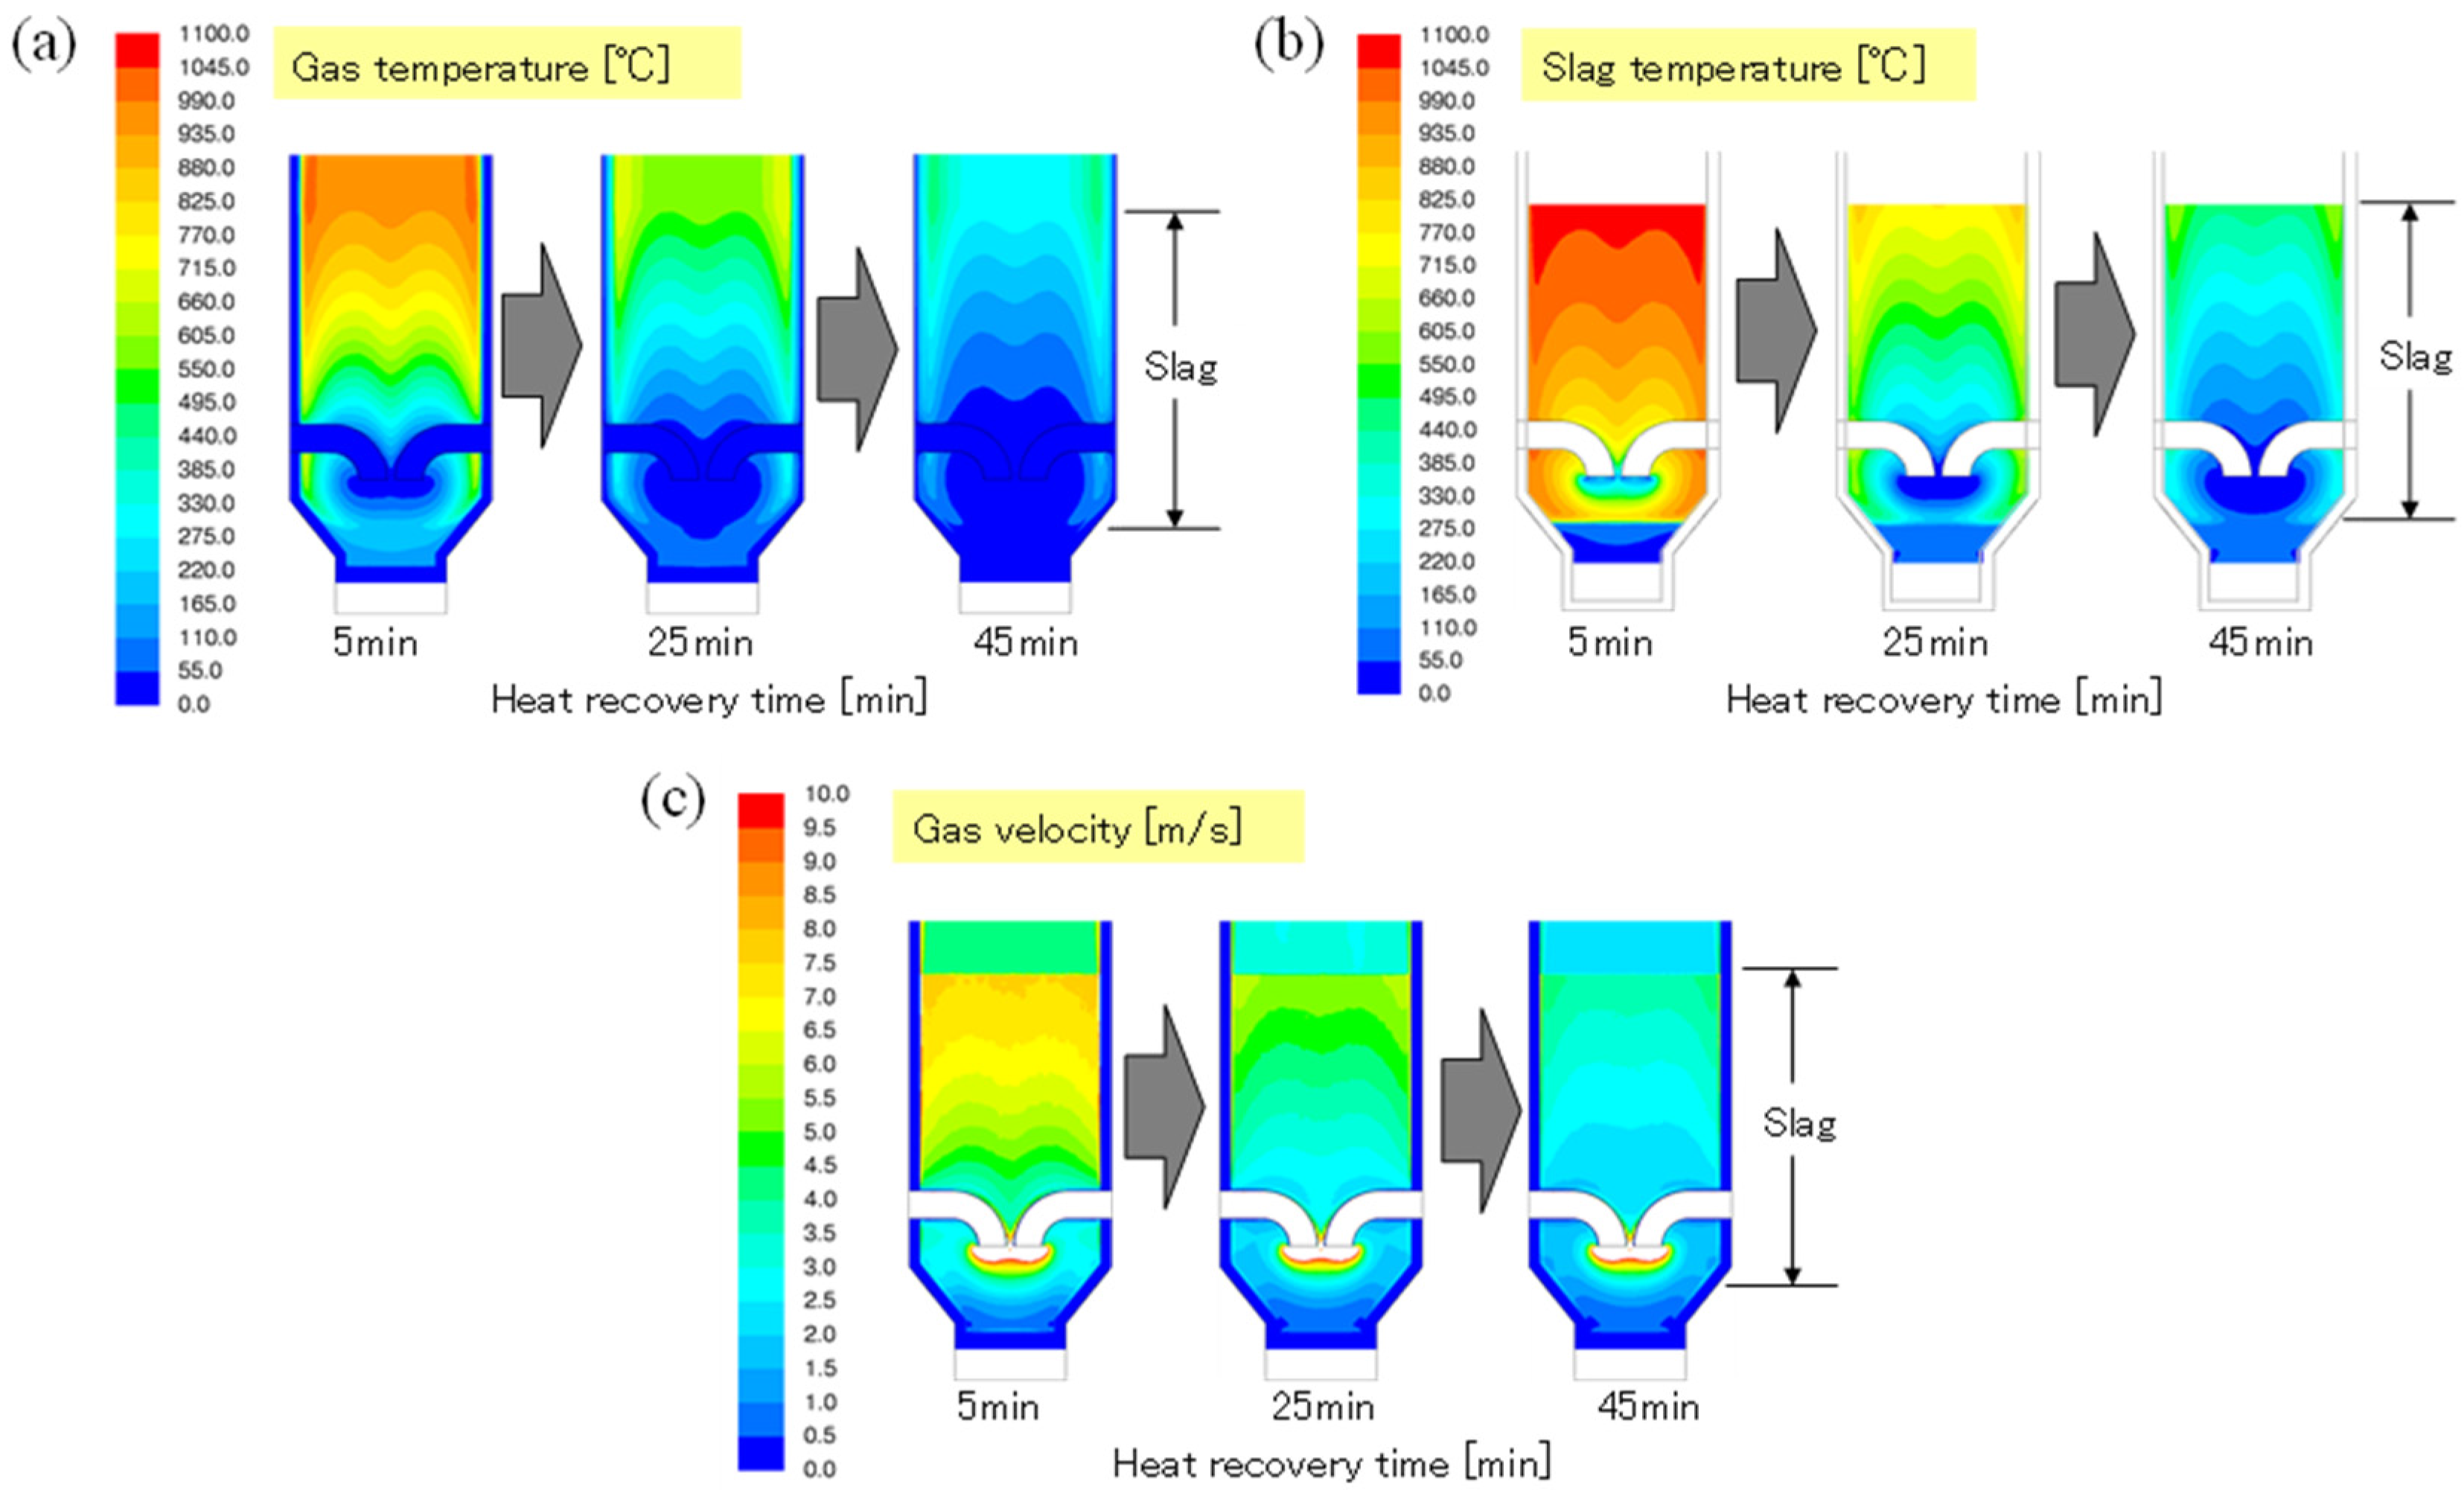
Figure 14.
Calculated gas velocity distribution at top of slag packed bed: (a) Case 1, (b) Case 2, ◊: Average value at 5 min, ♦: Average value at 45 min.
Figure 14.
Calculated gas velocity distribution at top of slag packed bed: (a) Case 1, (b) Case 2, ◊: Average value at 5 min, ♦: Average value at 45 min.

Figure 15.
Gas velocity measurement in pilot-scale slag heat recovery chamber (left) and photo of discharged slag after heat recovery (right).
Figure 15.
Gas velocity measurement in pilot-scale slag heat recovery chamber (left) and photo of discharged slag after heat recovery (right).
Figure 16.
Comparison of gas velocity above packed bed in pilot-scale slag heat recovery chamber.
Figure 17.
Gas temperature profiles obtained by pilot test and CFD simulation.

Table 1.
Experimental conditions for laboratory-scale gas velocity measurements.
| Chamber | Chamber inner diameter (mm) | 300 |
| Packed bed | Sample temperature (K) | 298 |
| Sample packing height (mm) | 250 | |
| Total weight of the sample (kg) | 25 | |
| Sample | Dimensions T × W × L (mm) | 8 × 22.5 × 22.5 |
| Equivalent spherical volume diameter ds [mm] | 19.8 | |
| Equivalent particle diameter dp (mm) | 14.0 | |
| Sphericity dp/ds (mm) | 0.71 | |
| Sample density (t/m3) | 2.0 | |
| Gas | Gas inlet temperature (K) | 298 |
| Gas flow rate (L/min) | 200 | |
| Anemometer | Radical position of the probe r (mm) | 30, 50, 70, 100, 120, 140 |
| Rotation speed of the probe (rpm) | 1.71 |
Table 2.
Calculation conditions for laboratory-scale CFD simulation.
| Chamber | Chamber inner diameter (mm) | 300 |
| Packed bed | Sample temperature (K) | 298 |
| Sample packing height (mm) | 250 | |
| Total weight of the sample (kg) | 25 | |
| Sample bed porosity | Central εc = 0.40 | |
| Near-wall εw = 0.56 | ||
| Specific surface area (m2/m3) | Central 164.6 | |
| Near-wall 86.1 | ||
| Sample | Dimensions T × W × L (mm) | 8 × 22.5 × 22.5 |
| Equivalent spherical volume diameter ds (mm) | 19.8 | |
| Equivalent particle diameter dp (mm) | 14.0 | |
| Sphericity dp/ds (mm) | 0.71 | |
| Sample density (t/m3) | 2.0 | |
| Gas | Inlet temperature (K) | 298 |
| Volumetric flow rate (L/min) | 200 | |
| Mass flow rate (kg/s) | 0.00408 | |
| Outlet gauge pressure (Pa) | 0 |
Table 3.
Specifications of slag heat recovery pilot plant.
| Equipment | Specifications | ||
|---|---|---|---|
| Twin-roll plant | Cooling roll | Dimensions | Φ1.6 m × W1.5 m |
| Number of rolls | 2 | ||
| Material | Cu | ||
| Rotation speed | Max.20 rpm | ||
| Cooling water flow rate | 125–130 m3/h/roll | ||
| Ladle tilting machine | Tilting speed | Max.6.5 °/min | |
| Load | Max.140 t | ||
| Conveyer | Dimensions | W1.3 m × L14.5 m | |
| Lifting height | 5.5 m | ||
| Speed | 25 m/min | ||
| Material | SUS304 | ||
| Slag heat recovery plant | Crusher | Capacity | 1.0 t/min |
| Bucket elevator | Transport capacity | 1.0 t/min | |
| Heat recovery chamber | Chamber size | L1.5 m × W2.0 m × H2.5 m | |
| Capacity | Max.6 t | ||
| Blower | Gas flow rate | Max.12000 Nm3/h | |
| Motor | 150 kW | ||
| Cyclone | Size | Φ2.2 m × H7.5 m | |
Table 4.
Operating conditions of pilot-scale slag heat recovery test.
| Twin-roll plant | Ladle tilting speed (mm/s) | 1.0 |
| Rotation speed of the cooling rolls (rpm) | 10 | |
| Cooling water flow rate (t/h/roll) | 125 | |
| Conveyer speed (m/min) | 25 | |
| Slag heat recovery plant | Amount of slag charged (t) | 4.8 |
| Height of the slag packed bed (m) | 1.83 | |
| Gas flow rate (Nm3/h) | 7200 |
Table 5.
Calculation conditions for pilot-scale CFD simulations (field and boundary conditions).
| Chamber | Chamber cross section (m2) | 2.82 |
| Wall thickness (mm) | Steel inner wall 5 | |
| Heat insulator 100 | ||
| Steel outer wall 12 | ||
| Heat transfer coefficient on walls (W/m2K) | 20 | |
| Wall initial temperature (K) | 298 | |
| Ambient temperature (K) | 298 | |
| Packed bed | Slag bed porosity | Central εc = 0.55 |
| Near-wall εw = 0.77 | ||
| Specific surface area (m2/m3) | Central 164.6 | |
| Near-wall 86.1 | ||
| Slag packing height (m) | (Case1) 1.83 (Case2) 3.50 | |
| Slag | Dimensions of the slag T × W × L (mm) | 7 × 50 × 50 |
| Equivalent spherical volume diameter ds (mm) | 32.2 | |
| Equivalent particle diameter dp (mm) | 16.4 | |
| Sphericity dp/ds (mm) | 0.51 | |
| Initial temperature (K) | Precharged slag 298 | |
| Slag for heat recovery 1373 | ||
| Gas | Inlet temperature (K) | 298 |
| Volumetric flow rate (Nm3/h) | (Case1) 7200 (Case2) 10900 | |
| Mass flow rate (kg/s) | (Case1) 2.368 (Case2) 3.592 | |
| Outlet gauge pressure (Pa) | 0 |
Table 6.
Calculation conditions for pilot-scale CFD simulations (Physical properties of materials).
| Item | Density (g/m3) | Specific Heat (J/kgK) | Thermal Conductivity (W/Mk) |
|---|---|---|---|
| Slag | 2200 | 1010 | λs |
| Heat insulator | 100 | 1256 | 0.2 |
| Steel | 8030 | 502 | 40 |
Table 7.
Calculation conditions for pilot-scale CFD simulations (Heat conductivity of slag).
| Temp (K) | 373 | 473 | 573 | 673 | 773 | 873 | 973 | 1073 | 1173 | 1273 |
| λs | 0.22 | 0.45 | 0.74 | 1.13 | 1.66 | 2.37 | 3.28 | 4.40 | 5.76 | 7.35 |
© 2017 by the authors. Licensee MDPI, Basel, Switzerland. This article is an open access article distributed under the terms and conditions of the Creative Commons Attribution (CC BY) license (http://creativecommons.org/licenses/by/4.0/).
Share and Cite
MDPI and ACS Style
Shigaki, N.; Ozawa, S.; Sumi, I. Effect of Gas Velocity Distribution on Heat Recovery Process in Packed Bed of Plate-Shaped Slag. Energies 2017, 10, 755. https://doi.org/10.3390/en10060755
AMA Style
Shigaki N, Ozawa S, Sumi I. Effect of Gas Velocity Distribution on Heat Recovery Process in Packed Bed of Plate-Shaped Slag. Energies. 2017; 10(6):755. https://doi.org/10.3390/en10060755
Chicago/Turabian StyleShigaki, Nobuyuki, Sumito Ozawa, and Ikuhiro Sumi. 2017. "Effect of Gas Velocity Distribution on Heat Recovery Process in Packed Bed of Plate-Shaped Slag" Energies 10, no. 6: 755. https://doi.org/10.3390/en10060755
Note that from the first issue of 2016, this journal uses article numbers instead of page numbers. See further details here.