
Incorporating Charging/Discharging Strategy of Electric Vehicles into Security-Constrained Optimal Power Flow to Support High Renewable Penetration


1
School of Electrical & Electronic Engineering, Yonsei University, Seoul 03722, Korea
2
Department of Electrical Engineering, Soongsil University, Seoul 06978, Korea
*
Author to whom correspondence should be addressed.
Energies 2017, 10(5), 729; https://doi.org/10.3390/en10050729
Submission received: 18 January 2017
/
Revised: 27 April 2017
/
Accepted: 28 April 2017
/
Published: 20 May 2017
(This article belongs to the Special Issue Theory and Application of Computational Intelligence in Electric Vehicles and their Integration within Smart Energy Networks)
Abstract
:This research aims to improve the operational efficiency and security of electric power systems at high renewable penetration by exploiting the envisioned controllability or flexibility of electric vehicles (EVs); EVs interact with the grid through grid-to-vehicle (G2V) and vehicle-to-grid (V2G) services to ensure reliable and cost-effective grid operation. This research provides a computational framework for this decision-making process. Charging and discharging strategies of EV aggregators are incorporated into a security-constrained optimal power flow (SCOPF) problem such that overall energy cost is minimized and operation within acceptable reliability criteria is ensured. Particularly, this SCOPF problem has been formulated for Jeju Island in South Korea, in order to lower carbon emissions toward a zero-carbon island by, for example, integrating large-scale renewable energy and EVs. On top of conventional constraints on the generators and line flows, a unique constraint on the system inertia constant, interpreted as the minimum synchronous generation, is considered to ensure grid security at high renewable penetration. The available energy constraint of the participating EV associated with the state-of-charge (SOC) of the battery and market price-responsive behavior of the EV aggregators are also explored. Case studies for the Jeju electric power system in 2030 under various operational scenarios demonstrate the effectiveness of the proposed method and improved operational flexibility via controllable EVs.
1. Introduction
Many efforts to lower carbon emissions and respond to climate change have been conducted by the electricity and transportation sectors. Renewable energy sources (RES) such as wind power and solar power have been developed to replace fossil-fuel-combustion electricity-generating units. Electric vehicles (EVs), which are powered by electricity from charged batteries, are referred to as an alternative to traditional petroleum fuel vehicles [1,2,3]. Electricity from the high penetration of RES can be provided at low marginal costs but may threaten power system security due to unpredictable fluctuations and non-dispatchable characteristics. The controllability of EVs (i.e., battery energy in EVs) could help balance intermittent RES and facilitate the integration of RES into a power system [4,5,6].
Emerging EV loads present new challenges to grid planning and operation due to variability and uncertainty as well [7,8]. Smart charging scheduling programs are required to ensure the stability and reliability of the power system. The EV aggregator plays an important role in the integration of the EV fleet into the power system by managing the charging of batteries and participating in the electricity market [9,10,11,12]. EV batteries can have three modes according to system price: waiting mode, charging mode, and discharging mode. Waiting mode can be set up to avoid high price periods, and charging demand can be shifted to off-peak time. In the charging mode referred to as grid-to-vehicle (G2V), batteries are charged by buying electricity from the grid. The discharging mode called vehicle-to-grid (V2G) can return stored energy back to the grid. The EV aggregator interacts with system operator (SO) to determine the mode of EVs in order to reduce costs, minimize system losses, improve voltage profiles, and to provide ancillary services such as regulation and operating reserve through real-time monitoring of system conditions and the market [13,14,15]. EVs are considered as interruptible loads or dispatchable sources in a power system. Therefore, EVs can be one of energy storage application. The bidirectional technology and immediate response of EVs can reinforce the operational flexibility of power system integrated with high penetration of RES.
Many countries submitted pledges, which are referred to as “intended nationally determined contributions (INDCs)”, to the United Nations (UN) in 2015. These included an indication of reducing greenhouse gas emissions. The United States plans to reduce greenhouse gas emissions by 26–28% by 2025 compared to 2005 levels, the European Union (EU) aims at a 40% reduction by 2030 compared to 1990 levels, and South Korea’s mitigation target is an approximate 37% emission reduction by 2030 [16,17]. For successful transition to a decarbonized energy sector, new technologies such as renewable energy, energy storage, and alternative fuel vehicles [18] need to be deployed. Jeju Island in South Korea established its Carbon Free Island Project by 2030 to reorganize the power system through 100% replacement to renewable energy, 100% conversion to EVs, and creation of a large-scale advanced-smart-grid island [19,20,21].
This paper focuses on the charging/discharging strategy of EV aggregators while considering stored energy in EV batteries in order to support the high penetration of RES and enhance the operational flexibility of electric power system. The AC power system needs to maintain sufficient inertia constant to maintain the desired voltage and frequency because intermittent sources lack the capability of providing system inertia and reserve. The minimum synchronous generations and maximum power limits of wind power are introduced to ensure power system security [22,23,24,25]. The day-ahead price is calculated based on the forecasts for RES and demand. The actual deviations from day-ahead are balanced by EV aggregators that have their own cost curves, and determine the charging, wait, and discharging of EV fleets according to market price and their stored energy [26,27]. This research assumes that the capacity of high-voltage direct current (HVDC) system connected to the mainland will reach 900 MW by 2030. The capacity of transmission from the mainland to Jeju Island is 600 MW, and the remaining 300 MW is used for contingency reserve. Figure 1 shows the proposed framework.
This paper is organized as follows: Section 2 introduces the envisioned prospects and the potentiality of a carbon-free island project on Jeju. Section 3 presents problem formulation for cost minimization. Section 4 shows case studies for validating the proposed EV charging strategy, followed by concluding remarks in Section 5.
2. Carbon Free Island Initiative by 2030 in Jeju
Jeju Island was selected as the location for a Smart Grid Test Bed in South Korea. The project was implemented in two steps: the first step was to establish system infrastructure between 2009 and 2011. The second step was to determine a procedure to conduct an integrated operation by 2013. The Jeju demonstration project is one of the world’s largest smart grid communities. It includes 10 consortia in five regions, and covers 185 of area, which is about 10% of Jeju Island. This covers 15,000 residents and 6250 households. Research teams, companies, and service providers tested advanced technologies and research. They also developed business models with regard to integrating renewable energies into the grid, advanced metering infrastructure (AMI), energy storage system (ESS), smart home and building energy management system (EMS), EV charging, V2G, demand response (DR), etc. [19,20].
Based on validated technologies and operating experience from the test bed, in 2012, the Jeju Special Self-Governing Province initiated its Carbon Free Island by 2030 Project for the deployment of a large-scale smart grid. This project would improve energy efficiency and tackle climate change issues [21]. The sustainable energy strategy is realized with integrations of renewable energy, EVs, and advanced smart grid technologies. By 2030, existing fossil fuel power stations will be replaced with 100% renewable energy such as wind and solar power. In Phase 1, 1 GW of offshore and 350 MW of onshore wind power generation will be installed by 2020, and 2 GW of offshore wind farm and 100 MW of solar power will be extended by 2030 as Phase 2. All cars, including rental car and public transport vehicles, will be changed to EVs. Jeju has pursued the installation of infrastructure, improvement of laws and regulation, and incentive plans in order to spread EVs and to be a representative city of green technology. In the first step, charging facilities are built in main regions, and 29,000 EVs of public sectors and rental cars will be supplied by 2017. In the second step, charging facilities are completed at main tour sites and accommodations and expanded at main residential and downtown areas by 2020. Finally, there will be 371,000 EVs and 75,513 chargers across the island by 2030.
The president of South Korea delivered the keynote speech, ”2030 Energy Strategies to Foster New Industries”, at the 21st session of the Conference of the Parties (COP21) in Paris, and highlighted the initiative for transition into a carbon-free island. National support (such as the project budget, regulatory improvements, and investments of commercial companies) will be significantly increased to accelerate the realization of carbon-free environment and green growth.
3. Mathematical Formulation
3.1. Optimization Problem
This section presents the objective function of minimizing the operational cost (or maximizing the social welfare) by exploiting the EV controllability in order to maximize the RES penetration while running the power grid within its operating limits. Successful EV controls help reduce the curtailment of RES while ensuring the system security and minimizing generation of conventional units. This research assumes day-ahead and real-time markets [26,27]. Net variability of demand and renewable energy is handled by coordinated EV controls and reserve deployment. The objective function for minimizing the total generation cost is formulated as follows:
where and are the generation cost functions of conventional generating units for in the day-ahead market and for in real-time, respectively. is the cost offered by the EV aggregators for providing according to the modes of the EV fleets, i.e., charging, discharging, or waiting modes. Consequently, the SO in Equation (1) minimizes the total generation cost including the bidding costs in the day-ahead, reserve costs in real time, and service costs of EV fleets. Renewable operating costs are assumed to be zero.
• Power balancing constraint in the day-ahead market
A day-ahead market is cleared from the bidding procedure of the generation-side based on economic dispatch (ED). The total generation (including conventional and renewable generating units) and demand (including load consumption and EVs) are balanced in period t as follows:
where is the total generation, and , , and are the active power output of conventional generating unit i, wind power unit j, and solar power unit k in the day-ahead market, respectively. is the total demand, is the total load except for EV loads, and is the EV demand in the EV fleet l in the day-ahead market. , , , and are the number of conventional units, wind power units, solar power units, and EV fleets, respectively.
• Power balancing constraint in the real-time market
In the real-time market, a power balancing procedure is conducted to secure reliability from the deviations in actual generation and demand based on the optimal power flow (OPF) [27]. The real-time constraint for total generation and total demand is as follows:
where all parameters are the same with day-ahead while subscript presents real-time.
In the real-time market, EV fleets can play an important role in balancing generation and demand in order to exploit their flexibility and fast response. In Equation (4), the value of the EV fleet among plug-in can be positive for the charging mode, zero for the waiting mode, and negative for the discharging mode. The SO aims to minimize the variations in the conventional units to avoid additional operating costs:
where presents the active power output variation of conventional unit in real time.
• Generating unit constraints
The technical constraints of generating units such as minimum/maximum power output and ramp-up/down rate limit are as follows:
where is the decision variable of generation status, and is the ramp rate of generator. and present minimum and maximum active power of generating units.
Equations (5)–(8) are associated with conventional generating units, and Equations (9) and (10) present the power limits for renewable generating units. In Equation (6), the calculation of actual generation minus scheduled generation determines the , which values can be 1, 0, and −1 when the calculation is positive, zero, or negative, respectively. The incremental and decremental generation is less than the ramp-up rate limit and more than the ramp-down limit.
• Branch/transformer and bus constraints
Power flow on each transmission line or transformer should be less than its own limits because the locational marginal price (LMP) can be significantly increased in a highly congested system. As a result, generation dispatch does not allow overloading in all elements. The bus voltage magnitude can be forced to maintain a voltage level within acceptable limits:
where and present the line flow and transmission line limits, respectively. is voltage magnitude at bus m, and and present acceptable voltage limits.
• EV fleet constraints
The EV aggregator has to establish the mode of its EV fleet among charging, wait, and discharging as a business operator while considering the electricity price of the system, number of plug-in EVs, SOC level, battery capacity, and charging, discharging rate, and efficiency.
Based on these factors, discharging rate and bidding price for electricity support to grid are determined so as to minimize cost for charging and maximizing their profits. Equations (13)–(15) are EV aggregator’s technical constraints:
where is the total number of EVs, the subscripts c, d, w, and u indicate the status of EVs for charging, discharging, waiting, and being unplugged, respectively. Therefore, , , and are the number of plug-in EVs, while is the number of unplugged EVs.
The plug-in EVs from the grid point of view are considered as generators or loads according to their modes (such as charging, waiting, or discharging mode), while the unplugged status indicates that the EVs are being used in driving mode:
where , , and are the total battery capacity, charging power, and discharging power of the EV fleet l, respectively. , , and present information of each EV connected to EV fleet l. The total power of the EV fleet, , is derived from the difference between the total charging rate and the discharging rate, as shown in Equation (15). If the total charging rate is greater than the total discharging rate, the EV fleet behaves as a load. On the other hand, if the total discharging rate is greater than the total charging rate, the EV fleet seems to be supplying energy to the grid as a generator. The aggregator of each EV fleet determines whether it participates in bidding according to market conditions and the SOC level of the EVs:
The SOC level of the EV fleet can be calculated according to the charging and discharging modes as shown in Equation (16). The energy drawn from the grid to the EV battery during charging period depends on the charging efficiency, , and the energy supplied from the EV battery to the grid is affected by the discharging efficiency, , due to the inherent losses of the battery charger [28]. The aggregator ensures that the SOC of its EV fleets is within the minimum and maximum SOC level in order to avoid the uncomfortable experience of each EV owner and over-charging.
3.2. Grid Intergration of Renewable Energy Source
3.2.1. Effective Inertia Constant
The effective inertia constant represents the capability to preserve the desired voltage and frequency through the rotational inertia of an AC power system [22]. The minimum inertia constant for AC system relative to the HVDC rating is defined as Equation (18), and the minimum requirement is 2.0 to 3.0. Two HVDC systems have operated between the mainland and Jeju Island. The current source converter (CSC)-based HVDC #1 has a capacity of 300 MW and voltage level up to ±180 kV with two poles. The CSC-based HVDC #2 a is bipolar HVDC system that has a transfer rate of 400 MW and ±180 kV voltage. Furthermore, the bi-directional voltage source converter (VSC)-based HVDC #3 will be able to operate with 200 MW total transfer. The total capacity of the HVDC is 900 MW, but it is expected that the HVDC operation capacity in 2030 will be 600 MW, with 300 MW remaining as a contingency reserve to immediately respond to sudden events such as a large loss of generating resources, transmission lines, or loads [29]. Table 1 lists the generators in Jeju Island. It is enough to meet the minimum value of with must-run generators (NamJeju TP, Hanlim CC, and Jeju LNG) and two synchronous condensers. The inertia and ramp rate of Jeju LNG are assumed because it will be connected to the grid in 2018:
where is effective inertia constant, is rotational inertia constant of generating unit i, and has an MVA rating of generating unit i.
3.2.2. Maximum Wind Power Penetration Limit
In an isolated island power system with a high penetration of wind power, the wind power output limit depends on operating constraints such as technical minimum/maximum output, ramp rate capability, and spinning reserve imposed by conventional generating units [23,24]. The sudden loss of a large scale of wind power due to faults may have a serious impact on the power system stability. Therefore, a precise stability analysis is needed to determine the accurate wind power output limit. In [30], the wind power output limit for the power system on Jeju Island is analyzed by power flow and dynamic studies. The maximum wind power limit is 1582 MW during peak demand. The limit is a time-varying indicator that is determined by system demand, unit commitment, and HVDC operating conditions. The capacity of wind generation is increased because surplus power can be transmitted to the mainland through HVDC #3.
4. Case Study
4.1. System Configuration
The proposed approach for minimizing operating cost based on OPF through the interaction between the ISO and EV fleets is simulated using the Jeju Island power system to reduce additional electricity production from conventional generating units by using EV batteries. In this case, the total conventional generation capacity is 735 MW with 10 units as shown in Table 1, and the total demand in 2030 is expected to reach 1160 MW [29]. It is assumed that 400 MW in summer and 300 MW in winter is consistently provided by HVDC systems from the mainland, and the minimum rotating generation is 295 MW in summer and 201 MW in winter to secure enough reserve and to increase system stability. The offshore wind farm of 2000 MW, onshore wind power of 350 MW, and solar power of 100 MW are planned by 2030. Figure 2 illustrates the Jeju Island power system configuration.
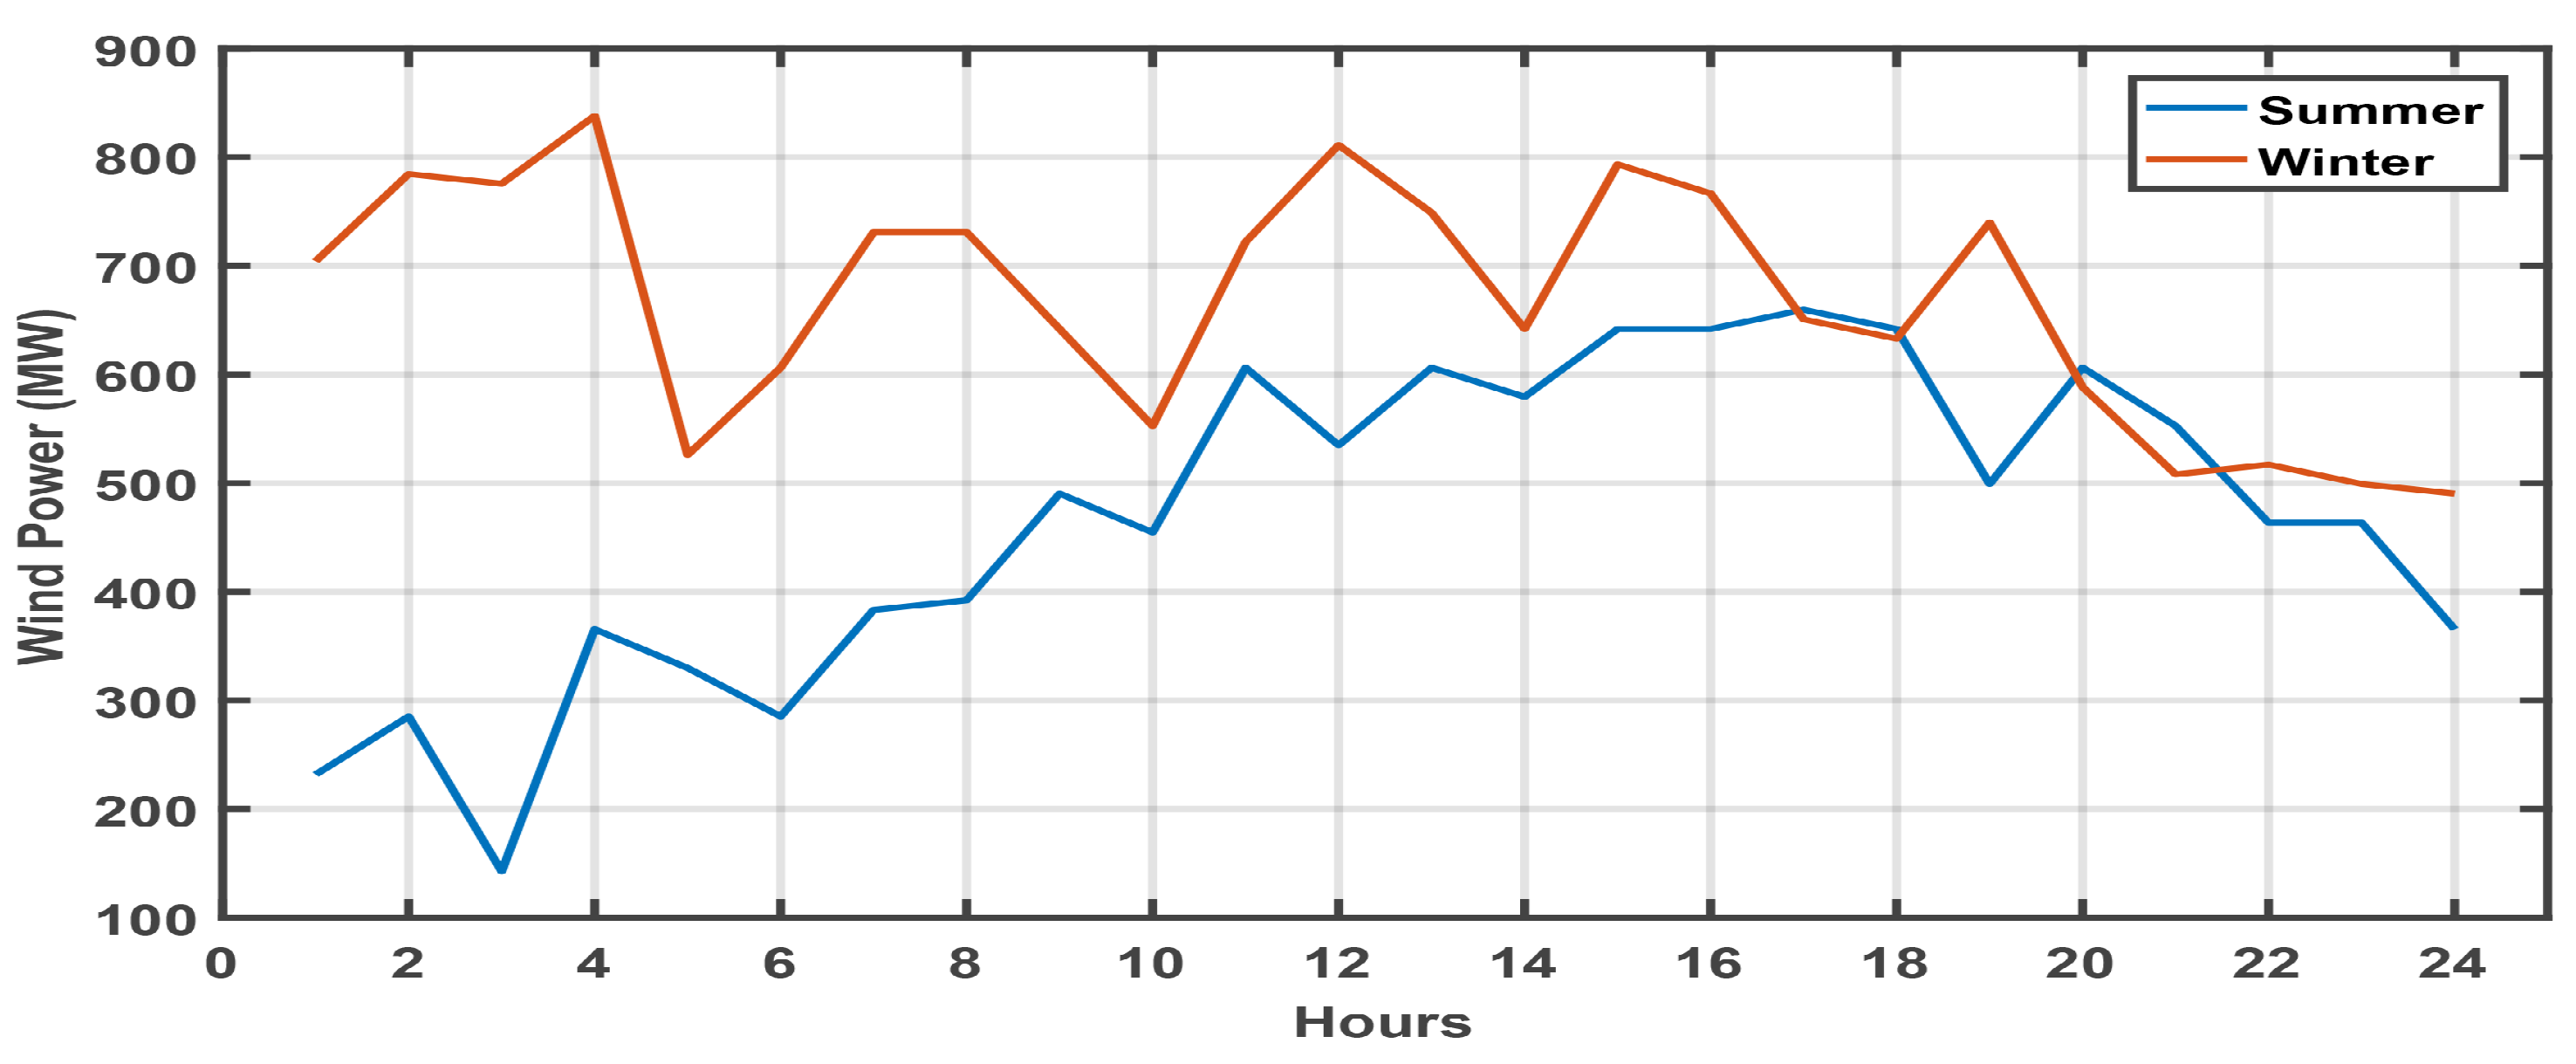
4.1.1. Wind Power Generation
To effectively operate wind power system, the minimum average wind speed is required to be at least 4–5 m/s. Jeju Island has plentiful wind resources for power generation. Wind speed data are extracted from the National Climate Data Service System (NCDSS), which serves the meteorological climate and renewable resources data set in South Korea [31]. The expected wind power generation for summer and winter in 2030 are shown in Figure 3. In summer, wind power generation is lower and more variable. In this paper, case studies for the summer are examined because battery charging is more important during the summer.
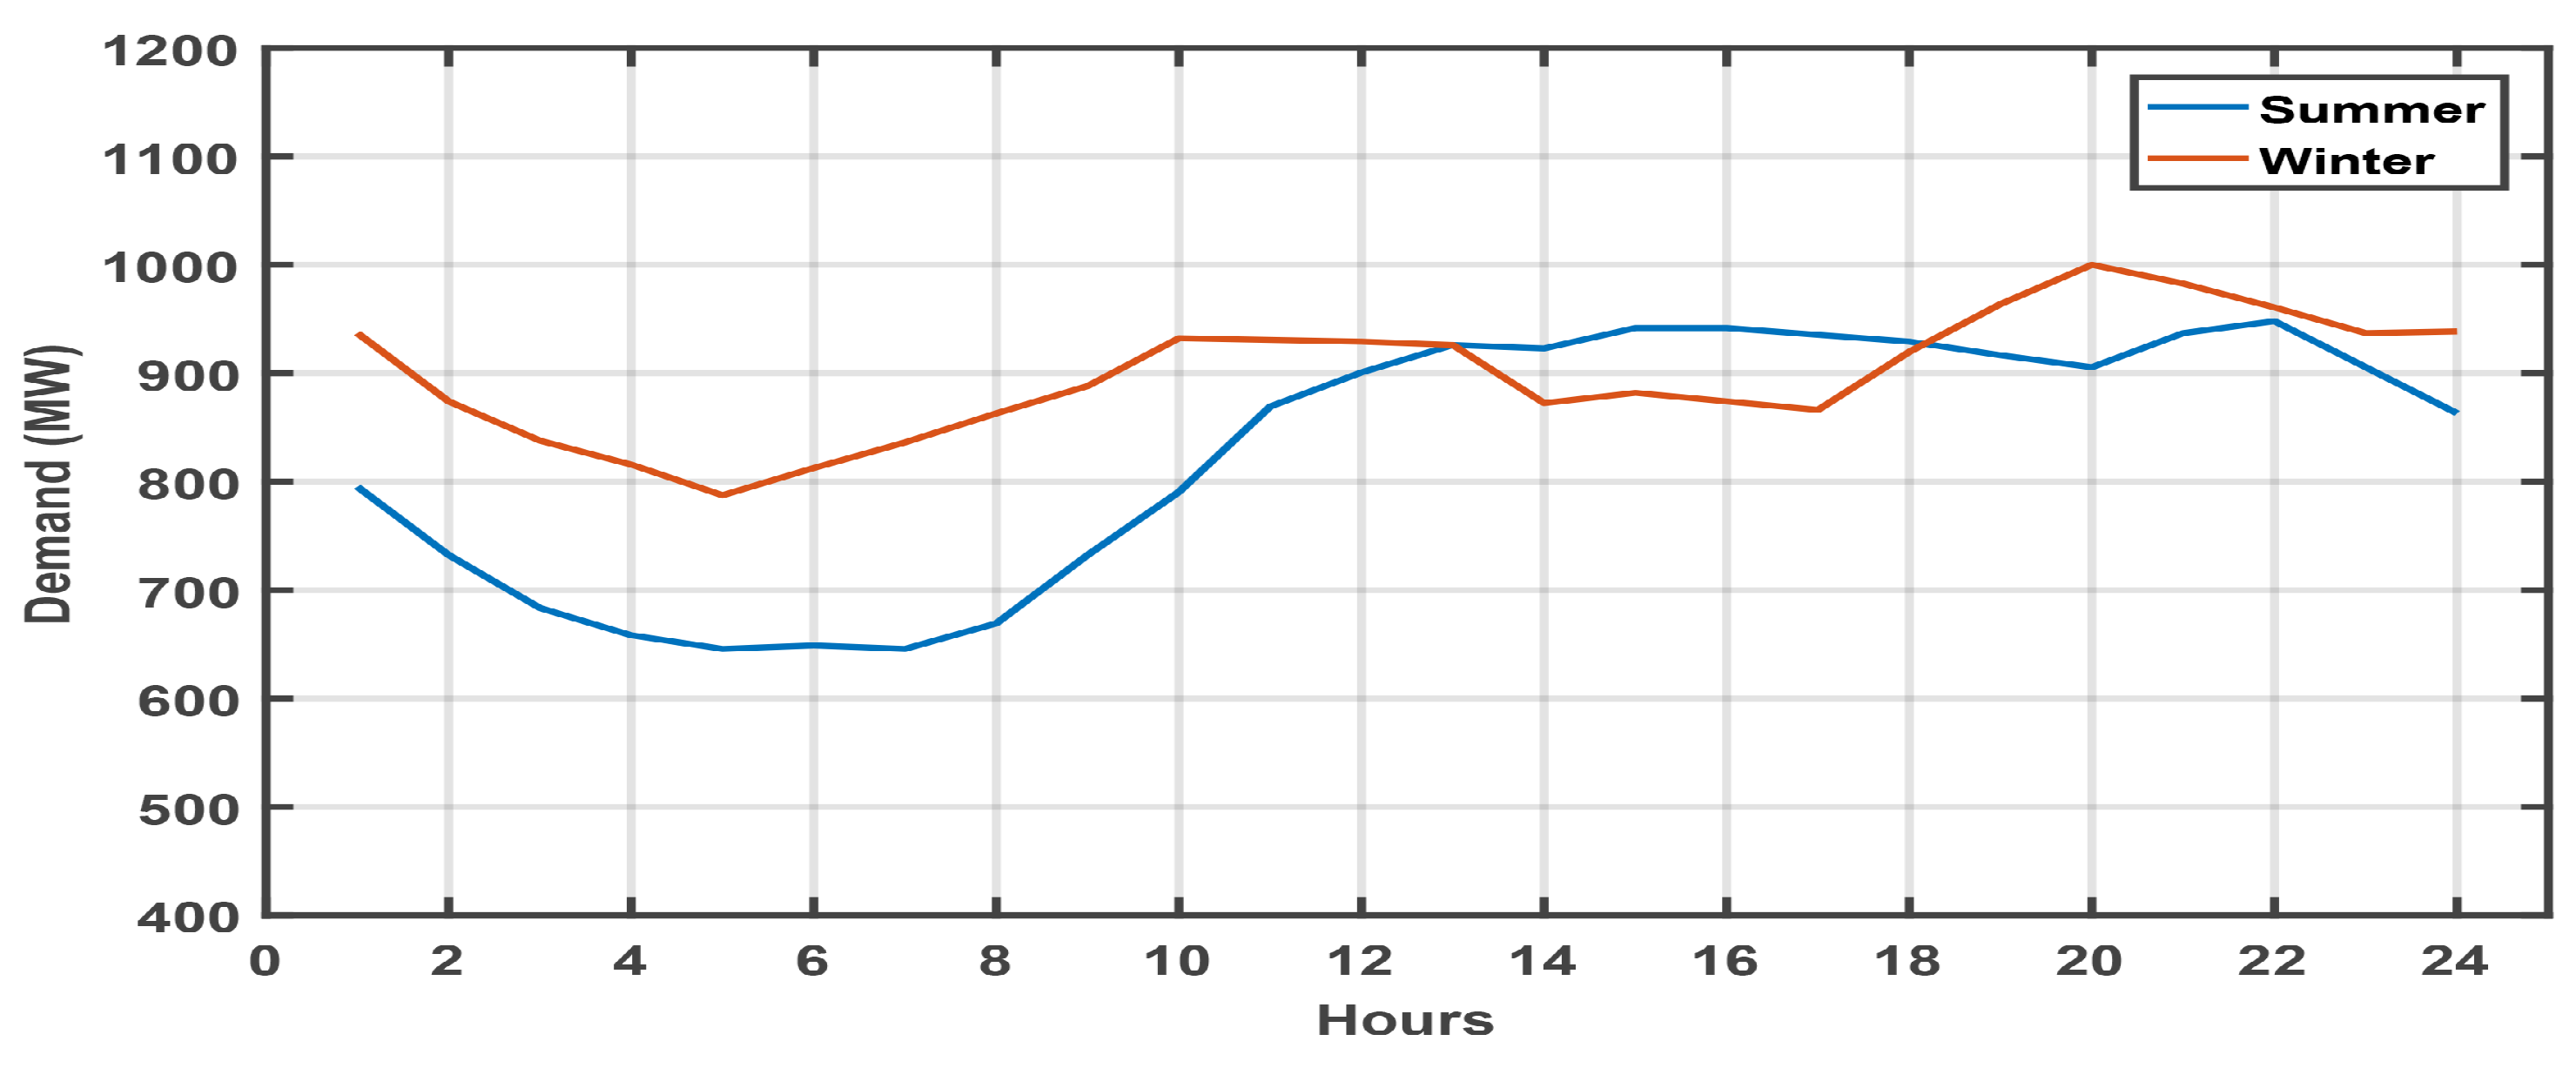
4.1.2. Load Profile and EV Modeling
Figure 4 shows the hourly load profiles in summer and winter in Jeju Island. It is a difficult task to accurately forecast EV charging patterns for 2030. The EV charging pattern may be different from that of a metropolitan area because Jeju Island is a sightseeing region. Tourists can charge at charging stations, public parking spaces, or accommodations equipped with charging units, while residents charge their EVs at home or at the workplace. The number of fast chargers will be 4350, and the number of slow chargers for residents will be 71,160 [32]. The charging patterns are analyzed based on daily miles driven, type of vehicles, departure and arrival time, and battery capacity on Jeju Island [30]. Figure 5 shows the charging patterns according to charging methods: (1) fast charging (120 kWh) and (2) slow charging (4 kWh). During fast charging, the peak time for charging demand is during the evening rush hour because residents also charge their EVs using fast chargers after work, while all residents charge EVs by using slow chargers. Slow charging reduces the charging demand during peak times and increases the demand during off-peak times because it takes longer to charge at a lower charging rate.
In this paper, EVs are classified into two groups according to their SOC levels. It is important to select the criterion for dividing the groups because the value may impact on battery performance, benefits, and operating costs. This research selects 75% SOC as the criterion with some margin because the EV with 67% SOC may drive around the Jeju Island, whose circumference is about 200 km. It is expected that the driving ranges of many EVs should go beyond 300 km in the future. EV aggregators may adjust this criterion to accommodate temporal and seasonal changes, and market conditions, for example. The criterion may be refined by EV owners and the aggregator for mutual benefits. Group 1 includes EVs with SOC under 75%. Group 2 consists of EVs with SOC over 75% to provide the V2G service. It is also assumed that the V2G service is provided by residential chargers: the discharging rate is 4 kWh, and the charging and discharging efficiency, and are 85%. Then, all EVs for residents are plugged in when they get back home.
4.1.3. Cost Function of Generating Units
The generating units in the Jeju power system are listed in Table 1, and an operating cost function is modeled with piecewise linear approximation. EVs in Group 1 are always supposed to charge their batteries, and the behaviors of EVs in Group 2 are determined by market price. A cost curve for EVs in Group 2 is shown in Figure 6. EVs in charging mode are price-sensitive loads, which are considered as negative real power injections [33]. The aggregator does not charge EVs above . EVs of are charged between and , and all EVs are in charging mode under . The blue line in Figure 6 indicates the generating cost curve for the V2G mode. The EV aggregator updates the cost function every hour because the market price and the capacity of EV fleet vary with time. In addition, numerous factors (such as the amount of RES generation, system operating limits, market conditions, and peak time/off peak time) should be incorporated in practice. The EV aggregator should offer competitive pricing compared with other generating units to sell it back to the grid in consideration of various factors (such as investment and operating costs, incentives for EV owners, the amount of available V2G services, and pricing of other generating units). The studies for market operation and charging/discharging pricing strategies have been conducted for Jeju’s initiatives in Korea [34,35].
4.1.4. EVs and RES Controls
The proposed framework should help minimize the operating cost of Jeju power grid at high wind penetration through successful EVs and RES controls and ensure the system security as well. The RES is integrated in the grid by taking system inertia and maximum wind power penetration limit into consideration. The EVs play a role in compensating for the variation of RES: they are controlled based on their SOC and market price in order to increase the use of RES (i.e., reduce the operating cost). The charging or discharging of EVs are determined based on their cost functions in the power system market.
4.2. Simulation Results
EVs in Group 2 are considered as dispatchable loads or generation units according to market price. Each EV aggregator can determine its cost curve reflecting the SOC level or business conditions. Simulations are conducted as follows:
- w/o Control,
- Control 1: waiting mode,
- Control 2: charging mode,
- Control 3: charging and discharging mode.
In w/o Control, all EV batteries are charged without any control, while the EVs in Group 2 are controlled by EV aggregators in Controls 2 to 4. EVs are in waiting mode for Control 2, and EVs are charged if price requirements are satisfied in Control 3. Some EVs are in charging mode or waiting mode, and the others are in discharging mode, according to market conditions. Although the demand forecast is accurate, the power output for conventional generating units are quite different due to forecasting errors of renewable generation. Deviations are compensated by flexible controls for the EVs. This results in a reduction in total generating costs.
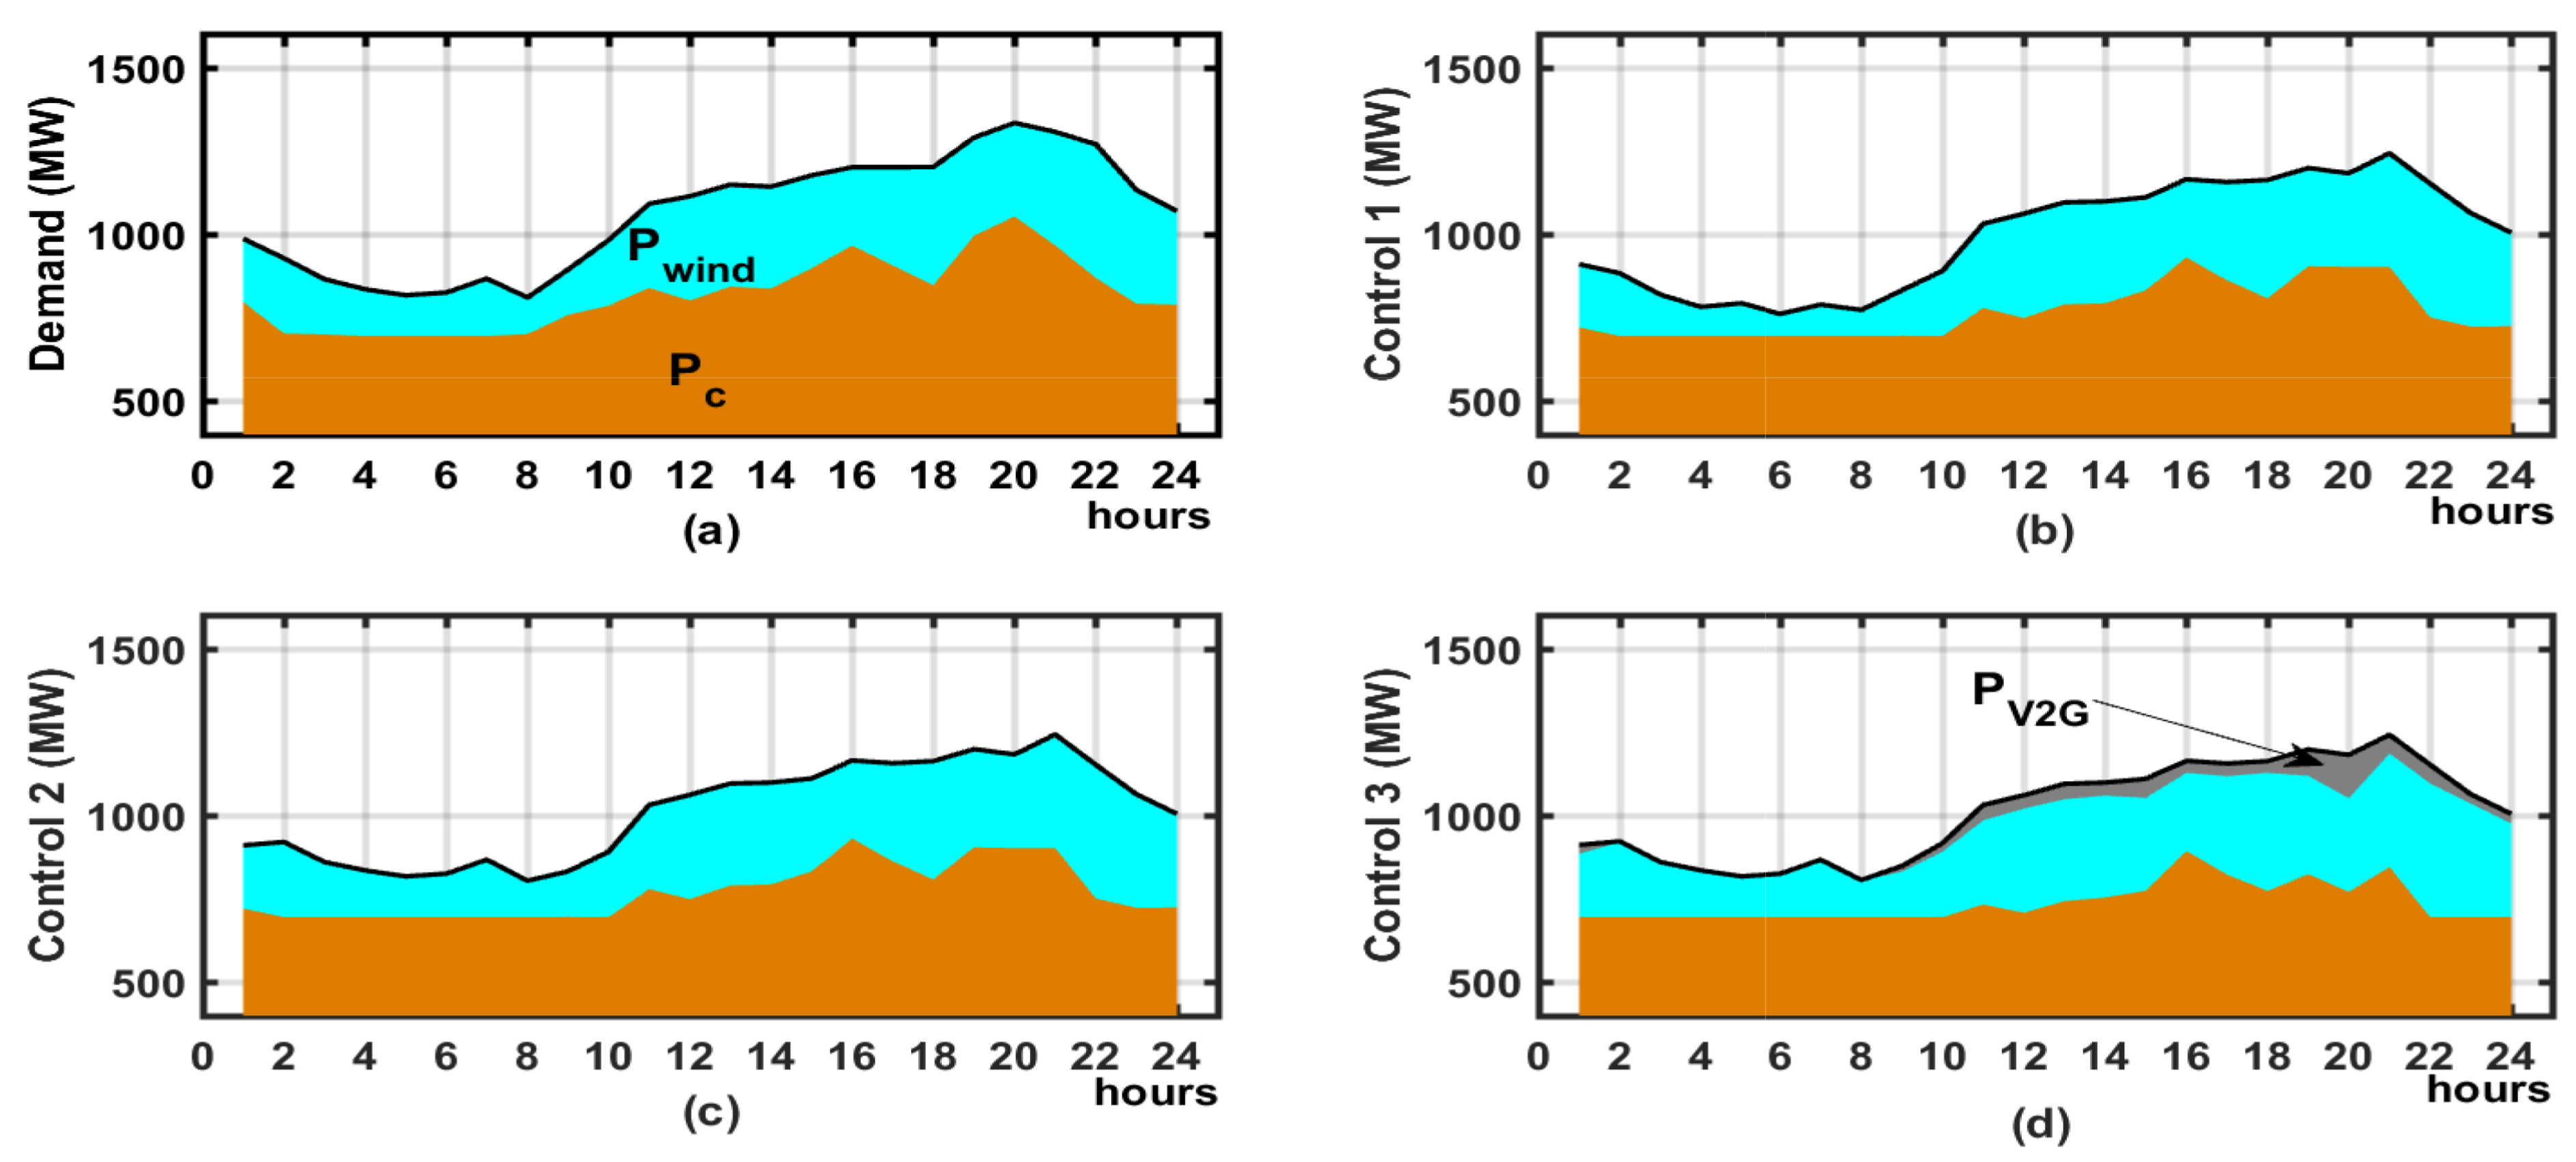
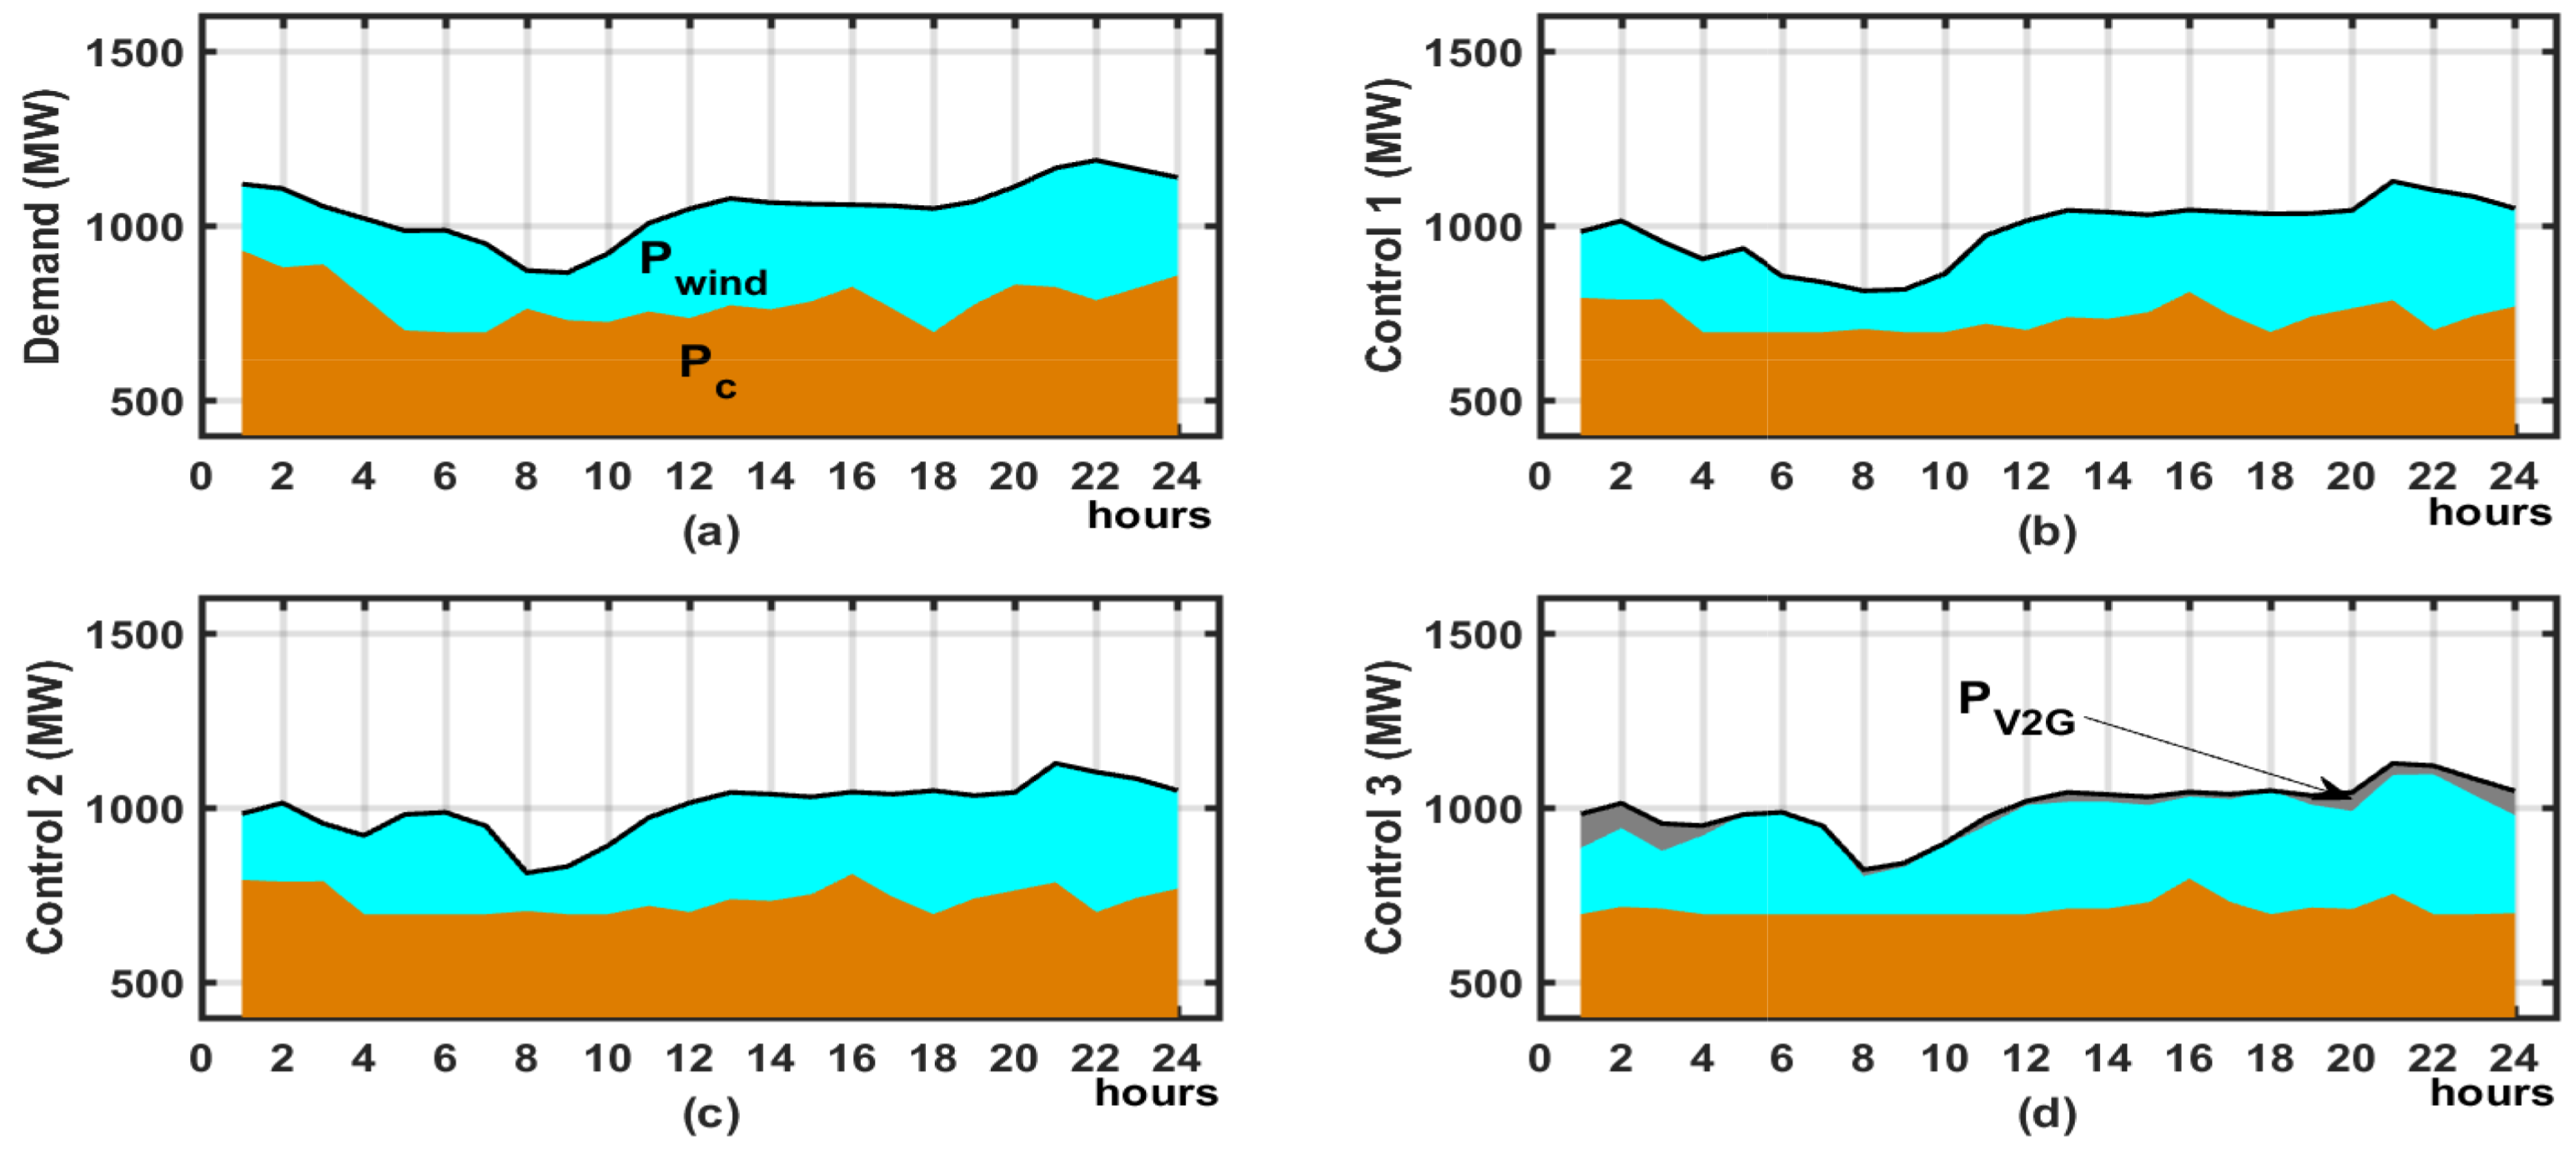
In Case 1, fast chargers are mainly occupied by residents during the evening rush hour, while it is assumed that all residents use slow chargers in their homes in Case 2. Figure 7 and Figure 8 show the hourly generation mix and total demand according to control methods in Cases 1 and 2, respectively. Conventional generating units in w/o Control produce the highest amount of power and fluctuations compared with other cases. In Control 1, the outputs are significantly reduced due to demand reduction by the waiting mode in Group 2. Although demand for Control 2 is higher than Control 1 during off-peak times, there is not much change in generation. The reason is that the increased demand is sufficiently covered by renewable resources. However, the minimum power output of conventional units is guaranteed to secure enough operating reserve and to supply inertia to the grid. At peak times, EV loads in Group 2 are in waiting mode, and demand is not increased due to the high price. In Control 3, the EV aggregators determine whether to buy or sell electricity based on their cost curves. EVs in Group 2 are charged when the price is low, and discharged when the price is high. Generally, it is effective that V2G service is performed at peak times. Furthermore, generation from conventional units is minimized through the V2G functions of the EVs, which is a cost effective and fast method. The demand curve for Case 2 can be flattened by the effect of charging demand shifts due to the slow charging rate as shown in Figure 5. The output of the conventional generating units and V2G is higher in Case 2 than in Case 1 in order to reduce the market price.
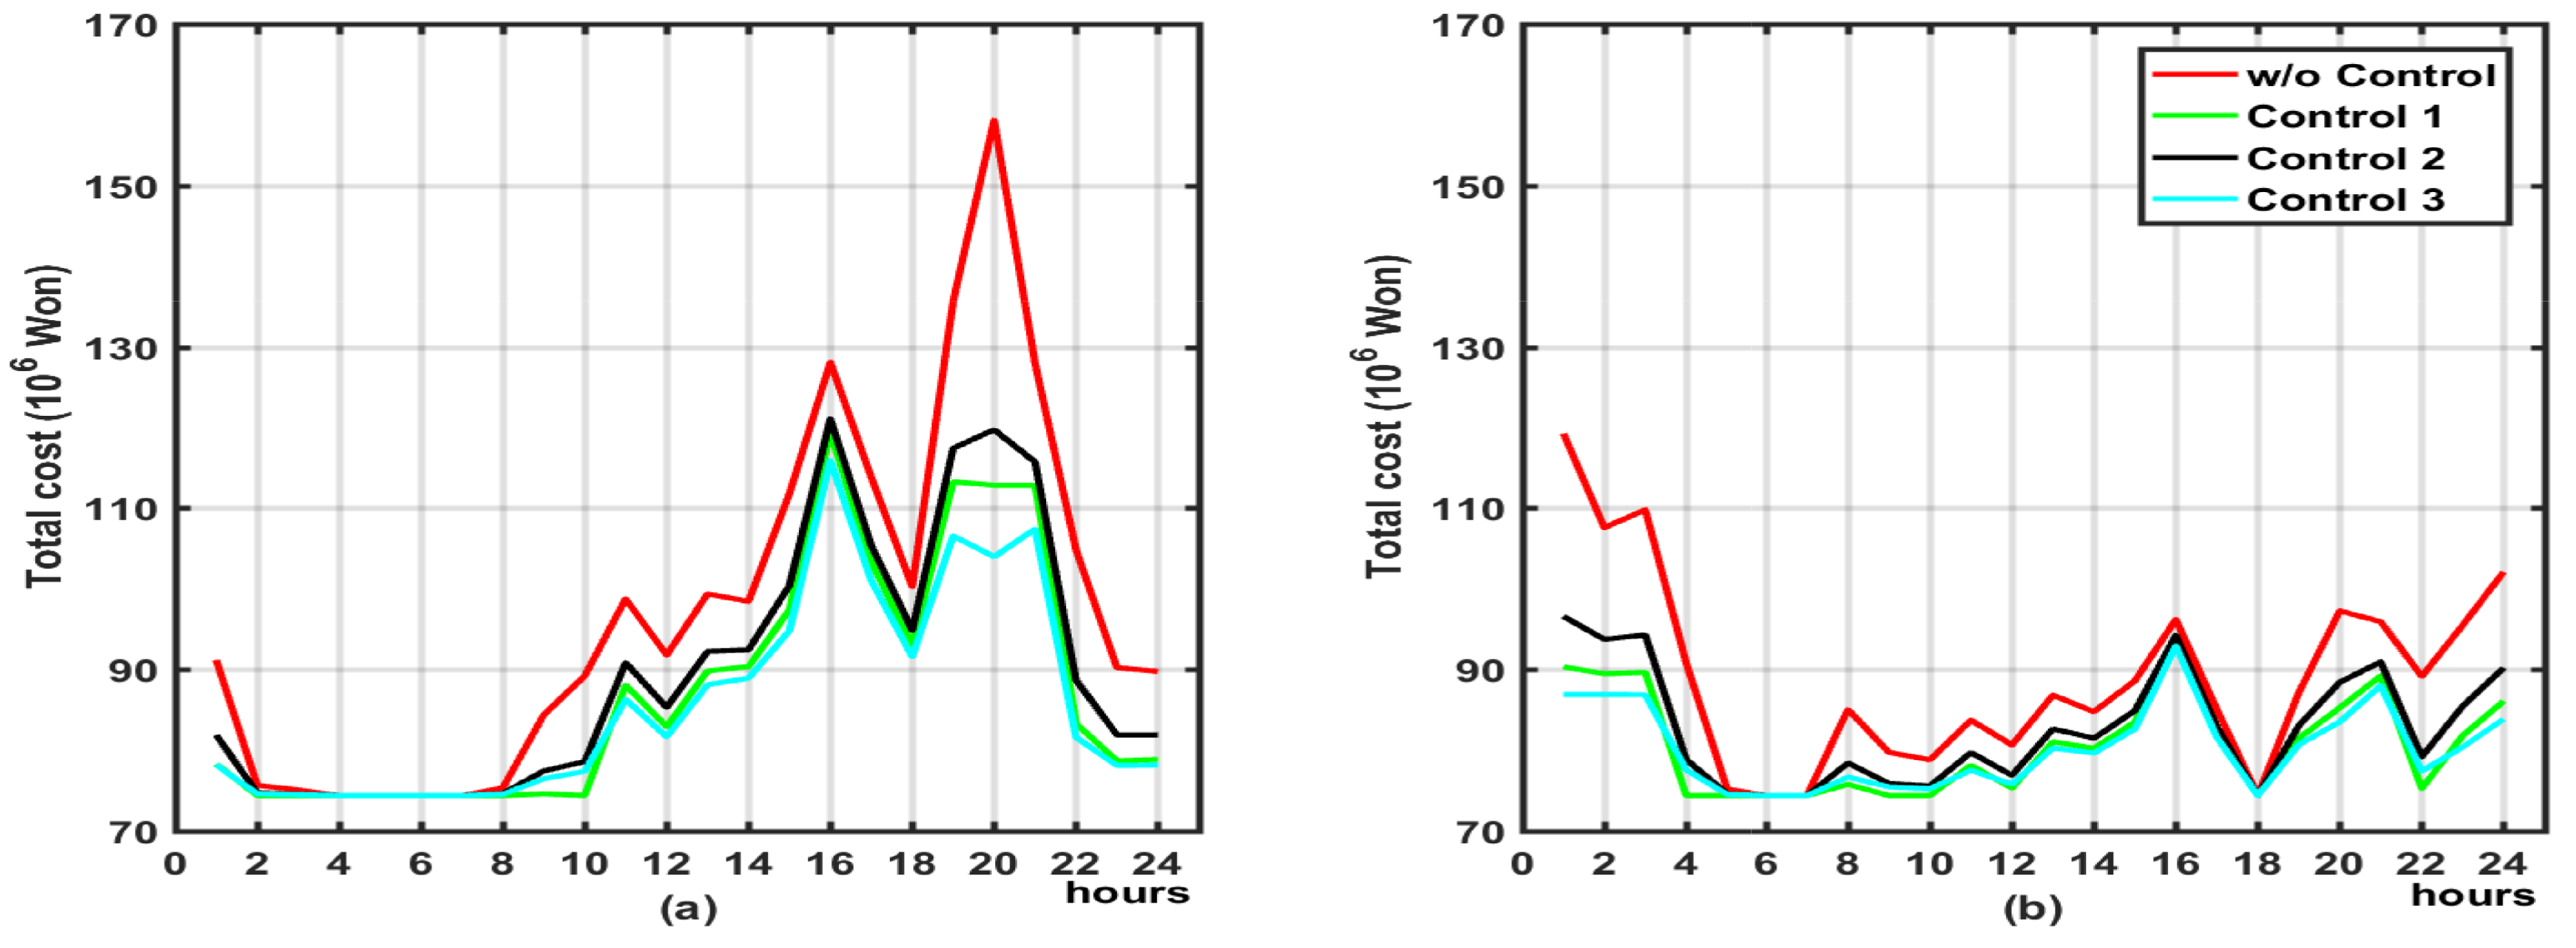
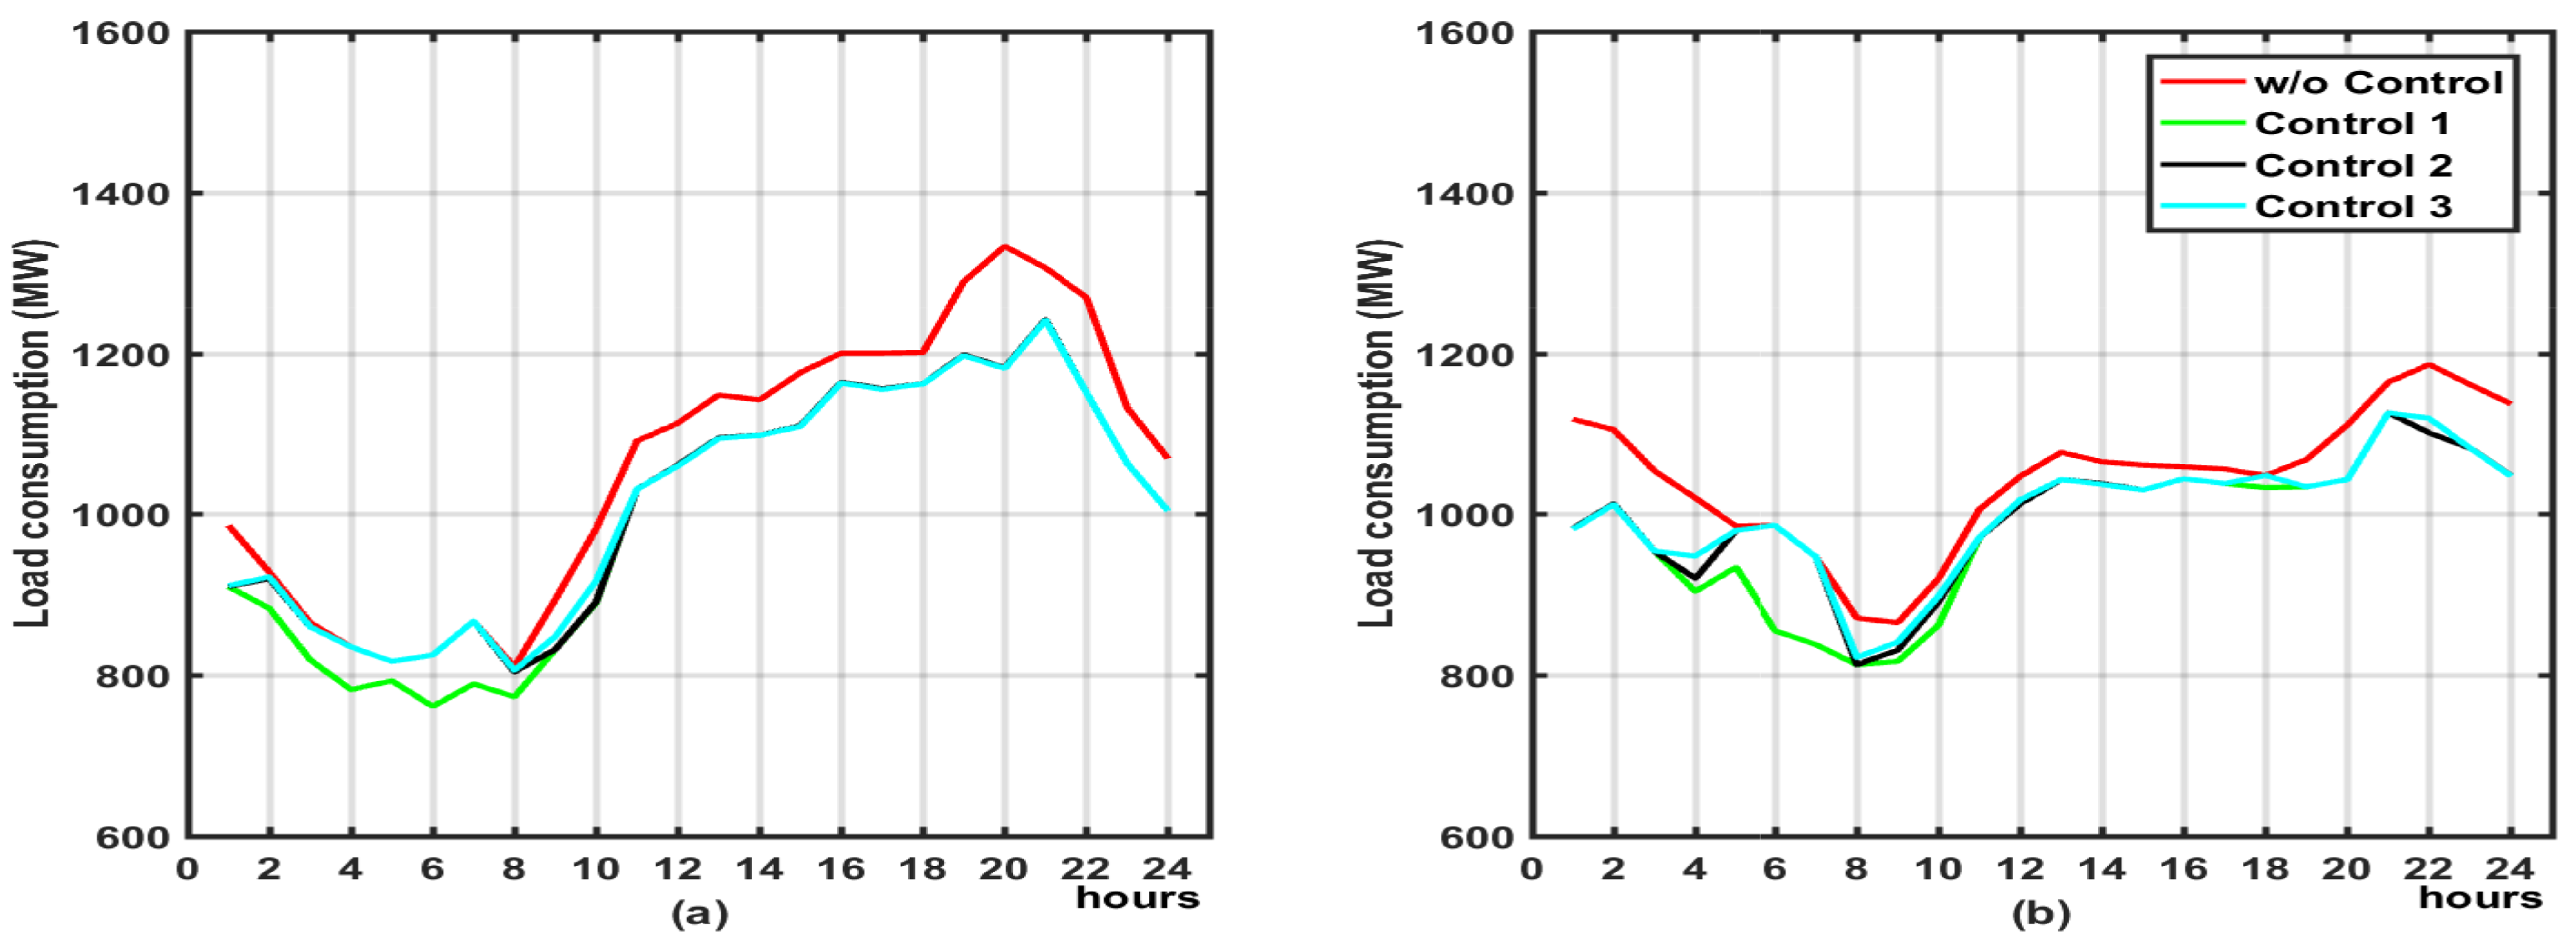
Load consumptions for each control method in Case 1 and Case 2 are shown in Figure 9. The load consumption for Control 1 is lowest because EV loads in Group 2 are turned off. Controls 2 and 3 are performed when the market price is high, and their demand curves are always less than or equal to the curve of w/o Control. Demand for Control 3 is slightly higher because V2G services of some EV aggregators can reduce the market price. The total costs during peak times in Case 1 are higher than those in Case 2 due to the effect of peak demand, while total costs during off-peak times in Case 2 are slightly higher than those in Case 1. Demand for Control 1 is lowest because EV loads in Group 2 are turned off. Total costs in Case 1 and Case 2 are shown in Figure 10.
5. Conclusions
The transition toward high renewable penetration in Jeju Island might adversely affect the stability and reliability of the power system because RES are inherently intermittent and are considered to be non-dispatchable. The day-ahead market is cleared based on the forecast of wind speed, solar radiation, pattern of the EV fleet, and load demand. However, the forecasting errors always exist in practice. Insufficient generation can be filled by more electricity production from conventional generating units, thus raising the overall grid operating costs. The V2G technology of EVs can help significantly reduce system costs without the use of non-additional fossil-fuel-fired generating units. Although each EV battery has small capacity and insignificant impact on the power system, geographically distributed EV fleets in several areas around the island can act as distributed generations (DG) and controllable loads, thus relieving the congestion and lowering the system marginal price.
This research formulated a security-constrained OPF by incorporating a charging/discharging strategy of aggregated EV fleets to minimize the total system costs while not compromising system security. This SCOPF should provide a systematic computation framework for critical decision-making in operations. It can be extended to adopt credible contingencies in order to meet the regional reliability performance standards. EV aggregators can participate in bidding based on the electricity market conditions, and can determine charging, waiting, or discharging according to market price based on their own cost curves. The effectiveness of the proposed approach was demonstrated through simulation studies for the Jeju electric power system, and the results by the control methods were compared. Bidirectional charging of EV batteries can be an attractive solution because it uses environmentally friendly and cost-effective technology, and also has operational flexibility at high renewable penetration. The proposed framework may be extended to effectively operate distributed ESSs and DG. Many issues at high renewable penetration (such as cost minimization, system loss minimization, frequency regulation, power smoothing, etc.) could be characterized as objective functions with practical constraints. It is expected that these efforts help expand business and operation models for EV aggregators and boost economic performance.
Acknowledgments
This work was supported by the Human Resources Development program of Korea Institute of Energy Technology Evaluation and Planning (KETEP) grant funded by Korea government Ministry of Trade, Industry and Energy(No. 20174030201540). This work was supported under the framework of international cooperation program managed by National Research Foundation of Korea(No. 2017K1A4A3013579).
Author Contributions
Kyungsung An has developed the study framework, conducted simulation studies, and written the paper under supervision of the corresponding author, Kyeon Hur. Kyung-Bin Song helped improve the theoretical aspects and practicality of this study.
Conflicts of Interest
The authors declare no conflict of interest.
Nomenclature
Day ahead | |
Real time | |
Generation cost of conventional unit | |
Operating cost of EV fleets | |
Total generation | |
Active power output of conventional unit | |
Active power output of wind power unit | |
Active power output of solar power unit | |
Total demand | |
Demand except EV loads | |
Demand of EV fleets | |
Active power output variation of conventional unit in real time | |
Ramp rate of conventional unit | |
Maximum active power limit of conventional unit | |
Minimum active power limit of conventional unit | |
Maximum active power limit of wind power unit | |
Minimum active power limit of wind power unit | |
Maximum active power limit of solar power unit | |
Minimum active power limit of solar power unit | |
Number of conventional units | |
Number of wind power units | |
Number of solar power units | |
Number of EV fleets | |
MVA flow on line | |
MVA flow limit on line | |
| V | Voltage magnitude |
Allowable maximum voltage magnitude | |
Allowable Minimum voltage magnitude | |
Number of EVs | |
Number of EVs in charging mode | |
Number of EVs in discharging mode | |
Number of EVs in waiting mode | |
Number of unplugged EVs | |
| B | Battery capacity of EV fleet |
| C | Charging of EV fleet |
| D | Discharging of EV fleet |
| SOC | State of charge |
Charging efficiency of EV battery | |
Discharging efficiency of EV battery | |
Effective inertia constant | |
| H | Rotational inertia constant of conventional unit |
MVA rating of unit | |
HVDC power transfer |
References
- Richardson, D.B. Electric vehicles and the electric grid: A review of modeling approaches, impacts, and renewable energy integration. Renew. Sust. Energy Rev. 2013, 19, 247–254. [Google Scholar] [CrossRef]
- Fang, X.; Misra, S.; Xue, G.; Yang, D. Smart grid—The new and improved power grid: A survey. IEEE Commun. Surv. Tutor. 2012, 14, 944–980. [Google Scholar] [CrossRef]
- Electric Power System Flexibility: Challenges and Opportunities; Technical Report 3002007374; Electric Power Research Institute (EPRI): Palo Alto, CA, USA, 2016.
- Lund, H.; Kempton, W. Integration of renewable energy into the transport and electricity sectors through V2G. Energy Policy 2008, 36, 3578–3587. [Google Scholar] [CrossRef]
- Vaya, M.G.; Andersson, G. Self scheduling of plug-in electric vehicle aggregator to provide balancing services for wind power. IEEE Trans. Sustain. Energy 2016, 7, 886–899. [Google Scholar] [CrossRef]
- Carrion, M.; Zarate-Minano, R. Operation of renewable-dominated power systems with a significant penetration of plug-in electric vehicles. Energy 2015, 90, 827–835. [Google Scholar] [CrossRef]
- Yilmaz, M.; Krein, P.T. Review of the impact of vehicle-to-grid technologies on distribution systems and utility interfaces. IEEE Trans. Power Electron. 2013, 28, 5673–5689. [Google Scholar] [CrossRef]
- Shafiee, S.; Fotuhi-Firuzabad, M.; Rastegar, M. Investigating the impacts of plug-in hybrid electric vehicles on power distribution systems. IEEE Trans. Smart Grid 2013, 4, 1351–1360. [Google Scholar] [CrossRef]
- Ortega-Vazquez, M.A.; Bouffard, F.; Silva, V. Electric vehicle aggregator/system operator coordination for charging scheduling and services procurement. IEEE Trans. Power Syst. 2013, 28, 1806–1815. [Google Scholar] [CrossRef]
- Schuller, A.; Dietz, B.; Flath, C.M.; Weinhardt, C. Charging strategies for battery electric vehicles: Economic benchmark and V2G potential. IEEE Trans. Power Syst. 2014, 29, 2014–2022. [Google Scholar] [CrossRef]
- Sharma, I.; Cañizares, C.; Bhattacharya, K. Smart charging of PEVs penetrating into residential distribution systems. IEEE Trans. Smart Grid 2014, 5, 1196–1209. [Google Scholar] [CrossRef]
- Zhou, L.; Li, F.; Gu, C.; Hu, Z.; Blond, S.L. Cost/benefit assessment of a smart distribution system with intelligent electric vehicle charging. IEEE Trans. Smart Grid 2014, 5, 839–847. [Google Scholar] [CrossRef]
- Tuttle, D.P.; Baldick, R. The Evolution of plug-in electric vehicle-grid interactions. IEEE Trans. Smart Grid 2012, 3, 500–505. [Google Scholar] [CrossRef]
- Deilami, S.; Masoum, A.S.; Moses, P.S.; Masoum, M.A.S. Real-time coordination of plug-in electric vehicle charging in smart grids to minimize power losses and improve voltage profile. IEEE Trans. Smart Grid 2011, 2, 456–467. [Google Scholar] [CrossRef]
- Chukwu, U.C.; Mahajan, S.M. Real-time management of power systems with V2G facility for smart-grid applications. IEEE Trans. Sustain. Energy 2014, 5, 558–566. [Google Scholar] [CrossRef]
- Energy and Climate Change; Technical Report; International Energy Agency (IEA): Paris, France, 2015.
- Boyd, R.; Turner, J.; Ward, B. Tracking intended nationally determined contributions: what are the implications for greenhouse gas emissions in 2030; Policy Paper; Centre for Climate Change Economics and Policy and Grantham Research Institute on Climate Change and the Environment: London, UK, 2015. [Google Scholar]
- Boot, P.A.; van Bree, B. A Zero-Carbon European Power System in 2050: Proposals for a Policy Package; Technical Report ECN-E-10-041; Energy Research Centre of The Netherlands (ECN): Petten, The Netherlands, 2010. [Google Scholar]
- Korea Smart Grid Institute. Available online: www.smartgrid.or.kr (accessed on 27 March 2017).
- Smart grid in Korea; Technical Report; Ministry of Knowledge Economy and Korea Smart Grid Institute: Seoul, Korea, 2013.
- Carbon Free Island Jeju by 2030; Technical Report; Ministry of Knowledge Economy and Korea Smart Grid Institute: Seoul, Korea, 2015.
- Kundur, P. Power System Stability and Control; McGraw-Hill: New York, NY, USA, 1994. [Google Scholar]
- Papathanassiou, S.; Boulaxis, N. Power limitations and energy yield calculation for wind farms operating in island systems. Renew. Energy 2006, 31, 457–479. [Google Scholar] [CrossRef]
- Park, J.W.; Park, Y.H.; Moon, S.I. Instantaneous wind power penetration in Jeju Island. In Proceedings of the Power and Energy Society General Meeting—Conversion and Delivery of Electrical Energy in the 21st Century, Pittsburgh, PA, USA, 2008. [Google Scholar]
- Yoon, M.; Yoon, Y.T.; Jang, G. A study on maximum wind power penetration limit in island power system considering high-voltage direct current interconnections. Energies 2015, 8, 14244–14259. [Google Scholar] [CrossRef]
- Ott, A.L. Experience with PJM market operation, system design, and implementation. IEEE Trans. Power Syst. 2003, 18, 528–534. [Google Scholar] [CrossRef]
- Wu, T.; Rothleder, M.; Alaywan, Z.; Papalexopoulos, A.D. Pricing energy and ancillary services in integrated market systems by an optimal power flow. IEEE Trans. Power Syst. 2004, 19, 339–347. [Google Scholar] [CrossRef]
- Duvall, M.; Knipping, E.; Alexander, M. Environmental Assessment of Plug-in Hybrid Electric Vehicles-Nationwide Greenhouse Gas Emissions; Technical Report 1015325; Electric Power Research Institute (EPRI): Palo Alto, CA, USA, 2007. [Google Scholar]
- The 7-th Basic Plan for Long Term Electricity Supply & Demand (2015–2029); Technical Report; Ministry of Knowledge Economy: Seoul, Korea, 2015.
- Analysis for Impact of EVs and Wind Power Plants on Jeju Power System; Technical Report; Korea Power Exchange: Jeju Island, Korea, 2016.
- National Climate Data Service System of South Korea. Available online: http://sts.kma.go.kr/ (accessed on 27 March 2017).
- Medium & Long Term Comprehensive Plan for Electric Vehicles (2015–2030); Technical Report; Jeju Special Self-Governing Province: Jeju Island, Korea, 2015.
- Zimmerman, R.D.; Murillo-Sanchez, C.E.; Thomas, R.J. MATPOWER’s extensible optimal power flow architecture. In Proceedings of the 2009 IEEE Power Energy Society General Meeting, Calgary, AB, Canada, 2009. [Google Scholar]
- A Research of EV Charging Infrastructure Distribution; Technical Report; Korea Smart Grid Institute: Seoul, Korea, 2011.
- Kim, J.H.; Kim, C.H. Smart EVs charging scheme for load leveling considering ToU price and actual data. J. Electr. Eng. Technol. 2017, 12, 1–10. [Google Scholar] [CrossRef]
Figure 1.
Configuration of the proposed framework. SOC: state-of-charge; G2V: grid-to-vehicle; V2G: vehicle-to-grid; ISO: independent system operator; EV: electric vehicle.
Figure 1.
Configuration of the proposed framework. SOC: state-of-charge; G2V: grid-to-vehicle; V2G: vehicle-to-grid; ISO: independent system operator; EV: electric vehicle.
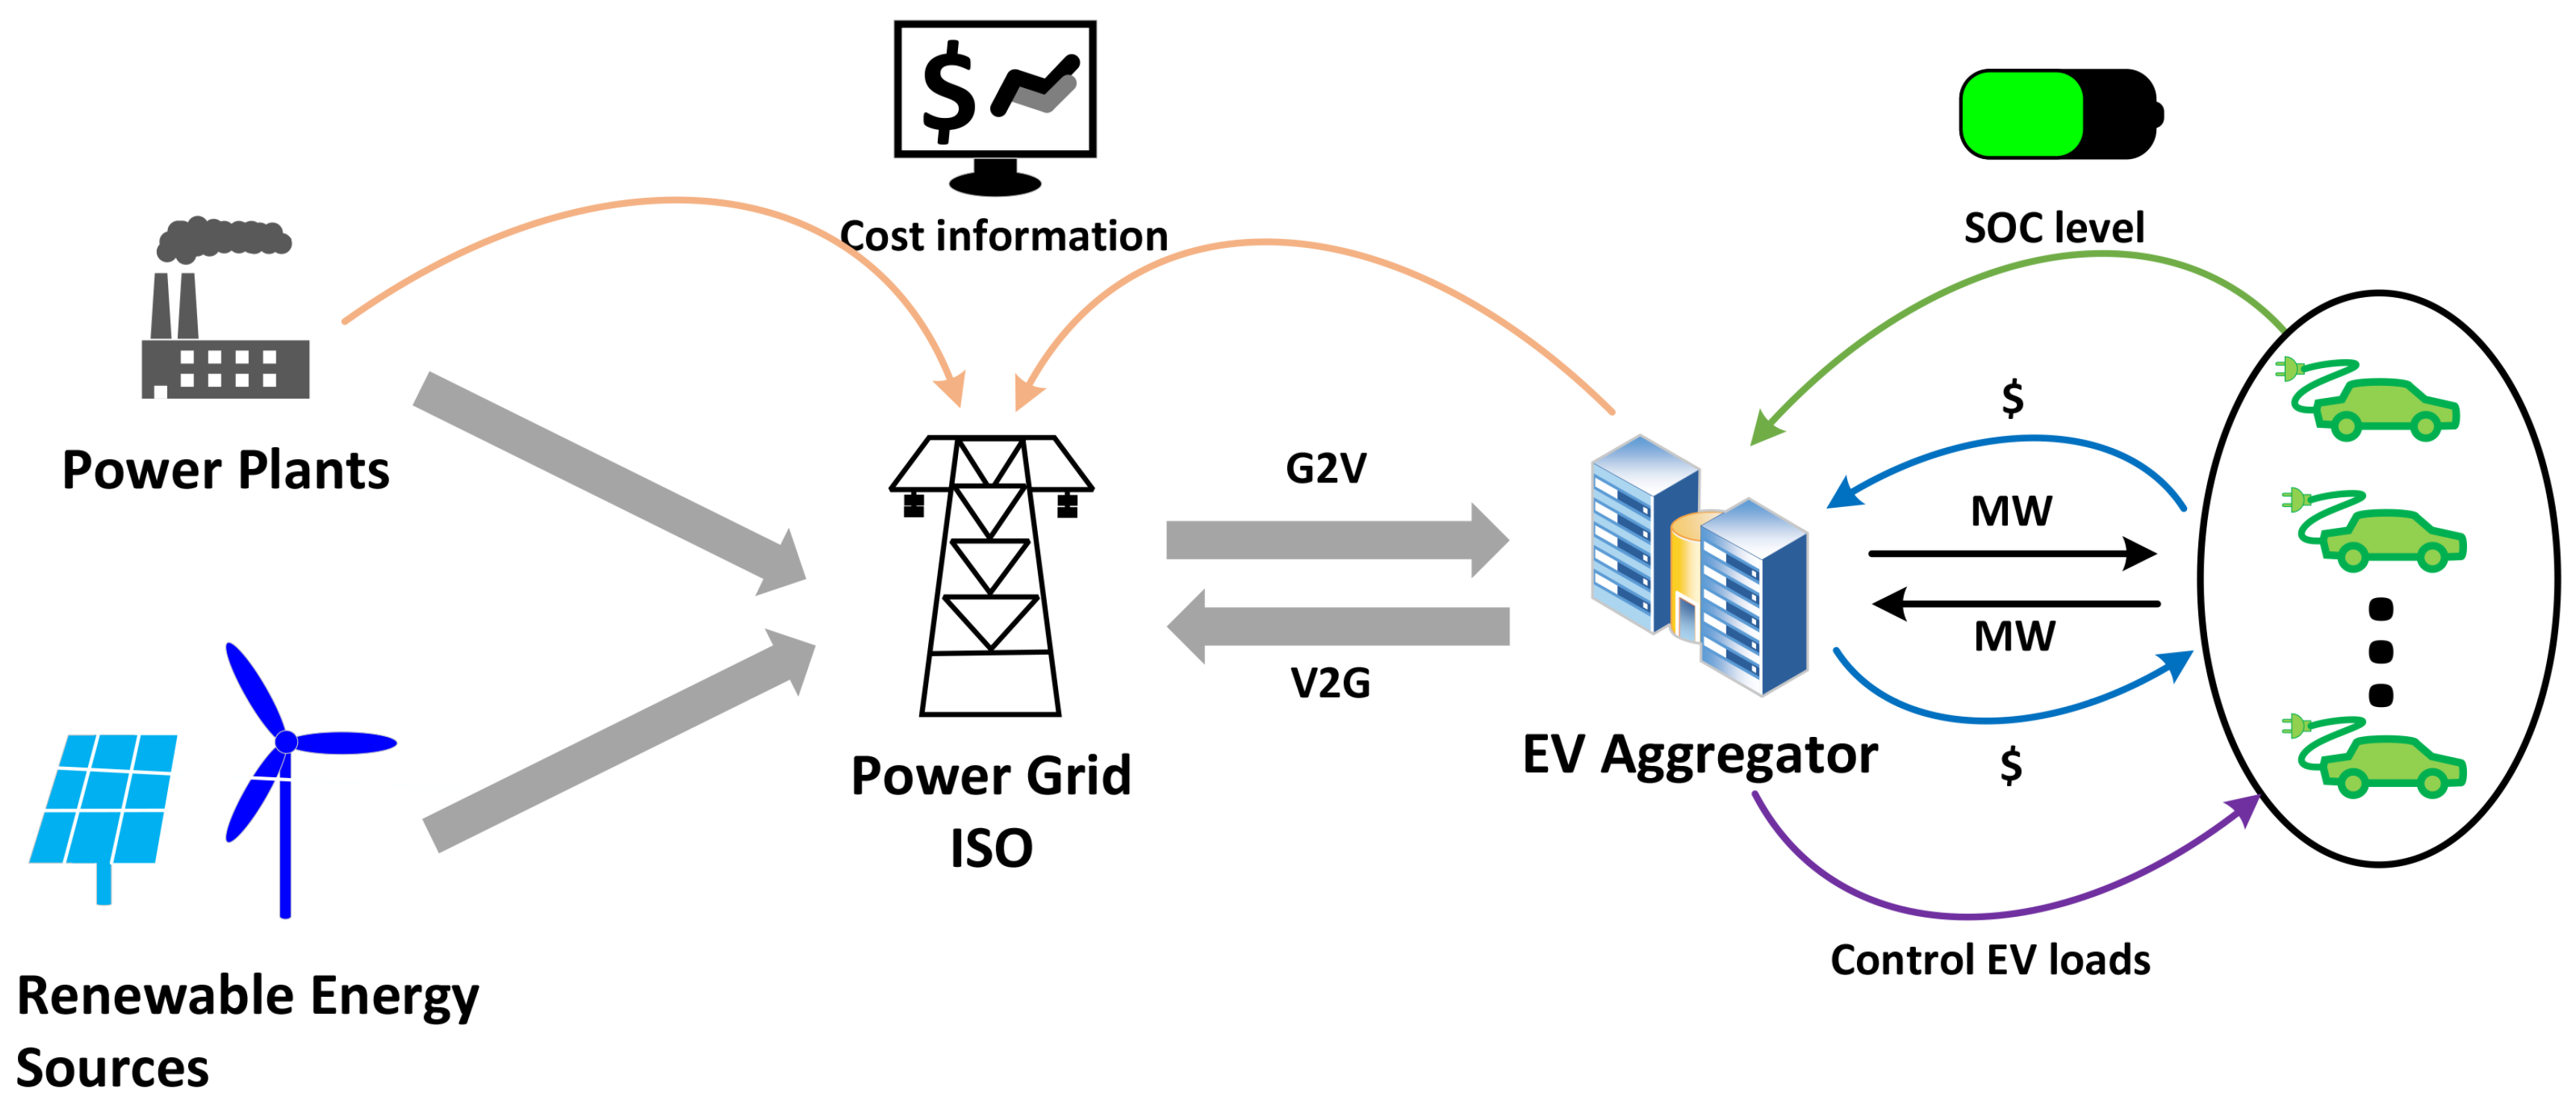
Figure 2.
Jeju Island power system diagram. HVDC: high-voltage direct current.
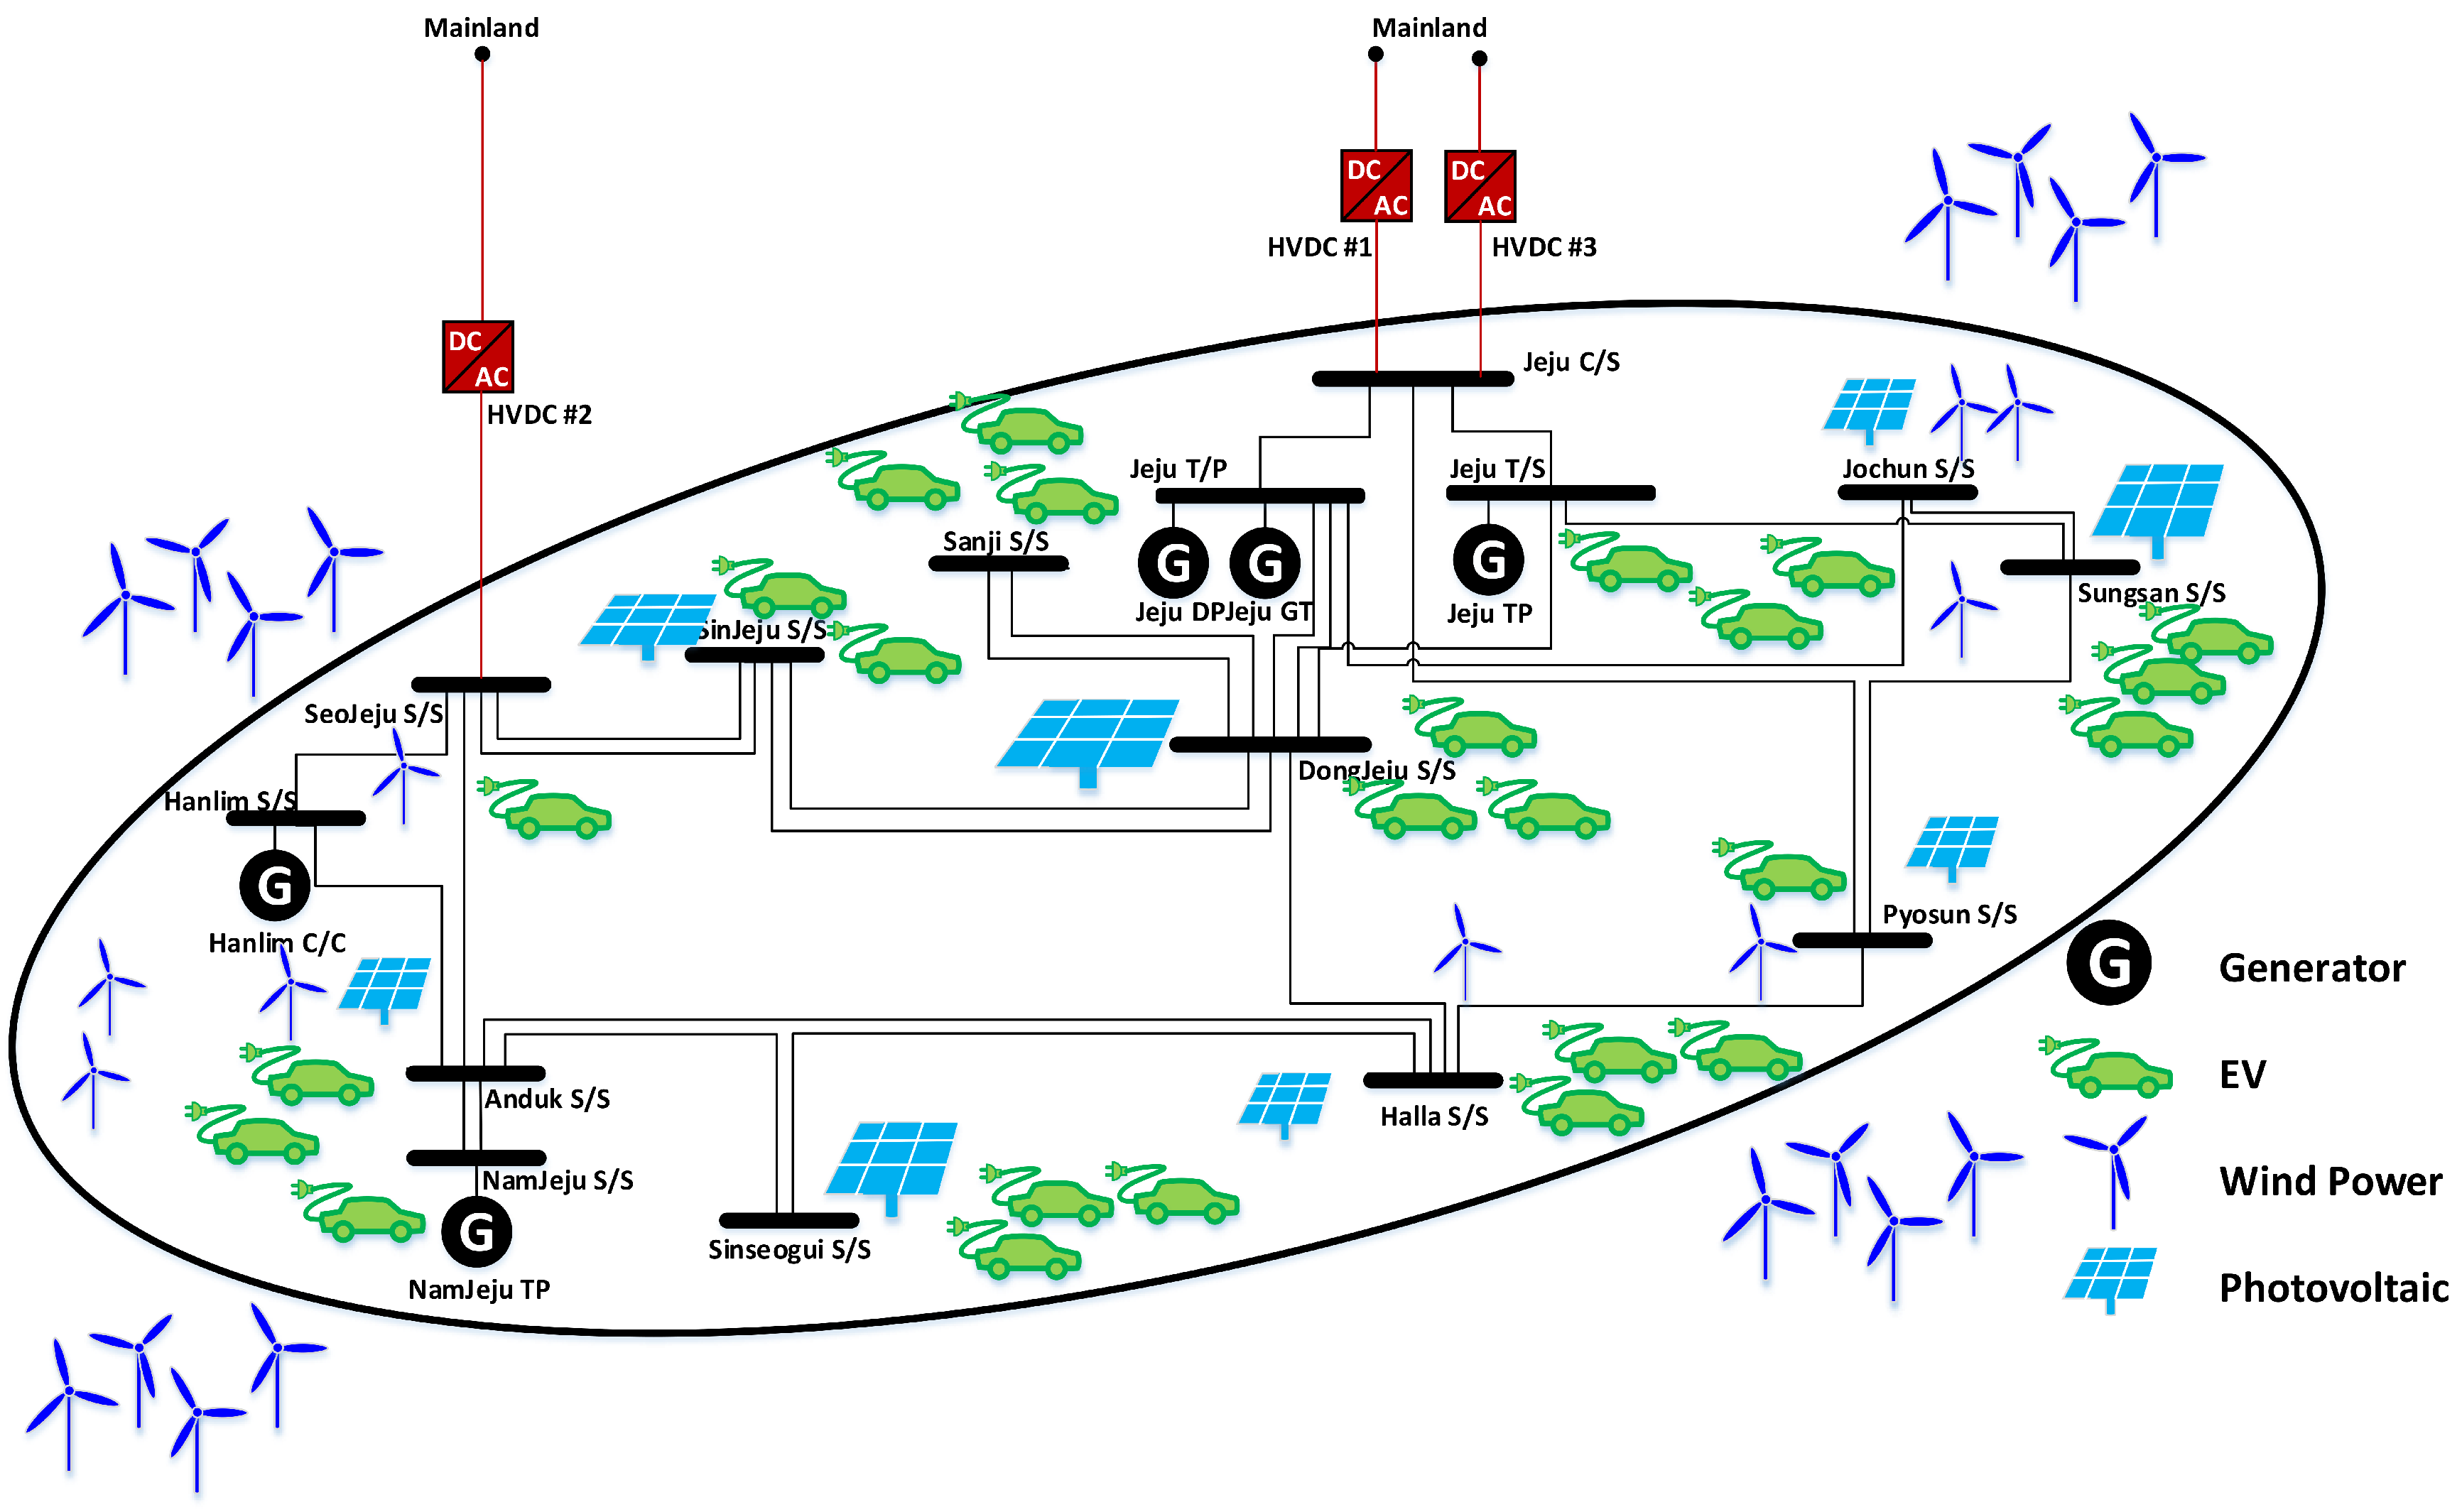
Figure 3.
Hourly wind power generation on Jeju Island.

Figure 4.
Hourly demand on Jeju Island.

Figure 5.
EV demand according to charging methods.
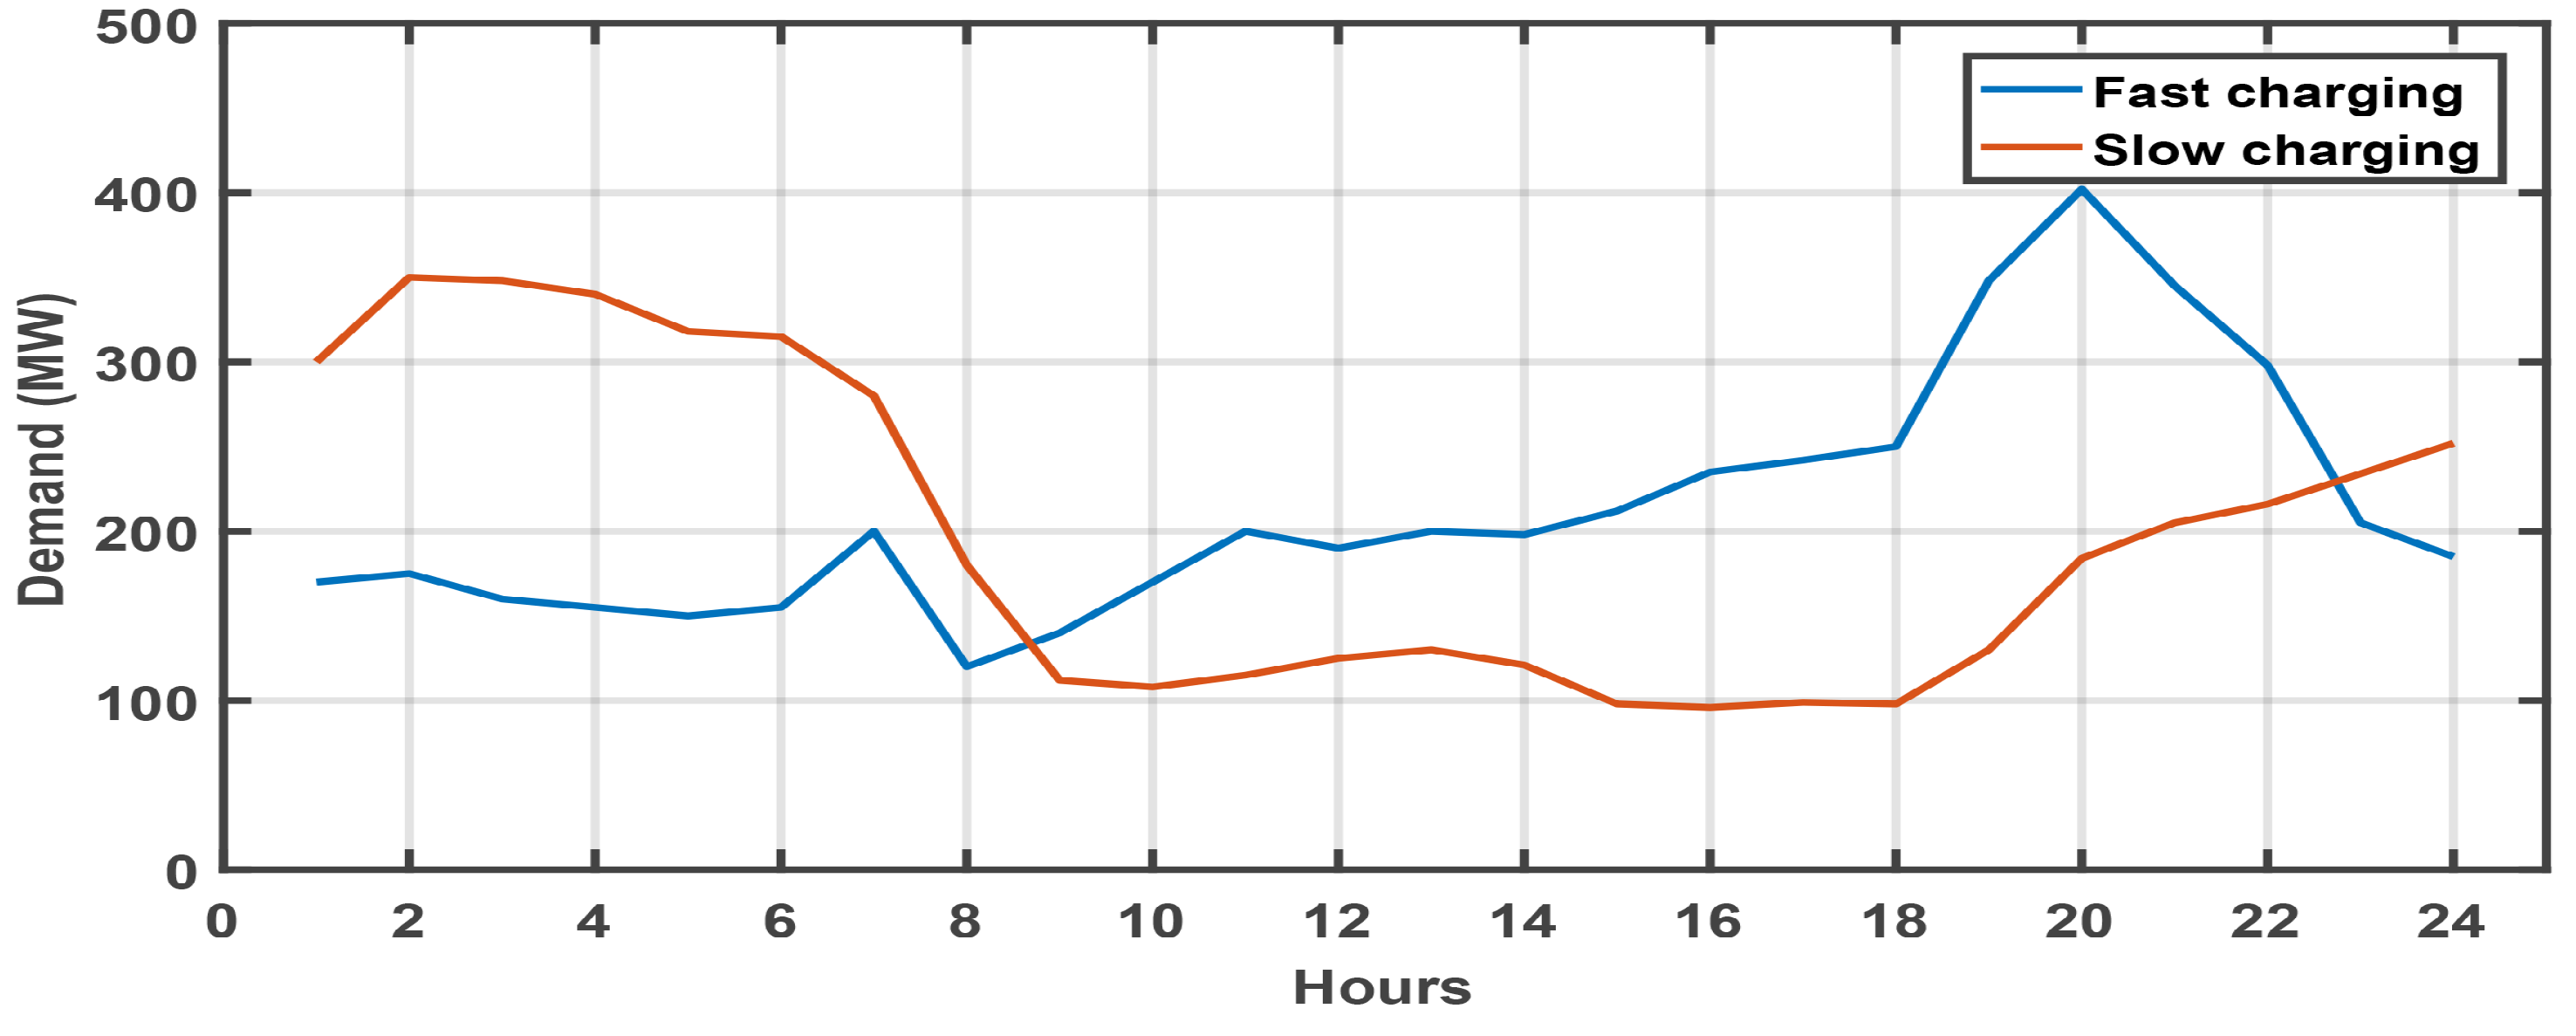
Figure 6.
Cost curve for EV in charging and discharging modes.
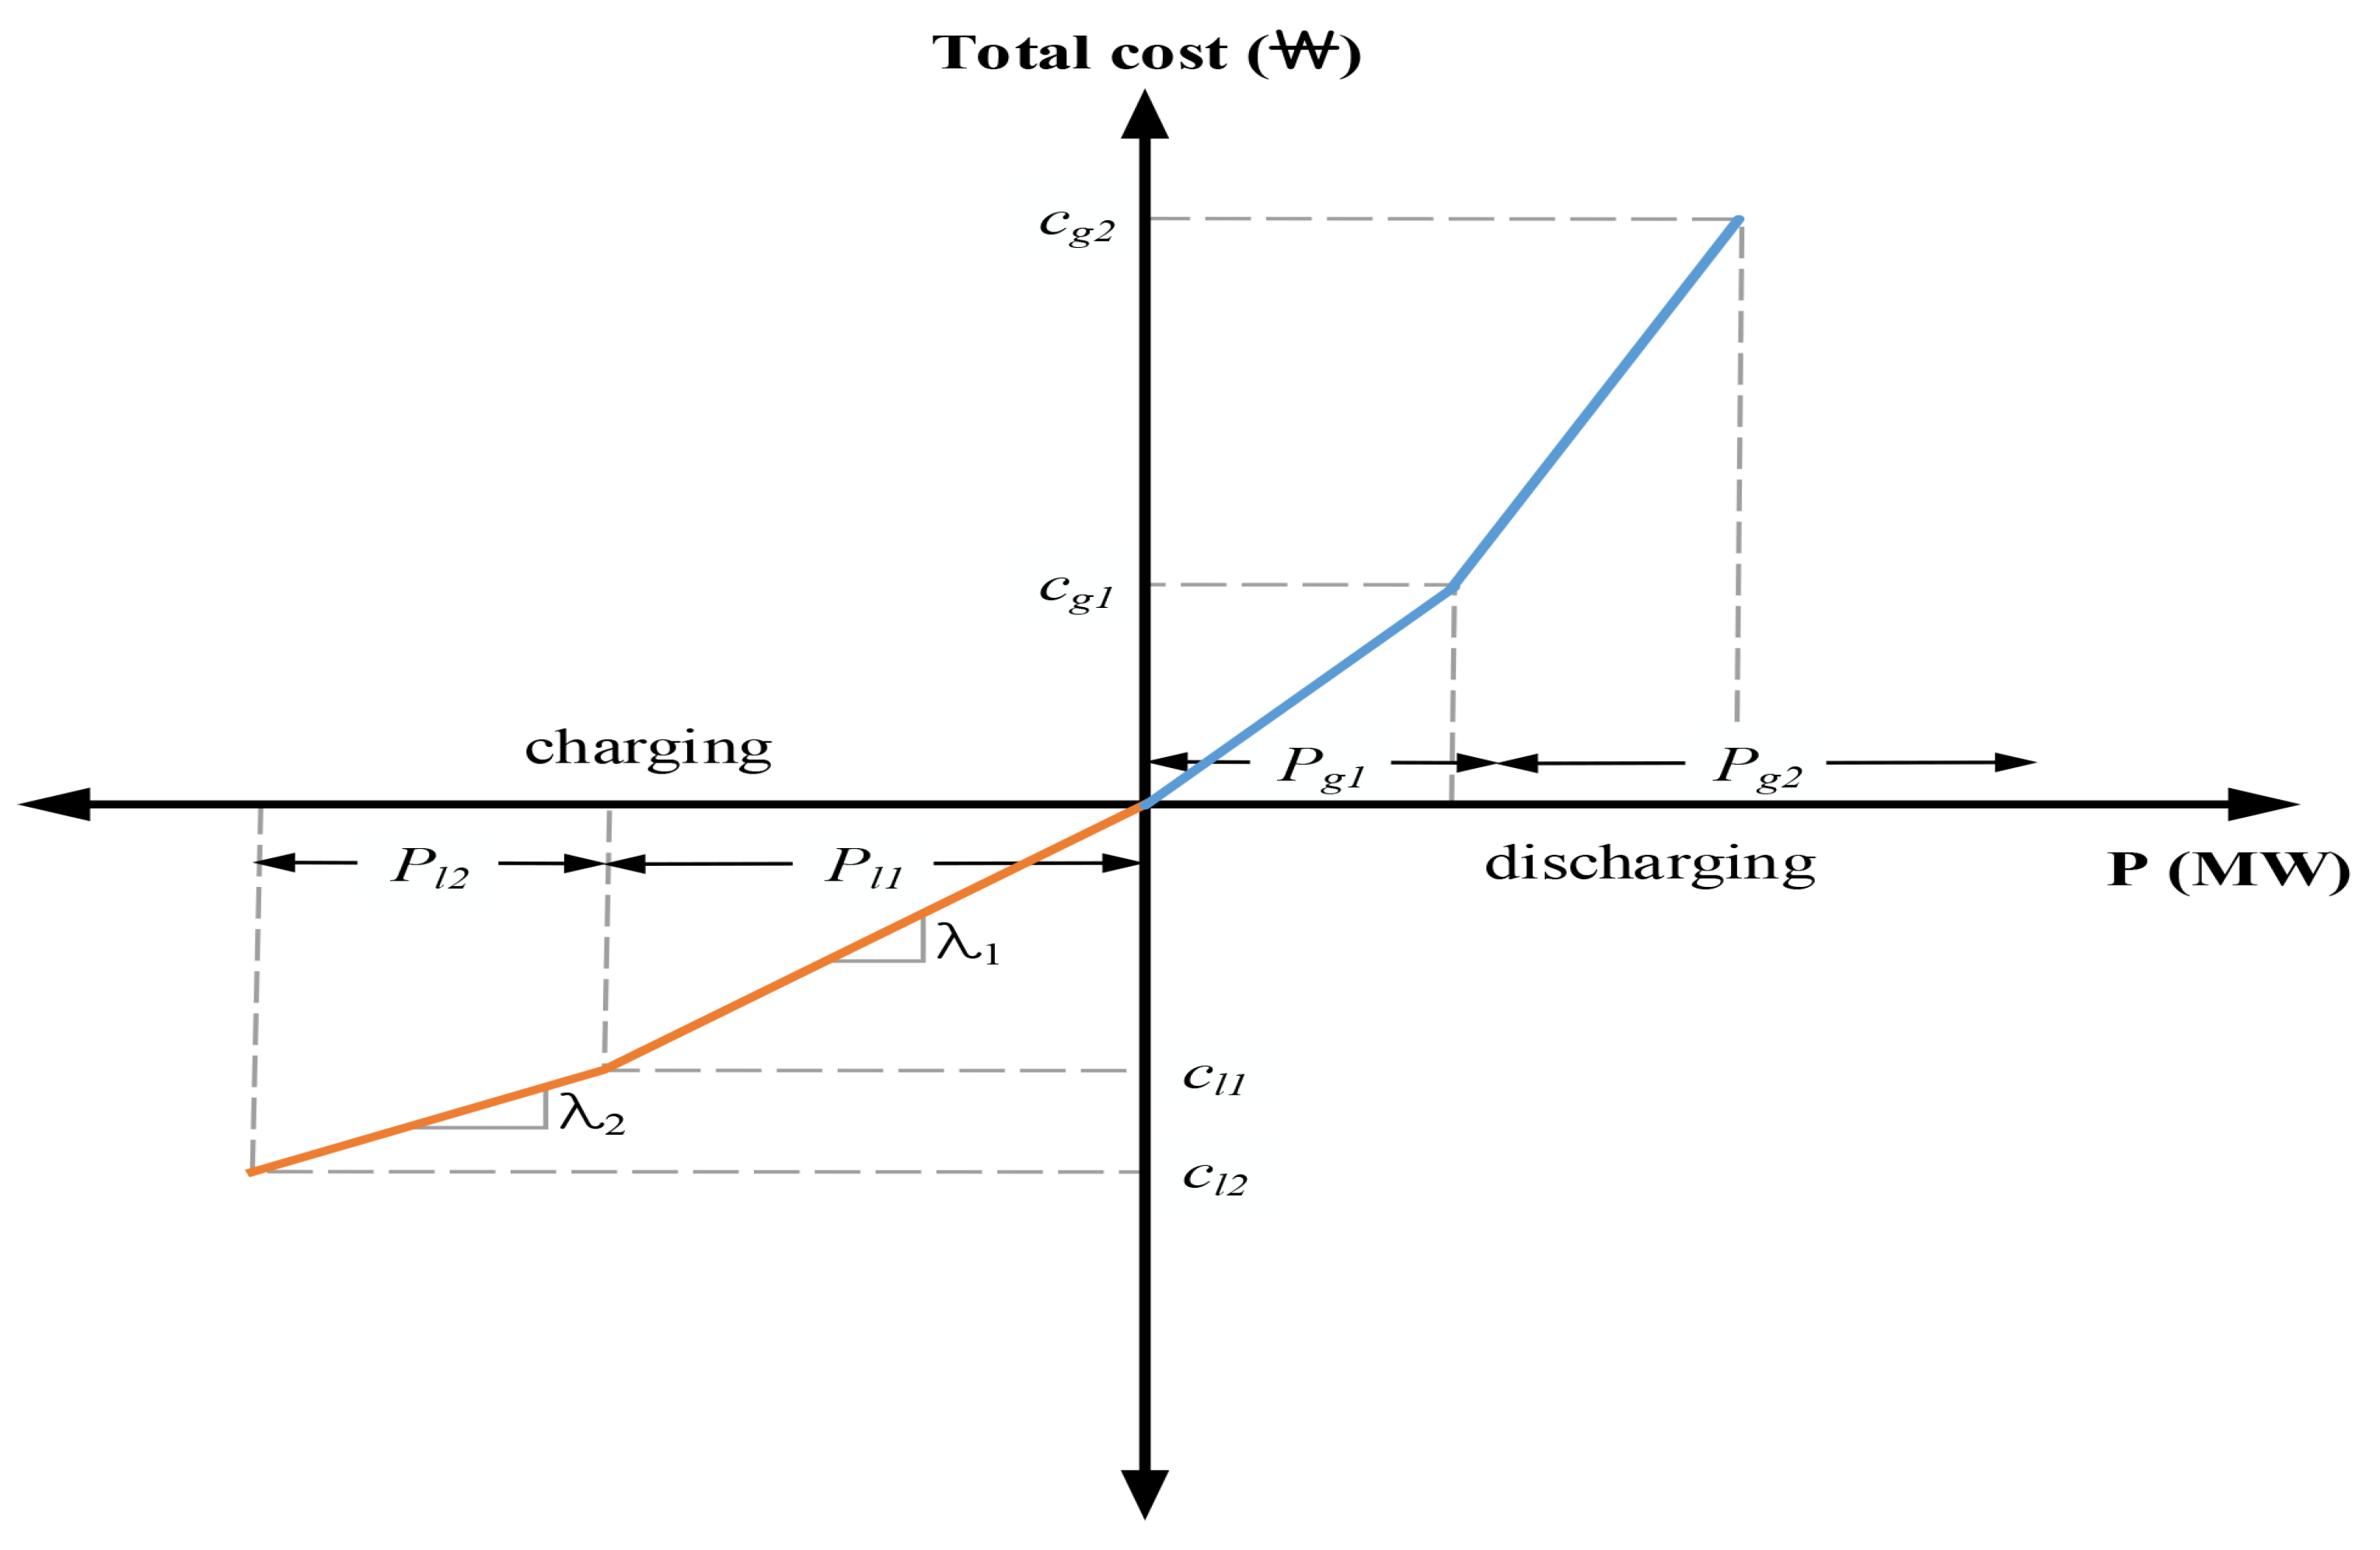
Figure 7.
(Case 1) Demand and generation mix for: (a) w/o Control; (b) Control 1; (c) Control 2; and (d) Control 3.
Figure 7.
(Case 1) Demand and generation mix for: (a) w/o Control; (b) Control 1; (c) Control 2; and (d) Control 3.

Figure 8.
(Case 2) Demand and generation mix for: (a) w/o Control; (b) Control 1; (c) Control 2; and (d) Control 3.
Figure 8.
(Case 2) Demand and generation mix for: (a) w/o Control; (b) Control 1; (c) Control 2; and (d) Control 3.

Figure 9.
Load consumptions in: (a) Case 1 and (b) Case 2.

Figure 10.
Total costs of EV controls in: (a) Case 1 and (b) Case 2.

Table 1.
Generators in the Jeju power system.
| Generator | (MW) | (MW) | Inertia (H) | R.R (MW/min) | Rating (MVA) |
|---|---|---|---|---|---|
| Jeju GT #1 | - | - | 2.6 | - | 50 |
| Jeju GT #2 | - | - | 2.6 | - | 50 |
| Jeju DP #1 | 26 | 40 | 6.7 | 2.0 | 45 |
| Jeju DP #2 | 26 | 40 | 6.7 | 2.0 | 45 |
| Jeju TP #1 | 42 | 75 | 5.4 | 1.0 | 97 |
| Jeju TP #2 | 42 | 75 | 5.4 | 1.0 | 97 |
| NamJeju TP #1 | 50 | 100 | 5.9 | 5.0 | 130 |
| NamJeju TP #2 | 50 | 100 | 5.9 | 5.0 | 130 |
| Hanlim CC | 41 | 105 | 6.0 | 8.7 | 150 |
| Jeju LNG | 60 | 200 | 6.0 | 5.0 | 250 |
| Total | 337 | 735 | - | 29.7 | - |
© 2017 by the authors. Licensee MDPI, Basel, Switzerland. This article is an open access article distributed under the terms and conditions of the Creative Commons Attribution (CC BY) license (http://creativecommons.org/licenses/by/4.0/).
Share and Cite
MDPI and ACS Style
An, K.; Song, K.-B.; Hur, K. Incorporating Charging/Discharging Strategy of Electric Vehicles into Security-Constrained Optimal Power Flow to Support High Renewable Penetration. Energies 2017, 10, 729. https://doi.org/10.3390/en10050729
AMA Style
An K, Song K-B, Hur K. Incorporating Charging/Discharging Strategy of Electric Vehicles into Security-Constrained Optimal Power Flow to Support High Renewable Penetration. Energies. 2017; 10(5):729. https://doi.org/10.3390/en10050729
Chicago/Turabian StyleAn, Kyungsung, Kyung-Bin Song, and Kyeon Hur. 2017. "Incorporating Charging/Discharging Strategy of Electric Vehicles into Security-Constrained Optimal Power Flow to Support High Renewable Penetration" Energies 10, no. 5: 729. https://doi.org/10.3390/en10050729
Note that from the first issue of 2016, this journal uses article numbers instead of page numbers. See further details here.