Article

Determination of Equivalent Thermal Conductivity of Window Spacers in Consideration of Condensation Prevention and Energy Saving Performance

1
Department of Architecture, Seoul National University, Seoul 08826, Korea
2
Department of Architectural Engineering, Pukyong National University, Busan 48513, Korea
3
Building Business Unit, Division of Construction, Samsung C&T Corporation, Gyeonggi-do 13530, Korea
*
Author to whom correspondence should be addressed.
Energies 2017, 10(5), 717; https://doi.org/10.3390/en10050717
Submission received: 18 April 2017 / Revised: 15 May 2017 / Accepted: 17 May 2017 / Published: 18 May 2017

Abstract

:
This study investigated the impact of thermally improved spacers (TISs) on the condensation prevention and energy saving performances of residential windows. The temperature factor and total U-value were analyzed with the two-box model, by which the TISs are represented with the equivalent thermal conductivity. The results showed that the TISs could increase the temperature factor by up to 12%, and this significantly improved the condensation prevention performance. In addition, it was proved that the TIS enables the prevention of the condensation at an outdoor temperature that is 4.2 °C to 15.7 °C lower compared with the conventional spacer. Also, it was shown that the TISs reduce the total U-value by an amount from 0.07 W/m2K to 0.12 W/m2K, implying that the heat loss through the window is reduced by a rate from 2.8% to 8.2%. In addition, the results of the whole building energy simulation proved that the TISs can reduce the annual heating-energy consumption by a rate from 3.0% to 6.3%. The results were then used for the development of monographs to determine the equivalent thermal conductivity of a window spacer that can meet the performance criteria in terms of condensation prevention and energy saving.

1. Introduction

Windows are one of the weakest points in building envelopes from the viewpoint of the thermal insulation [1,2]. It is therefore important to enhance the thermal performances of windows to reduce the heat loss through windows, which can contribute to the reduction of not only condensation risks, but also the total heating energy of a building. In the window elements, the heat loss is particularly large at the edge region where thermal bridges can be created due to the adjoining frame and glazing. As thermal bridges usually result in increased heating/cooling load, condensation risks and the mould growth in the heating season [3], the heat loss at the edge region should be minimized by applying highly-insulated window spacers, as well as high-performance glazing [4].
In particular, residential buildings are prone to condensation risks due to the high moisture levels that are generated by the occupants’ respiration or activities [5]. As the condensation can deteriorate not only the building durability but also occupants’ health, many studies have suggested methods to avoid the condensation; for example, insulative window spacers [4], improved window frame using a material with low-thermal conductivity [6], double window system with ventilation slits [7], dynamic insulation windows using airflows [8], and so on. As for the energy aspect, the energy regulations of low-energy residential buildings now demand a high-insulation performance regarding the building envelopes, which can be achieved by improving the thermal insulation and/or air-tightness of the windows [9,10,11,12,13,14,15,16].
Among the recent technologies for improving window performances, thermally improved spacers (TISs) are one of practical solutions to reduce the condensation risk and heat loss of insulated glazing units (IGUs) [17]. The TISs are particularly effective to reduce the heat transfer through the edge region of the window. It should also be noted that the effect of the edge loss becomes more influential as windows are improved with low-e coatings and gas fills [18]. The impact of the spacer on the heat loss and the surface condensation might be significant, especially in the cases of high-performance glazing units such as low-e-coated or gas-filled windows [19]. As a result, the TIS technology has been increasingly applied to the IGUs of residential buildings [4].
Elmahdy demonstrated that, relative to windows with conventional metal spacers, the TIS application results in higher surface temperatures at the edge-of-glass region, which improves the condensation resistance and the overall R-value [20]. Carpenter and McGowan showed that the use of an insulating spacer can reduce the total U-value of a standard double-glazed wood-frame window by 6% compared with the traditional aluminium spacer [21]. In addition, it was also reported that the application of the insulating spacer can reduce the total U-value of high-performance windows such as a double low-e-coated glazing by 12%. Song et al. evaluated the effect of two TIS types (thermally broken aluminium spacer and thick-walled plastic spacer) on the inside surface condensation in a double-glazing window system. It was claimed that the TISs increased the lowest inside surface temperature by up to 3.1 °C and the inside air humidity for the condensation prevention was increased by up to 11% compared with the conventional aluminum spacer [4]. Gustavsen et al. showed that the changing of the effective spacer conductivity from 10 W/mK to 0.25 W/mK resulted in the reduction of the frame U-value by more than 18%. It was also claimed that a further reduction of the effective spacer conductivity—for example, 0.25 W/mK to 0.05 W/mK—can reduce the frame U-value and the edge-of-glass U-value by 10% and 8%, respectively [1]. Baldinelli et al. demonstrated that, for a wooden window, the modification of the aluminum spacer with a warm spacer (plastic material) can reduce the total U-value by approximately 18% [22].
Regarding the analysis methods for window spacers, Elmahdy and Frank conducted numerical and experimental studies to investigate the impact of four different spacers (aluminum spacer, corrugated metal spacer, silicone foam spacer, and thermally broken metal spacer) on the glass-surface temperature and the heat flow through the edge region. The discrepancy between the calculated and measured values is less than 4%, which led to a conclusion that the numerical simulation can be a very helpful tool in the provision of the data for simplified window-calculation procedures [19]. Gustavsen et al. investigated the total U-value and the interior-surface temperature of windows with insulating spacers through numerical simulations and hot-box experiments; here, it was proved that the simulated thermal performances showed a sound agreement with the real measured results, even though the numerical simulations resulted in a larger difference of the total U-value between the traditional spacers and the insulating spacers [23]. Based on the literature study, Maref et al. presented the following claims: The effect of the spacer should not be underestimated, the difference between different types of spacers is significant, and numerical simulations can be used to predict the effects of spacers [24].
The previous studies mainly investigated the impact of the TIS on the heat transmittance or the indoor-surface temperature at the edge region. It was clearly shown that the TIS can contribute to the improvement of the thermal insulation or the condensation resistance. Only a few studies, however, have examined how the TIS affects both the condensation resistance and the total U-value. Also, there have been few examples of the TIS impact on the maximum heating load or annual heating energy consumption, because the thermal performance of the TIS was evaluated with regard to the total U-value. Moreover, in the current design process for windows, there is no rule of selecting a proper window spacer that can meet not only energy-saving regulation but also condensation prevention criteria.
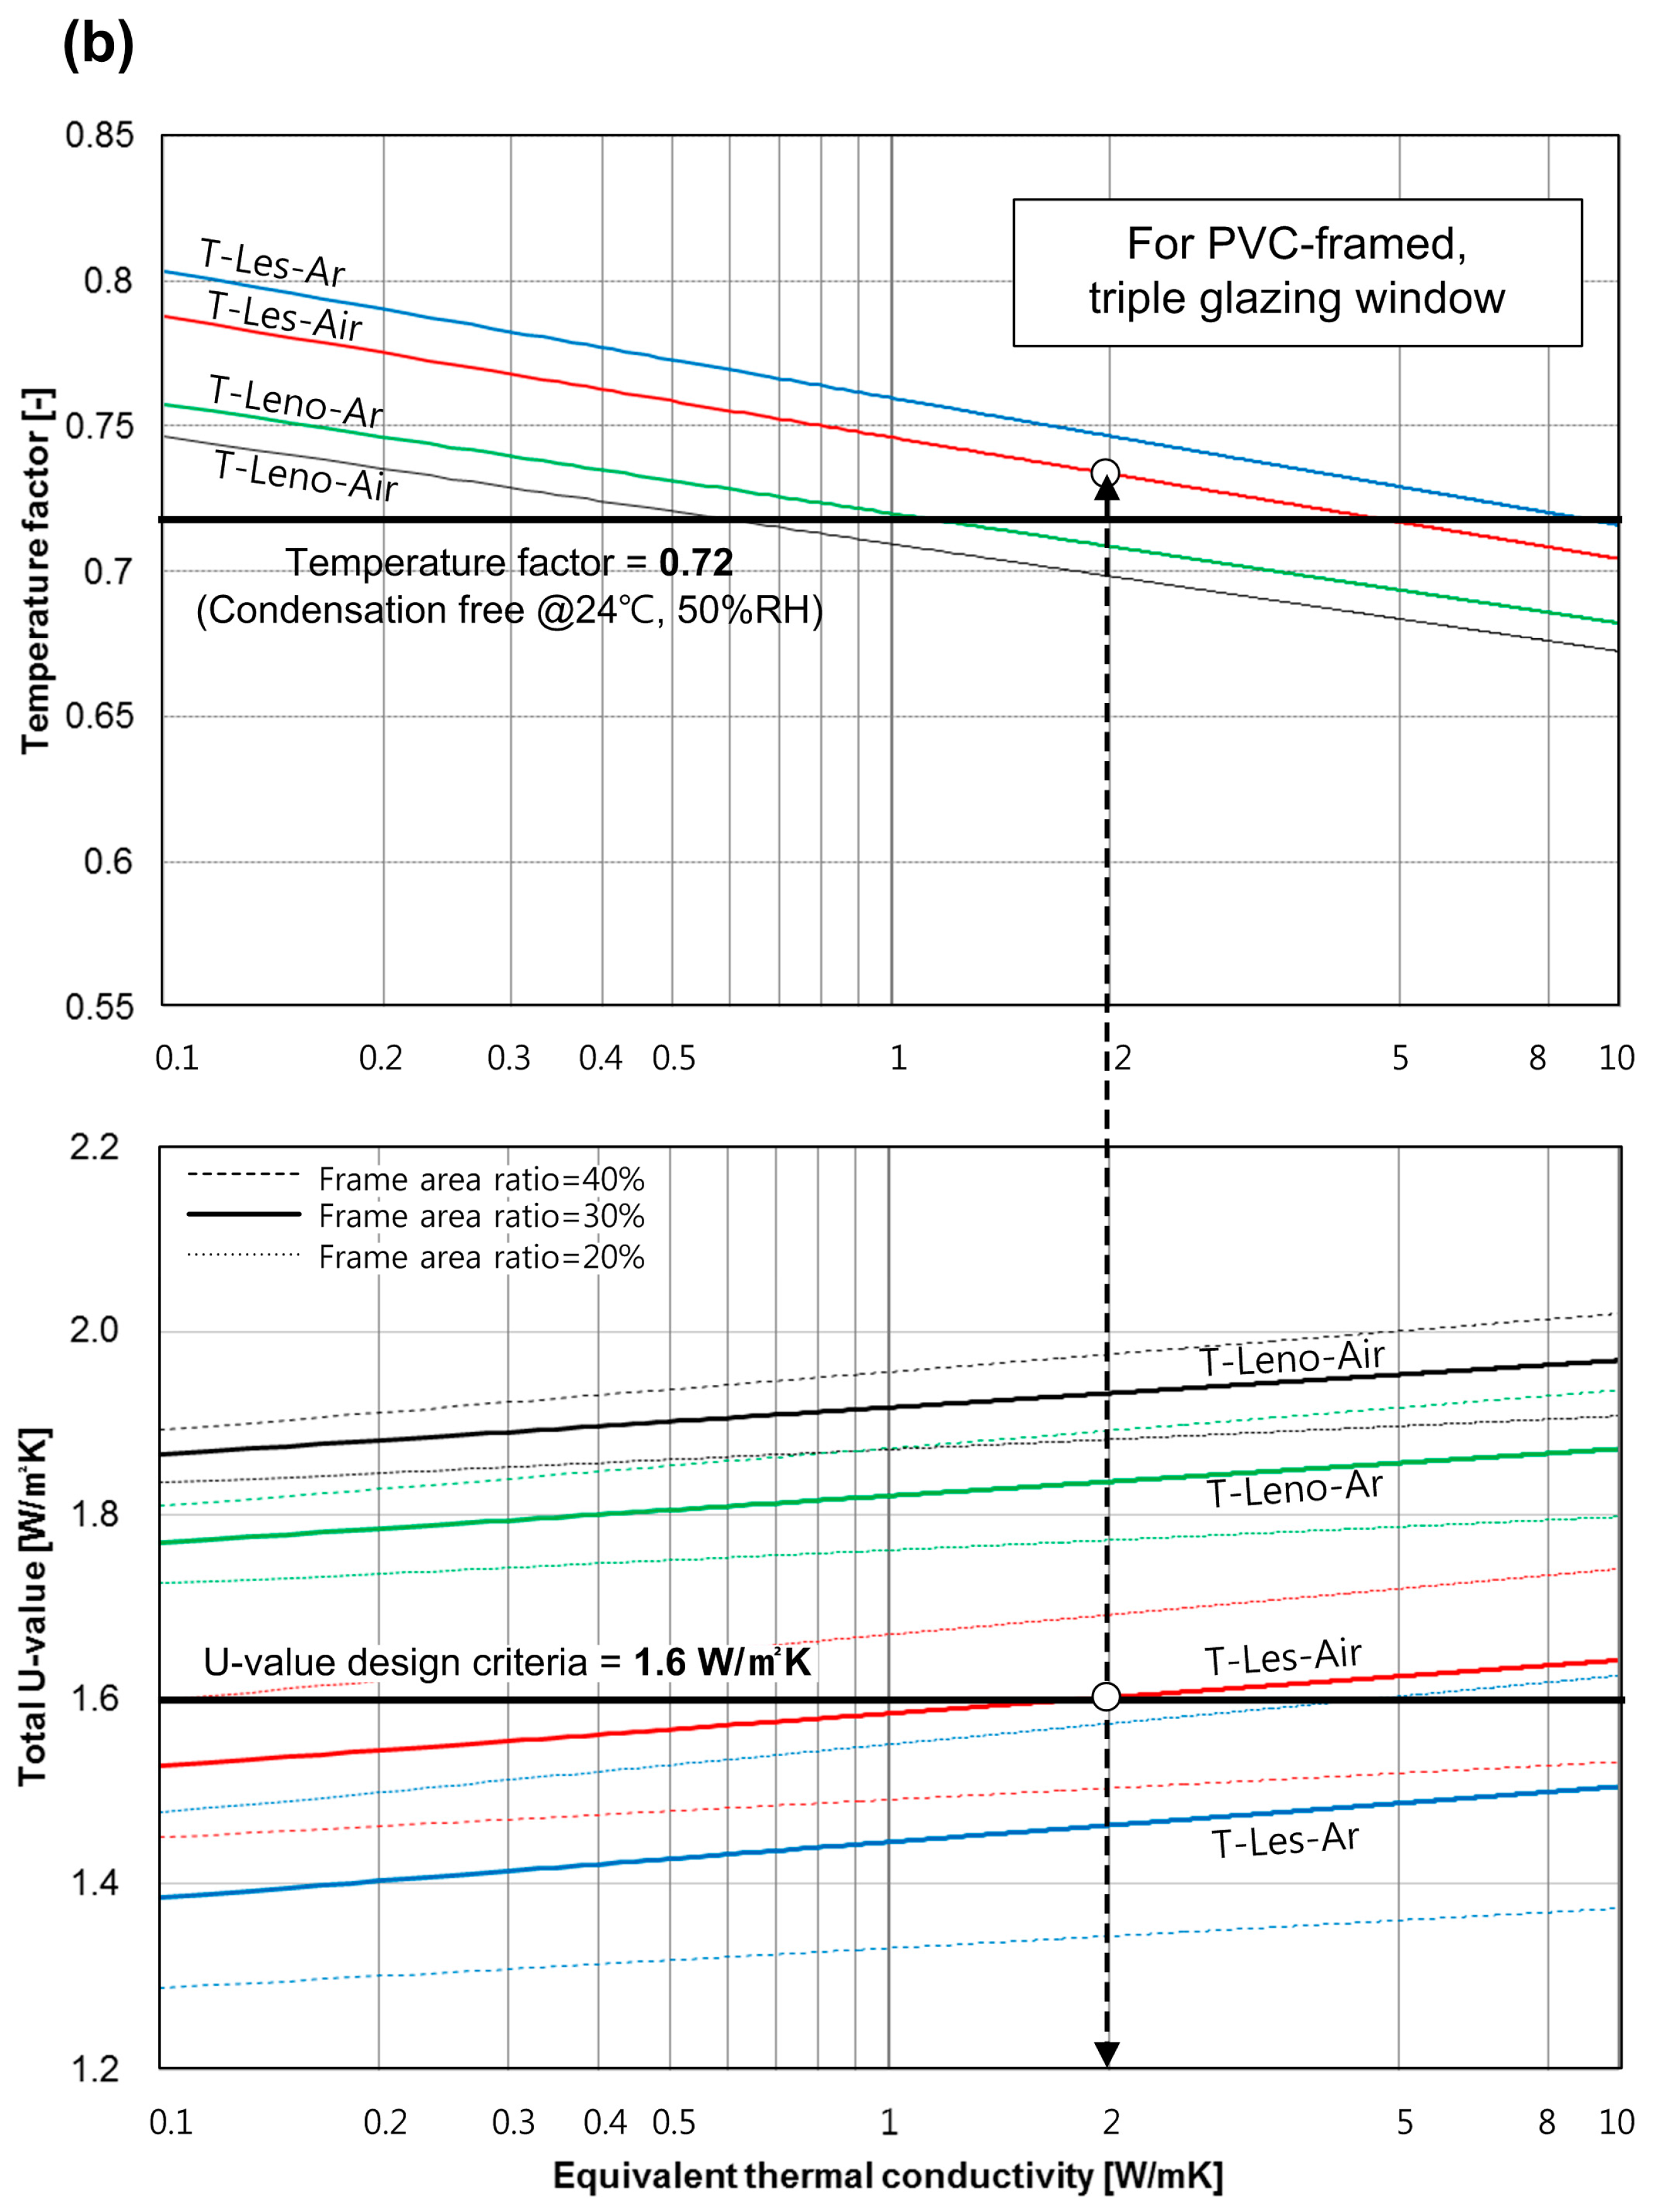
Hence, this study investigated the reduction of the total U-value as well as the condensation risk with the application of the TIS. The relation between the total U-value and the condensation resistance was also analysed. In addition, the whole building energy simulation was conducted to evaluate the impact of the TIS on the maximum heating load and heating energy consumption. Based on the analysis, monographs for the window spacer determination were suggested so that a designer can consider not only condensation prevention but also the energy saving performance.

2. Survey of Window Spacers

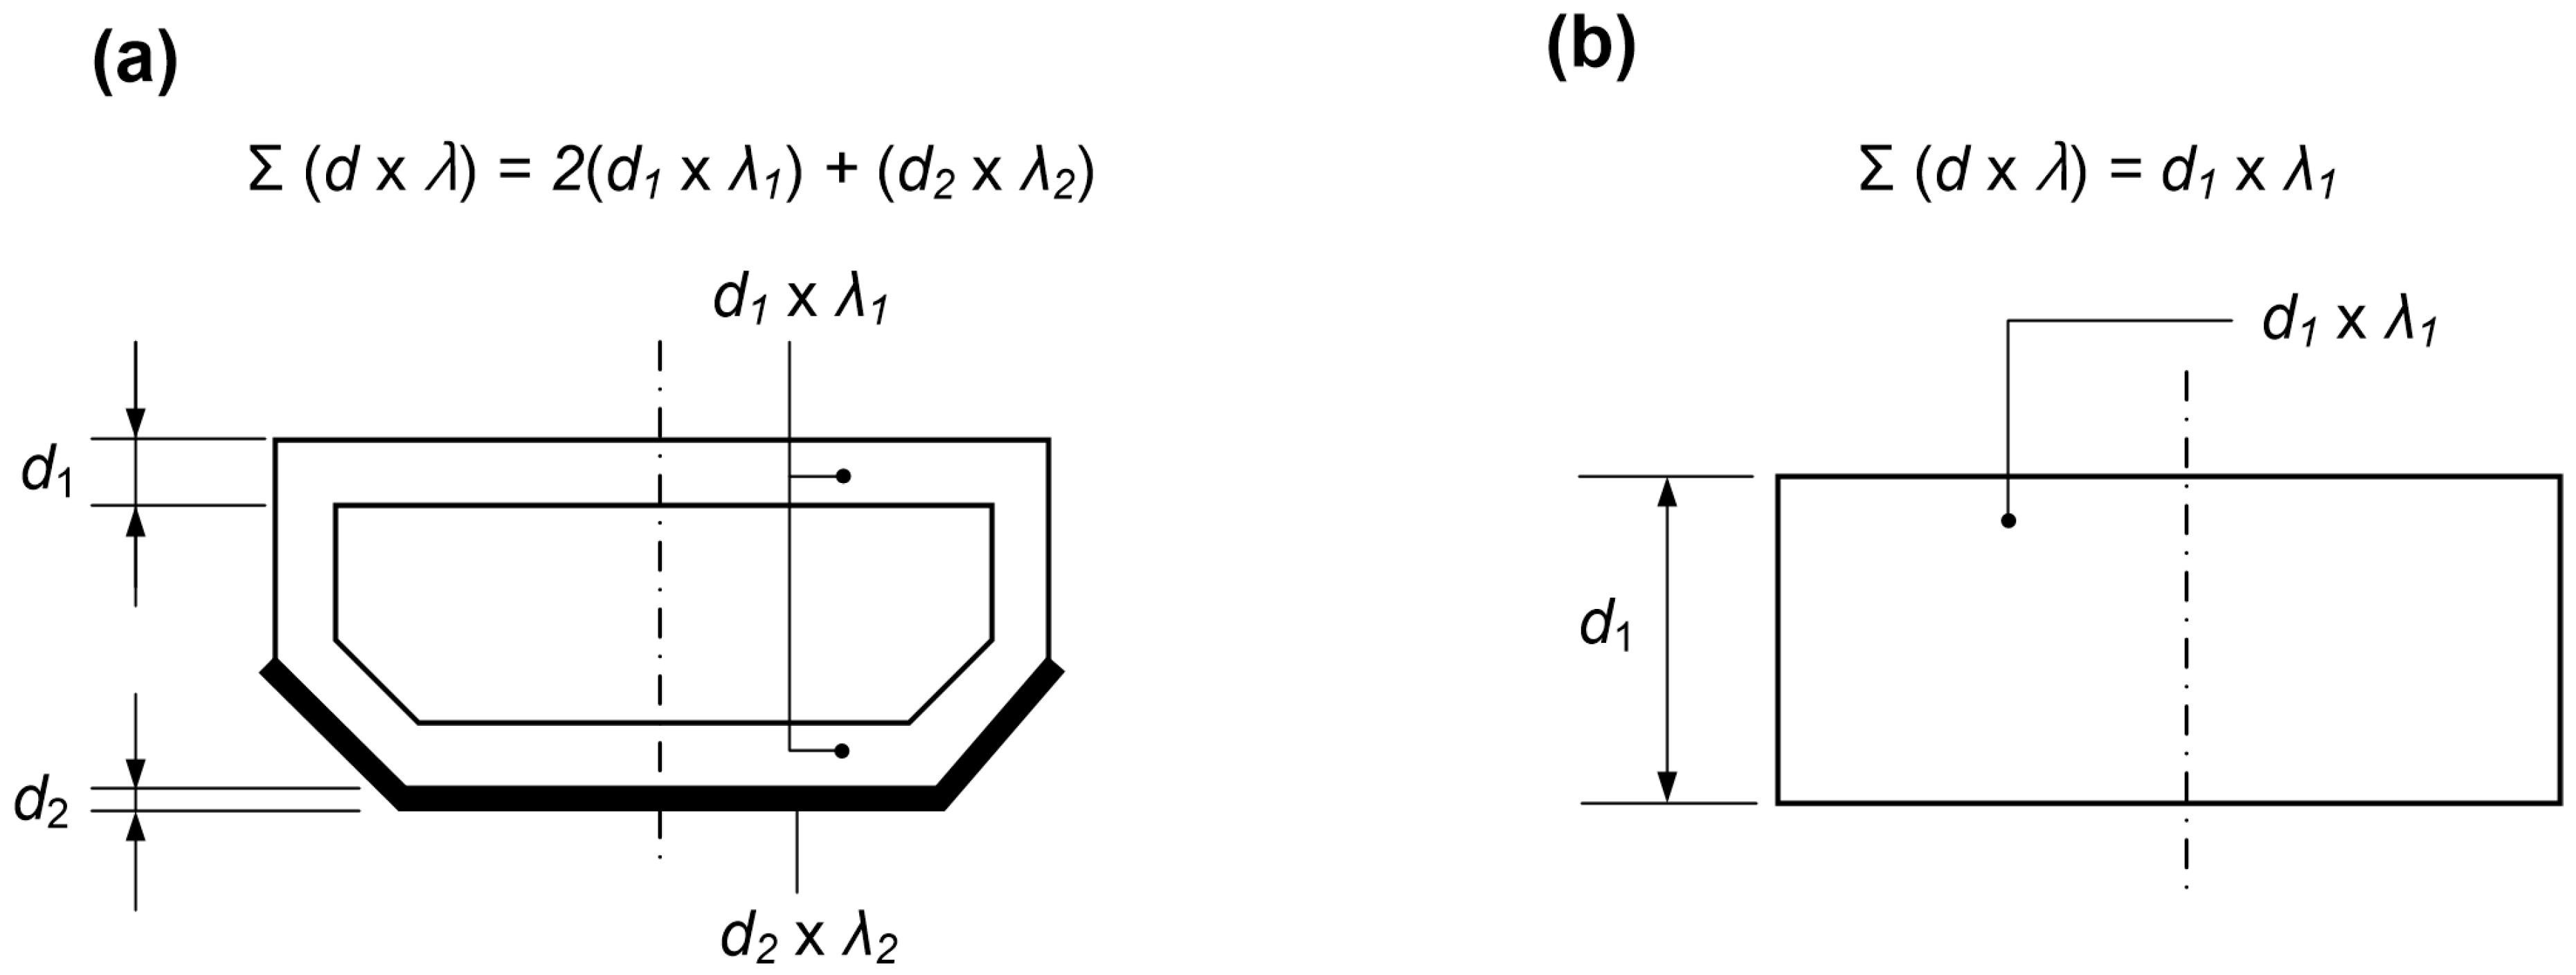
The role of the window spacers is the provision of a cavity between multiple glasses for the purpose of improving the insulation performance of windows. The spacers need to provide a structural robustness to resist the thermal expansion and/or the contraction caused by the seasonal variations of outdoor-weather conditions. For this reason, they are usually made of rigid elements such as aluminum, steel, and non-metallic materials to provide the required structural strength.
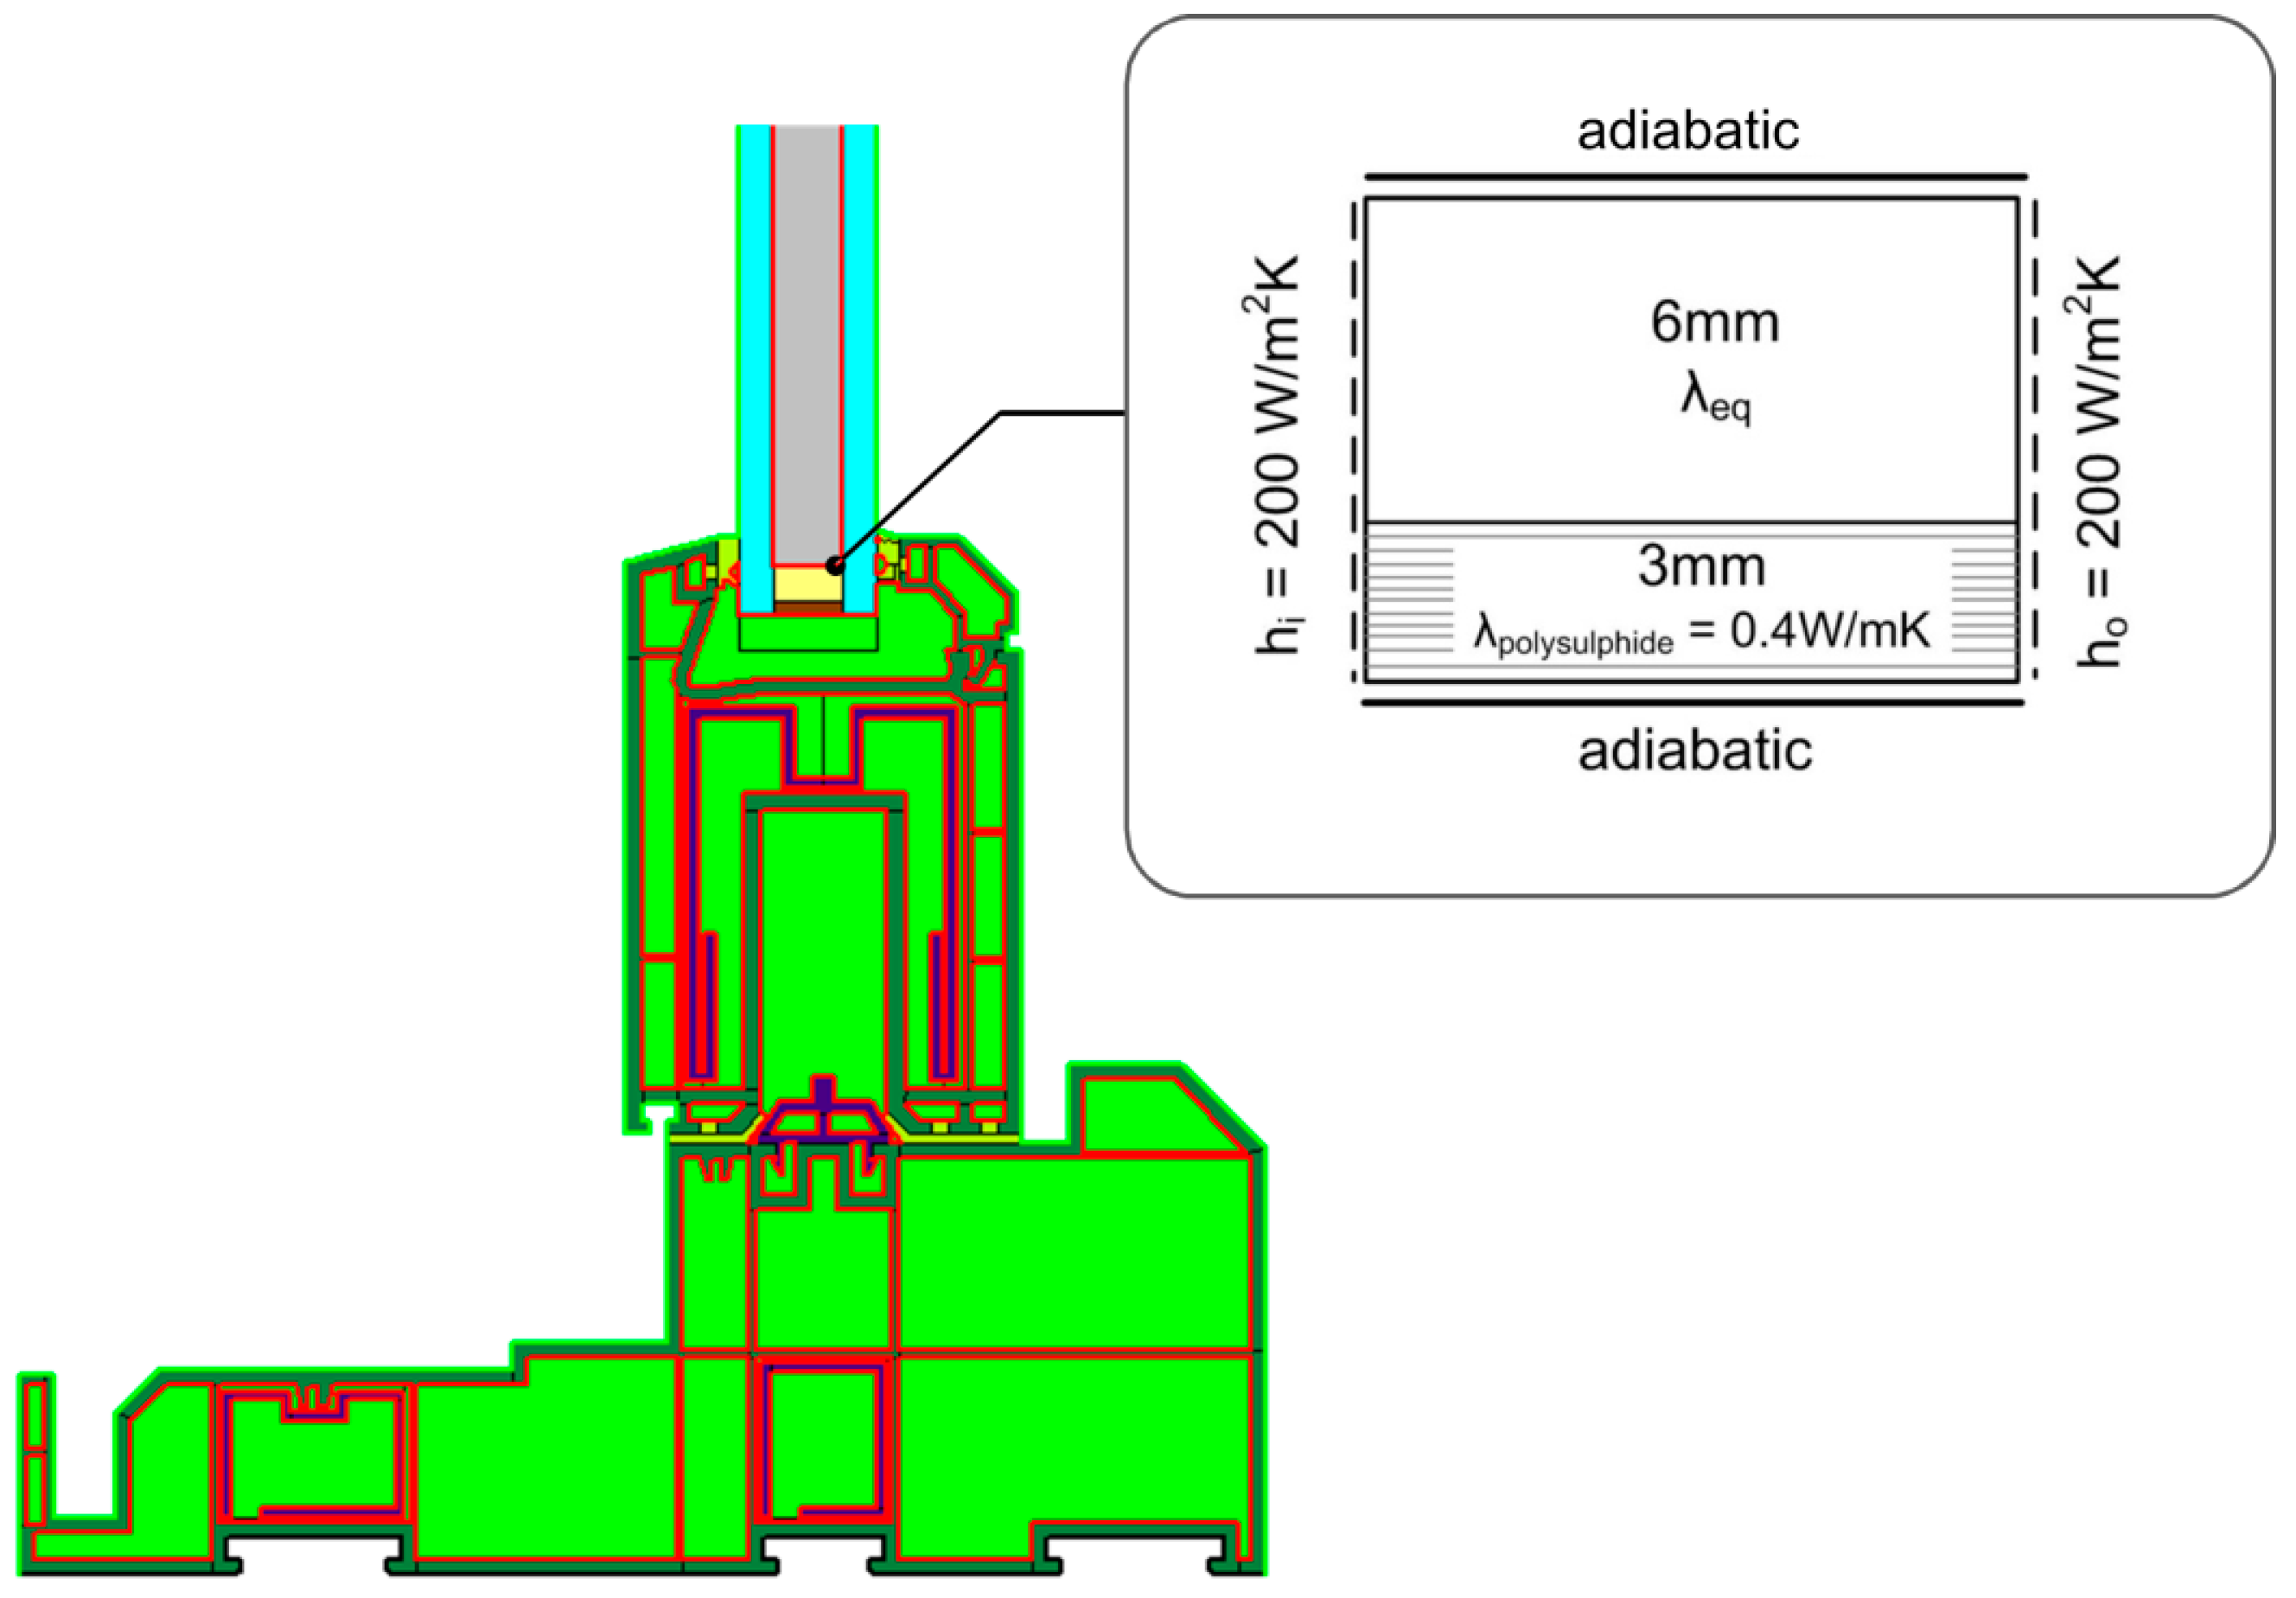
As the metallic element of the spacer has high thermal conductivities, they can create an easy path for heat transfer through the edge region of windows. To decrease the heat transmittance through the spacer, it is necessary to reduce the thickness of the spacer elements or to apply non-metallic materials with a low thermal conductivity. Depending on the thickness and the thermal conductivity of the spacer materials, a window spacer can be classified as TIS if the summation of the thickness multiplied by the thermal conductivity at the central section is less than 0.007 W/K, as shown in Figure 1 and Equation (1), as follows:
( d λ ) 0.007 ( W / K ) ,
where d is the thickness of the element perpendicular to the heat-transfer direction and λ is the thermal conductivity of each element.
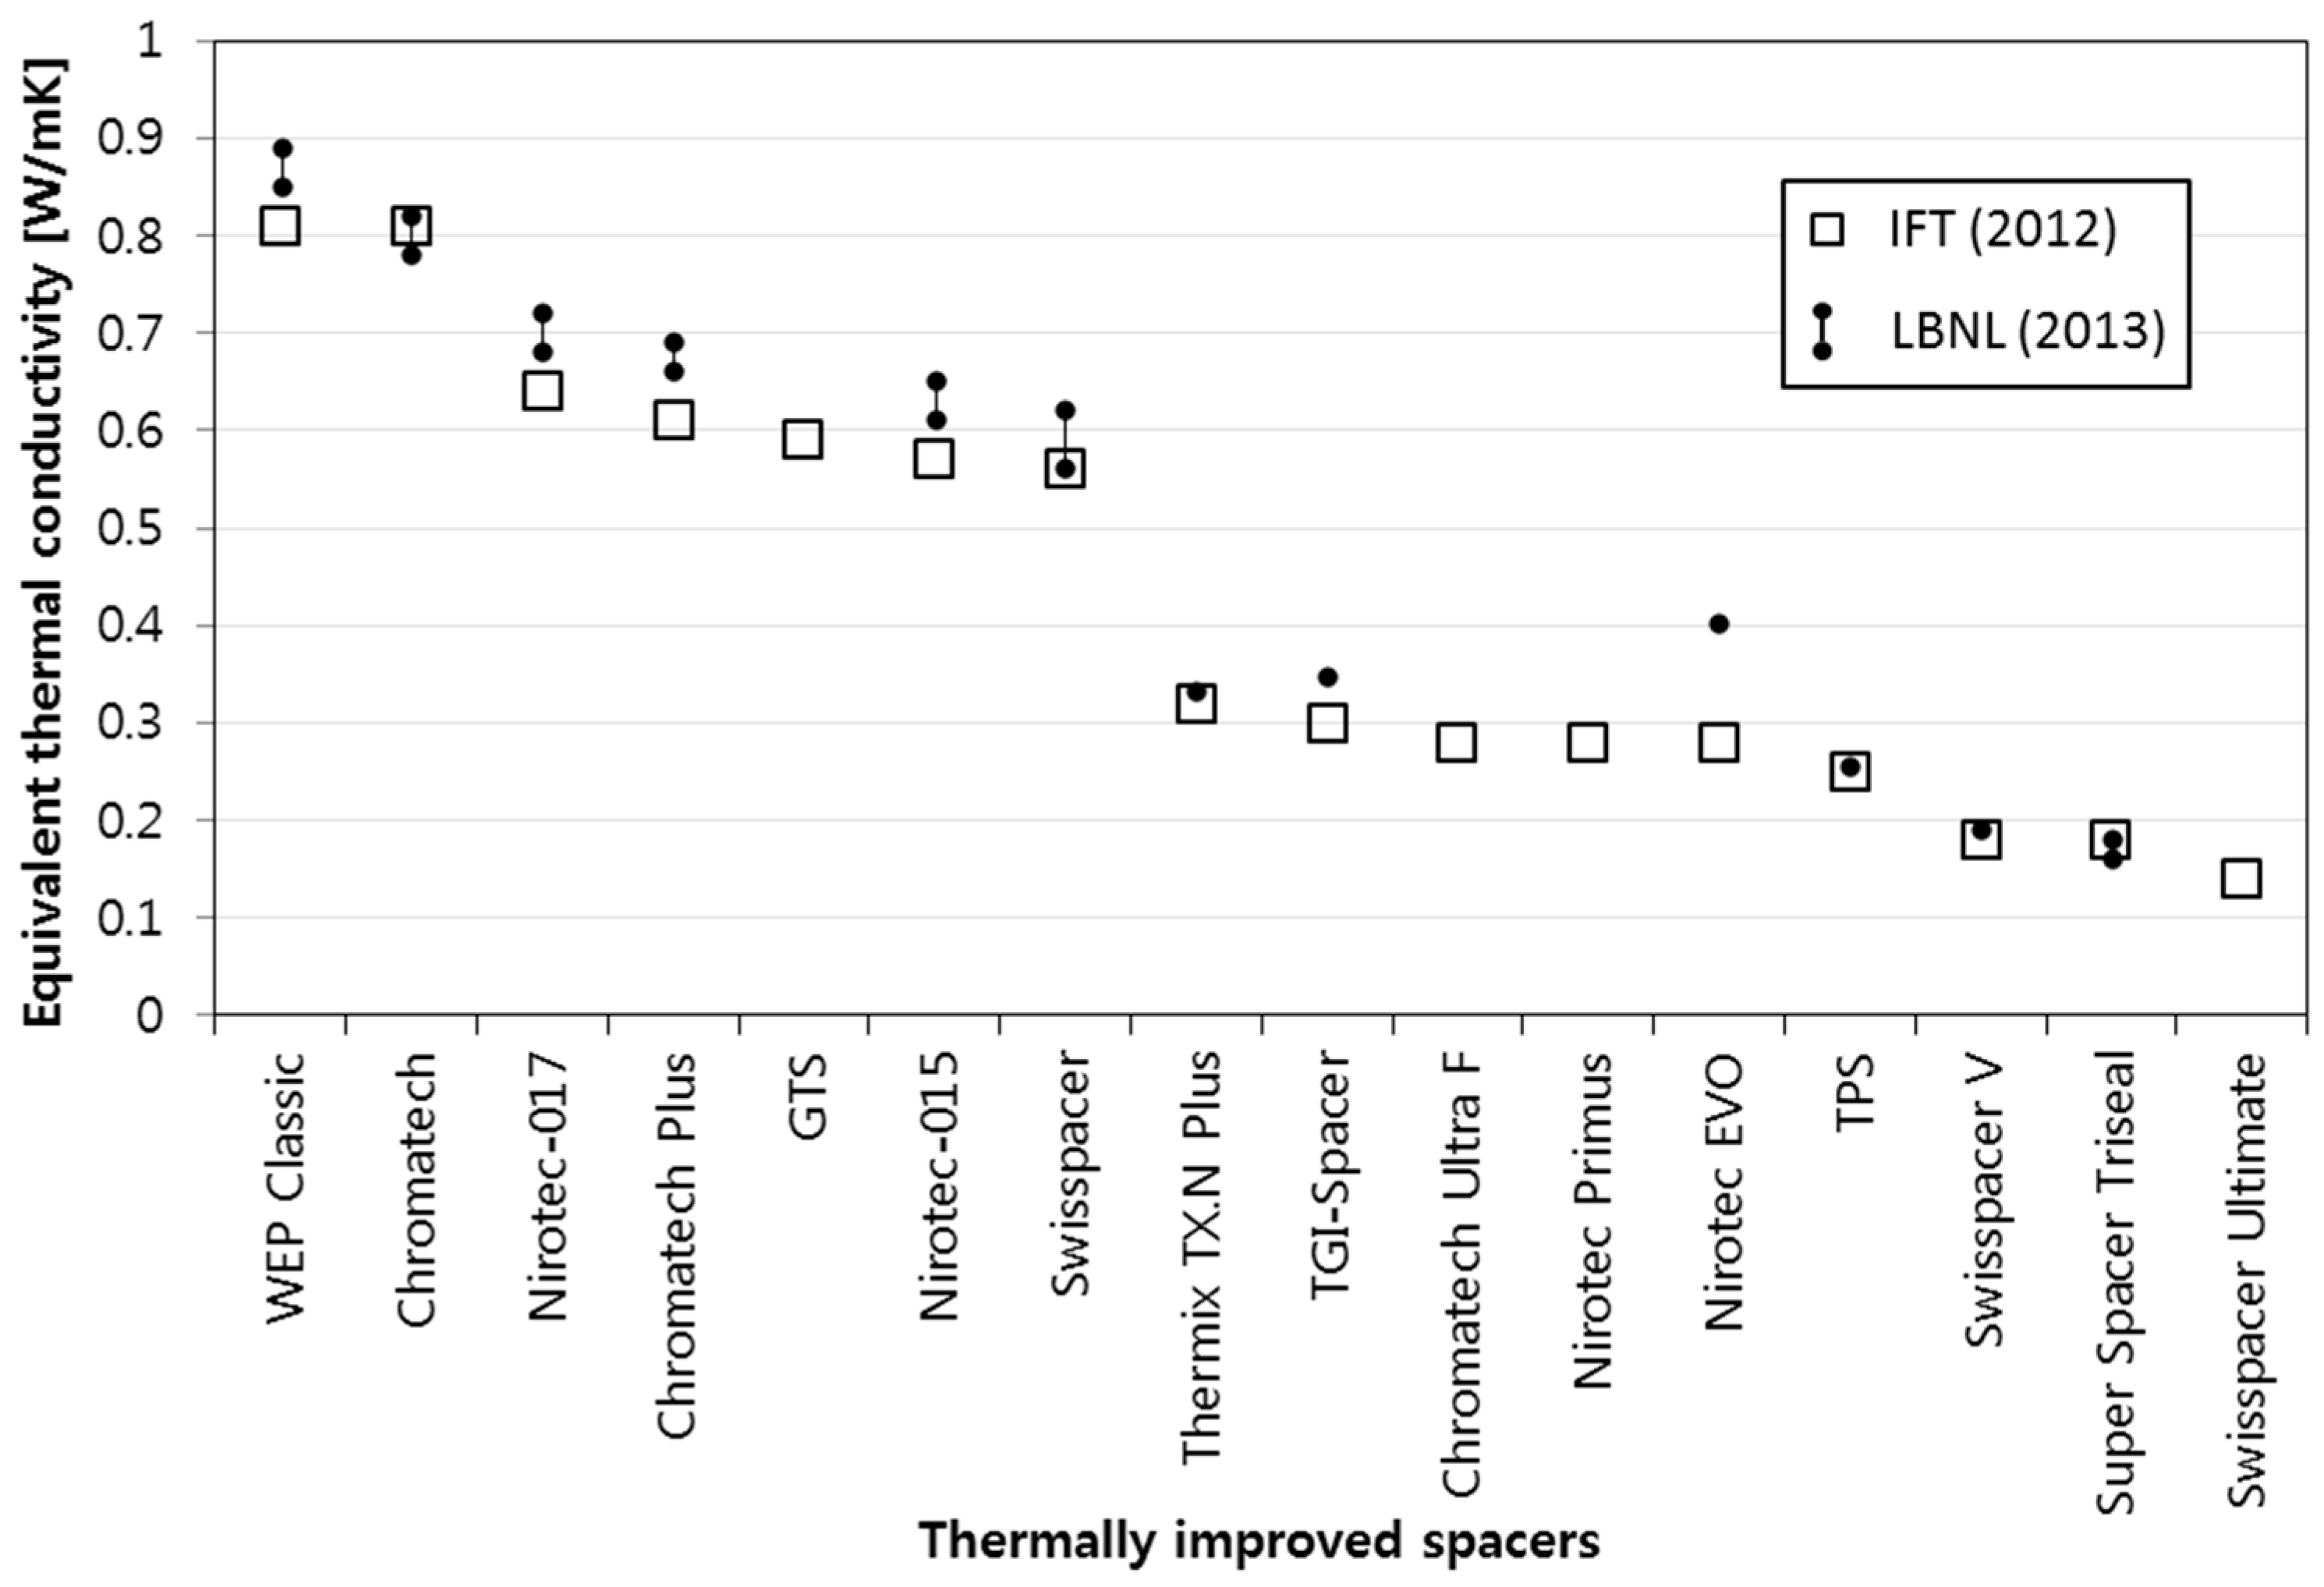
In this study, a literature survey was conducted to identify the window spacers that are currently available in the building industries [1,17,26]. If a spacer meets the condition of Equation (1), it was classified as a TIS, as shown in Table 1. The TIS is generally made of a very thin metallic part to compensate for the high thermal conductivity; alternatively, if the thickness of the element cannot be reduced, non-metallic materials such as plastic are inserted to increase the thermal resistance.
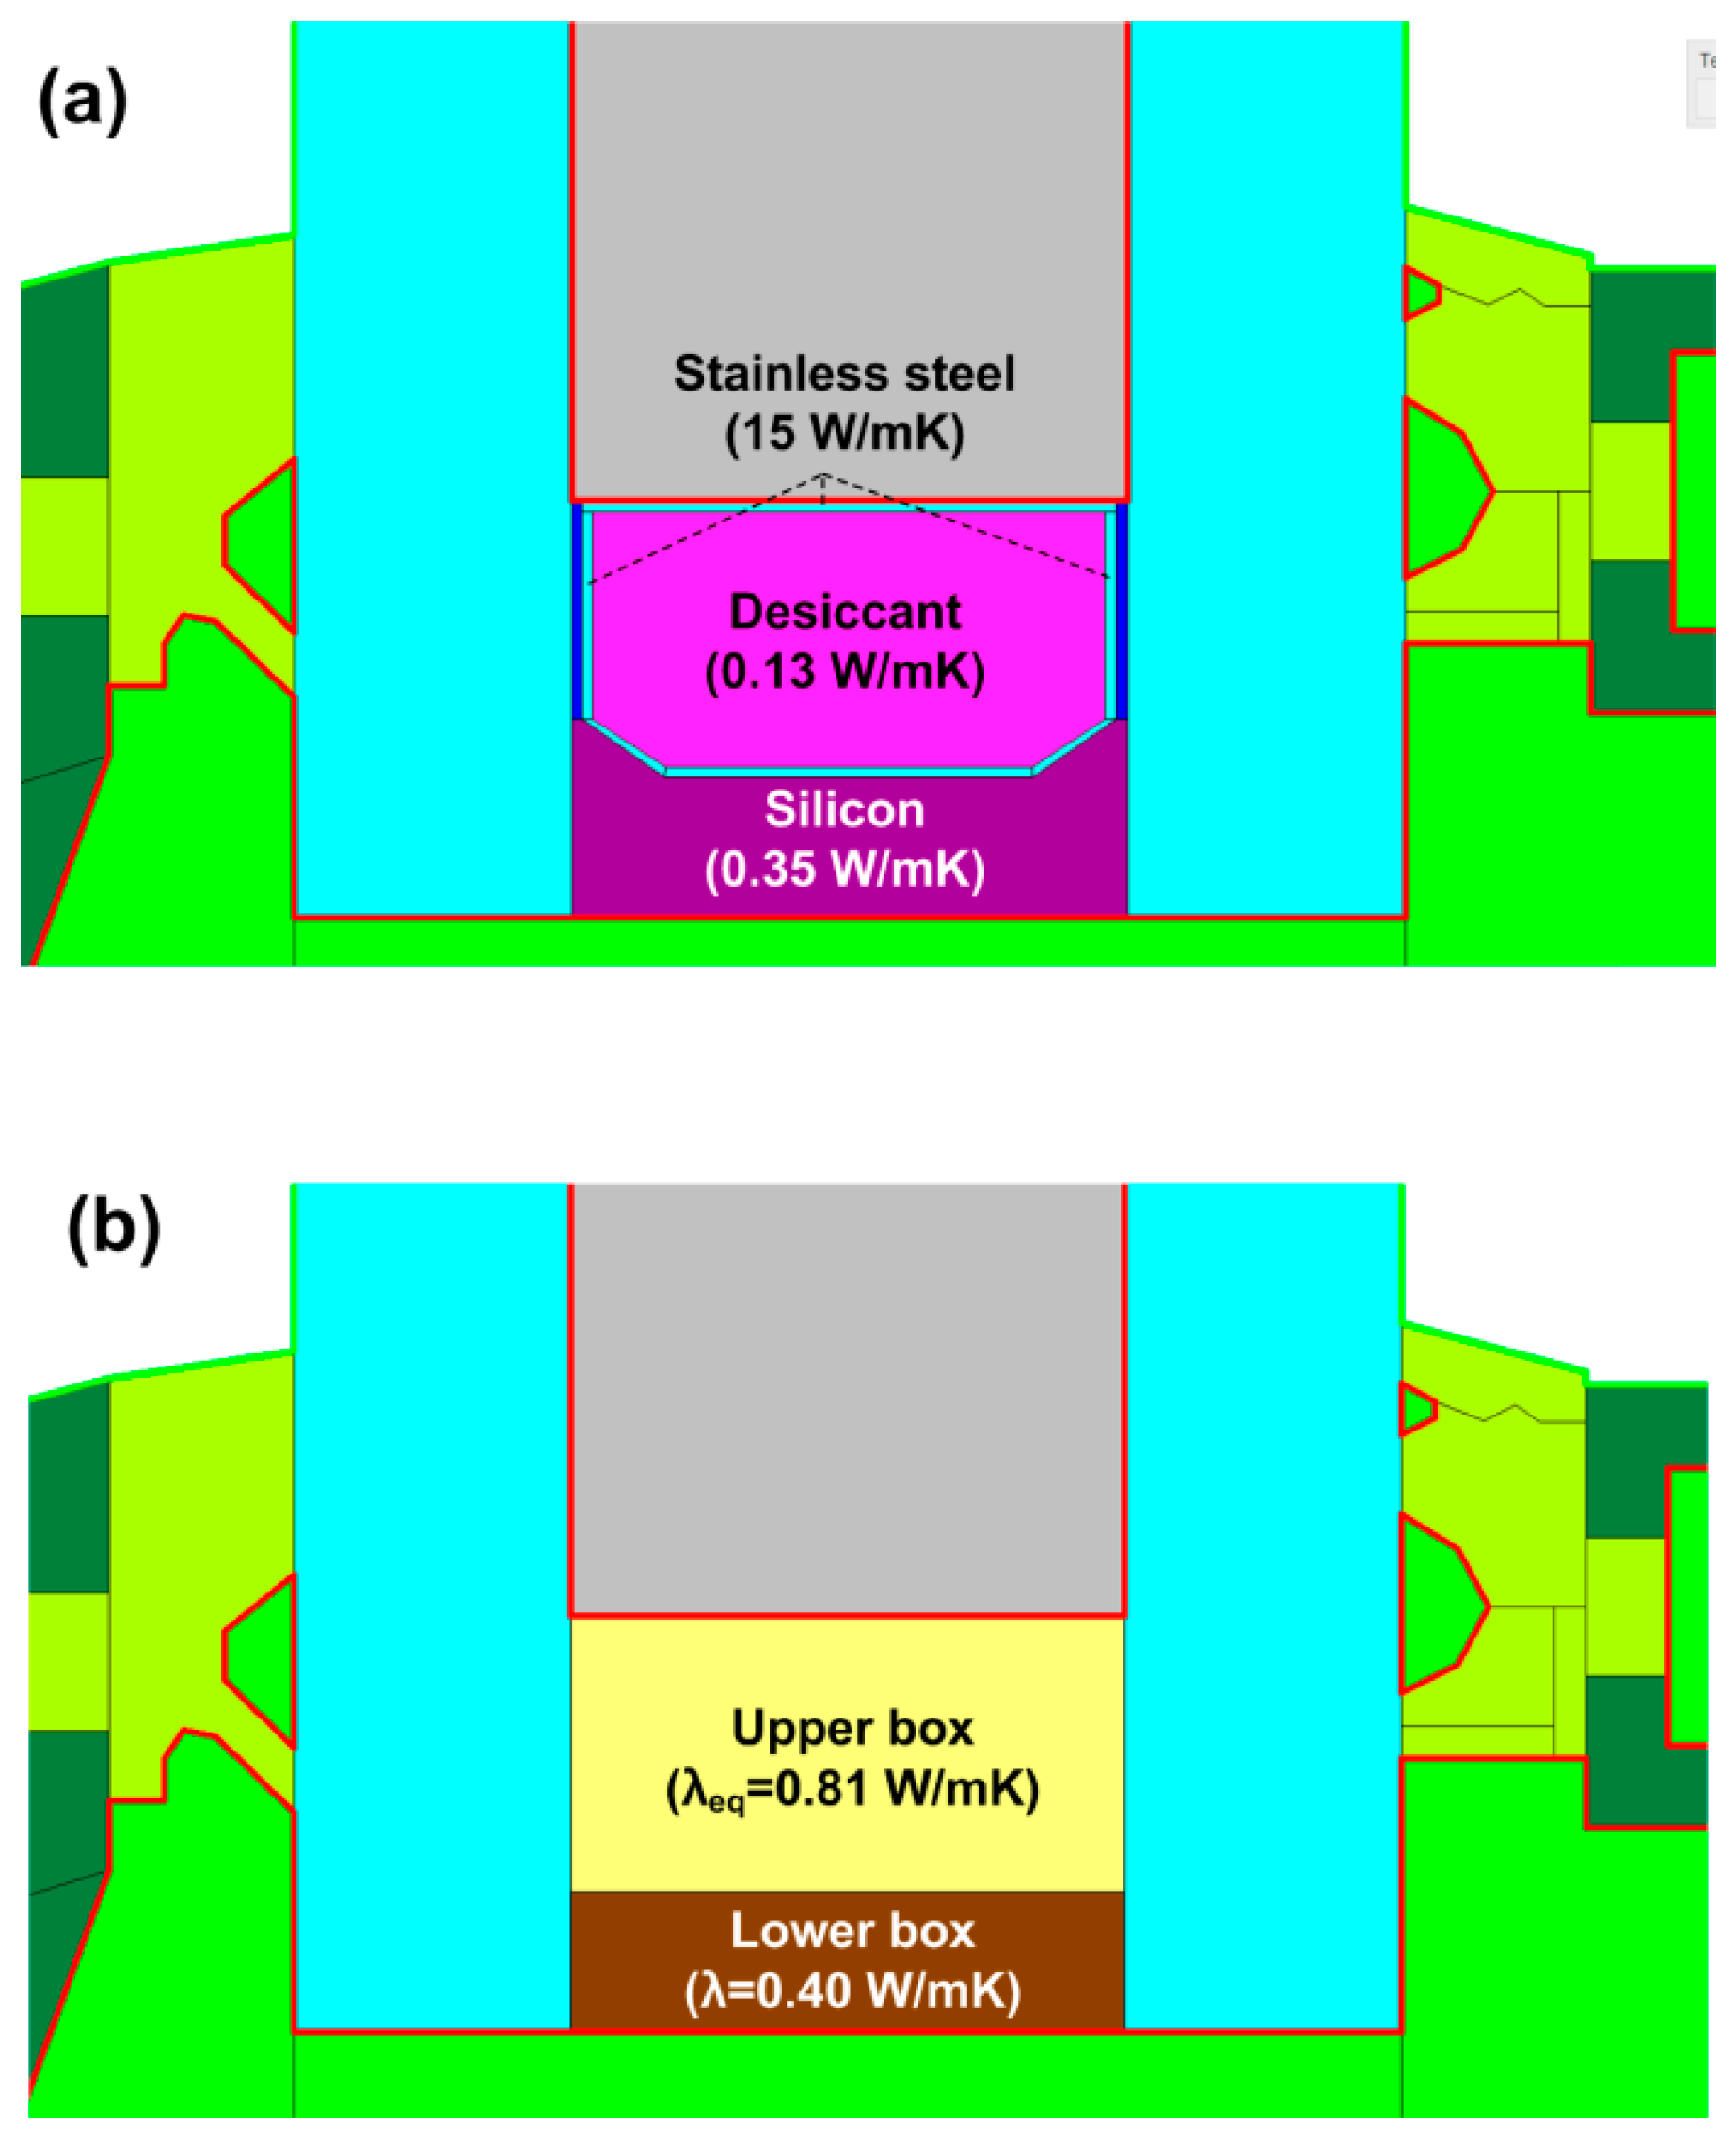
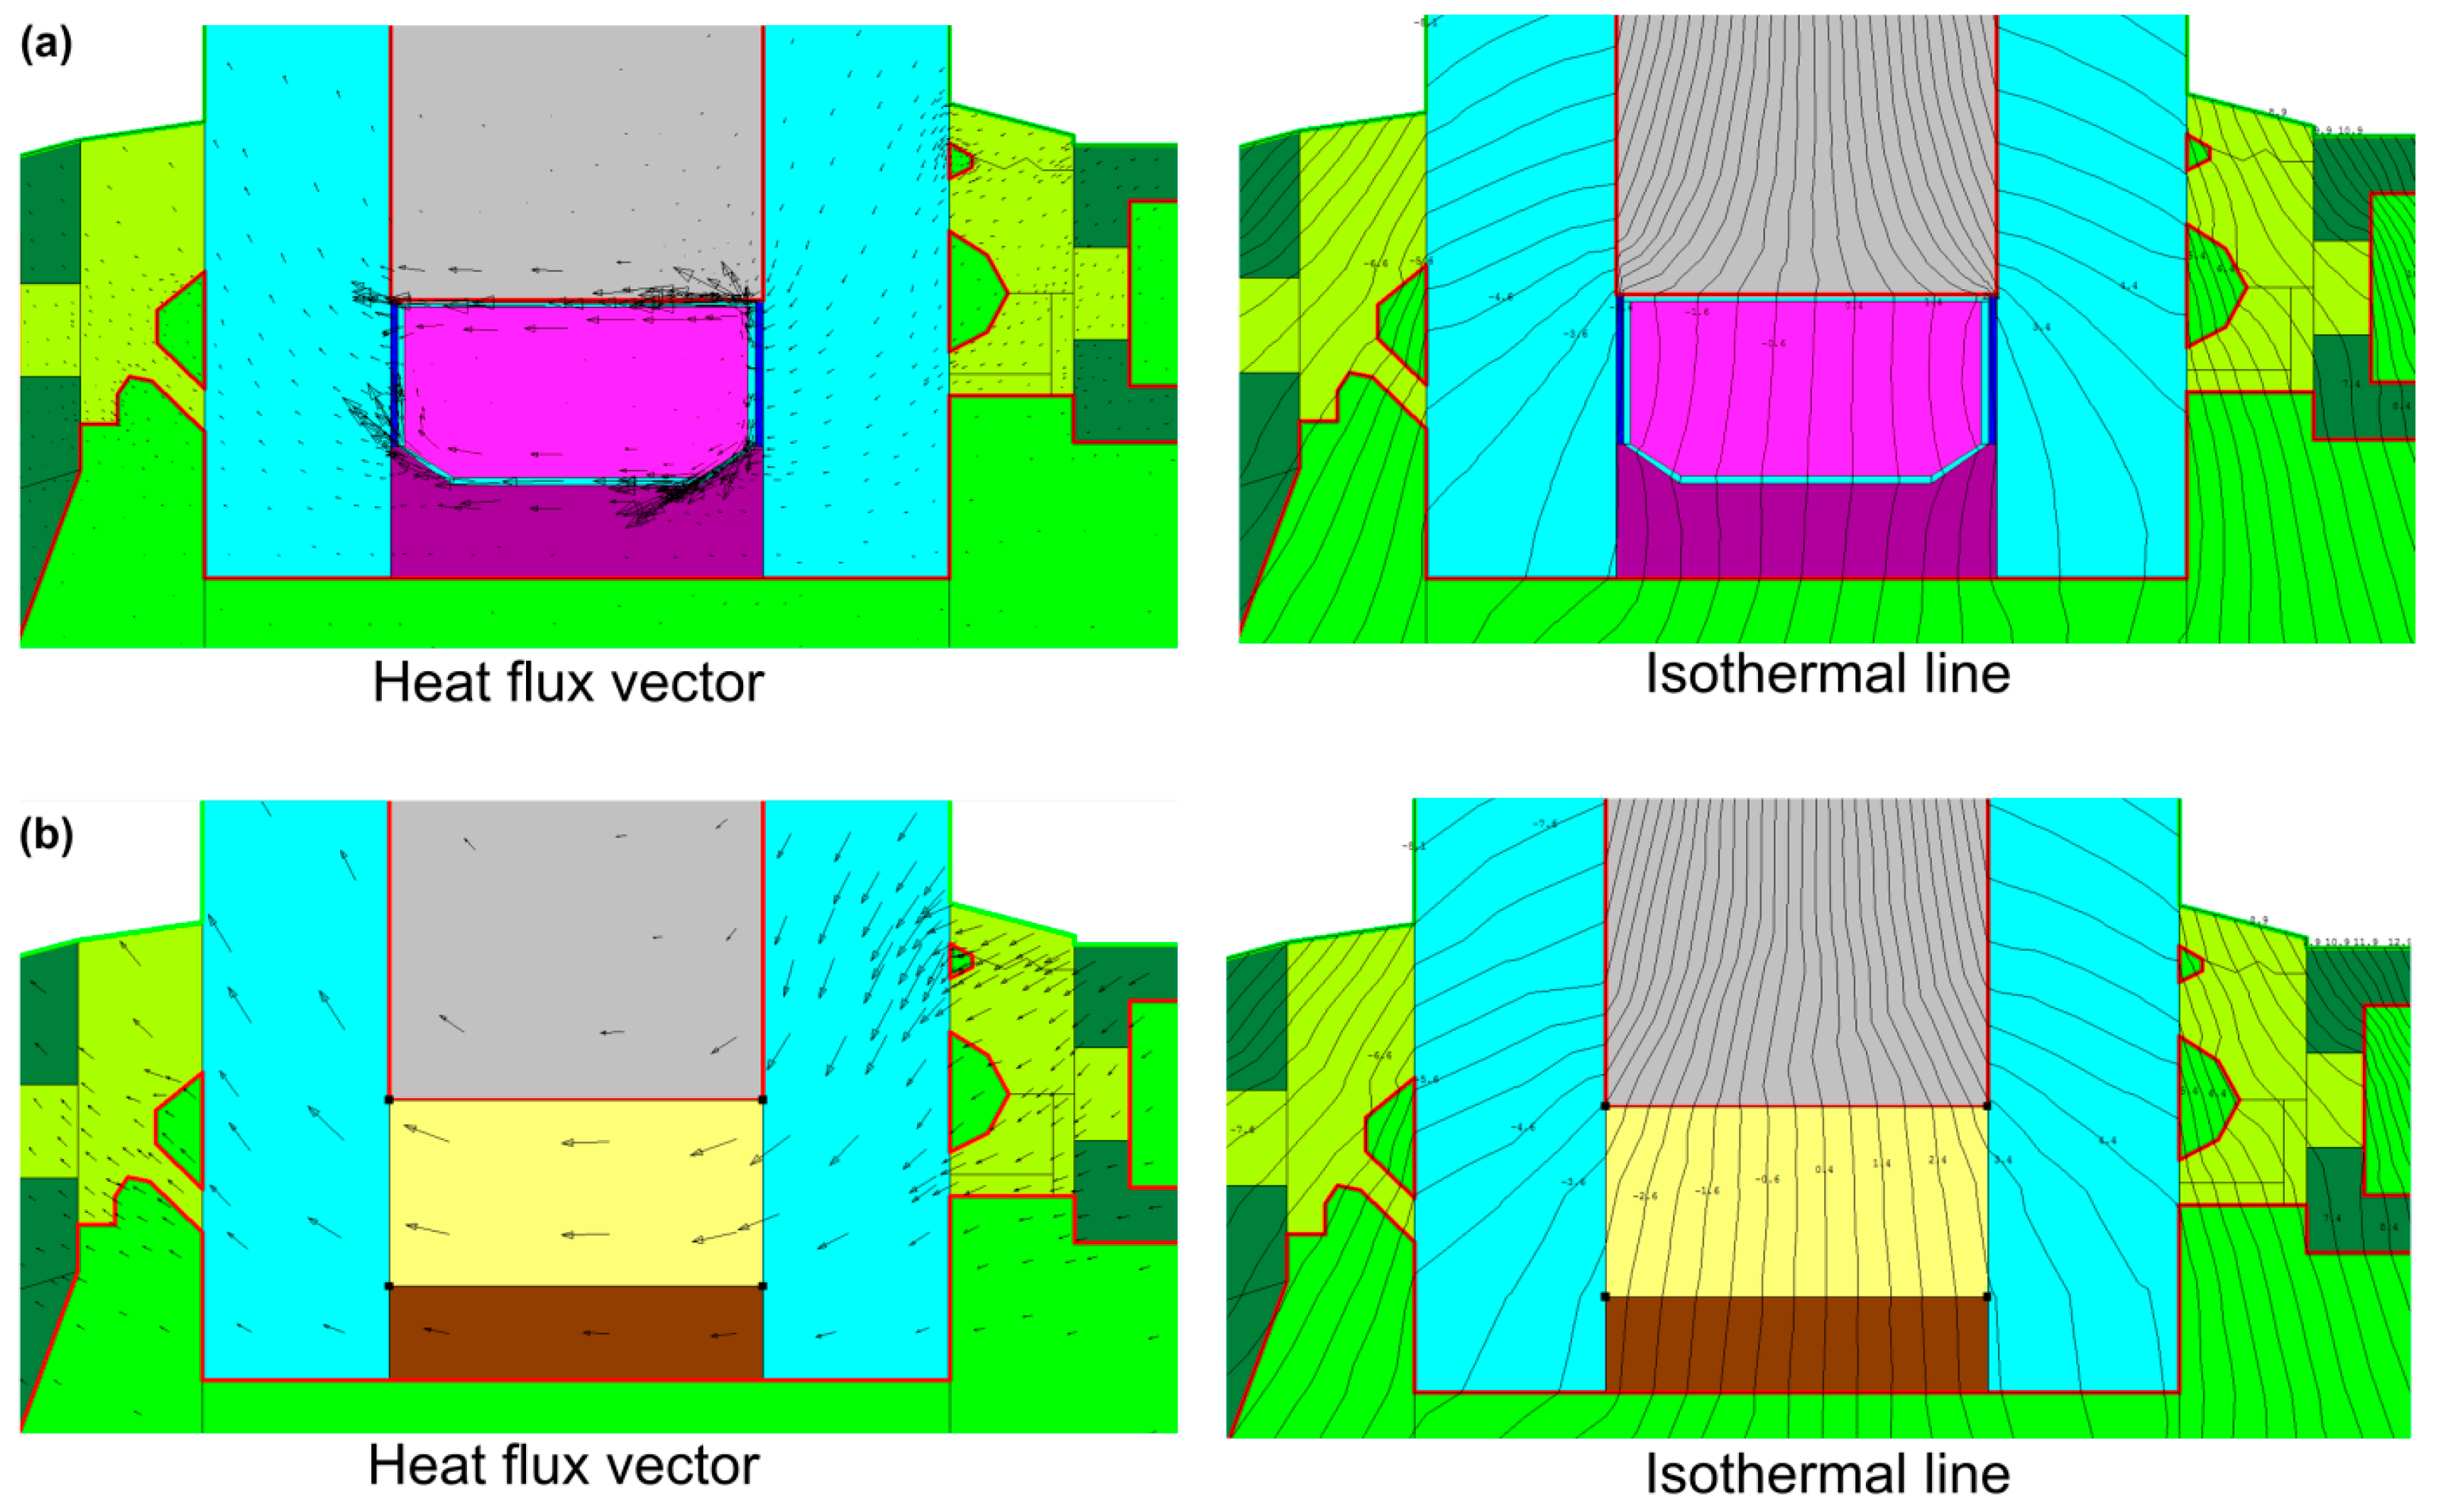
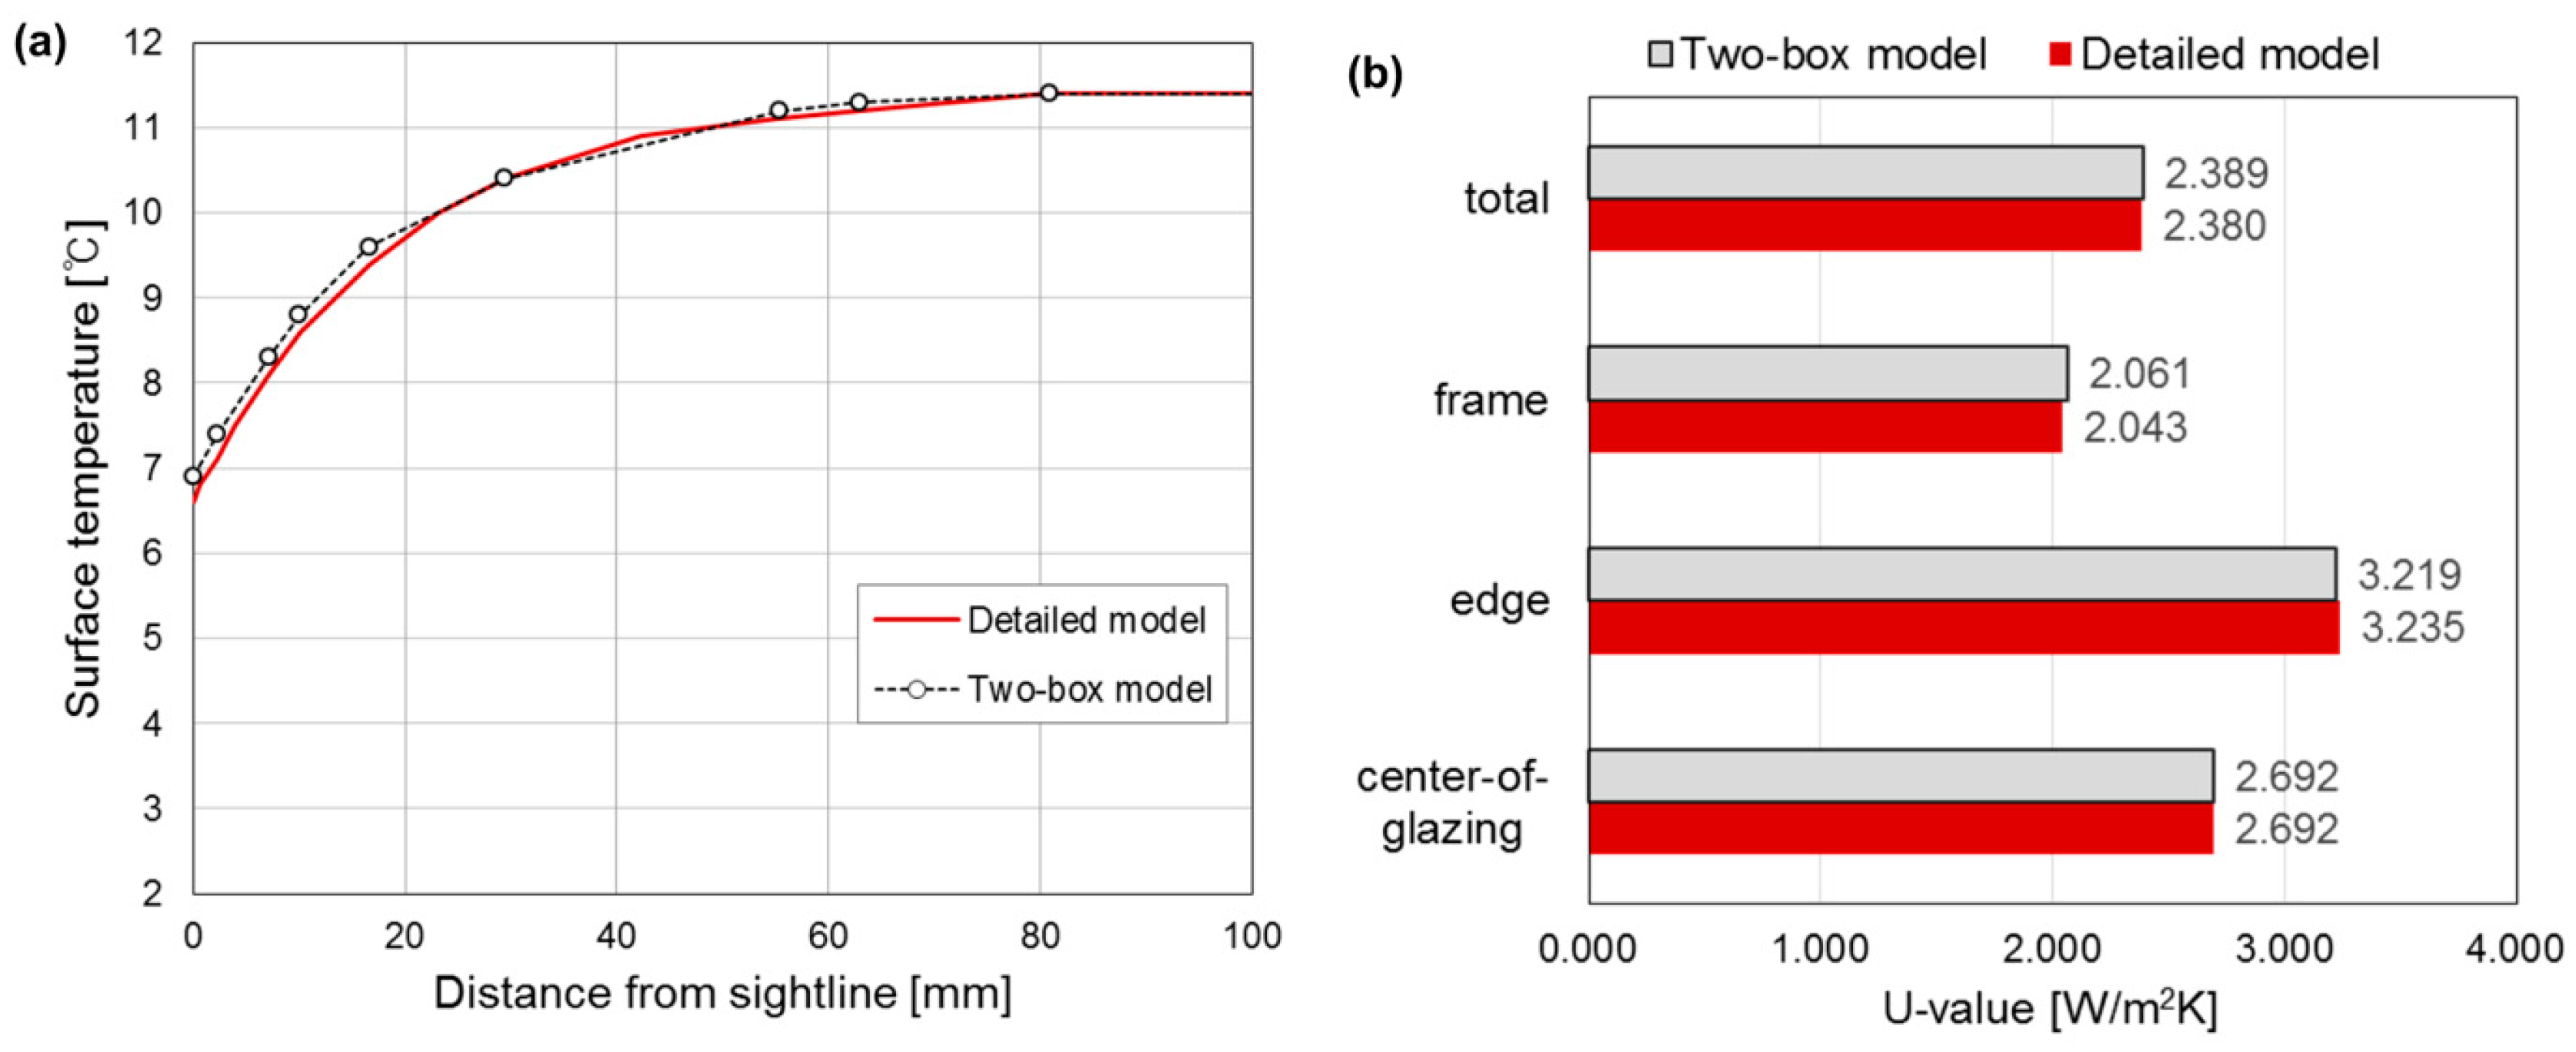
3. Research Method

3.1. Simulation Model

To consider the impact of the TIS on condensation prevention and energy saving, it is necessary to predict the indoor-surface temperatures and the total U-value of the window at the early design stage. This prediction can be achieved by conducting a heat-transfer simulation; however, it is somewhat cumbersome to make a detailed model of the TIS because it is usually composed of very thin metallic foil, adhesive, and sealant. The detailed modelling of the TIS is time-consuming and may cause problems with the accuracy of the finite-element calculation [27]. For this reason, this study evaluated the thermal performances of the TIS using a two-box model [1,28]. With this model, the complicated TIS is replaced with simple two boxes composed of upper and lower boxes, as shown in Figure 2. While the lower box represents a polysulphide sealant, the upper box represents the thermal conductivity of the original spacer, which is defined as the equivalent thermal conductivity (λeq). A comparative study between the two-box model and the detailed model proved that the two-box model produces accurate results, and the corresponding calculations of the linear thermal transmittance are therefore easier to perform [27].
According to a review of the previous studies and the manufacturer’s data, the λeq of the TIS ranges from 0.1 W/mK to 0.9 W/mK [26,29,30,31], as shown in Figure 3. For the conventional window spacers, the approximate λeq is from 1.0 W/mK to 8.0 W/mK [30]. The thermal performances of the TIS were evaluated with the two-dimensional steady-state heat transfer simulation program THERM 7.4 [18]. A typical window (1 m × 0.9 m) that is widely installed in residential buildings was modeled, as described in Figure 2. The frame material was assumed as polyvinyl chloride (PVC), which is effective for the reduction of the heat transfer through the frame section.
Before implementing the two-box model for the evaluation of the thermal performance of the TISs, the result of the two-box model was compared with that of a detailed model in order to validate the two-box model. One of the TISs in Table 1 (“Chromatech” spacer) was analyzed with detailed and two-box models, respectively, as described in Figure 4. Indoor surface temperatures and U-values by each modeling method were analyzed with THERM simulation in order to examine whether the two-box model is suitable to investigate the impact of the TIS on the temperature factor and total U-value of the windows.
Figure 5 shows the simulation results with regard to heat flux vector and temperature distribution in the edge region of the investigated window. In the case of the detailed model, the heat flux vectors are concentrated at the metallic part of the spacer due to relatively high thermal conductivity of the stainless steel, as shown in Figure 5a. On the other hand, the two-box model resulted in more uniform distribution of heat flux vectors as shown in Figure 5b, because the spacer is represented with the homogeneous material, or the equivalent thermal conductivity.
Even though the pattern of heat flux vectors is different with modeling methods, the overall heat flux is almost identical for each case. THERM simulation outputs showed that the heat flux at the edge region is 126.2 W/m2 for detailed model and 125.5 W/m2 for two-box model. Regarding the heat flow at the edge region, the detailed and two-box models resulted in 7.94 W and 7.90 W, respectively. Table 2 shows the THERM results on the heat flux and heat flow at the edge and frame region for each case. Accordingly, both models resulted in the similar temperature distribution around the TIS, even though the corner part of the spacer shows a slight different temperature distribution, as shown in the isothermal line of Figure 5.
Figure 6 shows the indoor surface temperature and U-values, which are important to the evaluation of the thermal performance in terms of condensation prevention and energy saving, respectively. It can be found that both modeling methods produce very similar temperature profiles, as described in Figure 6a. As the two-box model resulted in slightly less heat flux at the edge region than the detailed model, it shows a slightly higher temperature at the region near the sightline. However, the discrepancy between two modeling methods is at most 0.3 °C, or 4.5%, at the sightline. In addition, the surface temperature at 13 mm from the sightline, which is used to evaluate the condensation [32], shows the discrepancy of 0.1 °C, or 2.2%. Regarding the U-value, the discrepancies of edge region, frame and total U-value were −0.016 W/m2K, 0.018 W/m2K, and 0.009 W/m2K, respectively, as shown in Figure 6b. The discrepancy of total U-value was only 0.4%, which is negligible in the evaluation of energy saving performance. Therefore, it is feasible to implement the two-box model to evaluate the impact of the TIS on the condensation prevention and energy saving performance.

3.2. Simulation Case

The impact of the TIS can vary depending on factors like the glazing type, low-e coating, and infill gas; accordingly, this study investigated the thermal performances of the TIS with the different glazing types (double, triple), coatings (no coating, low-e soft coating, low-e hard coating), and infill gases (air, argon) that are listed in Table 3. In consideration of the λeq range, the window spacer was varied from 0.1 W/mK to 8.0 W/mK in each simulation case. The material properties of the window elements and the simulation boundary conditions are summarized in Table 4 and Table 5, respectively.

3.3. Performance Criteria

The performance of the condensation prevention was evaluated with the temperature factor fT, as formulated by Equation (2), where the surface temperature at 13 mm from the sightline was used for the calculation of the temperature factor [32]. The higher temperature factors indicate that the window can withstand the surface condensation at lower outdoor air temperatures. In this study, the indoor and outdoor air temperatures were assumed as 24 °C and −15 °C, respectively, in consideration of the winter design condition in Seoul, Korea:
f T = T s i T o T i T o ( ) ,
where fT is the temperature factor, Tsi is the surface temperature, Ti is the indoor air temperature, and To is the outdoor air temperature.
The temperature factor is non-dimensional (-) and represents the indoor surface temperature relative to the difference between the indoor and outdoor air temperatures. The use of the temperature factor makes it possible to compare the thermal performance of the windows under different boundary conditions [24].
In addition to the temperature factor, the annual time of condensation occurrence was estimated to compare the performance of the condensation prevention; accordingly, Equation (2) was transformed to calculate the outdoor air temperature at which the condensation starts to occur, as formulated by Equation (3), as follows:
T o = T s i f T T i 1 f T ( ° C )
If the Tsi is substituted by the dew-point (DP) temperature at the design condition (e.g., 13 °C DP at 24 °C Dry-Bulb (DB) temperature, 50% Relative Humidity (RH)), the To can be considered as the outdoor air temperature at which the condensation starts to occur. Then, the annual occurrence time of the condensation can be calculated by accumulating the number of hours when the To is greater than the outdoor air temperature in the typical meteorological data, as exemplified in Figure 7.
Regarding the energy saving performance, the total U-value of the window was analyzed with Equation (4) [33], whereby the center-of-glazing U-value was obtained from the WINDOW program, while the frame and the edge-section U-values were calculated with the THERM simulation. The width of the edge section was assumed as 63.5 mm from the sightline, as defined by NFRC (National Fenestration Rating Council) 100 [34]:
U = U c g A c g + U e g A e g + U f A f A p f ( W / m 2 K ) ,
where the subscripts cg, eg, f, and pf are the center of glazing, edge of glazing, frame, and projected area of fenestration, respectively.
In addition to the total U-value, the energy saving performance of a residential building was also investigated with the whole building energy simulation. The objective of the simulation is to analyze the impact of the window spacers on the energy saving performance in terms of the maximum heating load and the heating-energy consumption. A typical residential building in Korea was modeled with Designbuilder v5, as shown in Figure 8, and it was simulated with Energyplus 8.5.
The floor area of the building, which is composed of three bedrooms, one living room that is alongside the kitchen, and other utility rooms, is 110 m2. It was assumed that four persons occupy the building, in accordance with the conventional occupancy schedule in Korea [35]. The building was assumed to be occupied by four persons. The U-value of the exterior wall was assumed as 0.210 W/m2K, which is in accordance with the energy-efficiency building standard in Korea [36]. The south and north sides of the building are exposed to the outdoor air, while the east and west sides are adjacent to the other residential buildings. The window in Figure 2 was used in the energy simulation, and the window-to-wall ratio was assumed as 50%, which is commonly applied to residential buildings in Korea [37].The total U-value of the window, which was obtained from the THERM simulation and Equation (4), was used as an input parameter of the energy simulation. No mechanical ventilation system was considered for the building. Instead, it was assumed that the building has a constant infiltration rate of 0.6 ACH [36]. For each case of Table 3, the energy simulations were conducted with different λeq values (0.1 W/mK to 8.0 W/mK). The input parameters of the energy simulation are summarized in Table 6. The hourly simulation during the heating season was carried out using the meteorological data of Seoul.

4. Results and Discussion

4.1. Condensation Prevention Performance

The simulation results show a clear relation between the λeq of the spacer and the temperature factor, as described in Figure 9. The results show that the TIS raises the temperature factor by an amount from 0.06 to 0.08 (from 9% to 12%), depending on the window type. Also, the temperature factor shows a relatively large change when the λeq is less than 1.0 W/mK, indicating that the TIS can be effective in the increasing of the temperature factor of the window, or in the reduction of the condensation risks. In addition, the variation of the temperature factor can be approximated as a logarithmic function of the λeq, which can be formulated by the following equation:
f T = a ln ( λ e q ) + b ,
where the coefficient “a” indicates the change rate of the temperature factor with respect to the logarithmic change of the λeq, which can be regarded as the relative impact of the λeq on the temperature factor. The larger the absolute value of “a” is, the more impact the λeq has on the temperature factor. The coefficient “b” can be considered as the maximum possible temperature factor, which can be realized by the TIS with the near-zero λeq. Figure 9 shows that the high-performance windows (e.g., triple glazing with the low-e coating) result in the higher absolute value of “a” and “b”; that is, the TIS impact on the condensation prevention is greater when it is applied to higher-performance windows.
The increased temperature factors indicate that the TIS can cause the condensation at lower outdoor temperatures compared with the conventional spacers. Figure 10a shows the outdoor temperature at which the condensation starts to occur, which is calculated using Equation (3). In the case of “D-Leno-Air”, the condensation starts to occur at −2.8 °C when the conventional spacer (λeq = 8.0 W/mK) is applied; however, the TIS (λeq = 0.1 W/mK) can make the window resist the condensation until the outdoor temperature drops to −7.0 °C. The condensation can therefore be prevented at an outdoor temperature that is 4.2 °C lower through the replacement of the conventional spacer with the TIS. Depending on the window type, the TIS enables the prevention of the condensation at an outdoor temperature that is 4.2 °C to 15.7 °C lower compared with the conventional spacer.
Using the typical meteorological data of Seoul, the annual time-of-condensation occurrence was calculated, as shown in Figure 10b. The annual time was profoundly reduced when the λeq is less than 1.0 W/mK, or when the TIS was applied to the window; furthermore, the condensation risk was reduced down to nearly zero when the λeq is less than 0.4 W/mK for the low-e-coated double-glazing or triple-glazing windows.

4.2. Energy Saving Performance

Figure 11 shows that the reduction of the total U-value is relatively large when the λeq is less than 0.1 W/mK, or the TIS is applied to the window. It was found that the TIS can reduce the total U-value by an amount from 0.07 W/m2K to 0.13 W/m2K, depending on the window type. This result implies that the TIS can reduce the heat loss through the investigated window by a rate from 2.8% to 8.2%.
Similar to the analysis of the temperature factor, the impact of the TIS on the U-value reduction increased when it was applied to the higher-performance glazing (e.g., triple glazing). Figure 12 shows the reduction ratio of the total U-value when the infill gas or the TIS was applied to various glazing systems. In each case, the effect of the TIS on the U-value reduction increased when it was applied to the low-e-coated glazing. Moreover, in the case of the triple glazing, the contribution of the TIS became more than that of the infill gas. The TIS can therefore be an effective measure in the reduction of the heat loss, considering that the higher-performance glazing is increasingly applied to residential buildings.
Figure 13 shows the simulation results regarding the maximum heating load and the heating-energy consumption; here, the low values of the λeq did not lead to a significant reduction of the maximum heating load. Depending on the window type, the maximum heating load was reduced by a rate from 0.9% to 2.1% with the application of the TIS; however, the heating-energy consumption was reduced by a rate from 3.0% to 6.3%, which is relatively larger than the reduction of the maximum heating load. This finding implies that the TIS is effective in saving the heating energy, although it does not have significant influence on the reduction of peak design load.
The simulation results also proved that the reduction rate of the heating-energy consumption increased when the TIS was applied to the high-performance glazing. For instance, in the case of “D-Leno-Air”, the heating-energy consumption was reduced from 20.7 kWh/m2 to 20.1 kWh/m2 (reduction rate = 3%), when the λeq was reduced from 8.0 W/mK to 0.1 W/mK. In the case of “T-Les-Ar”, however, the heating-energy consumption was reduced from 13.7 kWh/m2 to 12.9 kWh/m2 (reduction rate = 6.3%). These results show that the energy saving effect of the TIS becomes more influential as the performance of the windows is improved with multiple glazing, low-e coatings, and gas fills.
Further, the energy-saving effect of the TIS is almost the same as that of the infill gas. For example, the heating-energy consumption of the “T-Leno-Air” with a λeq of 0.1 W/mK is 15.6 kWh/m2, while that of the “T-Leno-Ar” with a λeq of 8 W/mK is 15.8 kWh/m2. The TIS can therefore be recommended as an alternative energy-saving measure when it is difficult to apply the infill gases to the multiple glazing.

4.3. Development of Monographs for Spacer Selection

The total U-value is one of the most common performance indicators of windows in terms of the thermal performance. In general, a low total U-value represents an effective insulation that can also lead to a high condensation prevention performance. As a window design needs to satisfy the performance criteria in terms of the condensation prevention as well as the energy saving performance, it is necessary to examine the relation between the temperature factor and the total U-value.
Figure 14 shows the variation of the total U-values with the temperature factor when various window spacers (λeq = 0.1 W/mK to 8.0 W/mK) are applied to different window types. It is evident in this figure that a lower λeq results in a lower total U-value and a higher temperature factor; therefore, the TIS can improve the condensation prevention performance as well as the energy saving performance of windows. Given the linear relation between the total U-value and the temperature factor, the reduction of the total U-value leads to a linear increase of the temperature factor. Figure 14 can also be used to examine the extent to which the window spacer affects the thermal performance of windows in terms of condensation prevention and energy saving.
At the design stage, the appropriate λeq of the spacer is necessary to satisfy the performance criteria in terms of condensation prevention (temperature factor) and energy saving (total U-value). Figure 14 was therefore transformed so that a designer can determine the proper λeq to meet the design criteria of temperature factor and the total U-value, as shown in Figure 15.
The monograph is composed of the following two parts: The upper part is for the examination of the temperature factor, and the lower one is for the checking of the total U-value. In both parts, the x-axis represents the λeq in a logarithmic scale, and it is used to determine the proper λeq value. As the total U-value is dependent on the area of the window elements (e.g., the center-of-glazing, window edge, and frame), it was plotted with the frame-area ratios of 20%, 30%, and 40%, respectively, which was reported as common frame-area ratios for the PVC-framed window [38]. For simplicity, the cases for the low-e hard coating have not been plotted in the monograph.
This monograph can be utilized to determine the λeq when the performance requirements regarding condensation prevention (temperature factor) and energy saving (total U-value) are specified. For instance, if the window requirements mean that the U-value should be 2.0 W/m2K and the temperature factor should be 0.70, the “D-Les-Air” with the λeq of 5 W/mK can be an alternative, as shown in the lower part of Figure 15a. Regarding the temperature factor, however, the λeq of 5 W/mK cannot meet the required temperature factor of 0.70; therefore, the proper λeq can be determined by finding the intersection of the “fT = 0.70” line and the “D-Les-Ar” line in the upper part of Figure 15a. Lastly, the “D-Les-Ar” with the λeq of 0.5 W/mK can be an alternative to meet the both design requirements.
If a window requires higher energy saving (total U-value = 1.6 W/m2K) and condensation prevention (temperature factor = 0.72) performances, the “T-Les-Air” with the λeq of 2 W/mK can be an alternative, as shown in the lower part of Figure 15b. In this case, the spacer (λeq = 2 W/mK) can also meet the required temperature factor of 0.72, as shown in the upper part of Figure 15b.
The developed monographs can be implemented for the selection of an appropriate window spacer when the two design requirements, the total U-value and the temperature factor, are given. In the current design process, much attention is given for the determination of the total U-value of the window to comply with the energy saving regulations for residential buildings; however, a window can still be exposed to the condensation risks even though the U-value has been determined as energy saving-regulation compliant, as exemplified in Figure 15a. To deal with this problem, the TIS can be implemented as an alternative for the mitigation of the condensation risks, and the developed monographs can be applied to determine the proper λeq of the TIS.

4.4. Uncertainty Analysis

As the total U-value and the temperature factor in the monographs were calculated with numerical simulations, the effect of the parameter uncertainty needs to be considered in the simulation results. Even though this study assumed fixed values for boundary conditions and material properties, as shown in Table 4 and Table 5, the values can vary with the design conditions or window products. For this reason, the uncertainty analysis was conducted in order to estimate the impact of the parameter values on the total U-value and temperature factors. As this study focused on the window spacers, the properties of the spacer were kept constant, while other parameters such as the thermal property of the frame, heat transfer coefficients, and indoor/outdoor air temperatures were varied, as described in Table 7. Among the simulation cases listed in Table 3, case “D-Les-Air” was adopted for the uncertainty analysis, because it can represent the typical window performance in terms of the total-U value.
Figure 16 shows the temperature factor and the total U-value considering the variation of above-mentioned parameters. It can be found that the frame (PVC) thermal conductivity and outdoor/indoor air temperature do not have much impact on the analysis results, as shown in Figure 16a–c. It was also found that the outside heat transfer coefficient has a marginal impact on the analysis as described in Figure 16d; however, the inside heat transfer coefficient has much impact on the the temperature factor and the total U-value as shown in Figure 16e. As the inside heat transfer coefficient can vary with the room dimension, indoor air flow, heating methods, and so on, it is necessary to determine the proper heat transfer coefficient by conducting experimental studies or computational fluid dynamics. In addition, a further study needs to be conducted in order to predict more accurate performances under various conditions.

5. Conclusions

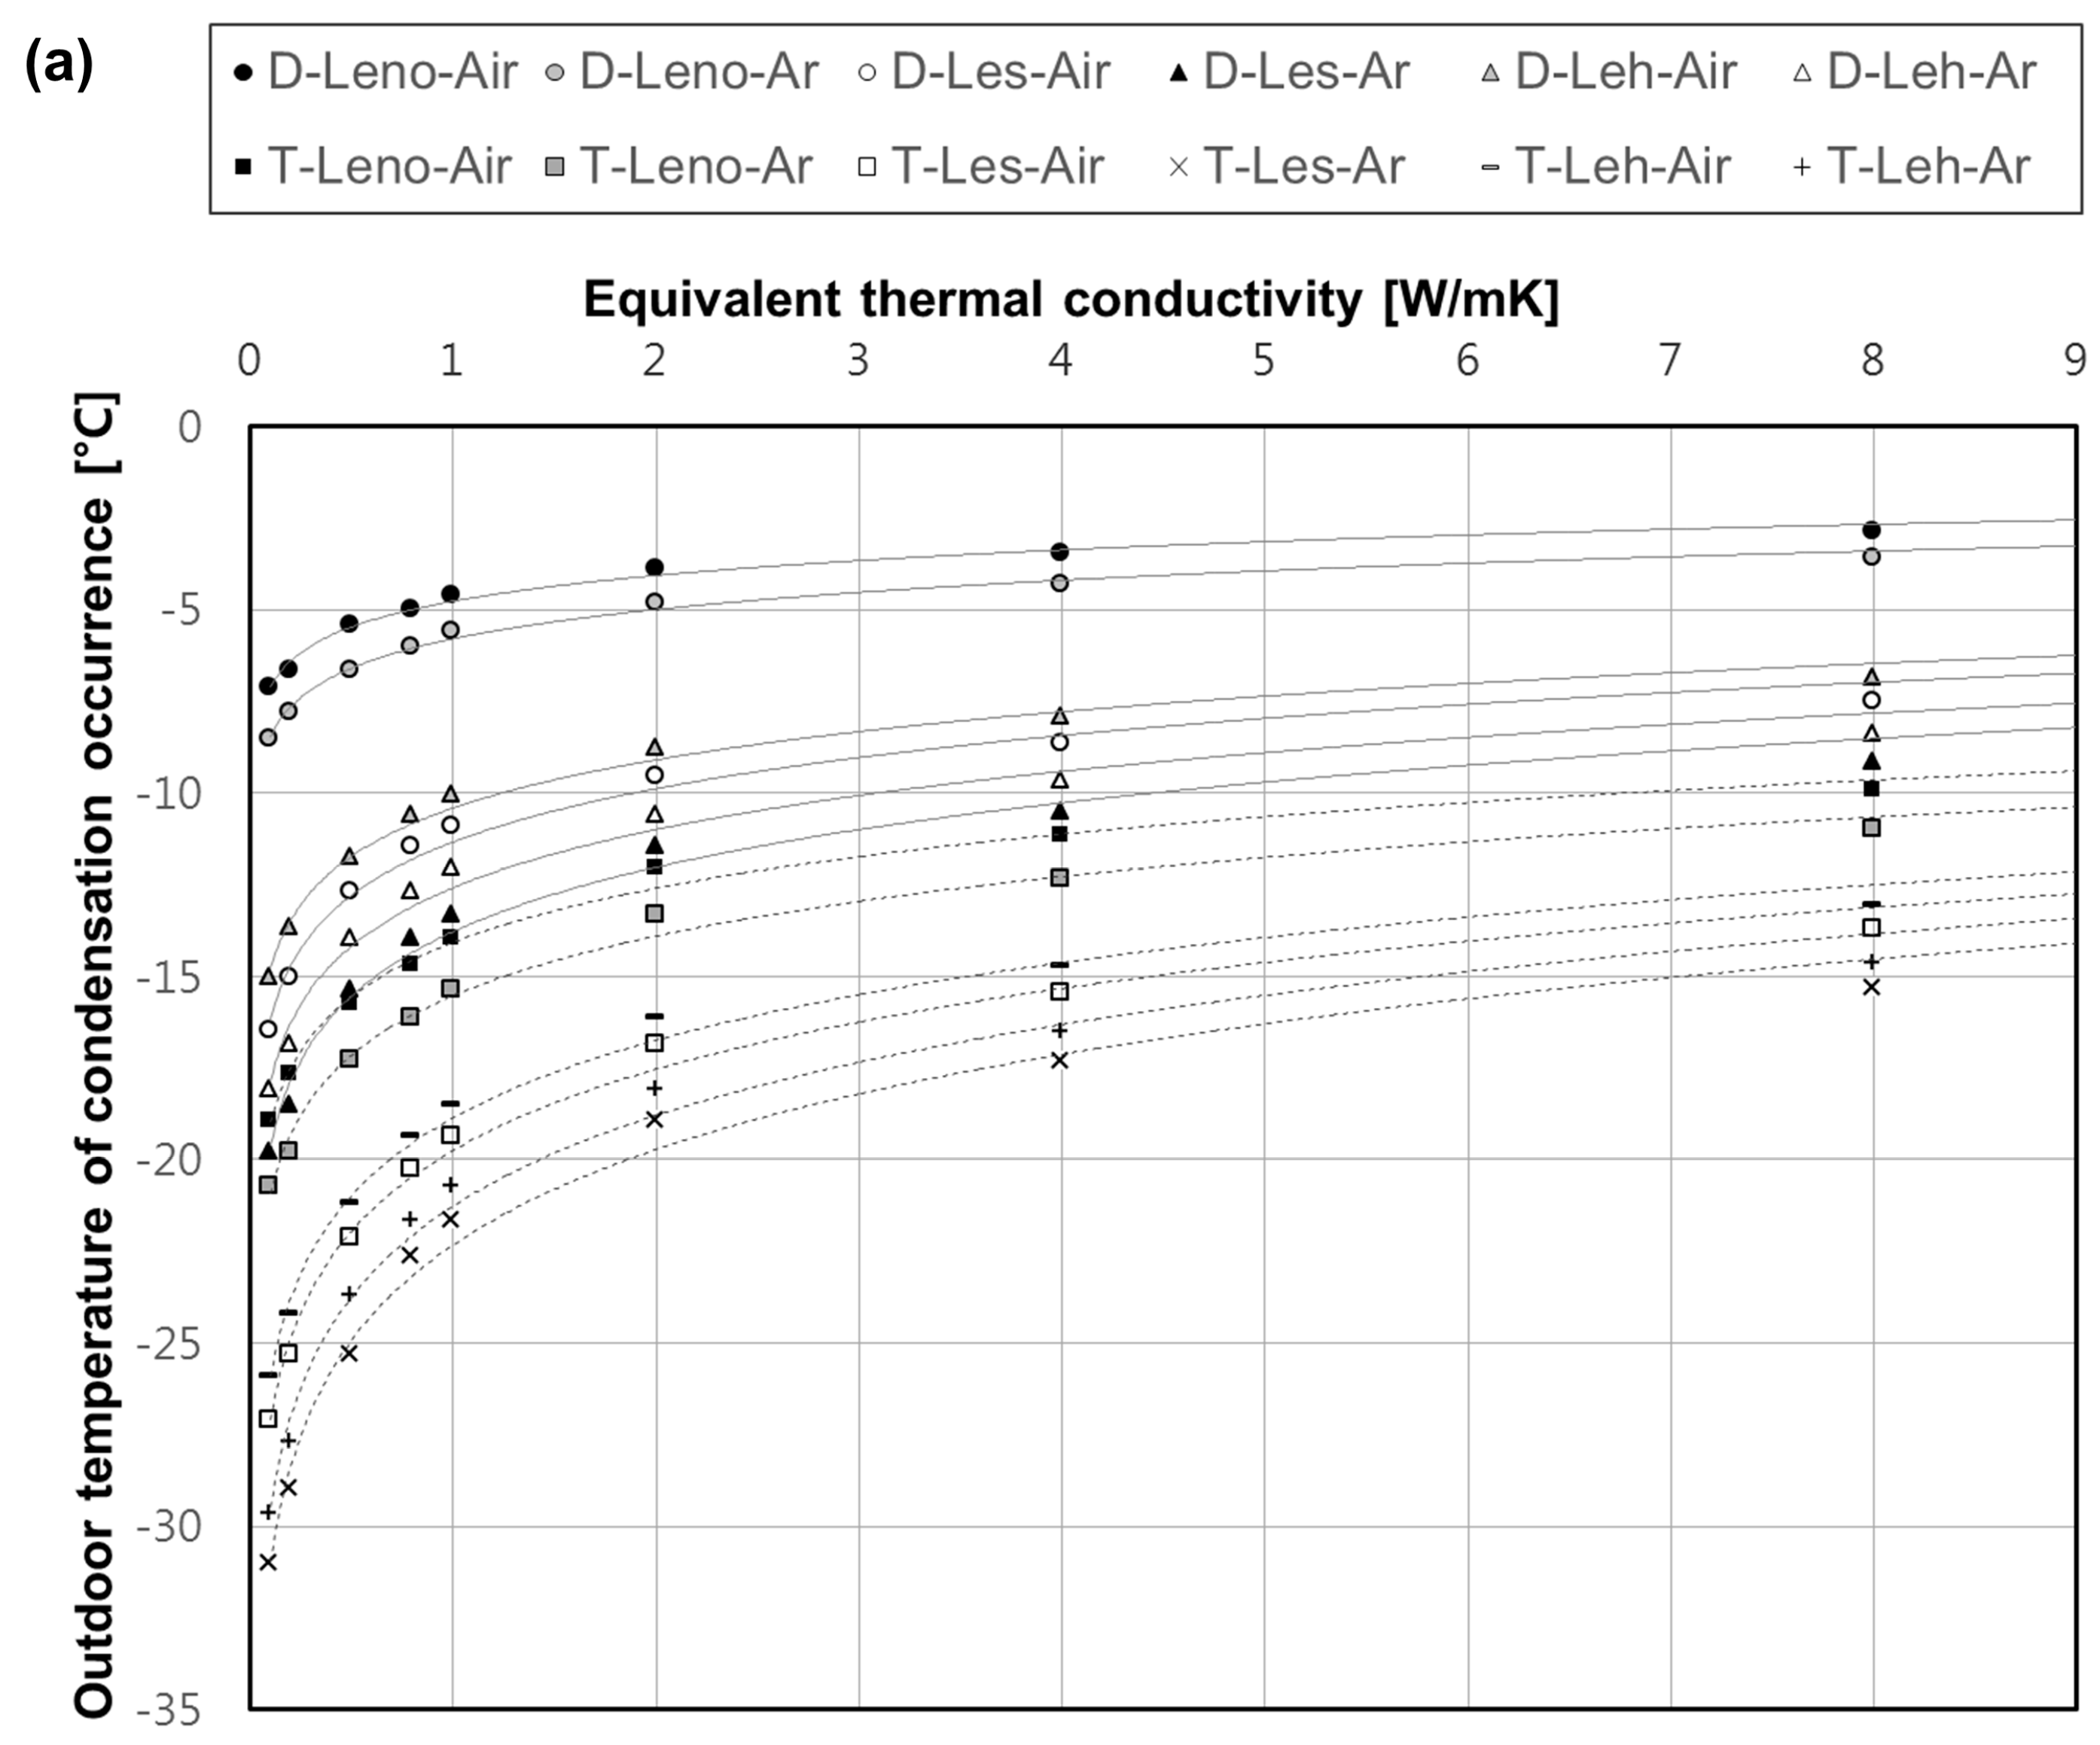
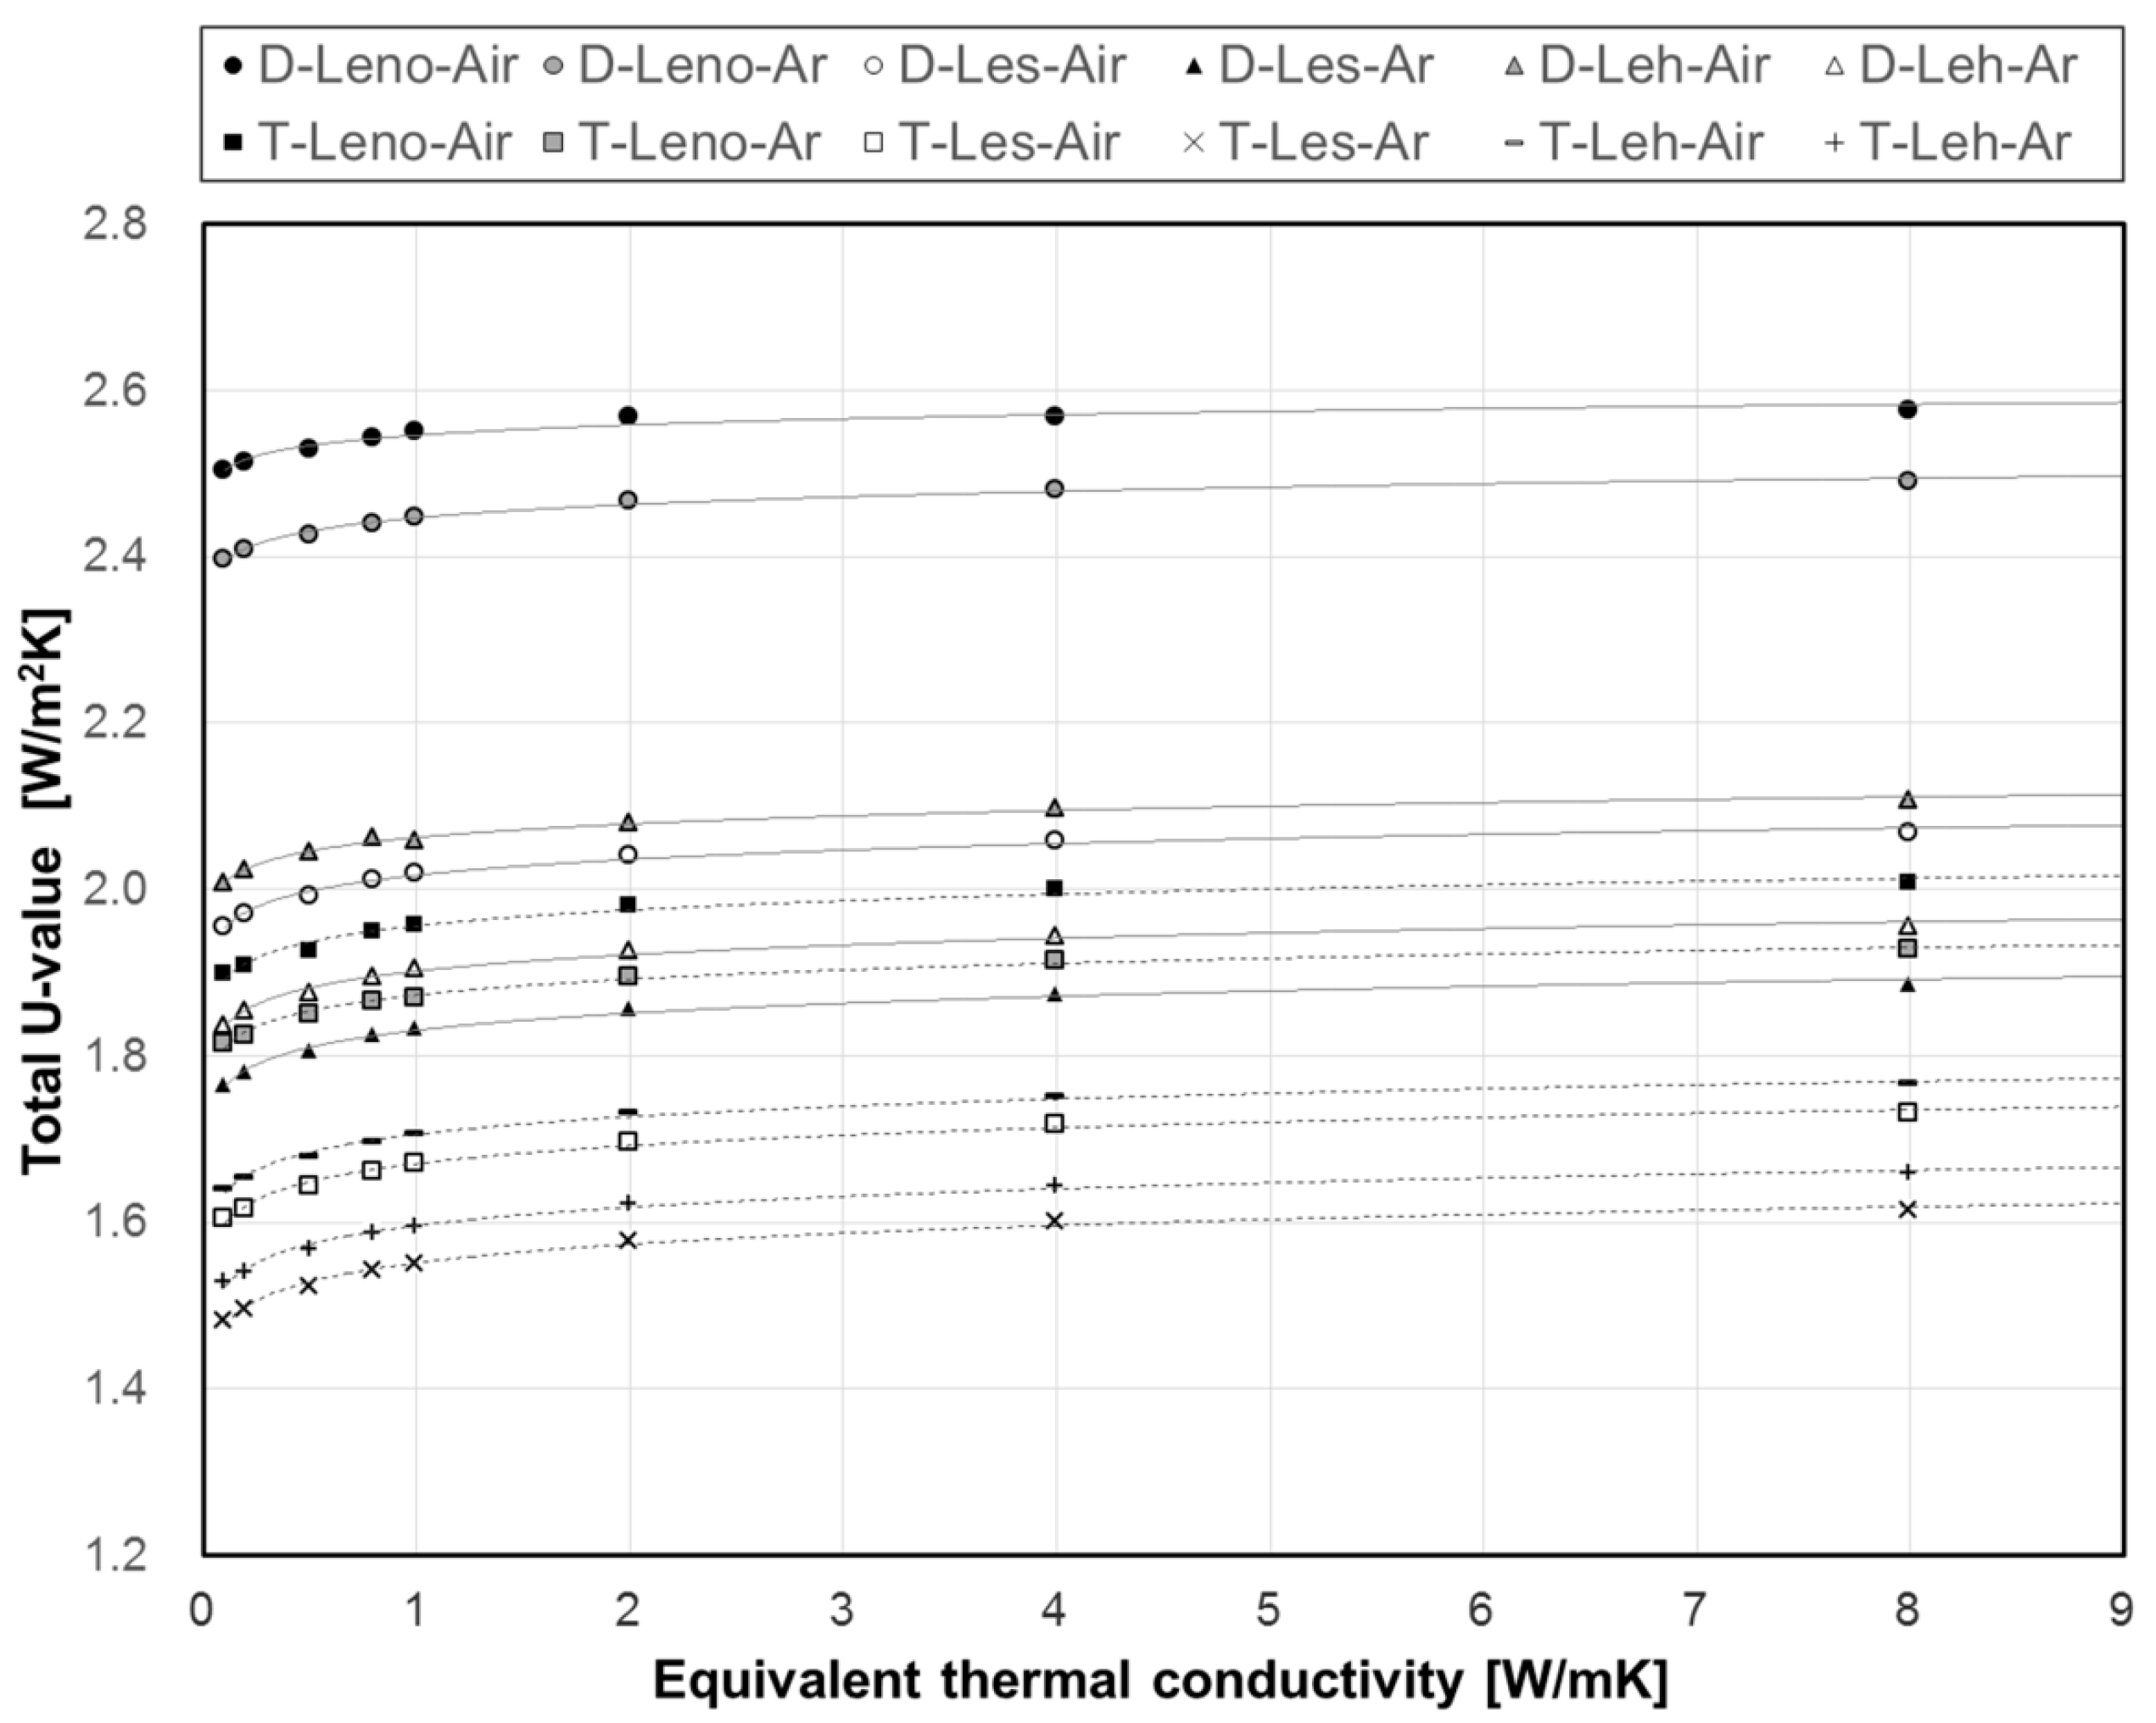
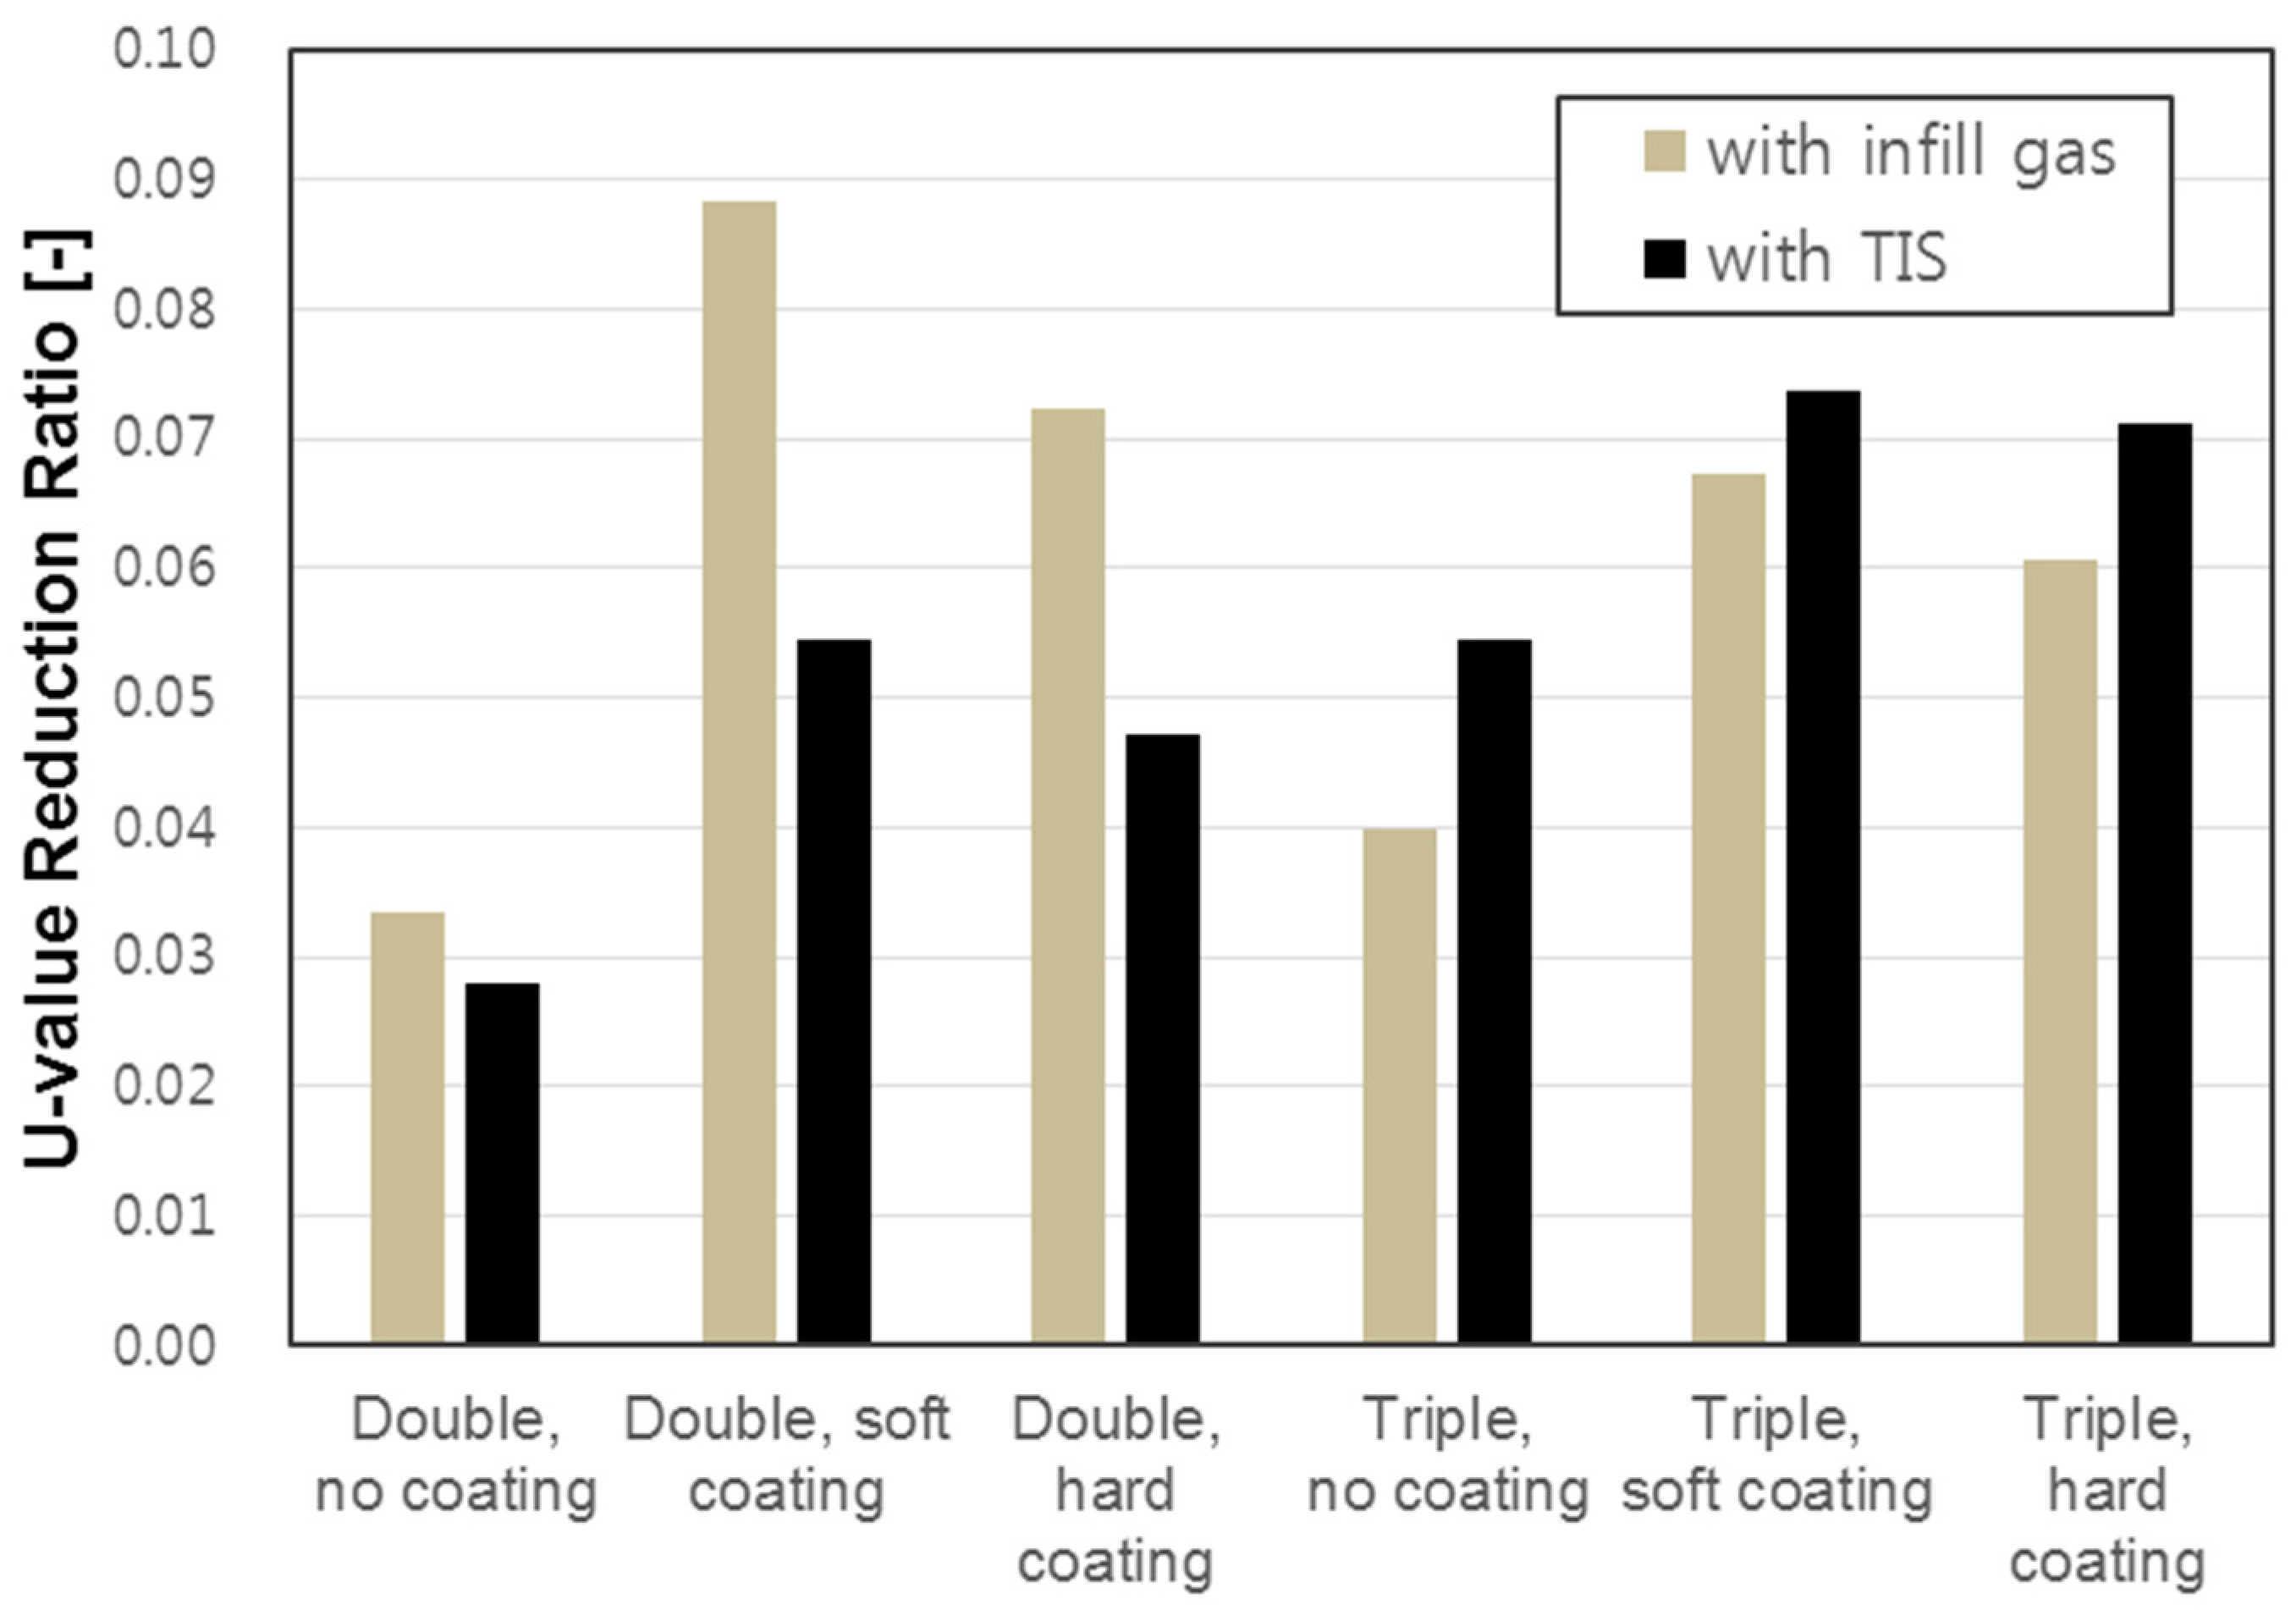
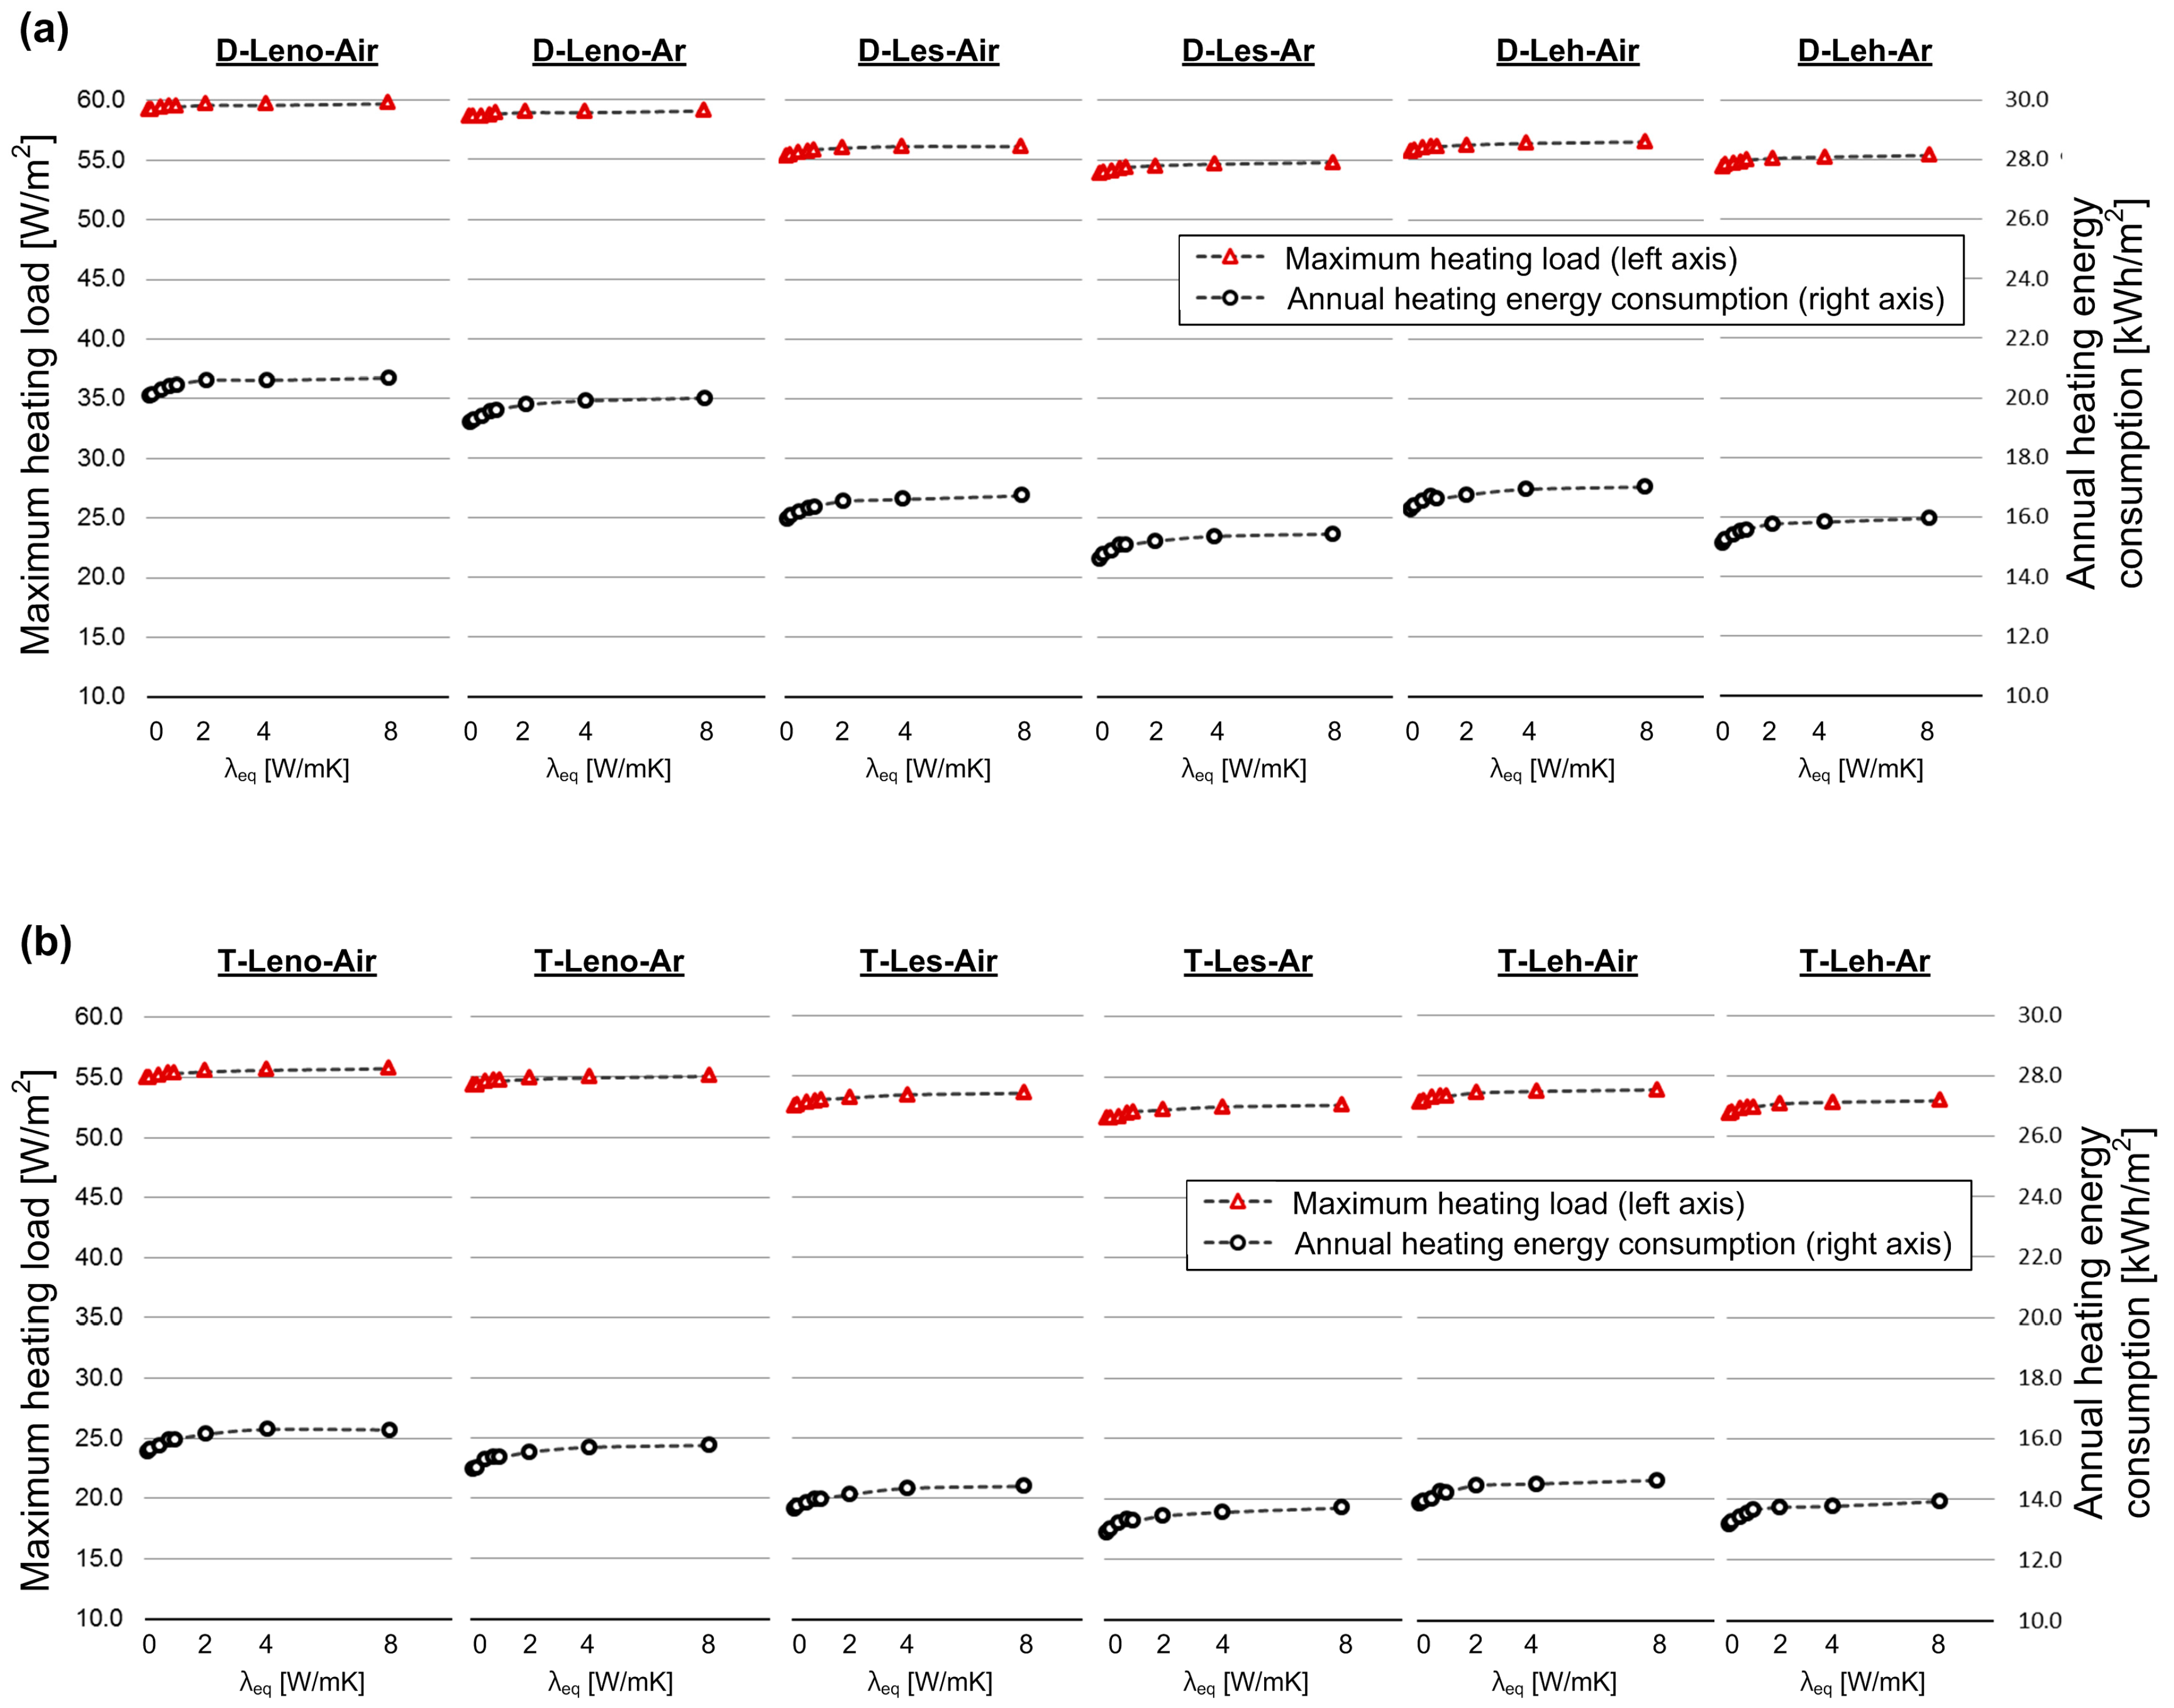
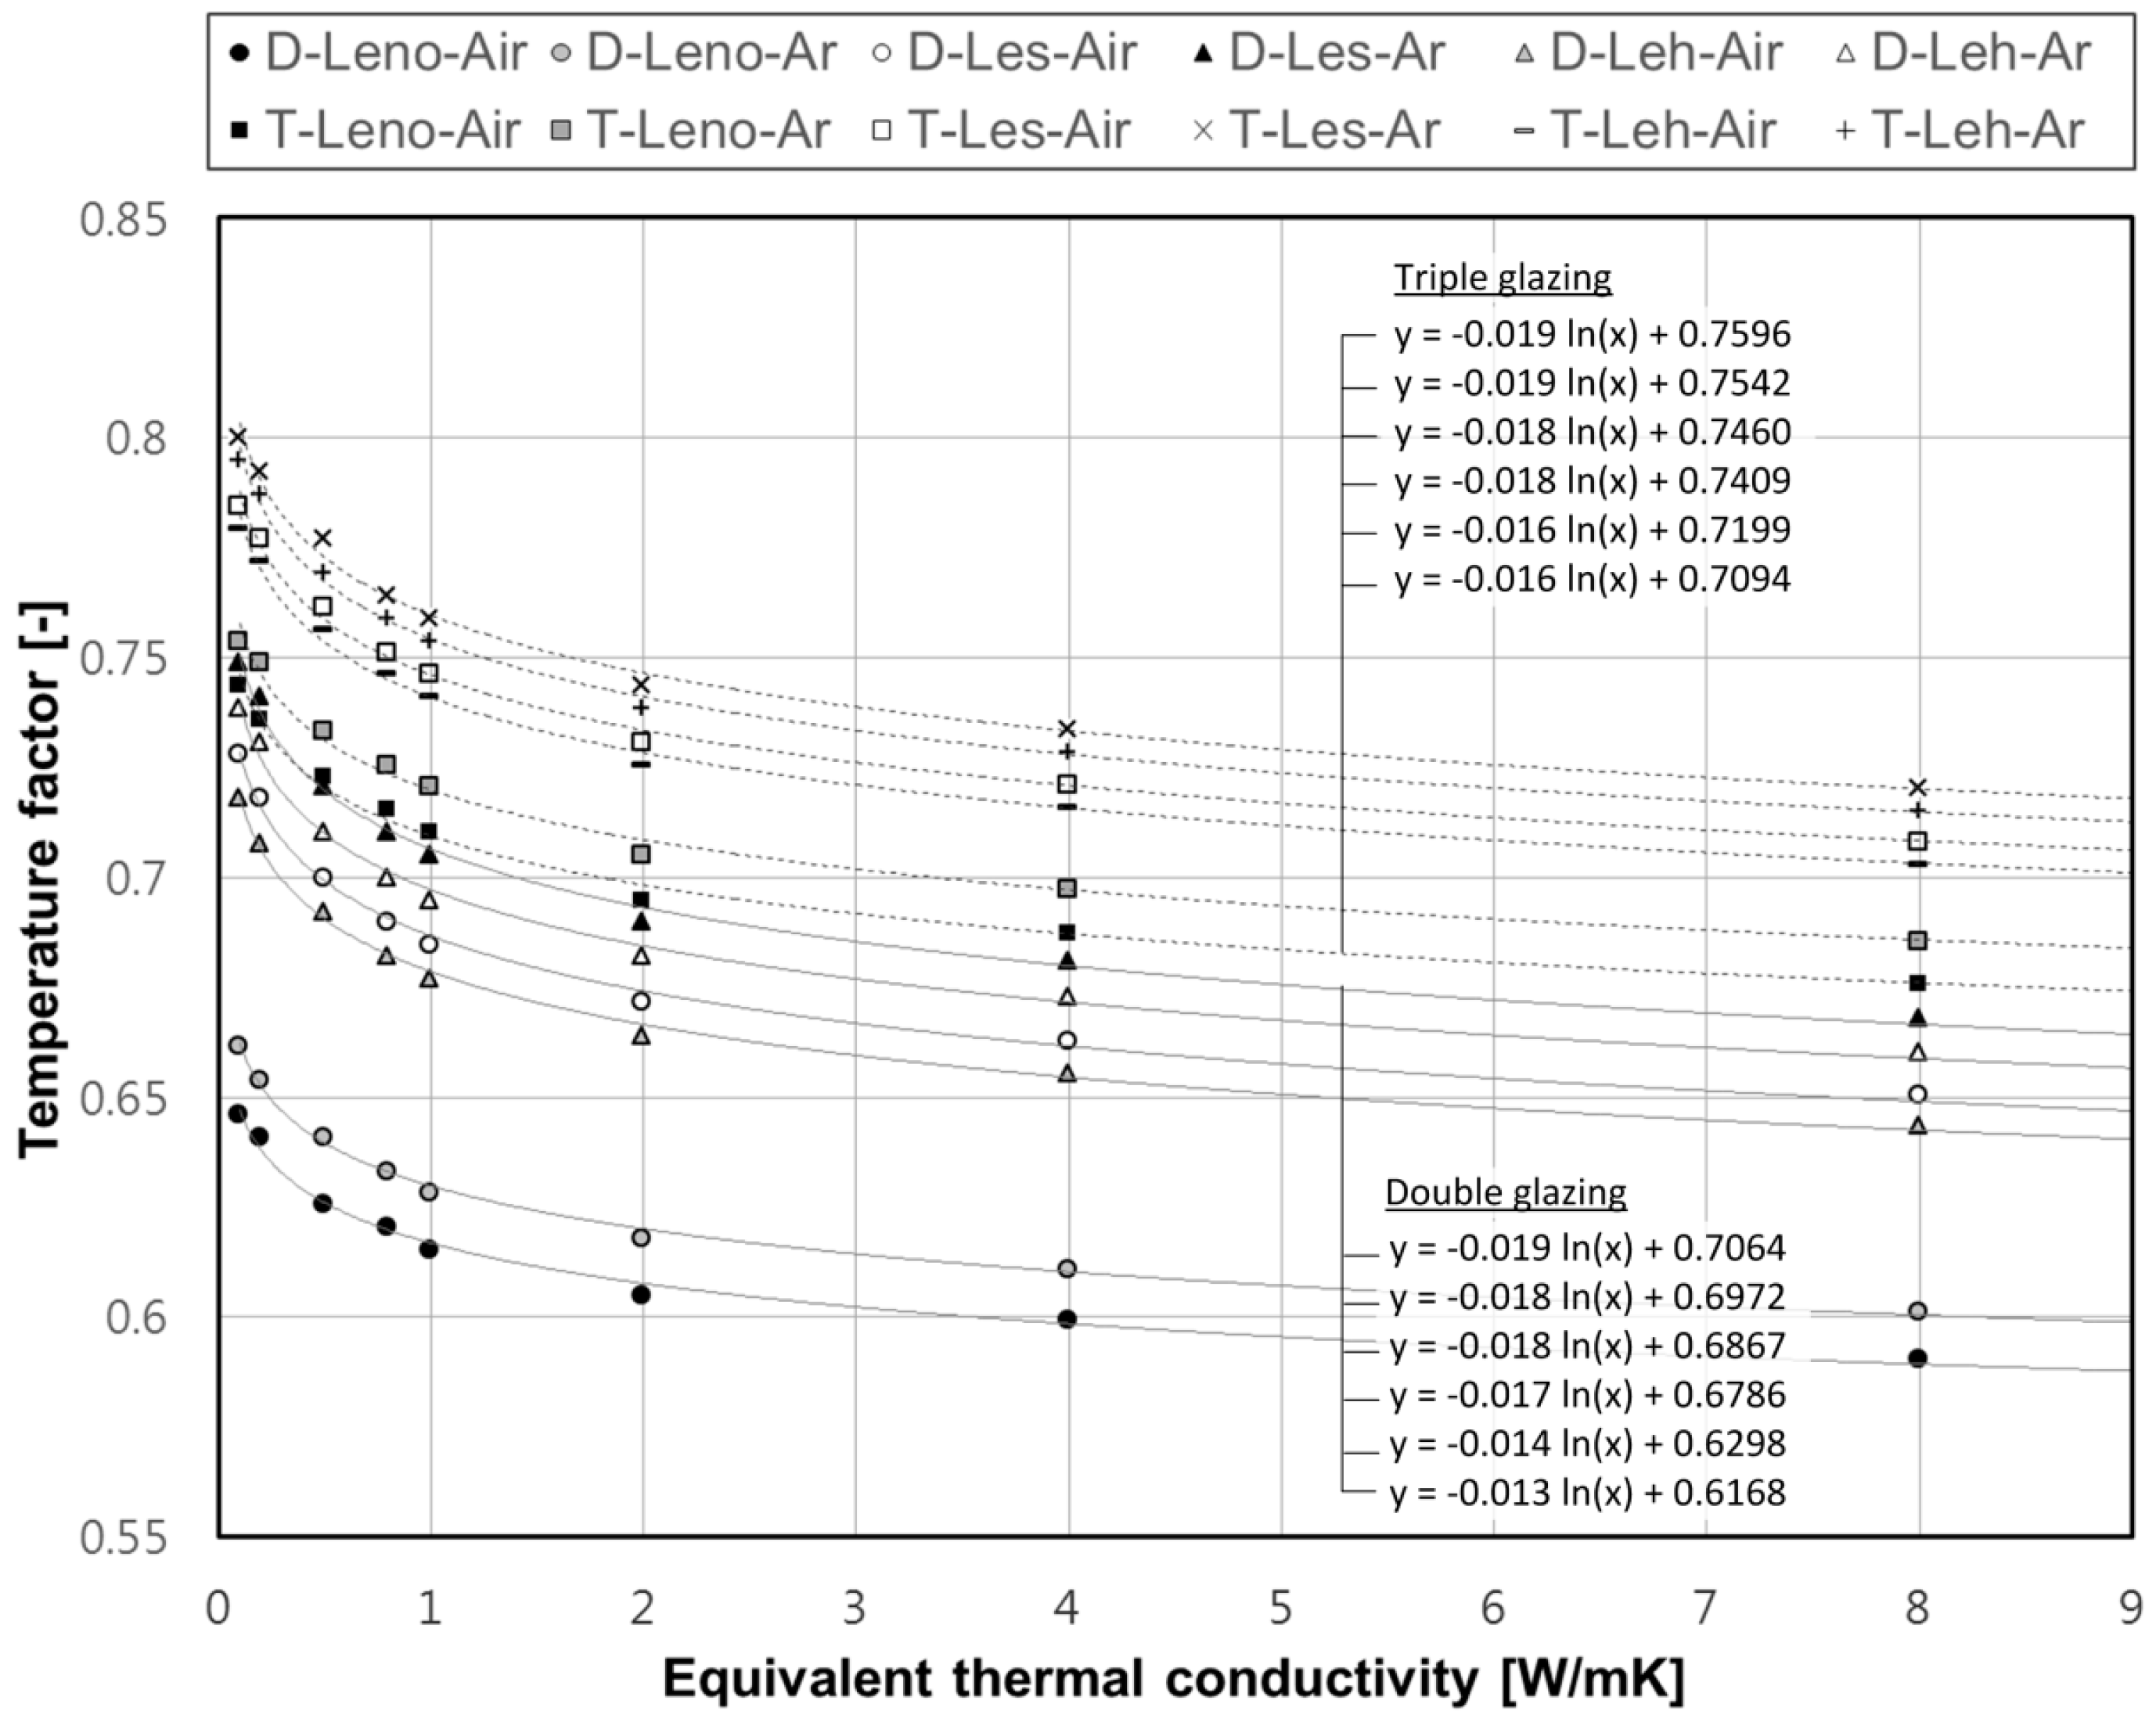
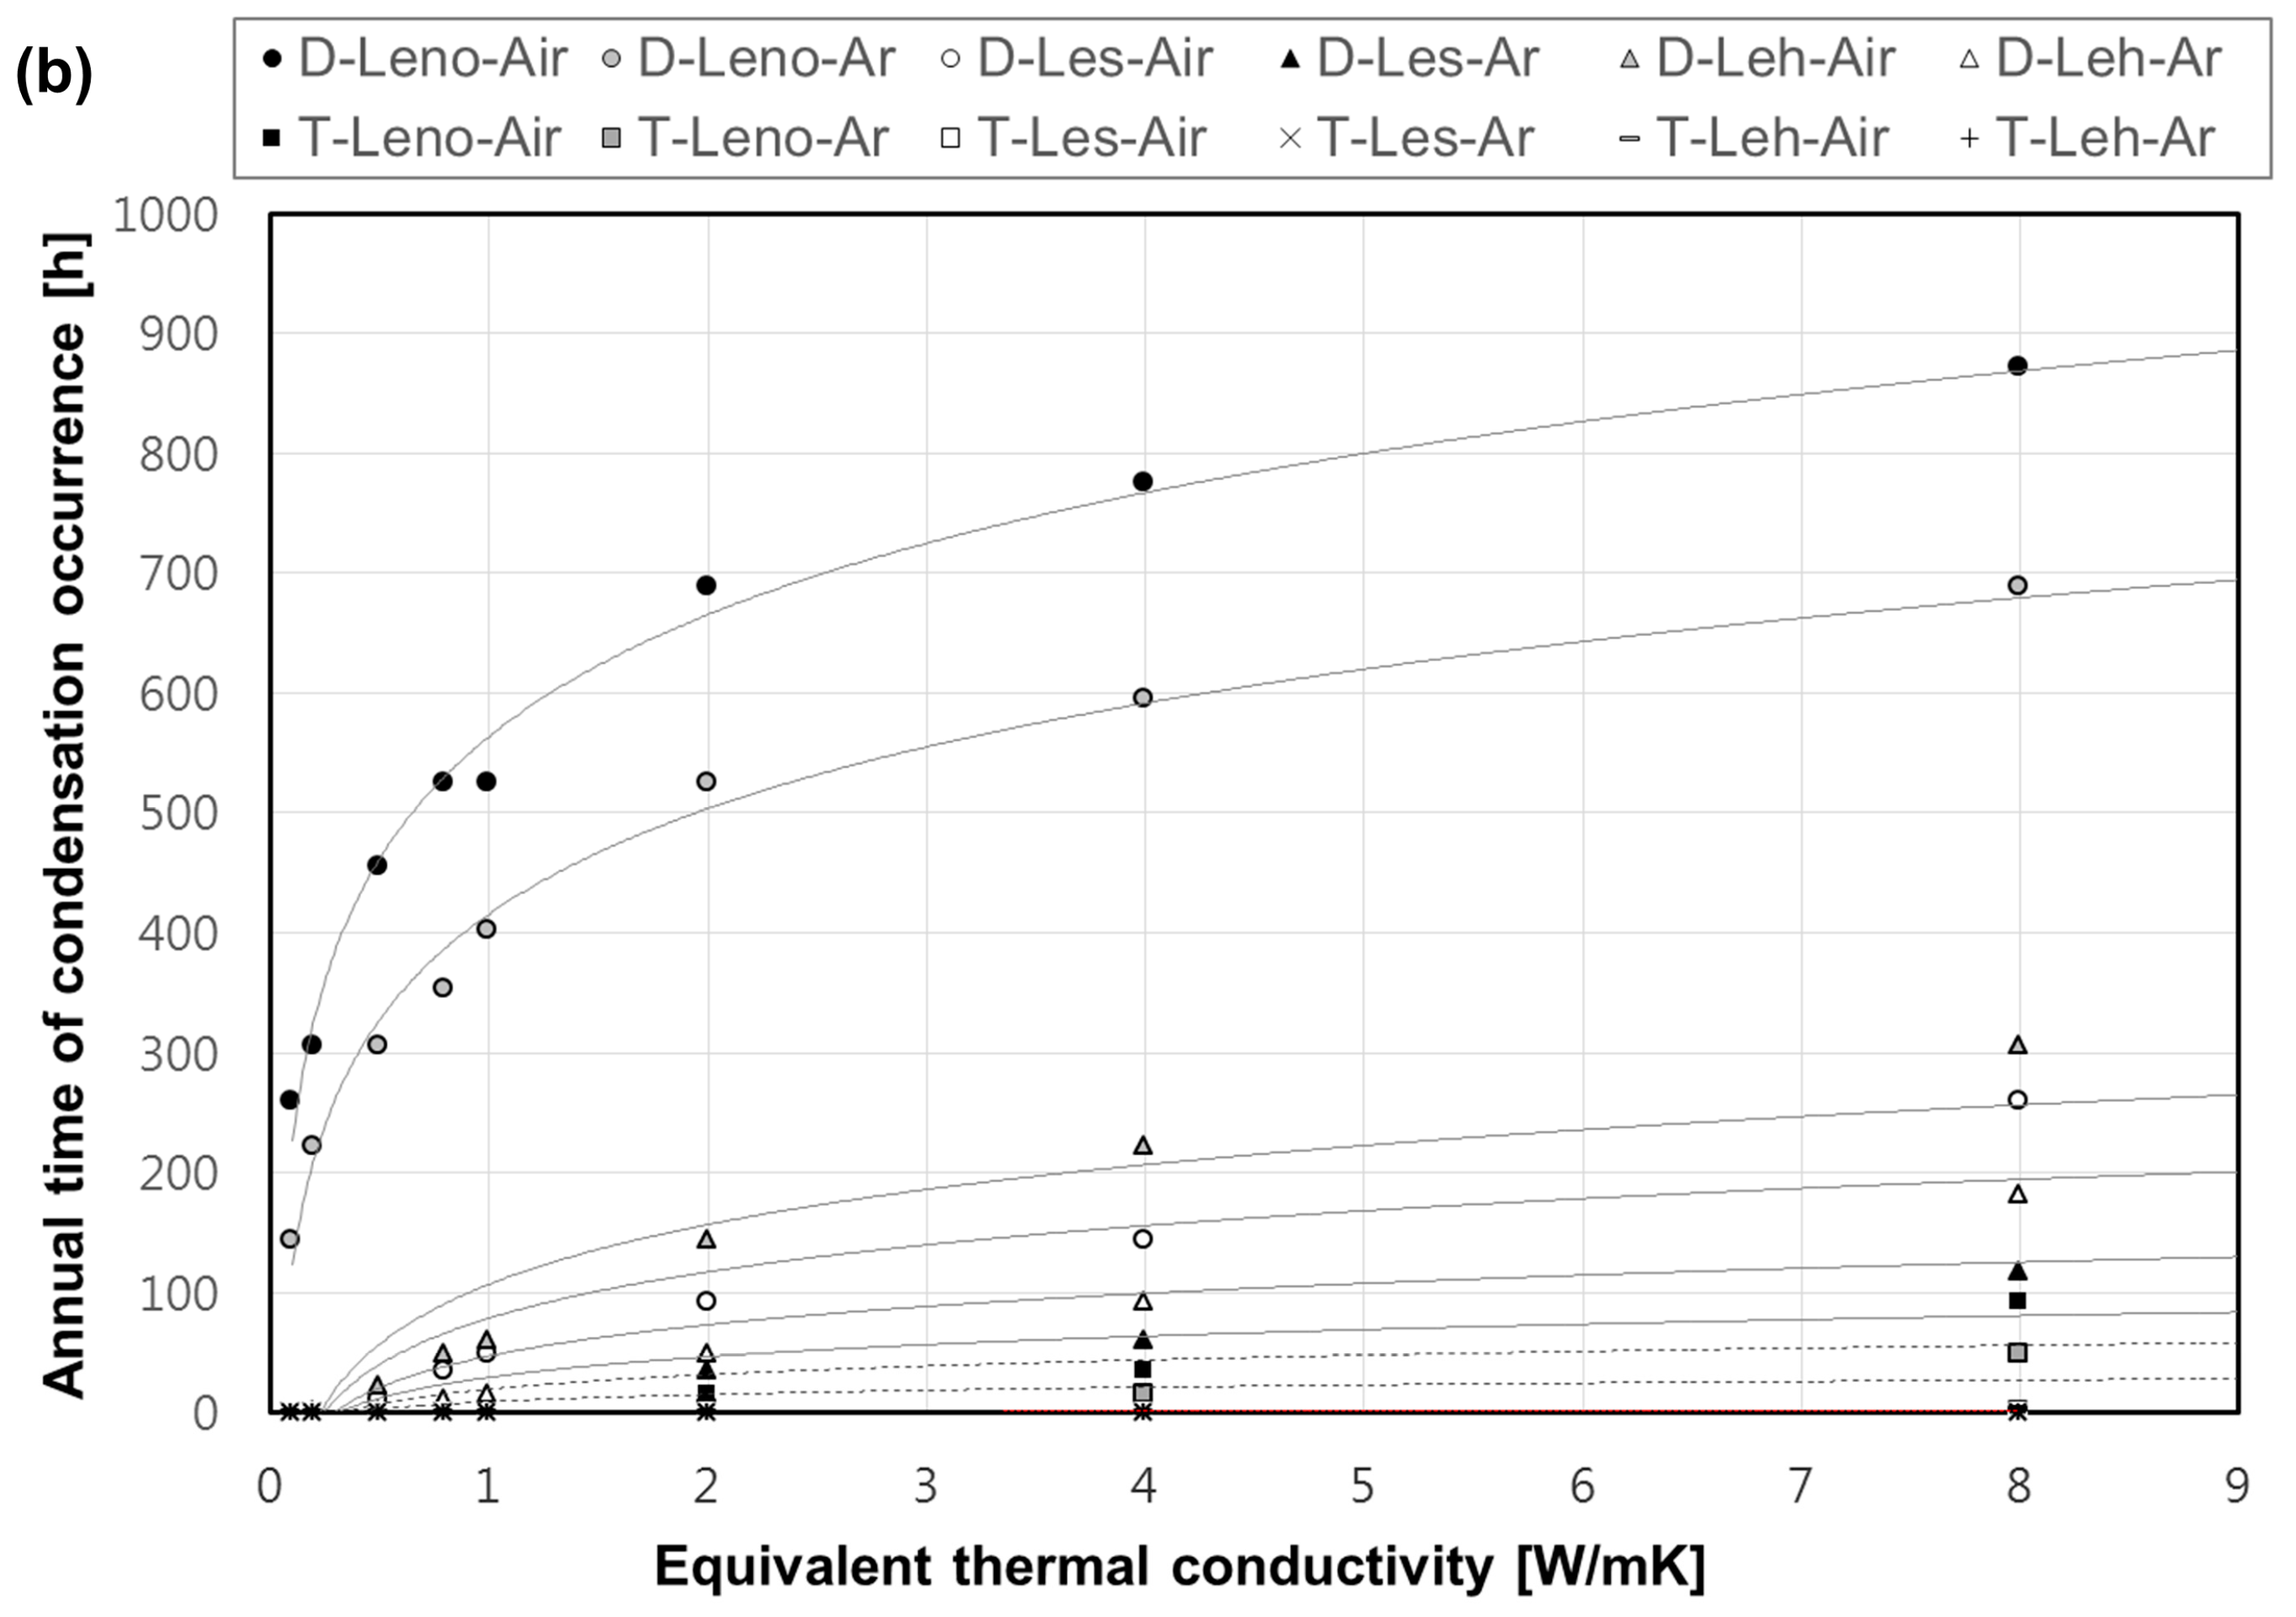
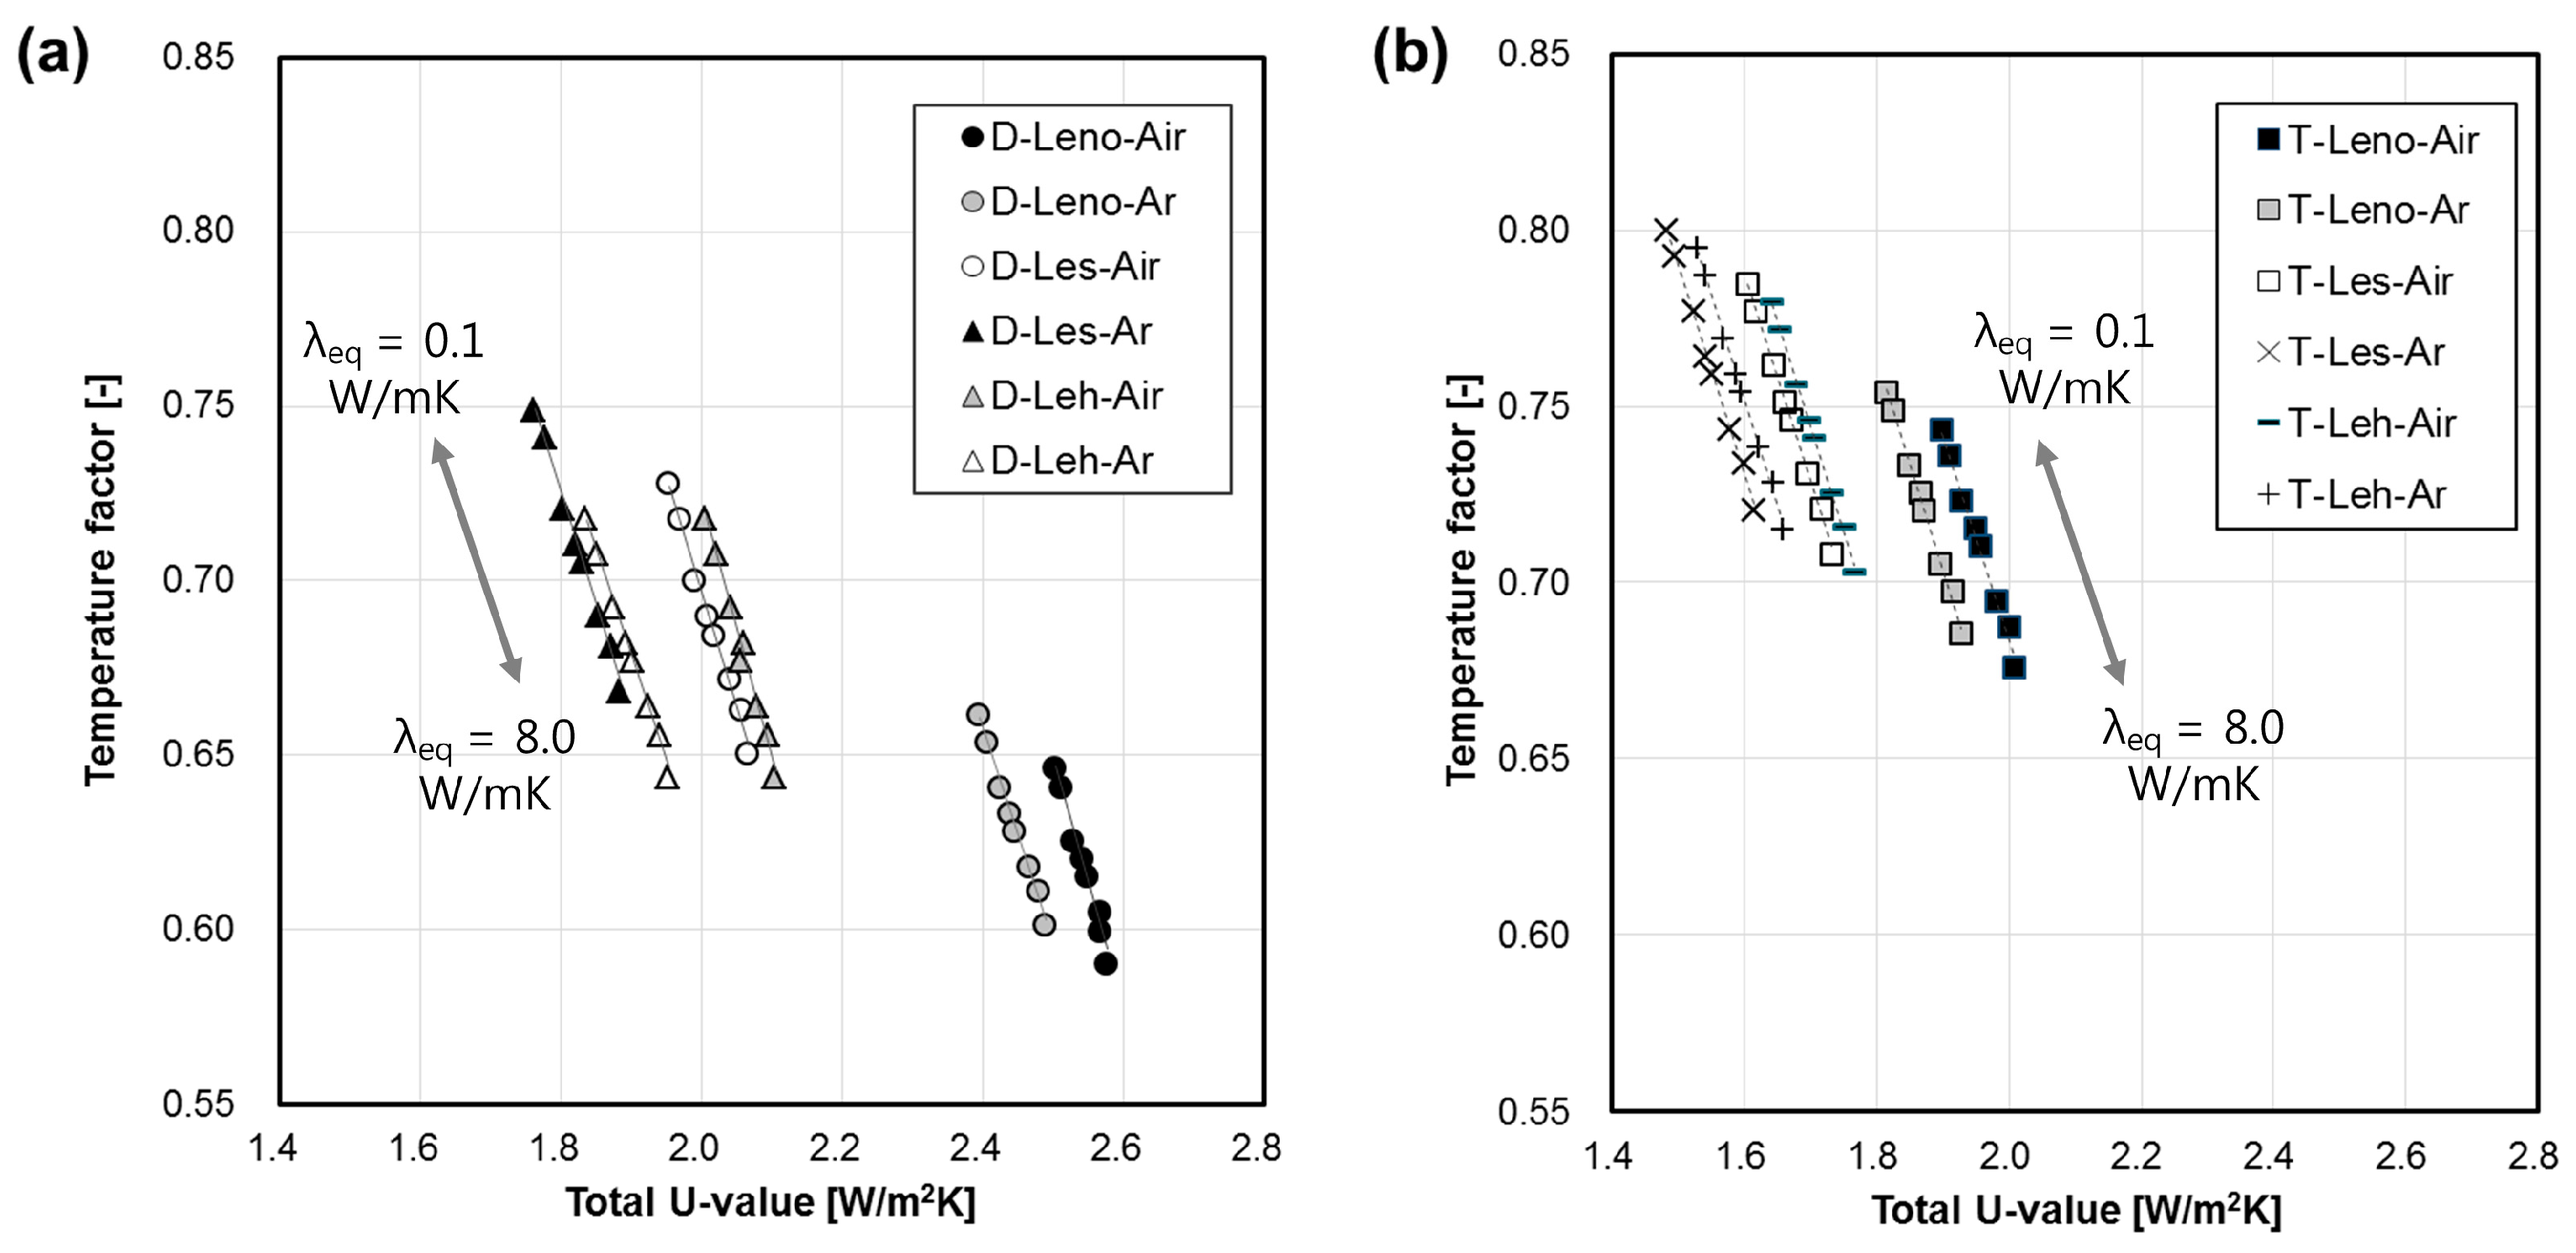
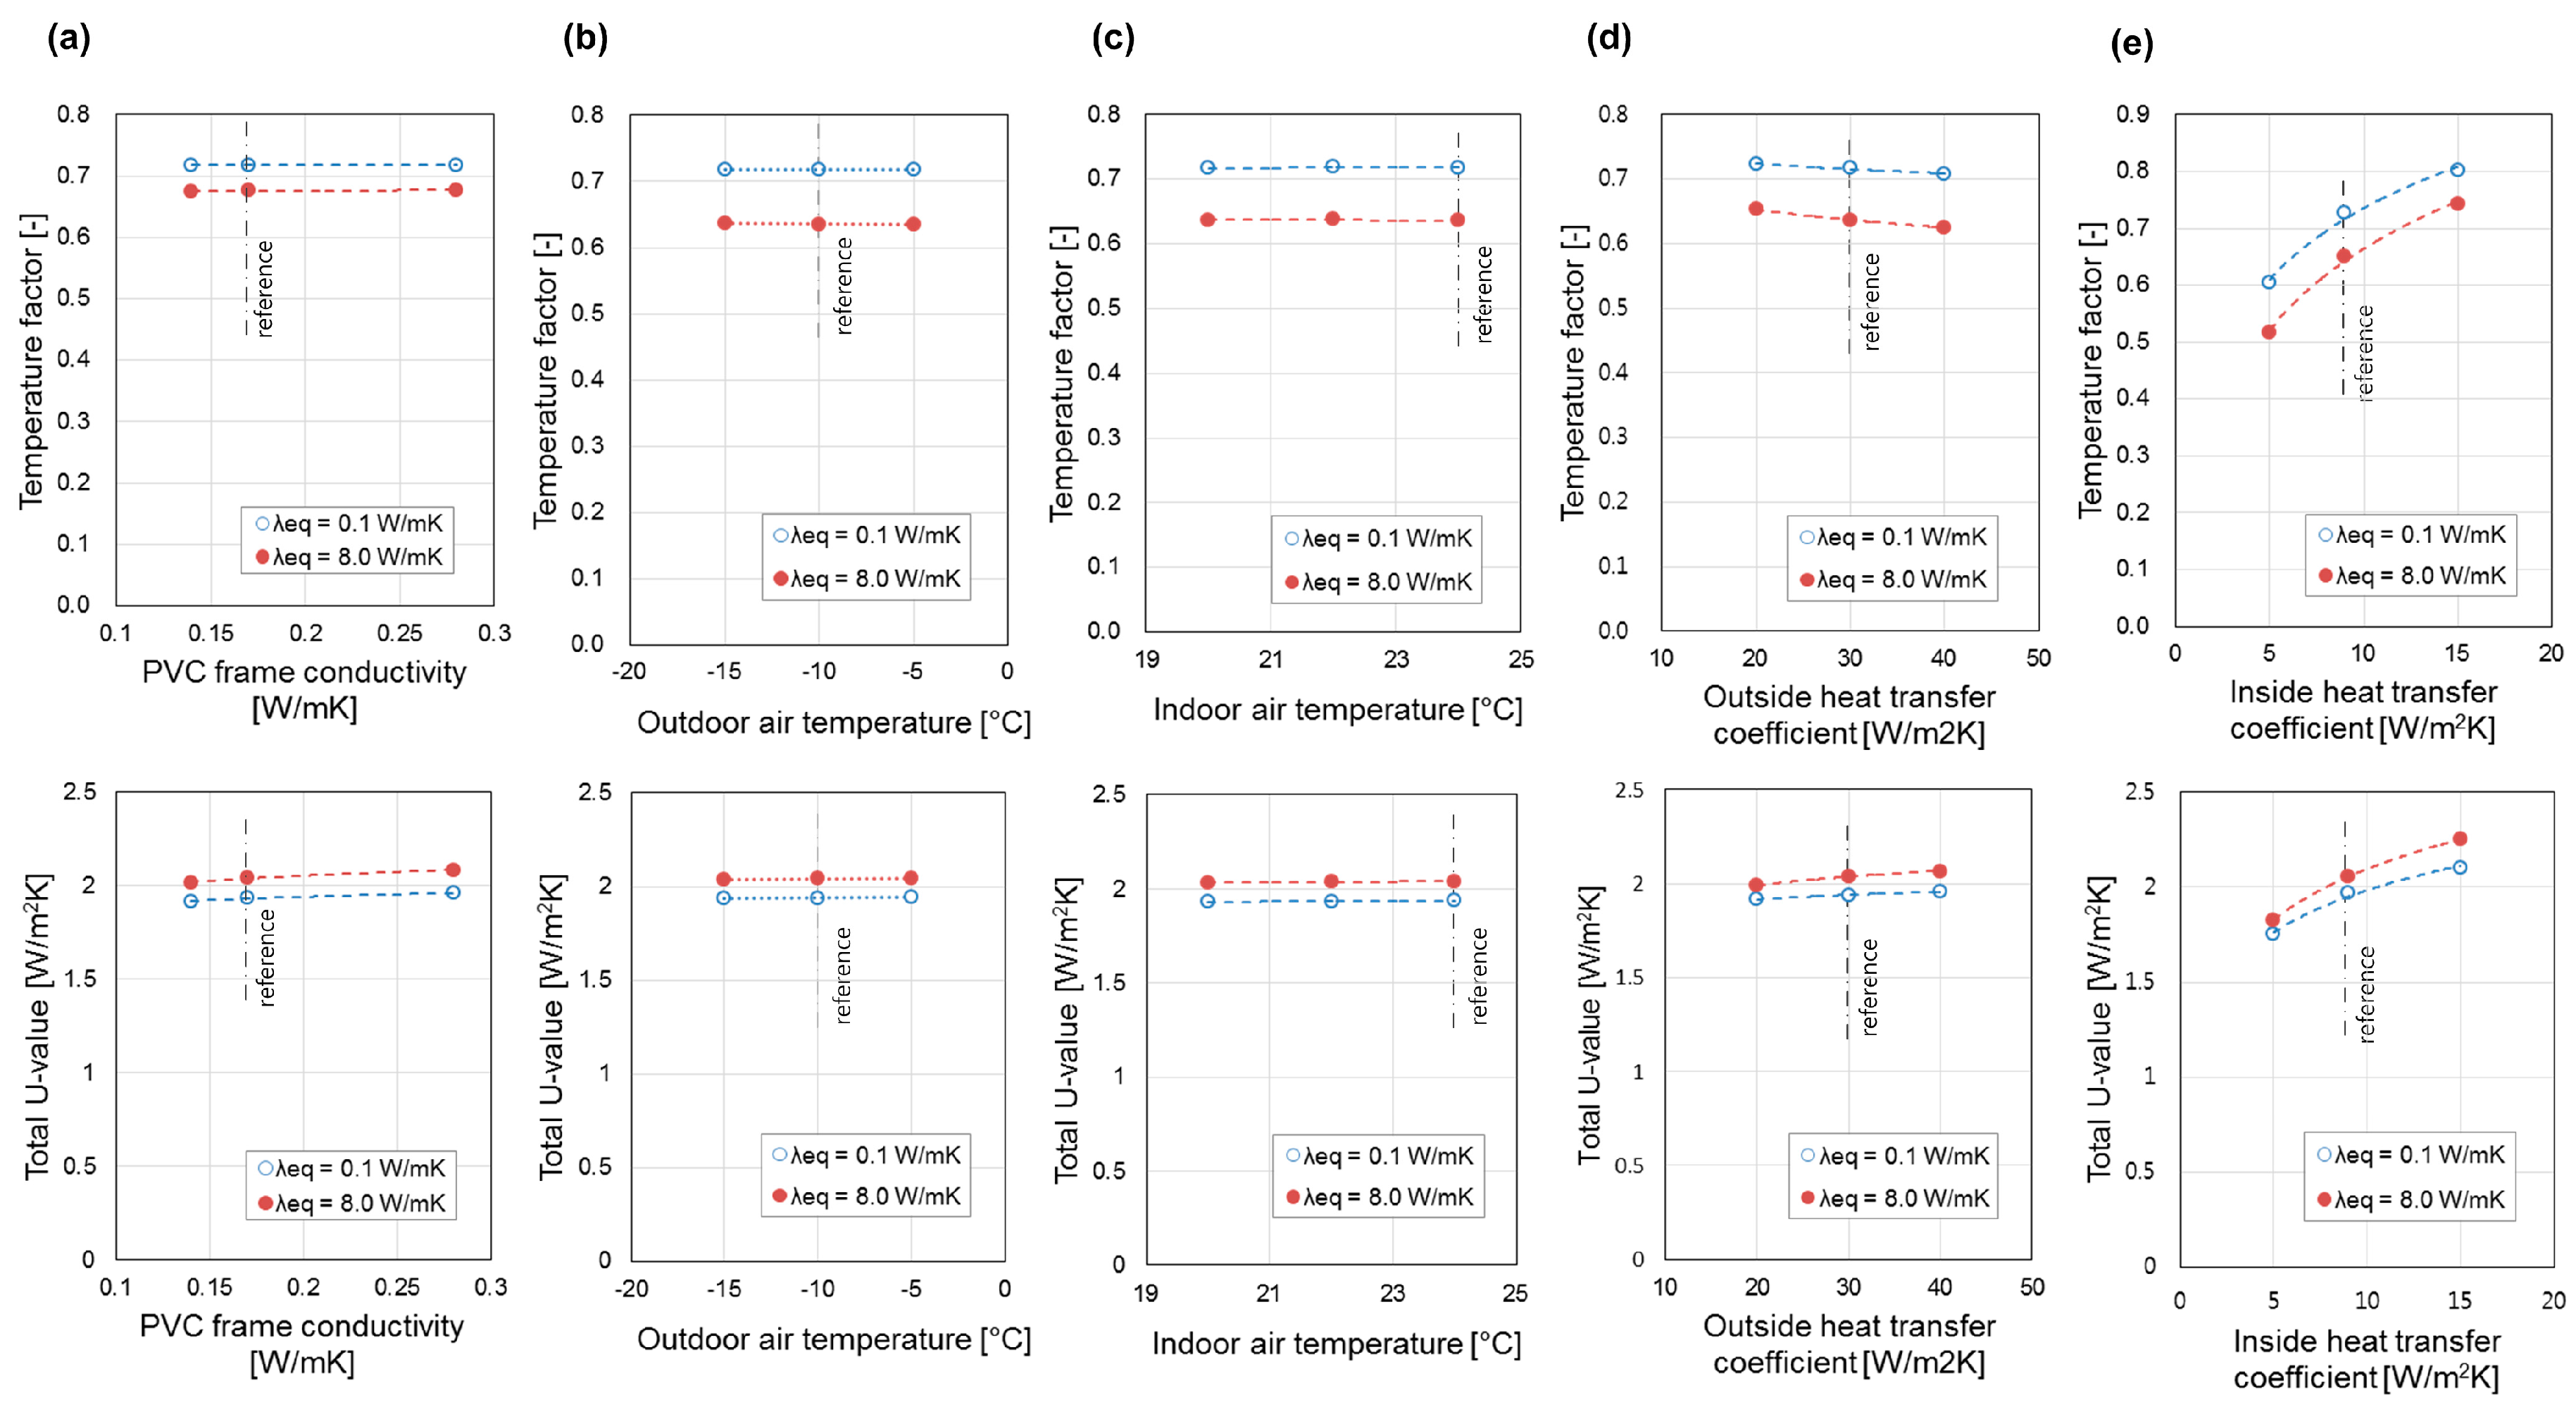
In this study, the impact of the window spacers on the total U-value and the temperature factor was numerically investigated with the THERM simulation. A two-box model was implemented for the simulation as it can facilitate the analysis of the complicated TIS with the acceptable accuracy. The whole building energy simulation was also conducted to quantify the impact of the spacers on the heating load and the annual heating-energy consumption. The simulation results showed that the employed thermally improved spacer (TIS) can increase the temperature factor by up to 12%, thereby resulting in a significant improvement of the condensation prevention performance. It was also shown that the employed TIS can reduce the total U-value by a quantity from 0.07 W/m2K to 0.13 W/m2K, implying that the reduction of the heat loss through the window is from 2.8% to 8.2%. The result of the whole building energy simulations proved that the TIS can reduce the maximum heating load by a rate from 0.9% to 2.1%, and it can save the heating-energy by up to a rate from 3.0% to 6.3%, depending on the window type.
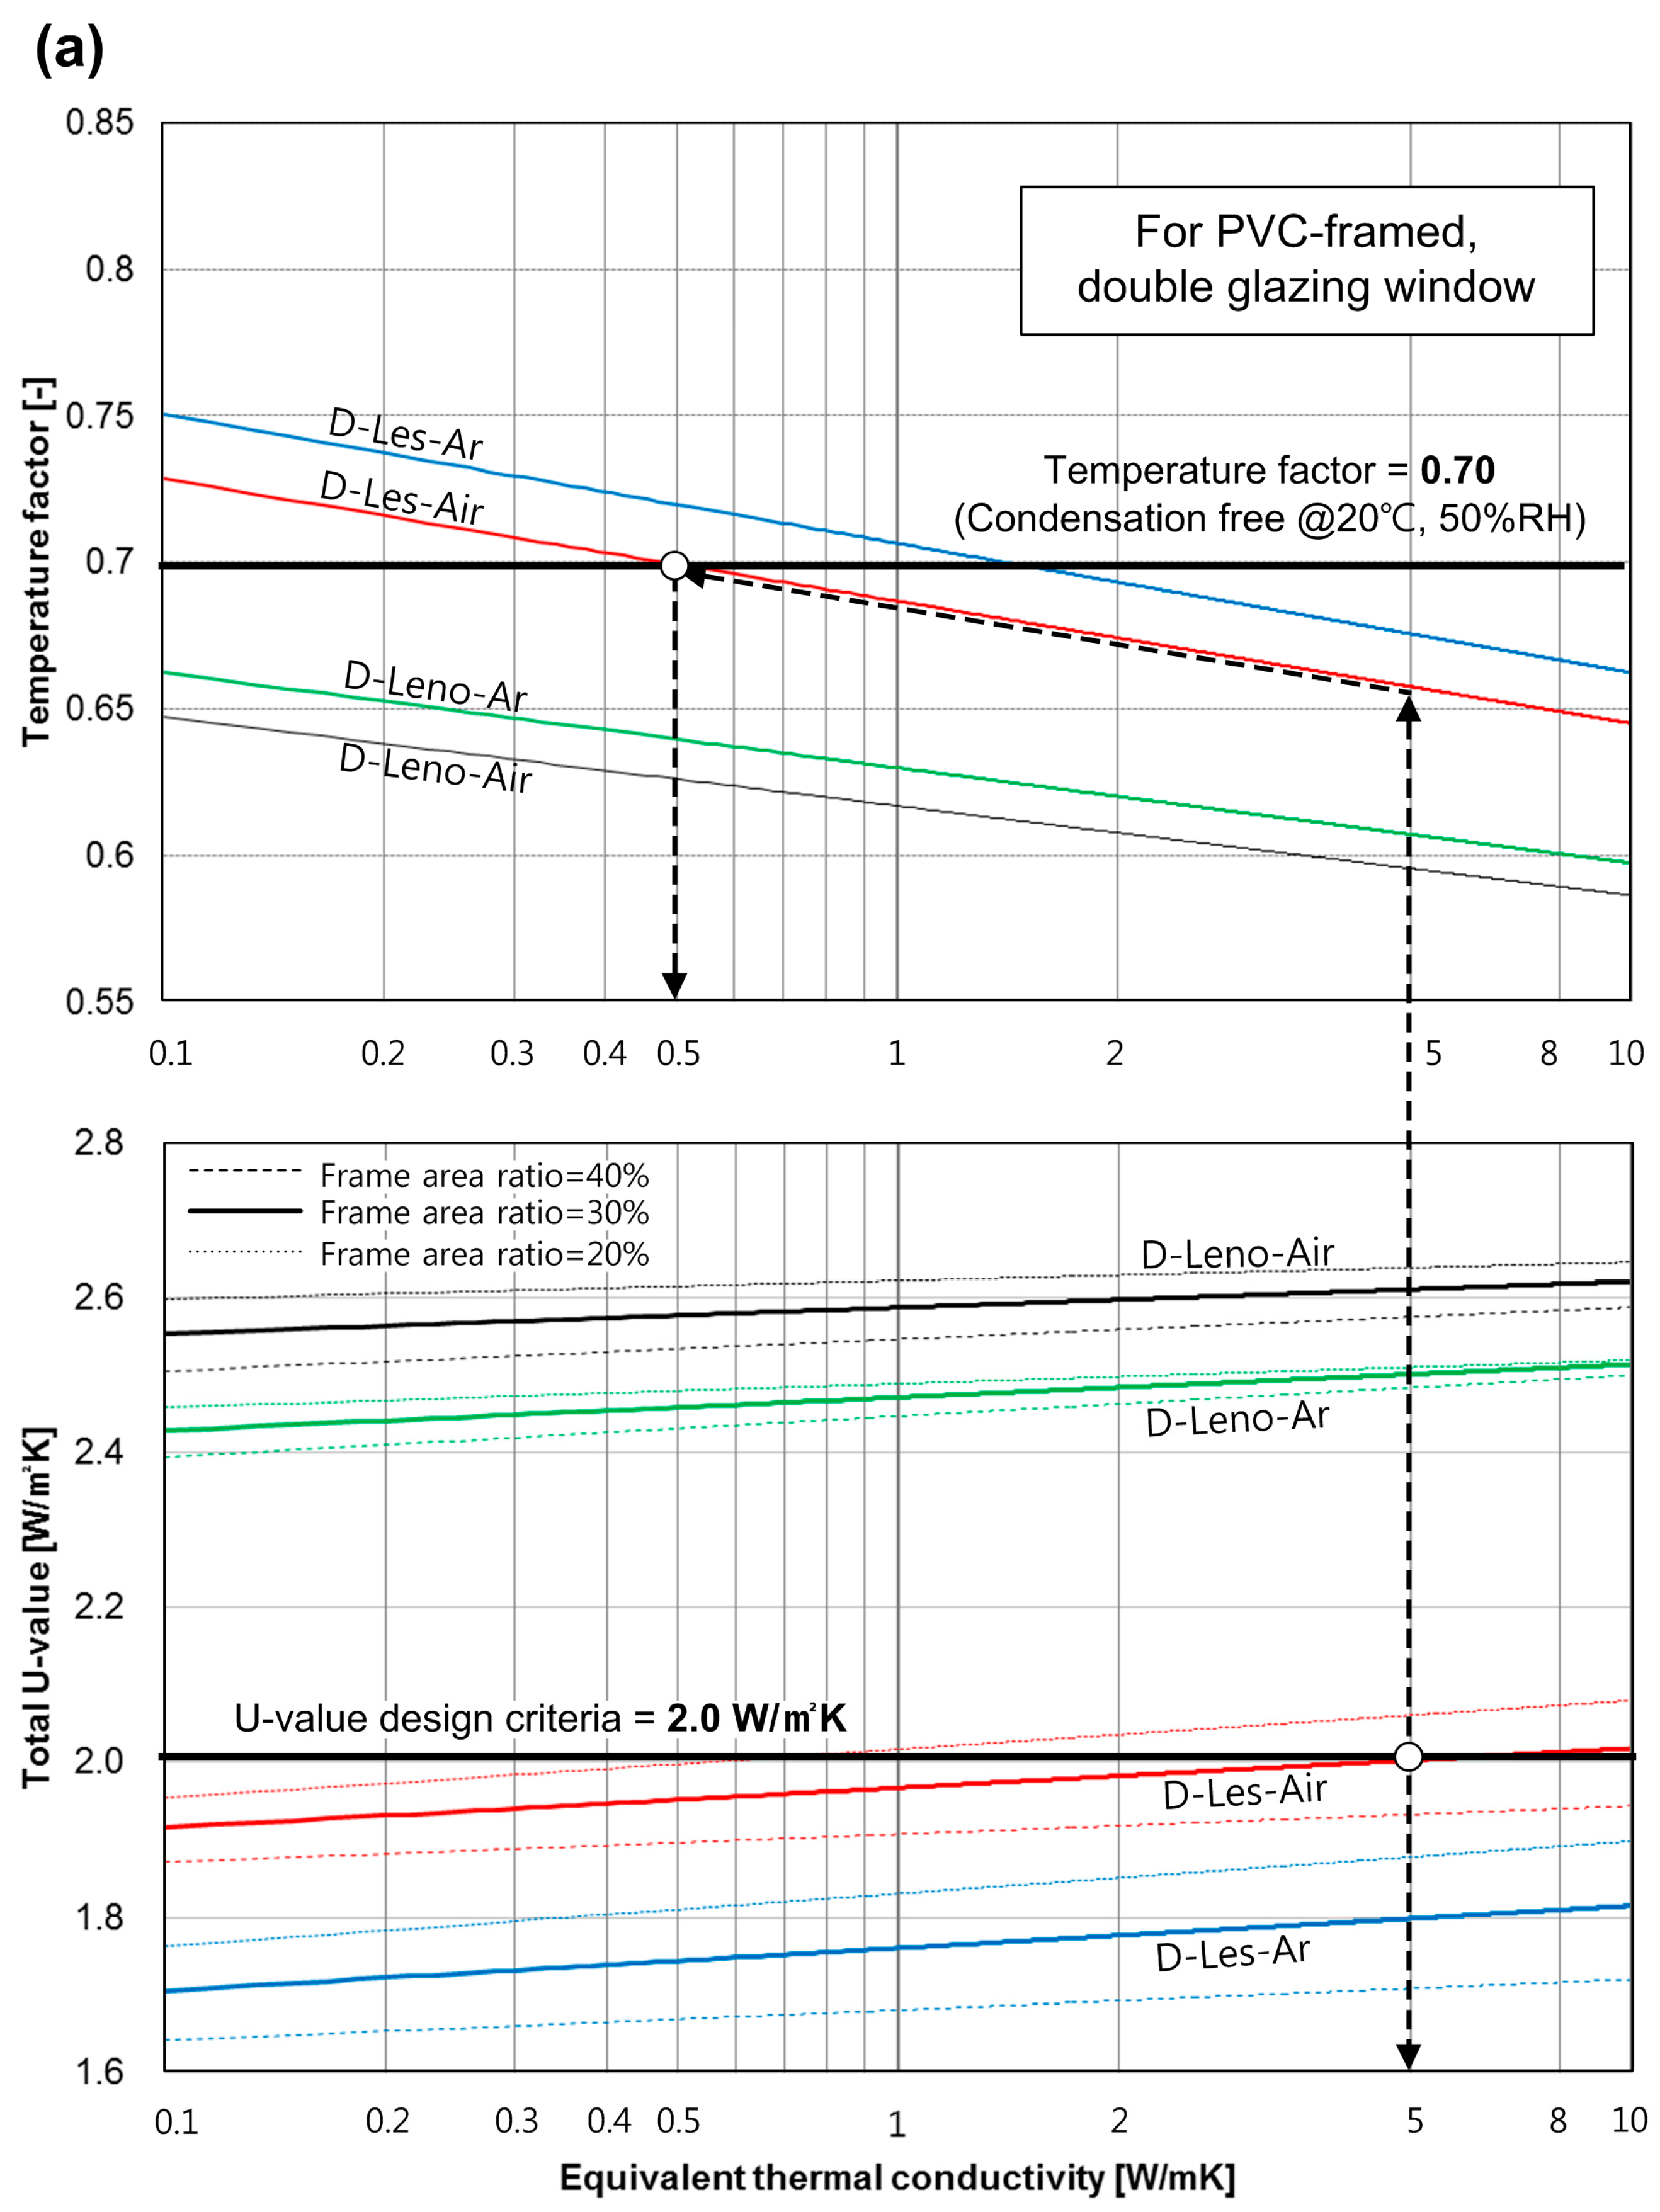
Based on the results, monographs were proposed so that a designer can select an appropriate window spacer to comply with the design criteria regarding condensation prevention and energy saving performances. The results and the suggested monographs will help engineers, designers, and construction practitioners to improve the thermal performance of windows in terms of condensation prevention and heating energy saving.
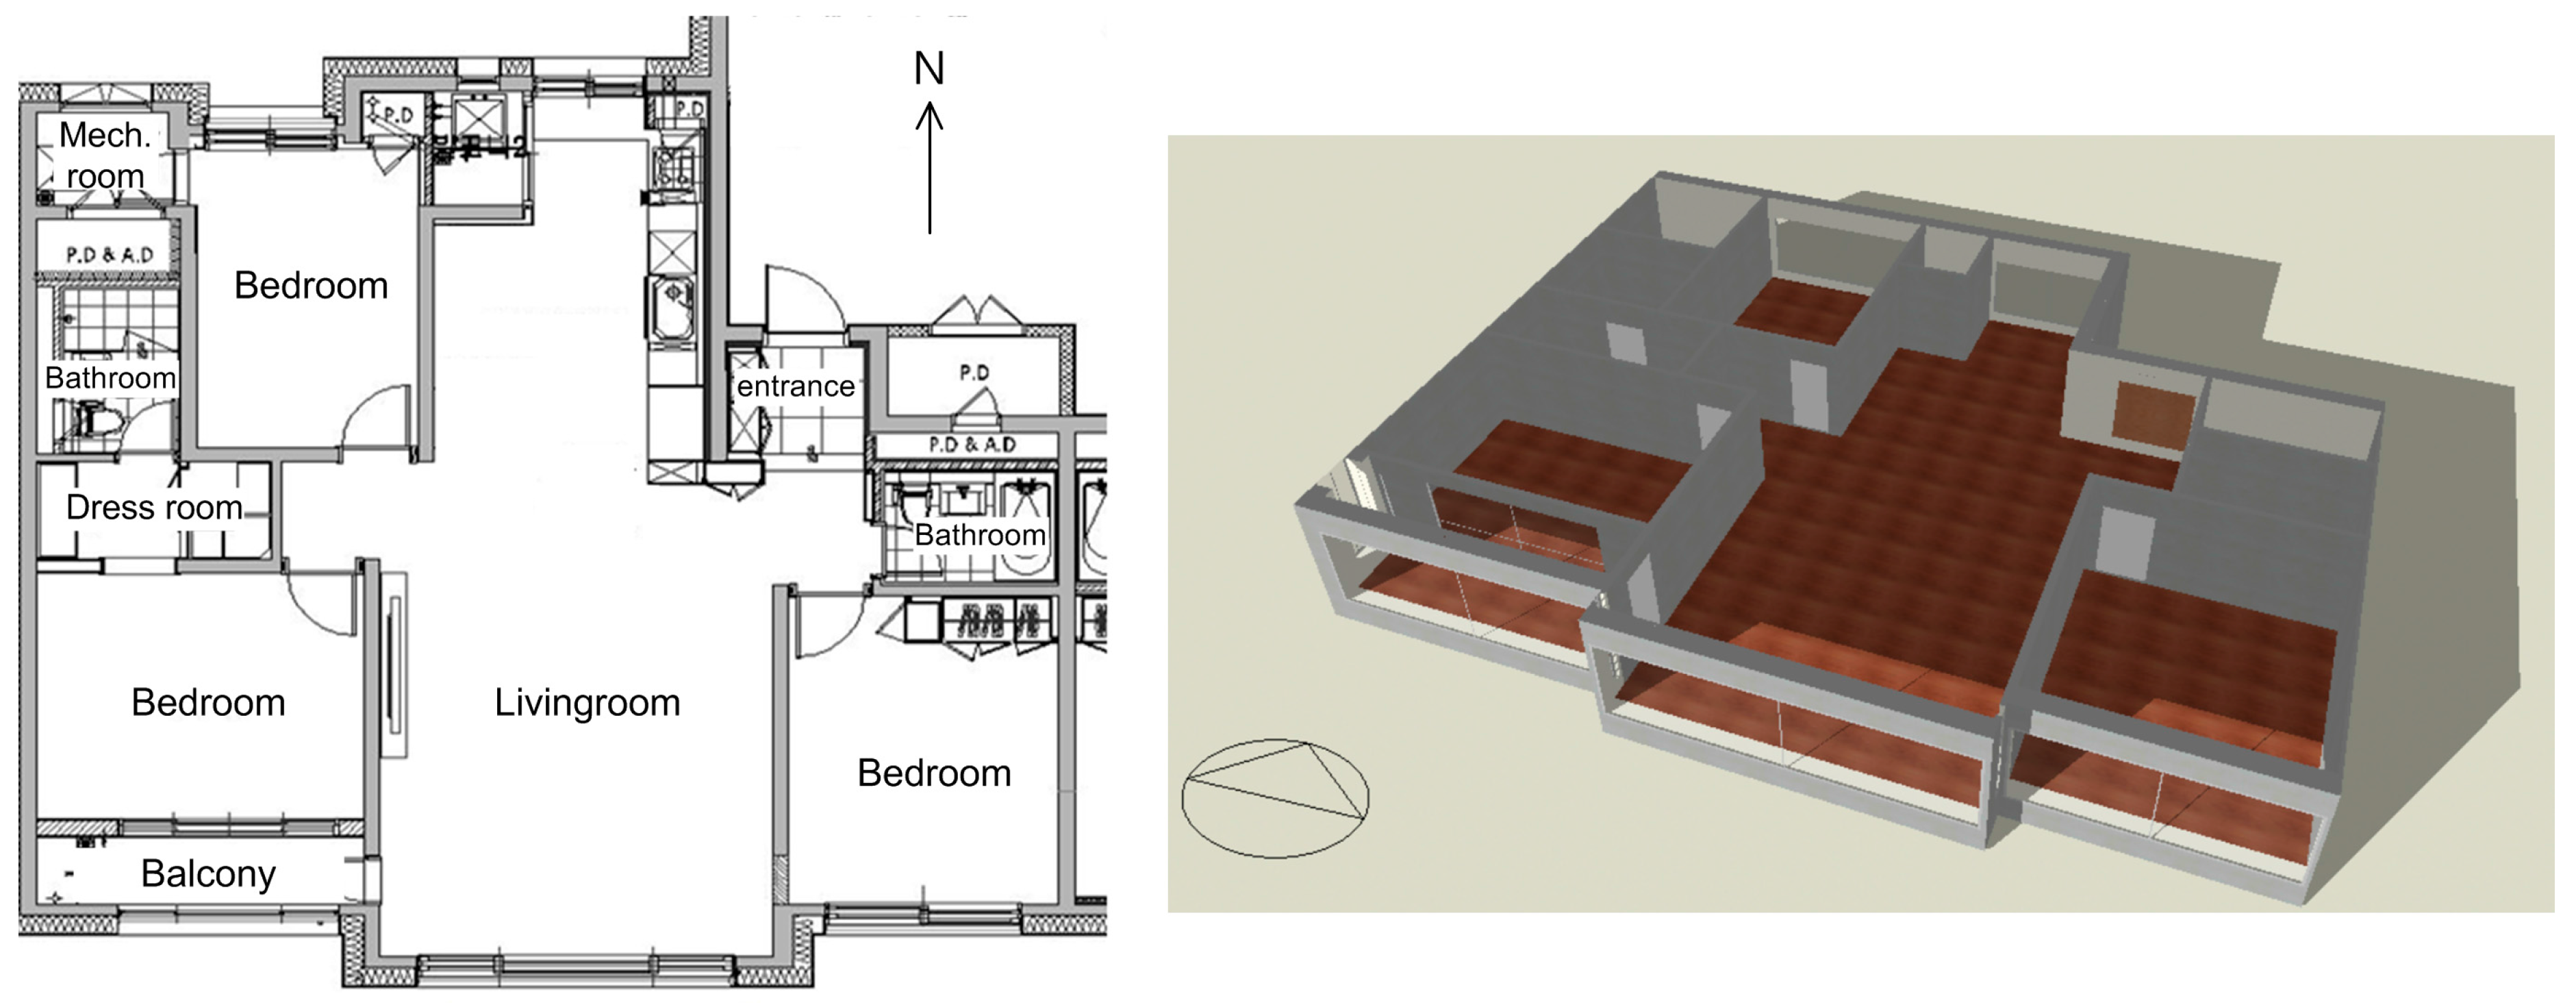
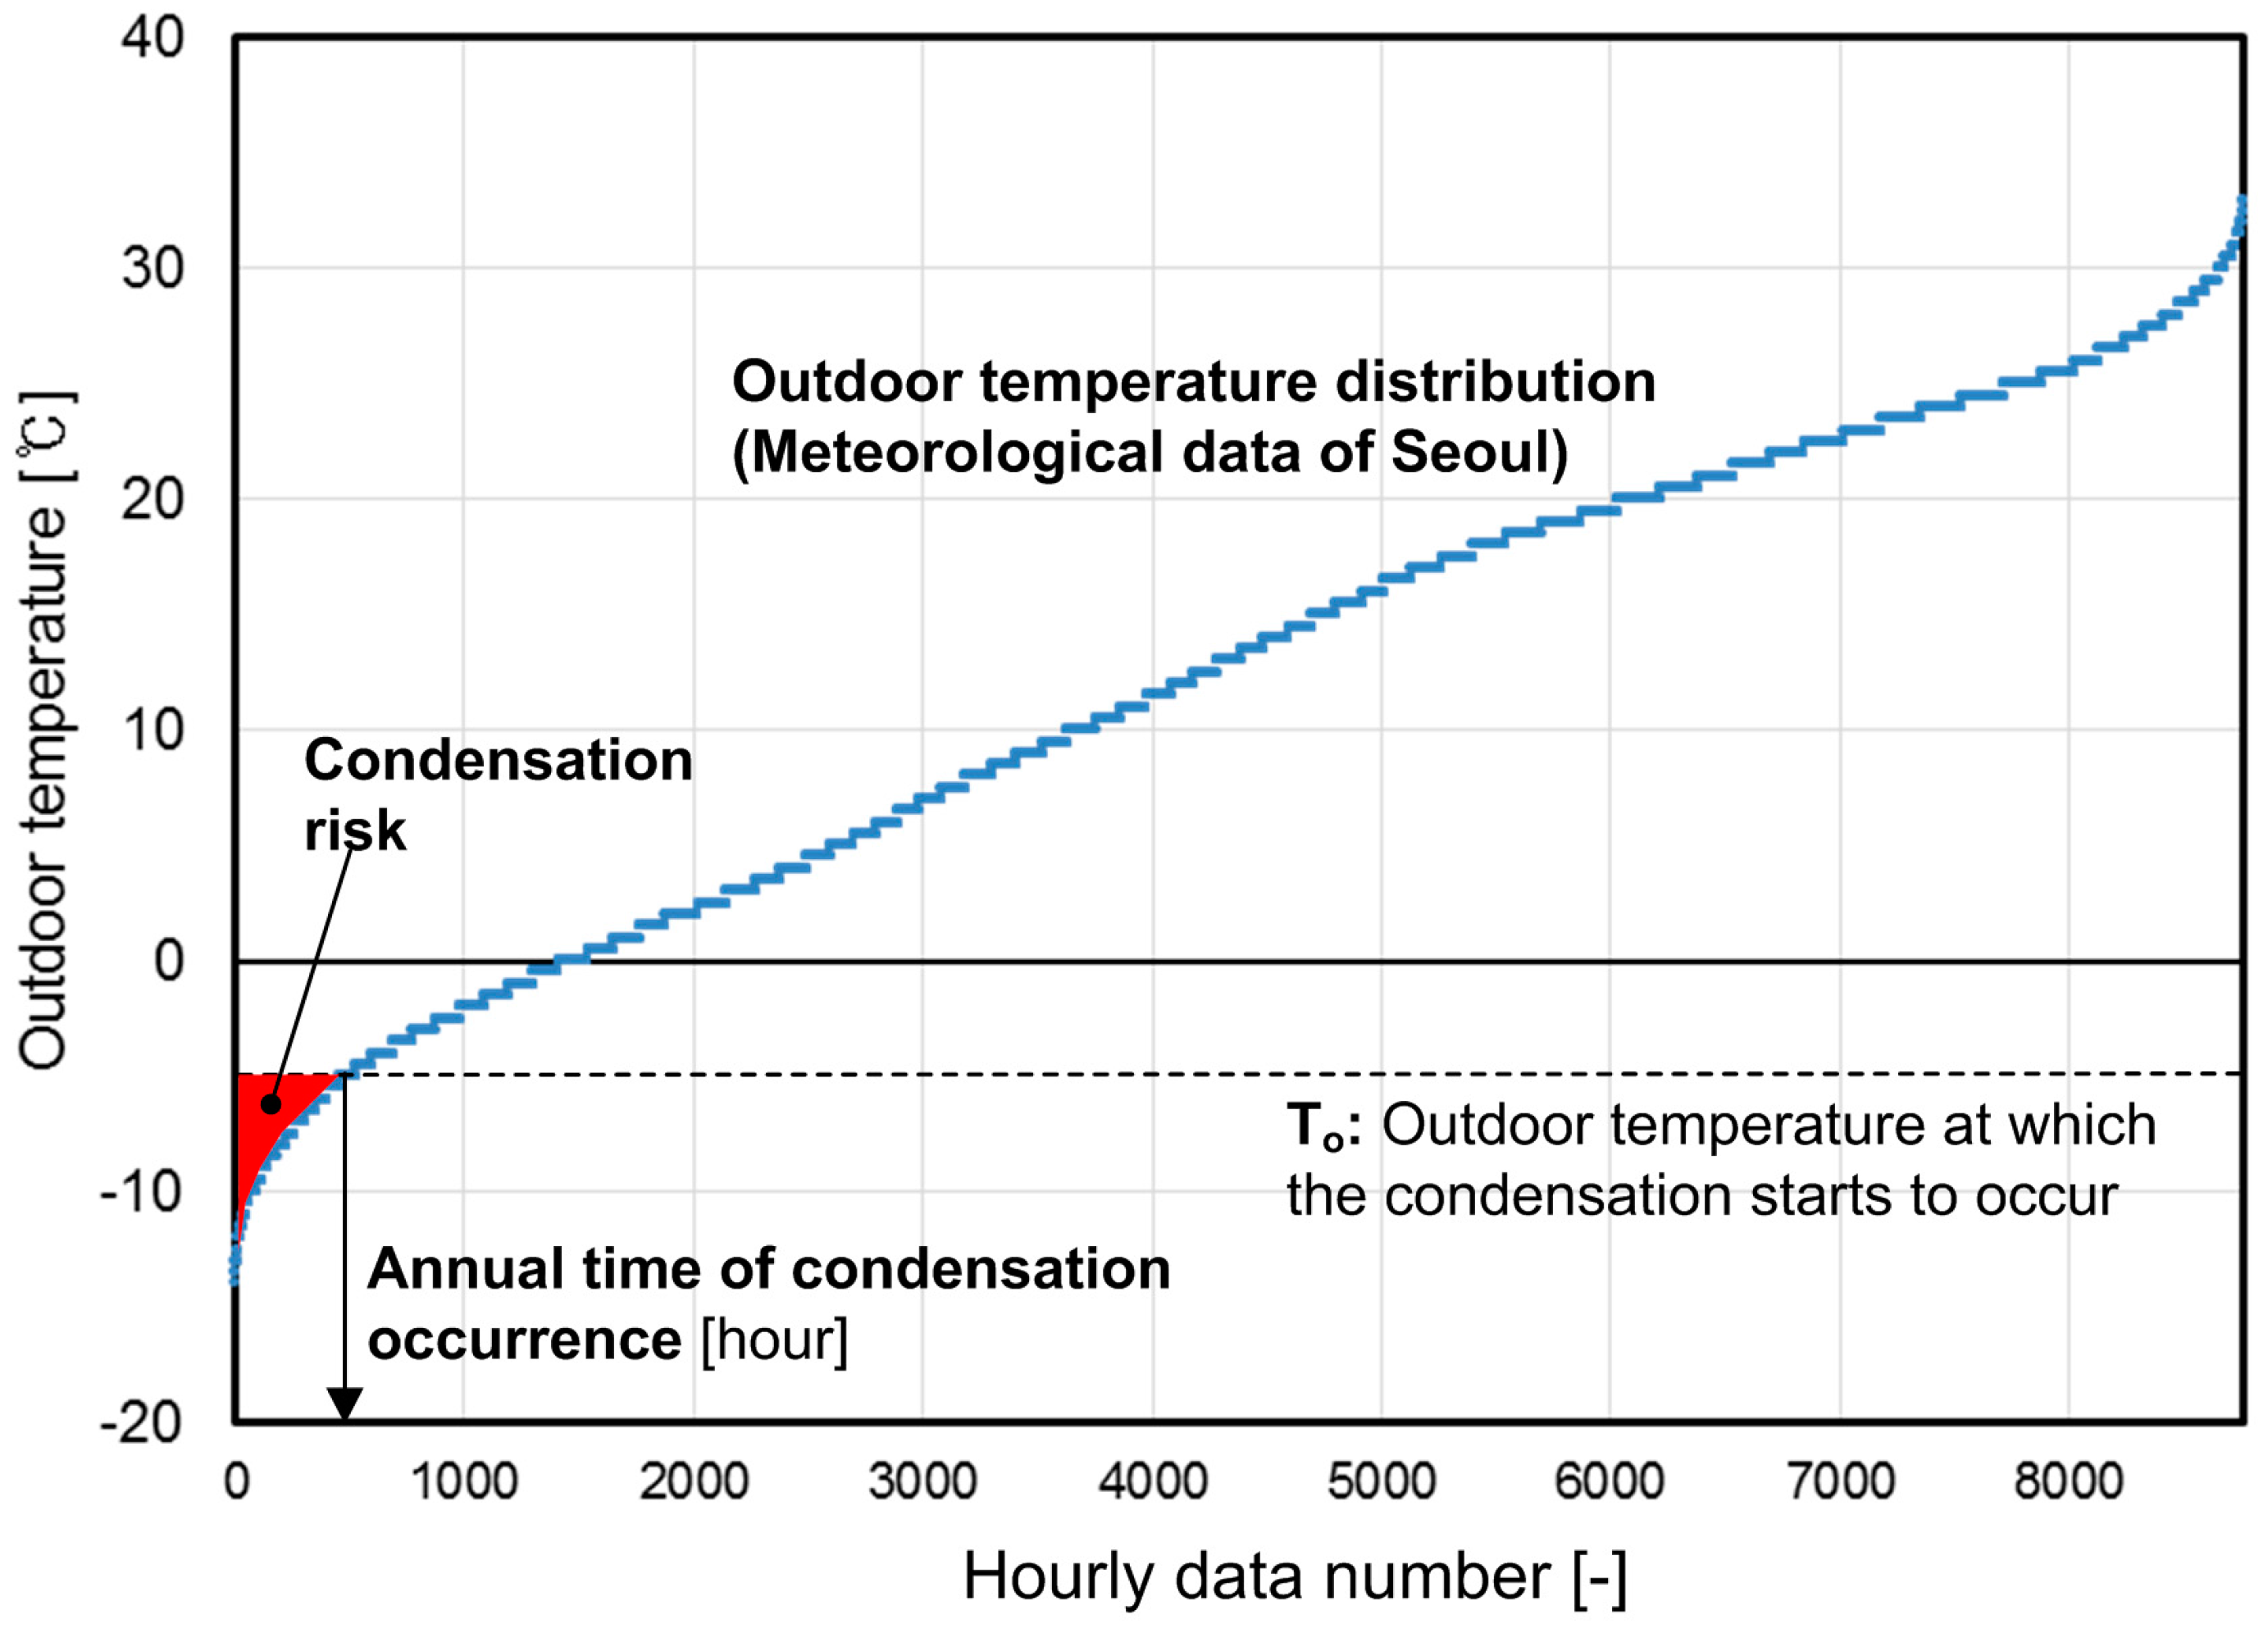
For this study, a PVC frame was assumed in the analysis of the residential windows; however, the thermal properties such as total U-value and the temperature factor can vary according to the frame geometry and/or the material. Thus, the impacts of various frame types on the thermal performance need to be investigated to extend the applicability of the developed monographs. In addition, the simulation results and the developed monographs were derived from the meteorological data of Seoul. The results of this study can be applied to the similar climate zone; however, additional analysis should be performed in order to apply the determination monographs to other climatic contexts.

Acknowledgments

This work was supported by the National Research Foundation of Korea (NRF) grant funded by the Korea government (MSIP, No. 2016R1C1B2010955), and a grant (16CTAP-C114863-01) from Infrastructure and Transportation Technology Promotion Research Program funded by Ministry of Land, Infrastructure and Transport of the Korean government.

Author Contributions

Kyu-Nam Rhee and Ji-Yong Yu conceived and designed the numerical simulations; Mi-Su Shin and Kyu-Nam Rhee performed the simulations and analyzed the data; Gun-Joo Jung contributed the literature review and data survey; Mi-Su Shin wrote the paper.

Conflicts of Interest

The authors declare no conflict of interest.

References

  1. Gustavsen, A.; Grynning, S.; Arasteh, D.; Jelle, B.; Goudey, H. Key elements of and material performance targets for highly insulating window frames. Energy Build. 2011, 43, 2583–2594. [Google Scholar] [CrossRef]
  2. Cuce, E.; Riffat, S.B. A state-of-the-art review on innovative glazing technologies. Renew. Sustain. Energy Rev. 2015, 41, 695–714. [Google Scholar] [CrossRef]
  3. Zedan, M.F.; Al-Sanea, S.; Al-Mujahid, A.; Al-Suhaibani, Z. Effect of Thermal Bridges in Insulated Walls on Air-Conditioning Loads Using Whole Building Energy Analysis. Sustainability 2016, 8, 560. [Google Scholar] [CrossRef]
  4. Song, S.Y.; Jo, J.H.; Yeo, M.S.; Kim, Y.D.; Song, K.D. Evaluation of inside surface condensation in double glazing window system with insulation spacer: A case study of residential complex. Build. Environ. 2007, 42, 940–950. [Google Scholar] [CrossRef]
  5. Lu, X. Estimation of indoor moisture generation rate from measurement in buildings. Build. Environ. 2003, 38, 665–675. [Google Scholar] [CrossRef]
  6. Moshfegh, B.; Loyd, D.; Karlsson, B. Heat transfer at modern windows-risk of condensation. Energy Build. 1989, 13, 119–125. [Google Scholar] [CrossRef]
  7. Kim, J.; Kim, T.; Leigh, S.B. Double window system with ventilation slits to prevent window surface condensation in residential buildings. Energy Build. 2011, 43, 3120–3130. [Google Scholar] [CrossRef]
  8. Kawahara, D.; Kato, S. Prediction of Dew Condensation of Windows with Airflow. Energy Procedia 2015, 78, 519–524. [Google Scholar] [CrossRef]
  9. Tommerup, H.; Svendsen, S. Energy savings in Danish residential building stock. Energy Build. 2006, 38, 618–626. [Google Scholar] [CrossRef]
  10. Balaras, C.A.; Gaglia, A.G.; Georgopoulou, E.; Mirasgedis, S.; Sarafidis, Y.; Lalas, D.P. European residential buildings and empirical assessment of the Hellenic building stock, energy consumption, emissions and potential energy savings. Build. Environ. 2007, 42, 1298–1314. [Google Scholar] [CrossRef]
  11. Ihm, P.; Park, L.; Krarti, M.; Seo, D. Impact of window selection on the energy performance of residential buildings in South Korea. Energy Policy 2012, 44, 1–9. [Google Scholar] [CrossRef]
  12. Grynning, S.; Gustavsen, A.; Time, B.; Jelle, B.P. Windows in the buildings of tomorrow: Energy losers or energy gainers? Energy Build. 2013, 61, 185–192. [Google Scholar] [CrossRef]
  13. Thalfeldt, M.; Kurnitski, J.; Voll, H. Detailed and simplified window model and opening effects on optimal window size and heating need. Energy Build. 2016, 127, 242–251. [Google Scholar] [CrossRef]
  14. Skarning, G.C.J.; Hviid, C.A.; Svendsen, S. Roadmap for improving roof and façade windows in nearly zero-energy houses in Europe. Energy Build. 2016, 116, 602–613. [Google Scholar] [CrossRef]
  15. Lai, C.M.; Wang, Y.H. Energy-saving potential of building envelope designs in residential houses in Taiwan. Energies 2011, 4, 2061–2076. [Google Scholar] [CrossRef]
  16. Cuce, E. Role of airtightness in energy loss from windows: Experimental results from in-situ tests. Energy Build. 2017, 139, 449–455. [Google Scholar] [CrossRef]
  17. Van den Bergh, S.; Hart, R.; Jelle, B.; Gustavsen, A. Window spacers and edge seals in insulating glass units: A state-of-the-art review and future perspectives. Energy Build. 2013, 58, 263–280. [Google Scholar] [CrossRef]
  18. Mitchell, R.; Kohler, C.; Zhu, L.; Arasteh, D.; Carmody, J.; Huizenga, C.; Curcija, D. THERM 6.3/WINDOW 6.3 NFRC Simulation Manual, Technical Report LBNL-48255; Lawrence Berkeley National Laboratory: Berkeley, CA, USA, 2011. [Google Scholar]
  19. Elmahdy, A.H.; Frank, T. Heat transfer at the edge of sealed insulating glass units: Comparison of hot box measurements with finite-difference modeling. ASHRAE Trans. 1993, 99, 915–922. [Google Scholar]
  20. Elmahdy, A.H. Assessment of Spacer bar Design and Frame Material on the Thermal Performance of Windows. ASHRAE Trans. 2006, 112, 30–43. [Google Scholar]
  21. Carpenter, S.C.; McGowan, A.G. Frame and spacer effects on window U-value. ASHRAE Trans. 1989, 95, 604–608. [Google Scholar]
  22. Baldinelli, G.; Asdrubali, F.; Baldassarri, C.; Bianchi, F.; D’Alessandro, F.; Schiavoni, S.; Basilicata, C. Energy and environmental performance optimization of a wooden window: A holistic approach. Energy Build. 2014, 79, 114–131. [Google Scholar] [CrossRef]
  23. Gustavsen, A.; Uvsløkk, S.; Jelle, B.P. Numerical and experimental studies of the effect of various glazing spacers on the window U-value and the glazing temperature. In Proceedings of the Nordic Building Physics Symposium (NBPS), Reykjavík, Iceland, 13–15 June 2005. [Google Scholar]
  24. Maref, W.; van den Bossche, N.; Armstrong, M.; Lacasse, M.A.; Elmahdy, H.; Glazer, R. Condensation risk assessment on box windows: The effect of the window-wall interface. J. Build. Phys. 2011, 36, 35–56. [Google Scholar] [CrossRef]
  25. International Standard Organization (ISO). ISO 10077-1:2006, Thermal Performance of Windows, Doors and Shutters—Calculation of Thermal Transmittance—Part 1: General; International Standard Organization: Geneva, Switzerland, 2006. [Google Scholar]
  26. Bundesverband Flachglas Data Sheets. Available online: http://www.bundesverband-flachglas.de/en/downloads/data-sheets/ (accessed on 26 January 2017).
  27. Svendsen, S.; Laustsen, J.B.; Kragh, J. Linear thermal transmittance of the assembly of the glazing and the frame in windows. In Proceedings of the Nordic Building Physics Symposium (NBPS), Reykjavík, Iceland, 13–15 June 2005. [Google Scholar]
  28. Laustsen, J.B.; Svendsen, S. WinDat WP2. 3–Edge Seals, Frames and Windows-Edge Constructions and Frames; Technical University of Denmark: Lyngby, Denmark, 2003. [Google Scholar]
  29. Institut für Fenstertechnik (IFT). Equivalent Thermal Conductivity Warm Edge, Final Report; IFT Rosenheim GmbH: Rosenheim, Germany, 2012. [Google Scholar]
  30. Lawrence Berkeley National Laboratory (LBNL). Window Spacers and Edge Seals in Insulating Glass Units: A State-of-the-Art Review and Future Perspectives; Lawrence Berkeley National Laboratory: Berkeley, CA, USA, 2013. [Google Scholar]
  31. Baker, J. Spacer Thermal Performance Study; WESTLab Canada, National Fenestration Rating Council (NFRC) Accredited Simulation Laboratory: London, ON, Canada, 2005. [Google Scholar]
  32. American Architectural Manufacturers Association (AAMA). AAMA 1503–09, Voluntary Test Method for Thermal Transmittance and Condensation Resistance of Windows, Doors, and Glazed Wall Sections; American Architectural Manufacturers Association: Schaumburg, IL, USA, 2009. [Google Scholar]
  33. American Society of Heating, Refrigerating, and Air-Conditioning Engineers (ASHRAE). Chapter 15.3 Fenestration. In ASHRAE Handbook Fundamental; American Society of Heating, Refrigerating, and Air-Conditioning Engineers, Inc.: Atlanta, GA, USA, 2013. [Google Scholar]
  34. National Fenestration Rating Council (NFRC). ANSI/NFRC 100–214: Procedure for Determining Fenestration Product U-Factors; National Fenestration Rating Council: Greenbelt, MD, USA, 2013. [Google Scholar]
  35. Hong, S.M.; Yoon, D.W. A CO2 Sensor based Demand Controlled Ventilation Strategies with Multi-zone Analysis in the Apartment House. J. Archit. Inst. Korea 2011, 27, 341–348. [Google Scholar]
  36. Ministry of Land, Infrastructure and Transportation. Building Design Standards for Energy Saving: The Notification of Ministry of Land, Infrastructure and Transportation; Korean Government: Seoul, Korea, 2016.
  37. Jang, C.Y.; Han, H.S.; Lee, J.S. The building energy efficiency rating evaluation of apartment depending on SHGC and window area ratio. J. Korean Sol. Energy Soc. 2010, 30, 38–43. [Google Scholar]
  38. Sung, U.J.; Lee, J.S.; Cho, S.; Jang, C.Y.; Paek, S.H.; Song, K.D. Study on Estimate of Thermal Resistance of PVC Frame Window Due to Material Composition. In Proceedings of the SAREK Summer Conference, PyongChang, Korea, 21–23 June 2006. [Google Scholar]
  39. Titow, M.V. PVC Technology, 4th ed.; Elsevier Applied Science Publishers Ltd.: New York, NY, USA, 1984; p. 1184. [Google Scholar]
  40. Kim, G.T.; Kim, J.Y.; Hwang, H.J.; Kim, K.S. The design criteria of the indoor temperature and humidity for the prevent condensation of small apartment buildings. LHI J. Land Hous. Urban Aff. 2014, 5, 291–296. [Google Scholar] [CrossRef]
  41. Mirsadeghi, M.; Cóstola, D.; Blocken, B.; Hensen, J.L. Review of external convective heat transfer coefficient models in building energy simulation programs: Implementation and uncertainty. Appl. Therm. Eng. 2013, 56, 134–151. [Google Scholar] [CrossRef]
  42. Obyn, S.; van Moeseke, G. Variability and impact of internal surfaces convective heat transfer coefficients in the thermal evaluation of office buildings. Appl. Therm. Eng. 2015, 87, 258–272. [Google Scholar] [CrossRef]
Figure 1. Determination criteria for thermally improved spacers: (a) hollow spacer and (b) solid spacer [25].
Energies 10 00717 g001
Figure 2. Vertical section of the investigated window.
Energies 10 00717 g002
Figure 3. Equivalent thermal conductivity of the TISs.
Energies 10 00717 g003
Figure 4. Simulation modelling of the TIS to compare (a) detailed model and (b) two-box model.
Energies 10 00717 g004
Figure 5. Simulation results of heat flux vector and temperature distribution for (a) detailed model and (b) two-box model.
Energies 10 00717 g005
Figure 6. Comparison of detailed model and two-box model in terms of (a) surface temperatures and (b) U-values.
Energies 10 00717 g006
Figure 7. Estimation of the annual condensation time.
Energies 10 00717 g007
Figure 8. Simulation modeling of the investigated residential building.
Energies 10 00717 g008
Figure 9. Temperature factors with the equivalent thermal conductivity of the spacers.
Energies 10 00717 g009
Figure 10. Condensation prevention performances: (a) outdoor temperature of condensation occurrence and (b) annual time-of-condensation occurrence.
Energies 10 00717 g010aEnergies 10 00717 g010b
Figure 11. Total U-value with the equivalent thermal conductivity of the spacers.
Energies 10 00717 g011
Figure 12. Total U-value-reduction ratio.
Energies 10 00717 g012
Figure 13. Maximum heating load and annual heating-energy consumption with the equivalent thermal conductivity of the window spacers: (a) double glazing and (b) triple glazing.
Energies 10 00717 g013
Figure 14. Relation between the temperature factor and the total U-value: (a) double glazing and (b) triple glazing.
Energies 10 00717 g014
Figure 15. Monographs of determining the equivalent thermal conductivity of a window spacer for PVC-framed window with (a) double glazing and (b) triple glazing.
Energies 10 00717 g015aEnergies 10 00717 g015b
Figure 16. Uncertainty analysis of THERM simulations with regard to (a) PVC frame conductivity; (b) Outdoor air temperature; (c) Indoor air temperature; (d) Outside heat transfer coefficient; and (e) Inside heat transfer coefficient.
Energies 10 00717 g016
Table 1. Examples of the commercially available TISs.
Product NameShapeMaterialThickness d [mm]Thermal Conductivity λ [W/mK] ( d λ ) [W/K]
WEP Classic Energies 10 00717 i001Stainless steel0.20150.00600
Chromatech Energies 10 00717 i002Stainless steel0.18150.00540
Nirotec-017 Energies 10 00717 i003Stainless steel0.17150.00510
Chromatech Plus Energies 10 00717 i004Stainless steel0.15150.00450
GTS Energies 10 00717 i005Stainless steel0.15150.00450
Nirotec-015 Energies 10 00717 i006Stainless steel0.15150.00450
Swisspacer Energies 10 00717 i007Aluminum0.031600.00512
Plastic1.00.16
Thermix TX.N Plus Energies 10 00717 i008Stainless steel0.10150.00195
Plastic0.75/1.200.23
TGI-Spacer Energies 10 00717 i009Stainless steel0.10150.00177
Plastic0.6/0.80.195
Chromatech Ultra F Energies 10 00717 i010Plastic0.10.1950.00168
Stainless steel0.915
Nirotec Primus Energies 10 00717 i011Stainless steel0.060.1720.00097
Biopolymer0.415
Nirotec EVO Energies 10 00717 i012Stainless steel0.06150.00104
Biopolymer0.40.172
TPS Energies 10 00717 i013Polyisobutylene6.00.250.00150
Swisspacer V Energies 10 00717 i014Stainless steel0.010.160.00047
Plastic1.015
Super Spacer Triseal Energies 10 00717 i015Mylar-foil0.101.10.00126
Silicone foam7.20.16
Siwsspacer Ultimate Energies 10 00717 i016Plastic1.0N/AN/A
Multilayer polyester-coated film0.097
Table 2. Comparison of heat flux and heat flow for detailed and two-box models.
ModelHeat FluxHeat Flow
Edge RegionFrameEdge RegionFrame
Detailed model126.2 W/m279.7 W/m27.94 W14.7 W
Two-box model125.5 W/m280.4 W/m27.90 W14.8 W
Discrepancy−0.5%0.9%−0.5%0.9%
Table 3. Simulation cases 1 for the investigation of the thermal performances of the TIS.
Low-E CoatingInfill GasGlazing Type
DoubleTriple 2
No coatingAirD-Leno-AirT-Leno-Air
No coatingArgonD-Leno-ArT-Leno-Ar
Soft coatingAirD-Les-AirT-Les-Air
Soft coatingArgonD-Les-ArT-Les-Ar
Hard coatingAirD-Leh-AirT-Leh-Air
Hard coatingArgonD-Leh-ArT-Leh-Ar
1 In all the cases, the window spacers are represented with a λeq from 0.1 W/mK to 8.0 W/mK; 2 For the triple glazing, the frame is the same as that of the double glazing, with the exception of the width of the glazing.
Table 4. Material properties of the window elements.
ElementConductivityEmissivityReference
Interior SideExterior Side
Clear glass1.0 W/mK0.8370.837WINDOW 7.4 library
Low-e soft coating1.0 W/mK0.090.837WINDOW 7.4 library
Low-e hard coating1.0 W/mK0.1570.837WINDOW 7.4 library
PVC (frame)0.17 W/mK0.9-THERM 7.4 library
Silicon (sealant)0.35 W/mK0.9-THERM 7.4 library
Table 5. Simulation boundary conditions.
Boundary ConditionIndoorOutdoor
Temperature24 °C−15 °C
Relative humidity40%-
Total heat transfer coefficient9 W/m2K30 W/m2K
Table 6. Description of the simulated residential building.
CategoryItemDescriptionRemark
GeneralLocationSeoul, Korea-
Building orientationSouth-
Floor area110 m2-
Conditioned floor area75 m2-
Number of occupants[00:00–08:00] 4 persons; [08:00–15:00] 1 person; [15:00–17:00] 2 persons; [17:00–18:00] 3 persons; [18:00–24:00] 4 persons[35]
ConstructionExternal wallPlaster 10 mm + XPS insulation 150 mm + Concrete 200 mm + gypsum board 10 mm (U-value = 0.210 W/m2K)[36]
FloorConcrete 210 mm + EPS insulation 120 mm + aerated concrete 50 mm + mortar 40 mm + linoleum 10 mm (U-value = 0.260 W/m2K)[36]
Window to wall ratio50%[37]
Window framePVC (polyvinyl chloride)-
Window U-valueobtained from THERM simulation-
Window g-value0.80 (No shading device)-
Infiltration rate0.6 ACH[36]
Heating systemSystem typeHydronic radiant floor heating system-
Set-point temperature22 °C-
Heat sourceGas-fired boiler (efficiency = 0.85)-
Table 7. Range of the parameter for uncertainty analysis.
ParameterRange 1Reference
Frame (PVC) thermal conductivity0.14–0.17–0.28 W/mK[39]
Outdoor air temperature−15–−10–−5 °C[40]
Indoor air temperature20–22–24 °C[40]
Outside heat transfer coefficient20–30–40 W/m2K[41]
Inside heat transfer coefficient5–9–15 W/m2K[42]
1 Bold letters indicate the value used in the simulation of the Section 4.1, Section 4.2 and Section 4.3.

