1. Introduction
Nuclear power is a promising solution to meet both the problems of worldwide increasing demand for energy and reduction of CO
2 emissions. In this field, numerous fuel cycle scenarios (consisting of the different combinations of components to use as fuel from mining to proper final disposal) have been proposed to cope with different alternatives. These scenarios are usually reduced to a handful [
1,
2], sufficiently general to represent different purposes: competitive energy generation, minimization of nuclear waste, etc. Among them, the open cycle and a partially closed fuel cycle involving reprocessing have been commercially implemented.
Reprocessing of irradiated nuclear fuel serves multiple purposes, from Pu separation and recovery for mixed uranium-plutonium oxide, MOX, fuel fabrication [
3], and irradiation, to reduction of high level waste volume, among others. This technology is or has been (at least partially) implemented in several countries, including France, Japan, Russia, and the United Kingdom, with significant number of nuclear power plants and installed capacity using MOX. This process has a significant impact on material flow. Some previous studies have aimed to assess the implications of implementing reprocessing for MOX fuel fabrication that can be applied to countries with a large sized nuclear reactor fleet [
4,
5]. However, for medium sized reactor fleets, these studies are generally not exhaustive (not taking into account practical issues, i.e., limitations in material stocks) or are focused only on one key sustainability indicator (either economy [
5], use of resources, or waste minimization [
2,
6]), and so the combination of expenses, resources and waste generation are not totally described.
This work aims to analyze the whole set of aspects included in the fuel cycle scenario in order to find the key variables or indicators with upmost importance for the implementation of reprocessing in a medium sized light water reactor (LWR) fleet with approximately constant energy demand. To do so, the inventories of the Spanish nuclear power park (54.9 TWh in 2014, according to [
7]) have been chosen. The conclusions reached in this work can also be considered valid for other countries with similar nuclear energy production, such as Belgium, Germany, Sweden, and others.
The Spanish nuclear fuel cycle [
8] started on 1964, with the construction of José Cabrera, a small pressurized water reactor (PWR) and the first of three nuclear power reactors. Two years later, the construction of S. M. de Garoña, a medium-sized boiling water reactor (BWR), began, followed two years later by Vandellós I, a medium-sized gas-cooled reactor. This first generation of Spanish units, all turnkey projects, gave practical experience with three different designs and led Spain to focus on PWR technologies for subsequent additions to the fleet. In the early 1970s, the construction of a second generation of seven reactors was started: five of them were completed (Almaraz I & II, Ascó I & II, and Cofrentes). Finally, in the early 1980s, the construction of a third generation of five plants was started, but only two were completed—Trillo I and Vandellós II. Therefore, ten nuclear reactors have been providing electricity to Spain, and seven of them are currently still in normal operation. Each Spanish nuclear reactor has been modeled individually by means of the TR_EVOL module [
9] of the EVOLCODE simulation system [
10], both developed at CIEMAT.
In order to properly detect and quantify the variables with major importance (from economic, resources, and waste generation points of view) for the implementation of reprocessing in a medium sized nuclear reactor park such as the Spanish one, two groups of fuel cycle scenarios beyond the current status of the fuel cycle have been simulated. They include two different lifetimes of the reactors of the fleet and reprocessing strategies that burn the maximum amount possible of the Pu mass generated in the cycle. It has been found that the lifetime of the reactors has a significant impact from the standpoint of Pu reduction and availability. From the point of view of economics, this analysis has shown that, for a medium sized nuclear reactor fleet, the reprocessing cost and the natural uranium cost are parameters with large importance.
2. Modelling of the Scenarios
2.1. Description of the Scenarios
The scenarios of interest here have been divided into two different groups. Scenarios considering a lifetime of 40 years have been labelled with “40.” The once-through strategy, used as reference scenario, has been labelled as scenario 40-ONCE. For scenarios with reprocessing, scenario 40-PART refers to the case where only a part of the spent fuel is reprocessed (the amount required to obtain the Pu to fabricate the maximum possible amount of MOX to be burned in the fuel cycle). In scenario 40-FULL, all the spent fuel is reprocessed to avoid final disposal. Thus, only high level waste from (partially) closed cycles other than SF (HLWr) will be disposed of in this scenario. Surplus Pu and RepU separated at the end of the fuel cycle scenario (EOC) and with no use for the scenario itself can be valued as assets for their use as fuel by other fuel cycle scenarios or countries. This changes the definition of scenario 40-FULL into scenario 40-FULL-1 (Pu and RepU are not valued as assets) and scenario 40-FULL-2 (this extra material is valued).
A second group of scenarios has been studied that consider a lifetime of 60 years for the reactors in order to assess the impact of the reactor lifetime in the scenario. These scenarios are labelled with “60” and are similarly subdivided, leading to scenarios 60-ONCE (once-through, reference scenario), 60-PART (partial reprocessing), and 60-FULL (full reprocessing). Again, this last scenario is replaced by 60-FULL-1 if Pu and RepU are not valued as assets and 60-FULL-2 in where they are valued. An additional analysis varying the uranium average cost between 2014 and the EOC has also been done. In these cases, the uranium average cost have been fixed at the historical highest cost of 230 €/kgU3O8 (reached at the end of 2007), and the scenarios using this value have been marked with an asterisk (*).
2.2. Hypotheses
The key assumptions used in the modeling of fuel cycle scenarios for Spain are as follows:
- (1)
The information of the Spanish nuclear fleet performance was taken from the Power Reactor Information System (PRIS) [
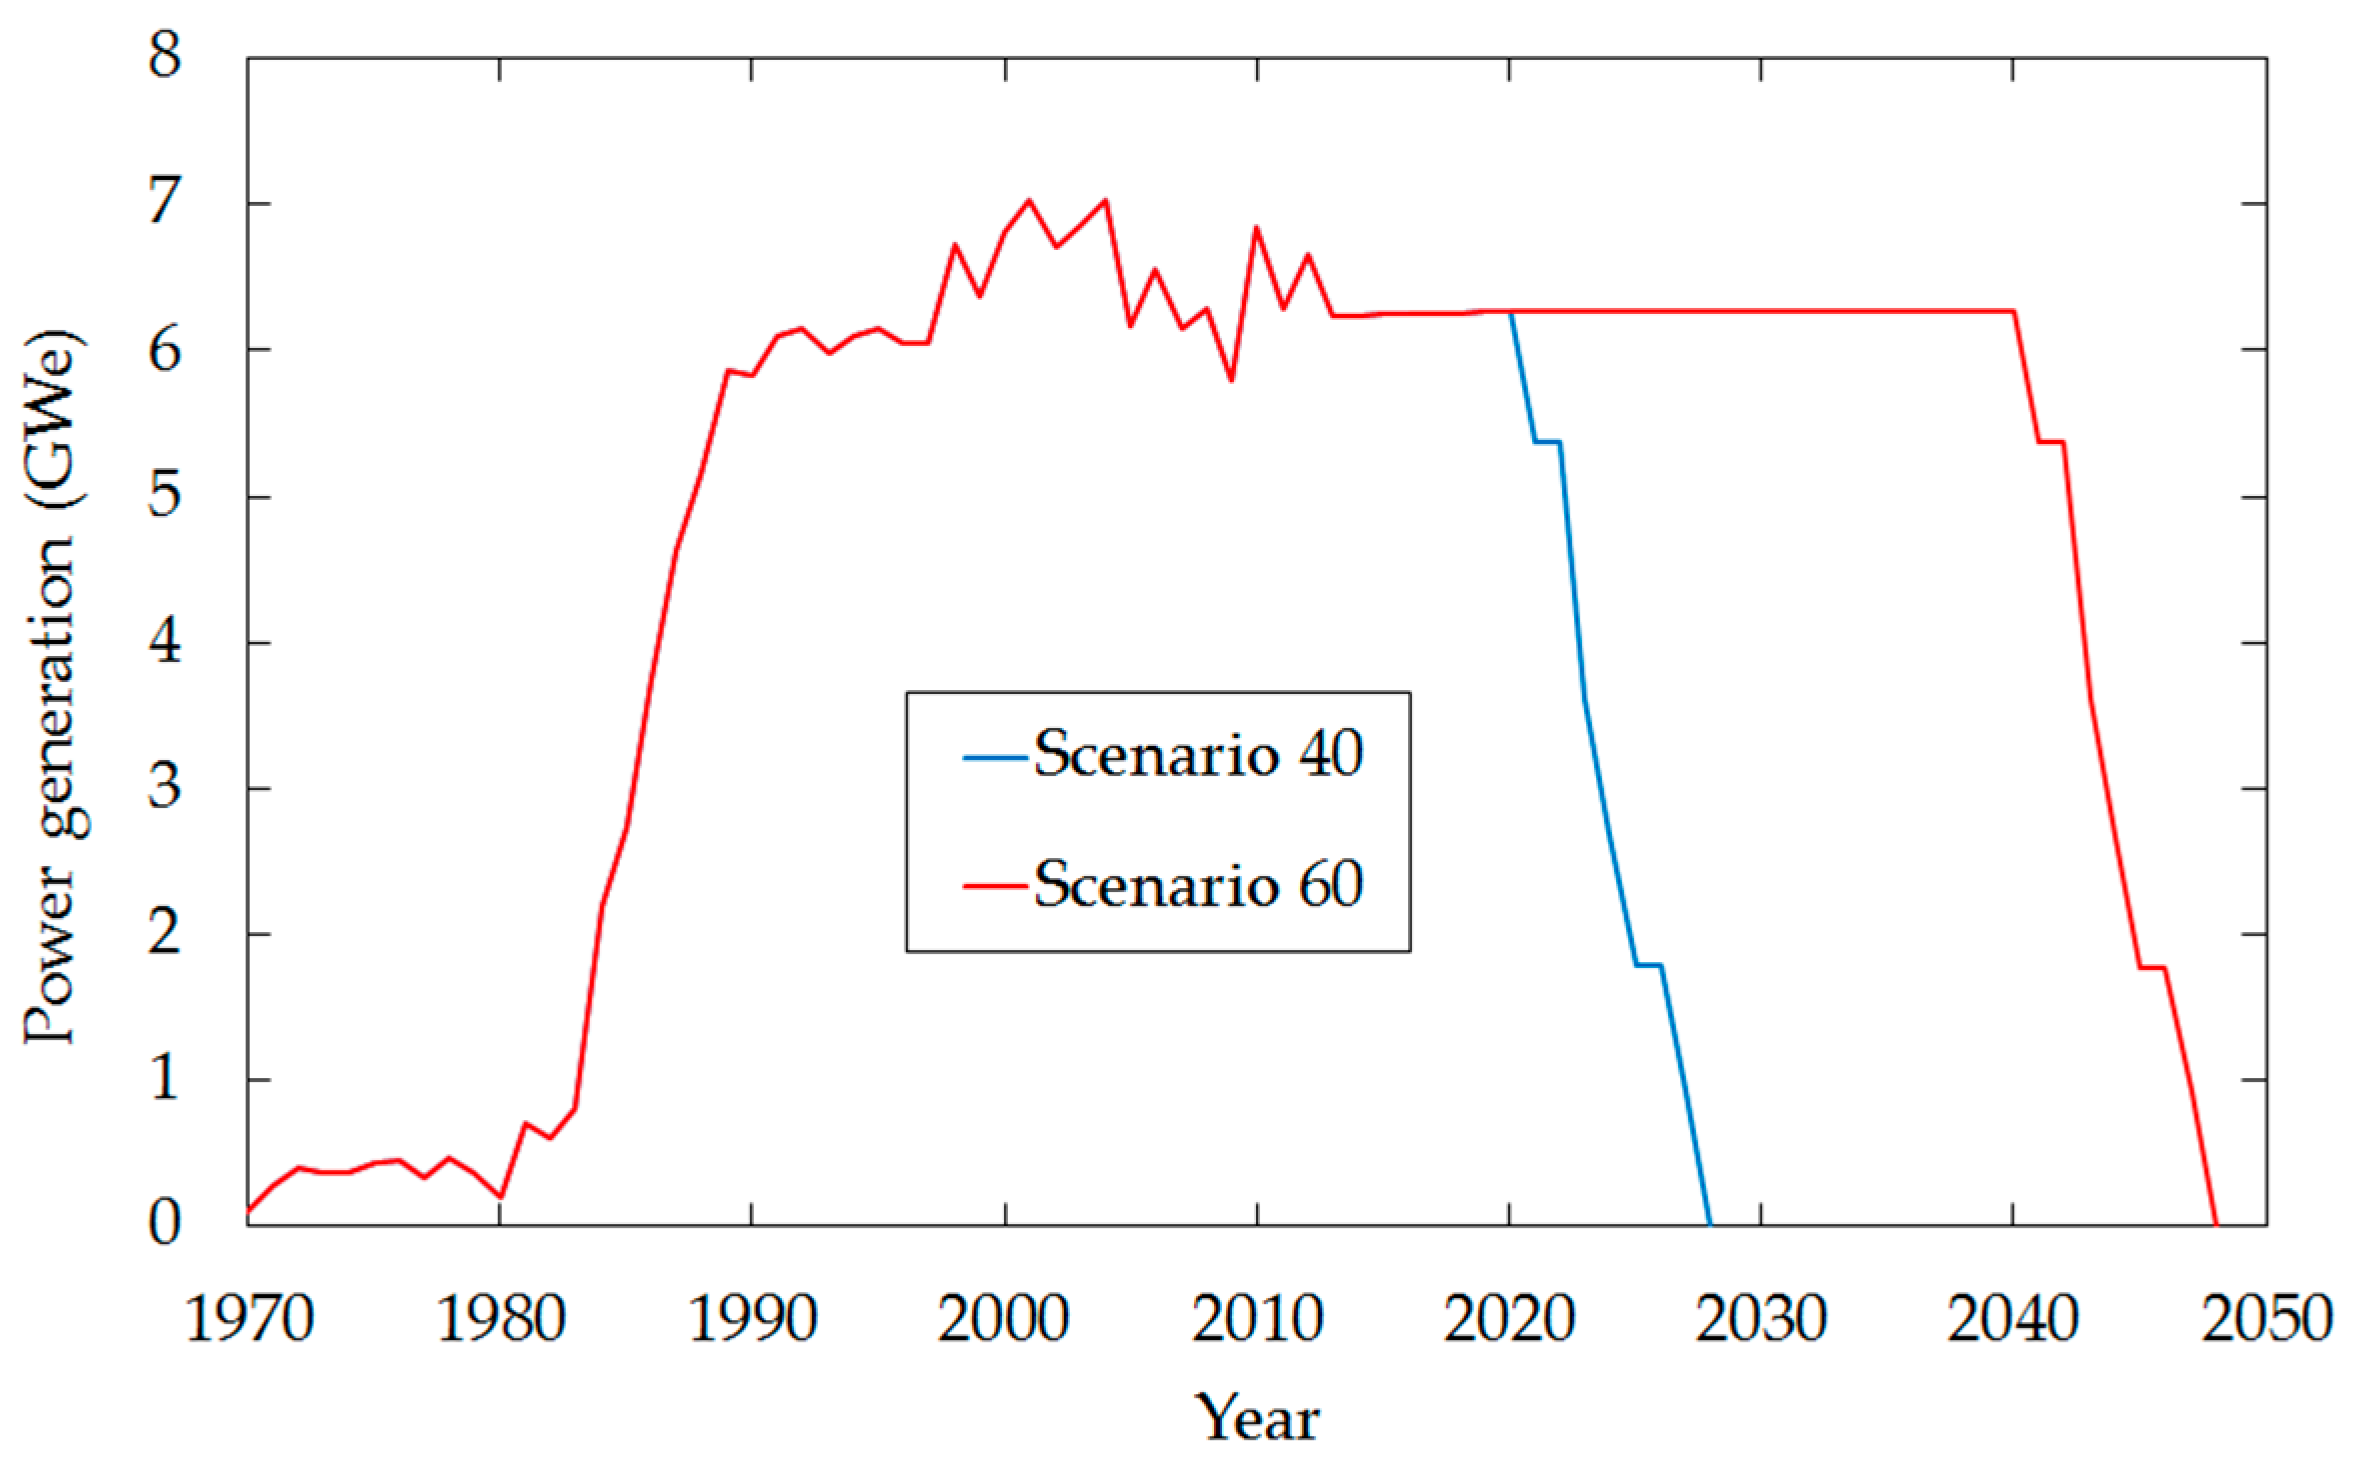
8] up to year 2012. Beyond that date, the energy production was projected considering the corresponding decommissioning dates assumed on each scenario (different for scenarios 40 and 60), as shown in
Figure 1. The total energy estimations for 40 and 60 years for the whole cycle are 2178 TWhe and 3277 TWhe, respectively. For the sake of this study, no new reactors are considered to be built.
- (2)
The fuel burn-up was averaged to 40 GWd/tU for reactors with 40 years of operation. For reactors with 60 years of operation, 40 GWd/tU was used for the first 40 years and 50 GWd/tU for the additional 20 years.
- (3)
Each PWR and BWR reactor was simulated separately in each scenario. Since Vandellós I has very different technology and has been in operation for only about 17 years, this reactor was not considered in the simulations.
- (4)
This study postulates a minimum period of five years of cooling time before reprocessing for the spent fuel (SF) and efficiency values of 99.9% for reprocessing and 100% for fabrication.
- (5)
In scenarios with reprocessing, and according to an average of the current technology status [
3], all reactors use MOX in 1/3 of the core since year 2016 until decommissioning.
- (6)
In scenarios with reprocessing strategies, uranium is recovered from the SF and then re-enriched to fabricate fresh UO
2-R fuel. The fuel specifications are shown in
Table 1 [
11]. Note that the final enrichment for reprocessed uranium (RepU) fuel is larger than for fuel from natural uranium (NatU) to compensate the amount of
236U. This enrichment is a result of the simulation, not a hypothesis.
The hypotheses used for the economic assessments are as follows:
- (1)
This analysis is carried out only from 2014 to EOC for all scenarios. The construction cost of existing reactors and the reinvestments needed to maintain operation to 60 years are not included in this analysis, although they can represent, together with the operation and maintenance (O&M) cost, more than 80% of the levelized cost of the electricity [
10,
12]. This assumption eliminates the possibility of an economical comparison among scenarios with different lifetimes.
- (2)
In reprocessing strategies, no reinvestments in reactors design were taken into account for using MOX or UO2-R fuel instead of UO2 fuel.
- (3)
No reprocessing facility is assumed to be built in the country with the medium sized nuclear fleet. Instead, it is supposed that contracts with a provider of this service are arranged. These contracts are considered to have constant costs for the scenario length, hence no new (cheaper) providers may appear, and the service cannot be canceled.
- (4)
The real decommissioning date of reactors is respected until 2012. After this date, reactors are expected to work for a total of 40 or 60 years, depending on the scenario definition.
- (5)
The unit costs have been taken as best estimations from Klaasen et al. [
13]. According to this data, the reprocessing cost range for UO
2-SF varies from 465 to 1100 €/kgHM (2012 price level). However, the range has been extended in order to show the results properly: lower (300 €/kg) and upper (1300 €/kg) limits for the reprocessing cost have been arbitrarily taken into account, given the larger uncertainty of this parameter. All costs taken from the literature have been converted to €, at 2012 price level, and are included in
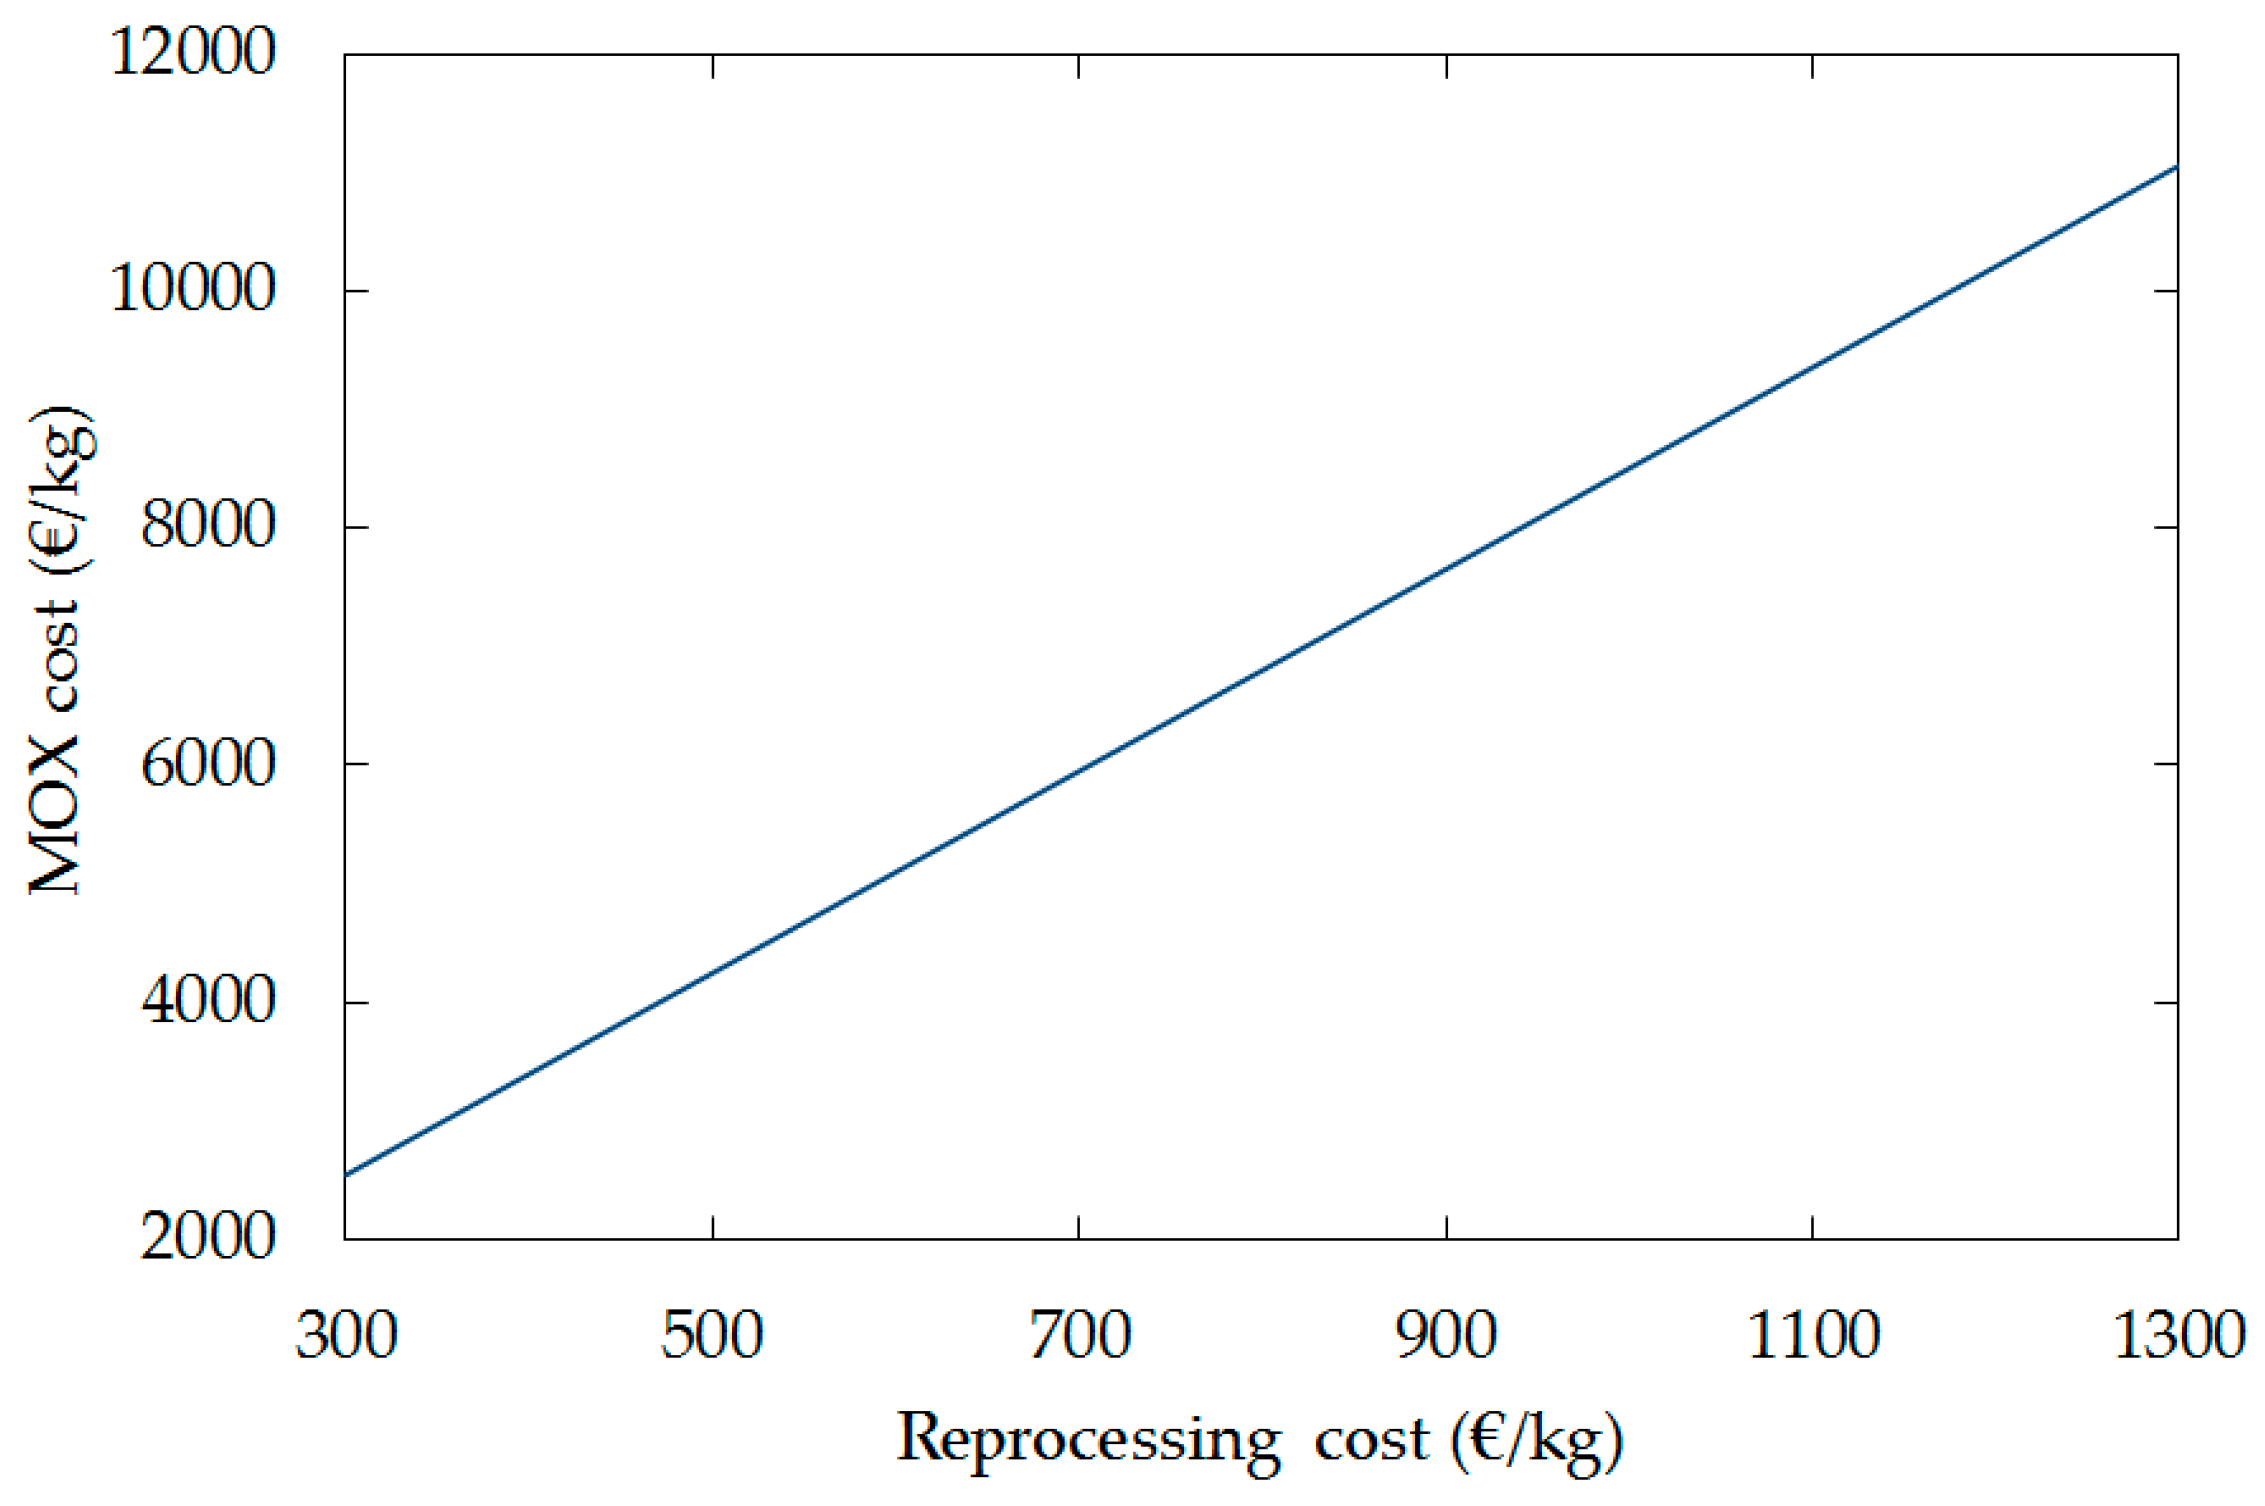
Table 2. Although these values may vary along time (and country/region), they are considered as representative for the long-term scenarios studied here. The UO
2 and MOX assembly fabrication cost is assumed as a constant value because its variability does not involve large changes at the total fuel cost. The cost of the MOX fuel can be obtained from the unit costs taken from the reference as the mass of UO
2-SF needed to obtain the amount of Pu times the UO
2-SF reprocessing cost, plus the fixed cost for MOX assembly fabrication. The results for this cost are shown in
Figure 2.
- (1)
An extra charge in the cost of MOX-SF reprocessing (relative to UO
2-SF reprocessing) has been assumed for scenarios with MOX-SF reprocessing. This extra cost is based on the different radiological properties that MOX-SF has regarding UO
2-SF, which complicates MOX-SF disposal and possibly its reprocessing. An extra charge of 25% has been arbitrarily assumed (upper bound in [
12]), considering the limited historical experience in MOX-SF reprocessing.
- (2)
The encapsulation plant and the final disposal facility (FD) are (arbitrarily) supposed to operate between years 2104 and 2118. Since the interim storage (ID) has been already approved in Spain, it is considered here that this disposal is the same for all scenarios. A lifetime of 100 years has been arbitrarily considered for the ID, which is emptied at EOC.
3. Simulation Tool: TR_EVOL Module Description
The TR_EVOL module [
9,
10] has been designed to evaluate different options for the fuel cycle scenario, enhancing the capabilities of the burn-up simulation system EVOLCODE [
14]. In particular, this module is able to simulate:
Diverse nuclear power plants: light water reactors, fast reactors, critical or subcritical systems, etc.;
Several different types of fuels: UO2, MOX, metal fuel, etc.;
The associated fuel cycle facilities, such as enrichment plant, fuel fabrication plant, reprocessing facility, interim storage, waste storage, and geological disposal.
The module is able to simulate both reactor fleets (as single averaged macro-reactors) and individually each reactor of the fleet (requiring larger computer resources).
The evolution of fuel isotopic composition and nuclear materials during the lifetime of the nuclear reactor or fleet is performed in TR_EVOL by means of ORIGEN 2.2 (Isotope Generation and Depletion Code) [
15], which has been completely incorporated within TR_EVOL in order to optimize the data transference between modules and increase computational speed. In case of irradiation, the ORIGEN reference cross section libraries or libraries specifically calculated with EVOLCODE 2.0 (CIEMAT, Spain) can be used. In this work, ORIGEN reference libraries were used since only thermal reactors have been taken into account (separate libraries for UO2 and MOX fuel). More details about the physics and capabilities of TR_EVOL can be found in [
16,
17].
The TR_EVOL module for economic assessments provides the Levelized Cost of Electricity making use of the TR_EVOL mass balance output file and four main sources of economic information:
Investment cost. This cost type includes the overnight cost of the plant, interest rates, payback periods, and construction periods.
Fuel cost. This cost is calculated using parameters such as raw materials, enrichment, conversions, and fabrication in case of UO2 fuel, or a fixed cost by kg in case of MOX fuel for LWR, fast reactors or Accelerator-Driven Subcritical systems.
Operation and Maintenance cost. This cost is given per unit of installed capacity (€/GWe).
Waste Management cost. This cost is the sum of interim and final disposal cost, including fixed and variable costs like shaft, galleries, canisters, and glasses (which are limited by heat production), and the decommissioning cost as a percentage of the overnight cost.
The economic calculation depends on the physics of the problem since it uses results depending on the physics of the problem (isotopics). For instance, it relies on the amount of Pu for MOX fabrication and the heat production limiting the amount of waste in canisters and glasses.
Note that the use of the TR_EVOL module has been crucial for obtaining a series of quantities needed to understand the behavior of the mass balance in the fuel cycle scenario. In particular this module has allowed the estimation of the following:
The Pu content and the isotopic composition at the discharge period for each reactor using different fuel, burn-up, or enrichment.
The fractions for Pu and RepU separated or contained in the SF.
Availability of Pu for MOX fabrication at every moment of the fuel cycle scenario.
4. Results and Discussion
This section includes the results of the analysis of the fuel cycle mass balance. This analysis has the objective of determining practical issues to be taken into account for the correct assessment of the scenario. The results of the analysis from an economics point of view, taking into account these practical issues, are presented later.
4.1. Fuel Cycle
Table 3 shows the fuel requirements for the different scenarios. In scenarios 40 with reprocessing, the SF is a resource able to provide more “fresh fuel” (MOX and re-enriched RepU). The reprocessing of 3780 t of UO
2-SF provides savings larger than 8000 t of NatU. Moreover, around 4000 t of depleted uranium (DepU) from the RepU re-enrichment is also generated in both scenarios 40-PART and 40-FULL.
Figure 3 gives a description of scenarios 40-PART and 40-FULL of the time evolution of the scenario until 2040, showing the amount of Pu in the different SF streams. Pu for MOX fabrication is obtained from the reprocessing of UO
2-SF fuel, which is implemented between years 2014 and 2020. This produces the reduction in the amount of Pu in UO
2-SF. In year 2023, irradiated MOX and UO
2-R fuels finish their cooling decay period at reactor pool, so the Pu existing in MOX-SF and in UO
2-R-SF becomes available. In addition, in scenario 40-FULL, the remaining SF will be reprocessed at EOC.
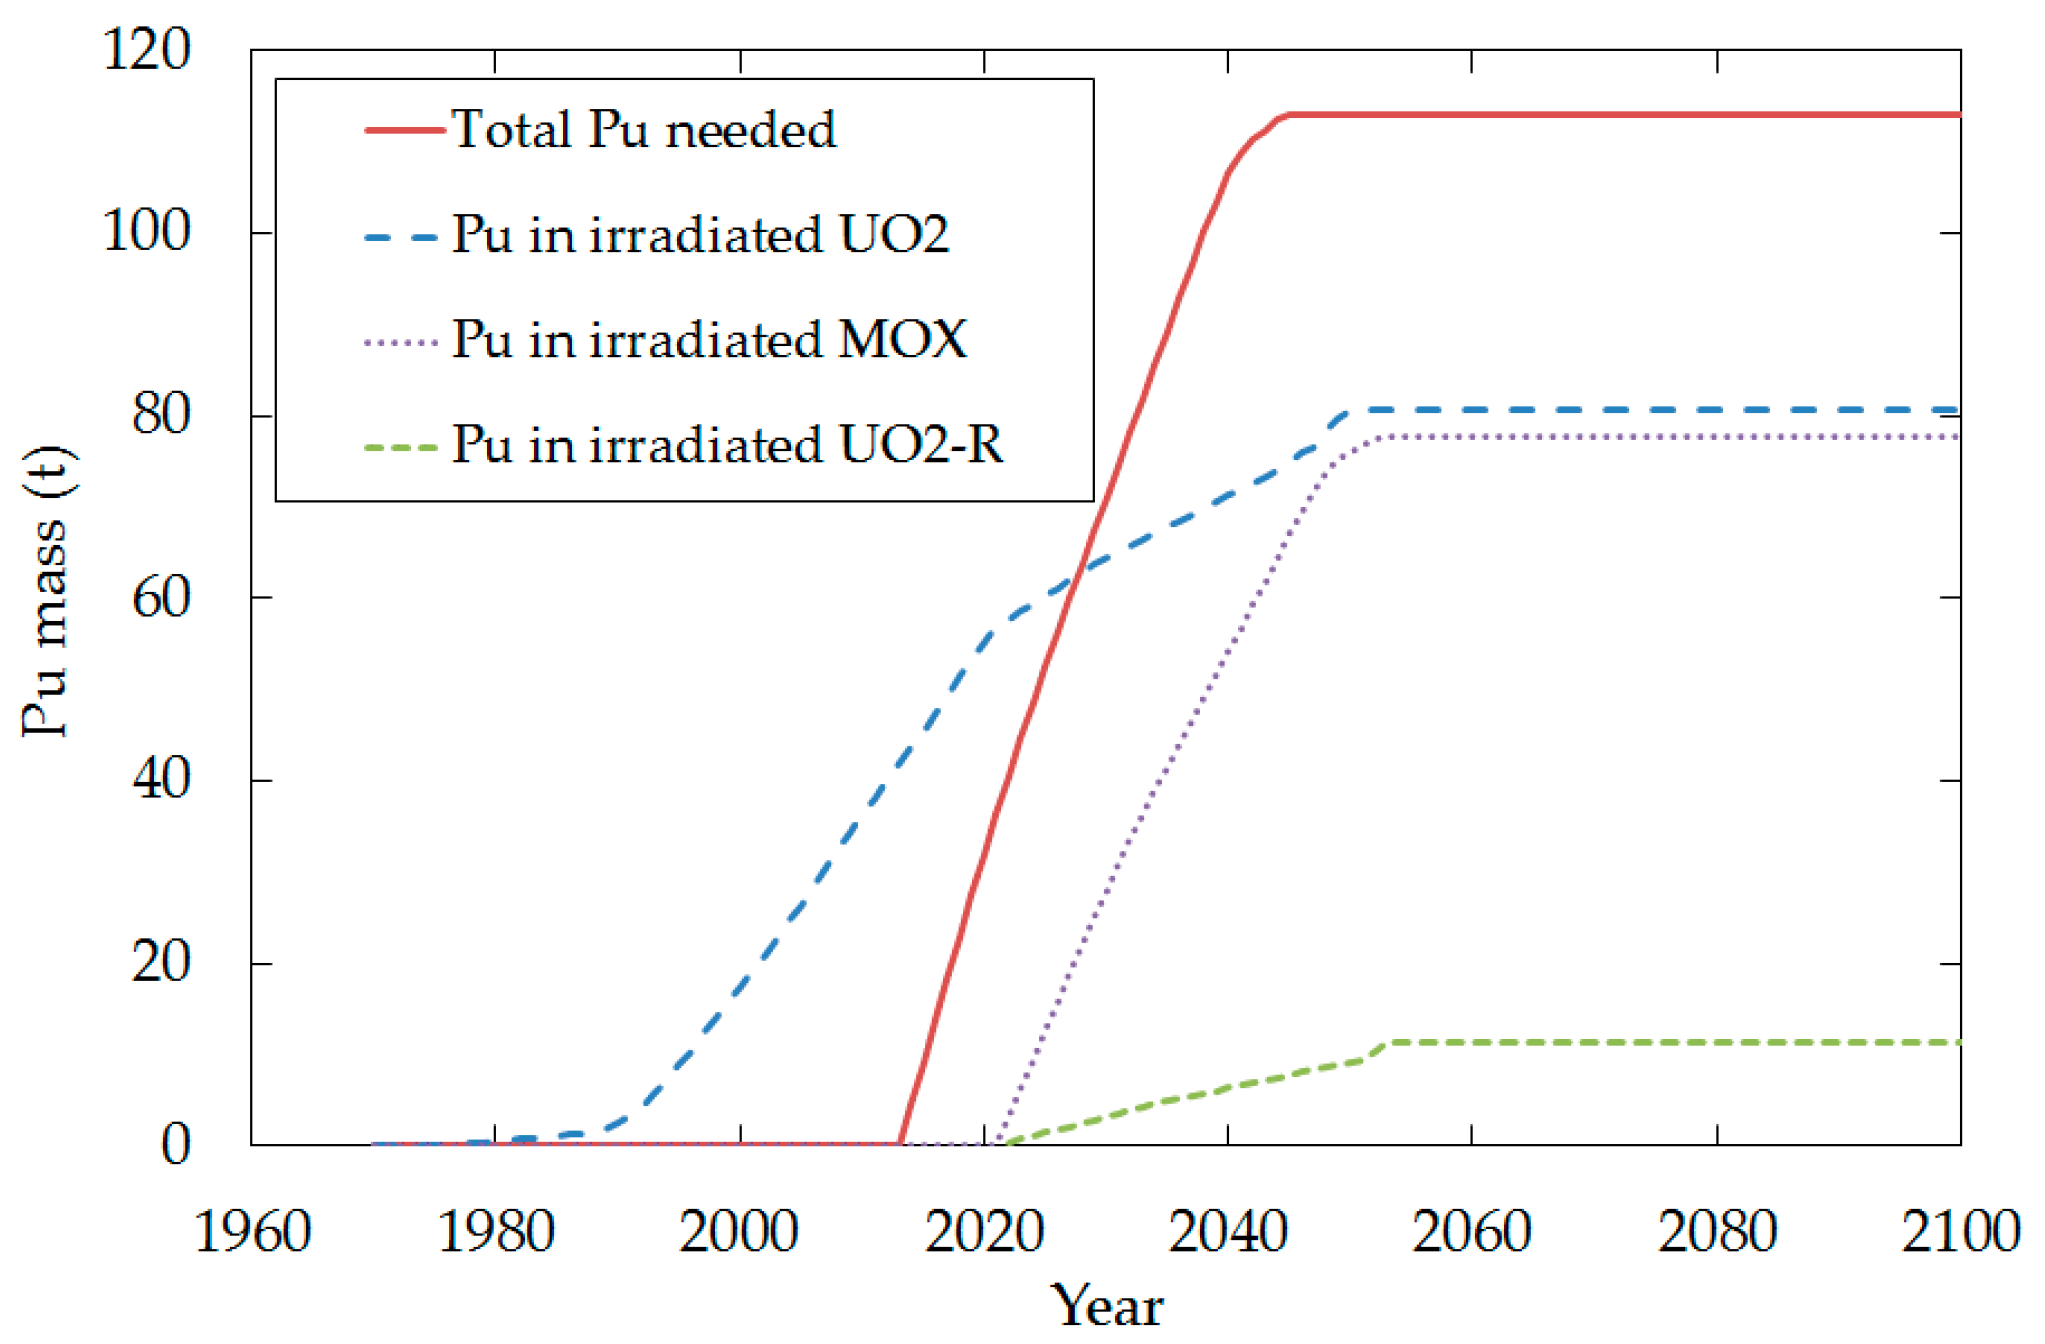
The fuel requirements for scenarios with 60 years of operation (scenarios 60) are also shown in
Table 3. In scenarios with reprocessing 60-FULL and 60-PART, 1296 t of MOX fuel are required (112 t of Pu), allowing savings of almost 20 kt of natural uranium. Unfortunately, the Pu available by reprocessing all the UO
2-SF is not enough (
Figure 4) to fabricate this amount of fuel at the moment when it is needed (the availability of Pu would be limited to only four power plants in this way). This problem is first detected in year 2029, when the “total Pu needed” exceeds the amount of “Pu in irradiated UO
2”. A total of 845 t of MOX may be obtained from the reprocessing of only the UO
2-SF. Around 32.4 t of Pu are needed if only the UO
2-SF is used as Pu source. Other sources of Pu are the UO
2-R-SF and the MOX-SF. With the Pu in these streams, the “total Pu needed” demands for fuel fabrication would be satisfied. However, this study does not consider the reprocessing of these SF to be available at these dates but at EOC instead. Hence, to solve this issue, the possibility of borrowing Pu from an external supplier when needed in the scenario and returning it at EOC has been considered. The reprocessing of the SF needed to give back the borrowed Pu is considered to be done at EOC as well. The Pu amount to be restored at EOC might be provided by two possible options (renamed scenarios 60-PART-1 and 60-PART-2):
Scenario 60-PART-1: all the UO2-SF and UO2-R-SF are reprocessed, plus some of the MOX-SF.
Scenario 60-PART-2: all the UO2-SF is reprocessed, plus the MOX-SF required to complete the Pu mass borrowed (it has to be considered that the Pu content in MOX-SF is almost five times that contained in the UO2-SF).
Additionally, around 5700 t of DepU from the RepU re-enrichment are also generated in both cases.
Concerning the back-end material balance, in scenario 40-ONCE, ~68 t of Pu are present in the SF, together with small quantities from the reprocessing of some nuclear fuel from José Cabrera and S. M. Garoña until year 1983. 65 t of separated RepU are also generated in this scenario. The strategy of scenario 40-PART allows only a small reduction in the amount of Pu in the fuel cycle scenario, down to ~51 t of Pu. On the contrary, this reduction is significant for scenarios 60, with a ~50% reduction by the use of MOX fuel, from ~93 t of Pu found in the spent fuel for Scenario 60-ONCE down to 44 t found in Scenario 60-PART.
Additionally,
Table 4 shows the irradiated fuel and HLWr mass to store in the FD. In the open cycle scenarios 40-ONCE and 60-ONCE, the fuel after irradiation is considered as waste and is stored in a final disposal; the value of 2.5 t of HLWr comes from the mass reprocessed until year 1983 (~68 t). Differences between scenarios 60-PART-1 and 60-PART-2 arise from the different material used as the source of Pu to be given back to the external supplier. It can also be seen that, for scenarios with reprocessing, the mass of material to be stored in the FD is significantly reduced.
Concerning the scenarios with extra-reprocessing at EOC (40-FULL and 60-FULL, and partial reprocessing in case of scenarios 60 to restore the Pu lent),
Table 5 shows the SF mass to be reprocessed at EOC by each fuel type. Scenario 60-PART-2 has the smallest amount of mass to be reprocessed at EOC because the Pu content in the MOX-SF is five times higher than in UO
2-SF.
4.2. Economics
As mentioned above, in the economic assessment only the period 2014 to the EOC was evaluated, since it includes the differences between scenarios that can help find the magnitudes with a significant impact (in economic terms) for the implementation of reprocessing. Since no financial investments or reinvestments were considered (being the largest contributions to the total cost of electricity), it is assumed that the main economic differences come only from the fuel type and its mass amount required from 2014 to the EOC and the final disposal. Among these cost types, the reprocessing cost and the cost of the natural uranium can be highlighted since these magnitudes were reported as having the largest impact in this kind of fuel cycle scenario analysis for large nuclear reactor fleets [
4,
5].
4.2.1. Fuel Cost
According to fuel type,
Table 5 shows the mass of the three fuel types used in the cycle per each scenario (UO
2 enriched at 4% and 4.5% according to burn-up, UO
2-R enriched at 4.5% and 4.9%, and MOX fuel). On the other hand, the FD and the SF and HLWr conditioning costs depend on the total mass generated along the cycle (as SF and HLWr), and they have been taken into account as a cost that depends on the strategy to follow.
According to the fuel mass calculated and applying the unit costs shown in
Table 2, the total fuel cost per scenario for the fuel fabricated for year 2014 to EOC was estimated and is shown in
Table 6. For scenarios with reprocessing, both boundary cases were considered, with a UO
2-SF reprocessing cost of 300 €/kgHM and of 1300 €/kgHM. The fuel cost for Scenarios 40-ONCE and 60-ONCE is, of course, independent of the reprocessing cost. It is important to mention that the cost of reprocessing the irradiated fuel to obtain the Pu to be returned to the lender in Scenario 60-PART will be assumed at EOC (by reprocessing process), and must be added to the total fuel cost shown in
Table 7. No cost has been considered for the transport of the borrowed material. The cost of reprocessing at EOC will be analyzed in the following.
4.2.2. Cost of Extra Reprocessing
Concerning the additional cost for those scenarios with extra-reprocessing at EOC (40-FULL and 60-FULL, and partial reprocessing in case of scenarios 60 to restore the Pu lent),
Table 8 shows reprocessing cost using the same reprocessing range costs of 300 €/kgHM and 1300 €/kgHM for UO
2-SF and the value of the MOX-SF reprocessing as stated in
Section 2.2 and the mass by each type shown in
Table 5. The particular cost of scenario 40-FULL should be highlighted because the large amount of UO
2-SF reprocessed. On the other hand, for scenarios with partial reprocessing, the smallest value is obtained for the 60-PART-2 scenario due to the lower mass needed to be reprocess for restoring the Pu to the supplier, since the Pu content in the MOX-SF is five times higher than that in UO
2-SF (even with a larger value of the MOX-SF reprocessing cost).
The cost of reprocessing at EOC is significant for scenario 40-FULL (~30 to ~63% of the total fuel cost) and small compared to total fuel cost for scenarios 60.
4.2.3. Cost of Final Disposal
The calculation of the number of packages to store in the FD is required to assess this cost. This number depends on the mass of SF to store, on thermal limits of the canister itself in the FD specification, and also on the radioactivity contained in this SF mass. More radioactive materials may require more room in the repository (relative to typical cooled UO
2 fuel) to assure that sufficient heat is dissipated and thermal limits are not exceeded [
2].
Regarding mass limit, the maximum number of assemblies allowed per package is 4 for UO
2-PWR assemblies, 12 for UO
2-BWR assemblies, 1 for MOX assemblies, and 3 Universal Containers for HLWr. To simplify the FD model, all the UO
2 fuel is considered as PWR assemblies. According to [
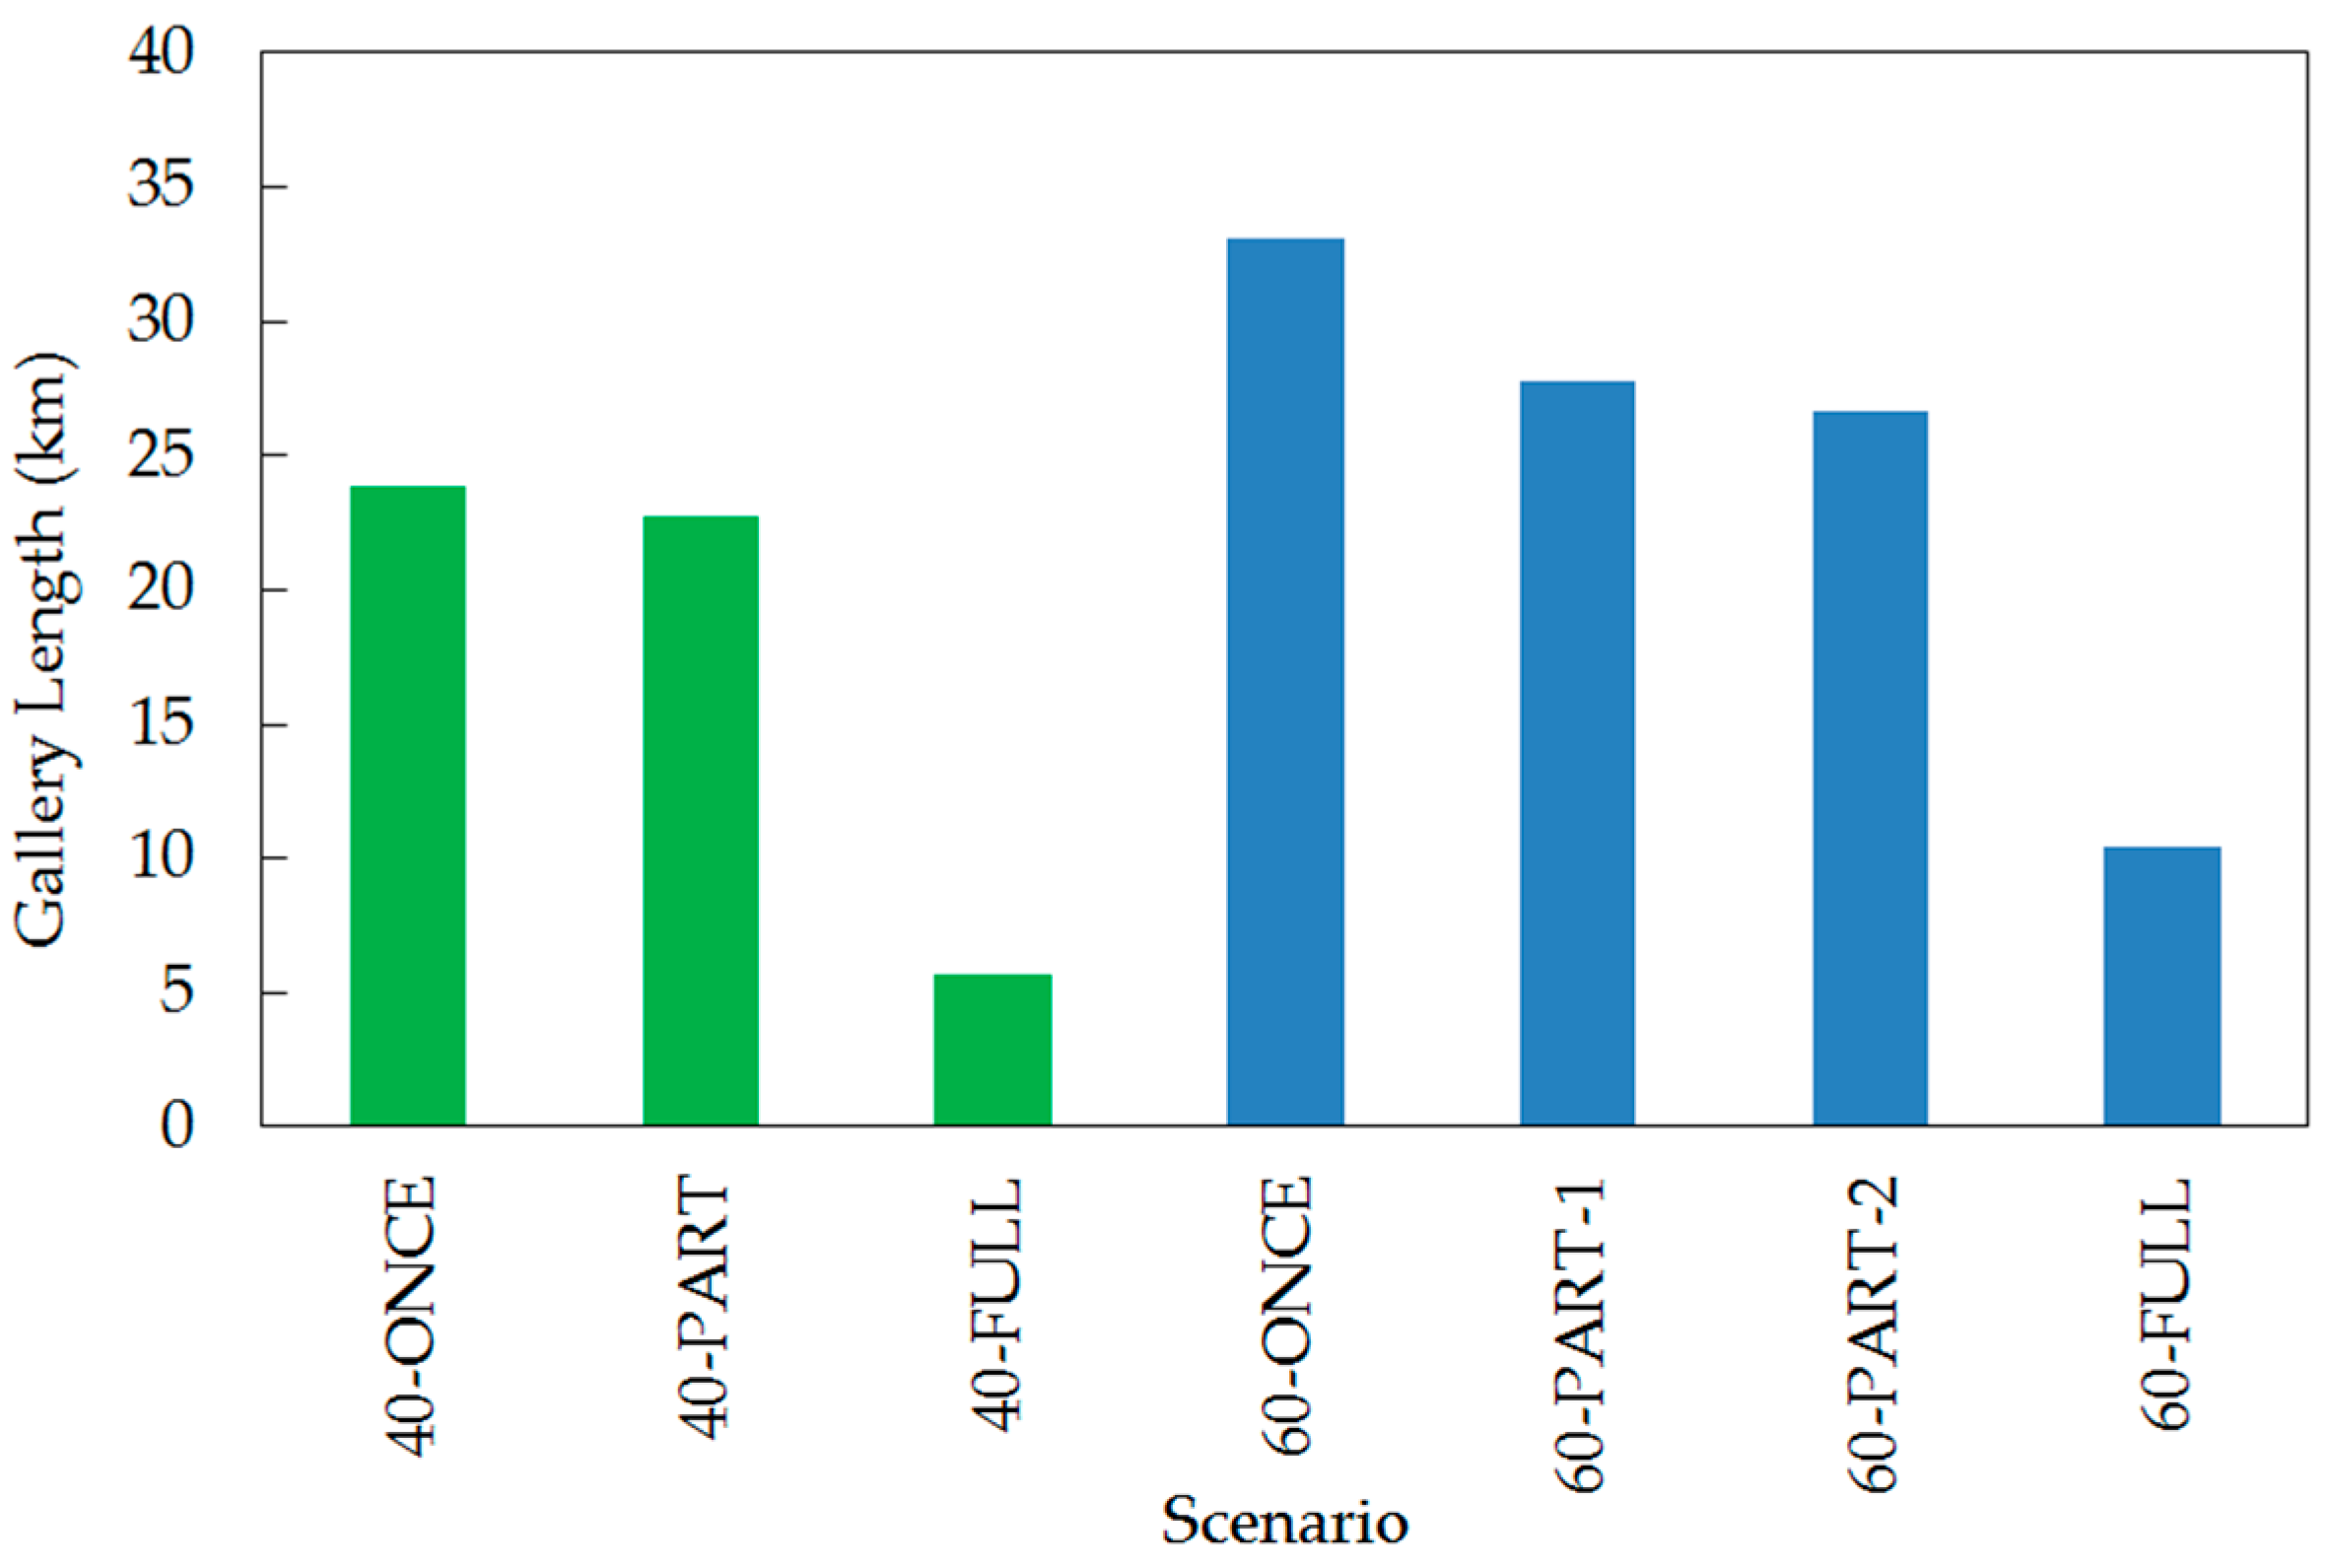
18], the maximum thermal power by canister in Spanish FD is 1.2 kW in order to avoid temperatures above 100 °C between the packages and the bentonite layer (engineering barrier located between the waste and the host rock). Considering the total number of packages coming from the application of these hypotheses (
Table 9), the gallery length required in the FD has been calculated for the different scenarios. Results are shown in
Figure 5. For scenarios 40, this figure shows that the partial reprocessing implies a small reduction on the gallery length compared to 40-ONCE (22.7 km vs. 23.9 km for Scenario 40-ONCE). This is caused because of the MOX storing assumptions: a significant gap between canisters containing MOX of 6.5 m is needed for the previously described thermal constraints. This also happens in 60-PART-1 and 60-PART-2 scenarios, with respective values of 27.8 km and 26.7 km vs. 33.1 km for Scenario 60-ONCE. For full reprocessing, in scenarios 40 and 60, the required gallery length is significantly reduced (in a factor 4 and 3, respectively, with total gallery length values of 5.7 km for Scenario 40-FULL and 10.4 km for Scenario 60-FULL).
It has to be noted that assessing the economic details of the FD is a complex procedure because of the lack of experience worldwide in its construction and operation and the high uncertainties in the different parameters [
19]. Some information can be found in that reference, which provides the last information available for the back-end costs. The estimation of the FD costs were made by means of that publication and a special module implemented in TR_EVOL for this purpose [
20]. The cost of the final disposal (
Table 9) includes the cost for the disposal itself (divided in an overnight cost, O&M cost and a closure cost) and the cost of the encapsulation plant (divided in overnight and O&M costs; it depends on the encapsulation capacity, the fuel type and the operation time). Both costs also depend on the number of packages to store.
Results show that there are not significant differences in the encapsulation plant cost between the open cycle and scenarios with partial reprocessing. On the contrary, this cost is reduced in almost a 50% in scenarios with full reprocessing. However, these differences represent just a small value when compared to the total cost of the disposal itself.
For the total cost of the FD, significant differences can be seen between scenarios, in particular in scenarios with full reprocessing because of the reduction in the number of packages. It has to be mentioned as well that the significant reduction in the gallery length (in factors four and three respectively for scenarios 40-FULL and 60-FULL), shown in
Figure 5, does not lead to similar reductions in costs, because of the contributions of the fixed costs and the encapsulation process cost according to [
19]. It has to be mentioned that FDs for once-through strategy (having SF + HLWr in the FD) and full reprocessing strategies (having only HLWr in the FD) are not strictly comparable: different requirements in the FD design are expected, possibly leading to different FD costs.
4.2.4. Extra Materials as Assets
As abovementioned, for full reprocessing strategies, the Pu and RepU separated and with no use for the scenario itself can be valued as assets for its use as fuel by other fuel cycle countries. The maximum fresh fuel mass that can be fabricated is shown in
Table 10 for both scenarios 40-FULL and 60-FULL respectively. Assuming that the maximum value as asset of both fuel types matches the UO
2 fuel cost from natural uranium and that a potential user of this material is found, the maximum value adding both MOX and UO
2-R fuel values (that can be considered as savings in the current fuel cycle scenario) is 929 M€ for 40-FULL and 942 M€ for 60-FULL. A sale cost of 1.87 M€/tUO
2 has been assumed for scenario 40-FULL and 2.11 M€/tUO
2 for scenario 60-FULL, both of them using the same cost for UO
2 from NatU but enriched to 4.0%
235U and 4.5%
235U, for scenarios 40-FULL and 60-FULL, respectively.
4.2.5. Total Scenario Cost
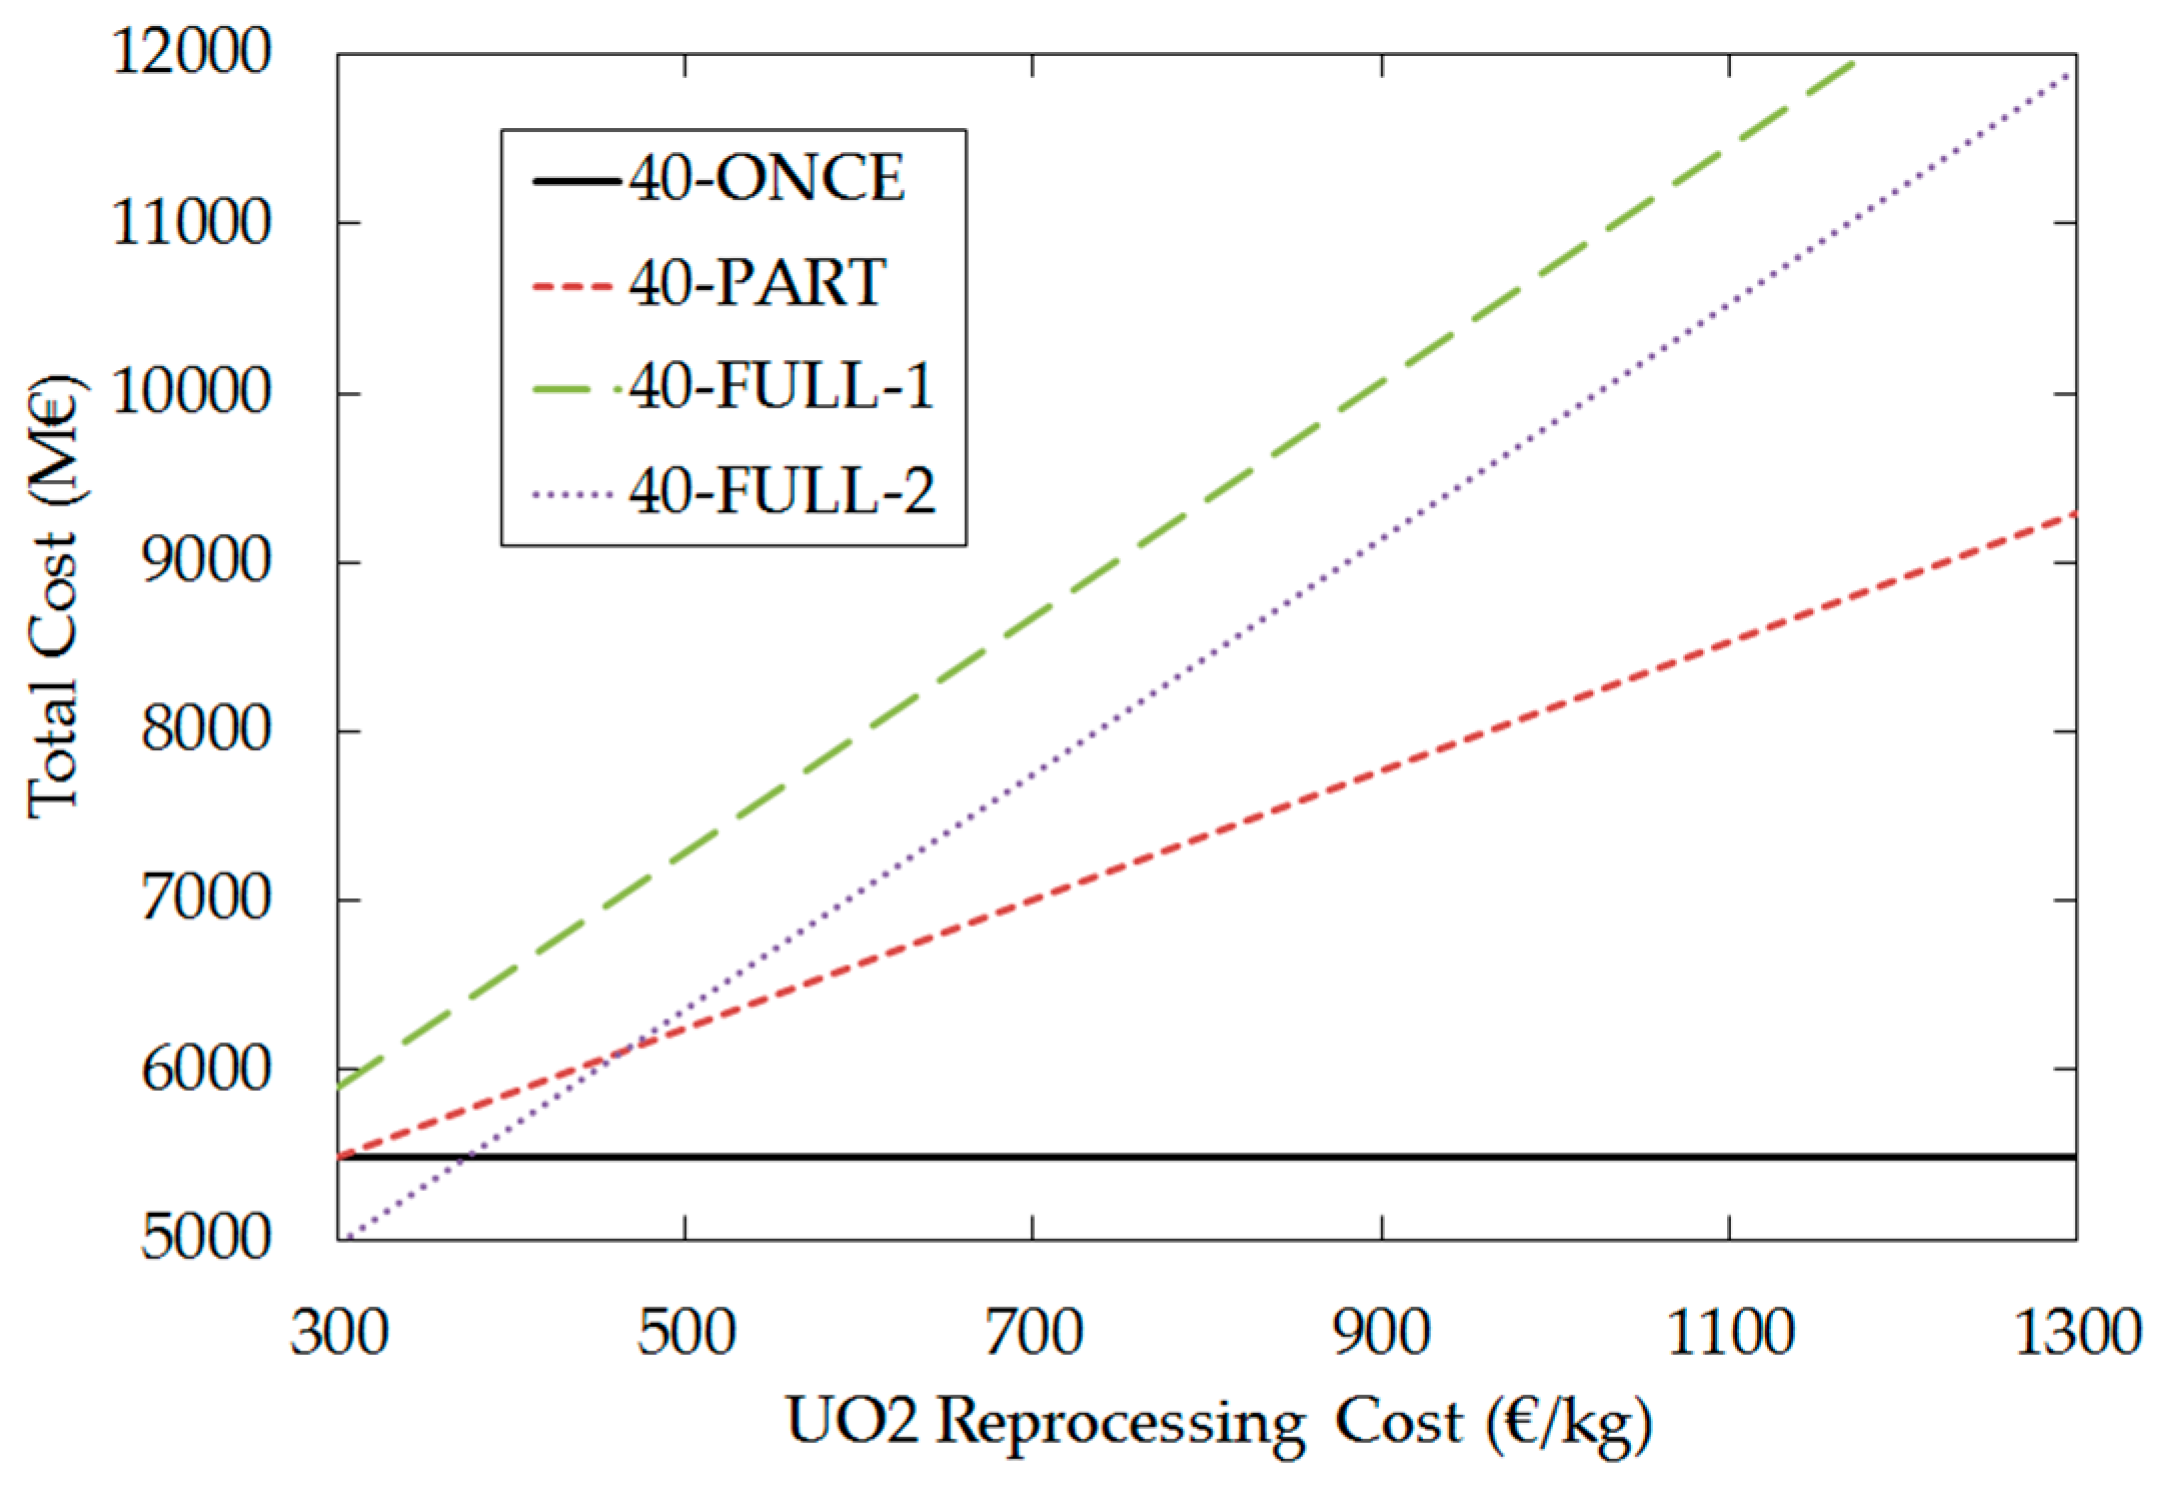
The cost of each scenario can be computed adding the cost of NatU, the cost of conversion/enrichment and fabrication plus the final disposal, and in the case of scenarios with reprocessing, the reprocessing costs and possibly subtracting the value of the assets. Then, summarizing the results for scenarios 40, the impact of reprocessing in the cost of the scenario can be seen in
Figure 6. This figure shows the total cost of the scenario as a function of the reprocessing cost for scenarios 40, including scenario 40-FULL-1 (Pu and RepU are not valued as assets) and scenario 40-FULL-2 (this extra material is valued). Note that the cost of the scenarios should not be taken as an absolute or reference value, because of the hypotheses made in the analysis. Instead, these costs are intended to identify incremented effects of the new technologies and options introduced regarding the open cycle.
This result shows that the main parameter with an impact in the cost of the fuel cycle scenario is indeed the cost of reprocessing. Even considering that the final disposal is for scenarios 40-PART and 40-FULL respectively 300-750 M€ cheaper than for scenario 40-ONCE (
Table 8), for scenario 40-PART, for a typical value of 1000 €/kg in the reprocessing cost leads to a difference in the total scenario cost of almost 4000 M€. For scenarios 40-FULL-1 and 40-FULL-2, which include extra reprocessing at EOC, the difference in the total scenario cost is around 7000 M€.
Both scenarios 40-PART and 40-FULL (see
Figure 3) have similar costs except for the cost for reprocessing the extra material at EOC, which only appears in scenario 40-PART. This cost has small importance if the cost of reprocessing is small (around 300 €/kg), but it becomes the major contributor for high reprocessing costs.
Additionally,
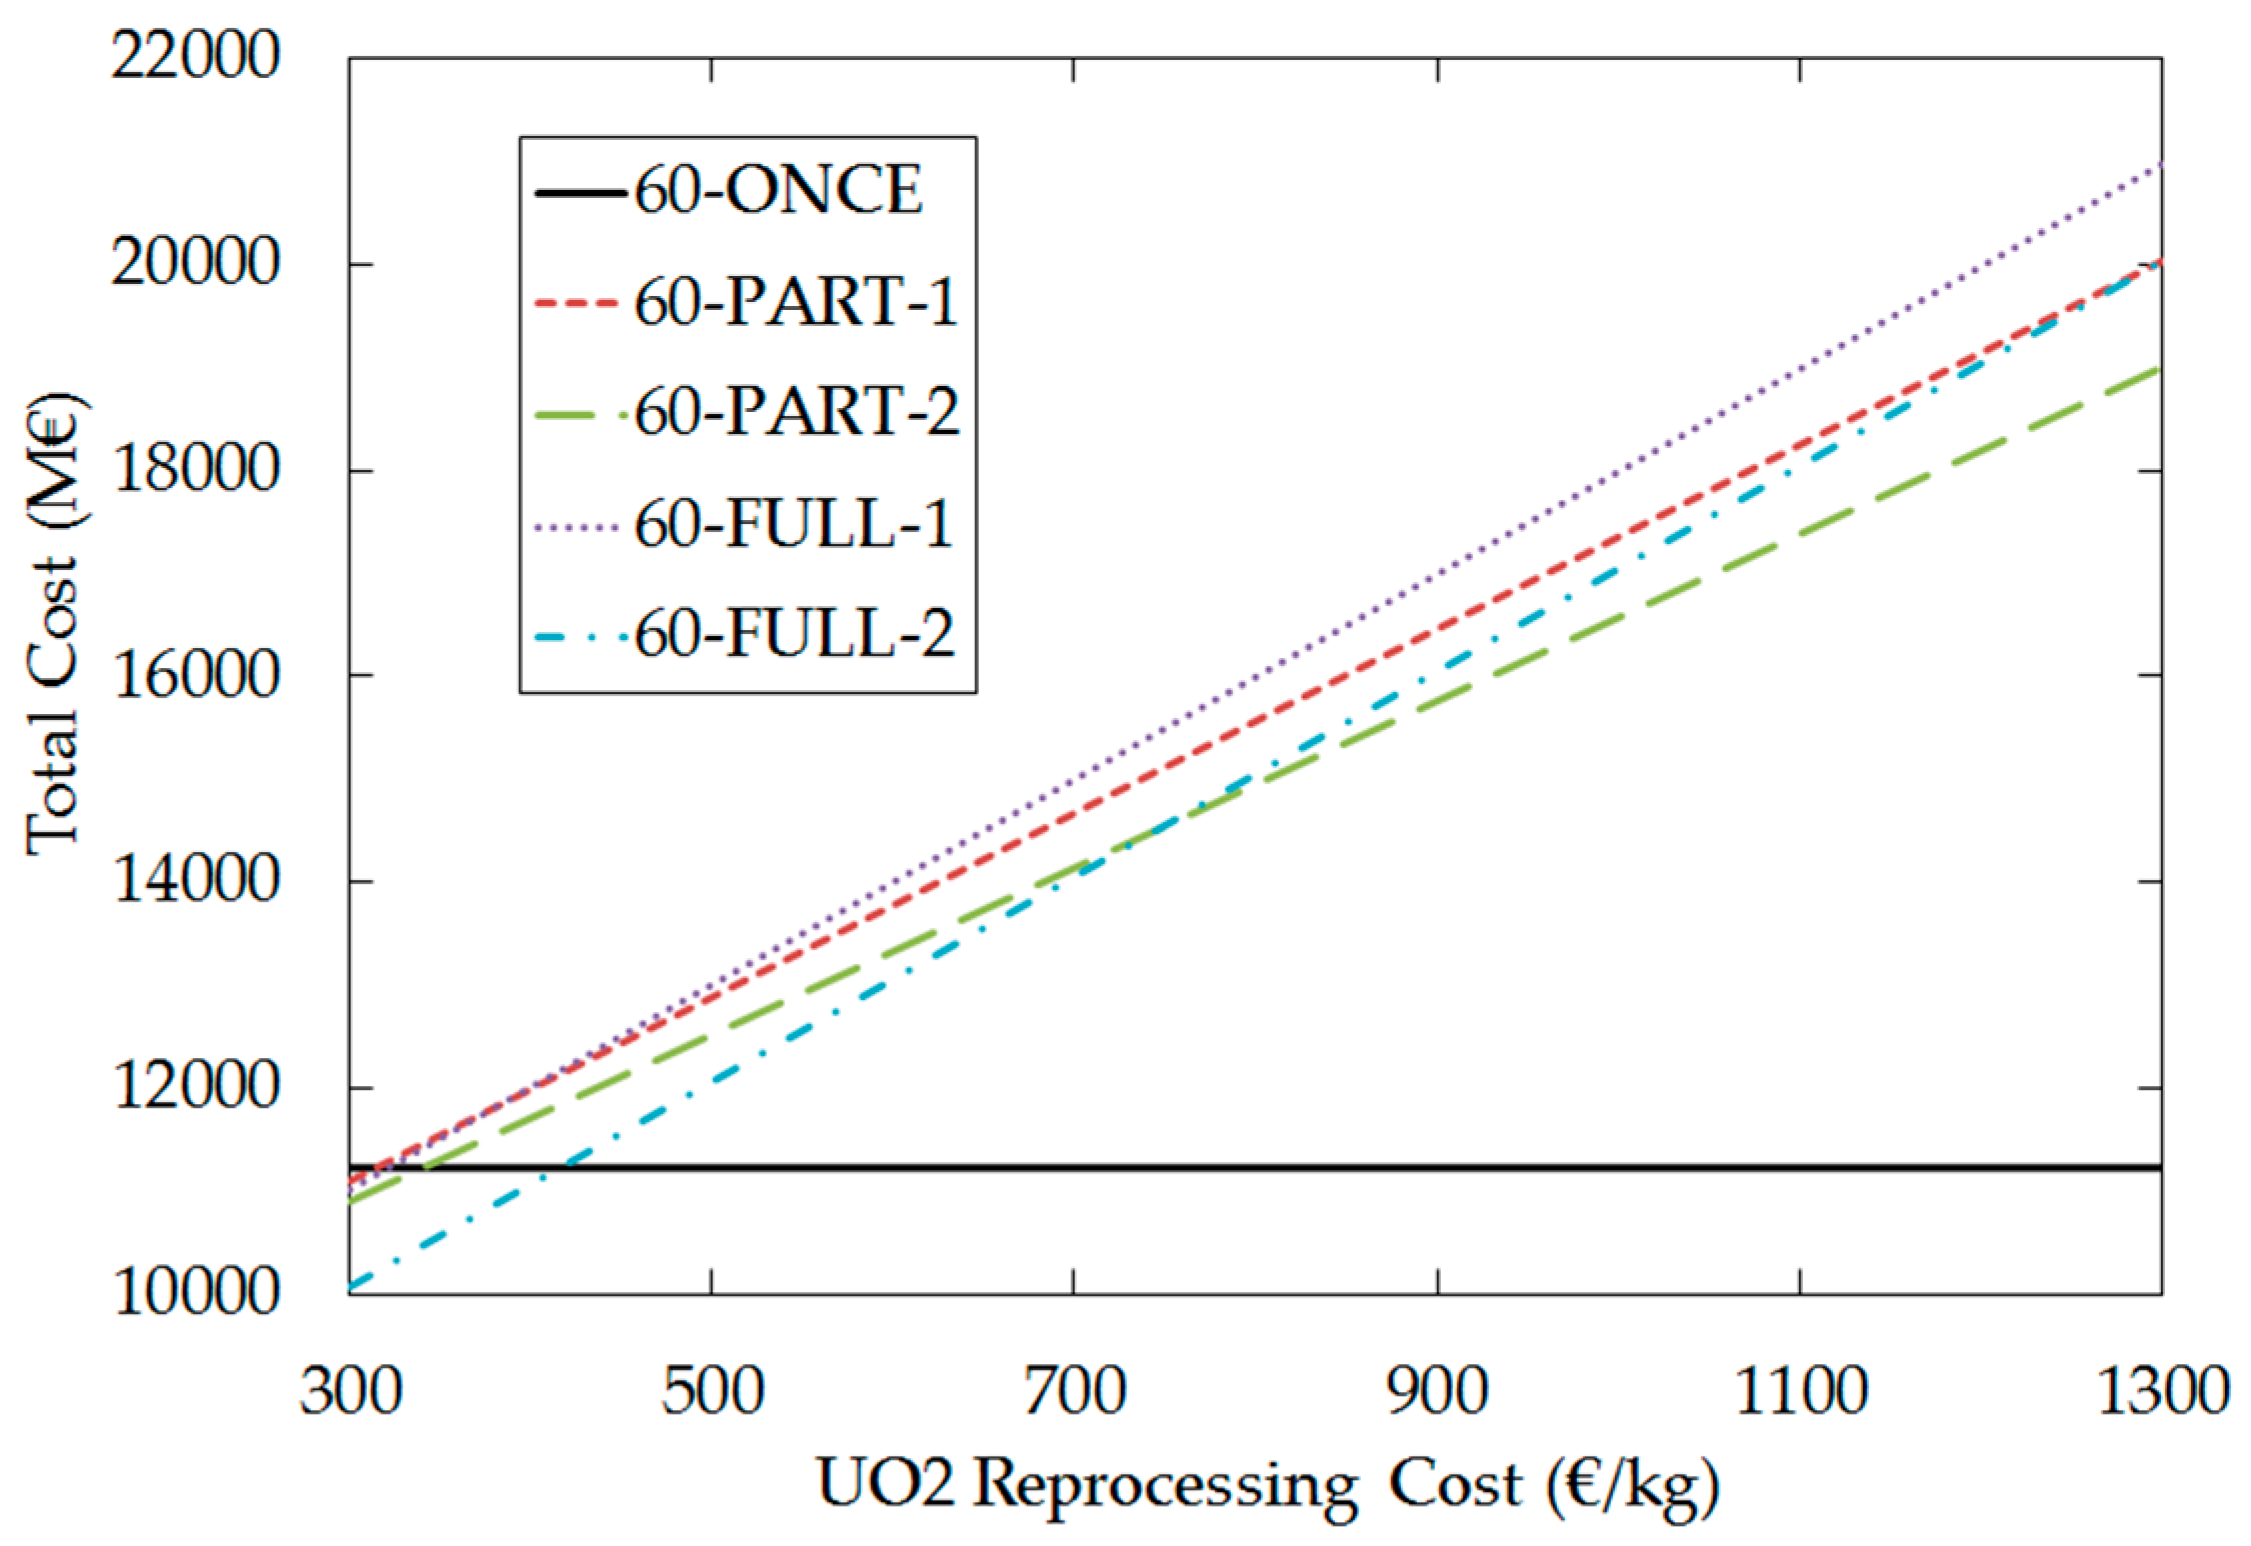
Figure 6 shows the effect of valuing the extra material: it provides a certain compensation for the cost of reprocessing, decreasing in around 1000 M€ the total scenario cost. A similar graph (
Figure 7) can be obtained for scenarios 60, with different values of the total cost. In this case, the total scenario cost for scenario 60-ONCE is around 11,200 M€. The effect of valuing the extra material in scenario 60-FULL-2 is similar to scenario 40-FULL-2, with a reduction in the total scenario cost of almost 1 B€. Scenarios 60-PART-1 and 60-PART-2 only differ significantly in the amount of mass to reprocess at EOC. Their total scenario costs are similar for a reprocessing cost of 300 €/kg (in this case reprocessing has small impact in the scenario cost and the total cost is also similar to scenario 60-ONCE), but not so similar for a reprocessing cost of 1300 €/kg: scenario 60-PART-1 is around 1 B€ more expensive due to the larger amount of mass to reprocess, reaching a total cost of around 20 B€.
4.2.6. Natural Uranium Price
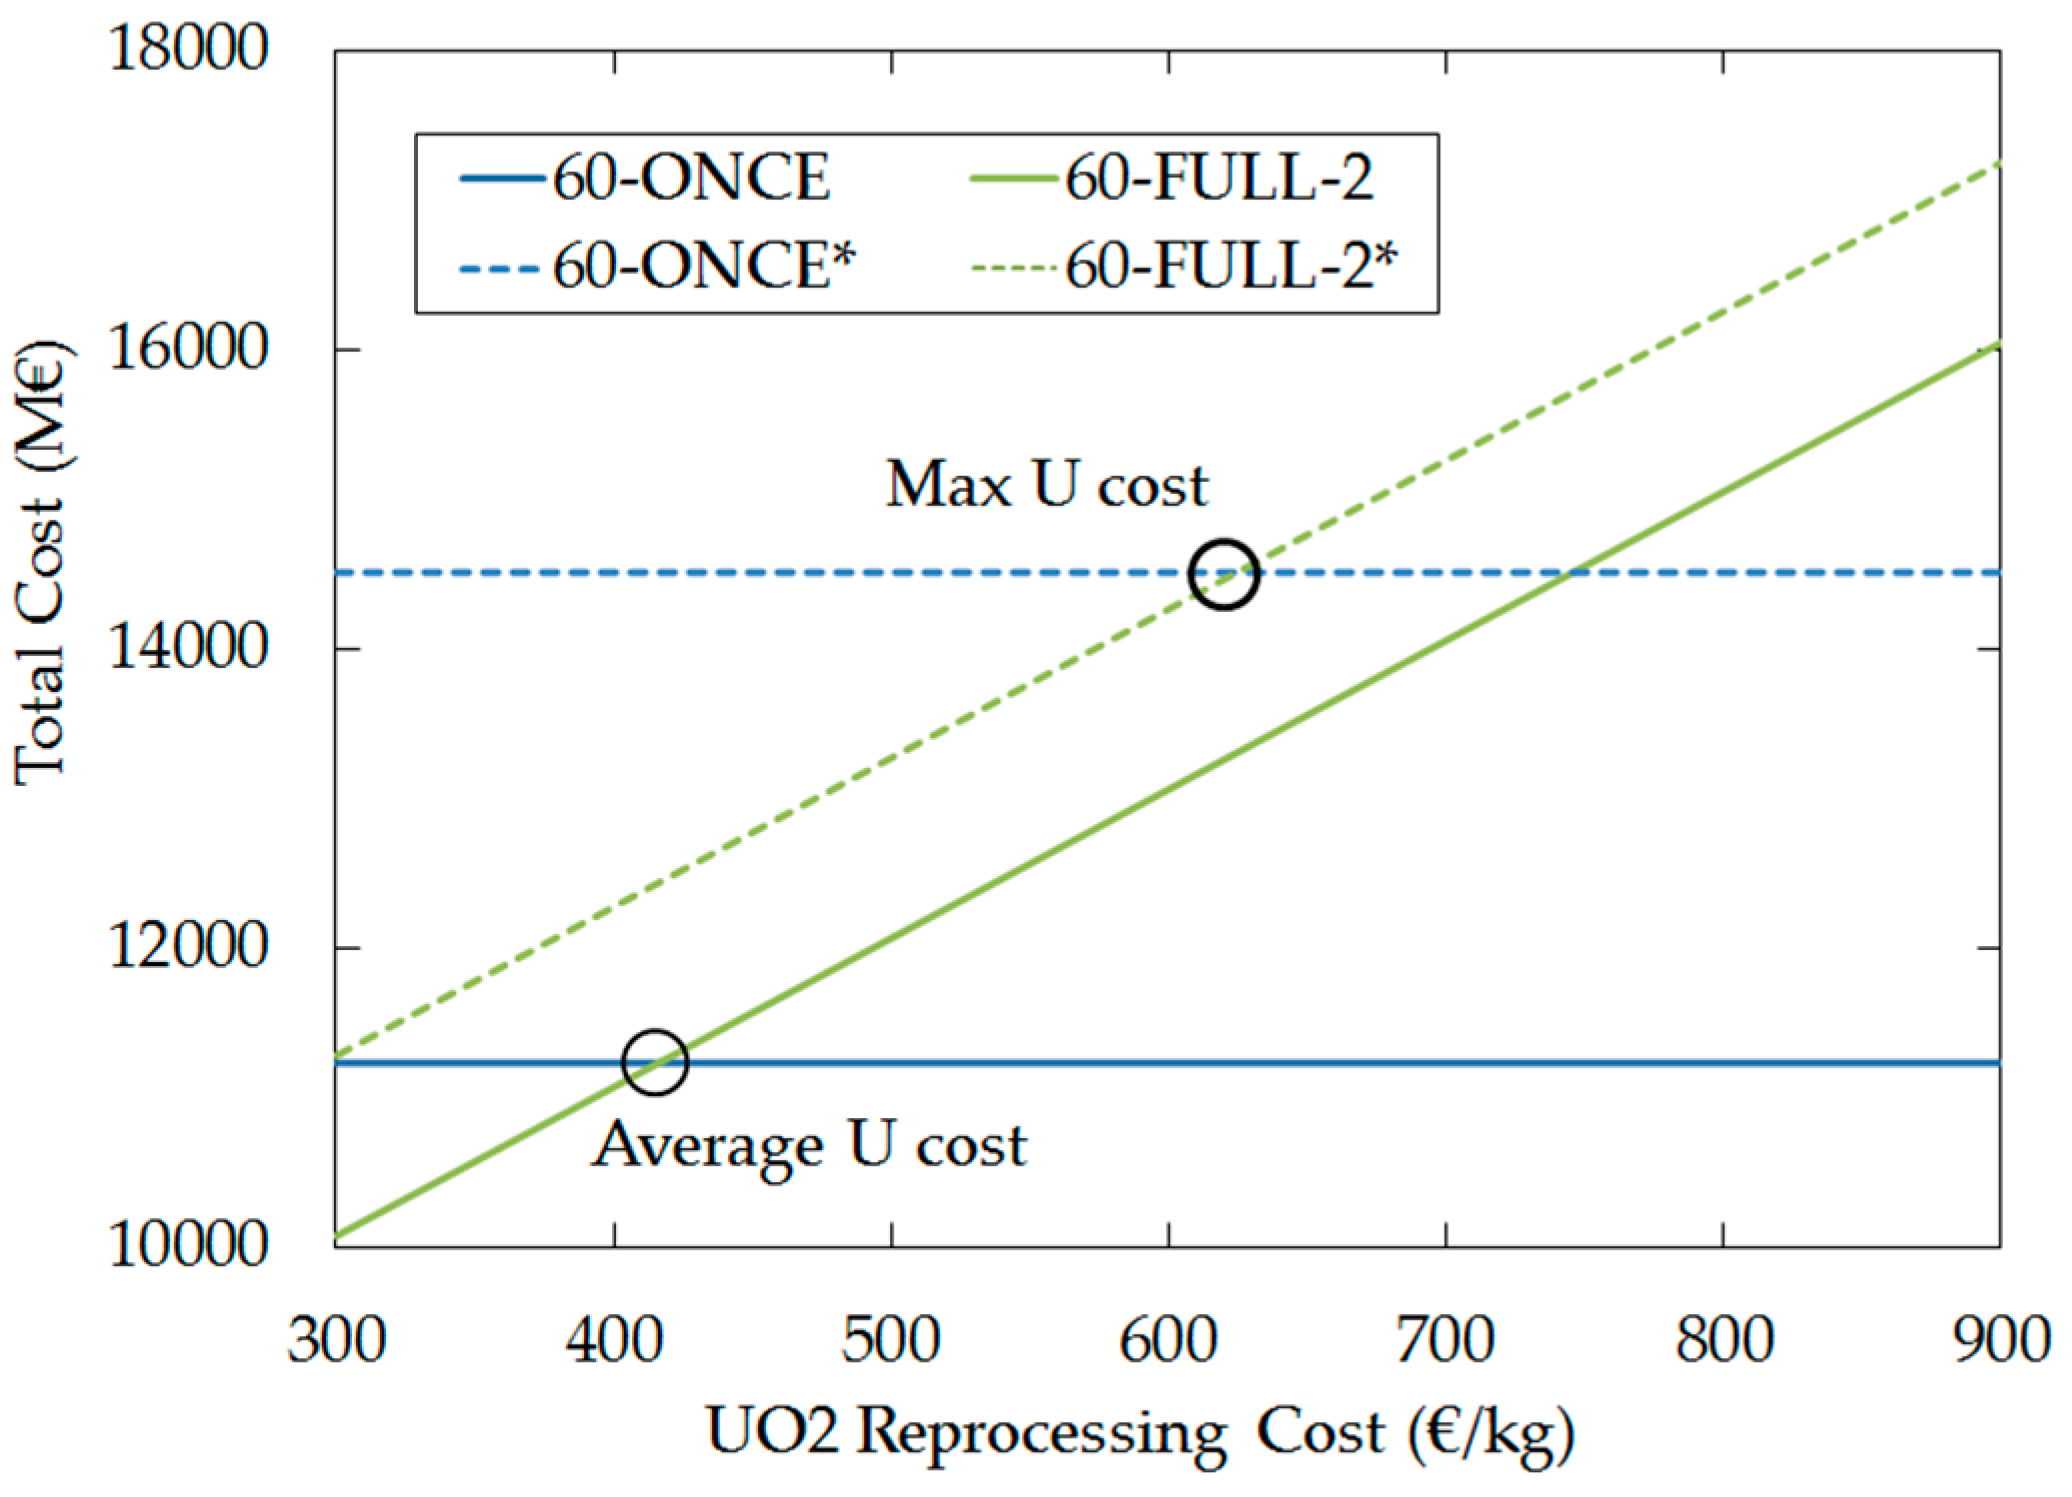
The cost of the once-through scenario depends mainly on the uranium price. The impact of changes in this uranium price for scenario 60 has been also explored in this work. Results are shown in
Figure 8, where the dashed lines for both scenarios 60-ONCE* and 60-FULL-2* represent the total cost if the uranium average cost between 2014 and the EOC is fixed as the historical highest cost of 230 €/kgU
3O
8. This increase in the uranium cost leads to a significantly larger cost of the scenario, from ~11,200 M€ to ~14,500 M€. On the other hand, scenarios with reprocessing do not have such significant dependence on the uranium cost. For scenario 60-FULL-2, where the extra material is considered as an asset, the total scenario cost is increased in ~1200 M€.
Although doubling the average uranium price could be excessive, a linear (not proportional) dependence has been detected for the cost of each fuel cycle scenario vs. the unit cost of natural uranium (because the total mass of natU is fixed for each scenario), so the results of the scenario cost can be interpolated for any average uranium price.
5. Conclusions
The once-through cycle and some scenarios with reprocessing were assessed and analyzed for a representative medium sized nuclear fuel cycle (with the inventories obtained for the Spanish fleet), considering 40 years and 60 years of reactor operation lifetime. The work was performed using the TR_EVOL module by means of an analysis in resource and economic terms for each evaluated scenario, with the aim of finding the most important variables for the implementation of reprocessing. The study was limited to the present reactors of the Spanish fleet (considering the energy produced, number of units, and expected decommissioning dates), and the impact on the cycle cost was evaluated from 2014 to the reactor decommissioning date in order to include only the impact of the different strategies applied beyond that year in the results.
Results show that none of these scenarios are able to consume all the Pu generated in the fuel cycle scenario. The reduction in the Pu amount is significant for scenarios 60, from ~93 t of Pu found in the spent fuel for Scenario 60-ONCE down to 44 t found in Scenario 60-PART (~50% reduction). In Scenarios 40, the reduction in the Pu amount is smaller, from ~68 t of Pu (in scenario 40-ONCE) to ~51 t of Pu.
Additionally, scenarios 60 show a practical limitation because there is a period when the Pu for MOX fuel fabrication coming from the reprocessing of UO2-SF is not available. Around 32.4 t of Pu on loan are needed to avoid this limitation. In this work, it is assumed that this Pu amount is borrowed from an external supplier and given back at EOC. This is the consequence of the hypothesis that the technology to reprocess the UO2-R-SF and the MOX-SF (other sources of Pu that could provide the Pu demands on time) is only available at EOC.
From the point of view of economics, this work has verified that for medium sized fuel cycle scenarios, the parameters with largest impact for the cycle cost variability (after the reactor infrastructure investment) are the reprocessing cost for typical unit costs and the natural uranium cost and the reprocessing cost for excessive unit costs. The uncertainty in the reprocessing cost induces significant changes in the scenario cost (costs seem to be larger for scenarios with reprocessing).
The fixed costs provide non-proportional elements that reduce the possible savings given by advanced options like reprocessing. This is the case, for instance, in the cost of the final disposal. Results show that scenarios with reprocessing can significantly reduce the gallery length of the final disposal where a full reprocessing strategy is applied. In fact, a reduction factor of 4 and 3 for scenarios 40 and 60 respectively is achieved. Actually, the gallery length reduction in scenarios with full reprocessing only leads to a reduction of 25% of the total FD cost for both scenarios 40 and 60. In addition, for partial reprocessing strategies this reduction is not significant because the gallery length reduction for UO2-SF is compensated with the further MOX-SF disposal.
The potential benefit of valuing the surplus Pu and RepU is larger when these materials are used by the same country or region within the reprocessing strategy, since it provides new fuel and an advantageous waste management strategy. Additionally, the potential benefit or drawback of reprocessing is linked to costs and availability of enriched uranium fuel produced from natural U. For instance, for scenario 60-ONCE, an increase in the natural U price up to the historical maximum (130% increase) provides the significant increase of ~30% in the total scenario cost from 2014.
No comparison between scenarios with different reactor operation times has been made because the impact on the total cost depends mainly on the reactors investments and the re-investment costs [
10,
12] to obtain the additional regulator license for operation, which were not included in this study. Other considerations including social, political, environmental, and security concerns related to the fuel cycle scenario (not taken into consideration in this work), might be of high importance in order to choose a reprocessing strategy for the medium-sized nuclear fuel cycle.
Finally, we want to stress that the use of advanced reactors and fuel cycle options, not included here, could significantly change the results of the study [
10,
19].


