
Numerical Study of Pressure Fluctuation in a Gas- Liquid Two-Phase Mixed-Flow Pump


1
School of Mechanical Engineering, Beijing Institute of Technology, Beijing 100081, China
2
State Key Laboratory of Hydroscience and Engineering, Department of Thermal Engineering, Tsinghua University, Beijing 100084, China
*
Author to whom correspondence should be addressed.
Energies 2017, 10(5), 634; https://doi.org/10.3390/en10050634
Submission received: 29 March 2017
/
Revised: 27 April 2017
/
Accepted: 2 May 2017
/
Published: 5 May 2017
Abstract
:To explore the pressure fluctuation characteristics in a mixed-flow pump handling a gas-liquid two-phase flow, an unsteady simulation was carried out with ANSYS CFX for the whole flow passage when the inlet gas void fraction (IGVF) was 0%, 5%, and 10%, respectively. Under pure water conditions (IGVF = 0%), the reliability of the simulation was verified by comparing with the experiment in both aspects of external characteristics and fluctuation. Through the implementation of the fast Fourier transform (FFT) algorithm, the characteristics of the pressure fluctuation in the impeller and the guide vane were obtained at different IGVF conditions. The results demonstrate that pressure fluctuations exist under different IGVF conditions due to the rotor-stator interaction and the gas-liquid phase interaction, and the intensity of the fluctuation is firstly enhanced, and then weakened, along the streamwise direction with the maximum located near the impeller outlet. The relationship between the gas content and the pressure fluctuation was analyzed, and it is shown that the regional pressure fluctuation will be intensified only if the gas content therein reaches a certain level and the local phase interaction is strong. In addition, the pressure fluctuation in both the rotor-stator interaction region and the guide vane may be effectively inhibited under small IGVF conditions.
1. Introduction
The gas-liquid two-phase transport exists widely in petroleum, chemical engineering, food, urban water supply, nuclear industry, etc. Moreover, the energy performance of multiphase pumps handling gas-liquid two-phase flows will have a significant impact on the economic benefits of the relevant industries [1,2,3,4]. Compared with the single-phase pumps, since the gas-liquid two-phase transport process is often accompanied with the polymerization and division of bubbles, the pulsation of phase content, the separation and intermixing of the two phases, the flow in the multiphase pumps will be more complicated. In turn, the complex two-phase flow phenomenon will inevitably affect the pressure fluctuation in the pump.
In recent years, research has been conducted on the pressure fluctuation of the gas-liquid two-phase flow, especially for the two-phase flow in the pipeline. The pressure fluctuation signal is commonly used to identify the regime of the two-phase flow [5,6]. For instance, in order to describe the relationship between the flow pattern and the pressure, Hanafizadeh et al. [7] drew a flow regime map by measuring the pressure fluctuation signal of the gas-liquid two-phase flow in a vertical pipe. In practical applications, the frequency of the slug flow is closely related to the structural damage, the corrosion rate, and the coating protection of the pipeline [8,9], therefore, it is also very important to predict the formation mechanism of the slug flow, and further understand its characteristics by measuring the pressure fluctuation signal [10,11,12].
However, studies on gas-liquid multiphase pumps are mainly concentrated on energy performance and flow instability. In the first aspect, a NACA65 axial flow pump handling gas-liquid two-phase flow was simulated by Tremante et al. [13]. It was found that when the attack angle is large, the air mass extends from the blade leading edge to the entire pressure side as the attack angle increases, and the stratified flow is generated in the impeller passage. Trevisan and Prado [14] explored the viscous effect on the two-phase flow pattern and the hydraulic performance of an electrical submersible pump, and found that the increase in equivalent-viscosity will cause the decrease in overall energy performance of the pump. In the analysis of Lu et al., [15] an Eulerian model was performed for the gas-liquid two-phase bubbly flow in a centrifugal pump and it showed that the gas content is high near the impeller shroud. Furthermore, a serious phase separation phenomenon will occur therein when the inlet gas void fraction is 14%. By observing the movement of the bubbles in a pump with high-speed photography technology, Poullikkas [16,17] explored the effect of the gas content on the energy performance of the pump. For flow instability, Yu et al. [18] simulated the internal flow in a gas-liquid two-phase rotodynamic pump and found that, under the condition of high gas content, obvious features of the bubble flow and the wave flow are presented in the leading edge and trailing edge of the impeller passage, respectively. Through the simulation of a multiphase rotodynamic pump under the condition of high gas content, Huang et al. [19] obtained that the static pressure in the gathering area of the liquid phase is generally higher than the gathering area of the gas phase, and the static pressure in the impeller increases gradually along the flow direction.
Usually, the centrifugal and axial types of pumps are used to transport the gas-liquid two-phase flow, thus not much relevant research has been done on mixed-flow pumps. Meanwhile, few studies have been performed on the pressure fluctuation in multiphase pumps. In this study, an unsteady flow simulation was carried out with ANSYS CFX 14.0 (SAS IP, Inc., Pittsburgh, PA, USA) for a mixed-flow pump handling a gas-liquid two-phase flow. Applying the fast Fourier transform (FFT), the characteristic difference of the pressure fluctuation under the conditions of pure liquid flow and gas-liquid two-phase flow with different IGVF was explored to obtain a preliminary understanding of pressure fluctuations in such pumps.
2. Configuration and Mesh of the Gas-Liquid Two-Phase Pump
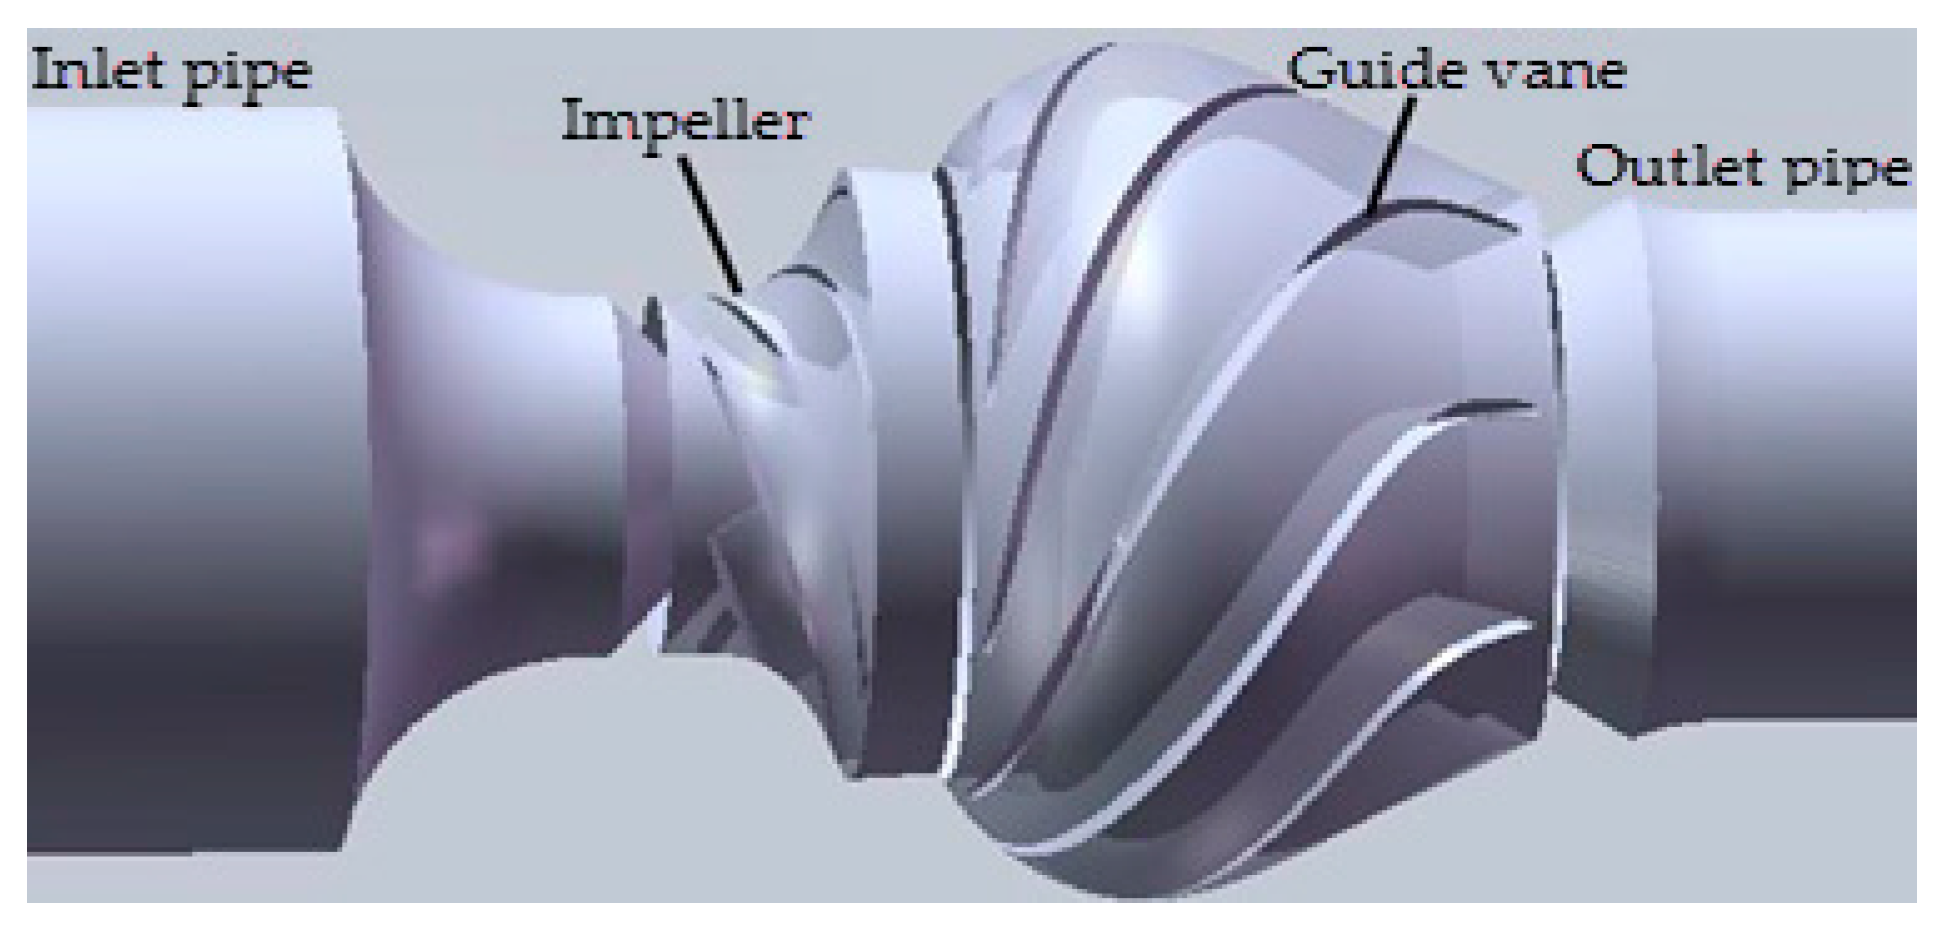
The three-dimensional model of the whole flow passage constructed with UG NX 6.0 (Siemens PLM Inc., Nuremberg, Germany) is shown in Figure 1. It includes four parts: inlet pipe, impeller, guide vane, and outlet pipe. The main parameters of this pump are listed as follows: impeller diameter D is 150 mm, impeller blade number Z1 is 6, guide vane number Z2 is 8, design flow rate Qd is 23.2 kg/s, design speed n is 2000 r/min, design head Hd is 14.6 m, and power P is 5.5 kW. The structured mesh of the computational domain was generated with ICEM CFD 14.0 (SAS IP, Inc., Pittsburgh, PA, USA) and TurboGrid 14.0 (SAS IP, Inc., Pittsburgh, PA, USA), and the mesh of the impeller and guide vane passages is displayed in Figure 2. Through the analysis of mesh independence, the selected mesh number for the whole domain is 3,624,513.
3. Numerical Methods
3.1. Governing Equations
As for the current models applied in the multiphase pumps handling gas-liquid two-phase flow, the two-fluid model has been widely used due to its high computational accuracy [20,21,22], therefore, it is selected as the numerical model in our study. Additionally, the numerical simulation is based on the following hypotheses: (a) the pattern in this multiphase pump is bubbly flow; (b) clear water and air are taken as the continuous phase and dispersed phase, respectively; and (c) the fluid is regarded as the isothermal flow, so there is no need to consider energy equations. The transport equations without mass transfer can be written as follows:
Continuity equation:
Momentum equation:
where, subscript k = l or g denotes the liquid or gas phase; ρk is the density; αk is the volume fraction and αl + αg = 1; p is the pressure; wk is the relative velocity; fk is the mass force relevant to the rotation of impeller; and Mk is the interphase force per unit volume. In the normal running phase of a pump, with the condition of small bubble size or low spin velocity of the bubbles, the Basset effect and the Magnus effect can be neglected [23,24]. In addition, the turbulent dispersion force can also be neglected according to the magnitude analysis by Yu et al. [25]. Therefore, the interphase force herein is associated only with drag, lift, and virtual mass. τ denotes the viscous stress tensor concerning molecular viscosity, as well as turbulence viscosity. Its components are written as:
where, i, j = 1, 2, 3 represent the three directions of the relative coordinate system; μk is the dynamic viscosity; Sij denotes the strain tensor; and represents the turbulent Reynolds stresses caused by turbulent motion, and it can be derived by:
here, the turbulent viscosity μk,t is formulated based on the shear stress transport (SST) k-ω model, a combination of the k-ω model applied in the near-wall region and the k-ε model employed for the mainstream region. This SST k-ω model not only has high accuracy in predicting flow separation under an adverse pressure gradient [26], but also has a certain applicability in the numerical description for the trajectory of the leakage vortex [27]. Here, the turbulent viscosity is computed as follows:
and:
where, α1 and β′ are the model constants (α1 = 5/9, β′ = 0.09); S is the invariant measure of the strain rate; and k and ω are the turbulence kinetic energy and turbulence frequency, respectively.
Additionally, the above descriptions of the governing equations are not only applicable to the gas-liquid two-phase flow, but also suitable for the single phase liquid, which only requires αl = 1.
3.2. Boundary Conditions and Numerical Solutions
At the inlet of the computational domain, the mass flow was specified and the turbulence intensity was set as 5%; at the outlet, the free outflow condition was adopted; at all wall boundaries, a non-slip condition of viscous fluid was used, and the logarithmic wall function approach was applied in the near-wall region. A transient rotor-stator method was adopted for data exchange in the rotor-stator interaction region (namely the impeller/inlet pipe interface and the impeller/guide vane interface), through which the transient effect of the flow can be considered reliably, hence, it can improve the numerical accuracy of flow characteristics between the rotors and stators. To facilitate the convergence of the numerical computation, the unsteady simulation begins with the initial field of steady simulation results. The high resolution was applied in the advection scheme as well as turbulence numeric, and second-order backward Euler method was adopted in the transient scheme. The other unsteady solution settings are listed in Table 1.
3.3. Monitoring Points Settings
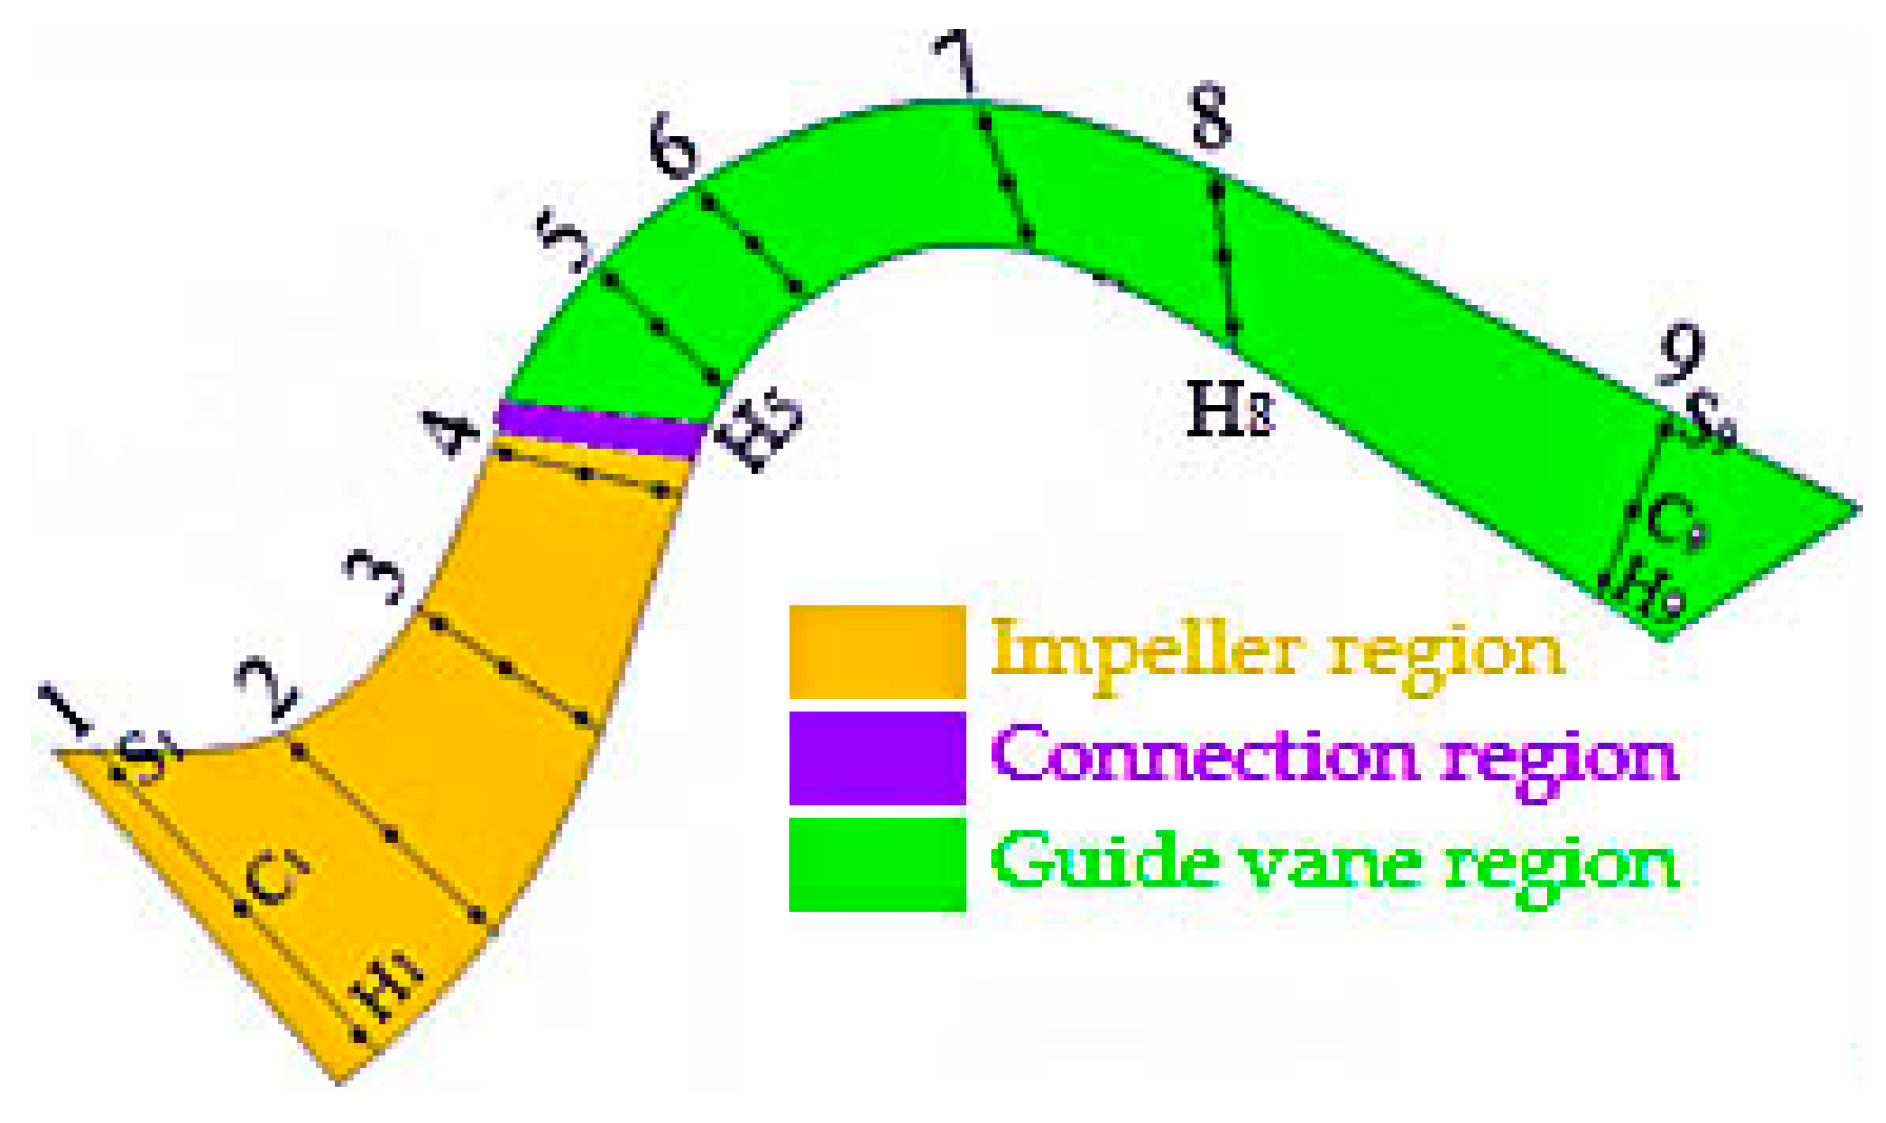
In the unsteady simulation, four and five monitoring sections were set in the impeller and guide vane from the inlet to the outlet, respectively, and denoted as i (where i = 1 to 9), as shown in Figure 3. Si, Ci, and Hi (where i = 1 to 9) stand for the central point on the section from the shroud to hub, respectively. Due to the technical limitations, it is impossible to know the pressure frequency characteristics in the rotating impeller by arranging sensors. Therefore, the sensors in this study were only deployed on the stationary guide vane. Actually, the monitoring points H5–H8 in Figure 3 were the partial trail points on the hub of the guide vane as well.
4. Results and Discussion
4.1. Validation of Energy Performance and Pressure Fluctuation
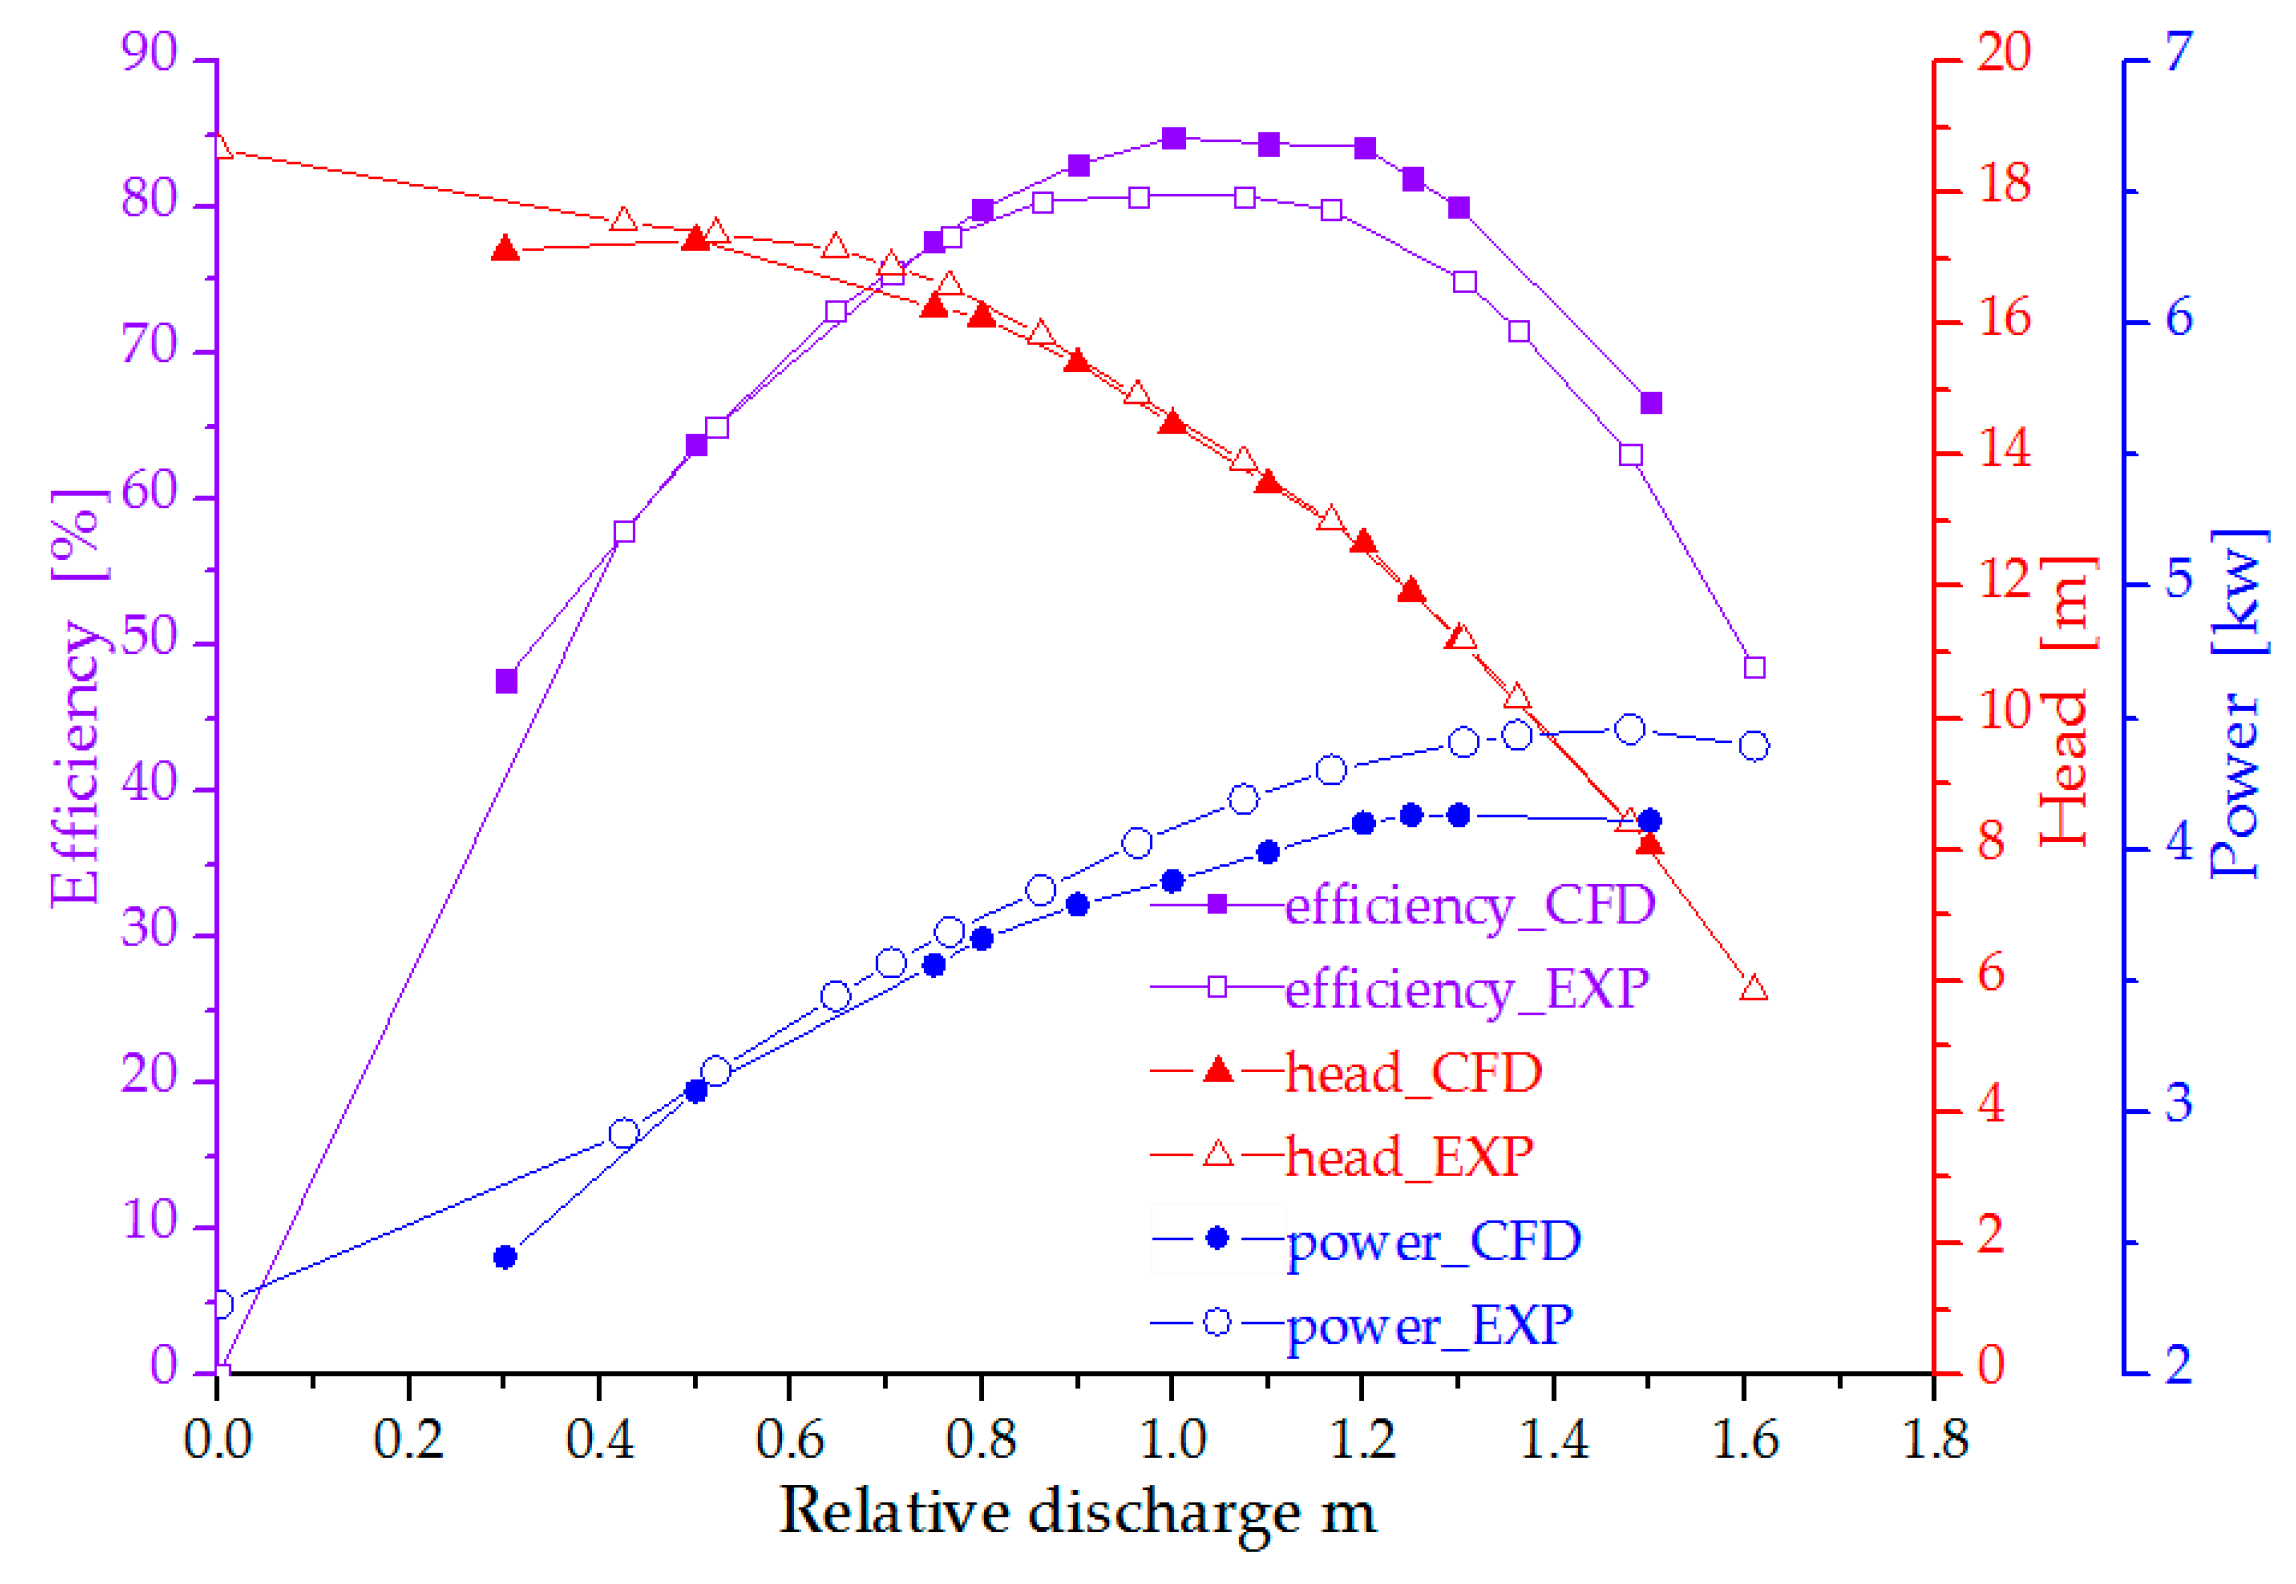
To verify the reliability of the numerical model, under eleven pure water flow rate conditions (IGVF = 0%), the unsteady internal flow of the two-phase pump was simulated when the tip clearance δ is 0.25 mm (0.25 mm is design clearance). The comparison between the simulation and experiment is listed in Figure 4. The efficiency, head, and power curves from the simulation agree well with the experimental results, and the errors of efficiency, head, and power at the design condition are 4.79%, 0.59%, and 4.67%, respectively. Additionally, the frequency domain diagram of points H5–H8 (Figure 3) under pure water conditions is presented in Figure 5. Overall, the frequency domains of pressure fluctuation from the simulation are in good agreement with the experimental ones as well, with a dominant frequency of 6 fn and a second dominant frequency of 12 fn occurring in both conditions. The above analysis illustrates that the numerical method used in our study is reasonable. From Figure 5, it can also be seen that more frequencies with small amplitudes appear in the experiment, this may be due to the vibration of the motor and test environment. Meanwhile, the fluctuation amplitude for dominant frequency of points H5–H8 gradually decreases under both conditions, which illustrates that the pressure fluctuation at the hub of the guide vane decreases along the streamwise direction, as well as with the rotor-stator interaction.
4.2. Pressure Fluctuation in the Impeller Passage at Different IGVF Conditions
The pressure fluctuation coefficients of points C1–C4 on the middle of the sections from the impeller inlet to outlet with different IGVF at the design condition are presented in Table 2. Here, the pressure fluctuation coefficient is defined as:
where, ρ is the fluid density; Hd is the design head under pure water condition; and S is the standard deviation of pressure fluctuation, namely:
where, Pi(t) is the pressure at time t, while is the average pressure.
As shown in Table 2, the pressure fluctuation coefficients at corresponding points C1–C3 increase as IGVF increases. On the one hand, this is because their locations are relatively far away from the rotor-stator interaction region, thus the influence of the rotor-stator interaction is weak; on the other hand, taking into account the rotation effect of impeller, the interaction mode between the gas and liquid is more complicated as IGVF increases [25] and this will lead to the appearance of complex flow patterns and the enlargement of pressure fluctuation. The maximum values of pressure fluctuation coefficients of the points C1–C4 are located near the impeller outlet under different IGVF conditions, which are closely related to the rotor-stator interaction and the complicated gas-liquid flow therein. Meanwhile, the pressure fluctuation coefficients of point C4 under conditions of IGVF = 0%, 10% are 1.43 and 1.40 times the condition of IGVF = 5%, respectively, which indicates that the pressure fluctuation near the impeller outlet may be effectively inhibited under small IGVF conditions.
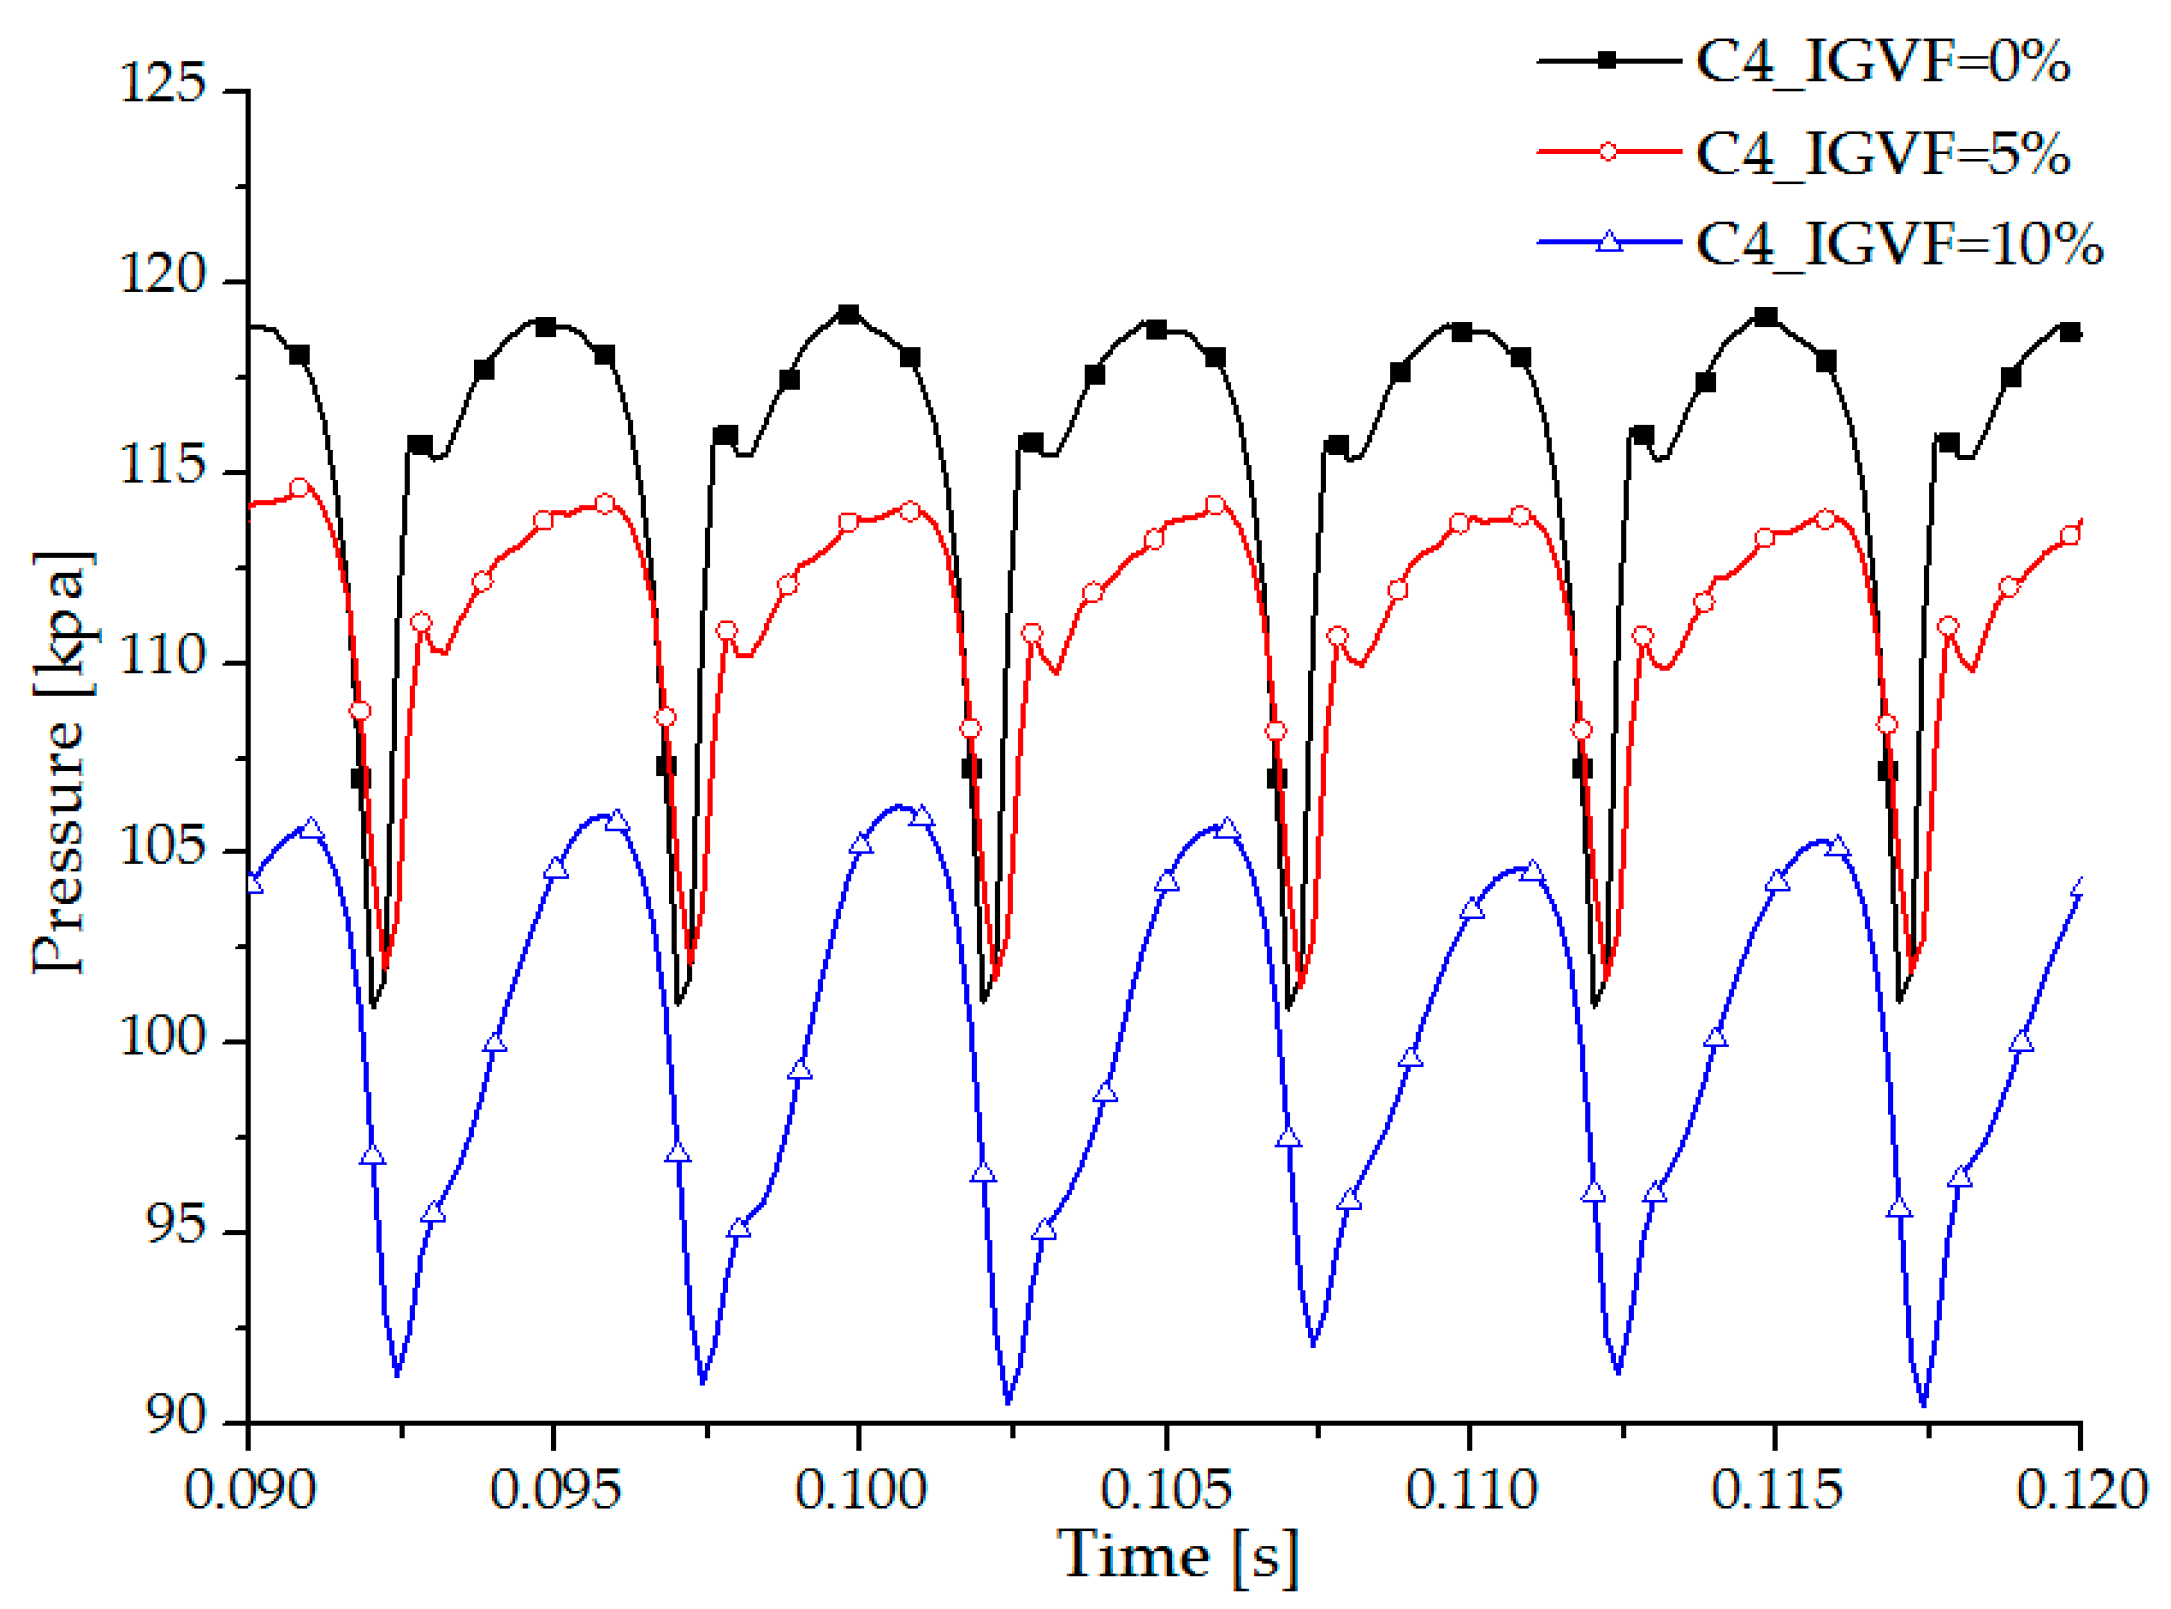
The pressure fluctuation of point C4 at the design condition with different IGVF values in one period is demonstrated in Figure 6. It can be seen that the average pressure of point C4 decreases as IGVF increases. Meanwhile, six peaks and valleys occur in one cycle under different IGVF conditions and this coincides with the number of the impeller blades. Through the FFT, the corresponding frequency domain diagram is shown in Figure 7. The dominant frequency of pressure fluctuation of point C4 is 6 fn under different IGVF conditions (corresponding to Figure 6), and the fluctuation amplitude for dominant frequency at IGVF = 5% is smaller than for the conditions of IGVF = 0%, 10%. There are also N × 6 fn frequencies (where N is a positive integer) at all of these conditions, whichis the result of the periodically-rotating impeller blades (Z1 = 6) [28]. Moreover, there are other frequencies with small amplitudes arising when IGVF is 5% and 10%, which are closely related to the more disordered flow caused by the complex phase interaction between the gas and the liquid.
Figure 8 shows the pressure and liquid phase streamlines distributions of the central hub-to-shroud surface of the impeller passage when IGVF is 0% and 10%. It can be seen that, compared with the condition of IGVF = 0%, a larger range low pressure zone appears in the impeller inlet region at the condition of IGVF = 10%, which manifests that the cavitation performance of this pump is worse under the gas-liquid two-phase condition. Moreover, under the gas-liquid two-phase condition, the flow in the impeller passage is more disordered, and backflow phenomenon occurs in the impeller hub (Figure 8b). This is caused by the rotating effect of the impeller, as the liquid phase is subjected to a larger centrifugal force than for the gas phase, resulting in the gathering of the gas in the impeller hub [29]. In turn, the cumulative gas will block the impeller passage, and considering the effect of the complex interphase forces between the gas and the liquid, the flow in the impeller passage is more disordered. This is also the reason why points C1–C3 have large pressure fluctuations when IGVF = 10%.
4.3. Pressure Fluctuation in the Guide Vane Passage at Different IGVF Conditions
The pressure fluctuation coefficients of points C5–C9 on the middle of the sections from inlet to outlet of the guide vane passage with different IGVF at the design condition are presented in Table 3. Pressure fluctuation coefficients of points C5–C9 decrease gradually from inlet to outlet of the guide vane under different IGVF conditions, which illustrates that the rotor-stator interaction is attenuated. Meanwhile, the pressure fluctuation of corresponding points at IGVF = 5% is generally less than the conditions of IGVF = 0%, 10%, which demonstrates that the pressure fluctuation in the guide vane can also be inhibited under small IGVF conditions.
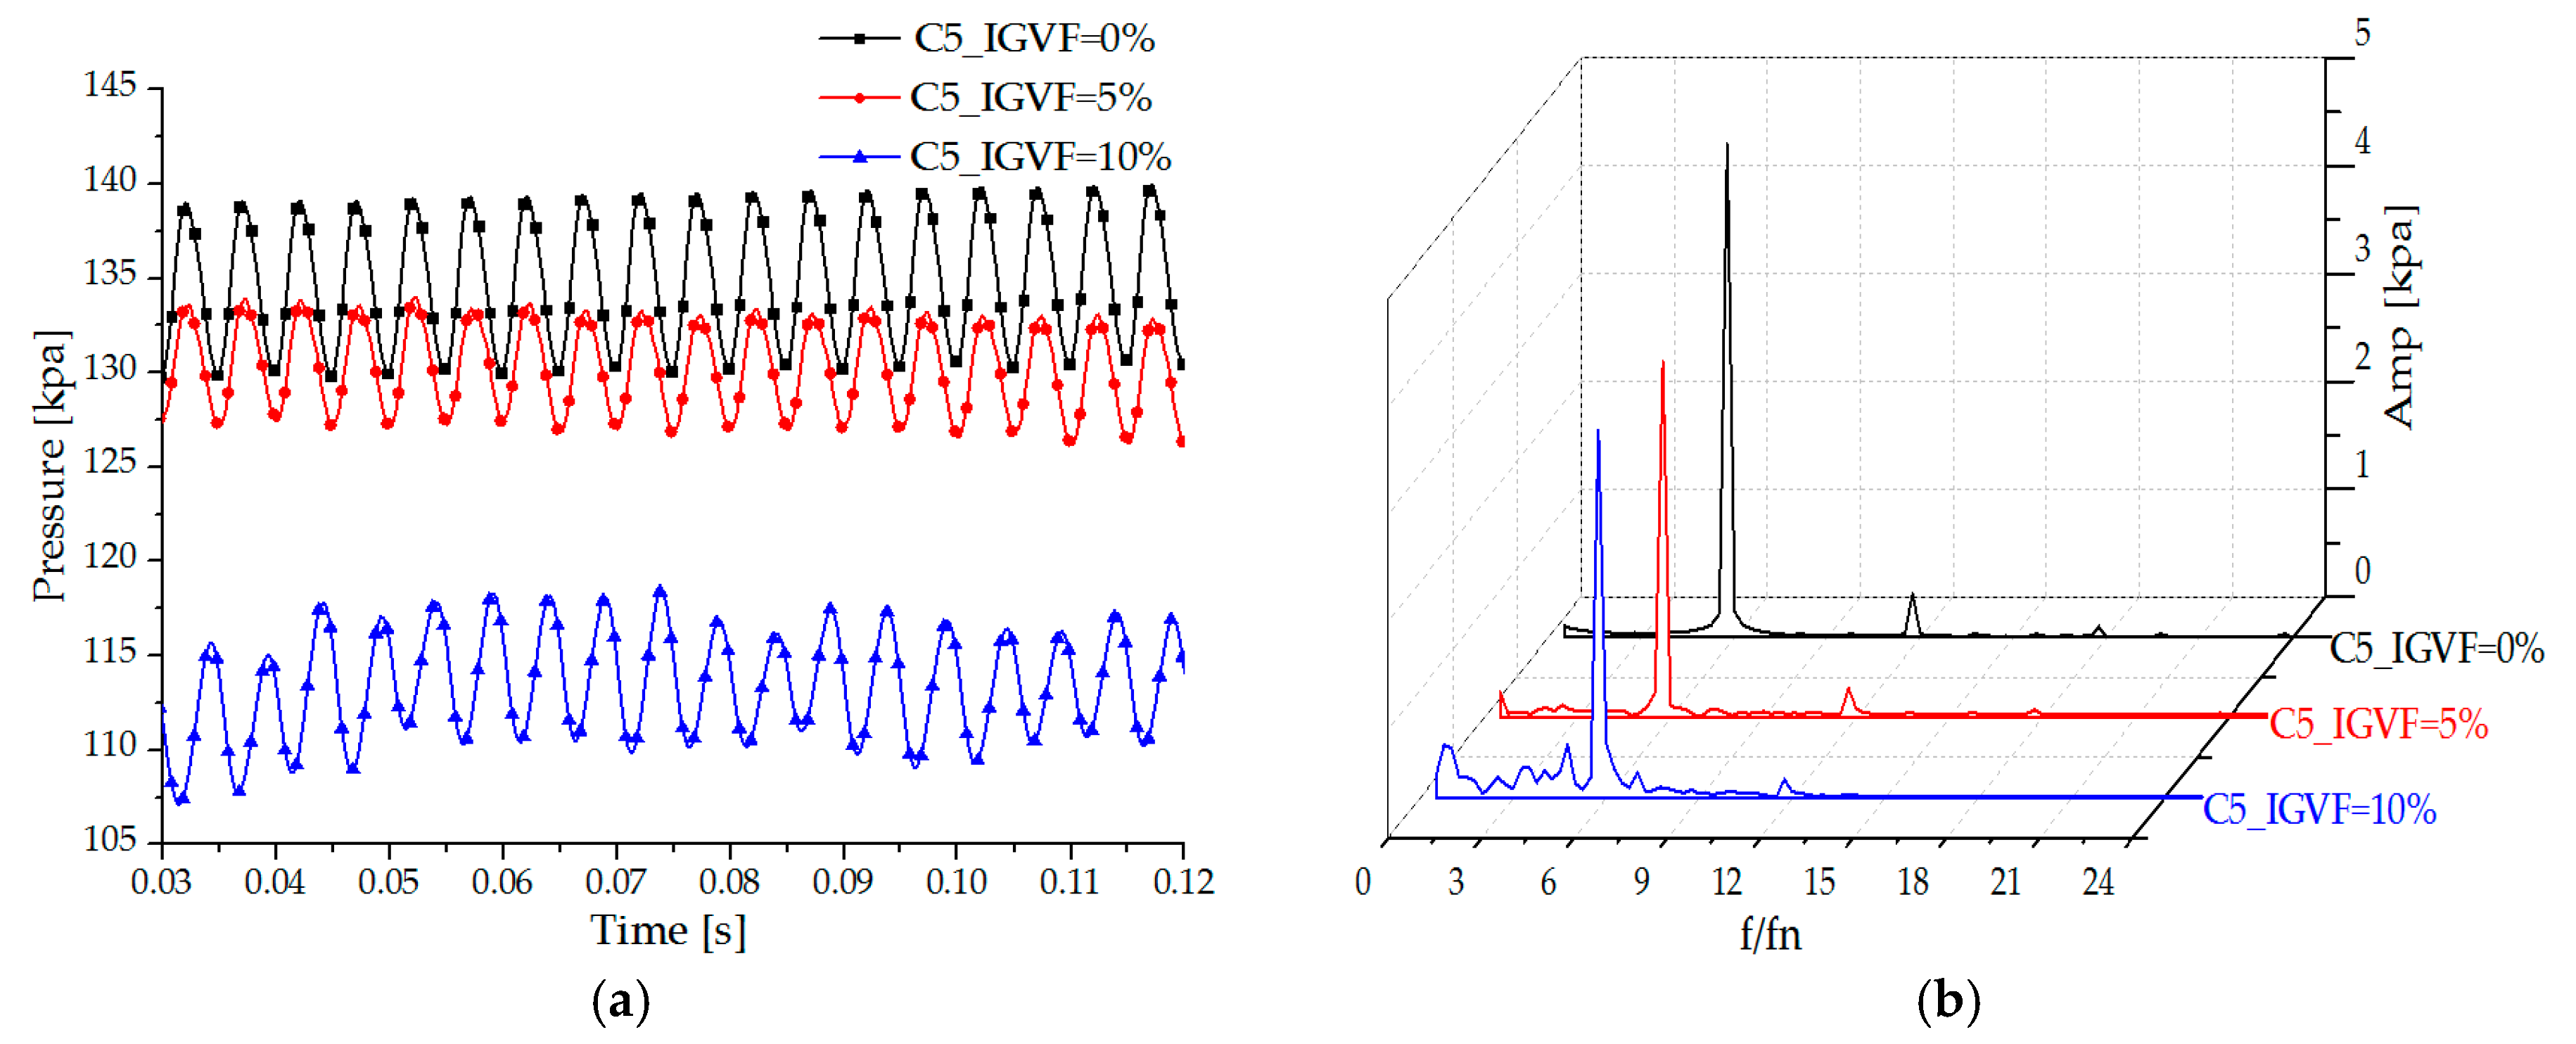
The time domain and frequency domain characteristics of point C5 at different IGVF conditions in three periods are demonstrated in Figure 9 (Q = Qd). With the increase of IGVF, the average pressure of point C5 decreases, while the turbulence of periodicity increases; the amplitude of the dominant frequency under the condition of IGVF = 5% is smaller than for the conditions of IGVF = 0%, 10%. From Figure 9b, it can also be seen that there are other frequencies with small amplitudes at the gas-liquid two-phase conditions.
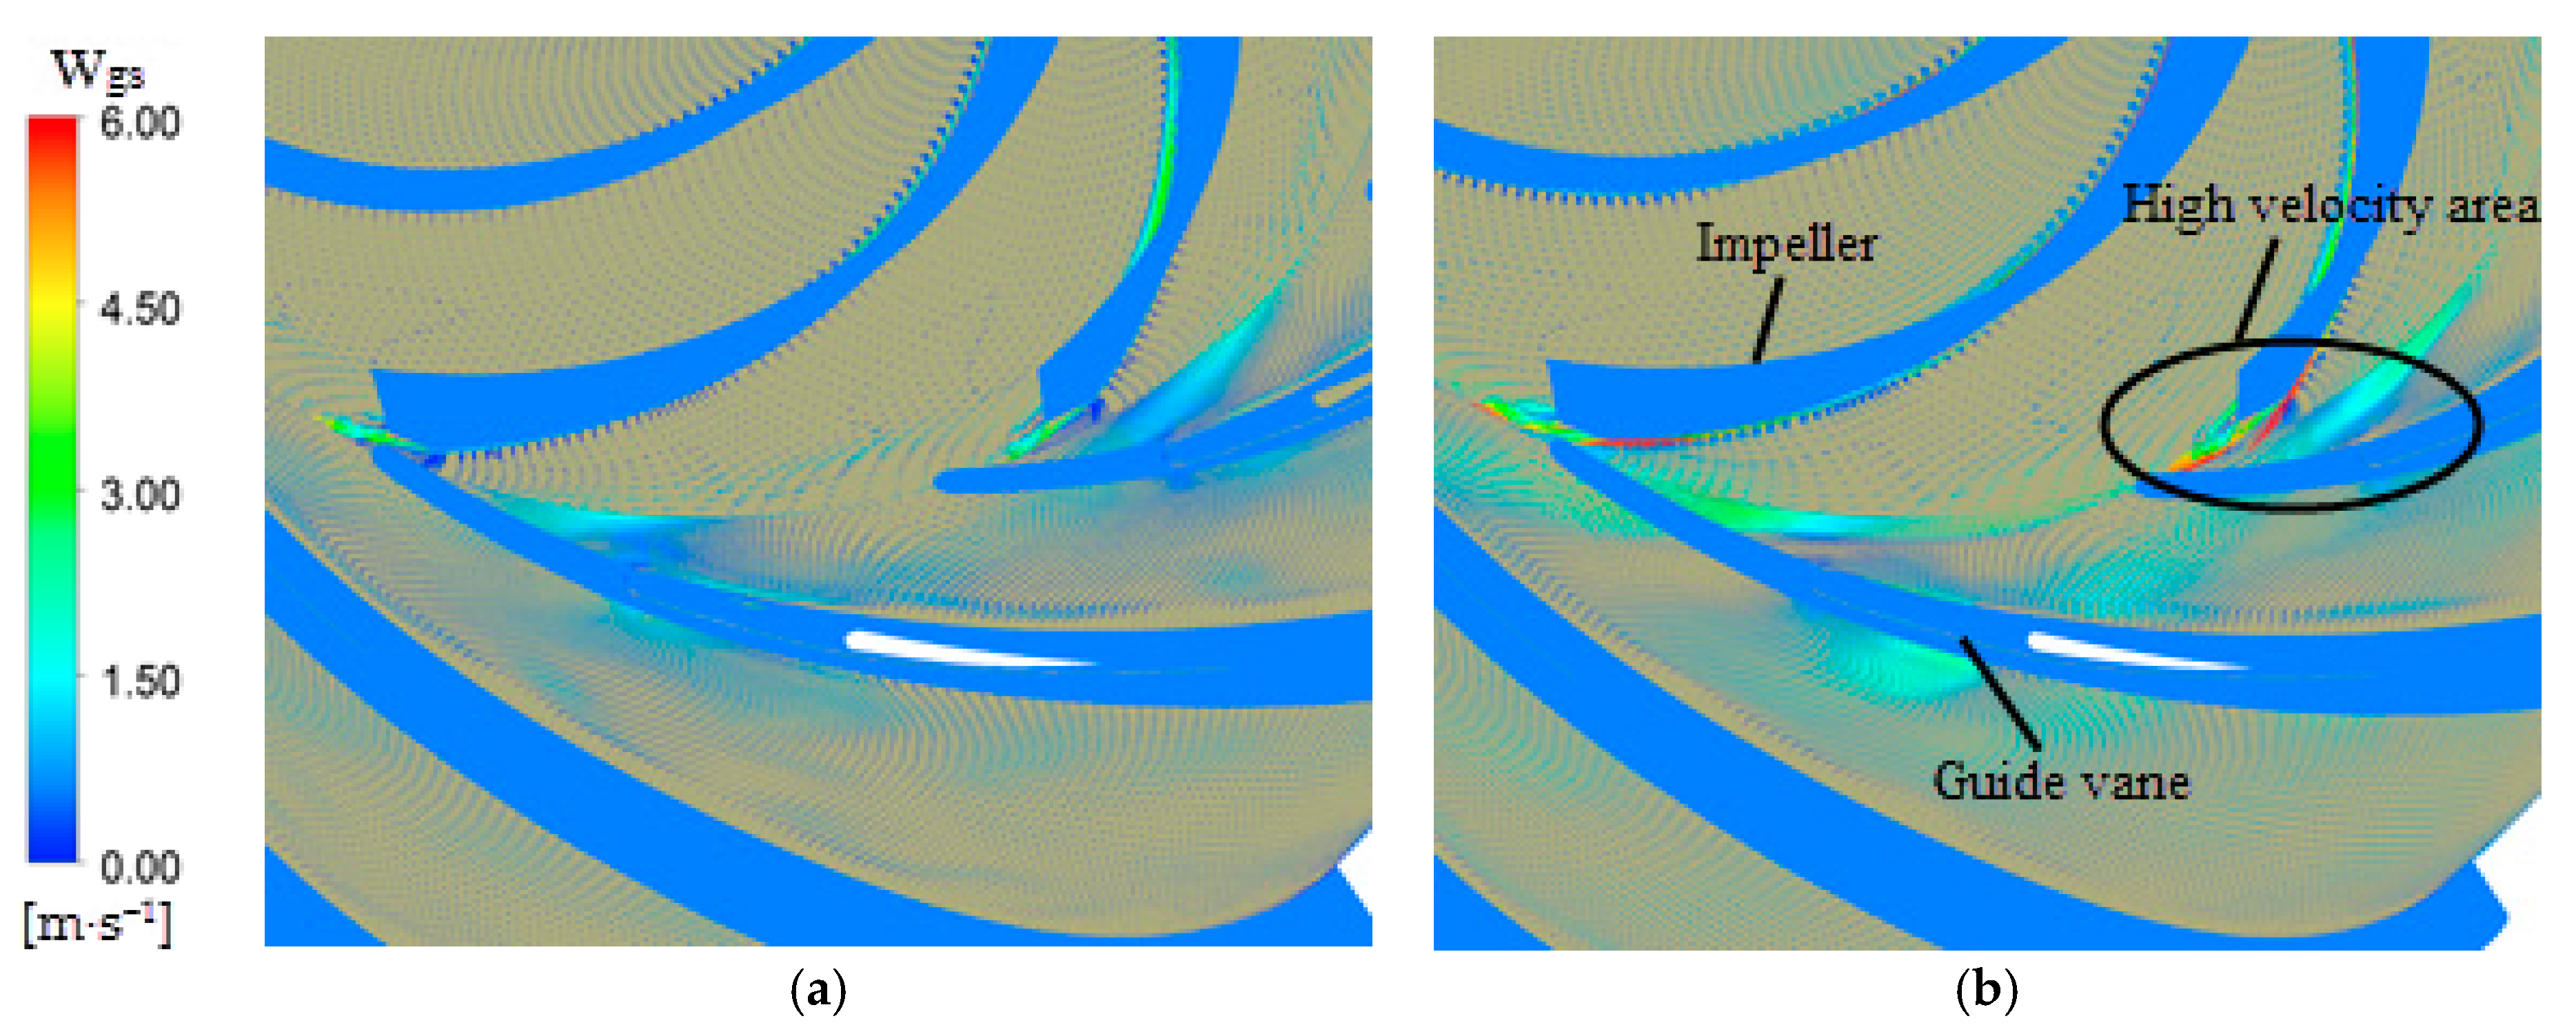
Through the above analysis of pressure fluctuation in both the impeller and guide vane, it can be found that the pressure fluctuation in the rotor-stator region (points C4, C5) is somewhat large at different IGVF conditions. The vector distributions of both the liquid superficial velocity (Wls) and the gas superficial velocity (Wgs) from the impeller outlet region to the guide vane inlet region at the span of 0.5, when t is 0.24 s, are displayed in Figure 10 and Figure 11, respectively. Figure 10a shows that the liquid superfical velocity in the vicinity will increase significantly when the impeller blades are close to the guide vane blades under the condition of IGVF = 0%, this is because there is a larger water discharge under the condition of IGVF = 0% than under the gas-liquid two-phase conditions. Meanwhile, the larger liquid superfical velocity will result in a stronger impact loss in the inlet region of the guide vane passage, this is the reason why the pressure fluctuation in the rotor-stator region (points C4, C5) at this condition is larger. From Figure 11, it can be observed that the gas superficial velocity at condition of IGVF = 10% is larger than for the condition of IGVF = 5%, taking into account the rotating effect of the impeller, this results in larger pressure fluctuation at corresponding points under the condition of IGVF = 10%. Actually, the above analyses are also the reasons that larger pressure fluctuations occur in the guide vane passage under the conditions of IGVF = 0%, 10%.
From the above analysis, it is found that, under the design condition with different IGVF, the fluctuation intensity of points C1–C9 on the middle of the sections is firstly enhanced and then weakened along the streamwise direction with the maximum located near the impeller outlet (point C4). The pressure fluctuation in both the rotor-stator interaction region and the guide vane may be effectively inhibited under small IGVF conditions, and more frequencies with small amplitudes appear under the gas-liquid two-phase conditions than under the pure water condition.
4.4. Relationship between the Gas Content and the Pressure Fluctuation in the Impeller/Guide Vane
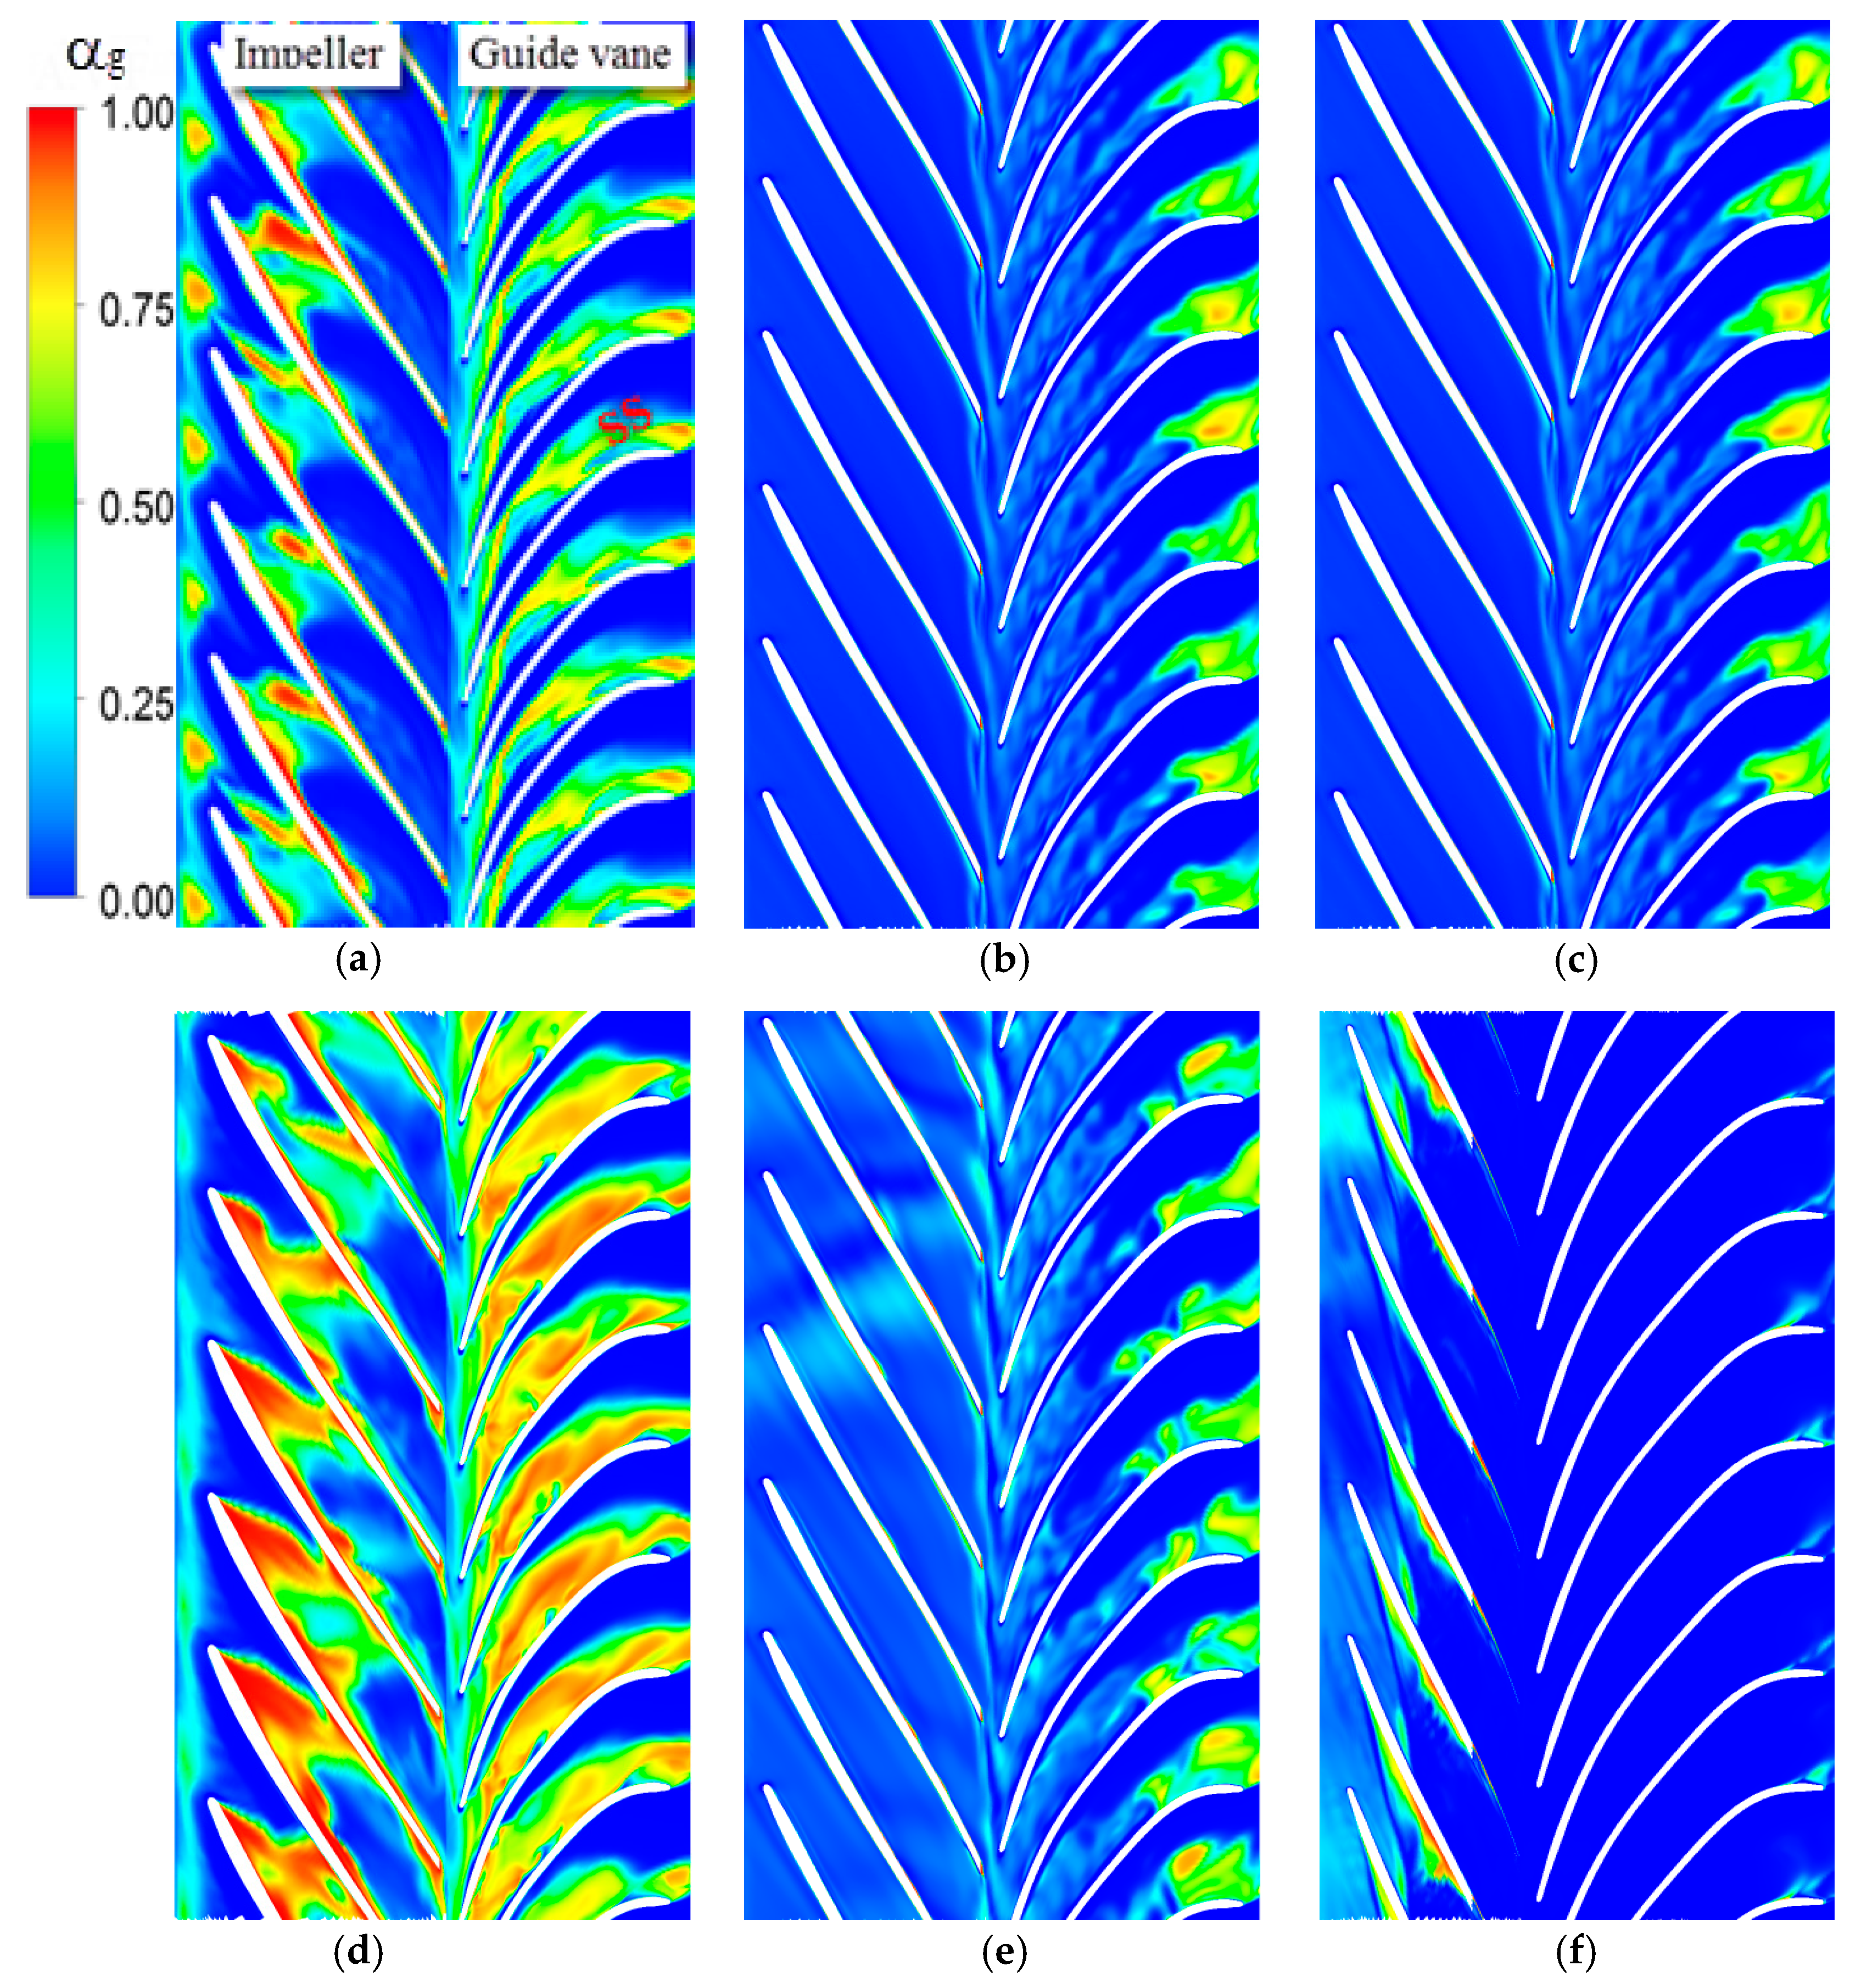
The distribution of the gas content from hub to shroud of both the impeller and guide vane under conditons of IGVF = 5%, 10% is shown in Figure 12. The gas content in the impeller passage is mainly accumulated near the hub in these two conditions (Figure 12a,d). On the one hand, this is caused by the rotating effect of the impeller; on the other hand, the liquid phase with a larger density is subjected to a larger centrifugal force than for the gas phase. These two resons result that the liquid moving to the shroud while the gas gathers in the hub and, hence, the flow in the impeller hub is more disordered (Figure 8b). The gas content decreases from the hub to the shroud of the guide vane and the gas content in the hub accumulates near the back surface (namely the “SS” surface in Figure 12a). This is due to the gas entering guide vane passage is affected by the pressure difference between the working surface and the back surface, and the gas moves to the back surface and gathers therein. Meanwhile, the gas content is also high on the back surface of the guide vane outlet under the conditions of IGVF = 5%, 10% (span = 0.5), while the pressure fluctuation is small therein (point C9). This is because the corresponding area is relatively far away from the rotor-stator interaction region, the rotor-stator interaction and the gas-liquid phase interaction are weak, resulting in a small acceleration existing in the gas phase, and the distribution of the gas content is relatively stable therein. Then, compared with Table 2 and Table 3, the pressure fluctuation in the rotor-stator interaction region (points C4, C5) at the span of 0.5 is far greater than that in the guide vane outlet region (point C9), which is ascribed to the larger gas-liquid phase interaction caused by rotor-stator interaction. According to the above analysis, it is found that, for the flow in the gas-liquid two-phase mixed-flow pump, the regional pressure fluctuation will be intensified only if the gas content therein reaches a certain level and the gas-liquid phase interaction is strong.
5. Conclusions
Through the unsteady numerical calculation, the characteristics of pressure fluctuation in a mixed-flow pump handling a gas-liquid two-phase flow were explored under different IGVF conditions. The results can be summarized as follows:
- (1)
- Influenced by the rotor-stator interaction and the gas-liquid phase interaction, pressure fluctuations occur in three IGVF conditions and the dominant frequency of the pressure fluctuation of point C4 is 6 fn (the impeller blade number is 6). Meanwhile, more frequencies with small amplitudes appear under the gas-liquid two-phase condition the than pure water condition.
- (2)
- At different IGVF conditions, the intensity of the fluctuation is firstly enhanced, and then weakened, along the streamwise direction with the maximum located near the impeller outlet (point C4). Additionally, the pressure fluctuations in both the rotor-stator interaction region and the guide vane may be effectively inhibited under small IGVF conditions.
- (3)
- Due to the rotating effect of the impeller, the liquid phase is subjected to a larger centrifugal force than for the gas phase, as the gas gathers in the hub of both the impeller and the guide vane. The relationship between the gas content and the pressure fluctuation was analyzed, and it is shown that the regional pressure fluctuation will be intensified only if the gas content therein reaches a certain level and the local phase interaction is strong.
Acknowledgments
This work was supported by National Natural Science Foundation of China (51579006, 51679122).
Author Contributions
Baoshan Zhu conceived, designed and performed the experiments; Wenwu Zhang and Zhiyi Yu analyzed the data and wrote the paper.
Conflicts of Interest
The authors declare no conflict of interest.
Nomenclature
| D | Impeller diameter, m |
| Qd | Design flow rate, kg/s |
| n | Rotational speed, r/min |
| P | Shaft power, kW |
| Hd | Head, m |
| Z | Blade number |
| F2 | Blending function in SST-k-ω model |
| p | Static pressure, kpa |
| w | Relative velocity, m/s |
| ns | Specific speed, m3/4.s−3/2 |
| Δt | Time step, s |
| T | Total time, s |
| Qt | Total flow rate, kg/s |
| a1 | Model constant, dimensionless |
| Cp | Pressure coefficient, dimensionless |
| r | Radial coordinate, dimensionless |
| fn | Frequency of the impeller rotation, 1/s |
| k | Turbulent kinetic energy, m2/s2 |
| Wls | Water superficial velocity, m/s |
| Wgs | Air superficial velocity, m/s |
| Amp | Amplitude of the fluctuation, kpa |
| IGVF | Inlet gas void fraction, dimensionless |
| f | Mass force relevant to the rotation of the impeller, m/s2 |
| S | Standard deviation of the fluctuation, dimensionless |
| Mk | Total interphase force per unit volume, N/m3 |
| N | Maximum iteration number per time step, dimensionless |
| Greek symbols | |
| α | Void fraction, dimensionless |
| ρ | Density of phase k, kg/m3 |
| τ | Viscous stress tensor, pa |
| μt | Turbulent viscosity, pa·s |
| ω | Rotational frequency of the impeller, 1/s |
| Subscripts | |
| k | Phase |
| g | Gas phase |
| l | Liquid phase |
References
- Wang, J.; Zha, H.B.; McDonough, J.M.; Zhang, D.H. Analysis and numerical simulation of a novel gas-liquid multiphase scroll pump. Int. J. Heat Mass Tranf. 2015, 91, 27–36. [Google Scholar] [CrossRef]
- Gong, H.; Falcone, G.; Teodoriu, C.; Morrison, G. Comparison of multiphase pumping technologies for subsea and downhole applications. Oil Gas Facil. 2012, 1, 36–46. [Google Scholar]
- Zhang, J.Y.; Cai, S.J.; Li, Y.J.; Zhu, H.W.; Zhang, Y.X. Visualization study of gas–liquid two-phase flow patterns inside a three-stage rotodynamic multiphase pump. Exp. Therm. Fluid Sci. 2016, 70, 125–138. [Google Scholar] [CrossRef]
- Wang, W.W.; Liang, X.; Zhang, M.Z. Measurment of gas-liquid two-phase slug flow with a Venturi meter based on blind source separation. Chin. J. Chem. Eng. 2015, 23, 1447–1452. [Google Scholar] [CrossRef]
- Matsui, G. Automatic identification of flow regimes in vertical two phase flow using differential pressure fluctuations. Nucl. Eng. Des. 1986, 95, 221–231. [Google Scholar] [CrossRef]
- Mosdorf, R.; Górski, G. Detection of two-phase flow patterns using the recurrence network analysis of pressure drop fluctuations. Int. Commun. Heat Mass 2015, 64, 14–20. [Google Scholar] [CrossRef]
- Hanafizadeh, P.; Eshraghi, J.; Taklifi, A. Experimental identification of flow regimes in gas–liquid two phase flow in a vertical pipe. Meccanica 2016, 51, 1771–1782. [Google Scholar] [CrossRef]
- Al-Safran, E. Investigation and prediction of slug frequency in gas/liquid horizontal pipe flow. J. Pet. Sci. Eng. 2009, 69, 143–155. [Google Scholar] [CrossRef]
- Thaker, J.; Banerjee, J. Characterization of two-phase slug flow sub-regimes using flow visualization. J. Pet. Sci. Eng. 2015, 135, 561–576. [Google Scholar] [CrossRef]
- Kabiri-Samani, A.; Borghei, S.M. Pressure loss in a horizontal two-phase slug flow. J. Fluids Eng. 2010, 132, 1–8. [Google Scholar] [CrossRef]
- Lin, P.Y.; Hanratty, T.J. Detection of slug flow from pressure measurements. Int. J. Multiph. Flow 1987, 13, 13–21. [Google Scholar] [CrossRef]
- Dinaryanto, O.; Prayitno, Y.A.K.; Majid, A.I.; Hudaya, A.Z.; Nusirwan, Y.A.; Widyaparaga, A. Experimental investigation on the initiation and flow development of gas-liquid slug two-phase flow in a horizontal pipe. Exp. Therm. Fluid Sci. 2017, 81, 93–108. [Google Scholar] [CrossRef]
- Tremante, A.; Moreno, N.; Rey, R. Numerical turbulent simulation of the two–phase flow (1iquid/gas) through a cascade of an axial pump. ASME J. Fluids Eng. 2002, 124, 371–376. [Google Scholar] [CrossRef]
- Trevisan, F.E.; Prado, M.G. Experimental investigation of the viscous effect on two-phase flow patterns and hydraulic performance of electrical submersible pumps. J. Can. Pet. Technol. 2010, 50, 45–52. [Google Scholar] [CrossRef]
- Lu, J.L.; Xi, G.; Qi, D.T. Numerical study on the gas-liquid two-phase 3-D flow in the impeller of a centrifugal pump. J. Eng. Thermophys. 2003, 24, 237–240. [Google Scholar]
- Poullikkas, A. Two phase flow performance of nuclear reaction coolant pumps. Prog. Nucl. Energy 2000, 36, 123–130. [Google Scholar] [CrossRef]
- Poullikkas, A. Effects of two-phase liquid-gas flow on the performance of nuclear reactor cooling pumps. Prog. Nucl. Energy 2003, 42, 3–10. [Google Scholar] [CrossRef]
- Yu, Z.Y.; Zhu, B.S.; Cao, S.L.; Liu, Y. Effect of virtual mass force on the mixed transport process in a multiphase rotodynamic pump. Adv. Mech. Eng. 2015, 6. [Google Scholar] [CrossRef]
- Huang, S.; Wang, H.J.; Zheng, M.X. Numerical analysis of gas-liquid two-phase flow in multiphase rotodynamic pump and pump performance. J. South China Uni. Technol. (Nat. Sci. Ed.). 2007, 35, 11–16. [Google Scholar]
- Lee, D.; Best, F.R.; McGraw, N. Microgravity two-phase flow regime modeling. In Proceedings of the American Nuclear Society winter meeting, Los Angeles, CA, USA, 15 November 1987. [Google Scholar]
- Benhmidene, A.; Chaouachi, B.; Bourouis, M.; Gansi, S. Numerical prediction of flow patterns in bubble pumps. J. Fluid Eng. 2011, 133, 031302. [Google Scholar] [CrossRef]
- Situ, R.; Hibiki, T.; Brown, R.J. Flow regime transition criteria for two-phase flow at reduced gravity conditions. Int. J. Multiph. Flow 2011, 37, 1165–1177. [Google Scholar] [CrossRef]
- Liu, D.Y. Fluid Dynamics of Two-Phase Systems; Higher Education Press: Beijing, China, 1993; pp. 26–31. [Google Scholar]
- Johnson, R.W. The Handbook of Fluid Dynamics; CRC Press: Boca Raton, FL, USA, 1998; pp. 21–22. [Google Scholar]
- Yu, Z.Y.; Zhu, B.S.; Cao, S.L. Interphase force analysis for air-water bubbly flow in a multiphase rotodynamic pump. Eng. Comput. 2015, 32, 2166–2180. [Google Scholar] [CrossRef]
- Zhang, K.W. Theory of Fluid Machinery, Volume 1; China Machine Press: Beijing, China, 2000; pp. 76–80. [Google Scholar]
- Li, X.J.; Yuan, S.Q.; Pan, Z.Y.; Li, Y.; Liu, W. Dynamic characteristics of rotating stall in mixed flow pump. J Appl. Math. 2013, 8, 1–12. [Google Scholar] [CrossRef]
- Zhang, W.W.; Yu, Z.Y.; Zhu, B.S. Influence of tip clearance on pressure fluctuation in low specific speed mixed-flow pump passage. Energies 2017, 10, 148. [Google Scholar] [CrossRef]
- Yu, Z.Y.; Wang, G.Y.; Cao, S.L. Extended two-fluid model applied to analysis of bubbly flow in multiphase rotodynamic pump impeller. Front. Mech. Eng. 2009, 4, 53–59. [Google Scholar] [CrossRef]
Figure 1.
Configuration of the gas-liquid two-phase pump.

Figure 2.
Structured mesh of the impeller and guide vane passages. (a) Impeller passage; and (b) guide vane passage.
Figure 2.
Structured mesh of the impeller and guide vane passages. (a) Impeller passage; and (b) guide vane passage.
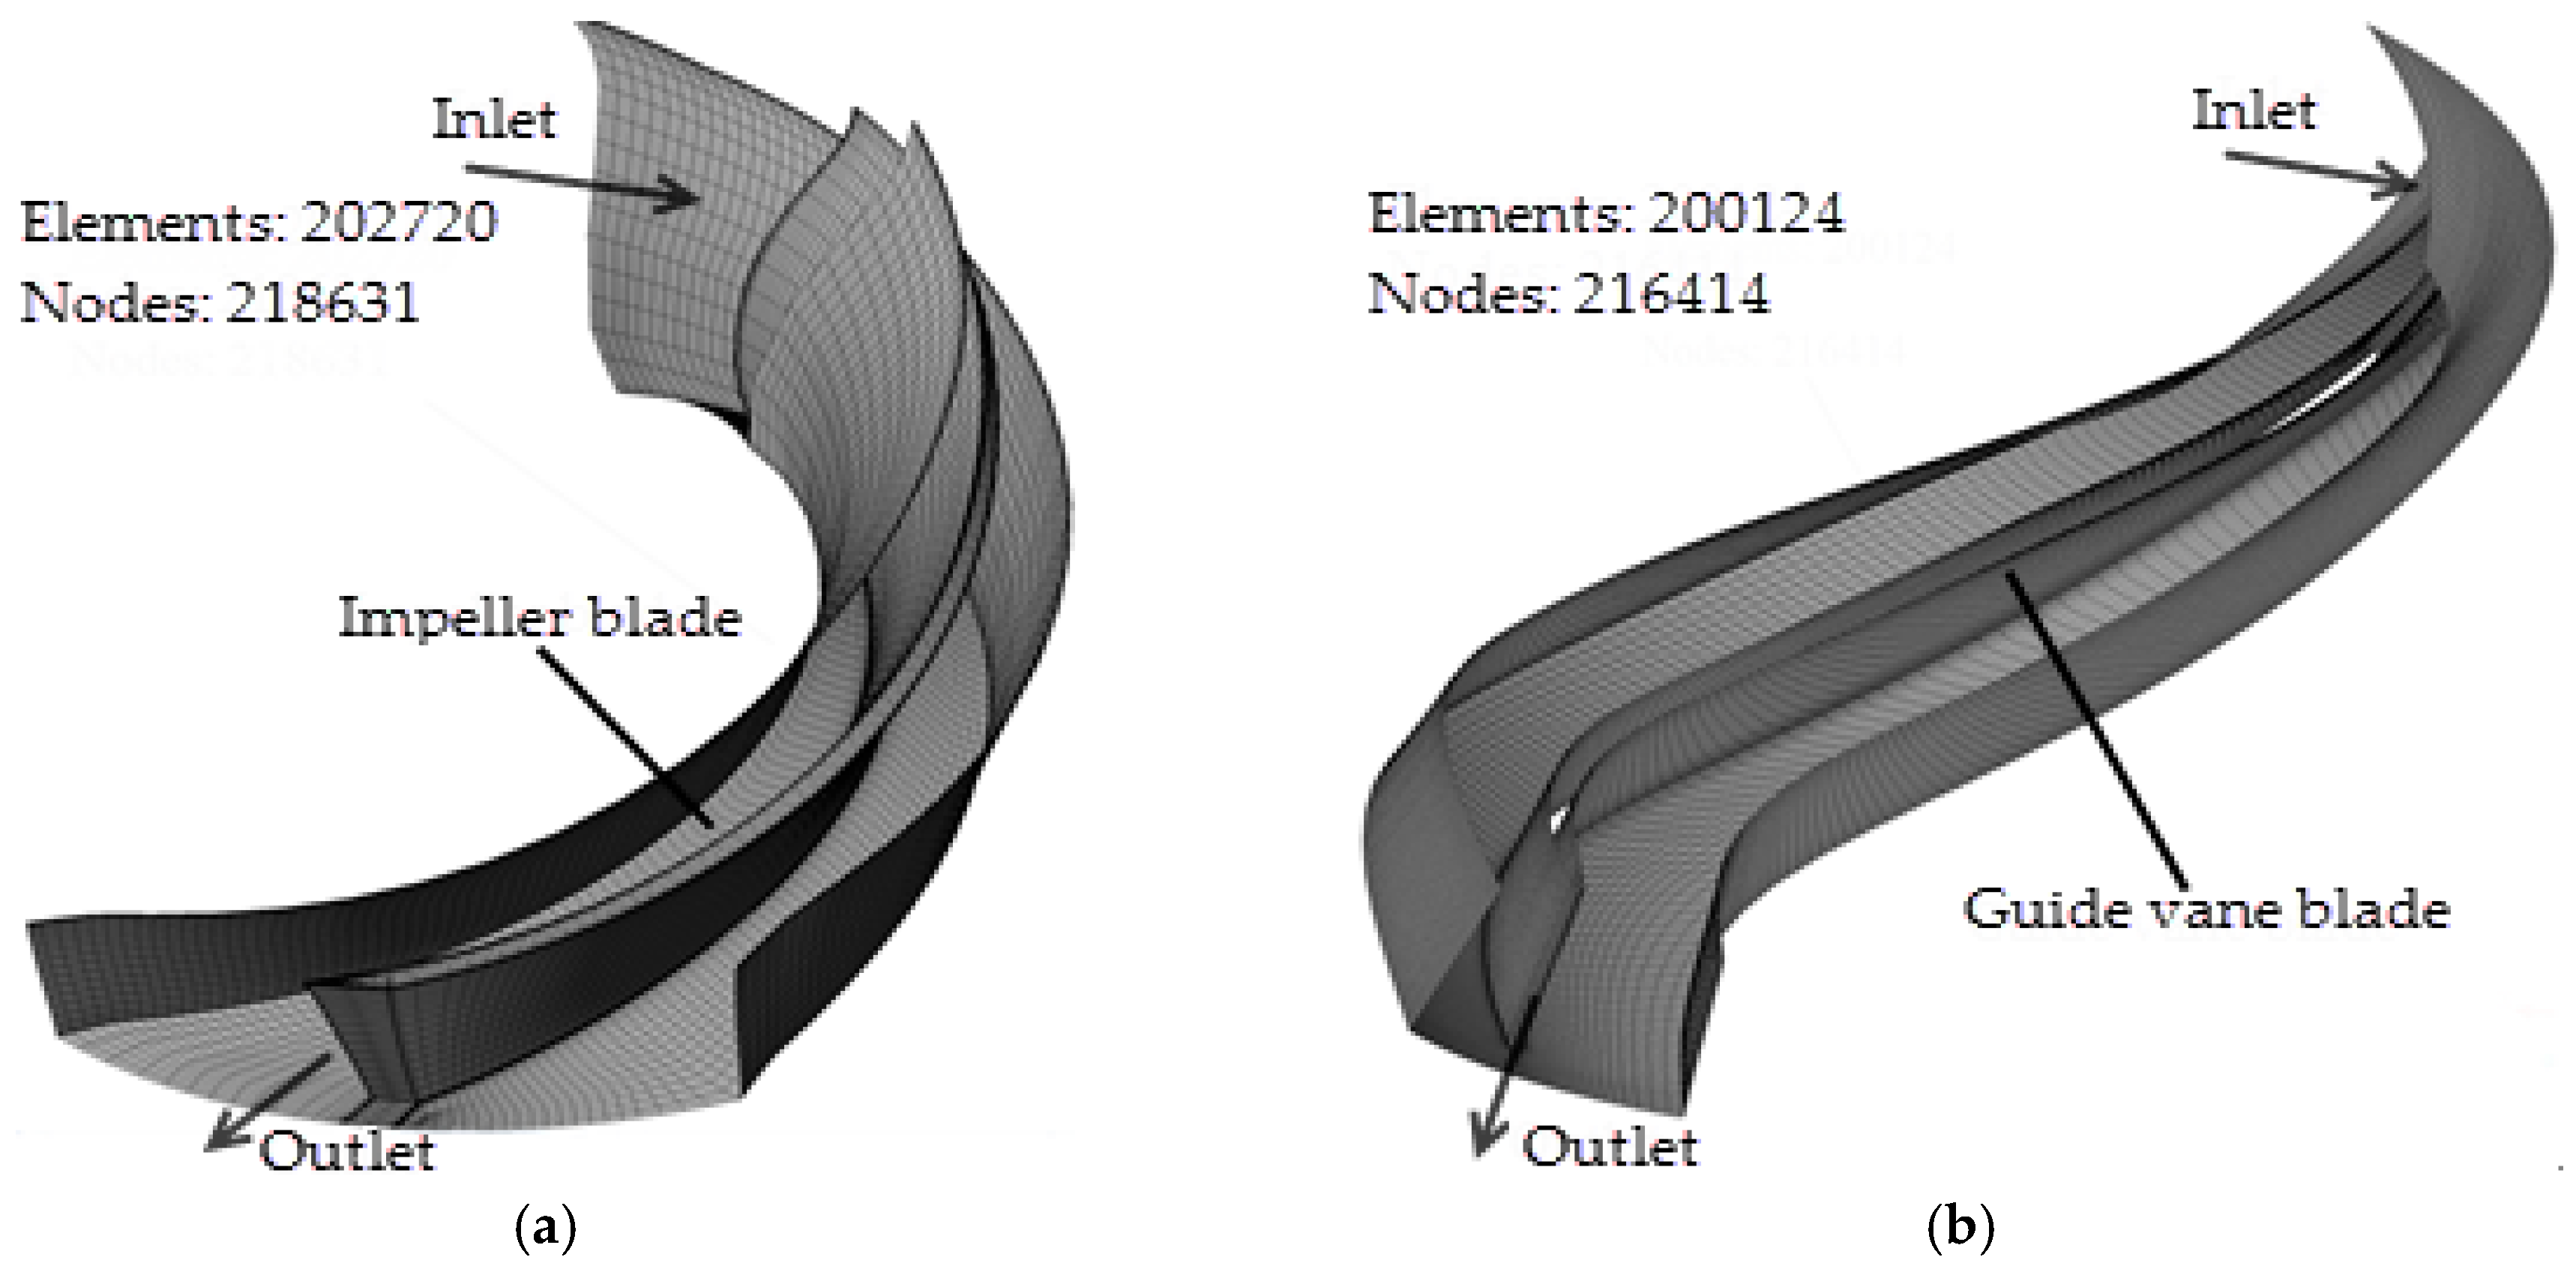
Figure 3.
Location of monitoring points.

Figure 4.
Energy performance curves from the simulation and the experiment under pure water conditions (relative discharge m = Q/Qd). CFD: computational fluid dynamics; EXP: experiment.
Figure 4.
Energy performance curves from the simulation and the experiment under pure water conditions (relative discharge m = Q/Qd). CFD: computational fluid dynamics; EXP: experiment.

Figure 5.
Frequency domain diagram of points H5–H8 at pure water condition (Q = Qd). Amp—the amplitude of pressure fluctuation, kpa; f/fn—the frequency ratio of pressure fluctuation to impeller rotation.
Figure 5.
Frequency domain diagram of points H5–H8 at pure water condition (Q = Qd). Amp—the amplitude of pressure fluctuation, kpa; f/fn—the frequency ratio of pressure fluctuation to impeller rotation.
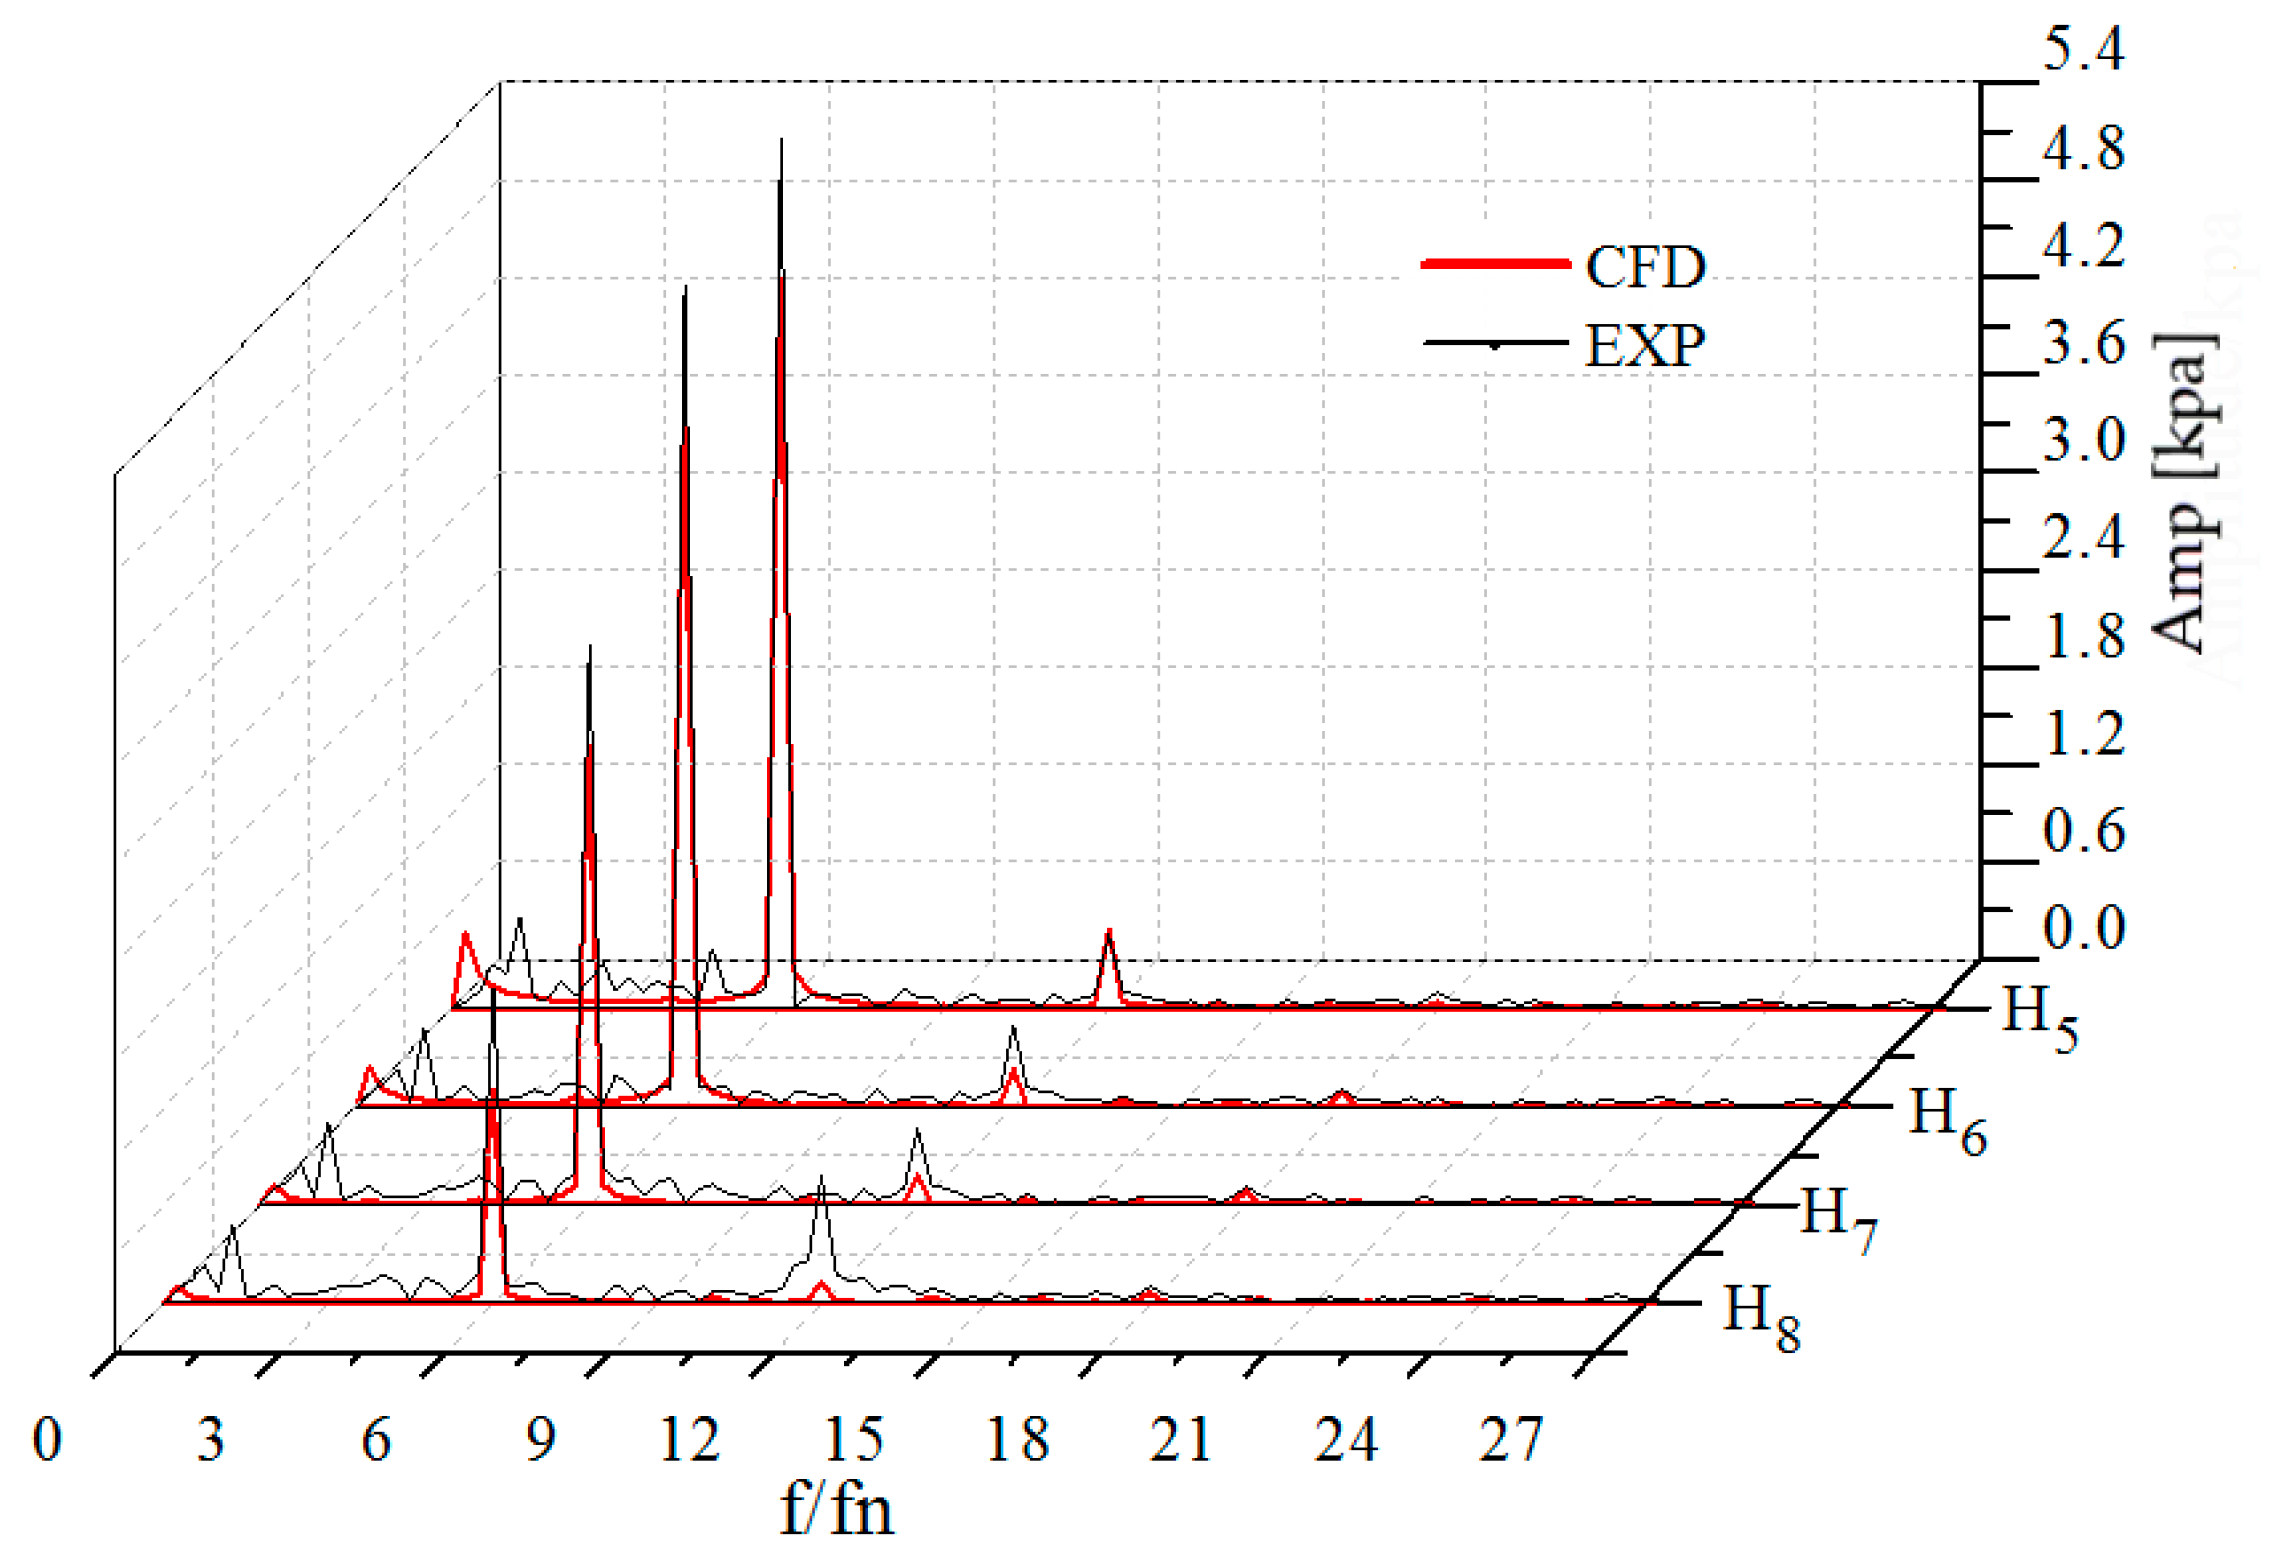
Figure 6.
Time domain characteristics of point C4 under different IGVF conditions (Q = Qd).

Figure 7.
Frequency domain diagram of point C4 under different IGVF conditions (Q = Qd).
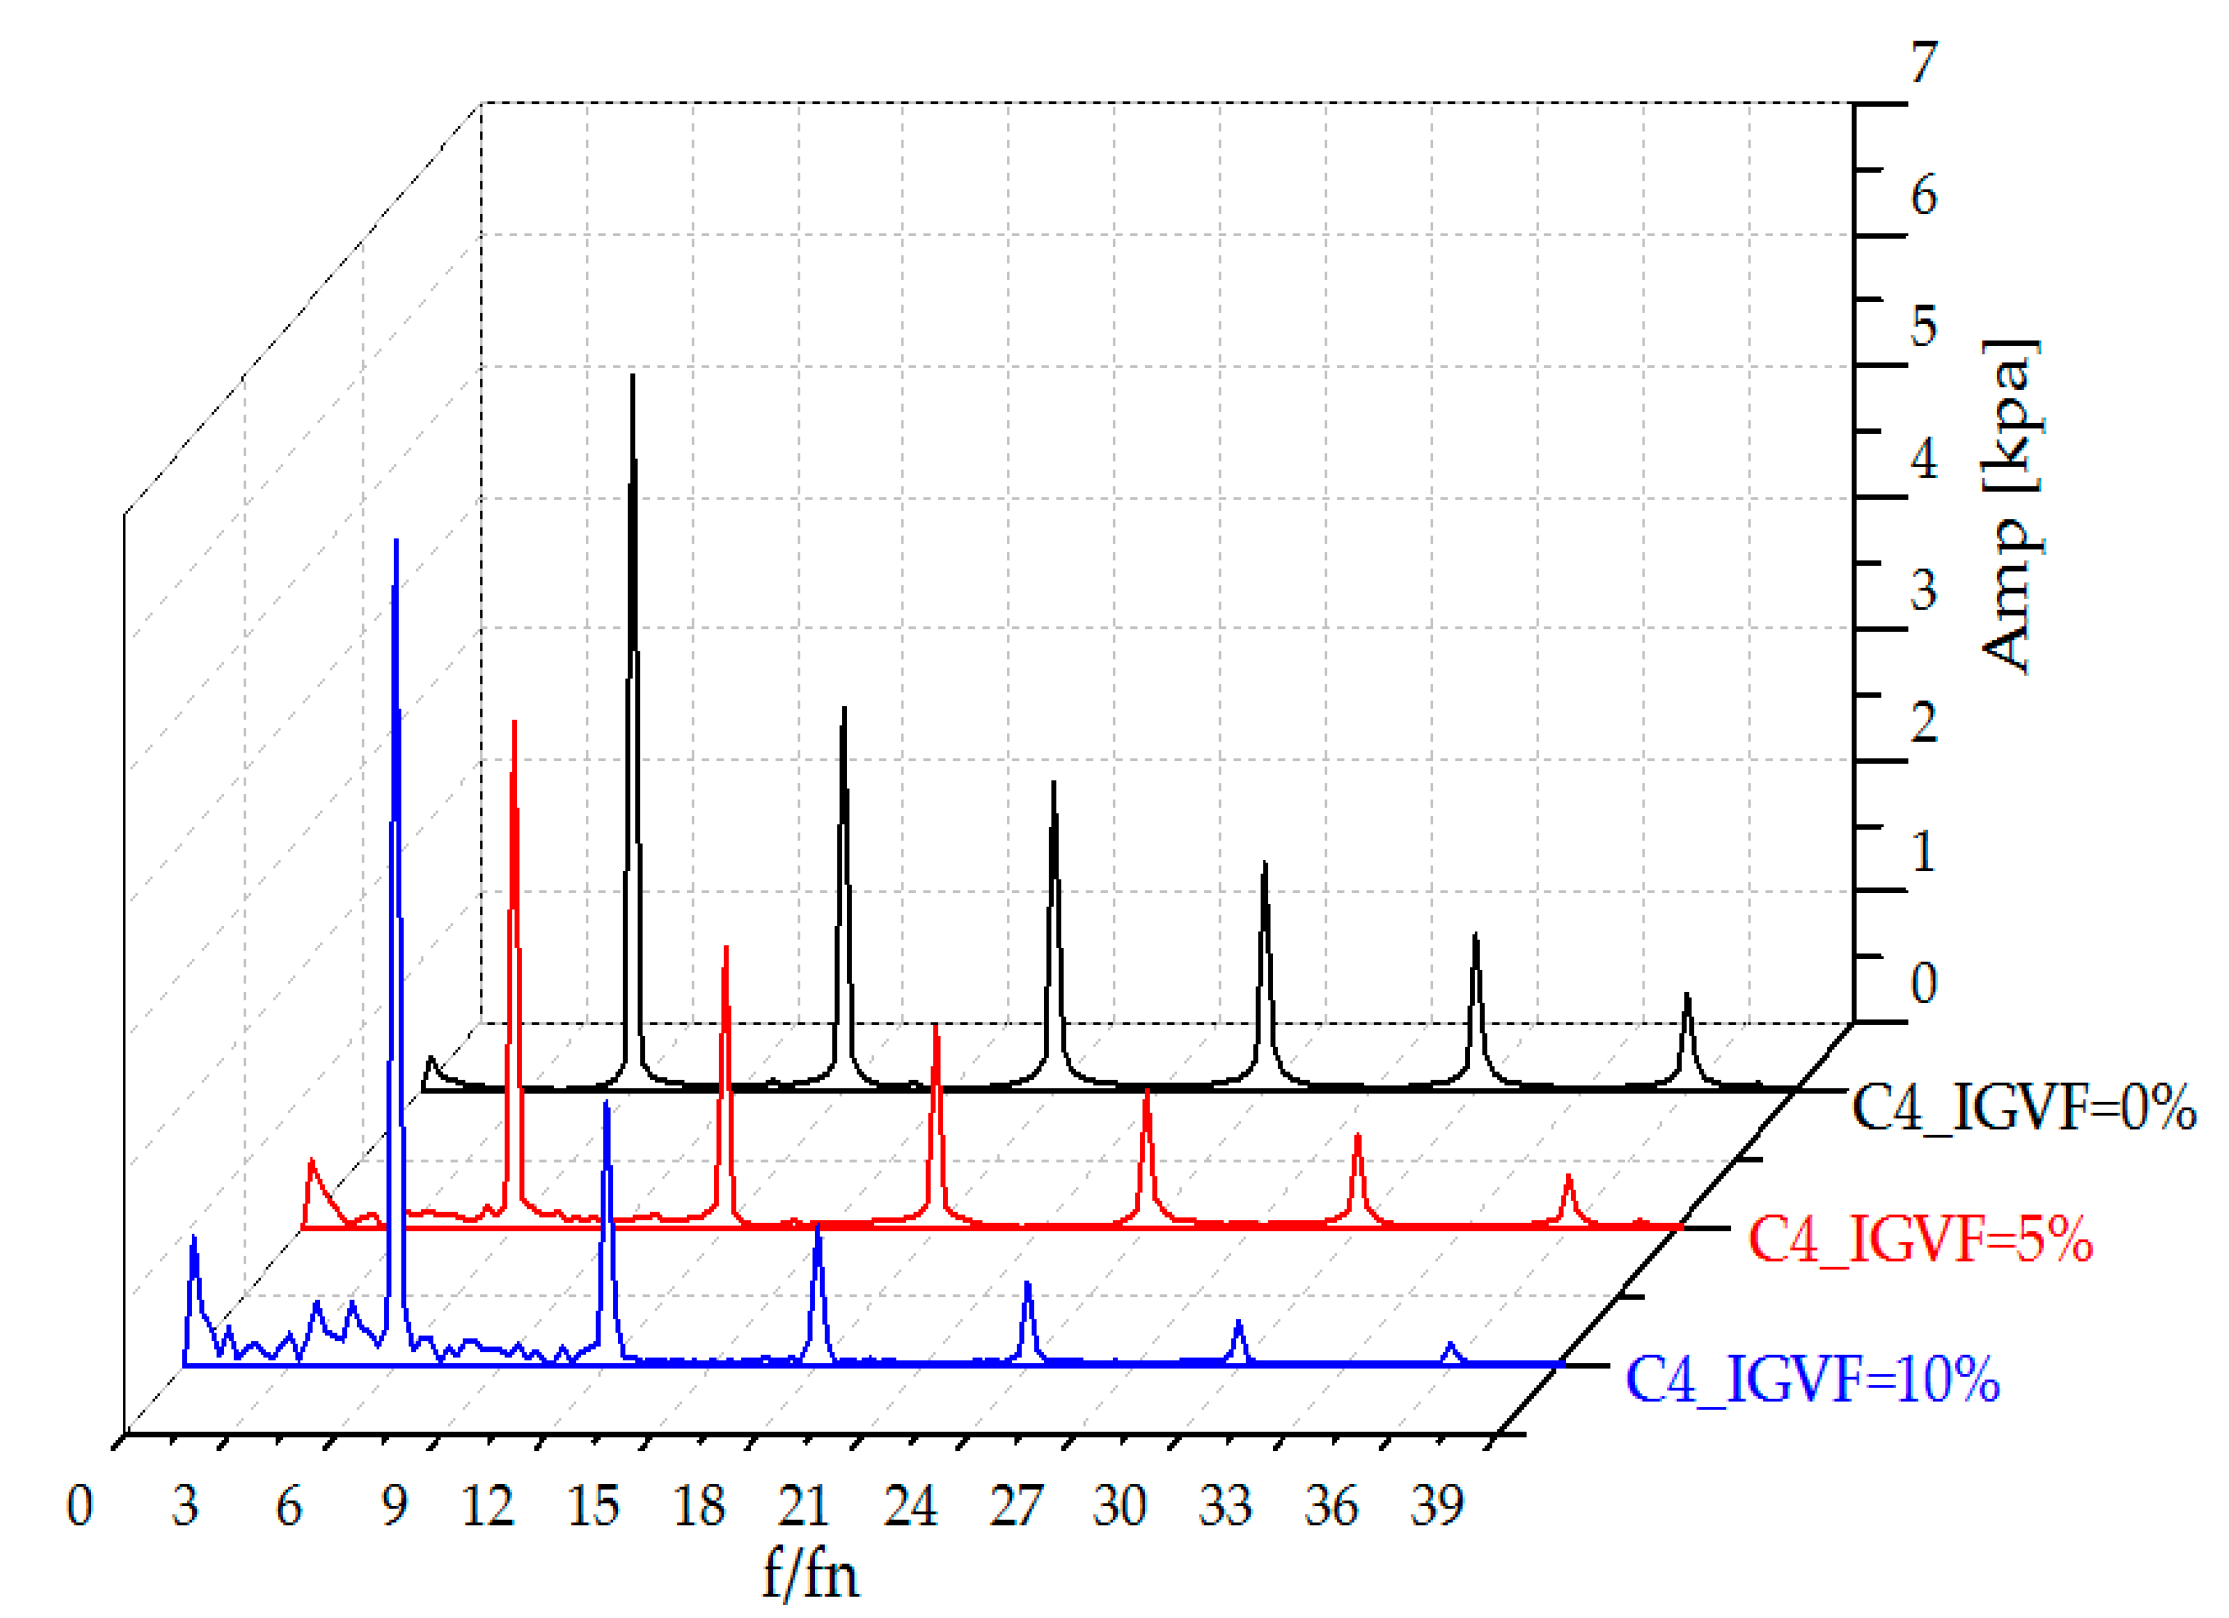
Figure 8.
Pressure and liquid phase streamlines distribution of the central hub-to-shroud surface at different IGVF conditions (Q = Qd). (a) IGVF = 0%; and (b) IGVF = 10%.
Figure 8.
Pressure and liquid phase streamlines distribution of the central hub-to-shroud surface at different IGVF conditions (Q = Qd). (a) IGVF = 0%; and (b) IGVF = 10%.
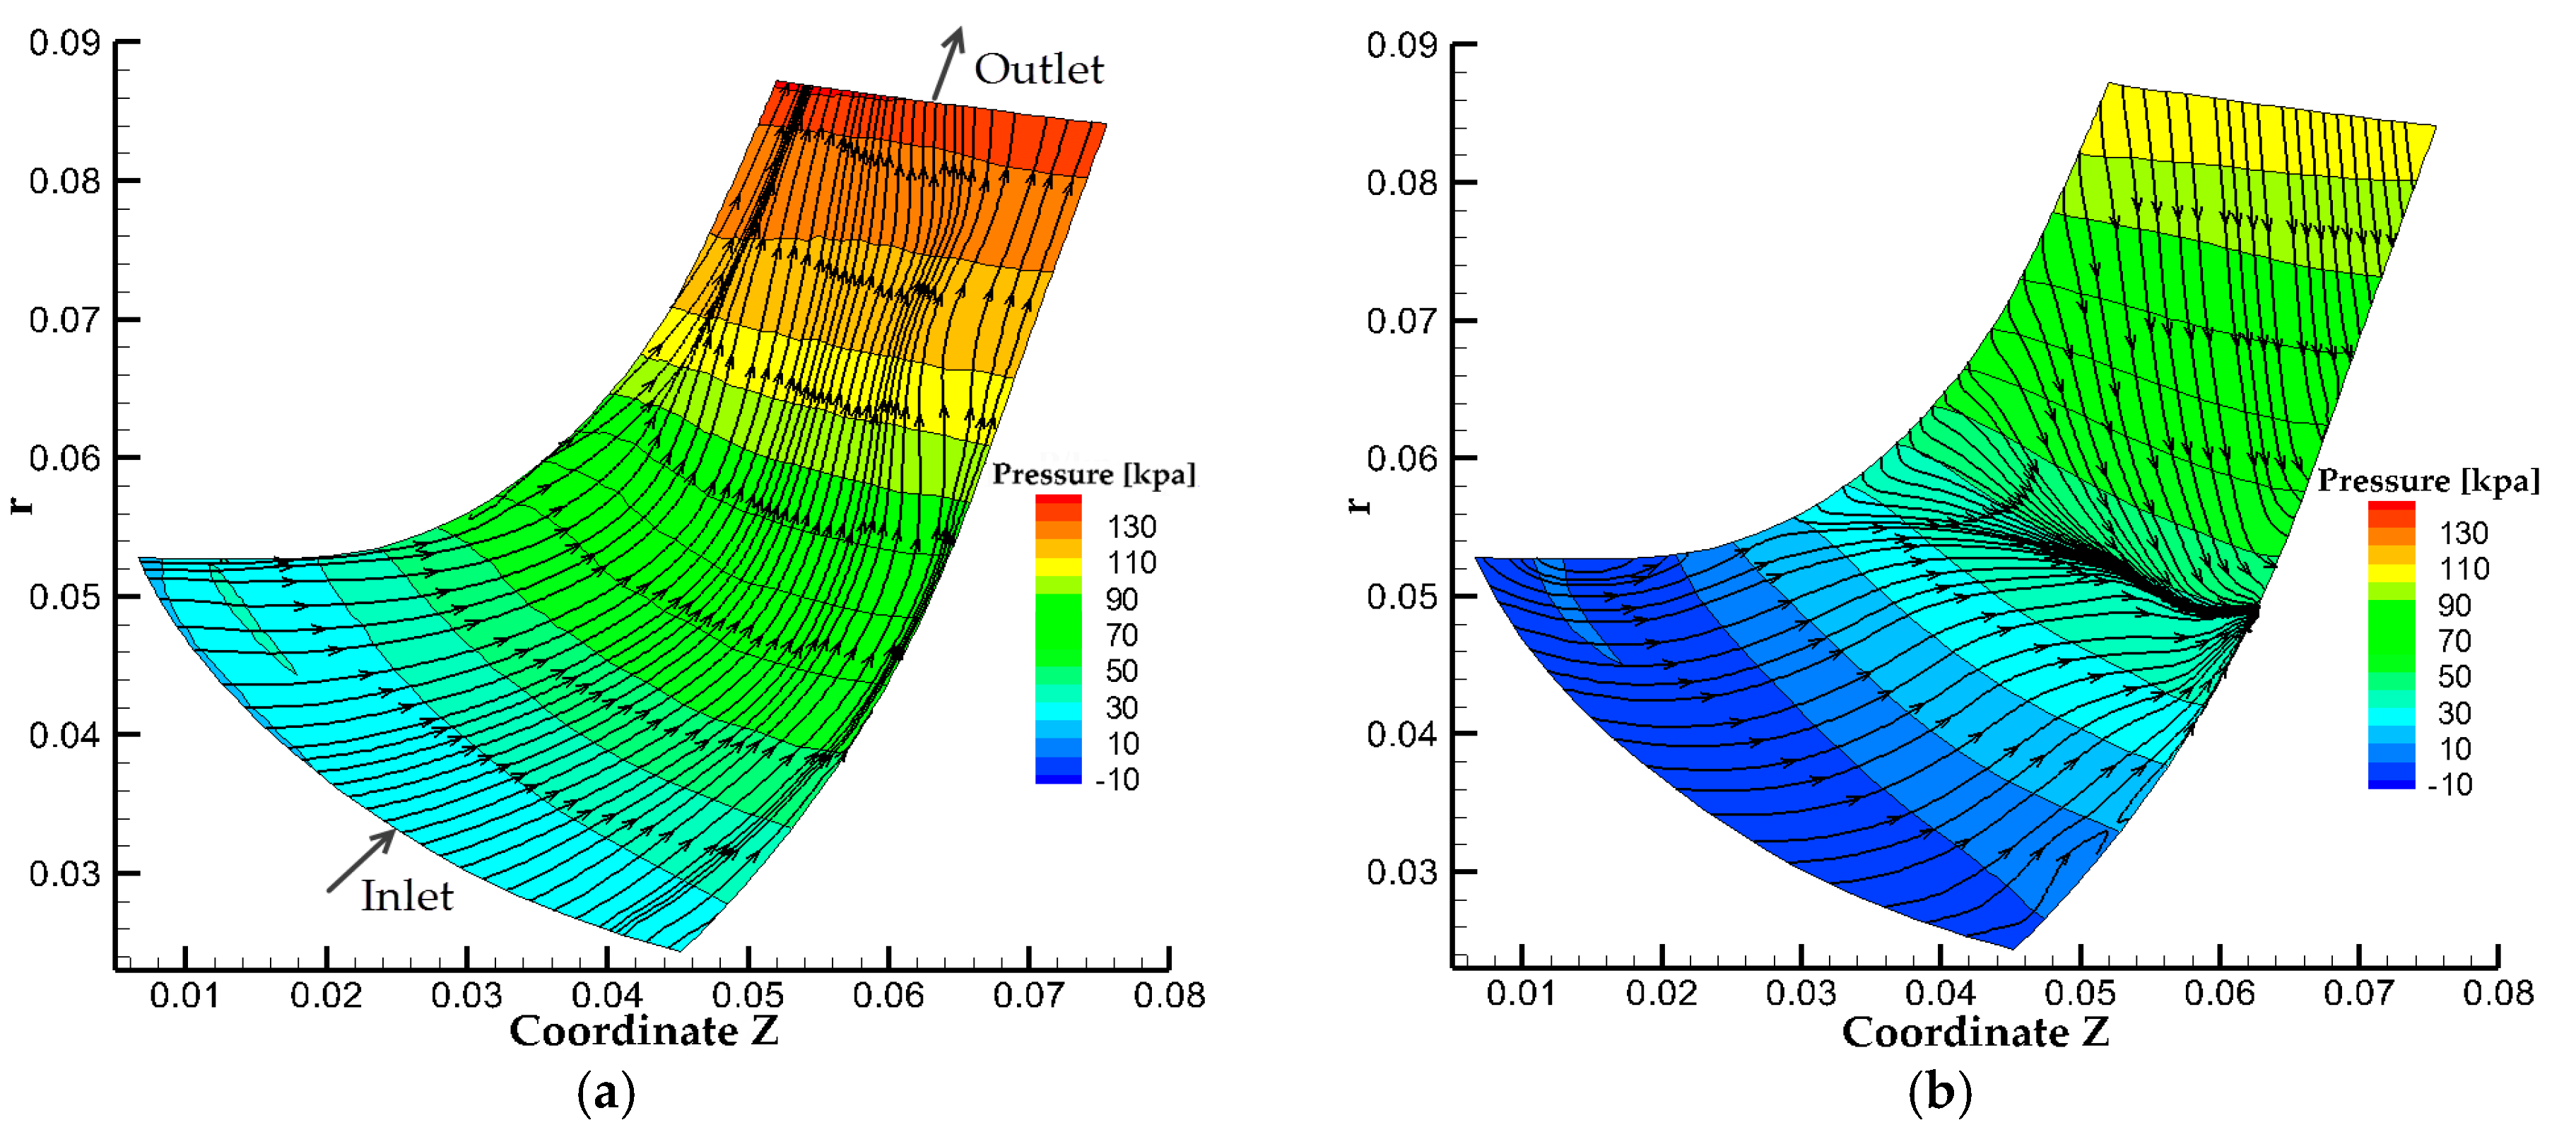
Figure 9.
Time domain and frequency domain characteristics of point C5 under different IGVF conditions (Q = Qd). (a) Time domain characteristics; and (b) frequency domain characteristics.
Figure 9.
Time domain and frequency domain characteristics of point C5 under different IGVF conditions (Q = Qd). (a) Time domain characteristics; and (b) frequency domain characteristics.

Figure 10.
Vector distributions of the liquid superficial velocity (Wls) in the interaction region (Span = 0.5, Q = Qd). (a) IGVF = 0%; (b) IGVF = 5%; and (c) IGVF = 10%.
Figure 10.
Vector distributions of the liquid superficial velocity (Wls) in the interaction region (Span = 0.5, Q = Qd). (a) IGVF = 0%; (b) IGVF = 5%; and (c) IGVF = 10%.
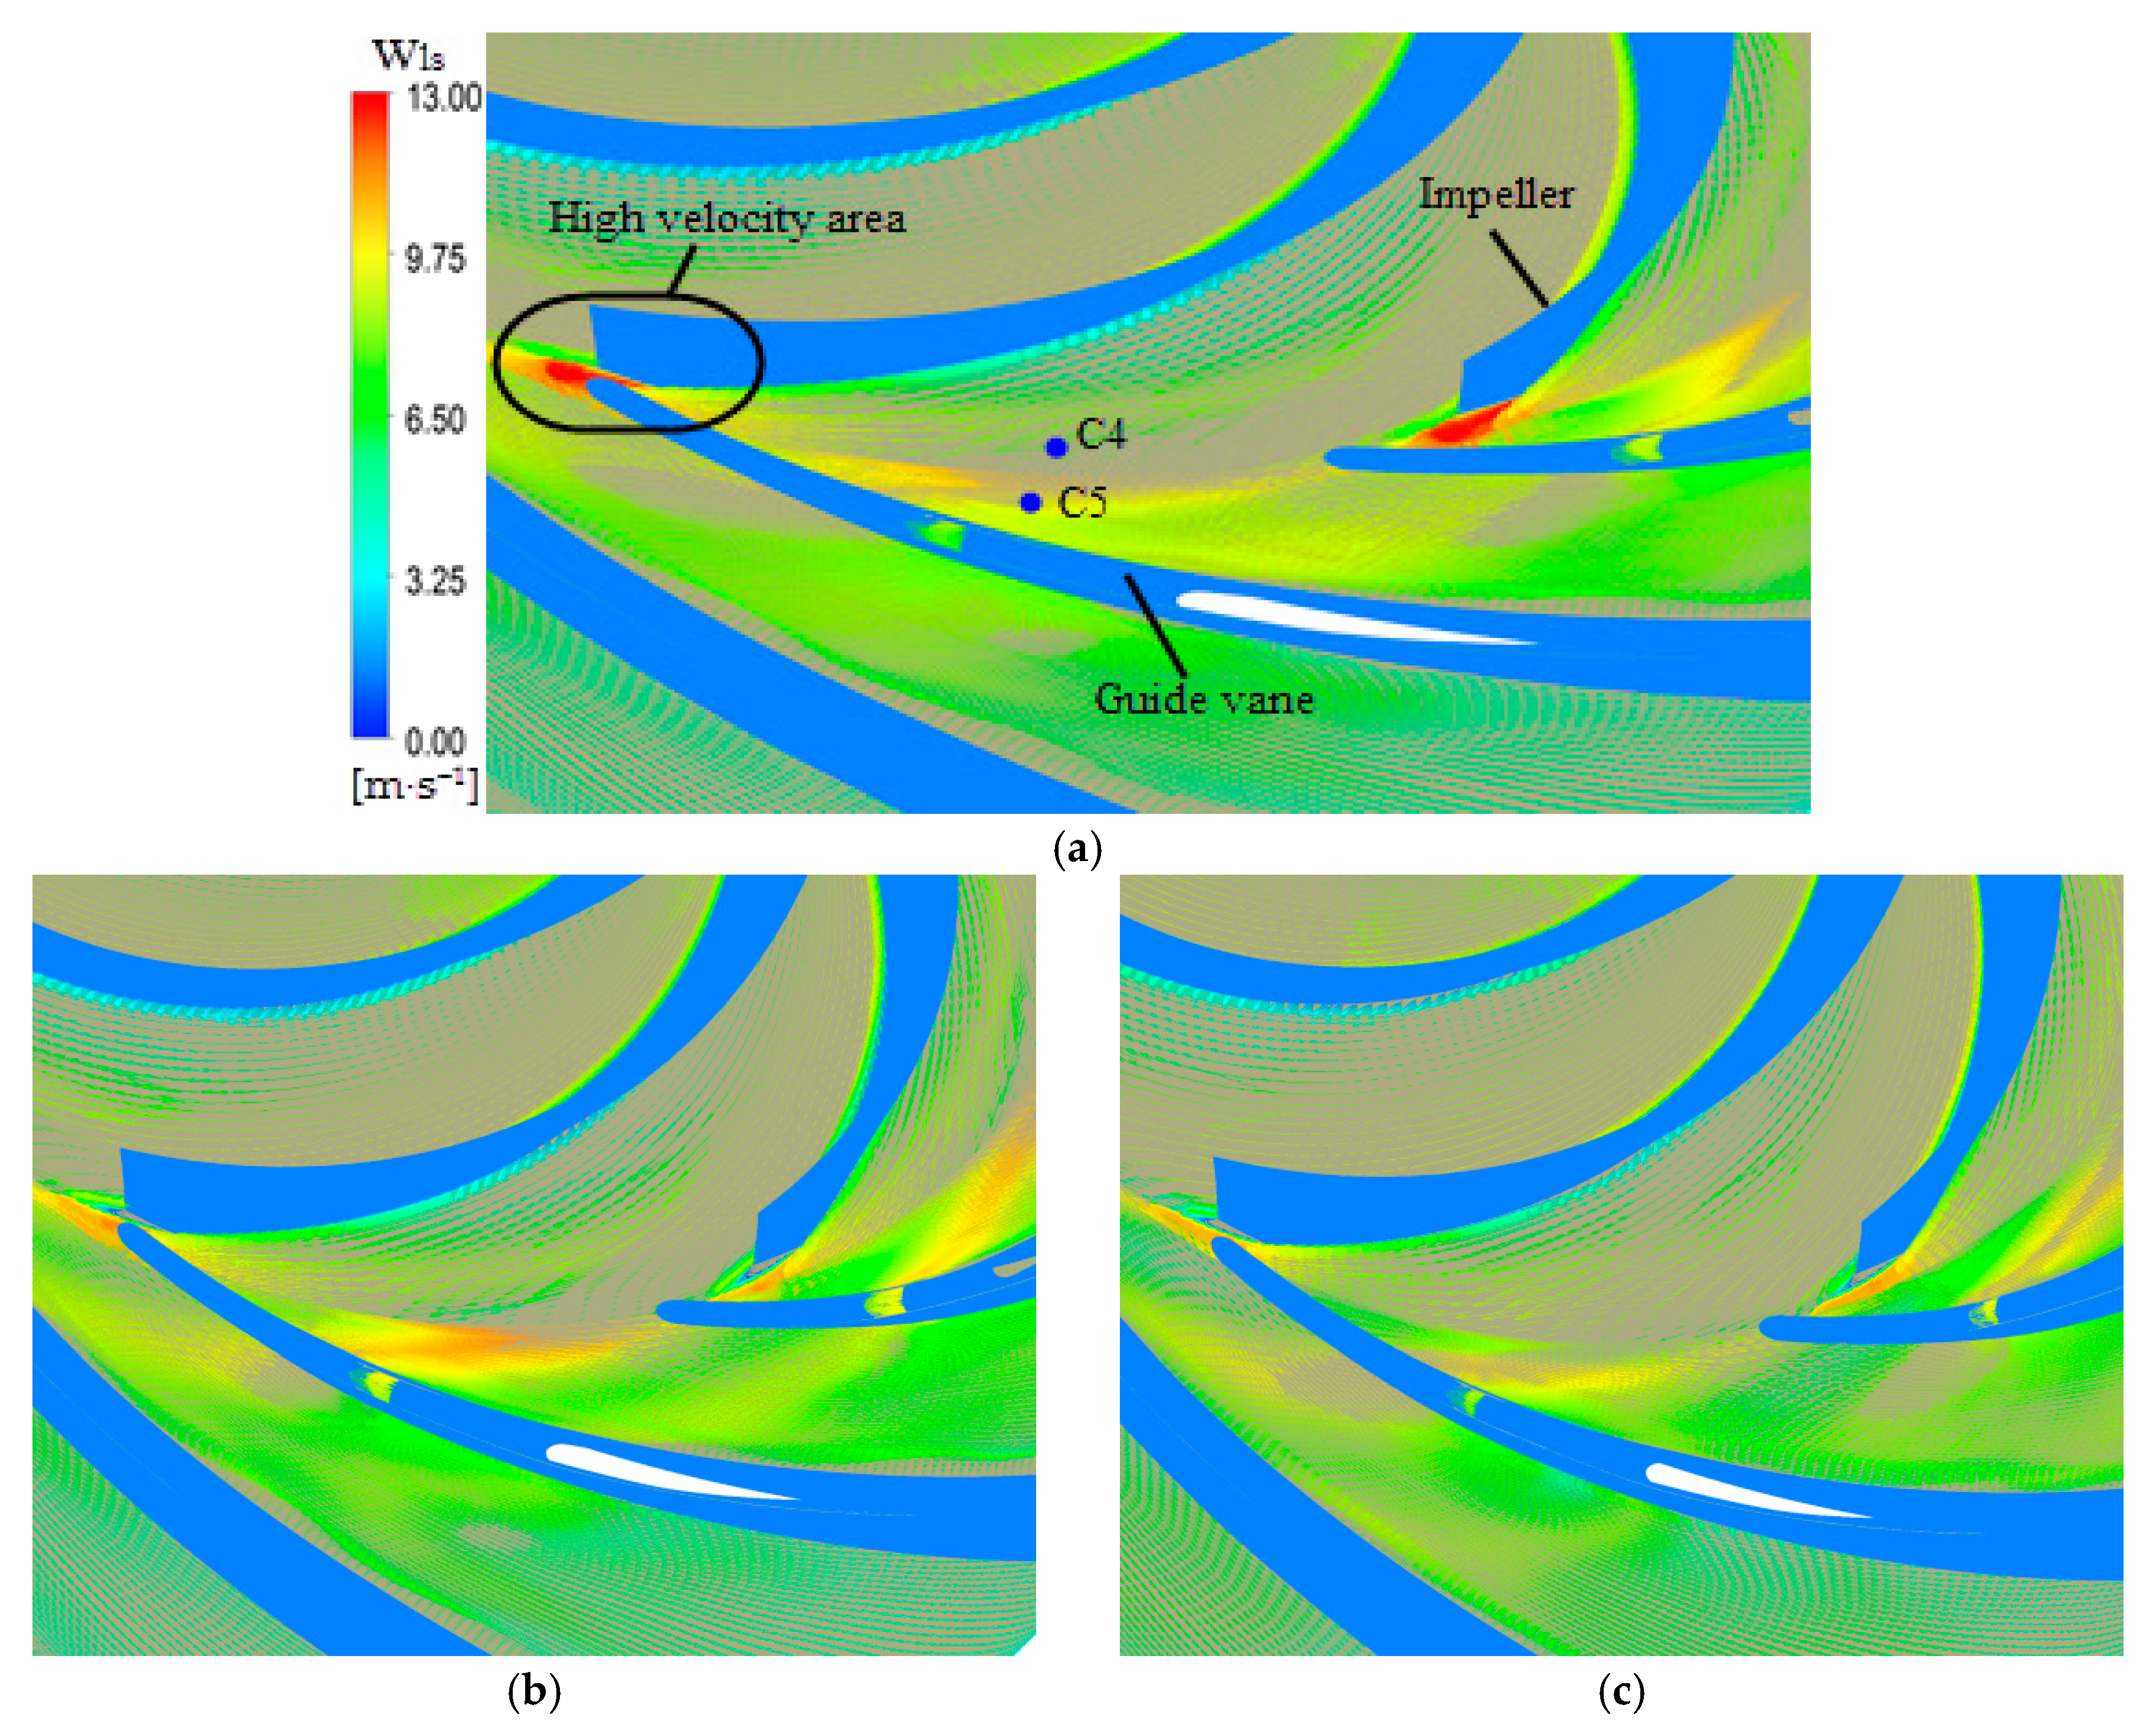
Figure 11.
Vector distributions of the gas superficial velocity (Wgs) in the interaction region (Span = 0.5, Q = Qd). (a) IGVF = 5%; and (b) IGVF = 10%.
Figure 11.
Vector distributions of the gas superficial velocity (Wgs) in the interaction region (Span = 0.5, Q = Qd). (a) IGVF = 5%; and (b) IGVF = 10%.

Figure 12.
Distribution of the gas content from the hub to the shroud of both the impeller and the guide vane at condtions of IGVF = 5%, 10% (Q = Qd). (a) Span = 0.01, IGVF = 5%; (b) Span = 0.5, IGVF = 5%; (c) Span = 0.99, IGVF = 5%; (d) Span = 0.01, IGVF = 10%; (e) Span = 0. 5, IGVF = 10%; and (f) Span = 0.99, IGVF = 10%.


Table 1.
The unsteady solution settings. RMS: root mean square.
| Parameters | Notations | Values |
|---|---|---|
| Time step | Δt | 0.0002 s |
| Maximum iteration number per time step | N | 20 |
| Total time | T | 0.3 s |
| Residual | RMS | <1 × 10⁻⁴ |
| Total flow rate | Qt | 23.2 kg/s |
| Inlet gas void fraction | IGVF | 0%, 5%, 10% |
Table 2.
Pressure fluctuation coefficients of points C1–C4 in the impeller (%).
| Points | C1 | C2 | C3 | C4 | |
|---|---|---|---|---|---|
| IGVF | |||||
| 0% | 0.20 | 0.26 | 0.36 | 3.52 | |
| 5% | 0.52 | 0.53 | 0.58 | 2.46 | |
| 10% | 2.13 | 1.86 | 1.48 | 3.44 | |
Table 3.
Pressure fluctuation coefficients of points C5–C9 in the guide vane (%).
| Points | C5 | C6 | C7 | C8 | C9 | |
|---|---|---|---|---|---|---|
| IGVF | ||||||
| 0% | 2.29 | 2.12 | 1.48 | 0.73 | 0.20 | |
| 5% | 1.68 | 1.43 | 0.94 | 0.48 | 0.21 | |
| 10% | 2.03 | 1.16 | 1.11 | 0.46 | 0.43 | |
© 2017 by the authors. Licensee MDPI, Basel, Switzerland. This article is an open access article distributed under the terms and conditions of the Creative Commons Attribution (CC BY) license (http://creativecommons.org/licenses/by/4.0/).
Share and Cite
MDPI and ACS Style
Zhang, W.; Yu, Z.; Zhu, B. Numerical Study of Pressure Fluctuation in a Gas- Liquid Two-Phase Mixed-Flow Pump. Energies 2017, 10, 634. https://doi.org/10.3390/en10050634
AMA Style
Zhang W, Yu Z, Zhu B. Numerical Study of Pressure Fluctuation in a Gas- Liquid Two-Phase Mixed-Flow Pump. Energies. 2017; 10(5):634. https://doi.org/10.3390/en10050634
Chicago/Turabian StyleZhang, Wenwu, Zhiyi Yu, and Baoshan Zhu. 2017. "Numerical Study of Pressure Fluctuation in a Gas- Liquid Two-Phase Mixed-Flow Pump" Energies 10, no. 5: 634. https://doi.org/10.3390/en10050634
Note that from the first issue of 2016, this journal uses article numbers instead of page numbers. See further details here.