
Grain Size Distribution Effect on the Hydraulic Properties of Disintegrated Coal Mixtures


1
School of Resources & Safety Engineering, Central South University, Changsha 410083, Hunan, China
2
State Key Laboratory for Geomechanics & Deep Underground Engineering, China University of Mining & Technology, Xuzhou 221116, Jiangsu, China
3
GeoEnergy Research Centre (GERC), University of Nottingham, Nottingham NG7 2RD, UK
*
Authors to whom correspondence should be addressed.
Energies 2017, 10(5), 612; https://doi.org/10.3390/en10050612
Submission received: 6 April 2017
/
Revised: 25 April 2017
/
Accepted: 27 April 2017
/
Published: 29 April 2017
(This article belongs to the Special Issue Mathematical and Computational Modeling in Geothermal Engineering)
Abstract
:In order to better understand groundwater influx and protection in coal mining extraction works, an in-house water flow apparatus coupled with an industrial rock testing system, known as MTS 815.02, were used to study the effects of grain size mixtures on the compaction and flow properties of disintegrated, or non-cemented, coal samples. From the Reynolds number evaluation of the samples with different grain mixtures, and the relationship between the water flow velocity and pore pressure gradient differences, it was found that seepage through the mixtures are of non-Darcy flow type. The porosity of coal specimens was found to be highly affected by compaction, and the variations of the porosity were also influenced by the samples’ grain size distribution. It was found that the sample porosity decreases with increasing compaction and decreasing grain sizes. Grain crushing during compaction was observed to be the main cause of the appearance of fine grains, and the washing away of fine grains was consequently the main contributing factor for the weight loss due to water seepage. It was observed that during the tests and with the progression of compaction, permeability k decreases and non-Darcy factor β increases with decreasing porosity φ. The k-φ and β-φ plots show that as the sizes of disintegrated coal samples are getting smaller, there are more fluctuations between the porosity values with their corresponding values of k and β. The permeability value of the sample with smallest grains was observed to be considerably lower than that of the sample with largest grains. Non-Darcy behavior could reduce the hydraulic conductivity. It was found that the porosity, grain breakage and hydraulic properties of coal samples are related to grain sizes and compaction levels, as well as to the arrangement of the grains. At high compaction levels, the porosity of disintegrated coal samples decreased strongly, resulting in a significant decrease of the permeability at its full compression state; Non-Darcy flow behavior has the slightest effect in uniform samples, therefore, indicating that disintegrated coal in uniform grain size mixtures could be treated as an aquicluding (water-resisting) stratum.
1. Introduction
Water protection is an important issue for large scope underground mining works, especially in western China, where a large proportion of the coal seams are below arid areas and water resources are quite scarce. Moreover, if the overburden rock strata are sufficiently permeable, surface water and groundwater can flow into the underground mine, which could result in an unsafe mining environment and also deteriorate the region’s already weak ecological environment [1]. Furthermore, in the western China mining area, the overlying rock structures of most of the main coal seams have typical characteristics of shallow depths, overlaid by thick sand layers and underlaid by thin bedrock. Coal exploration works that are taking place in these areas are mostly rather invasive, resulting in strong strata fracture, which could consequently result in significant surface subsidence, water loss, coal seam rock bursts and other hazards. Additionally, deterioration of the existing ecological and environmental systems is among the other negative effects of these mining works [2,3]. Therefore, a better understanding of the hydrogeological responses of coal seam that are widespread in these areas has clear advantages.
There are many factors that control and influence the occurrence of water influx within the ground. The main factors are ground stress [4], pore water pressure [5], geological formations and mine dimensions such as mining width and advancing distance [2]. On the other hand, understanding the compaction and flow characteristics of deformed rock layers play a key role in water influx prevention within the coal mines; therefore, studying the evolution of hydraulic properties for porous sedimentary rocks under compaction [6] can certainly be beneficial in the planning of coal mining works. Many of factors, such as lithology, rock texture, and external loading, can affect the compaction level of different non-cemented sedimentary rock [7,8]. There are several other factors that also influence the properties of non-compacted sedimentary rocks mixed grains, including shear strength [9], friction angle [10], permeability [11], etc. During loading, rock grains may be broken [12,13], the degree to which the grains are broken down to, could be related to different factors such as the saturation and drying processes [14,15], the intensity of the applied stress [16] and the initial grading of the rock mixture [12,17].
Historically, many researchers have investigated water flow through non-cemented media (e.g., in dam filter layers) to find out the effect of flow on the grain size ratios and consequently on the hydraulic properties of the grain mixtures [18,19,20]. More recently, a good number of studies has been carried out to analyze the correlations between the seepage-induced grain rearrangements with seepage forces [21]), grain mixing [22], water table level [23], channel network formation [24] and grain shape and gradation [25]. Furthermore, several experimental studies have been reported in the literature on the investigation of hydraulic properties due to water flux in non-cemented coal samples and other non-compacted sedimentary rocks [26,27,28,29]. From studying the variation of the compaction, shearing and flow characteristics of non-cemented rocks, reference [28] proposed a logarithmic equation between the axial pressures and permeability coefficients. They also found that the seepage in non-cemented rock masses does not obey the Darcy law, but it is better explained by the Forchheimer equation [30]. When the rock exhibits a lower porosity, the characteristics of the non-Darcy flow are more clearly observed [28].
For non-cemented coal particles, many theoretical, experimental and numerical methods have been proposed to understand the effect of properties such as grain size, density and ash on fixed characteristics [31,32,33], coal combustion [34], coal particle moving [35], stable free radicals [36], etc. Permeability is influenced by the stress rate [37], fracture geometry [38], fracture geometry and water-content [39], both presence of water and magnitude of water saturation [40]. In the study carried out by [28], the evolution of permeability within disintegrated rocks under water flow was experimentally investigated; however, in that study the effects of different mixtures of grain sizes were not considered.
To capture the compaction and hydraulic properties of disintegrated coal samples with different grain sizes, in this work an experimental setup has been considered for the measurement, calculation, and quantification of the effect of changing grain sizes and axial displacements on the properties of water flow in a non-Darcy condition. The same setup was previously used to study the influence of grain mixture on flow characteristics of disintegrated mudstone [41]; however, the work in this paper is the first study of this type on monitoring and analyzing the compaction and hydraulic properties of coal. In the following sections, the details of experimental apparatus, test specimens and testing procedure are explained.
2. Experimental Equipment and Conditions
2.1. Experimental Equipment
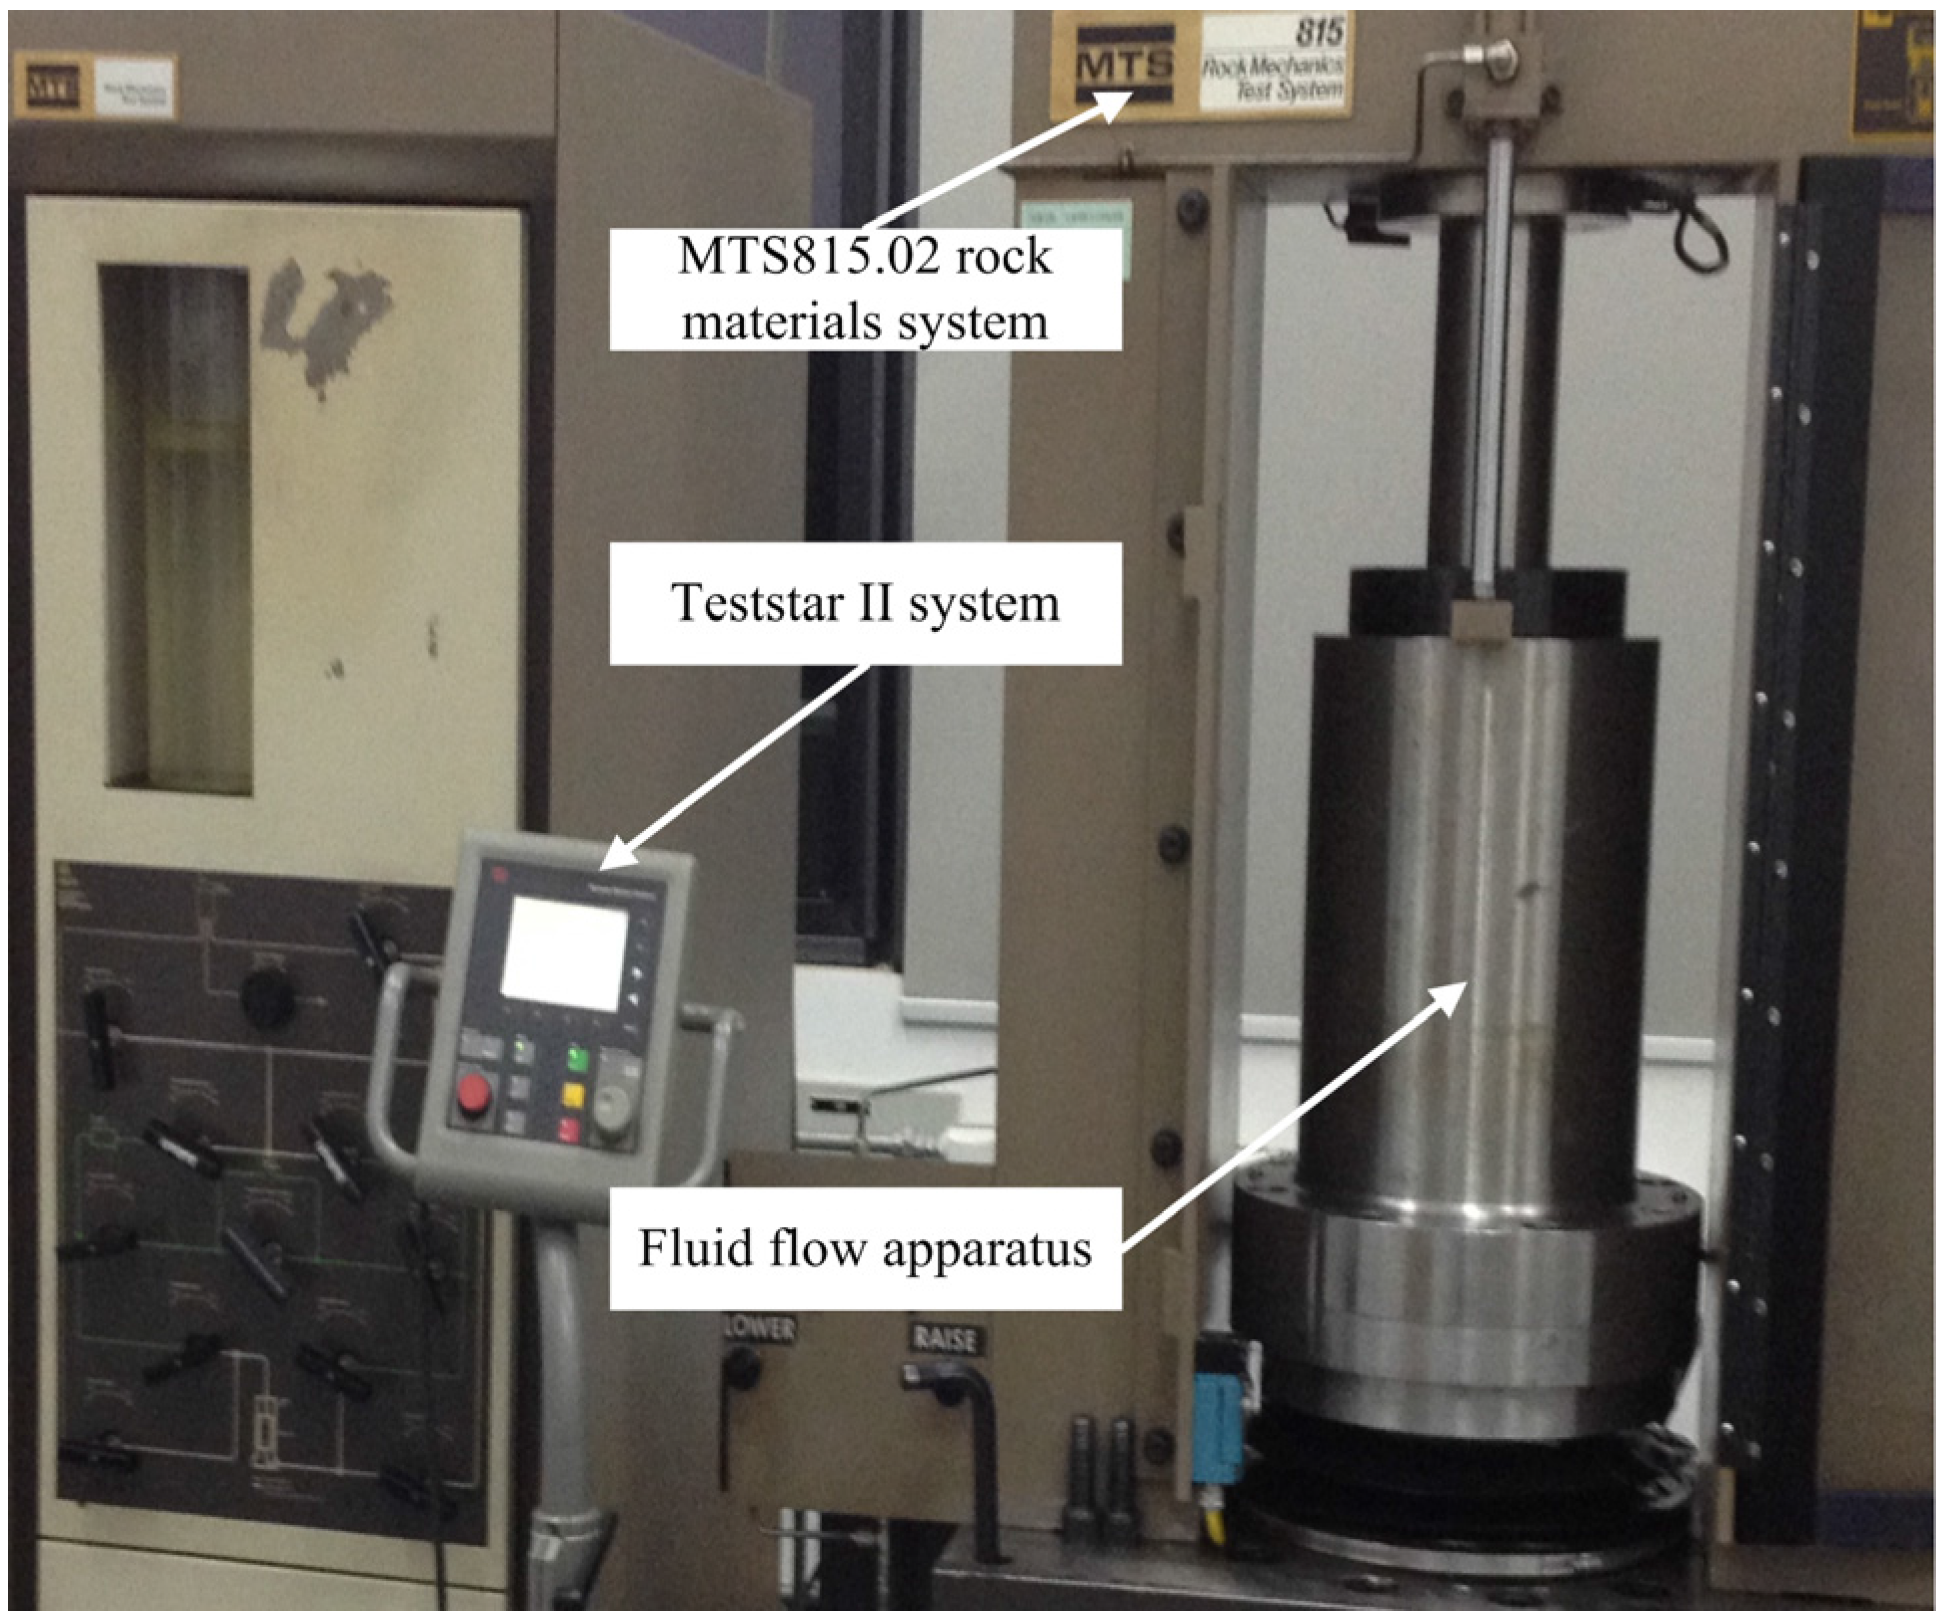
The MTS 815.02 rock material system and a fluid seepage setup are the two main parts of the coupled testing equipment (Figure 1) used in this study. The schematic illustration of the testing system is shown in Figure 2. An epoxy resin layer (7) is used to separate the cylindrical tube (6) and the rock specimen (16), and to prevent the radial water flow. A one–way valve is used to connect the cylindrical tube (6) and the triaxial base of the system, which includes valve chest (1), valve core (2), mechanical spring (3), mechanical bolt (4) and base plate (13). The porous disks (9 and 14) ensure that water flow is evenly distributed, and the filter pads (8 and 15) can keep the testing system clear and free of water contamination. The loading plate (12) is utilized to exert the axial pressure.
The same experimental setup was formerly applied to study the flow characteristics of disintegrated sedimentary rocks [4,41]; however, the former work did not take into account the effect of grain size distribution on the compaction and water flow properties of sedimentary coal samples, which is the main focus of this study.
2.2. Experimental Conditions
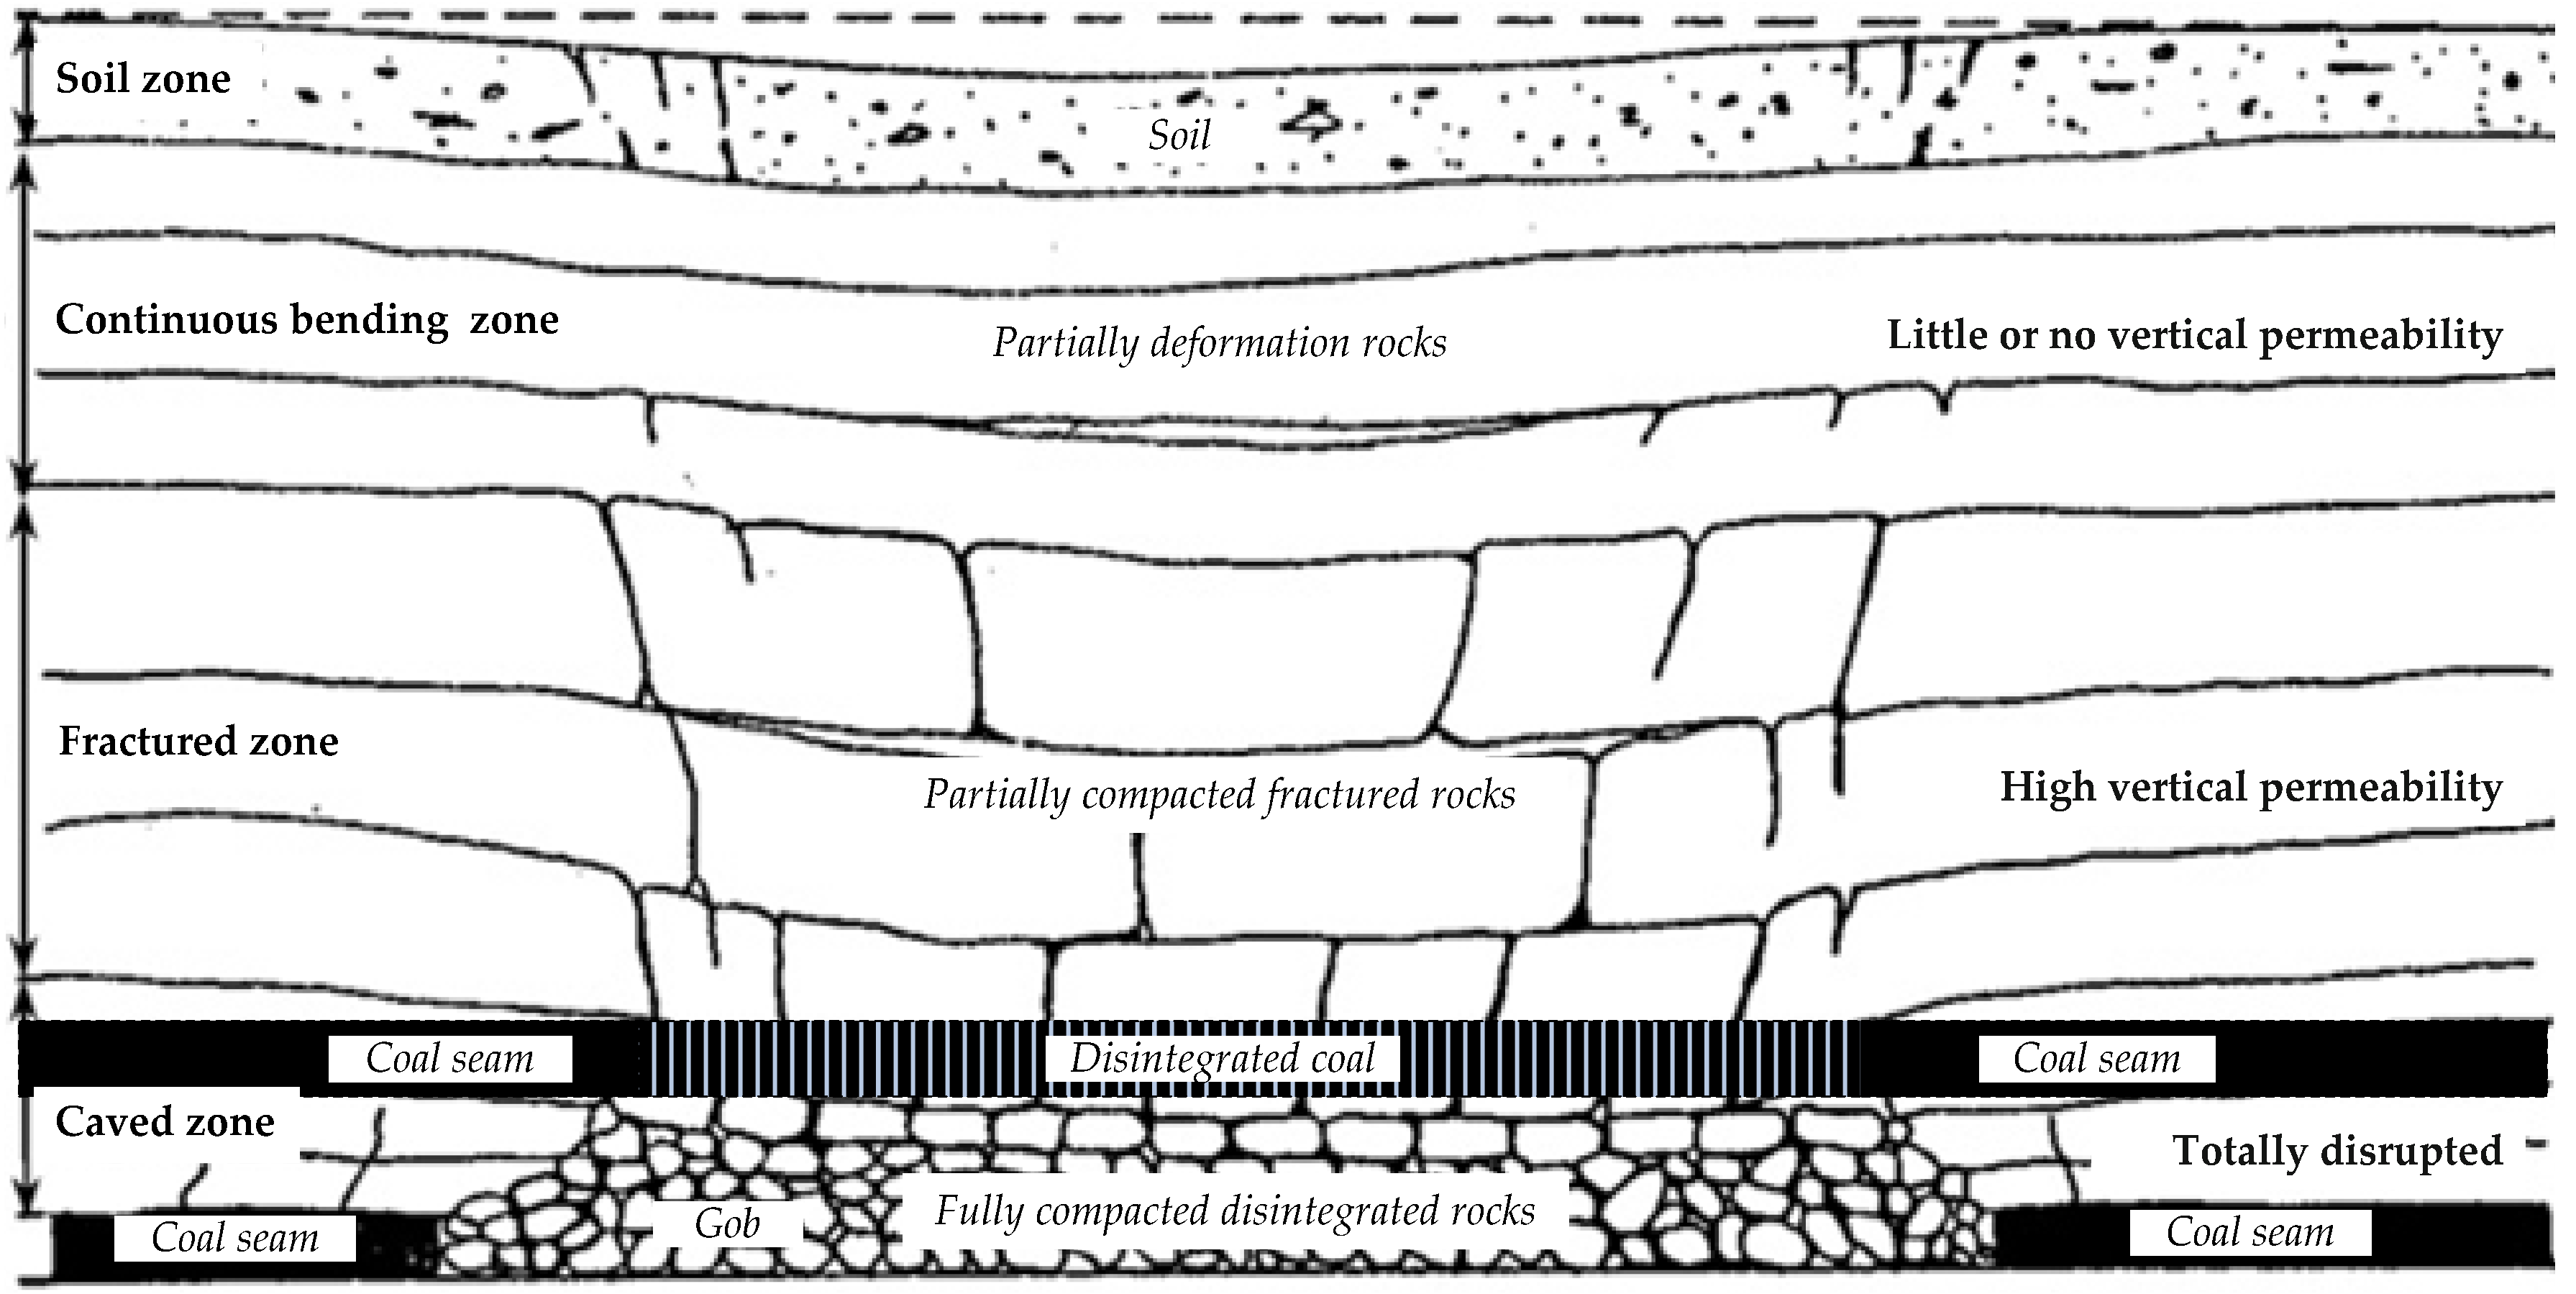
In longwall mining, as shown in Figure 3, there are four disturbance zones that are formed in the overlying strata of a coal seam [42]. After mining operations, along with the consolidation process around the excavated areas, a state of equilibrium can be reached within the disturbed zones [43]. In these mining-affected areas, in addition to the investigation of the geological formations, water table and cavitation percentages of underground openings [44,45,46,47], it is also essential to study the hydraulic properties of the deformed rocks under the constant loading of the overlying ground layers [48]. As a practical issue in mining geotechnics, studying the compaction and hydraulic conductivity attributes of deformed strata makes a great contribution to plan for mitigation of potential problems that can arise from mining activities. With the removal of coal material, the stress distribution around the excavated area changes and as a result the ceiling of the excavated area could cave in. The stress variation within the ground occurs from the seam level all the way up to the ground surface, this can lead to fractures and changes of the permeability of the adjacent ground zones by several orders of magnitude [42,49]. As a result the hydraulic properties of the overburden strata are changed, particularly near the excavated zones, and therefore high permeability pathways are frequently formed [49,50]; this can cause water influx within the ground.
2.2.1. Sample Preparation
As shown in Figure 3, the grain sizes of disintegrated coal underground display large variety. However, because of the limit of experimental setup-cylindrical tube (its diameter is 100 mm and height is 180 mm), coal was broken into 2.5–20 mm diameter size and the grains were mixed to decrease the boundary effect and the testing error.
The coal blocks sampled for this study were taken from a depth of approximately 340 m at the site of Xiaojiawa Coal Mine in China. The dry density of the coal blocks was . The coal specimens were broken into grains smaller than 20 mm in the laboratory. The crushing of coal blocks was done in two steps. First, using steel piercers and iron hammers, the coal blocks were hammered into pieces of 60 mm diameter or less. Then, a particular stone breaker was used to break those large pieces into small ones with sizes less than 20 mm in diameter.
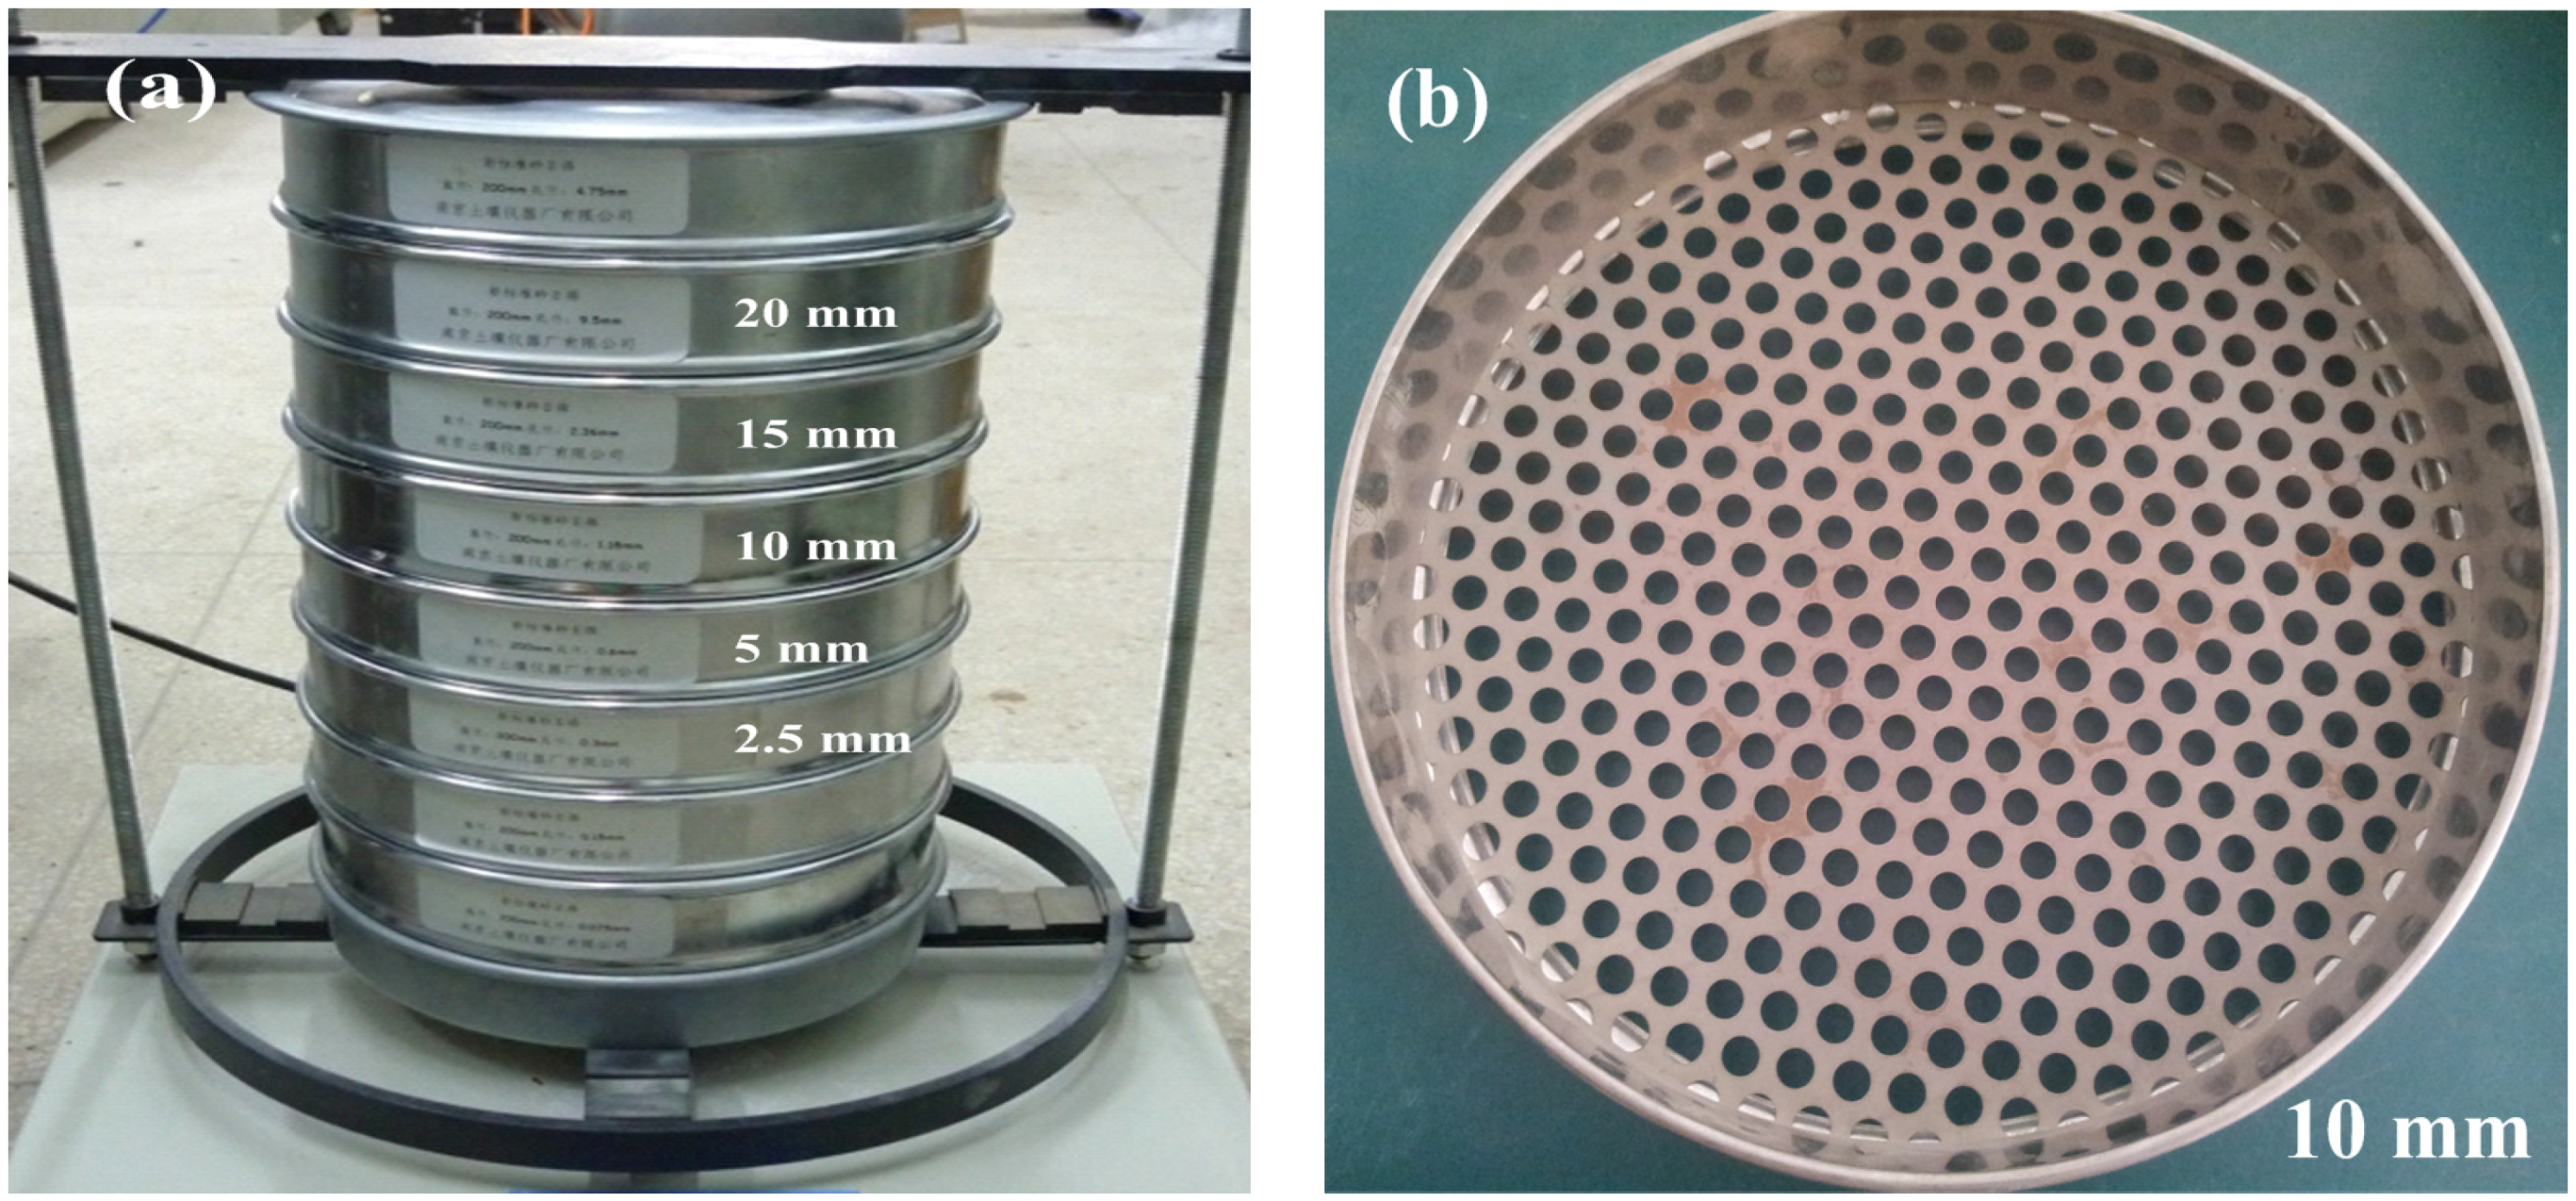
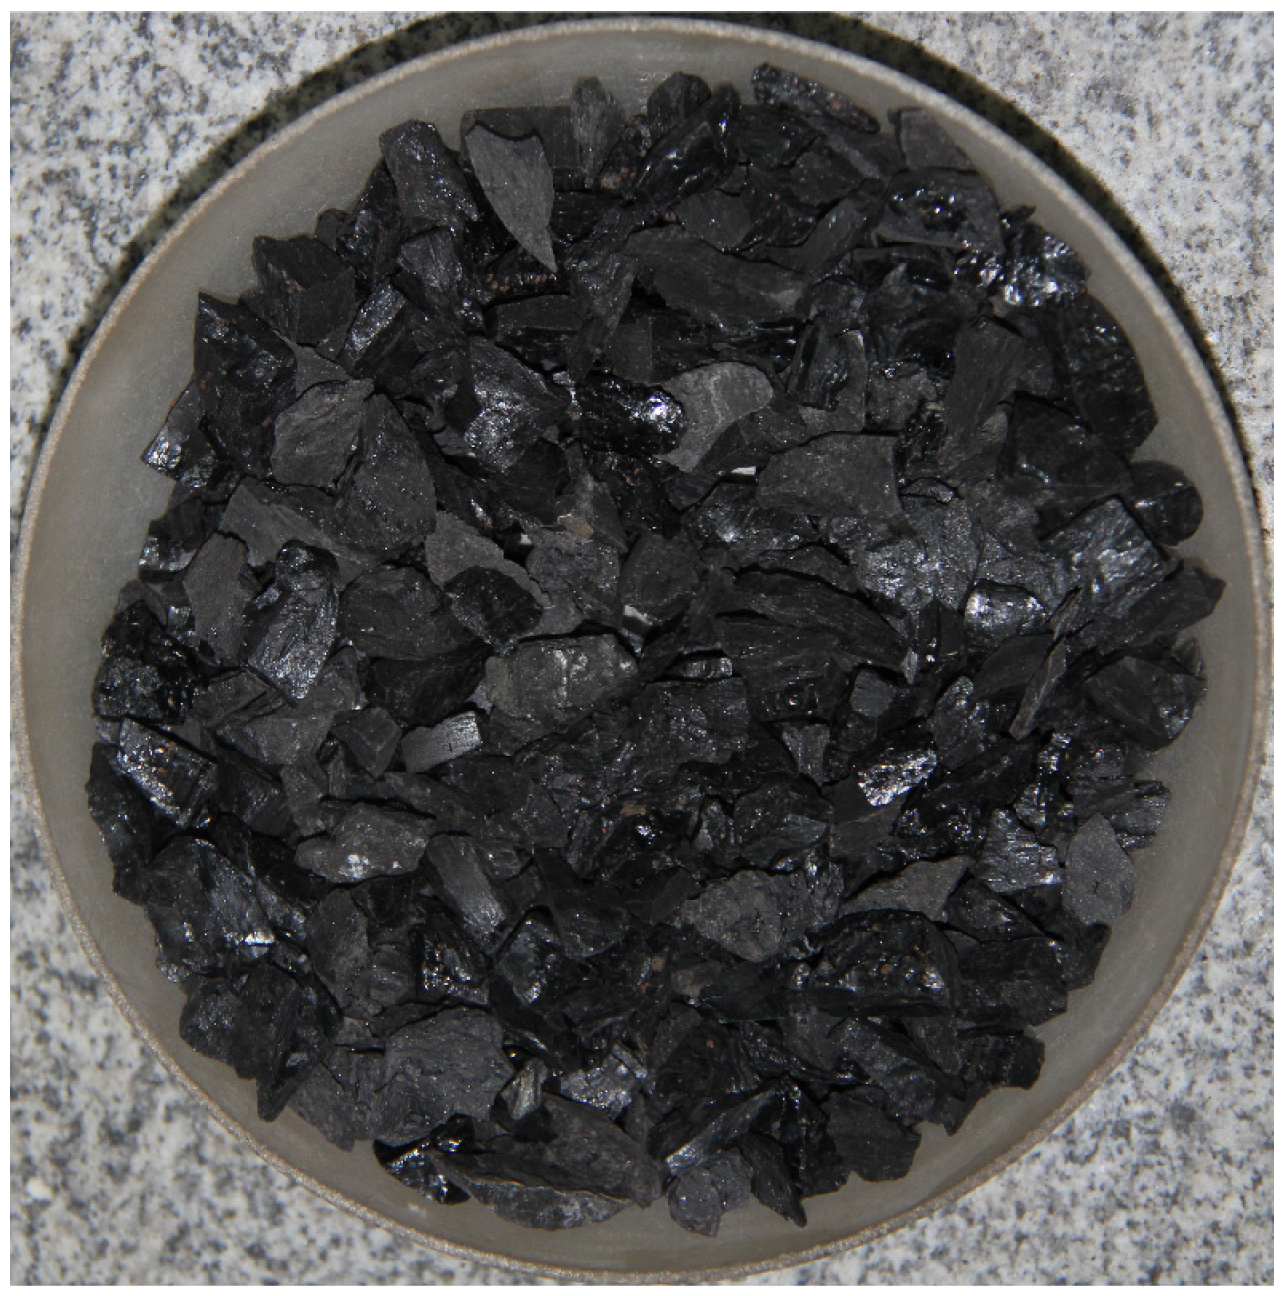
Using a sieving machine with high-frequency vibration (Figure 4a), the disintegrated coal was separated into four groups with different grain size ranges, namely 2.5–5 mm, 5–10 mm, 10–15 mm and 15–20 mm. As shown in Figure 4b, the sieves used had round shaped holes, to ensure the uniformity of the prepared test samples and that the grains are sieved evenly. Testing samples in weight ratios of (1:1:1:1), (2:1:1:1), (1:2:1:1), (1:1:2:1) and (1:1:1:2) were prepared from the four groups of grain sizes, respectively. For simplicity of referencing in this paper the above-mentioned samples are referred to as uniform (1:1:1:1), smallest (2:1:1:1), smaller (1:2:1:1), larger (1:1:2:1) and largest (1:1:1:2), the sample weight was 1500 g. Table 1 provides a summary of the samples with different amounts of grain size constituents. An example display of the sieved grains in 10–15 mm is also shown in Figure 5.
2.2.2. Water Pressure
In actual mining conditions, the water pressure under coal seam in Xiaojiawa Coal Mine can reach to 2.3 MPa. Considering the experimental setup and geological conditions, 2.3 MPa was taken as the highest water pressure in the test.
2.2.3. Compaction Behavior
As show in Figure 3, due to the effect of mining, the lower section of coal seam will be disintegrated, the porosity of the lower section will be increased. Therefore, compaction level was considered to monitor the variation of porosity on hydraulic properties.
3. Experimental Procedure
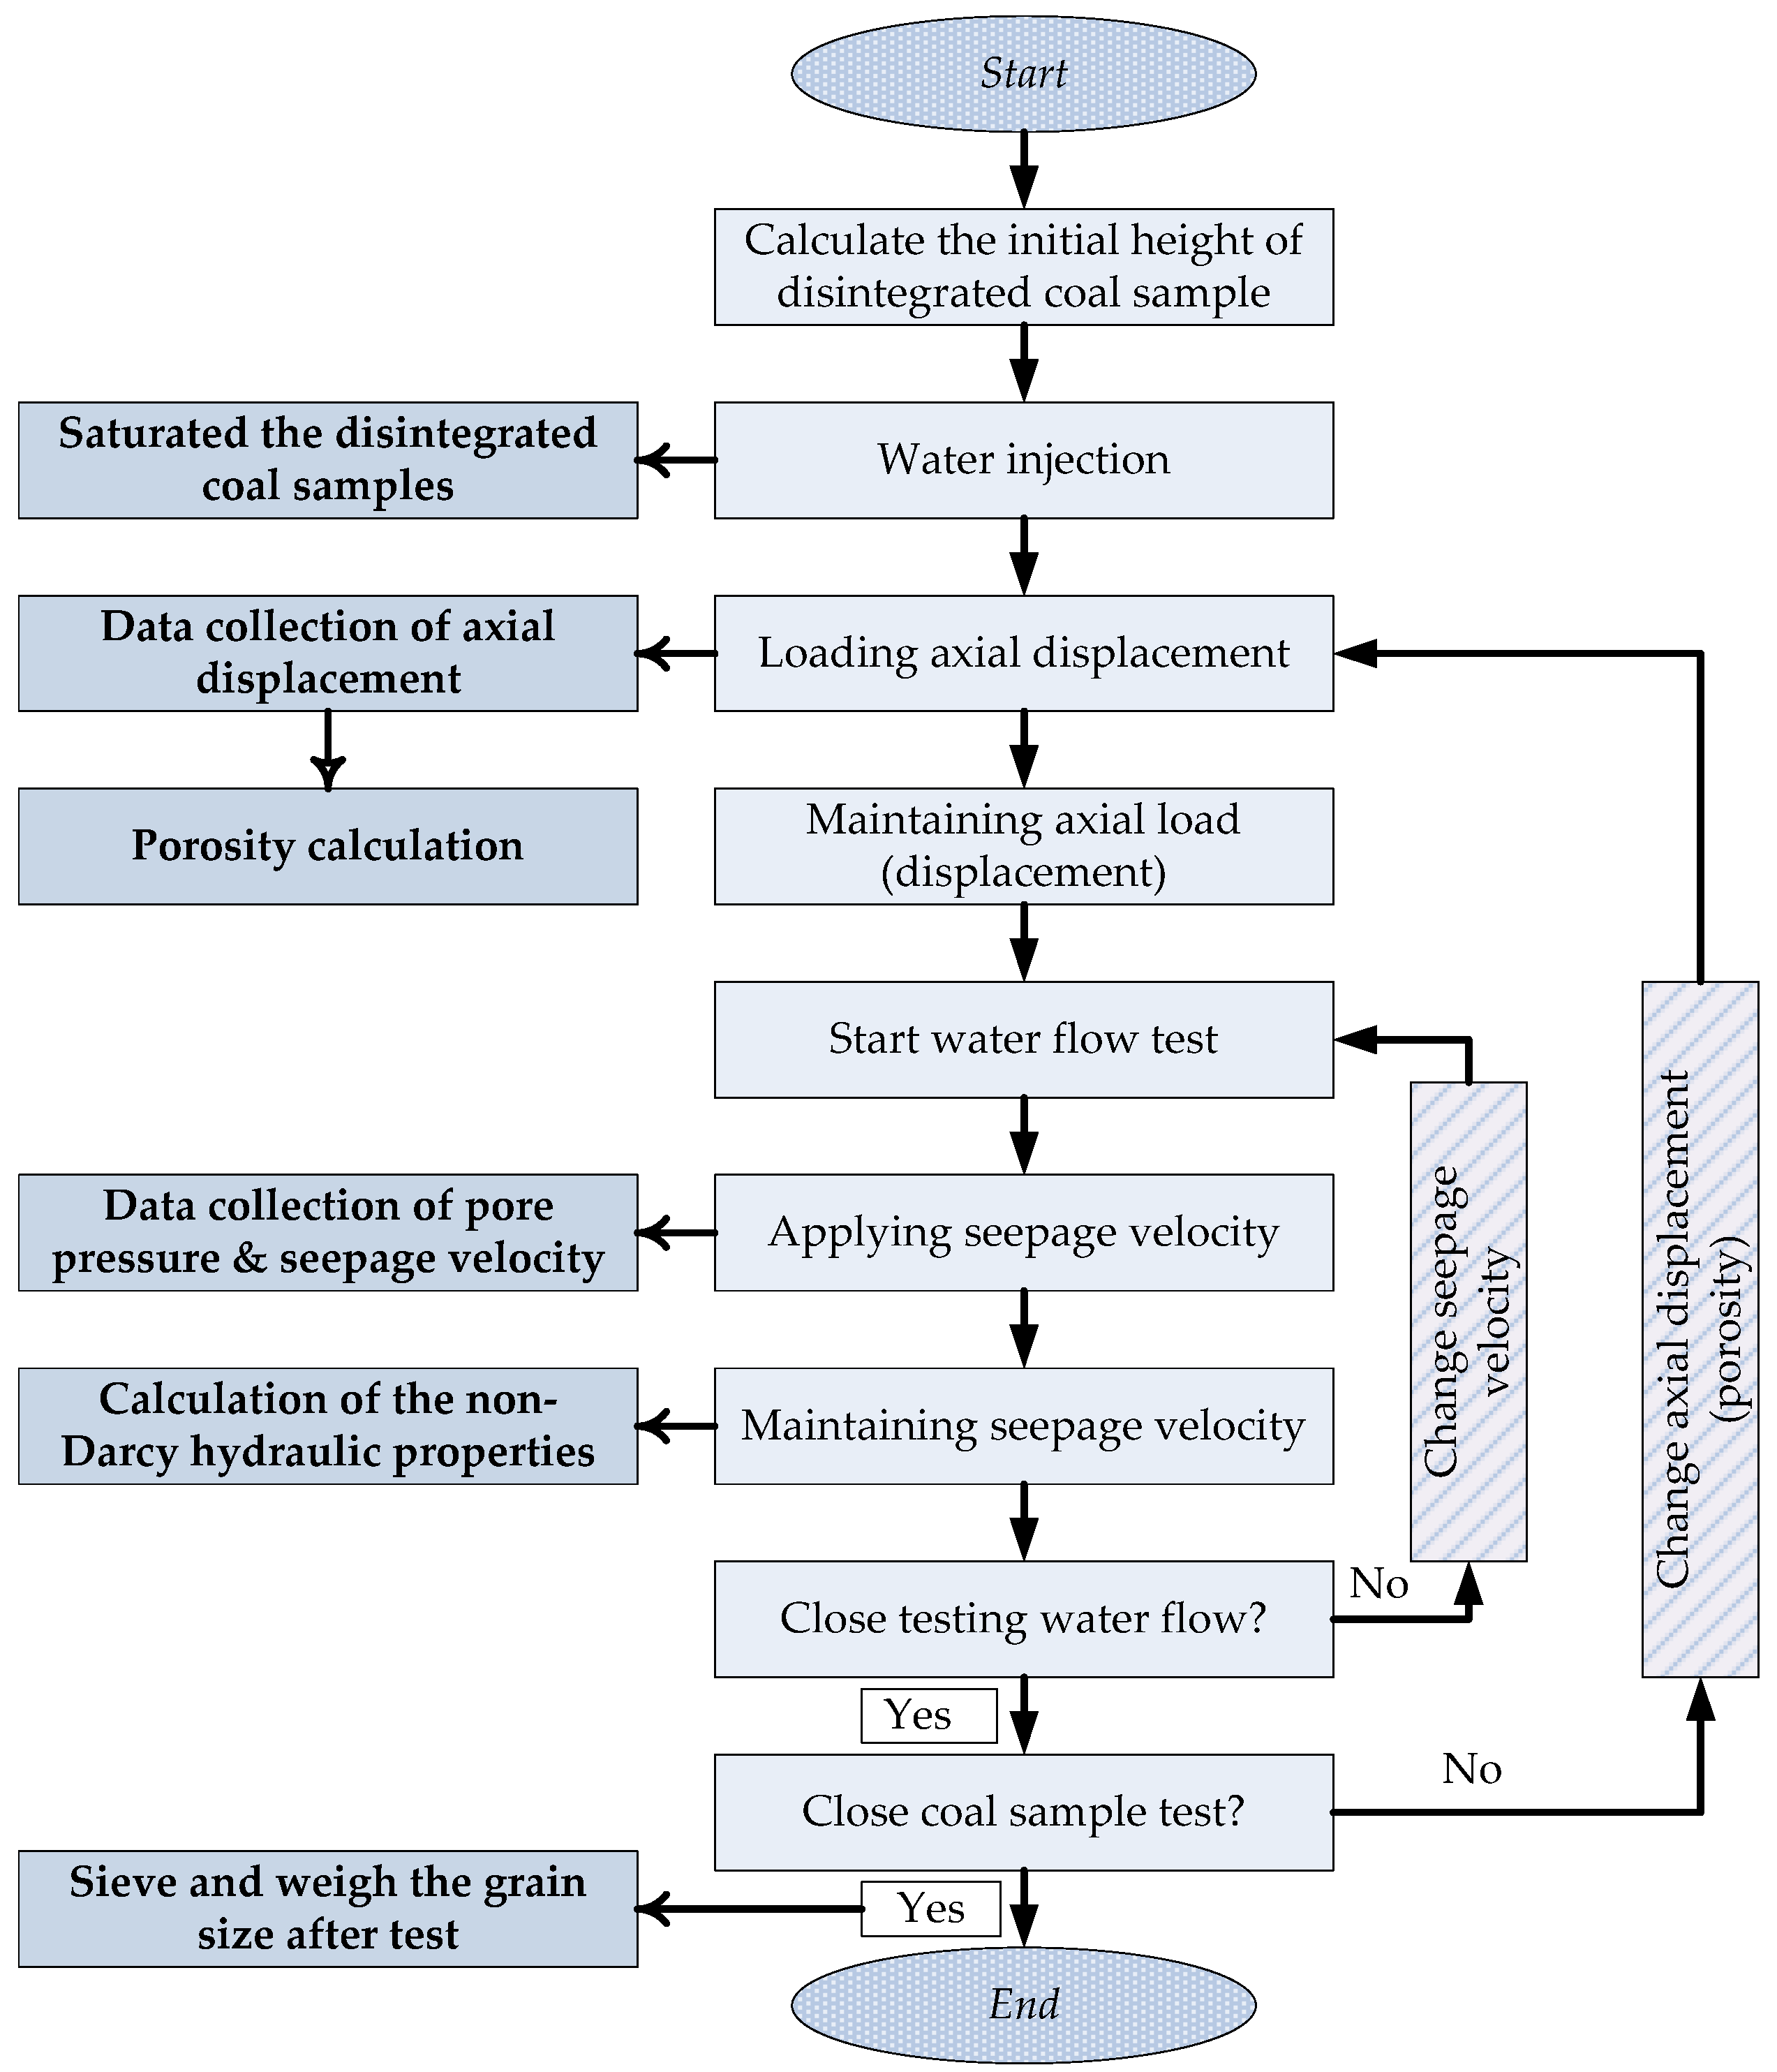
Before each test, the coal samples were required to be fully saturated with water. To obtain reliable measurements, water flow readings were carried out after the load (displacement) was remained at a set value; in other words, the load modification and fluid seepage were two consecutive testing stages. The testing advancement was as follows:
- (1)
- Calculation of the original length (porosity) of sample before load application.
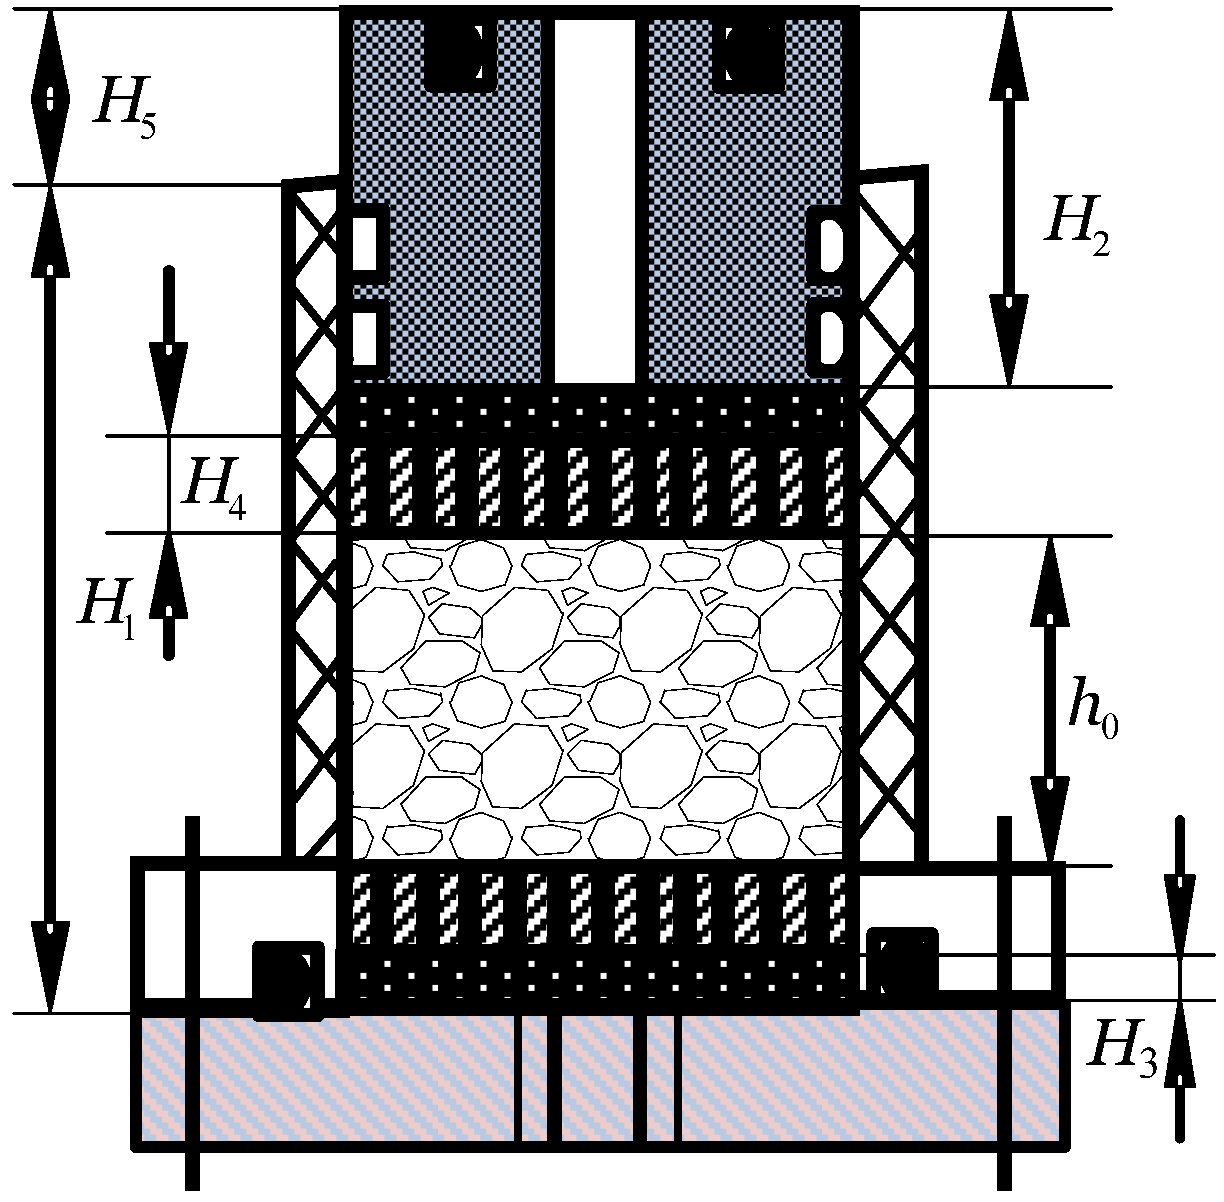
First, a coal sample was placed into the cylindrical container, and the loading ram was installed to rudimentarily compact the sample. As shown in Figure 6, the original height of the sample can be calculated as . to , which are illustrated in Figure 6, are the dimensions of the different components of the sample container setup. As and were set before the design of the seepage device, could only be related to : . Therefore, the original porosity of coal sample was fixed.
- (2)
- Saturation of the coal samples.
The water injection capability of the MTS 815.02 test system was used to saturate the coal samples.
- (3)
- Application of the load.
The sample was loaded axially until its deformation reached to a pre-planned displacement value. The axial stress kept at 0.400 MPa during loading; then the porosity at each displacement (i.e., 10, 15, 20, 25, 30, 35, 40 mm) was calculated. The displacement was maintained until step 4 was finished.
- (4)
- Application of the water flow.
The loading ram speed could be programmed through the control system of the MTS 815.02 machine. During the experiments, after the final compaction of the sample (i.e., step 3), water pressure was regulated in order to maintain different loading ram speeds of 16.7, 31.3, 62.5, 93.8, 109 µm/s to apply different axial displacements within the range of 10 mm to 40 mm with 5 mm intervals.
The flowchart in Figure 7 summarizes the complete test advancement; each sample was tested four times to achieve a better level of reliability in the results. For each case, to increase test accuracy, the final result was taken as the average value from the four tests.
4. Experimental Results and Discussion
Test results are analyzed in this section, which include porosity evolution during compaction, evaluation of the non-Darcy seepage flow, grain crushing and hydraulic properties.
4.1. Porosity Evolution during Compaction
The sample porosity, φ, at each compaction level can be expressed as:
where is the mass of the disintegrated coal sample, is the sample density and is the original height of the sample, Q is the cross-sectional area of the cylindrical tube, and S is the displacement along the vertical axis.
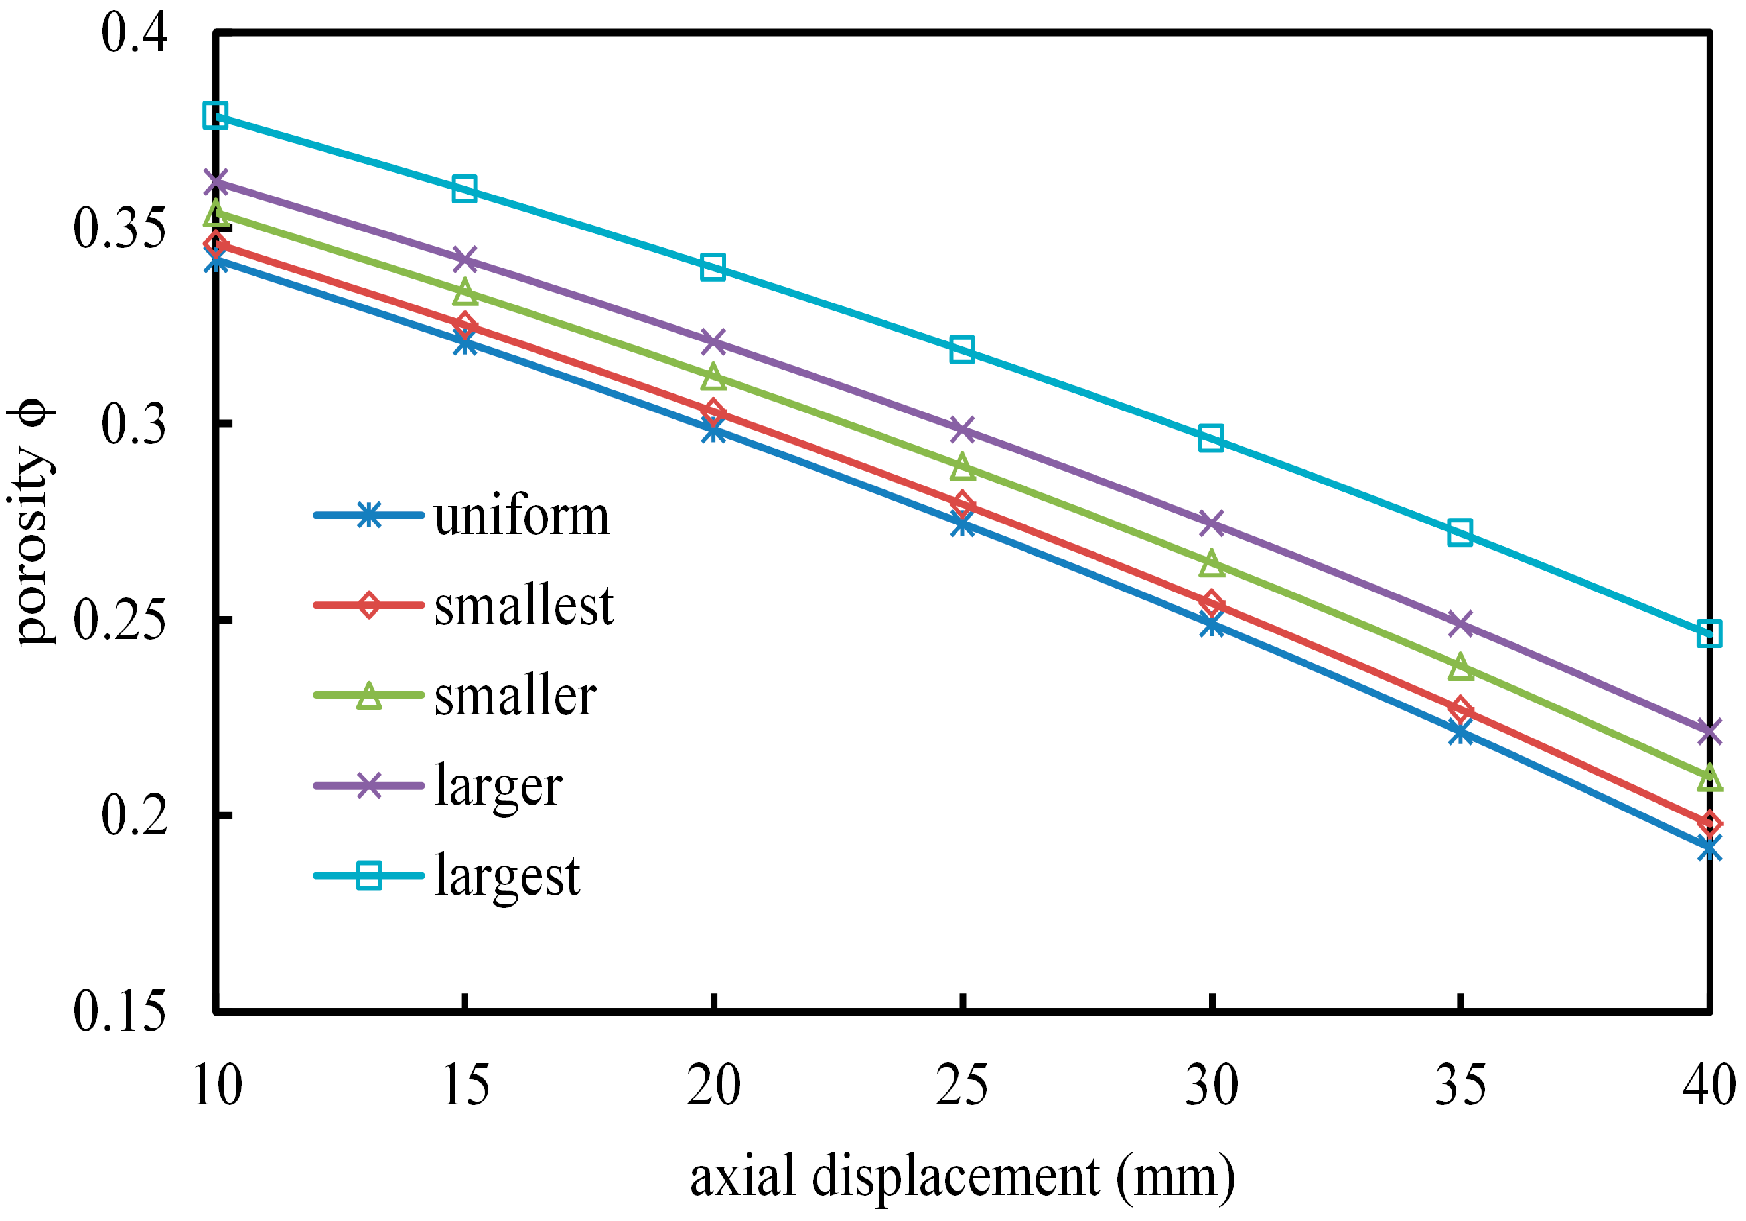
Based on Equation (1), the evolution of porosity values during compaction could be obtained, as summarized in Table 2, based on which the porosity evolution graphs are plotted in Figure 8. The graphs in Figure 8 illustrate that on the whole, the porosity of disintegrated coal is highly affected by the compaction level (axial deformation) and by different mixtures of grain sizes. For the same sample, the porosity reduces with increasing axial deformation, as the voids in the non-cemented coal parts are reduced during compaction. At the same compaction level (i.e., axial deformation), the porosity increases with increasing grain sizes. The largest sample exhibits the maximum porosity value because the volume of voids in the sample with larger fragments is greater than that in the samples with smaller grains. The uniform sample exhibits the minimum porosity value because the smaller grains fill in the void spaces produced by larger fragments, and as a result the grains are closer to each other than in other samples. As Figure 9 shows, the rate of porosity variation in the uniform sample is the most significant, indicating that the grain mixture ratio (original porosity) plays a key role during compression under compaction.
4.2. Non-Darcy Flow Type
There are two methods to show that the flow within the disintegrated coal samples is of a non-Darcy type: (1) when the Reynolds number calculated for the flow within disintegrated coal samples is larger than five; and (2) when the relation between the water pressure gradient and flow rate could be replicated with a second-order function.
4.2.1. Reynolds Number Calculation
It has been shown that Forchheimer equation [30] provides good estimates of seepage flow within disintegrated hard non-cemented rocks, (e.g., [4,28]); therefore, it was used to model flow in this study. According to this method, for a non-Darcy seepage flow in one dimension, the correlation between pressure variations and flow rate can be defined as:
where , and are pore pressure gradient, pore pressure and dimensional variable, respectively, is water density, is water viscosity (equal to ), is sample permeability, is the average flow rate and is a non-Darcy factor. For the flow to be of Darcy type, should be almost equal to zero. Equation (2) could be applied to match the water seepage in coal samples as described below [41,51,52]. In this case, the Reynolds number (Re) can be expressed as:
where is a characteristic size, in this test, for non–consolidated non-cemented coal, the value for can be considered as the average diameter of the grains. As mentioned before, the seepage rate, , can be regulated by maintaining a constant deformation through the loading ram.
A previous study has shown that the upper limit of Re that is applicable for Darcy flow is 5, and this limiting value is only moderately different [53] for various porous media. As summarized in Table 2, the minimum and maximum porosity values are found to be 0.192 and 0.379, respectively. In the tests, the minimum and maximum flow velocities were measured as and , respectively. Taking the value of d within the range of 2.5 to 20 mm, and porosity values between 0.192 and 0.379, from Equation (3) we have:
Thus, Re values for the flow with the coal samples are between 0.37 and 20.2 as the minimum and maximum values, respectively. Therefore it is possible for the Re to be greater than 5, which means that in particular scenarios the non-Darcy seepage flow could be expected.
4.2.2. Relationship of Flow Rate and Water Pressure Gradient
The water pressure gradient, , does not change if the variables on the right hand side of Equation (2) are constant with regards to . In this case the pressure gradient can be verified from the pressure differences at the top and bottom boundaries of the sample. The bottom end of the specimen was linked with the atmosphere, i.e., , in this case:
where is the length of the coal sample. For the majority steady state flow, when the seepage flow is upward in vertical direction, , we have:
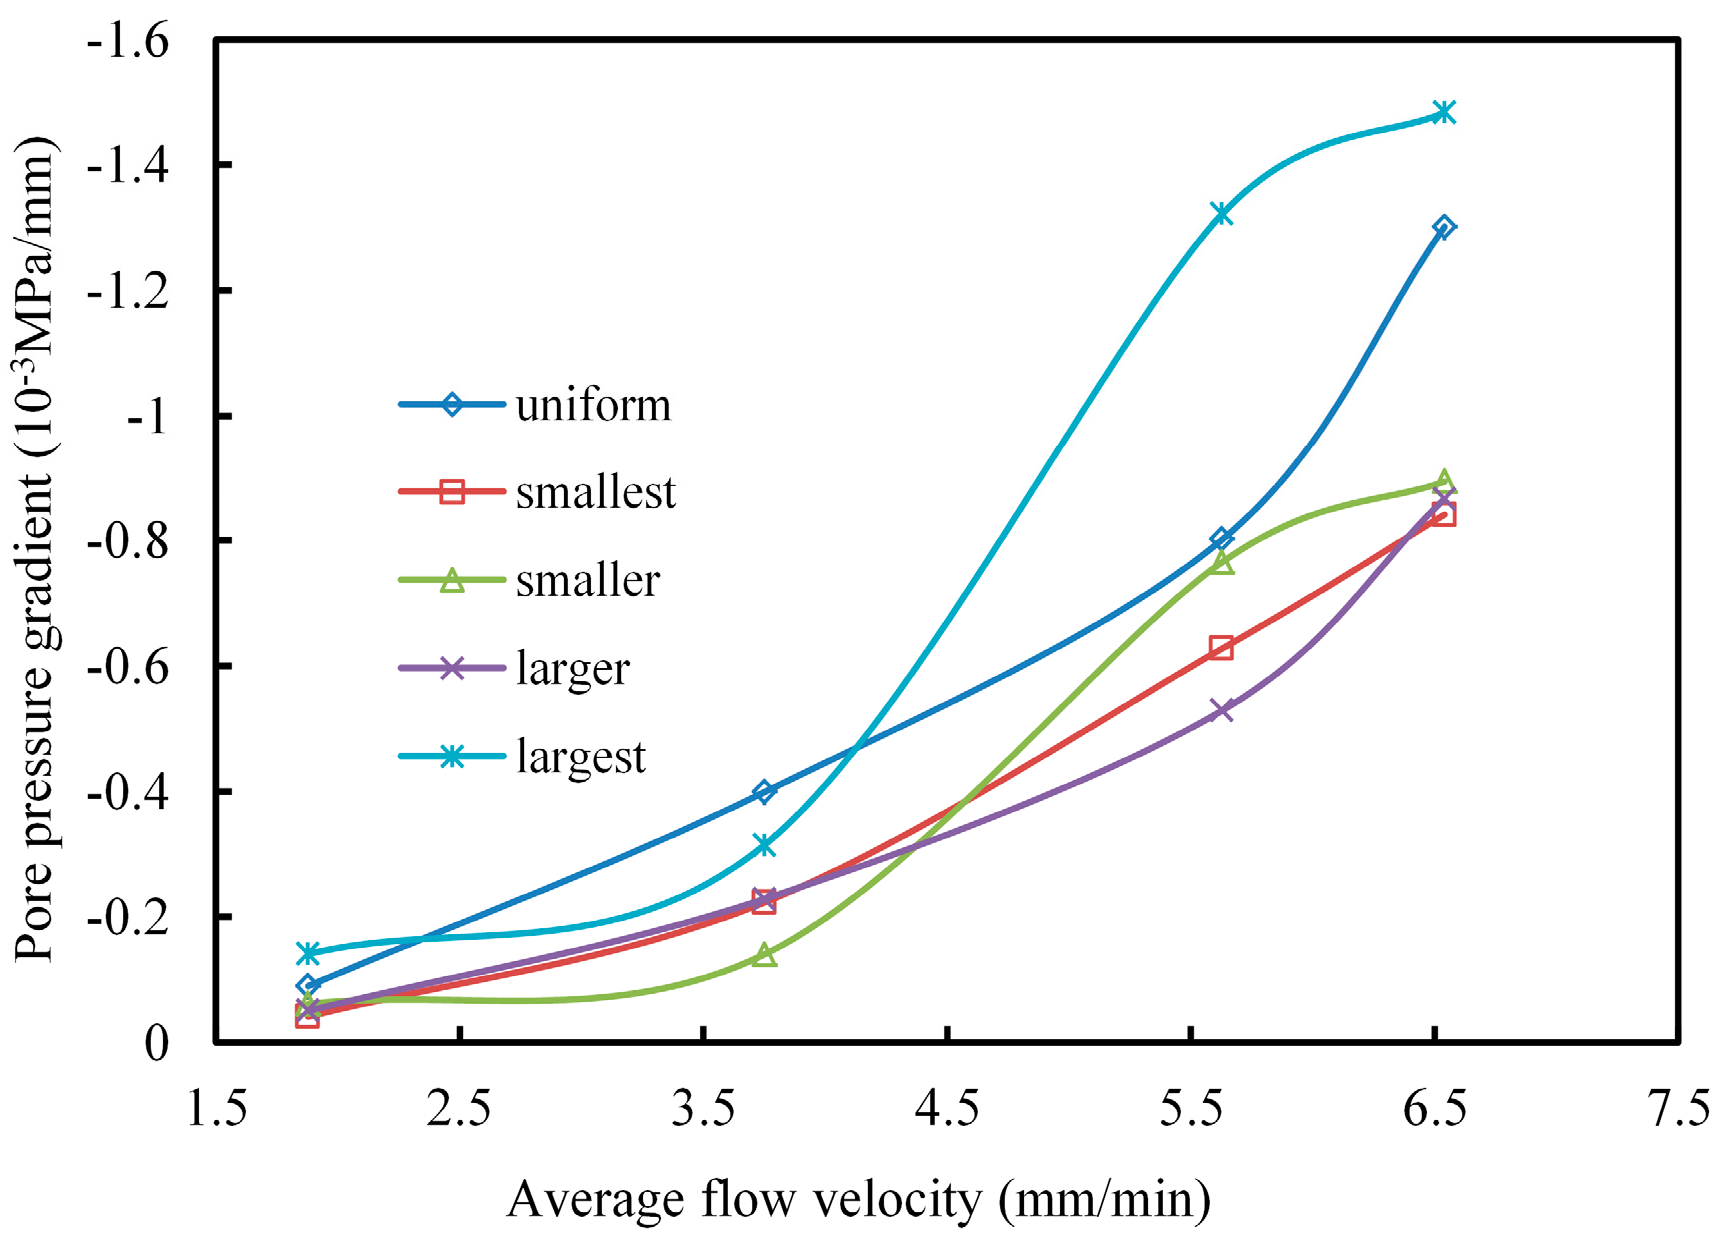
Figure 10 and Figure 11 illustrate that the hydraulic properties of non-cemented coal are highly affected by axial displacements and different mixtures of grain sizes. Generally, the pressure gradients versus flow rate plots are nonlinear and can be fitted by second-order relationship, which demonstrates that the second-order relationship, i.e., Equation (2), could be used to match the seepage flow in non-cemented coal during compaction.
4.3. Grain Mixture Alterations during the Tests
Using the sieving machine (Figure 4), the weights of the different grain size ranges in the samples were determined for both before and after the testing (seepage and compaction), and the values are summarized in Table 3.
According to the data in Table 3 and Figure 12, that shows the mass change variations following the tests, it is seen that compared with the original mass distributions, for all of the samples the proportions of the largest grains (15–20 mm) decreased after the completion of experiments. The decreased values indicate that, during compaction, the largest grains were broken into smaller particles. The weights of the medium grain sizes, (i.e., 5–10 mm and 10–15 mm) after compaction were almost unchanged, which means that during compaction the influence of grain crushing on the amount of medium size grains were very small. However, after the compaction in all samples there were more grains with the smallest sizes (2.5–5 mm), which suggested that under the compaction part of the largest grain constituents of the samples (15–20 mm) were broken into smaller ones, increasing the total weight of grains within the size ranges of 2.5–5 mm and 5–10 mm.
During compaction, some of the larger grains were broken into fine grains, which included particles within the size range of 0–2.5 mm. Water flow through the sample transported out some of the fine grains which was evident from the weight losses observed (see Figure 13). The weight of the fine grains component is highest for the smallest sample, which could be due to easy crushing of 2.5–5 mm grains into fine particles. The weight loss is the least for the largest specimen, as it is more difficult for the larger grains to be broken into fine particles. Because, compared to others, the smallest specimen contained more of the smallest grain sizes (2.5–5 mm), the transport of fine grains in this specimen was more pronounced.
4.4. Non-Darcy Flow Characteristics
The values of and β were evaluated from the relationship between the pressure gradient and the seepage rate. For a set of seepage velocities and the corresponding steady state pressure gradients , the values of and β could be calculated from:
where is the total number of the test flow for each sample, , in these experiments .
Using Equations (7) and (8), the non-Darcy seepage parameters (i.e., k and β) during compaction were calculated and the results are summarized in Table 4. Figure 14 shows the plots of k and β variation with porosity, φ, changes which also provide the comparison of the hydraulic properties of five different non-cemented coal samples with dissimilar grain size mixtures. The figure also shows that during compaction, the value of k increases while that of β decreases with increasing porosity. However, during loading, as the result of the breakage of corners and edges of the grains and the readjustment of the specimens structure, the fracture apertures become more erratic; therefore, both the curves for k-φ and β-φ relationships display some irregular fluctuations; for example, k for the smallest sample in Figure 14a, β for the smallest sample in Figure 14a and the smaller sample in Figure 14b, exhibit local fluctuations, when porosity is between 0.2 and 0.3.
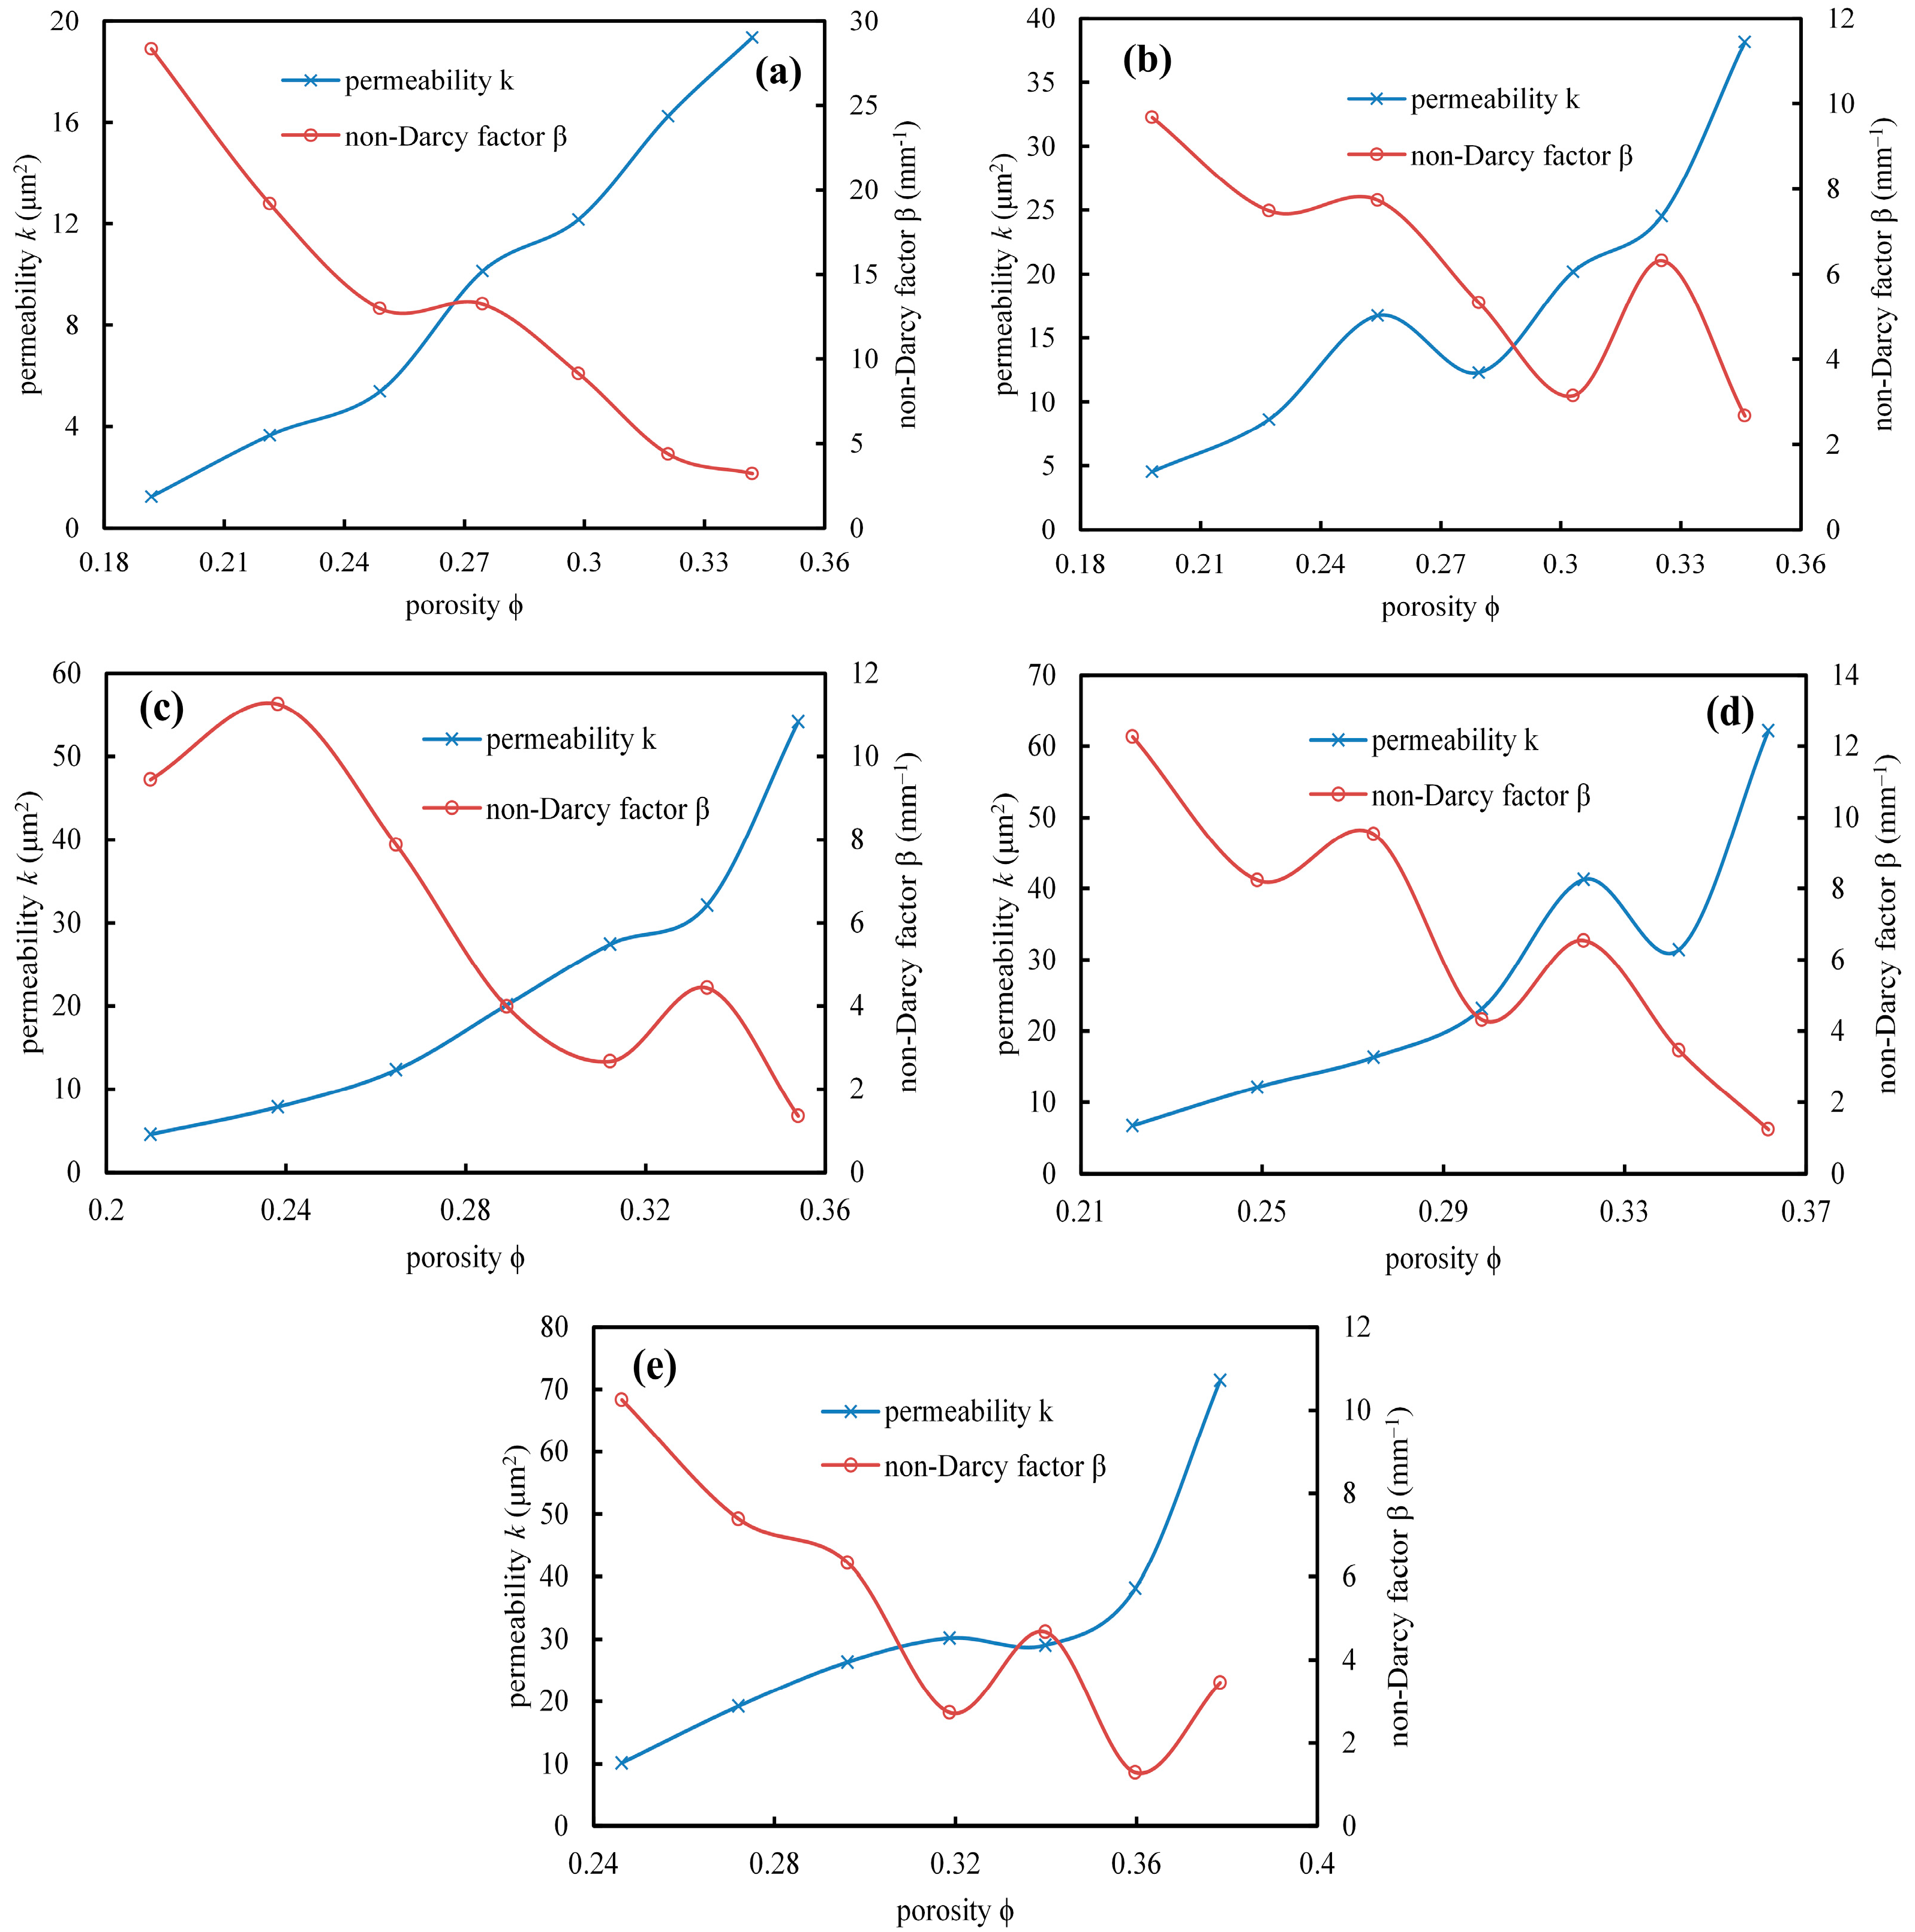
The plots of k and β and their variations with φ for different mixture of grains are shown in Figure 15. Generally, the larger the grain sizes in the sample, the greater the permeability value of the sample is due to the larger pores; this also indicates pore and crack closure and narrowing are easier in coal samples with larger grains, e.g., as displayed in Figure 15e, the permeability k of the largest sample is about four times greater than that of the uniform sample in Figure 15a; while, at the same time the non-Darcy factor β value is on average about four times smaller. Evidently, the uniform sample exhibits the minimum permeability value (see Figure 15a), which is mainly because the smaller grains tend to clog the voids of the larger ones, causing the porosity of the sample to be less than that of the others, and in turn results in the minimum value for permeability and the maximum value for the non-Darcy factor β. Furthermore, the variation of k has an opposite trend when compared with β. That means non-Darcy behavior could reduce the hydraulic conductivity of the effective porosity of non-cemented coal samples.
The closure of pores and cracks and the narrowing of the flow channels under compression surely contribute to the reduction of the permeability and increase in the value of β; however, there could be localized cases where anomalous rises in value of k are observed during certain fluctuations, which are most likely the result of clogging of large grains in broadened cracks that in turn accelerate seepage. At certain axial deformations (15 and 20 mm), secluded fractures can expand and join the main interconnected fracture network of the porous medium, consequently at this critical deformation there will be significant sudden increase in permeability. Samples with larger gains, in comparison to samples with smaller particles, seem to show a less notable critical deformation. A possible reason for this could be that samples with larger grain sizes have significantly more effective fractures as flow pathways that their closure and narrowing upon undergoing axial deformation result in more pronounced reduction of permeability. The fluctuations of non-Darcy factor β in uniform sample show slighter than that in other samples; while the fluctuations in smaller and larger samples shows greatest. This is mainly because non-Darcy flow behavior has slightest effect in uniform grain size but greatest effect in middle grains. In short, the hydraulic properties of disintegrated coal samples are related not only to the loading levels (porosity), grain mixture, but also to grain arrangement.
In saturated ground, the disintegrated coal seam, due to their high permeability, usually form a water-bearing layer, i.e., an aquifer (e.g., [44,54]). The test results in this study showed that at a high compaction levels, the porosity of crushed and disintegrated coal decreases significantly, that results in considerable drop of the permeability value (e.g., about 16 times for uniform sample when porosity decreased from 0.34 to 0.19). Therefore, disintegrated coal seam in the ground form aquiclude (water-resisting) layers (e.g., [55]), which can be useful for groundwater protection as well as prevention of mining-induced groundwater influx.
5. Conclusions
A series of tests using an in-house developed water seepage flow apparatus was carried out to study the influence of grain size mixture on the flow and compaction characteristics of non-cemented coal. The following conclusions can be made: evaluation of the Reynolds number for the test samples and the relationship between the water flow velocities and pore pressure gradient differences showed that the flow of water in non-cemented coal samples is of a non-Darcy nature, and best described by the Forchheimer equation, (i.e., Equation (2)). Generally, the porosity of non-cemented coal is highly related to the compaction (axial deformation) level, as well as to the grain sizes. The porosity decreases with increasing axial displacement and decreasing grain sizes. Water flow through the samples prompts the washing away of some fine grains which in turn causes the weight loss of coal samples. Some of the larger grains (15–20 mm and 10–15 mm) are broken into fine particles (0–2.5 mm) during compaction. The hydraulic properties (k and β) of non-cemented coal samples are highly affected by the grain sizes in the sample mixture and the compaction level. Generally, during compaction, k decreases while β increases with decreasing φ. The k-φ and β-φ plots display that the larger the grain sizes, the less oscillation is observed in the values of hydraulic properties. The permeability, k, of the sample with largest grains is four times greater than that of the sample with smallest grains. This is mainly because the samples with larger grains have many more effective pores and cracks that are filled in or closed while undergoing compression, resulting in lower permeability values for non-cemented samples (that are also producing small grains while undergoing compaction). Non-Darcy behavior could reduce the hydraulic conductivity of the effective porosity. In total, the hydraulic properties of the non-cemented coal samples are relative to their compaction levels, their grain mixture sizes, and also to the structure of their grain arrangements. The disintegrated coal seam usually forms subsurface aquifer layers due to their high permeability. At high compaction levels, due to the considerable decrease of the porosity and permeability, water-bearing strata could become water-resisting (aquicluding) strata. Non-Darcy flow behavior has the slightest effect in uniform samples, suggesting that uniform grain size mixtures could become water-resisting aquicluding strata easier than other samples.
Acknowledgments
This work was supported by the National Basic Research Program of China (2013CB227902) and the National Natural Science Foundation of China (51674247 and 51404266). The authors would like to acknowledge M. Rezania from University of Nottingham for his language improvement, as well as the anonymous reviewers for their valuable comments, which have greatly improved this paper.
Author Contributions
Dan Ma, Zilong Zhou and Haibo Bai conceived and designed the experiments; Dan Ma, Jiangyu Wu and Qiang Li performed the experiments; Dan Ma analyzed the data; Dan Ma and Zilong Zhou wrote the paper.
Conflicts of Interest
The authors declare no conflict of interest.
Appendix A
| Average diameter of the grains (L) | Cross section area of cylindrical tube (L2) | ||
| Original height of the coal sample (L) | Reynolds number (-) | ||
| H1 | Height of cylindrical tube (L) | Axial displacement (L) | |
| H2 | Height of plunger (L) | Time (T) | |
| H3 | Thickness of the filter pad (L) | Water flow velocity (L·T−1) | |
| H4 | Thickness of the porous disk (L) | Vertical axis going through the center of the sample (L) | |
| Spatial indices (-) | Partial differential operator (-) | ||
| Permeability (L2) | Nabla operator (L−1) | ||
| Sample length (L) | β | Non-Darcy factor (L−1) | |
| Mass of the coal sample (M) | Viscosity (L2·T−1) | ||
| Pore pressure (mL−1·T−2) | Porosity (-) | ||
| Pore pressure at the intake boundary (mL−1·T−2) | Coal mass density (mL−3) | ||
| Pore pressure connected with the atmosphere (mL−1·T−2) | Water density (mL−3) |
References
- Yin, S.X.; Zhang, J.C.; Liu, D.M. A study of mine water inrushes by measurements of in situ stress and rock failures. Nat. Hazards 2015, 79, 1961–1979. [Google Scholar] [CrossRef]
- Zhang, J.C.; Peng, S.P. Water inrush and environmental impact of shallow seam mining. Environ. Geol. 2005, 48, 1068–1076. [Google Scholar] [CrossRef]
- Ma, D.; Miao, X.X.; Bai, H.B.; Huang, J.H.; Pu, H.; Wu, Y.; Zhang, G.M.; Li, J.W. Effect of mining on shear sidewall groundwater inrush hazard caused by seepage instability of the penetrated karst collapse pillar. Nat. Hazards 2016, 82, 73–93. [Google Scholar] [CrossRef]
- Ma, D.; Miao, X.X.; Bai, H.B.; Pu, H.; Chen, Z.Q.; Liu, J.F.; Huang, Y.H.; Zhang, G.M.; Zhang, Q. Impact of particle transfer on flow properties of crushed mudstones. Environ. Earth Sci. 2016, 75, 593. [Google Scholar] [CrossRef]
- Zhang, B.Y.; Bai, H.B.; Zhang, K. Seepage characteristics of collapse column fillings. Int. J. Min. Sci. Technol. 2016, 26, 333–338. [Google Scholar] [CrossRef]
- Zhang, J.; Li, M.; Liu, Z.; Zhou, N. Fractal characteristics of crushed particles of coal gangue under compaction. Powder Technol. 2017, 305, 12–18. [Google Scholar] [CrossRef]
- Hamdani, I.H. Optimum moisture content for compacting soils one-point method. J. Irrig. Drain. Eng. 1983, 109, 232–237. [Google Scholar] [CrossRef]
- Cho, G.C.; Dodds, J.; Santamarina, J.C. Particle shape effects on packing density, stiffness, and strength: natural and crushed sands. J. Geotech. Geoenviron. Eng. 2006, 132, 591–602. [Google Scholar] [CrossRef]
- Fredlund, D.G.; Morgenstern, N.R.; Widger, R.A. The shear strength of unsaturated soils. Can. Geotech. J. 1978, 15, 313–321. [Google Scholar] [CrossRef]
- Wang, J.J.; Zhao, D.; Liang, Y.; Wen, H.-B. Angle of repose of landslide debris deposits induced by 2008 Sichuan Earthquake. Eng. Geol. 2013, 156, 103–110. [Google Scholar] [CrossRef]
- Yan, Z.L.; Wang, J.J.; Chai, H.J. Influence of water level fluctuation on phreatic line in silty soil model slope. Eng. Geol. 2010, 113, 90–98. [Google Scholar] [CrossRef]
- Coop, M.R.; Sorensen, K.K.; Freitas, T.B.; Georgoutsos, G. Particle breakage during shearing of a carbonate sand. Geotechnique 2004, 54, 157–163. [Google Scholar] [CrossRef]
- Casini, F.; Viggiani, G.M.B. Experimental investigation of the evolution of grading of an artificial material with crushable grains under different loading conditions. In Proceedings of the 5th International Symposium on Deformation Characteristics of Geomaterials, Seoul, Korea, 1–3 September 2011. [Google Scholar]
- Zhou, Z.; Cai, X.; Cao, W.; Li, X.; Xiong, C. Influence of water content on mechanical properties of rock in both saturation and drying processes. Rock Mech. Rock Eng. 2016, 49, 3009–3025. [Google Scholar] [CrossRef]
- Zhou, Z.; Cai, X.; Chen, L.; Cao, W.; Zhao, Y.; Xiong, C. Influence of cyclic wetting and drying on physical and dynamic compressive properties of sandstone. Eng. Geol. 2017, 220, 1–12. [Google Scholar] [CrossRef]
- Yan, K.Z.; Xu, H.B.; Shen, G.H. Novel approach to resilient modulus using routine subgrade soil properties. Int. J. Geomech. 2014, 14, 04014025. [Google Scholar] [CrossRef]
- Casini, F.; Viggiani, G.M.B.; Springman, S.M. Breakage of an artificial crushable material under loading. Granul. Matter 2013, 15, 661–673. [Google Scholar] [CrossRef]
- Silveira, A.; de Lorena Peixoto, T.; Nogueira, J. On void size distribution of granular materials. In Proceedings of the 5th Pan-American Conference on Soil Mechanics and Foundation Engineering, Buenos Aires, Argentina, 17–22 November 1975; pp. 161–176. [Google Scholar]
- Sherard, J.L.; Dunnigan, L.P. Filters and leakage control in embankment dams. In Proceedings of the Symposium on Seepage and Leakage from Dams and Impoundments, Denver, CO, USA, 5 May 1985; pp. 1–30. [Google Scholar]
- Indraratna, B.; Locke, M.R. Design methods for granular filters—Critical review. Geotech. Eng. 1999, 137, 137–147. [Google Scholar] [CrossRef]
- Zareifard, M.; Fahimifar, A. Elastic-brittle-plastic analysis of circular deep underwater cavities in a Mohr-Coulomb rock mass considering seepage forces. Int. J. Geomech. 2014, 15, 04014077. [Google Scholar] [CrossRef]
- Wang, D.Y.; Gao, Z.R.; Lee, J.L.; Gao, W.S. Assessment and optimization of soil mixing and umbrella vault applied to a cross-passage excavation in soft soils. Int. J. Geomech. 2014, 14, 0000374. [Google Scholar] [CrossRef]
- Shahriar, M.A.; Sivakugan, N.; Das, B.M.; Urquhart, A.; Tapiolas, M. Water table correction factors for settlements of shallow foundations in granular soils. Int. J. Geomech. 2015, 15, 06014015. [Google Scholar] [CrossRef]
- Turner, D.; Nakshatrala, K.; Martinez, M. Framework for coupling flow and deformation of a porous solid. Int. J. Geomech. 2014, 14, 04014076. [Google Scholar] [CrossRef]
- Ghabchi, R.; Zaman, M.; Kazmee, H.; Singh, D. Effect of shape parameters and gradation on laboratory-measured permeability of aggregate bases. Int. J. Geomech. 2014, 14, 04014070. [Google Scholar] [CrossRef]
- Engelhardt, I.; Finsterle, S. Thermal-hydraulic experiments with bentonite/crushed rock mixtures and estimation of effective parameters by inverse modeling. Appl. Clay Sci. 2003, 23, 111–120. [Google Scholar] [CrossRef]
- Legrand, J. Revisited analysis of pressure drop in flow through crushed rocks. J. Hydraul. Eng. 2002, 128, 1027–1031. [Google Scholar] [CrossRef]
- Ma, D.; Miao, X.X.; Jiang, G.H.; Bai, H.B.; Chen, Z.Q. An experimental investigation of permeability measurement of water flow in crushed rocks. Transp. Porous Media 2014, 105, 571–595. [Google Scholar] [CrossRef]
- Guida, G.; Bartoli, M.; Casini, F.; Viggiani, G.M. Weibull distribution to describe grading evolution of materials with crushable grains. Proced. Eng. 2016, 158, 75–80. [Google Scholar] [CrossRef]
- Whitaker, S. The Forchheimer equation: A theoretical development. Transp. Porous Media 1996, 25, 27–61. [Google Scholar] [CrossRef]
- Liu, X.H.; Xu, G.W.; Gao, S.Q. Fluidization of extremely large and widely sized coal particles as well as its application in an advanced chain grate boiler. Powder Technol. 2008, 188, 23–29. [Google Scholar] [CrossRef]
- Slezak, A.; Kuhlman, J.M.; Shadle, L.J.; Spenik, J.; Shi, S.P. CFD simulation of entrained-flow coal gasification: Coal particle density/size fraction effects. Powder Technol. 2010, 203, 98–108. [Google Scholar] [CrossRef]
- Li, Y.F.; Zhao, W.D.; Xu, S.H.; Xia, W.C. Changes of size, ash and density of coal particles on the column axis of a liquid–solid fluidized bed. Powder Technol. 2013, 245, 251–254. [Google Scholar] [CrossRef]
- Gao, J.H.; Liu, J.X.; Gao, J.M.; Du, Q.; Wang, X.F.; Wu, S.H. Modelling and experimental study on agglomeration of particles from coal combustion in multistage spouted fluidized tower. Adv. Powder Technol. 2009, 20, 375–382. [Google Scholar] [CrossRef]
- He, J.F.; Zhao, Y.M.; He, Y.Q.; Luo, Z.F.; Duan, C.L. Force characteristic of the large coal particle moving in a dense medium gas-solid fluidized bed. Powder Technol. 2014, 254, 548–555. [Google Scholar] [CrossRef]
- Liu, J.X.; Jiang, X.M.; Shen, J.; Zhang, H. Influences of particle size, ultraviolet irradiation and pyrolysis temperature on stable free radicals in coal. Powder Technol. 2015, 272, 64–74. [Google Scholar] [CrossRef]
- Ma, D.; Li, Q.; Hall, M.R.; Wu, Y. Experimental investigation of stress rate and grain size on gas seepage characteristics of granular coal. Energies 2017, 10, 527. [Google Scholar] [CrossRef]
- Liu, J.; Wang, J.; Chen, Z.; Wang, S.; Elsworth, D.; Jiang, Y. Impact of transition from local swelling to macro swelling on the evolution of coal permeability. Int. J. Coal Geol. 2011, 88, 31–40. [Google Scholar] [CrossRef]
- Wang, S.; Elsworth, D.; Liu, J. Permeability evolution in fractured coal: The roles of fracture geometry and water-content. Int. J. Coal Geol. 2011, 87, 13–25. [Google Scholar] [CrossRef]
- Han, F.; Busch, A.; van Wageningen, N.; Yang, J.; Liu, Z.; Krooss, B.M. Experimental study of gas and water transport processes in the inter-cleat (matrix) system of coal: Anthracite from Qinshui Basin, China. Int. J. Coal Geol. 2010, 81, 128–138. [Google Scholar] [CrossRef]
- Ma, D.; Bai, H.B.; Chen, Z.Q.; Pu, H. Effect of particle mixture on seepage properties of crushed mudstones. Transp. Porous Media 2015, 108, 257–277. [Google Scholar] [CrossRef]
- Peng, S.S. Coal Mine Ground Control, 3rd ed.; Society for Mining Metallurgy: Morgantown, VA, USA, 2008. [Google Scholar]
- Pappas, D.M.; Mark, C. Behavior of Simulated Longwall Gob Material, Report of Investigations; US Bureau of Mines: Pittsburgh, PA, USA, 1993. [Google Scholar]
- Bai, H.B.; Ma, D.; Chen, Z.Q. Mechanical behavior of groundwater seepage in karst collapse pillars. Eng. Geol. 2013, 164, 101–106. [Google Scholar] [CrossRef]
- Blodgett, S.; Kuipers, J.R. Underground Hard-Rock Mining: Subsidence and Hydrologic Environmental Impacts; Centre of Science in Public Participation: Bozeman, MT, USA, 2002. [Google Scholar]
- Ma, D.; Rezania, M.; Yu, H.S.; Bai, H.B. Variations of hydraulic properties of granular sandstones during water inrush: Effect of small particle migration. Eng. Geol. 2017, 217, 61–70. [Google Scholar] [CrossRef]
- Singh, M.M. Mine subsidence. In SME Mining Engineers Handbook; Society for Mining, Metallurgy, and Exploration, Inc.: LitUeton, CO, USA, 1992; pp. 938–971. [Google Scholar]
- Li, G.C.; Jiang, Z.H.; Lv, C.X.; Huang, C.; Chen, G.; Li, M.Y. Instability mechanism and control technology of soft rock roadway affected by mining and high confined water. Int. J. Min. Sci. Technol. 2015, 25, 573–580. [Google Scholar] [CrossRef]
- Booth, C.J. The effects of longwall coal mining on overlying aquifers. In Mine Water Hydrogeology and Geochemistry; Younger, P.L., Robins, N.S., Eds.; Geological Society Special Publications: London, UK, 2002; Volume 198, pp. 17–45. [Google Scholar]
- Booth, C.J. Groundwater as an environmental constraint of longwall coal mining. Environ. Geol. 2006, 49, 796–803. [Google Scholar] [CrossRef]
- Chu, T.X.; Yu, M.G.; Jiang, D.Y. Experimental investigation on the permeability evolution of compacted broken coal. Transp. Porous Media 2017, 116, 847–868. [Google Scholar] [CrossRef]
- Ma, D.; Miao, X.X.; Wu, Y.; Bai, H.B.; Wang, J.G.; Rezania, M.; Huang, Y.H.; Qian, H.W. Seepage properties of crushed coal particles. J. Pet. Sci. Eng. 2016, 146, 297–307. [Google Scholar]
- Kong, X.Y. Advanced Mechanics of Fluid in Porous Media, 2nd ed.; Press of University of Science and Technology of China: Hefei, China, 2010. [Google Scholar]
- Lu, H.F.; Yao, D.X.; Shen, D.; Cao, J.Y. Fracture mechanics solution of confined water progressive intrusion height of mining fracture floor. Int. J. Min. Sci. Technol. 2015, 25, 99–106. [Google Scholar] [CrossRef]
- Liu, W.Q.; Fei, X.D.; Fang, J.N. Rules for confidence intervals of permeability coefficients for water flow in over–broken rock mass. Int. J. Min. Sci. Technol. 2012, 22, 29–33. [Google Scholar] [CrossRef]
Figure 1.
MTS815.02 system and a fluid seepage apparatus.

Figure 2.
Testing system for non-cemented coal. Note: A—pressure sensor; B—load controller; C—relief valve; D—regulator; E—pressure difference sensor; F—drainage; S1~S15—switch. 1—valve chest; 2—valve core; 3—mechanical spring; 4—mechanical bolt; 5,11—O—shaped rubber seal rings; 6—cylindrical tube; 7—epoxy resin separation layer; 8,15—filter pad; 9,14—porous disk; 10—piston; 12—loading platen; 13—base plate; and 16—coal sample.
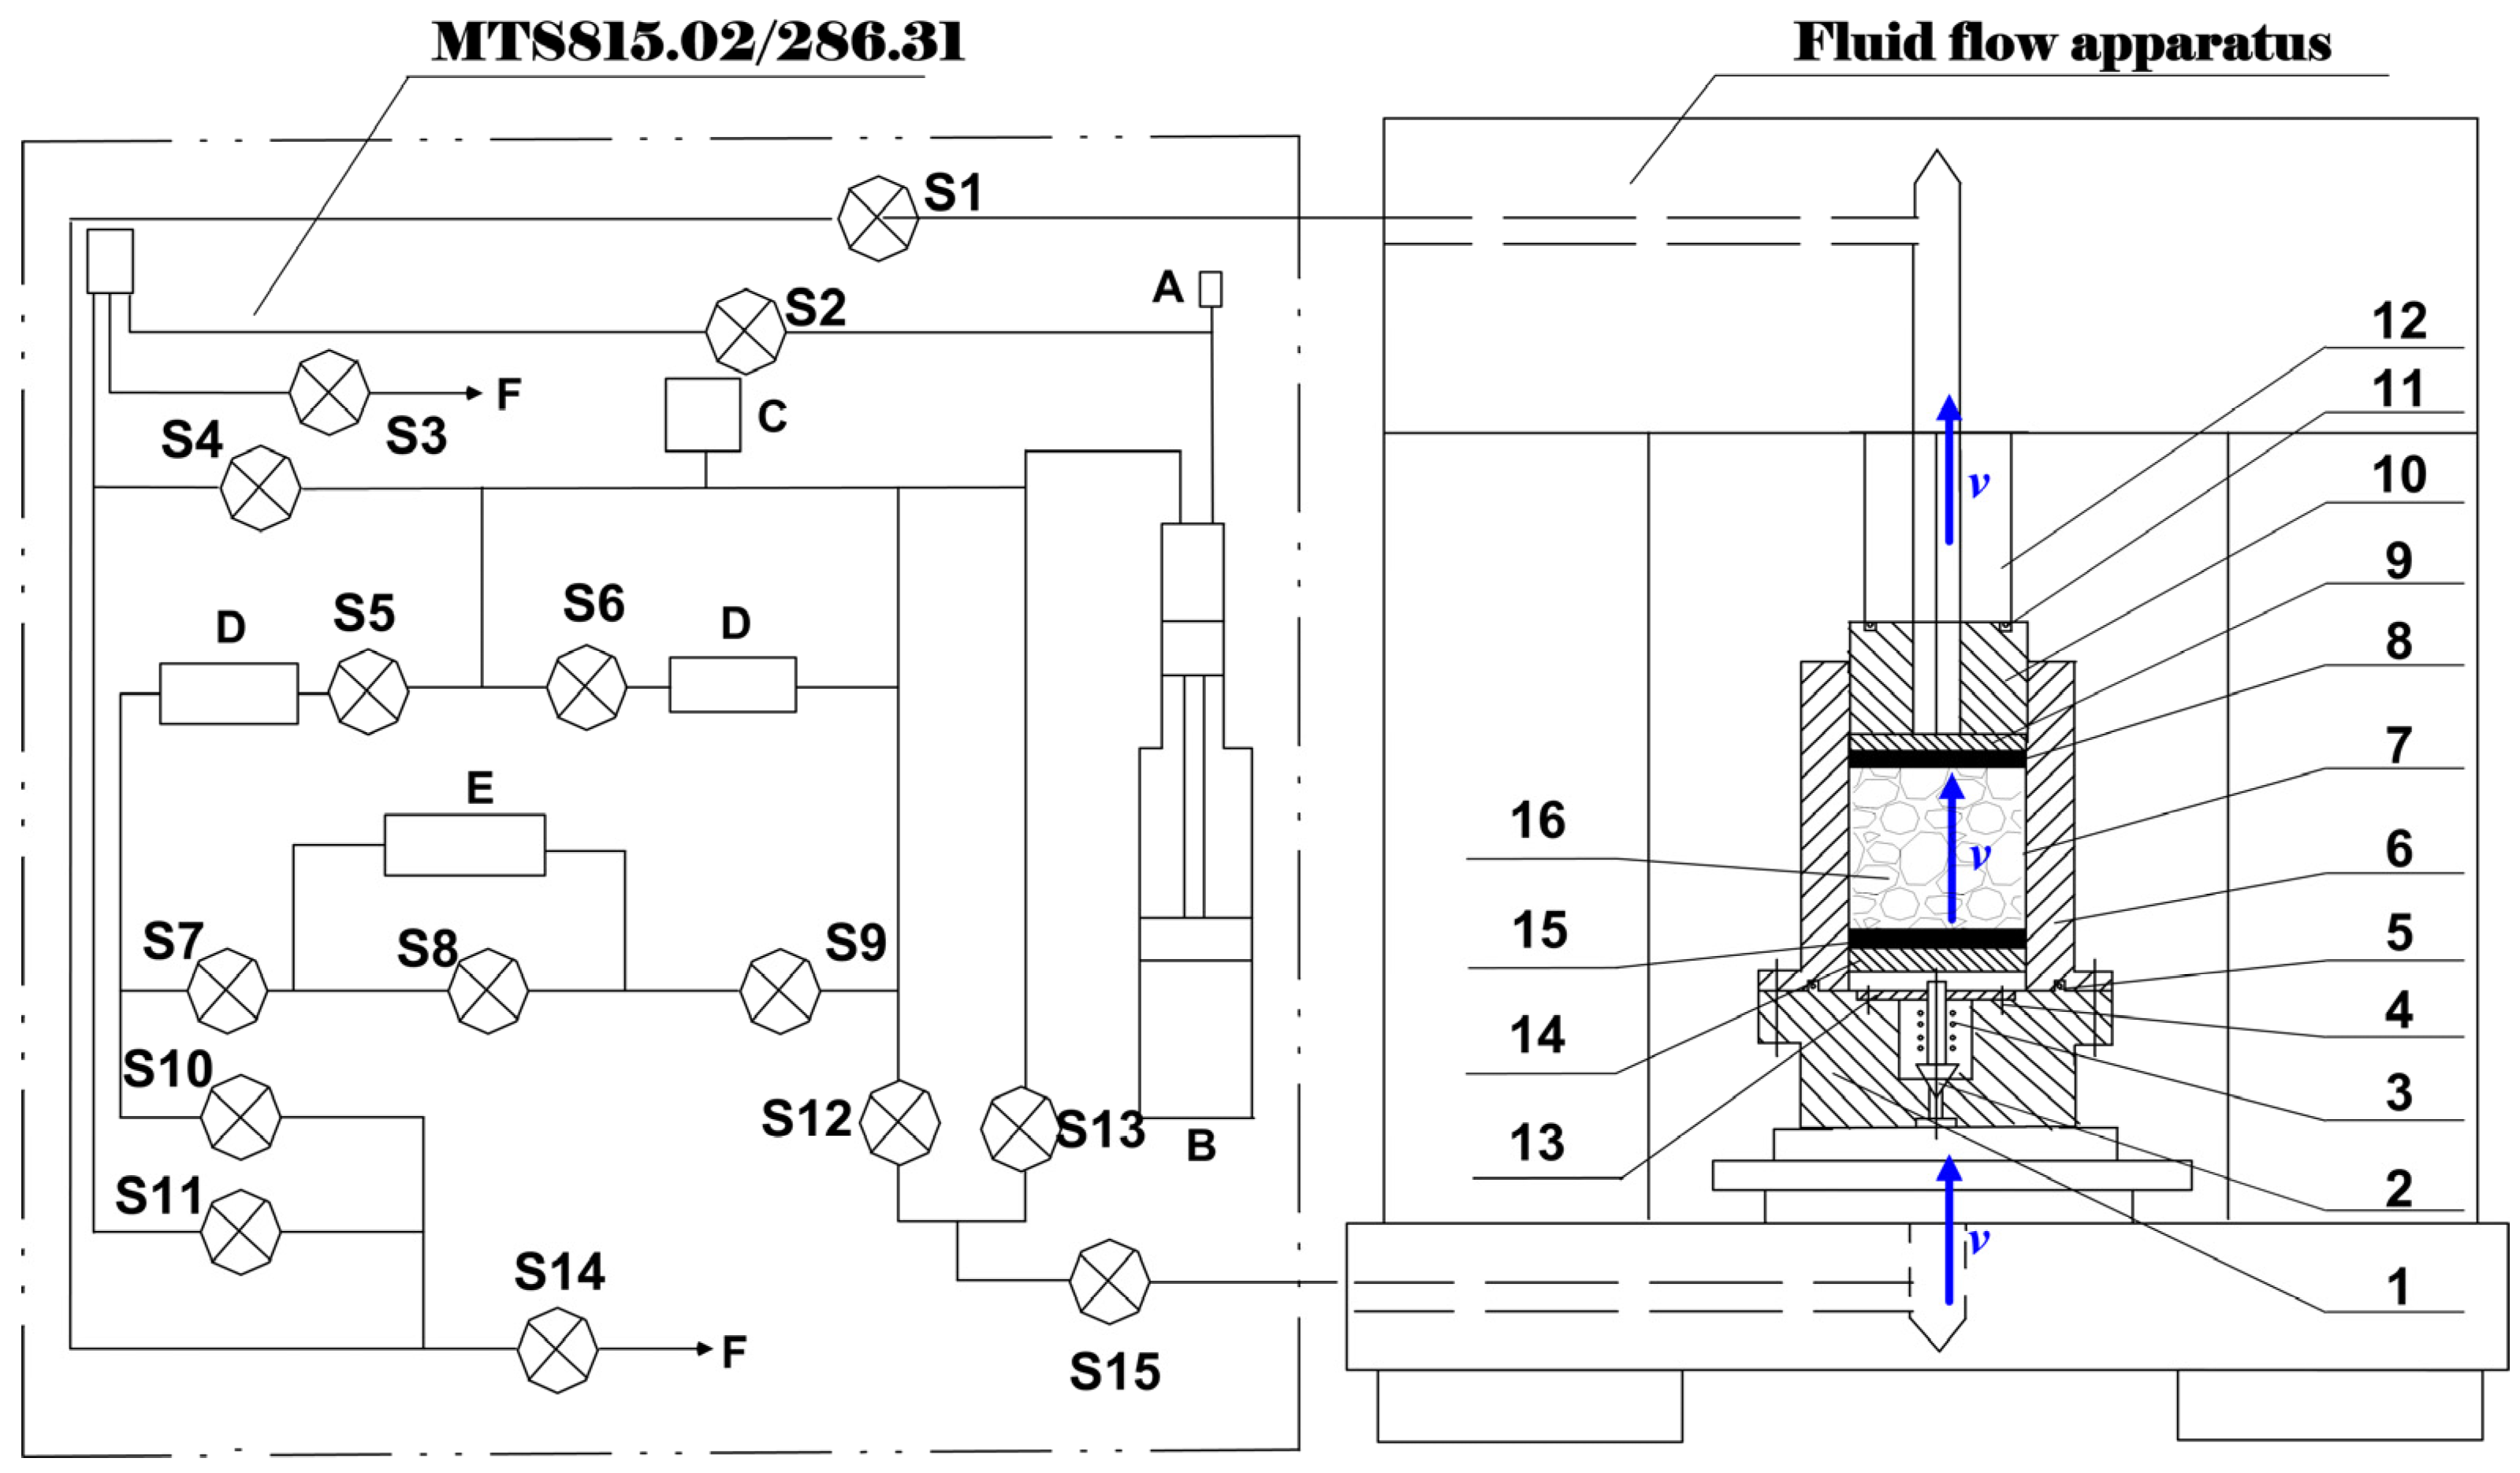
Figure 3.
Four zones of overlying strata above a longwall panel [42].
Figure 3.
Four zones of overlying strata above a longwall panel [42].

Figure 4.
A sieving machine with high frequency vibration: (a) sieve machine; and (b) a 10 mm sieve.
Figure 4.
A sieving machine with high frequency vibration: (a) sieve machine; and (b) a 10 mm sieve.

Figure 5.
Grain size (10–15 mm) of non-cemented coal separated by the sieving machine.

Figure 6.
Sketch calculating the height of the non-cemented coal. Note: H1: height of the cylindrical tube (180 mm); H2: height of the plunger (110 mm); H3: thickness of the filter pad (2 mm); H4: thickness of porous disk (9 mm); H5: height of the plunger head exceeds the cylindrical tube; and h0: original height of the coal sample.

Figure 7.
Testing procedure of the non-cemented coal.

Figure 8.
Porosity of non-cemented coal sample of each axial displacement.

Figure 9.
Porosity change rate of each axial displacement.
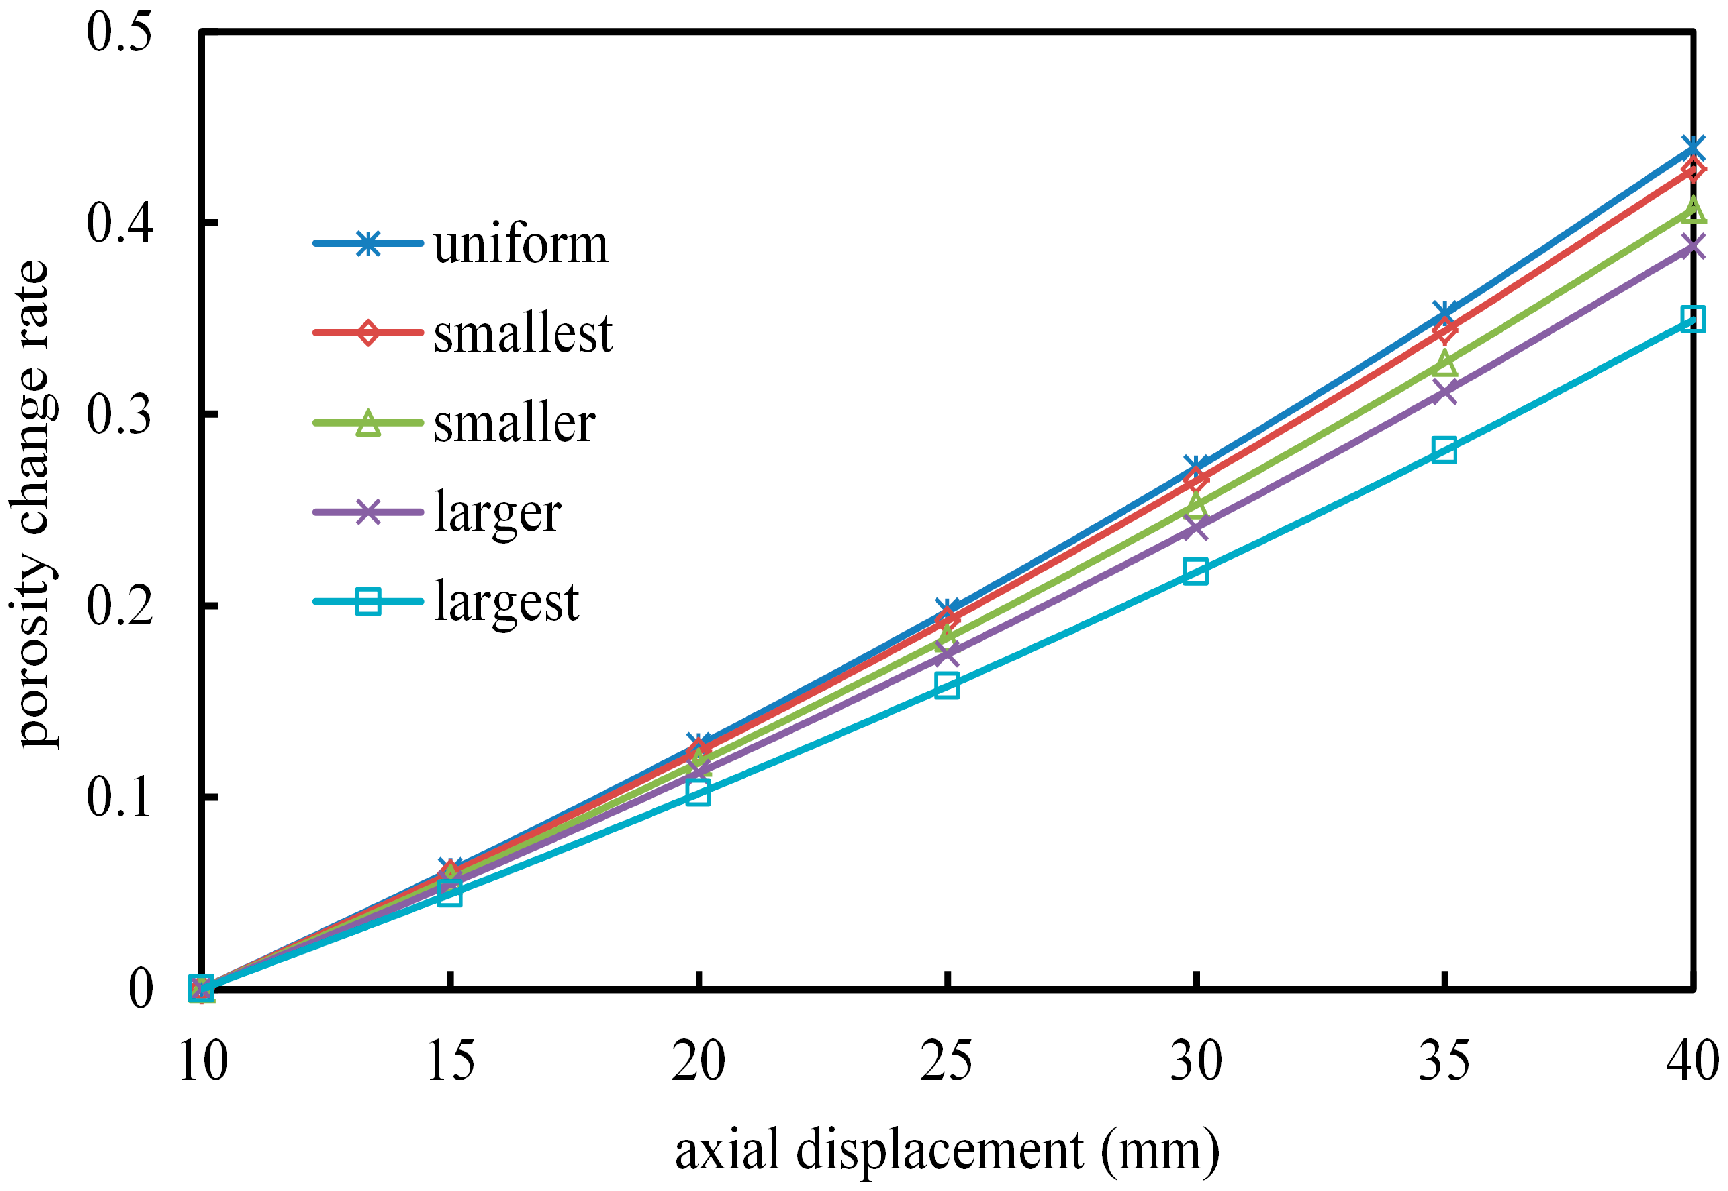
Figure 10.
Relation of pore pressure gradient with flow velocity for the uniform sample.
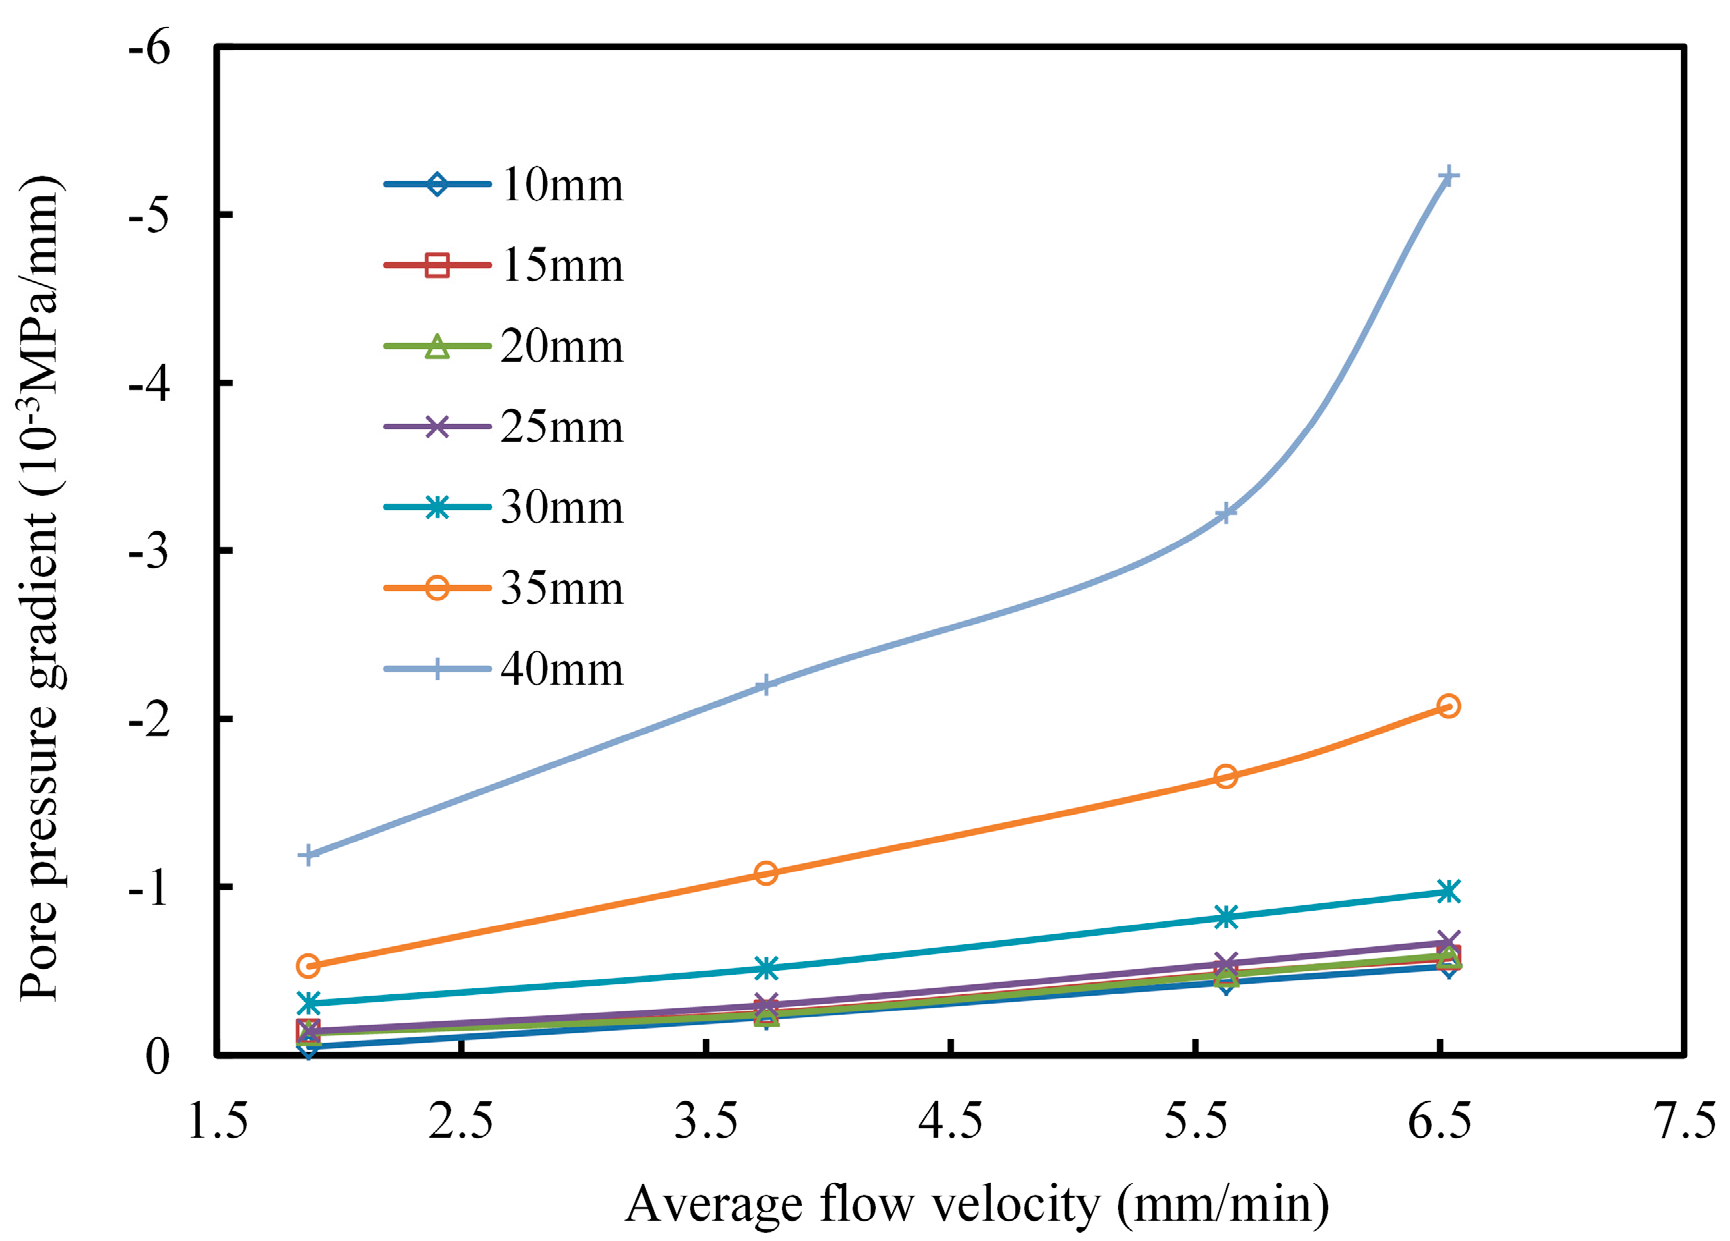
Figure 11.
Relation of pore pressure gradient with flow velocity at axial displacement 10 mm.

Figure 12.
Weight change curves after carrying out the tests (+ means increased, − means loss).
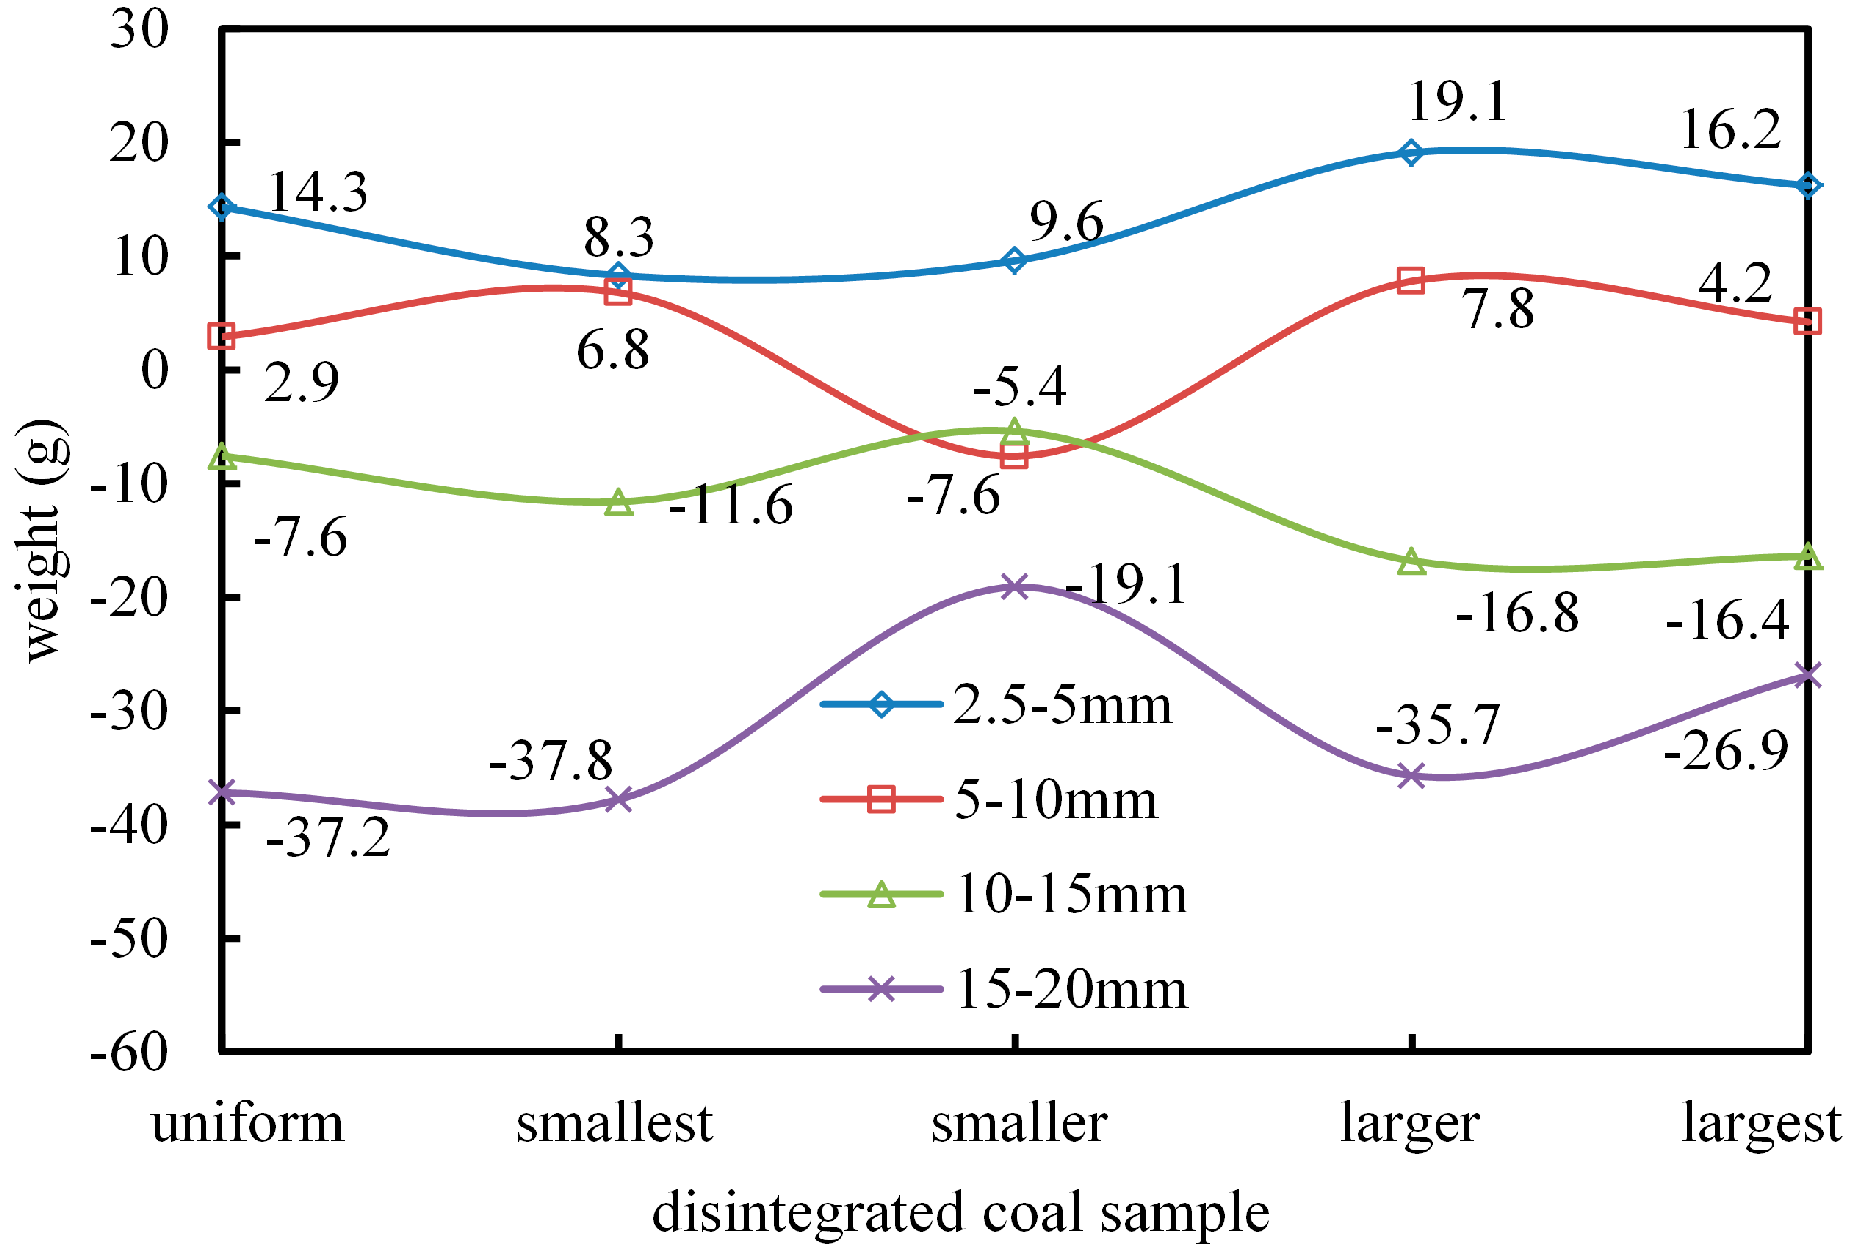
Figure 13.
Weight of the size (0–2.5 mm) and losses after carrying out the tests.
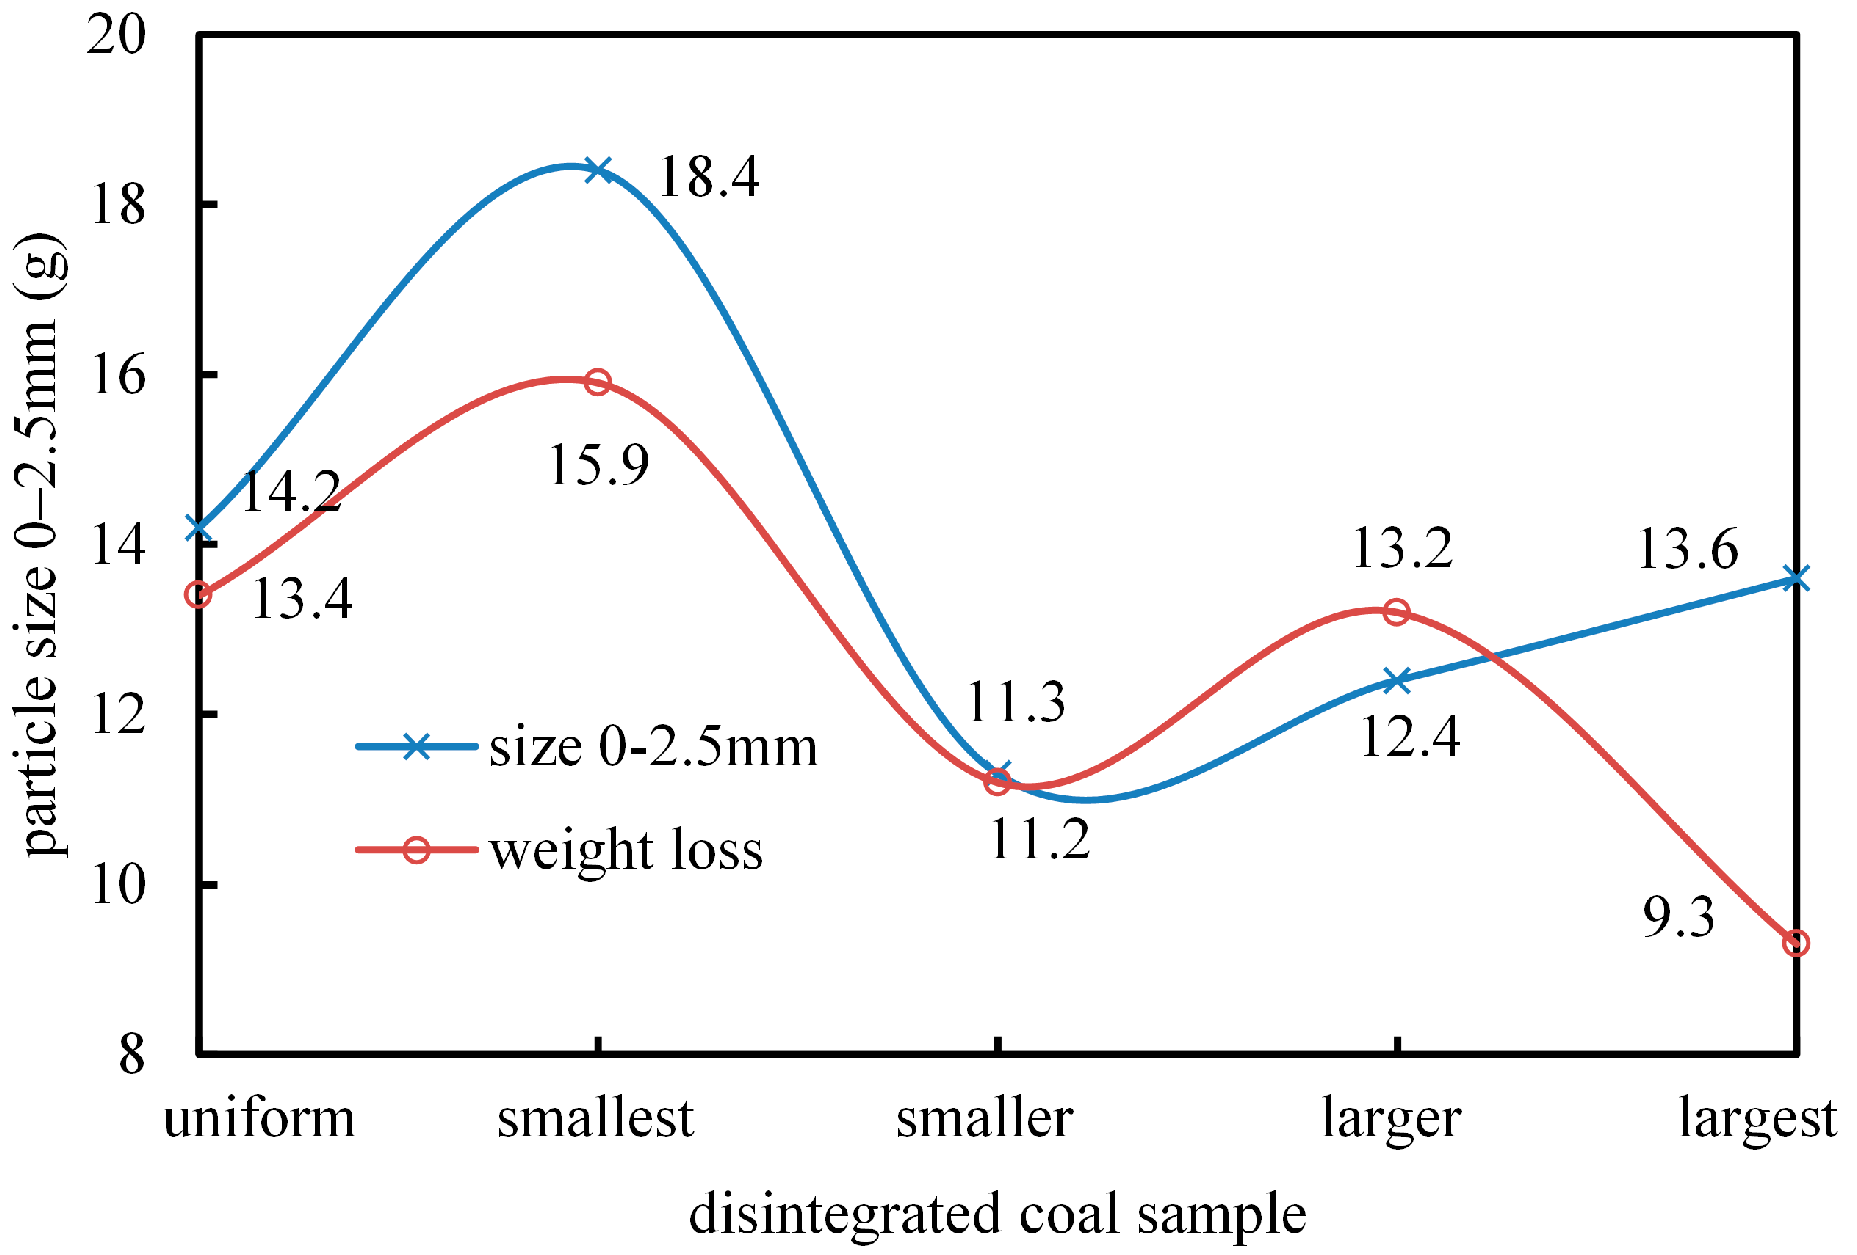
Figure 14.
Comparison of non-Darcy flow characteristics of the five samples: (a) k-φ curves; and (b) β-φ curves.
Figure 14.
Comparison of non-Darcy flow characteristics of the five samples: (a) k-φ curves; and (b) β-φ curves.
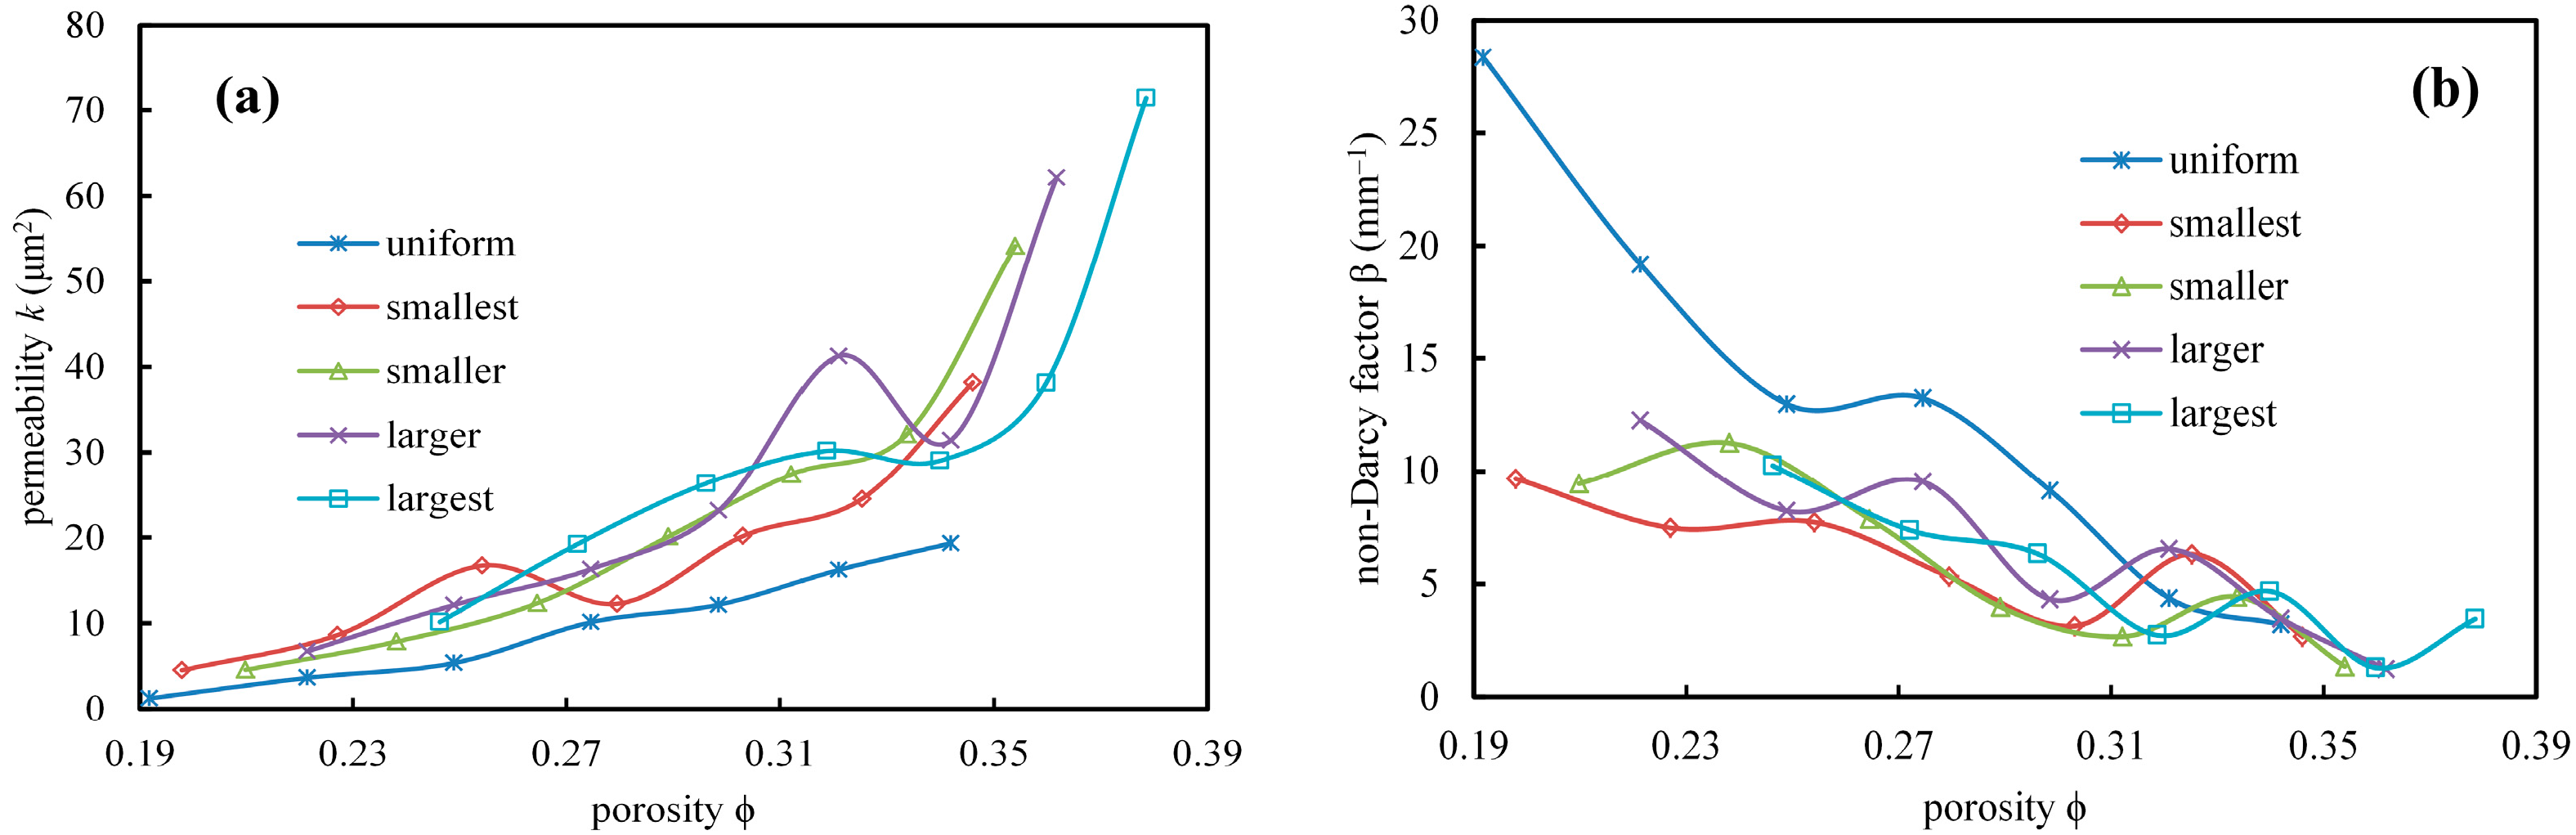
Figure 15.
Non-Darcy flow characteristics for the samples at various porosities: (a) uniform sample; (b) smallest sample; (c) smaller sample; (d) larger sample; and (e) largest sample.
Figure 15.
Non-Darcy flow characteristics for the samples at various porosities: (a) uniform sample; (b) smallest sample; (c) smaller sample; (d) larger sample; and (e) largest sample.

Table 1.
Coal grain size distribution of each sample.
| Sample | Weight Ratio to Each Grain Size | Weight to Each Grain Size (g) | |||
|---|---|---|---|---|---|
| 2.5–5 mm | 5–10 mm | 10–15 mm | 15–20 mm | ||
| Uniform | 1:1:1:1 | 375 | 375 | 375 | 375 |
| Smallest | 2:1:1:1 | 600 | 300 | 300 | 300 |
| Smaller | 1:2:1:1 | 300 | 600 | 300 | 300 |
| Larger | 1:1:2:1 | 300 | 300 | 600 | 300 |
| Largest | 1:1:1:2 | 300 | 300 | 300 | 600 |
Table 2.
Porosity evolution during compaction.
| Sample | Axial Displacement (mm) | ||||||
|---|---|---|---|---|---|---|---|
| 10 | 15 | 20 | 25 | 30 | 35 | 40 | |
| Uniform | 0.342 | 0.321 | 0.299 | 0.275 | 0.249 | 0.221 | 0.192 |
| Smallest | 0.346 | 0.326 | 0.303 | 0.279 | 0.254 | 0.227 | 0.198 |
| Smaller | 0.354 | 0.333 | 0.312 | 0.289 | 0.265 | 0.238 | 0.21 |
| Larger | 0.362 | 0.342 | 0.321 | 0.299 | 0.275 | 0.249 | 0.221 |
| Largest | 0.379 | 0.36 | 0.34 | 0.319 | 0.296 | 0.272 | 0.246 |
Table 3.
Grain size weight before and after carrying out the tests (seepage and compaction).
| Sample | Weight to Each Grain Size (g) | Weight Change (g) | ||||||||
|---|---|---|---|---|---|---|---|---|---|---|
| 2.5–5 mm | 5–10 mm | 10–15 mm | 15–20 mm | 0–2.5 mm (Increase) | Wight Loss | |||||
| Before | After | Before | After | Before | After | Before | After | |||
| Uniform | 375 | 389.3 | 375 | 377.9 | 375 | 367.4 | 375 | 337.8 | 14.2 | 13.4 |
| Smallest | 600 | 608.3 | 300 | 306.8 | 300 | 288.4 | 300 | 262.2 | 18.4 | 15.9 |
| Smaller | 300 | 309.6 | 600 | 592.4 | 300 | 294.6 | 300 | 280.9 | 11.3 | 11.2 |
| Larger | 300 | 319.1 | 300 | 307.8 | 600 | 583.2 | 300 | 264.3 | 12.4 | 13.2 |
| Largest | 300 | 316.2 | 300 | 304.2 | 300 | 283.6 | 600 | 573.1 | 13.6 | 9.3 |
Table 4.
Non-Darcy flow characteristics during compaction.
| Sample | Characteristics | Axial Displacement (mm) | ||||||
|---|---|---|---|---|---|---|---|---|
| 10 | 15 | 20 | 25 | 30 | 35 | 40 | ||
| Uniform | k (μm2) | 19.344 | 16.241 | 12.167 | 10.13 | 5.38 | 3.655 | 1.234 |
| β (mm−1) | 3.215 | 4.367 | 9.135 | 13.244 | 12.983 | 19.167 | 28.344 | |
| Smallest | k (μm2) | 38.167 | 24.531 | 20.188 | 12.28 | 16.732 | 8.63 | 4.529 |
| β (mm−1) | 2.673 | 6.314 | 3.145 | 5.328 | 7.73 | 7.481 | 9.673 | |
| Smaller | k (μm2) | 54.135 | 32.148 | 27.44 | 20.128 | 12.35 | 7.862 | 4.583 |
| β (mm−1) | 1.355 | 4.432 | 2.673 | 3.985 | 7.872 | 11.256 | 9.442 | |
| Larger | k (μm2) | 62.137 | 31.455 | 41.263 | 23.145 | 16.33 | 12.15 | 6.732 |
| β (mm−1) | 1.235 | 3.467 | 6.548 | 4.32 | 9.531 | 8.237 | 12.258 | |
| Largest | k (μm2) | 71.427 | 38.135 | 29.037 | 30.182 | 26.355 | 19.247 | 10.156 |
| β (mm−1) | 3.455 | 1.293 | 4.673 | 2.732 | 6.329 | 7.383 | 10.252 | |
© 2017 by the authors. Licensee MDPI, Basel, Switzerland. This article is an open access article distributed under the terms and conditions of the Creative Commons Attribution (CC BY) license (http://creativecommons.org/licenses/by/4.0/).
Share and Cite
MDPI and ACS Style
Ma, D.; Zhou, Z.; Wu, J.; Li, Q.; Bai, H. Grain Size Distribution Effect on the Hydraulic Properties of Disintegrated Coal Mixtures. Energies 2017, 10, 612. https://doi.org/10.3390/en10050612
AMA Style
Ma D, Zhou Z, Wu J, Li Q, Bai H. Grain Size Distribution Effect on the Hydraulic Properties of Disintegrated Coal Mixtures. Energies. 2017; 10(5):612. https://doi.org/10.3390/en10050612
Chicago/Turabian StyleMa, Dan, Zilong Zhou, Jiangyu Wu, Qiang Li, and Haibo Bai. 2017. "Grain Size Distribution Effect on the Hydraulic Properties of Disintegrated Coal Mixtures" Energies 10, no. 5: 612. https://doi.org/10.3390/en10050612
Note that from the first issue of 2016, this journal uses article numbers instead of page numbers. See further details here.