
Research on Optimal Planning of Access Location and Access Capacity of Large-Scale Integrated Wind Power Plants
by
Hui Li
1,2, 
Gengyin Li
1,
Siwei Liu
2,*,
Yuning Wang
3,
Zhidong Wang
2,
Jiaming Wang
2 and
Ning Zhang
4 1
State Key Laboratory of Alternate Electrical Power System with Renewable Energy Sources, North China Electric Power University Changping District, Beijing 102206, China
2
State Power Economic Research Institute, Changping District, Beijing 102209, China
3
State Grid Materials Co. Ltd., Xicheng District, Beijing 100120, China
4
State Key Lab of Control and Simulation of Power Systems and Generation Equipment, Department of Electrical Engineering, Tsinghua University, Haidian District, Beijing 100084, China
*
Author to whom correspondence should be addressed.
Energies 2017, 10(4), 442; https://doi.org/10.3390/en10040442
Submission received: 13 December 2016
/
Revised: 18 March 2017
/
Accepted: 21 March 2017
/
Published: 1 April 2017
(This article belongs to the Special Issue Techniques of Control for Energy Optimization in Actuators, Motors and Power Generation Systems)
Abstract
:This paper proposes a multi-objective optimal planning model of access location and access capacity for large-scale integrated wind power generation considering the mutual restriction between the planning of large-scale wind power plants and the planning of power system network. In this model, the power flow equilibrium degree, investment costs and active network loss are taken as the optimization goals. The improved differential evolution (IDE) algorithm is applied to calculate the Pareto optimal solution set of wind power’s access planning. With the solution results described by the Pareto pattern, all the alternative solutions are then ranked based on the entropy weight method and the final compromised solution is selected by the method of technique for order preference by similarity to ideal (TOPSIS). And the proposed optimal planning model is tested based on a practical planning need of large-scale integrated wind power generation in an actual power grid of China in 2020. The simulation results show that applied with the proposed optimization model and matching algorithm, the planning scheme of large-scale wind power’s access location and access capacity under complex and practical power system circumstances has been successfully optimized.
1. Introduction
In the northwest and northeast regions of China, which are rich in wind energy resources, the wind power generation has experienced rapid development in recent years, which brought a need of optimal planning of the access location and access capacity of large-scale integrated wind power plants to improve wind power consumption and to ensure the power system safely operation [1,2].
Power plant planning aims to solve the issue about when and where to build what kind of power plants with an overall consideration of power grid conditions, such as grid network structure, load development, power system reliability, economic efficiency, operation efficiency, and so on [3]. The common optimal planning of conventional power plants considers the smallest system economic cost as the optimization objective with the load demand supplied and the power system operating safely. The system’s total economic cost usually comprises of two parts: the power plants’ investment costs, which are related to the installed capacity, and the operating costs, which are related to the actual generated capacity.
Regarding the issue of optimal planning of wind power plants, according to wind power’s generation characteristics, the peaking ability of other types of power generation will be influenced by the integrated large-scale wind power generation. In solving the access location and access voltage level of integrated wind power plants, the total capacity of integrated wind power, the constraints of grid network structure, and the power system’s reliability and economy need to be taken into account [4,5,6]. In [7], based on a specific power operation mode, the capable access capacity of wind power generation was solved by the interior-point method based on the affine scaling theory. In [8], considering the constraints of the transmission lines’ limited capacity, system’s spinning reserve requirements, and regular power units’ output limits, the wind farm’s capable access capacity was calculated using the chance-constrained method. The literature [9] proposed an optimal method based on a market constraints optimization algorithm to solve multi-wind farms’ access locations and access capacities considering quarterly load demand and wind speed distribution characteristics. The literature [10] also analyzed the transmission network’s reliability with integration of large-scale wind power, based on which of the relationships between wind farms’ installed capacity and the transmission system’s expansion planning, as well as the balance between system reliability and investment benefit, were investigated. In [11], based on the evaluation of annual electricity demand, average wind speed, and illumination intensity, an optimization model using a genetic algorithm was proposed to calculate the total access capacity, the optimal capacity proportion, and the installation position of a wind-photovoltaic power hybrid system.
Up to now, among the studies focused on the optimal planning of wind power plants at home and abroad, most research are carried out based on distribution networks [12,13,14,15]. Though abundant achievements have been made, the existing methods show limitations facing the optimal planning of large-scale wind power plants which are centrally integrated into the transmission network. In China, according to the regional distribution characteristic of wind resource, wind power based generation is mostly exploited in a large scale more than hundred-MW-level in the northwest and northeast areas, however, which are a thousand kilometers far away from China’s east load center. In the meantime, China’s current new energy development policy encourages wind power energy to be exploited vigorously under the condition that the installed wind power can be effectively consumed. In this situation, there may be dozens or hundreds of wind farms integrated in a central area, and the power generated by wind farms need to be sent to distant load centers through the main transmission network. Hence, the optimal planning of access location and access capacity of wind power plants group is facing the challenges of large amount of total access capacity, widely available exploited areas, and variously-capable access locations.
In this paper, considering the mutual restriction between the planning of large-scale wind power plants and the planning of the power system’s network, an optimal planning model of access location and access capacity of large-scale wind power plants is put forward. The optimization objective takes the power flow equilibrium degree, investment costs, and active network loss as multi-optimization goals, and the proposed model is solved by the improved differential evolution (IDE) algorithm. With the solution results described by the Pareto pattern, the weights of the multi-objective attributes of each solution are calculated based on the entropy weight method, according to which all the alternative solutions are ranked and the final compromised solution is selected by the method of technique for order preference by similarity to ideal (TOPSIS). Based on a practical planning need of large-scale integrated wind power in an actual power grid in China in 2020, the best wind power access solution is successfully identified under the complex actual grid circumstances using the proposed model, which verifies the model’s effectiveness.
2. Optimal Planning Model of Large-Scale Wind Power Generation
The plan of access location and access capacity of newly planned wind power plants influences the corresponding expansion of power grid networks, the operation reliability, and the economic efficiency of the power system. To avoid the probable investment losses caused by wind farm construction and network construction, and to reach the optimal overall social benefits, the planning of integrated wind farms’ access locations and access capacities is better carried out with the consideration of the planning of network expansion. However, in this situation, the issue about optimal planning of wind power plants turns to be a multi-objective and nonlinear planning problem.
2.1. Objective Function
(1) Power flow equilibrium degree
With large-scale wind power integrated into the power system, if the wind power’s access has not been well planned, the power flow disequilibrium in different transmission lines may happen due to the volatility and randomness of wind power output characteristics. When one transmission line’s power flow reaches its capacity limit while the other lines are still lightly loaded, the power system’s security and reliability declines. However, the balance degree of system power flow on different transmission lines can be improved by better general planning schemes of wind farms and system network expansion. Hence, the power flow equilibrium degree can be an effective index indicating the effectiveness of the planning scheme of wind power and network expansion.
The power flow equilibrium degree can be described by the standard deviation of different line’s power flow ratios, as written as below:
where l is the amount of the transmission lines in the system, rij is the power flow ratio between the practical power flow and the rated capacity of line from bus i to bus j, |Pij| is the actual power flow, Pijmax is the rated capacity of line, and is the average of rij.
(2) Economic efficiency
On this issue about the optimal planning of large-scale centrally integrated wind power plants, the economic efficiency is mainly considered in two parts: the investment costs and the operation costs. Investment costs includes the expenses of wind farms’ construction, corresponding connection lines’ construction, and main power grid network’s expansion. Operation costs is mainly caused by system operation loss which changes for different planning schemes since the power flow distribution will be different. In the composition of system operation losses, the active network loss is mainly considered in this issue.
Taking the minimum sum of the investment costs and the active network loss as the economic optimization objective, the economic efficiency is described as:
where nij is the amount of planning lines between bus i and bus j, and cij is the price of each line, Ploss is the active network loss of power system, Closs is the cost coefficient of Ploss, determined by the electricity price and annual hours of maximum load loss.
2.2. Constraints
The constraints of the proposed model mainly include the wind power access capacity constraint, the power and electricity balance constraint, the power system operation constraint, and the power grid network constraint, etc.
(1) Constraint of wind power access capacity:
where Wins is the limit of total capacity of integrated wind power.
(2) Power flow constraint:
where Y0 is the initial node admittance matrix, ΔY is the change of node admittance matrix with the planning lines. yij is the admittance of each planning line.
ΔY can be expressed by:
(3) Constraint of conventional power plants’ output:
(4) Node voltage constraint:
(5) Constraint of transmission line power flow:
(6) Constraint of network expansion:
where, and are the amounts of existed and planned transmission lines between bus i and bus j, respectively.
(7) Constraint of wind power distribution at booster station:
where Wi,max is the maximum limit of bus i’s capable access capacity.
(8) Security and stability constraint
The planning of large-scale wind power access locations and capacity should satisfy the requirement in the standard Guidelines for Power System Security and Stability [16] written by the State Grid Corporation of China. This standard stipulates the reliability requirement for power systems under different stability levels including: (і) N-1 condition, when the power system loses any one operating electric equipment; (ii) N-2 condition, when the system loses any two operating electric equipment; and (iii) serious fault conditions.
3. Multi-Objective Optimization Process
3.1. Pareto-Based Optimal Solution Set
Since the proposed optimization model of large-scale wind power’s access location and access capacity is a multi-objective and nonlinear programming problem, the improved differential evolution (IDE) algorithm [17] is adopted here to solve the Pareto optimal solutions. The basic process of the DE algorithm consists three main steps: (і) Mutation: for two random vectors in the population, their difference is set as the variable source to generate a new vector; (ii) Crossover: based on mutation, a new generation is evolved from the current population each round; (iii) Choice: the population generation evolves until the evolutionary population contains the optimal solution.
Considering the calculation complexity and the DE algorithm’s characteristics, the original DE algorithm’s process is improved as below:
(1) Improved mutation process
For two random vectors p and q in the original population, if every attribute in vector p is not poor and at least one attribute is better than those in vector q, it is called that p and q obey Pareto dominance and p is the dominated vector. In the Gth mutation process, a new temporary population will be composed by the way that vector ui,G+1 begins to compare with its parent vector xi,G: (і) If the two vectors satisfy the Pareto dominance principle, the dominated vector is chosen as the new temporary population; (ii) If not, the two vectors are both chosen as the new temporary population. In this competing way, the amount of vectors in the temporary population is between NP and 2NP, and the former NP vectors become the next population generation by non-dominated sorting and crowded distance sorting based on the improved non-dominated sorting genetic algorithm [18].
(2) Adaptive adjustment of control parameters
Using the IDE algorithm, the convergence and robustness of the solving process are directly affected by the control parameters F and CR. In the standard DE algorithm, F and CR are constants parameters, and it always takes a long time to find the most appropriate value. Therefore, the adaptive adjustment is adopted to calculate the value of F and CR as the population evolves, which can eliminate the inconvenience of manual calculation and increase the diversity of the population. The adaptive adjustment strategies of F and CR are described as follows [19]:
where r1, r2, r3, r4 are random numbers in [0,1] obeying the uniform distribution. τ1 and τ2 are the adaptive adjustment possibility of F and CR, respectively. In this work, the values of Fmin, Fmax, τ1, and τ2 are set as 0.1, 0.9, 0.1, and 0.1, respectively.
3.2. Acquisition of the Final Compromised Solution
With the Pareto optimal solution set solved by the IDE algorithm, the attribute weights of optimization objectives are then calculated, and the weighted Pareto decision-making matrix is composed using the information entropy method [20]. In the weighted Pareto decision-making matrix, all the alternate solutions are sorted using the TOPSIS [21], based on the distances from each alternative solution to the ideal solution (IS) and the negative solution (NS), which are both calculated. After the comparison, the solution closest to the IS and at the mean time farthest away from NS, is chosen as the compromised Solution. The decision-making steps based on the TOPSIS method are as follows:
(1) Establishment of the weighted-standardized decision matrix
Firstly, establish the standardized decision matrix R, of which the square sum of a same attribute of all solutions adds up to 1:
Based on Equation (13), the weighted-standardized decision matrix V = {vij} is then established through the way that each column of matrix R multiply by its corresponding weight wj.
(2) Calculation of IS and NS
Second, provided that a lower value of the objective attribute indicates a better solution, then the ideal solution A+ and the negative solution A− can be expressed as:
(3) Calculation of distance
Then the distances of every alternative solution to IS and NS are calculated based on N-dimensional Euclid Norm, expressed as:
(4) Sorting of alternative solutions and decision-making
Finally, the approximate degree of each solution to the ideal solution is described by:
According to Equation (16), it satisfies 0 ≤ Ci ≤ 1, and if vi is the IS, Ci = 1, if vi is the NS, Ci = 0. Since the value of Ci directly indicates the approximate degree of each alternative solution to the IS, all the solutions in Pareto optimal solution set can be sorted according to the value of Ci, and the one which has largest value of Ci is chosen as the final compromised solution.
3.3. Overall Optimization Process
Matched with the proposed optimal planning model of large-scale wind power, the access location and access capacity of wind farms are calculated and optimized in the following steps:
- (1)
- Initialization of the calculation model. With the original system data, parameters, and algorithms input, the original generation of wind farm planning solutions are generated. Then the system power flow for each original solution is calculated by the Newton-Raphson method, based on which of the adaptive degrees of each solution is fetched.
- (2)
- Acquisition of the first test generation of wind power plants planning solutions. Based on the results of the adaptive degree calculation of each original solution, the adaptive adjustment is applied calculating the value of F and CR as the population evolves. After mutation and crossover processes, the first test generation of the wind power plants planning solutions is generated, and the adaptive degree of each solution is calculated as well.
- (3)
- Calculation of the Pareto-based optimal solution set. The IDE algorithm is applied to calculate the Pareto optimal solution set, as described in Section 3.1.
- (4)
- Acquisition of the final compromised solution. The TOPSIS method is applied to rank all the alternate solutions and reveal the final compromised solution out as described in Section 3.2. The overall optimization process is shown in Figure 1.
4. Simulation Analysis
4.1. Simulation Models
4.1.1. Power Grid Conditions
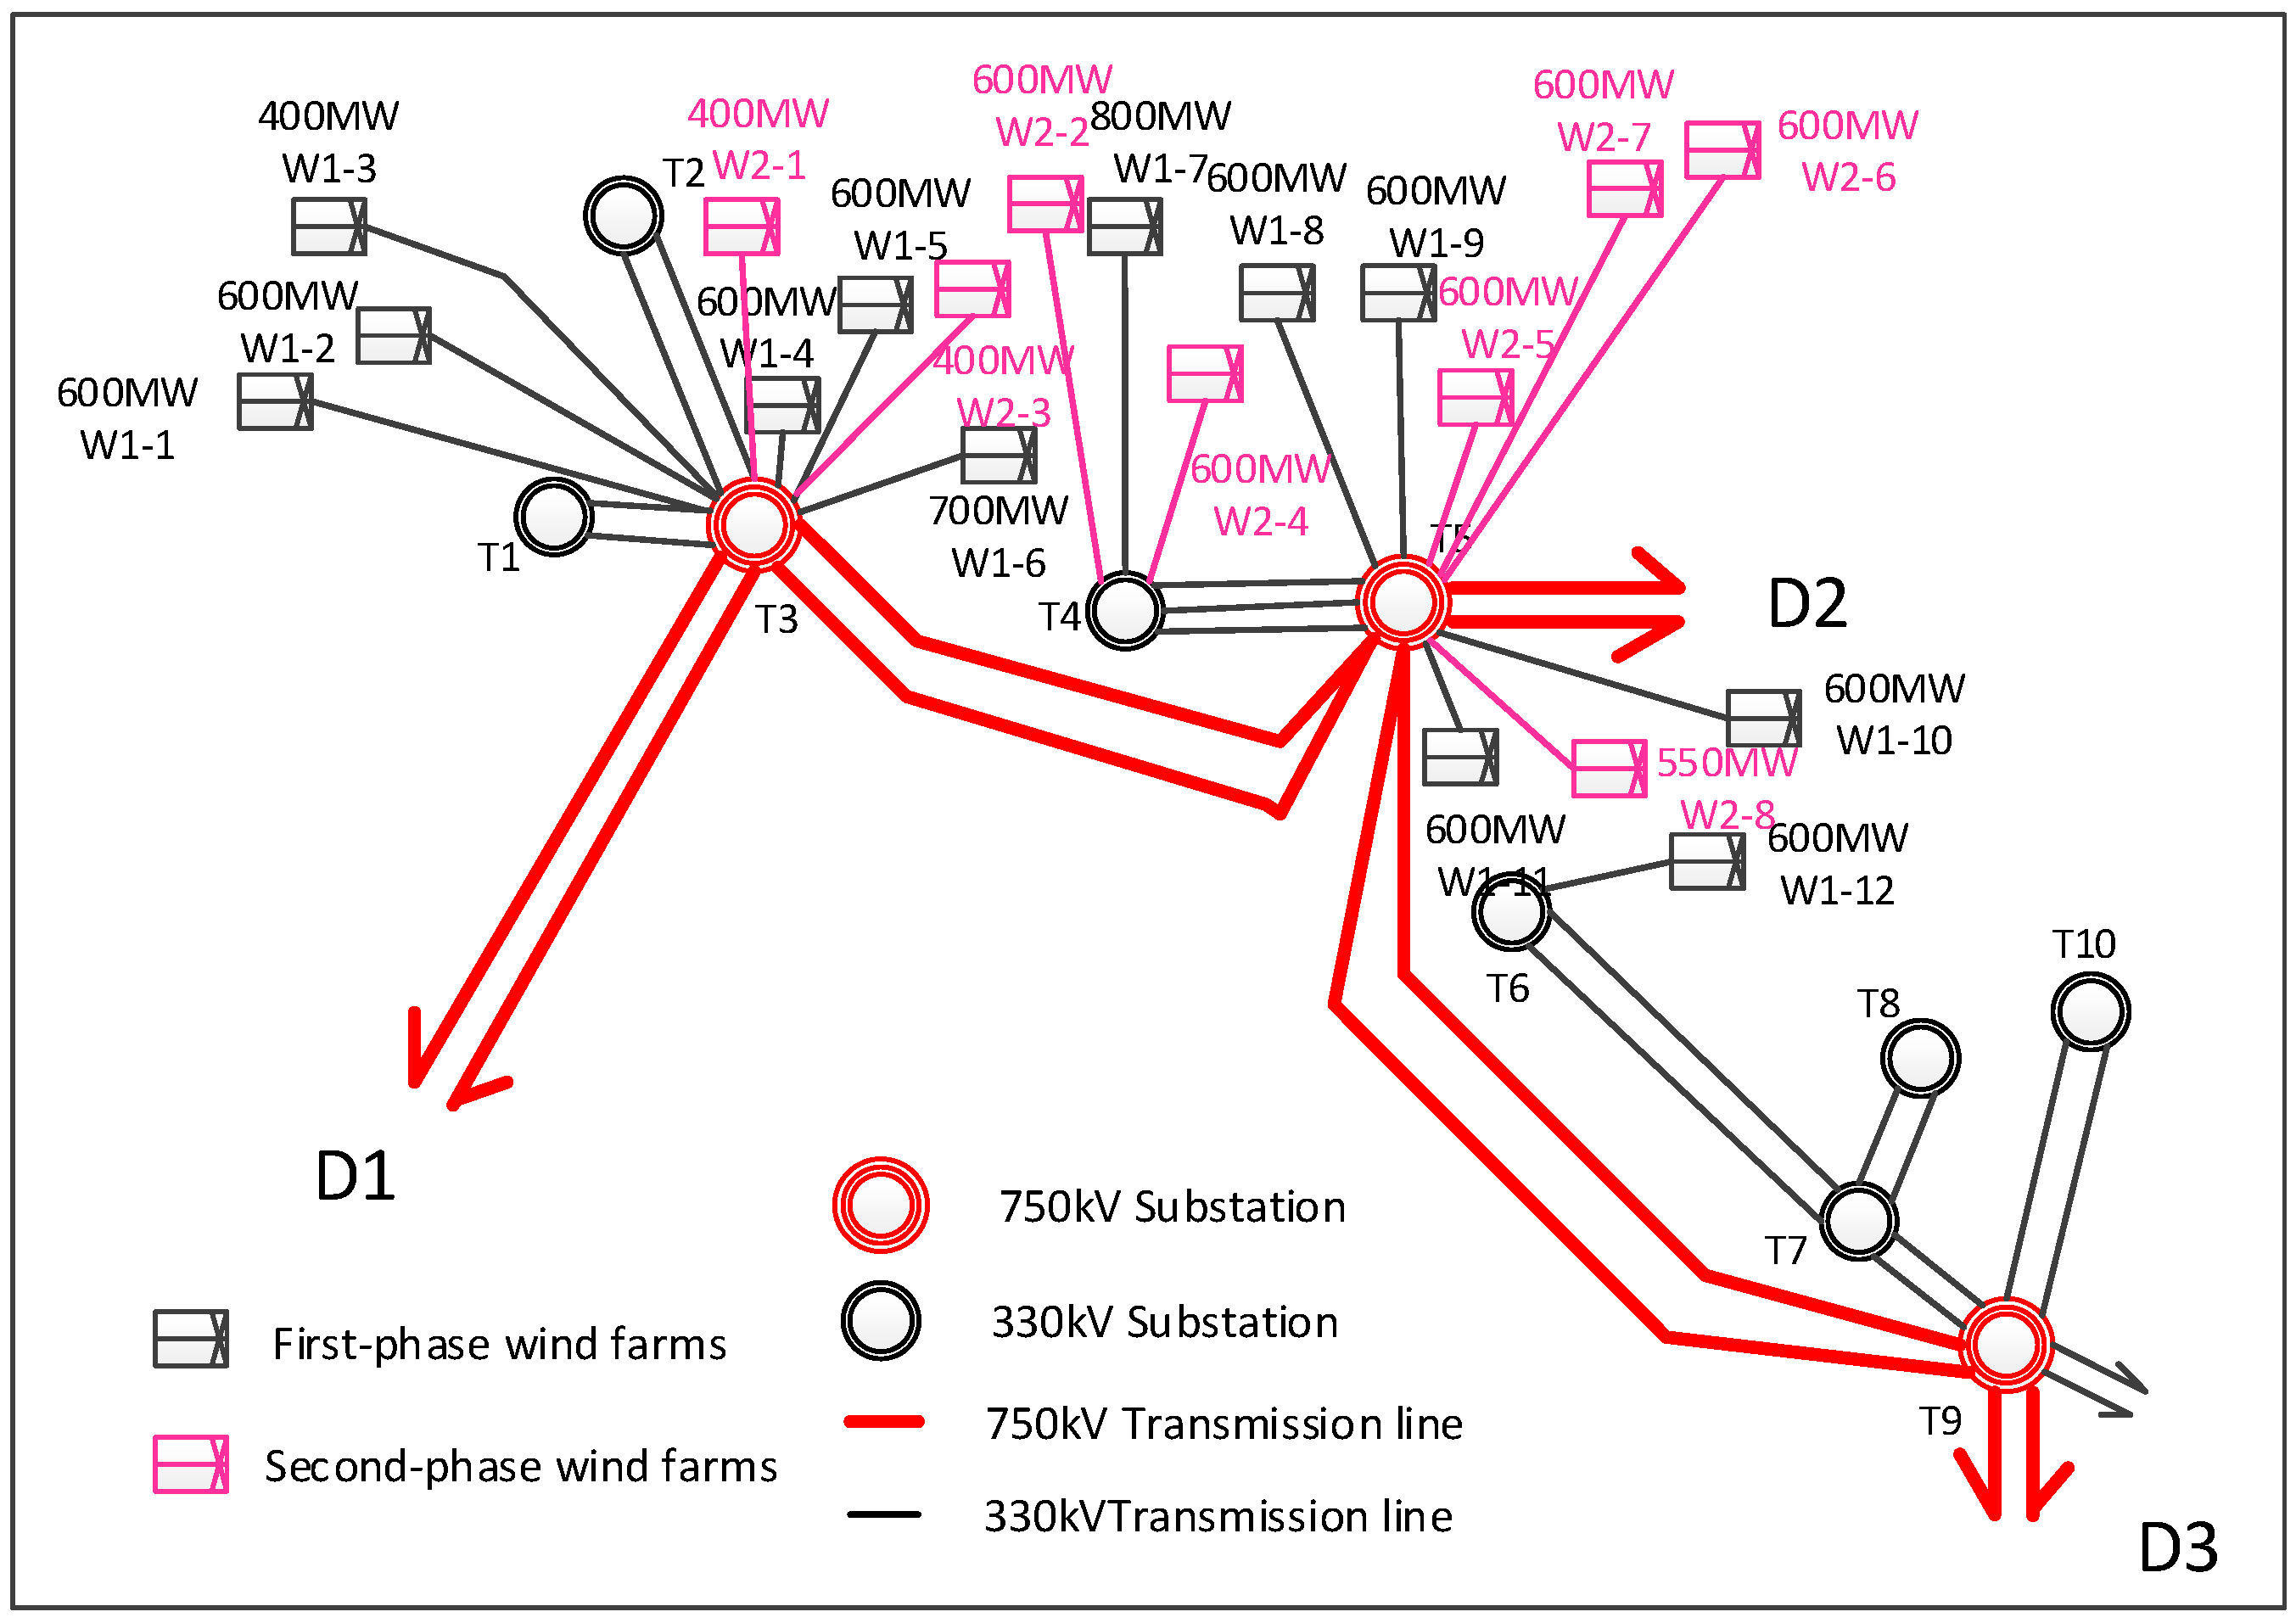
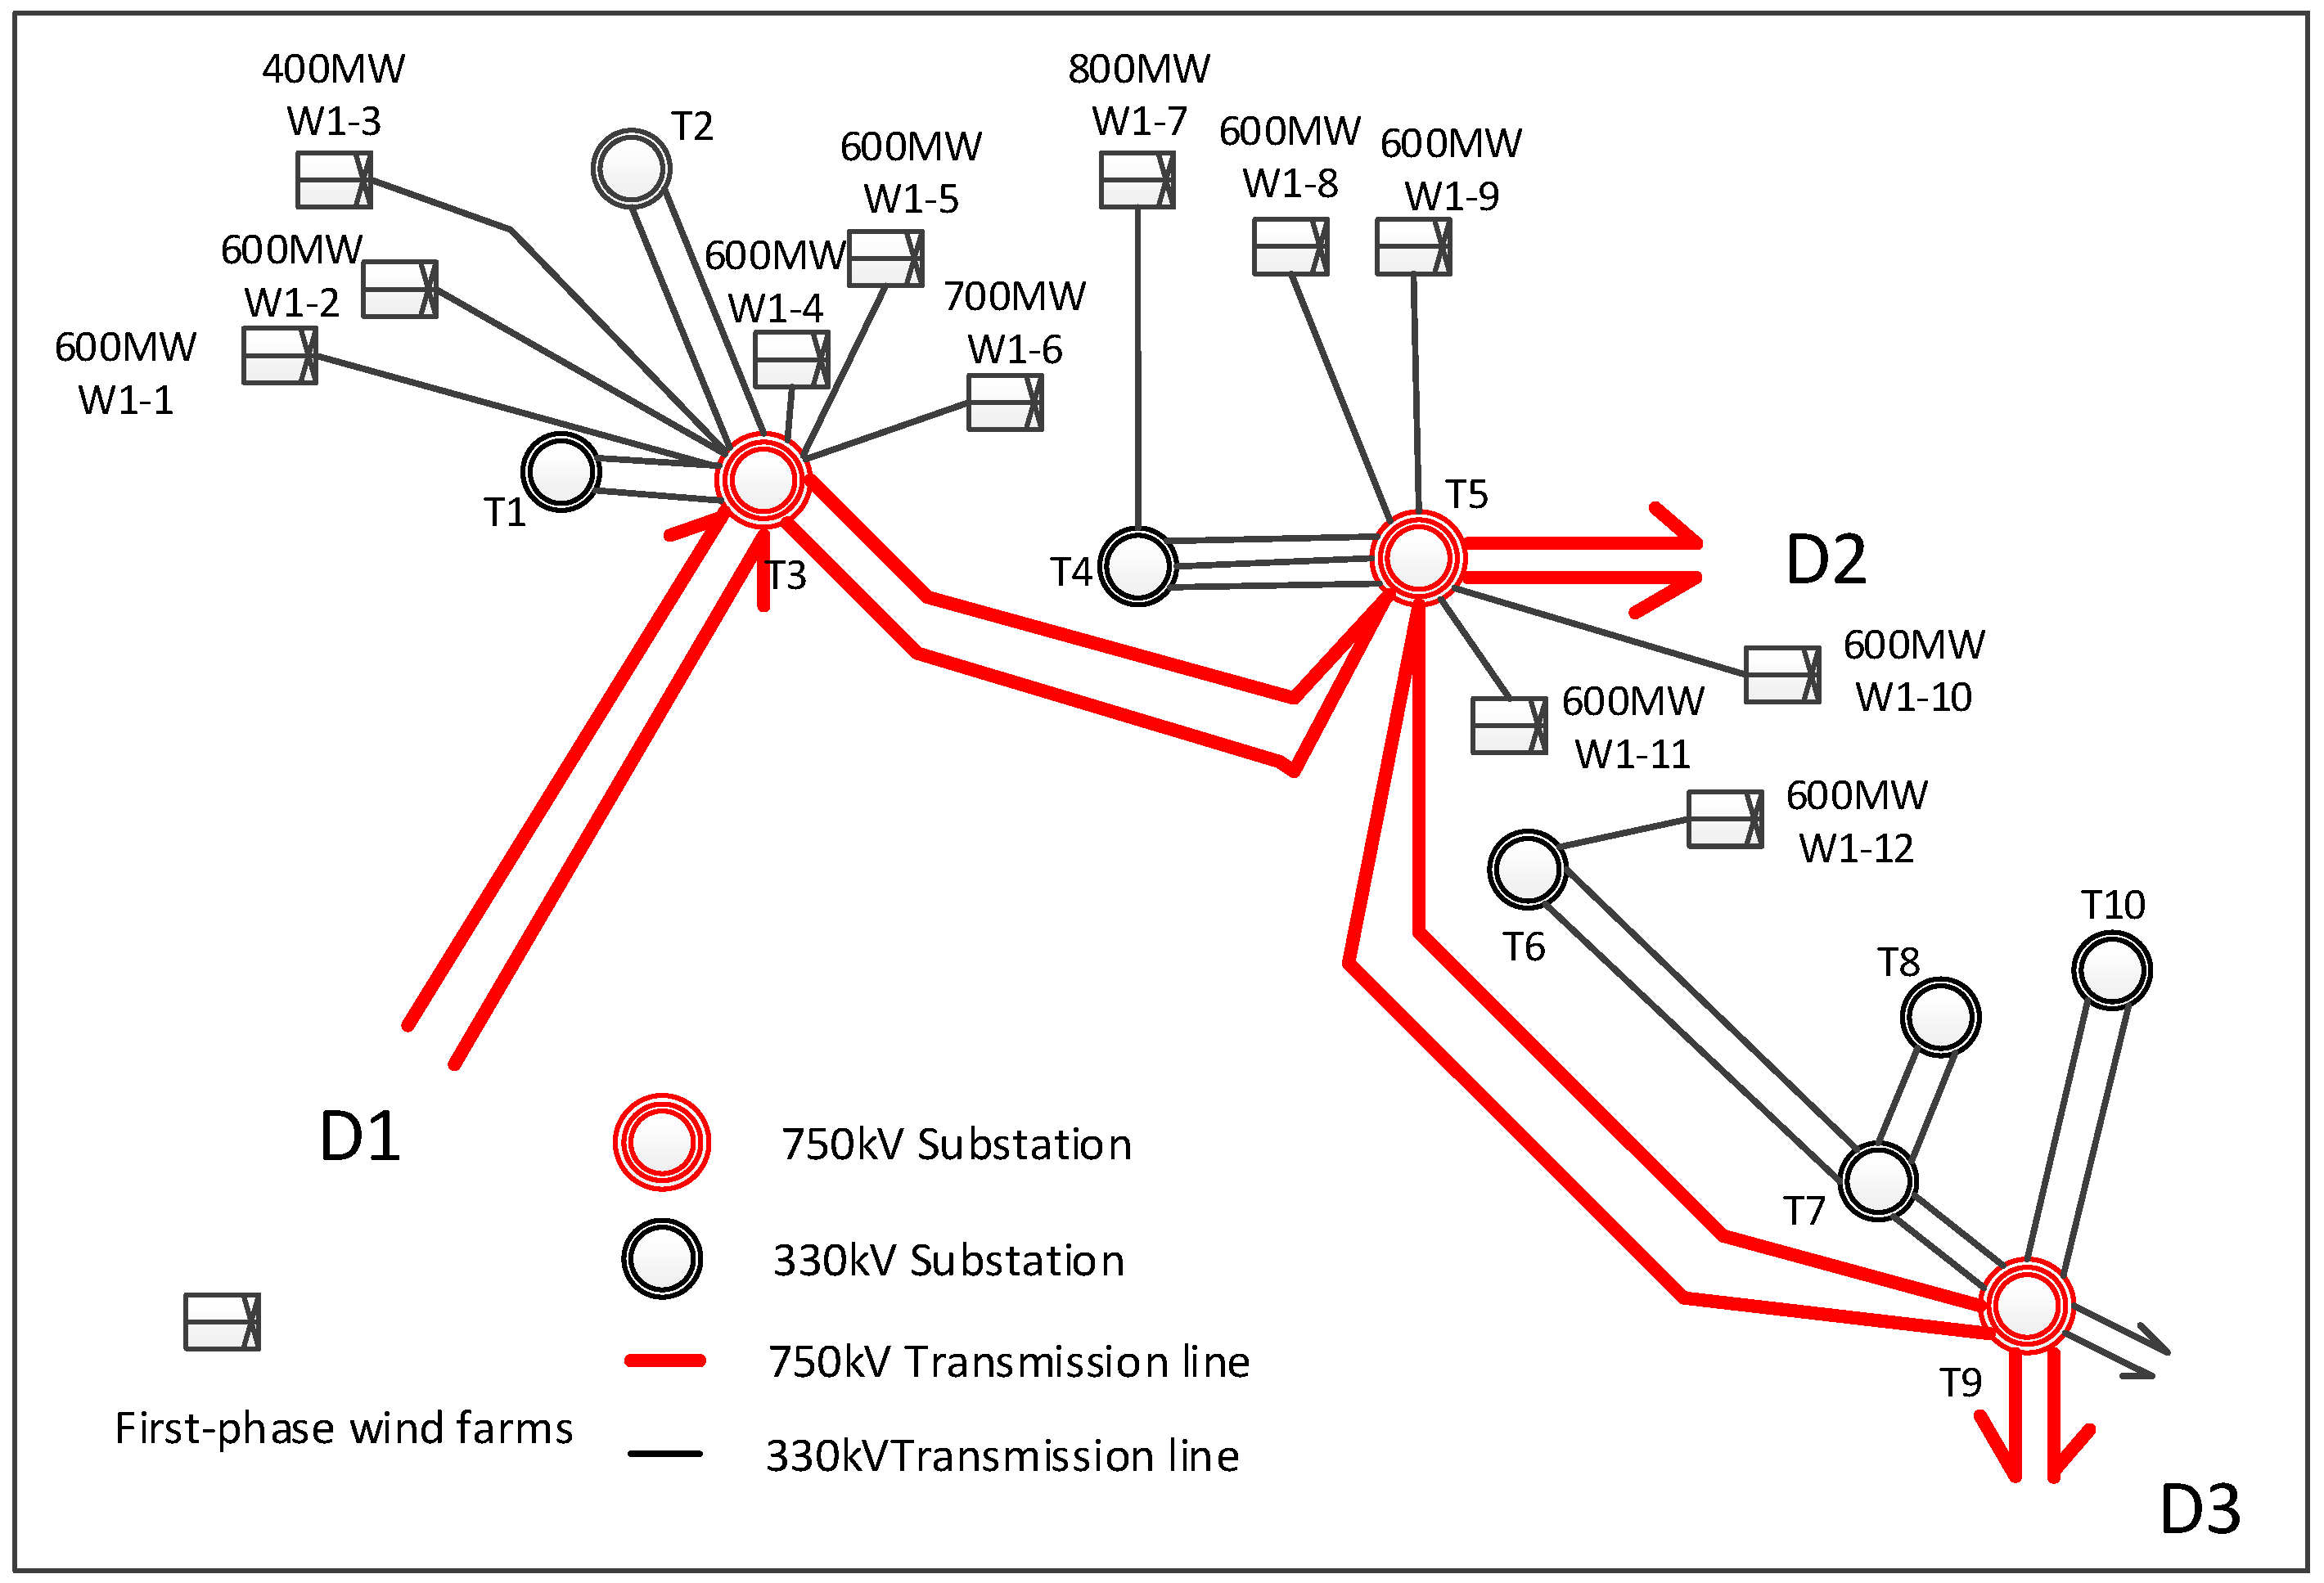
The simulation analysis is carried out based on a practical regional power grid in China which already contains 7300 MW first-phase integrated wind power generation. A second-phase access project of 4350 MW wind power generation in the year 2020 is ready for planning. The power system circumstances in 2020 are given in Table 1 in which the data are given according to the future forecasting of the constructions of power plants, substations, transmission lines, and the development of load demands based on the current data, and the corresponding diagram is shown in Figure 2.
As shown in Figure 2, the basic information and constraints of this power gird are as follows:
- (1)
- This regional power system consists of three 750 kV substations: T3, T5, and T9, of which each 750 kV substation is able to connect up to sixteen 330 kV lines, and this regional system consists of seven 330 kV substations: T1, T2, T4, T6, T7, T8, and T10, of which each 330 kV substation is able to connect up to eight 330 kV lines.
- (2)
- Wind farms in the first-phase and second-phase are all integrated at 330 kV substation. The economic transport capacity of 330 kV transmission line is taken as 309 MW and the limited continuous transport capacity to be 782 MW. The power output of each wind farm from its booster substation to 330 kV transmission line is assumed as 600 MW.
- (3)
- Through HVDC (high voltage direct current transmission) lines, this regional power system transmits power with other regional power grids with amount of −5000 MW, 8000 MW, and 2000 MW to District 1, District 2, and District 3, respectively.
- (4)
- The locations of wind farms booster substations has been determined, and the capable exploited capacity of wind power around each booster substations is also certain. The network structure of wind farms’ internal collection and the corresponding network losses are not taken into consideration in this simulation.
4.1.2. Wind Farms Access Conditions and Boundary Conditions
As shown in Figure 2, the detailed information of installed capacity and the transmission scheme of the first-phase 7300 MW wind power plants are given in Table 2.
Affected by the wind resources distribution limit, there are only eight alternate wind farm’s booster substations, named by W2-1–W2-8, capable for integration of second-phase 4350 MW wind power generation. The 330 kV substations capable for wind power integration are the substations T1–T6. The transmission line’s length from the capable wind-power booster stations W2-1–W2-8 to the capable 330 kV substation T1–T6 are given in Table 3.
4.2. Optimal Planning of the Second-Phase Wind Farms
In optimization process of the access location and access capacity planning of the second-phase wind power generation, some key variables are set as: (1) the unit cost of 750 kV line and 330 kV line are 2.44 million RMB and 1.5 million RMB per kilometer, respectively; (2) the cost coefficient of active network loss is 1.5 million RMB per MW; (3) the scale amount of the original population is 200; and (4) the maximum number of calculation iteration rounds is 1000.
In the early stage of the practical optimization process, the power system’s power flow equilibrium degree changes only in a small fluctuation degree, which is far less than the variation scale of the economic efficiency. It is suggested that the economy of transmission line’s cost plays a leading role among the optimization objectives in the early stage of optimization process. Hence, the optimal access locations of wind power booster substations and the corresponding transmission lines’ expansion plan are preliminarily selected.
In the later stage of the optimization process, since the transmission lines’ costs are the same based on the acquired wind farm access location solution, the capacity distribution scheme of wind farms are optimized according to the optimization objectives of power flow equilibrium degree and the active network loss.
Eventually the Pareto optimal solution set is generated with 30 solutions regarding wind farms’ access locations and access capacity combinations, of which the target cost of transmission lines is 504 million RMB, the target distribution of power flow equilibrium degree is between 0.3578 and 0.3725, and the target distribution of economic efficiency is between 711.0~863.3 million RMB. The distribution trend of all the 30 solutions in the Pareto optimal solution set are shown in Figure 3. The optimization objective’s attribute values of each solution are given in Table 4.
Based on the Pareto optimal solution set, as shown in Figure 3 and Table 4, the attribute weights of the power plow equilibrium degree and active network loss are then, respectively, calculated as 0.0357 and 0.9643 by the information entropy method. This means that the economic efficiency plays a more decisive role in this optimization planning process of the second-phase wind farms’ access location and access capacity.
Based on the TOPSIS method, all of the alternate solutions in the Pareto optimal solution set are sorted, and Solution 3 turns to be the optimal compromise solution which has the smallest distance to the ideal solution and the longest distance to the negative ideal solution. In Solution 3, (1) the power plow equilibrium degree is 0.3725; (2) the economic efficiency is 711 million RMB. The 750 kV network in this regional power system does not need strengthening, the total length of the planned transmission lines from second-phase wind farms to the 330 kV substations is up to 336 km with a total investment of 504 million RMB; (3) the active network loss is 138 MW; and (4) Solution 3 also satisfies the power flow check that no transmission line’s power flow exceeds the rated capacity.
5. Conclusions
This paper proposed a multi-objective optimization planning model of large-scale wind power’s access location and access capacity considering the mutual restriction between wind power’s access planning and the power system’s network planning. Based on a practical planning need of large-scale wind power access in a regional power grid in China in 2020, the proposed optimization model is tested. The power flow equilibrium degree, investment costs, and active network loss are taken as the optimization goals. Applied with the improved differential evolution (IDE) algorithm, the optimal access locations of wind power booster substations and the corresponding transmission lines’ expansion plan are preliminarily solved in the early stage of the optimization process, and the capacity distribution plans of integrated wind farms are calculated in a later stage. With the Pareto optimal solution set solved, all of the alternative solutions are sorted by the TOPSIS (technique for order preference by similarity to ideal) method and the final compromised solution is successfully selected. The result verifies the model’s effectiveness under complex practical power system circumstances.
Acknowledgments
This research work was supported by the National Key Research and Development Program of China: Topology Evolution Model and Power Forecast Method of the Future Electrical Power Systems (No. 2016YFB0900101).
Author Contributions
Hui Li and Gengyin Li conceived and designed the experiments; Hui Li, Siwei Liu, Yuning Wang, and Zhidong Wang performed the experiments; Hui Li, Yuning Wang, and Ning Zhang analyzed the data; Jiaming Wang contributed analysis tools; Hui Li and Siwei Liu wrote the paper.
Conflicts of Interest
The authors declare no conflict of interest.
References
- Xiao, C.Y.; Wang, N.B.; Zhi, J. Power characteristics of Jiuquan wind power base. Autom. Electr. Power Syst. 2010, 37, 64–67. [Google Scholar]
- Wang, Z.M.; Su, A.L.; Lu, S. Analysis on capacity of wind power integrated into Liaoning power grid based on power balance. Autom. Electr. Power Syst. 2010, 34, 86–90. [Google Scholar]
- Cheng, H.Z.; Zhang, Y. Power System Planning; China Electric Power Press: Beijing, China, 2008. [Google Scholar]
- Wiik, J.; Gjerde, J.O.; Gjengedal, T.; Gustafsson, M. Steady state power system issues when planning large wind farms. In Proceedings of the IEEE Power Engineering Society Winter Meeting, New York, NY, USA, 27–31 January 2002. [Google Scholar]
- Billinton, R.; Yi, G.; Karki, R. Composite system adequacy assessment incorporating large-scale wind energy conversion systems considering wind speed correlation. IEEE Trans. Power Syst. 2009, 24, 1375–1382. [Google Scholar] [CrossRef]
- Xu, M.; Zhuan, X. Optimal planning for wind power capacity in an electric power system. Renew. Energy 2013, 53, 280–286. [Google Scholar] [CrossRef]
- Lei, Y.Z.; Wang, W.S.; Yin, Y.H. An optimization method for determining wind power penetration limit in power system under static security constraints. Proc. CSEE 2001, 21, 25–28. [Google Scholar]
- Lei, Y.Z.; Wang, W.S.; Yin, Y.H. Wind power penetration limit calculation based on chance constrained programming. Proc. CSEE 2002, 22, 32–35. [Google Scholar]
- Roy, S. Market Constrained Optimal Planning for wind energy conversion systems over multiple installation. IEEE Trans. Energy Convers. 2003, 17, 124–129. [Google Scholar] [CrossRef]
- Billinton, R.; Wangdee, W. Reliability-based transmission reinforcement planning associated with large-scale wind farms. IEEE Trans. Power Syst. 2007, 22, 34–41. [Google Scholar] [CrossRef]
- Masoum, M.A.S.; Mousavi Badejani, S.M.; Kalantar, M. Optimal placement of hybrid PV-wind systems using genetic algorithm. In Proceedings of the 2010 Innovative Smart Grid Technologies (ISGT), Gaithersburg, MD, USA, 19–21 January 2010; pp. 1–5. [Google Scholar]
- Qiu, X.Y.; Xia, L.L.; Li, X.Y. Planning of distributed generation in construction of smart grid. Power Syst. Technol. 2010, 34, 7–10. [Google Scholar]
- Wang, J.; Li, X.Y.; Qiu, X.Y. Improved cluster analysis based Ultra-short term load forecasting method. Autom. Electr. Power Syst. 2005, 29, 90–97. [Google Scholar]
- Wang, C.S.; Cheng, K.; Xie, Y.H. Siting and sizing of distributed generation distribution network expansion planning. Autom. Electr. Power Syst. 2006, 30, 38–43. [Google Scholar]
- Hsiao, Y.T.; Chen, C.H.; Chien, C.C. Optimal capacitor placement in distribution systems using a combination fuzzy-GA method. Electr. Power Energy Syst. 2004, 26, 501–508. [Google Scholar] [CrossRef]
- State Grid Corporation of China. Guide on Security and Stability for Power System; State Grid Corporation Company: Beijing, China, 2001. [Google Scholar]
- Cheng, H.Z.; Gao, X.W.; Ma, Z.L. General optimized model of multi-objective electric power network planning. Autom. Electr. Power Syst. 2004, 38, 1229–1232. [Google Scholar]
- Liu, L.; Cheng, H.X.; Ma, Z.L.; Bazargan, M. Multi-objective transmission expansion planning considering life cycle cost. Proc. CSEE 2012, 32, 46–54. [Google Scholar]
- Hongyun, M.; Xiaohua, Z.; Sanyang, L. A differential evolution based on double populations for constrained multi-objective optimization problem. Chin. J. Comput. 2008, 31, 228–235. [Google Scholar]
- Guoyin, W.; Hong, Y.; Dachun, Y. Decision table reduction based on conditional information entropy. Chin. J. Comput. 2002, 25, 759–766. [Google Scholar]
- Chen, C.T. Extensions of the TOPSIS for group decision-making under fuzzy environment. Fuzzy Sets Syst. 2000, 114, 1–9. [Google Scholar] [CrossRef]
Figure 1.
Diagram of the overall optimization process.
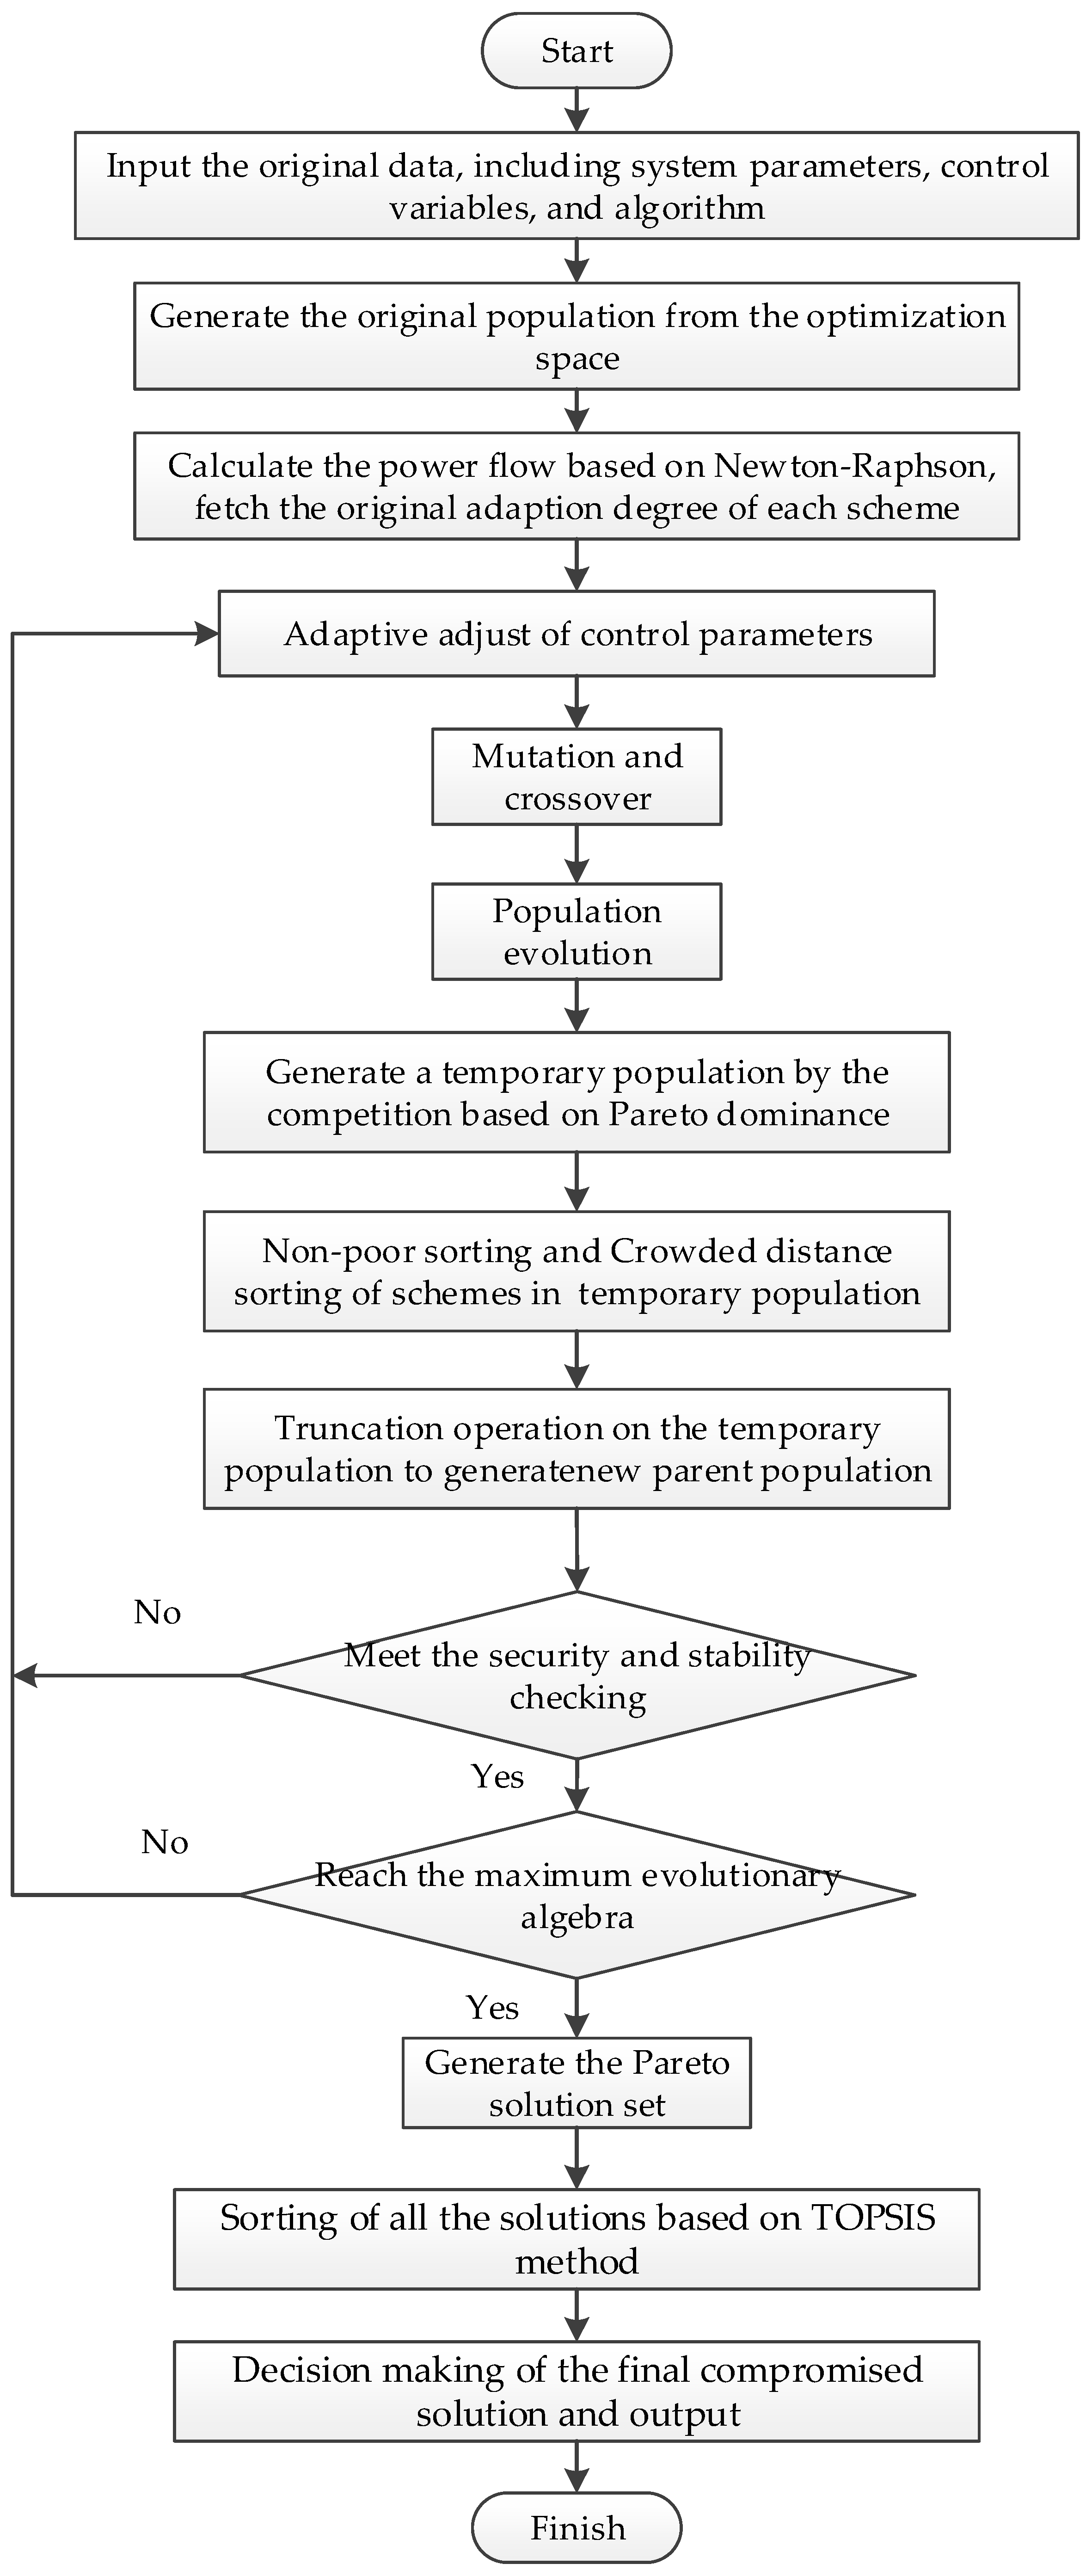
Figure 2.
Diagram of the test system network in 2020.

Figure 3.
Distribution trend of the Pareto optimal solution set.
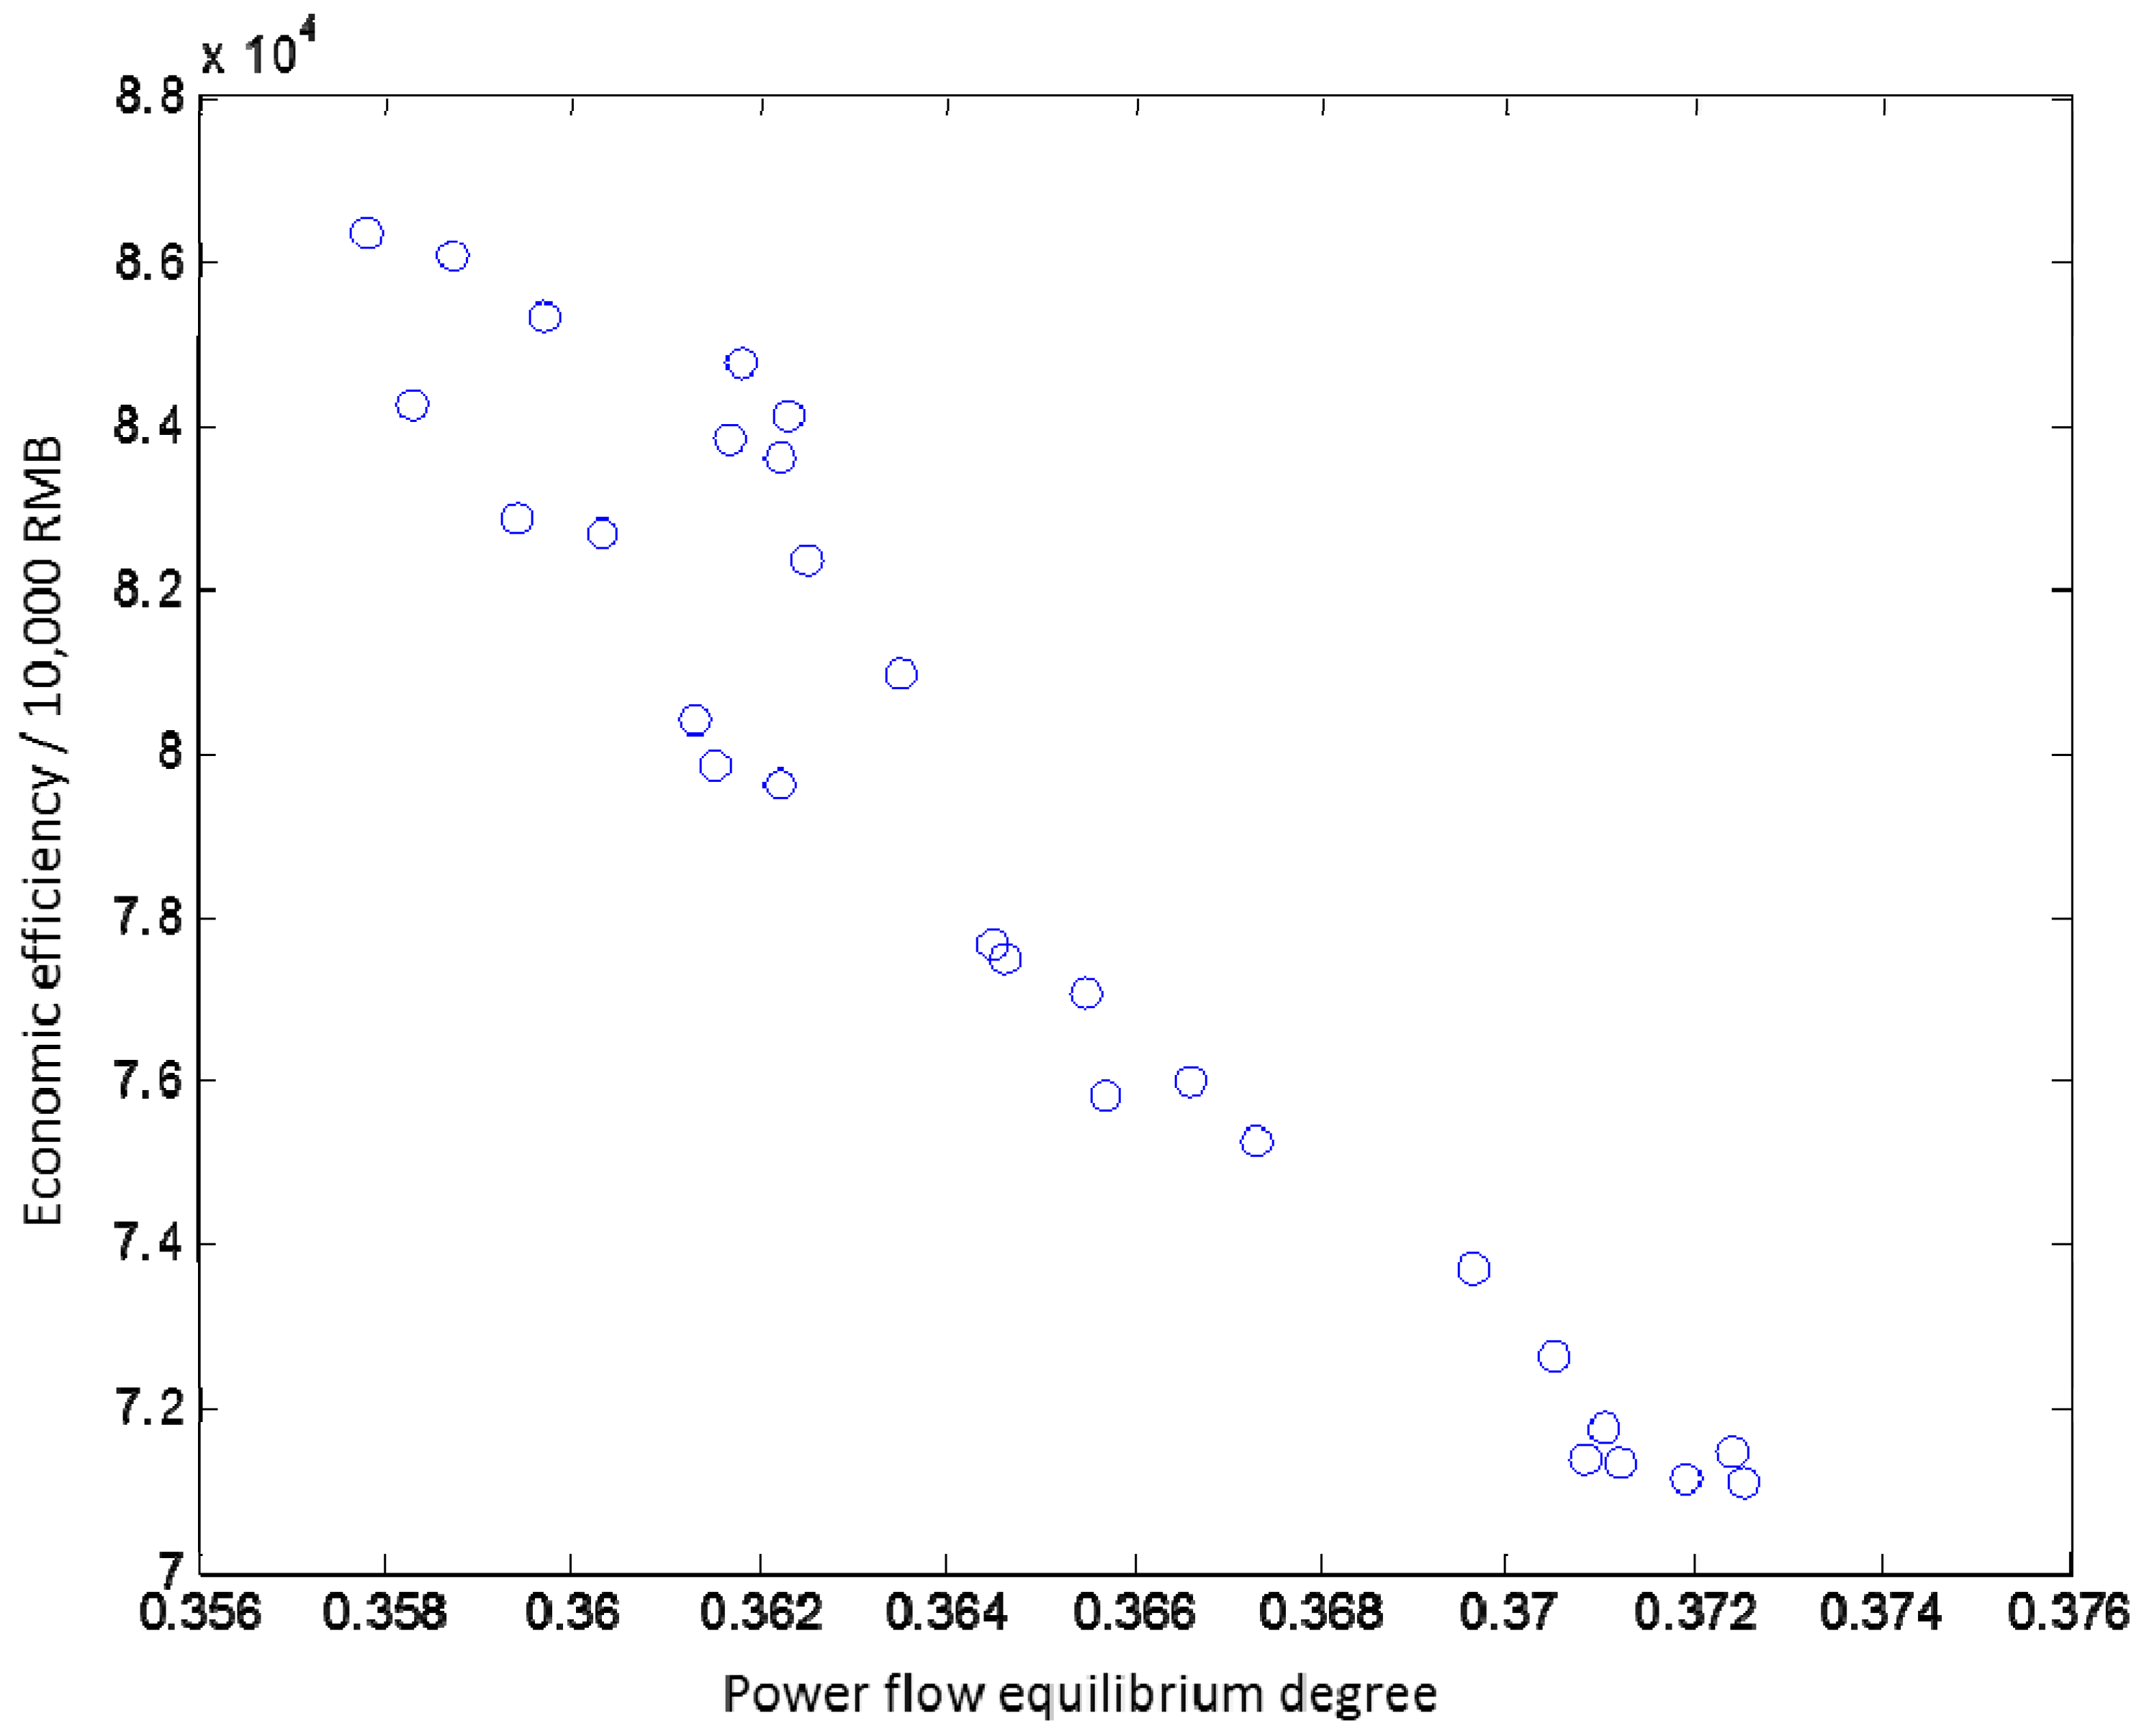
Figure 4.
Diagram test system network in 2020 with the second-phase wind farms.

Table 1.
Power system circumstances in 2020.
| Substation | Voltage Level/kV | Installed Capacity of Conventional Power Plants/MW | Installed Capacity of Wind Farms/MW | Loads/MW | Transmitted Power through HVDC/MW | Equivalent Loads/MW |
|---|---|---|---|---|---|---|
| T1 | 330 | 132 | 550 | 353 | - | 353 |
| T2 | 330 | - | - | 353 | - | 353 |
| T3-1 | 750 | - | - | - | −5000 | −5000 |
| T3-2 | 330 | - | 3500 | - | - | - |
| T4 | 330 | - | 800 | 16 | - | 16 |
| T5-1 | 750 | 6000 | - | - | 8000 | 8000 |
| T5-2 | 330 | - | 2200 | - | - | - |
| T6 | 330 | 224 | 1110 | 176 | - | 176 |
| T7 | 330 | 167 | - | 337 | - | 337 |
| T8 | 330 | 1722 | - | 978 | - | 978 |
| T9-1 | 750 | 3200 | - | - | 2000 | 2000 |
| T9-2 | 330 | 660 | - | 403 | - | 403 |
| T10 | 330 | 408 | - | 1109 | - | 1109 |
Table 2.
Data of the first-phase wind farms and the booster substations.
| Wind Farm’s Booster Substation | Installed Capacity/MW | Accessed 330 kV Substation | Transmission Line’s Length/km |
|---|---|---|---|
| W1-1 | 600 | T3 | 49 |
| W1-2 | 600 | T3 | 36 |
| W1-3 | 400 | T3 | 50 |
| W1-4 | 600 | T3 | 24 |
| W1-5 | 600 | T3 | 39 |
| W1-6 | 700 | T3 | 44 |
| W1-7 | 800 | T4 | 36 |
| W1-8 | 600 | T5 | 28 |
| W1-9 | 600 | T5 | 44 |
| W1-10 | 600 | T5 | 84 |
| W1-11 | 600 | T5 | 35 |
| W1-12 | 600 | T6 | 10 |
Table 3.
Transmission line’s length from W2-1–W2-8 to T1–T6/km.
| Alternate Wind Farm’s Booster Substations | T1 | T2 | T3 | T4 | T5 | T6 |
|---|---|---|---|---|---|---|
| W2-1 | 50 | 56 | 20 | 62 | 110 | 200 |
| W2-2 | 56 | 56 | 30 | 20 | 110 | 205 |
| W2-3 | 60 | 60 | 36 | 50 | 100 | 200 |
| W2-4 | 72 | 72 | 56 | 48 | 90 | 190 |
| W2-5 | 160 | 170 | 150 | 50 | 15 | 110 |
| W2-6 | 160 | 200 | 170 | 90 | 69 | 140 |
| W2-7 | 170 | 190 | 160 | 80 | 56 | 130 |
| W2-8 | 205 | 210 | 170 | 110 | 72 | 90 |
Table 4.
Optimization objective attribute values of the Pareto optimal solution set.
| Pareto optimal Solution Set | Power flow Equilibrium Degree | Economic Efficiency Deviation from the Most Economical Solution (%) |
|---|---|---|
| Solution 1 | 0.3578 | 21.4% |
| Solution 2 | 0.3666 | 6.8% |
| Solution 3 | 0.3725 | 0.0% |
| Solution 4 | 0.3587 | 21.0% |
| Solution 5 | 0.3712 | 0.3% |
| Solution 6 | 0.3719 | 0.1% |
| Solution 7 | 0.3724 | 0.5% |
| Solution 8 | 0.3708 | 0.4% |
| Solution 9 | 0.3594 | 16.5% |
| Solution 10 | 0.3705 | 2.2% |
| Solution 11 | 0.3597 | 20.0% |
| Solution 12 | 0.3719 | 0.1% |
| Solution 13 | 0.3655 | 8.4% |
| Solution 14 | 0.3696 | 3.7% |
| Solution 15 | 0.3613 | 13.1% |
| Solution 16 | 0.3646 | 9.0% |
| Solution 17 | 0.3615 | 12.3% |
| Solution 18 | 0.3625 | 15.9% |
| Solution 19 | 0.3710 | 0.9% |
| Solution 20 | 0.3673 | 5.8% |
| Solution 21 | 0.3617 | 17.9% |
| Solution 22 | 0.3622 | 17.6% |
| Solution 23 | 0.3603 | 16.3% |
| Solution 24 | 0.3657 | 6.6% |
| Solution 25 | 0.3583 | 18.5% |
| Solution 26 | 0.3618 | 19.2% |
| Solution 27 | 0.3623 | 18.3% |
| Solution 28 | 0.3622 | 12.0% |
| Solution 29 | 0.3635 | 13.8% |
| Solution 30 | 0.3645 | 9.2% |
Table 5.
The detailed access location and capacity of the second-phase wind farms of Solution 3.
| Planned Wind Farm Booster Substation | Planned Wind Farm Access Capacity/MW | Accessed 330 kV Substation | Transmission Line’s Length/km | Transmission Line’s Cost/Million RMB |
|---|---|---|---|---|
| W2-1 | 400 | T3 | 20 | 30 |
| W2-2 | 600 | T4 | 20 | 30 |
| W2-3 | 400 | T3 | 36 | 54 |
| W2-4 | 600 | T4 | 48 | 72 |
| W2-5 | 600 | T5 | 15 | 22.5 |
| W2-6 | 600 | T5 | 69 | 10.35 |
| W2-7 | 600 | T5 | 56 | 84 |
| W2-8 | 550 | T5 | 72 | 10.8 |
© 2017 by the authors. Licensee MDPI, Basel, Switzerland. This article is an open access article distributed under the terms and conditions of the Creative Commons Attribution (CC BY) license (http://creativecommons.org/licenses/by/4.0/).
Share and Cite
MDPI and ACS Style
Li, H.; Li, G.; Liu, S.; Wang, Y.; Wang, Z.; Wang, J.; Zhang, N. Research on Optimal Planning of Access Location and Access Capacity of Large-Scale Integrated Wind Power Plants. Energies 2017, 10, 442. https://doi.org/10.3390/en10040442
AMA Style
Li H, Li G, Liu S, Wang Y, Wang Z, Wang J, Zhang N. Research on Optimal Planning of Access Location and Access Capacity of Large-Scale Integrated Wind Power Plants. Energies. 2017; 10(4):442. https://doi.org/10.3390/en10040442
Chicago/Turabian StyleLi, Hui, Gengyin Li, Siwei Liu, Yuning Wang, Zhidong Wang, Jiaming Wang, and Ning Zhang. 2017. "Research on Optimal Planning of Access Location and Access Capacity of Large-Scale Integrated Wind Power Plants" Energies 10, no. 4: 442. https://doi.org/10.3390/en10040442
Note that from the first issue of 2016, this journal uses article numbers instead of page numbers. See further details here.