
Comparison of Impulse Wave and Sweep Frequency Response Analysis Methods for Diagnosis of Transformer Winding Faults

State Key Laboratory of Power Transmission Equipment & System Security and New Technology, Chongqing University, Chongqing 400044, China
*
Author to whom correspondence should be addressed.
Energies 2017, 10(4), 431; https://doi.org/10.3390/en10040431
Submission received: 27 January 2017
/
Revised: 13 March 2017
/
Accepted: 20 March 2017
/
Published: 28 March 2017
(This article belongs to the Special Issue Electric Power Systems Research 2017)
Abstract
:Monitoring of winding faults is the most important item used to determine the maintenance status of a transformer. Commonly used methods for winding-fault diagnosis require the transformer to exit operation before testing and an external exciting signal, whether the transformer is malfunctioning or not. However, if an overvoltage signal can be regarded as a broadband excitation source for fault diagnosis, then the interference caused by signal injection can be eliminated without the need for additional pulse or impulse signals. In this paper, a tapped transformer is designed and test platforms are built to compare winding diagnoses using the impulse wave and sweep frequency response analysis methods by recording voltage responses on both the high- and low-voltage sides and calculating the respective transfer functions. Based on comparison of statistical indicators, it is found that the sensitivities of both methods are similar for detecting conditions of winding-ground and winding-interlayer short circuits. It is concluded that it is feasible to use a transient overvoltage monitoring system for winding-fault diagnosis.
1. Introduction
Power transformers are recognized as one of the most important transmission components in the operation of the power system. Their stability and reliability ensure safe operation of the entire system: once transformer malfunction occurs, the transmission ability of the power system faces a significant threat. Malfunction of long-term transformers often occurs owing to the impact of transient overvoltages. According to [1], statistics show that between 70–80% of the number of total transformer failures are eventually traced back to undetected internal winding faults. Winding faults are a result of severe deterioration of the turn insulation, which tend to cause a breakdown in the dielectric strength of the insulation. This breakdown can cause adjacent windings to short (turn to turn) or a winding to be shorted to ground. Typical transformer failures, such as winding-ground short-circuit and winding interlayer short circuit, seriously damage the internal insulation [2] and affect normal operation. Safety and stability of transformer operation is becoming increasingly important because of the rapid development of ultra-high voltage technologies. It is therefore of significance to detect the existence of transformer faults that can avoid the occurrence of larger power system failures.
Diagnosis of transformer winding faults is usually carried out by testing [3,4] and then simulation [5,6]. Use of finite-element simulation software to simulate the structure of the core [7] and winding, or other real-time electromagnetic field distribution to determine the state of the winding, can determine whether the transformer is functioning normally [8]. Simulation methods can detect winding faults, but lack of operating data limits their practical use. Commonly used winding-fault diagnosis methods require outage of the transformer before testing [9]. There are several common methods including low-voltage impulse testing (LVI) [10], short-circuit impedance measurement method (SCI) [11], frequency response analysis method (FRA) [12,13], partial discharge method (PD) [14] and dissolved gas-in-oil analysis method (DGA) [15]. Using DGA, the relative concentration of various gases in the transformer oil is analyzed to detect transformer winding fault. PD occurrence has been known to produce several types of signals such as electromagnetic wave, sound wave and light, which can be analyzed to diagnose transformer winding fault. However, these tests cannot detect an incipient winding turn to turn fault very fast [16]. FRA is most frequently used to assess the state of windings [17], such as deformations and turn to turn short-circuit [1,16], by measuring their broad-spectrum frequency response transfer function. FRA can be divided into two main types, based on the different signals injected into the transformer: sweep frequency response analysis (SFRA) [18,19,20] and impulse frequency response analysis (IFRA). SFRA is commonly used for offline tests after a transformer failure and is hardly sufficient for preventing transformer failure. Therefore, if IFRA is used as the offline test, the applied impulse voltage should be in accordance with the insulation strength of the transformer. Because the impulse duration is very short, which would not influence the normal operation of the transformer noticeably, IFRA is feasible for online application.
FRA can be used to evaluate the state of a winding by mathematically comparing the transfer function [21,22] curves under normal and fault conditions and determine the type of fault using the correlation coefficient [23] and other statistical indicators. The exciting signal injected by SFRA is a series of sweep signals at different frequencies and a voltage amplitude of several volts; the exciting signal of IFRA is an aperiodic impulse that contains multi-frequency components and a voltage amplitude of several hundred volts. These injected signals may influence the core remanence and obtained data that cannot describe the situation of the windings, leading to inevitable errors. Moreover, these FRA methods need an external pulse or impulse signal generator to conduct the tests. A method for online FRA was put forward [24], in which the signal is injected from the bushing tap by a capacitor, and the response is measured at the neutral point. This method was used offline for detecting a transformer failure in laboratory. Injecting a signal into a bushing tap may cause an insulation fault, which is unaccepted for an operation transformer.
Lightning, operating impulse, and other transient overvoltages occur widely in actual power grids [25]. The overvoltage signal has broad-spectrum characteristics, which makes it possible to be used as an exciting signal for diagnosis of permanent winding faults [26]. Moreover, compared with traditional FRA, the overvoltage signal has greater amplitude and can avoid the insulation failure caused by signal injection. Therefore, if the overvoltage signal can be monitored, it is possible to use this as the exciting source and calculate the transfer function by monitoring the corresponding voltage or current signal of the winding. Transformer faults can therefore be evaluated by comparing their transfer functions under normal and fault conditions. Moreover, use of a transient overvoltage with greater amplitude could demonstrate the real operating performance of a transformer, thereby realizing online fault diagnosis of transformer winding faults based on overvoltage monitoring.
In recent years, we have invented a series of transient overvoltage sensors, such as the bushing capacitive divider and non-contact overvoltage monitoring system [27,28], that are applied to operating power systems, as shown in Figure 1. Transient overvoltages at the high-voltage (HV) and low-voltage (LV) windings can be monitored. These sensors make the monitoring of transformer winding insulation using transient overvoltages possible. Unlike SFRA and IFRA, the voltage level of such transient overvoltage signals applied to a transformer can be of the order of kilovolts; the impulse wave method was therefore selected for the experimental testwork. The impulse wave method uses a transient overvoltage signal, which can be obtained by sensors of the overvoltage monitoring system as the exciting signal to diagnose the transformer winding faults, and has the potential for online application. Because voltage sensors are normally set on both sides of the transformer winding when they are installed on the real transformer, the transient voltage data is the most convenient to be acquired in the field tests. Thus, the voltage transfer function is selected to evaluate the impulse wave method. This uses a lightning impulse with high amplitude voltage as the excitation signal from which the voltage transfer function is obtained. Therefore, in this paper, to find out the transient overvoltage response performance of a transformer, in order to widen the application of overvoltage monitoring, it could also present a feasible method for transformer winding fault diagnosis based on overvoltage monitoring. Therefore, to verify whether the impulse wave method can diagnose the occurrence of transformer winding fault, the winding-ground fault and the interlayer-winding fault are selected to figure out whether the sensitivity of the impulse wave method is similar to that of the SFRA method. The impulse wave method, using a lightning impulse of 4 kV as the exciting signal, is compared with the common SFRA method by measuring the winding voltages under normal and two fault conditions. The transfer functions under different faults conditions are calculated and then analyzed using statistical indicators to describe the differences between two curves. For the transformer winding used in these experiments, it is found that the sensitivity of the impulse wave method is similar to that of SFRA under conditions of winding-ground and winding-interlayer short-circuit faults. The results demonstrate that the impulse wave method could be feasible for online diagnosis of transformer winding faults.
2. Sweep Frequency Response Analysis and Impulse Wave Methods
2.1. Sweep Frequency Response Analysis
SFRA is a non-intrusive (non-destructive), offline testing method that can be carried out for any rated voltage of power, generator, or distribution transformer.
As shown in Figure 2a, by injecting a series of sweep signal waves, UIN, at different frequencies on the HV side of the transformer, a response voltage, UOUT, can be obtained. After filtering and calculating, the transfer function of the winding can be obtained as:
H(dB) = 20 log(UOUT/UIN)
A transformer winding can be considered as a network consisting of resistors, capacitors, and inductors. When an insulation fault occurs, the transfer function changes, so the winding state can be evaluated by analyzing the transfer function.
2.2. Impulse Wave Method
As shown in Figure 2b, if an overvoltage signal with high amplitude is applied to the transformer HV side, the response voltage wave, UOUT, on the LV side can be obtained from an overvoltage monitoring system. By Fourier Transform of the measured voltage, the spectrum relationship can be obtained and the transfer function can then be calculated. The voltage transfer function, in the form of gain, can be calculated by fast Fourier Transform (FFT) of the output voltage at LV and input voltage at HV:
TF(dB) = 20 log(FFT (UOUT)/FFT (UIN))
As with the SFRA method, analysis of the transfer function will indicate whether a winding fault exists.
3. Experimental Setup
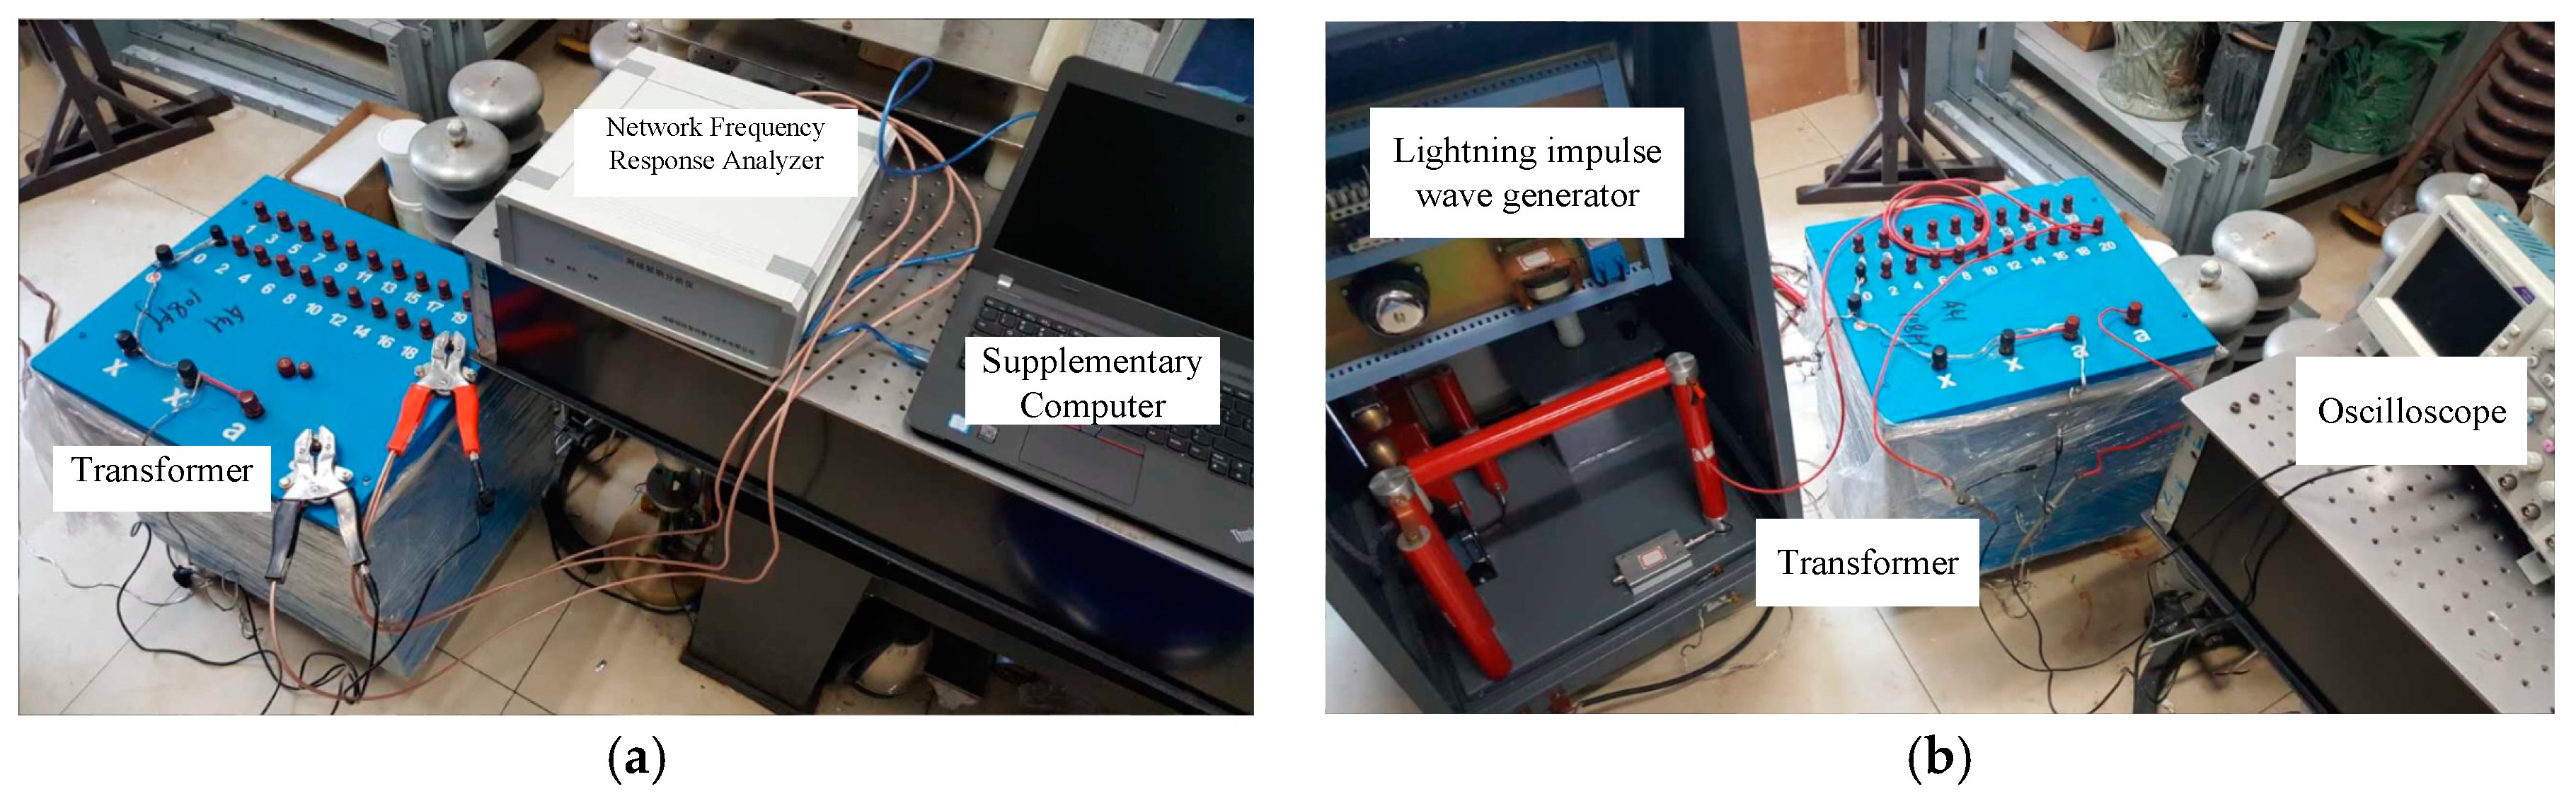
To compare the impulse wave and SFRA methods and demonstrate the feasibility of the former, a test platform was built that included a 10 kVA 220 V/2400 V transformer and voltage monitoring system, which applied to HV tap 20 and LV tap, consisting of voltage probes and a DPO7104C Tektronix oscilloscope (Tektronix, Shanghai, China). To simulate faults in the transformer windings under conditions of winding-ground and winding-interlayer short-circuits, a tapped transformer was designed. This contained a transformer core, winding, and taps. Metal connections from taps to ground and between taps, respectively, simulated winding-ground and winding-interlayer short-circuits. The impulse wave method was simulated by injecting a high-amplitude lightning voltage wave to the HV side of the transformer, and the response was obtained by measuring the voltage signals on both the HV and LV sides.
3.1. Test Circuits
The SFRA and impulse wave methods are compared with respect to fault diagnosis using two platforms based on a tapped transformer, as shown in Figure 3.
3.1.1. Diagnosis Platform Using the SFRA Method
The platform using the SFRA method based on the tapped transformer is shown in Figure 3a.
The exciting source is an HR2000 network frequency response analyzer that could output a series of sine waves at different frequencies with a peak-to-peak voltage, Vpp, of 20 V. The exciting signals injected at HV are sine waves with evenly distributed frequencies from 20 kHz to 2 MHz and Vpp = 20 V. The transformer function curves are obtained from the supporting software or calculated using Equation (1).
3.1.2. Diagnosis Platform Using Impulse Wave Method
The lightning impulse generator in Figure 3b is type LHCJ-10, with a rated energy of 0.1 kJ and total impact capacitance of 2 μF. The load capacitance of the generator is 700 to 6000 pF and the maximum output voltage is 10 kV. The rated capacitance of the generator outputting the entire lightning impulse is 1 kVA. The voltage efficiency is greater than 80%. The experiments use a standard lightning wave of 4 kV amplitude, with wave front and tail times of 1.2 and 50 μs, respectively. The amplitude of the injected lightning voltage is in accordance with the insulation strength, which could guarantee that the insulation is not damaged by the tests. Moreover, during the laboratory test, voltage transfer function under normal condition is always measured before the next test under fault condition. These transfer function curves were compared to confirm that the insulation of the transformer is not damaged.
The lightning impulse wave, UIN, is injected on the HV side and the response voltage, UOUT, is measured at the LV side. The spectrum relationship is obtained by FFT and the transfer function calculated from Equation (2).
3.2. Transformer Design
The rated power of the transformer is 10 kVA. The diameter D of the transformer core is 105 mm; the iron core is constructed of rectangular sheets of silicon steel. The cross-sectional shape and size are shown in Figure 4. Considering a laminating factor of 0.95, the effective cross-sectional area, S, of the core is 75.4 cm2.
The number of HV winding turns is 960. HV winding is divided into two parts evenly. Windings with 48 turns as a layer and a total of 20 layers are enwound continuously around the outside of the core. Each layer leads to a tap, and the number of taps is 20. The LV winding is also a layer winding. The space between core and winding is filled with epoxy cloth and epoxy tube. A schematic of the tap arrangement is shown in Figure 5.
The HV winding taps are designed to conveniently simulate winding short-circuit faults. Short circuits between taps and ground and between taps are used to simulate winding-ground and winding-interlayer short-circuit conditions, respectively.
4. Results
4.1. Voltage Transfer Functions Using the SFRA Method
By injecting a series of sine signals at the HV side, the response voltage signal at HV is obtained and the voltage transfer function calculated from Equation (1).
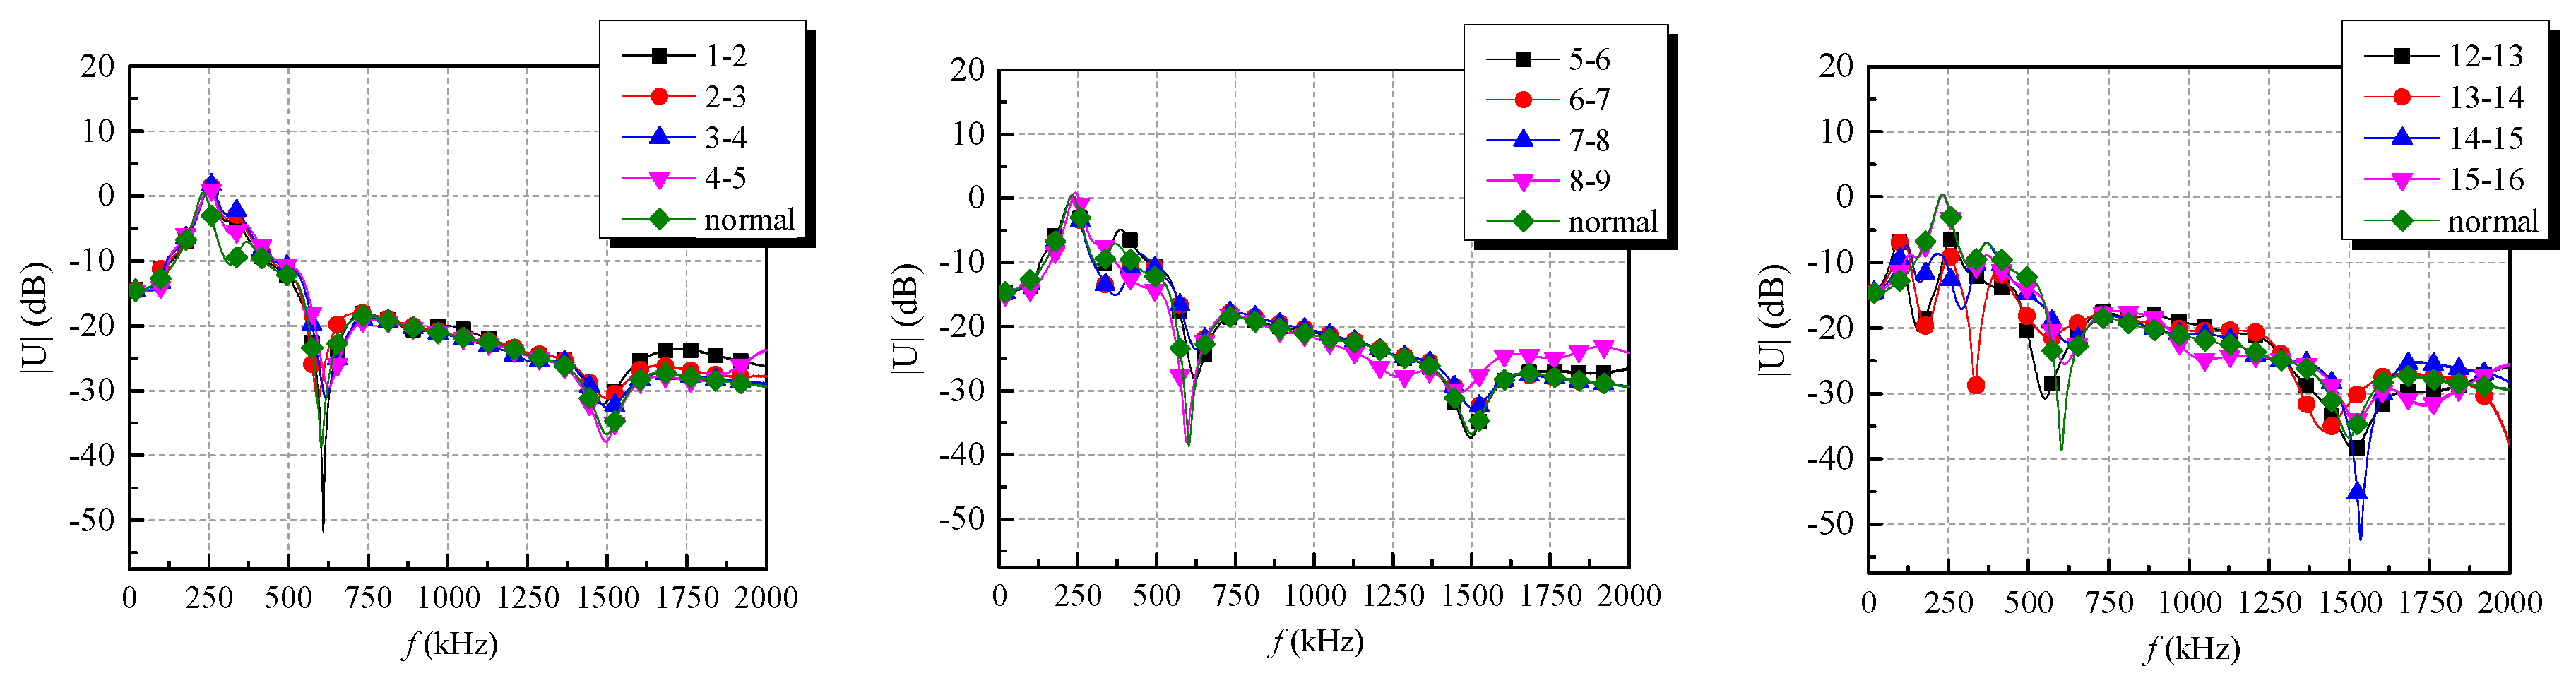
4.1.1. Voltage Transfer of Winding-Ground Short-Circuit Faults
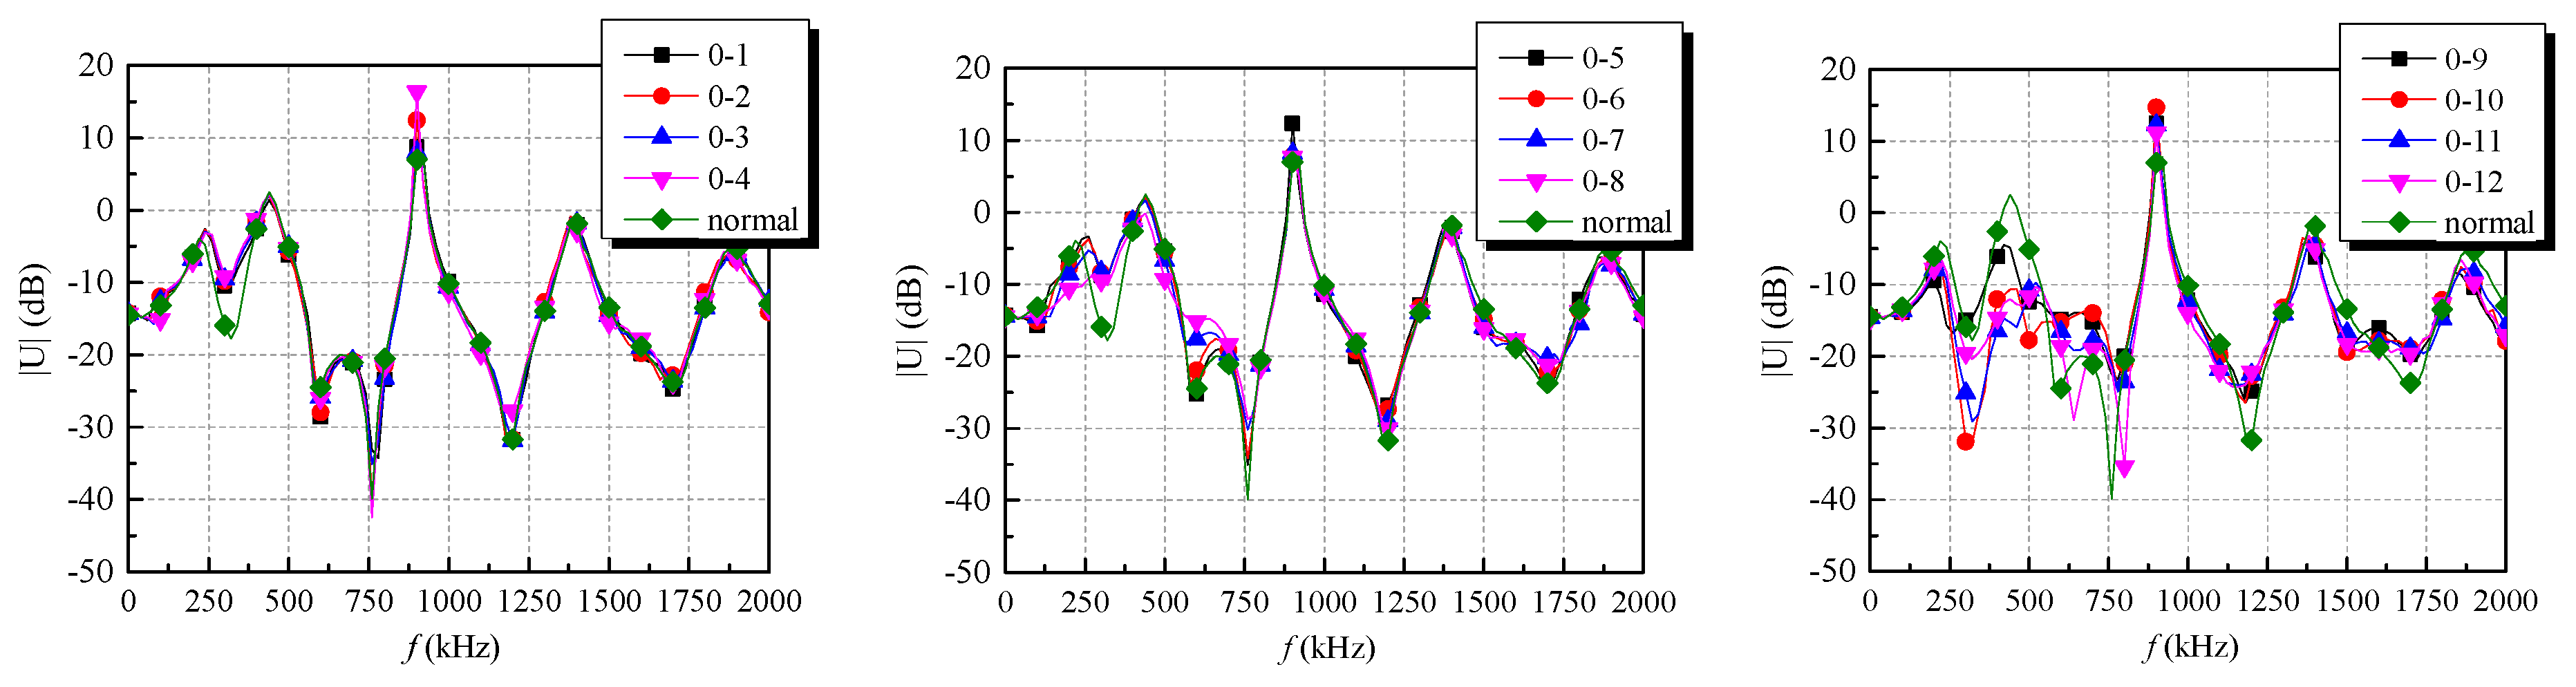
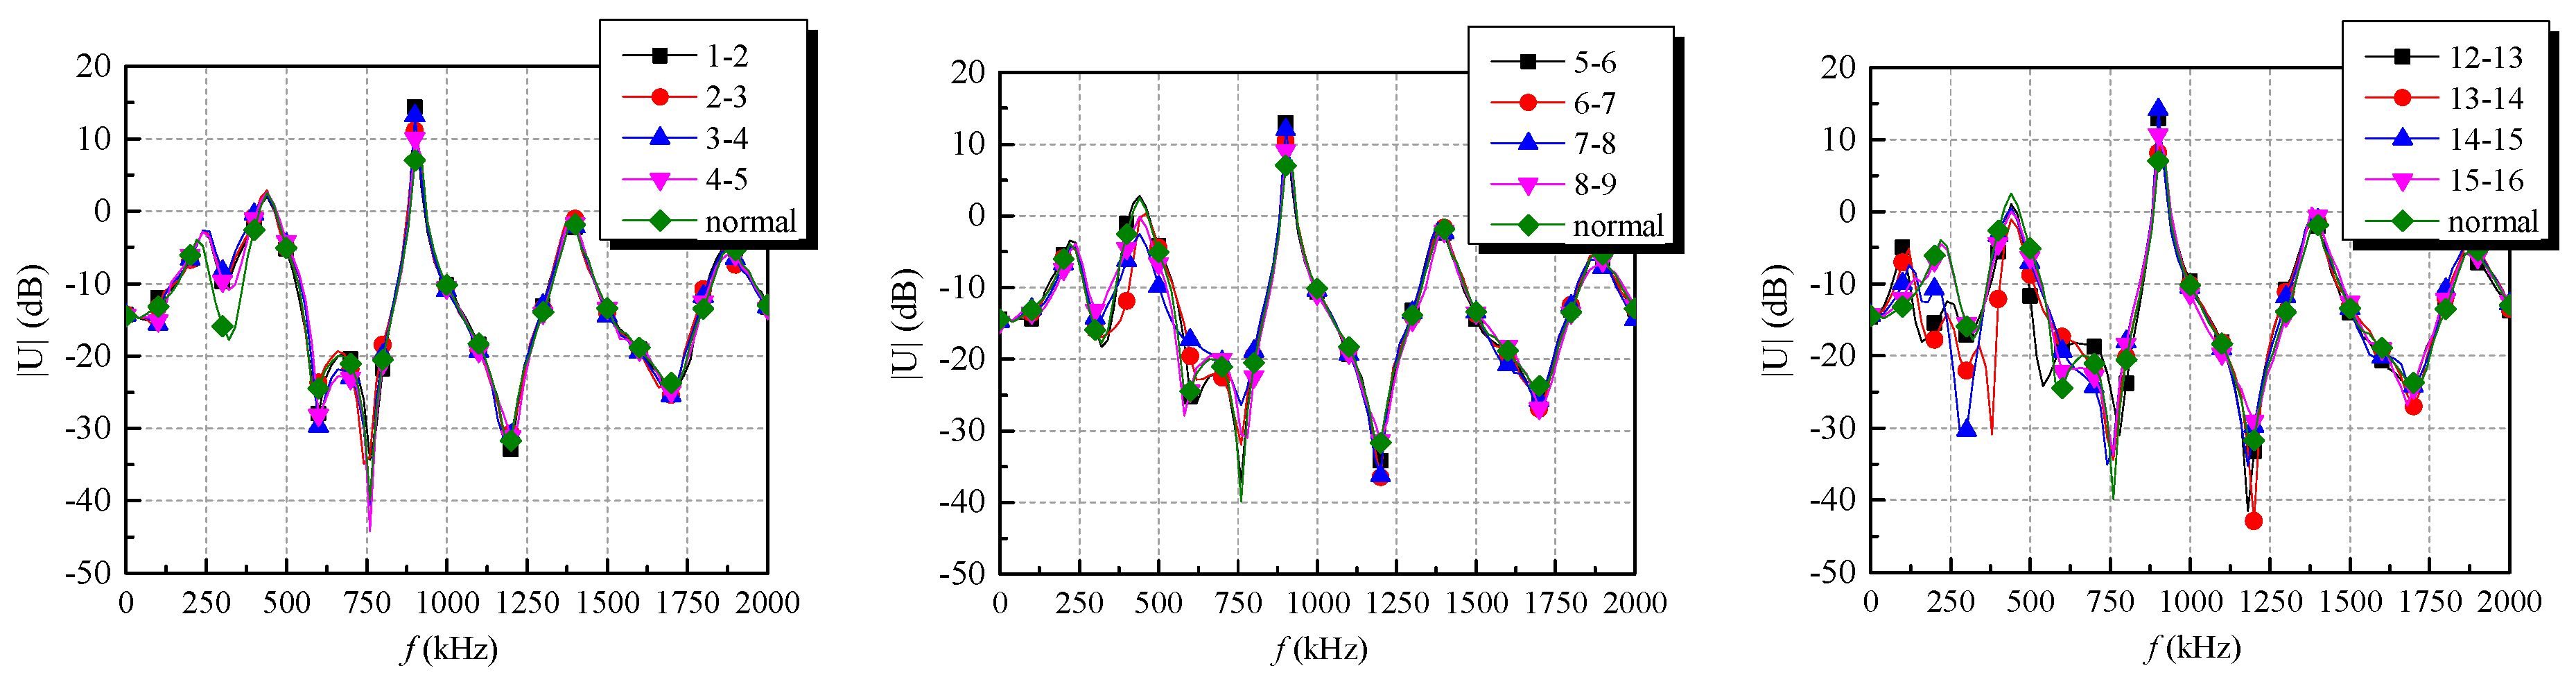
While the winding is functioning normally, a winding-ground short circuit is simulated by metal connecting between a transformer tap and the grounding wire. The transfer functions acquired are shown in Figure 6. The legends of Figure 6, Figure 7, Figure 8, Figure 9, Figure 10 and Figure 11 refer to the following: ‘normal’ represents normal operating conditions; |U| is the voltage transfer function; f represents frequency; 0 represents the HV winding ground; the numbers 1 to 20 stand for the respective taps; 0–1 represents a short circuit between ground and tap 1; and 1–2 represents an interlayer short circuit between taps 1 and 2. The other short-circuit conditions have analogous interpretations.
Figure 6 shows the frequency response voltage transfer functions for various winding-ground short-circuit conditions. Resonance points occur at 600 and 1500 kHz under normal conditions. When a winding-ground fault occurred (an increment in number means that the fault is more serious), the resonance point at 600 kHz shift lower and the resonance point at 1500 kHz shift to lower frequency. When fault 0–12 is simulated, a new resonance point appears at 600 kHz.
4.1.2. Voltage Transfer of Winding-Interlayer Short-Circuit Faults
Inserting a metal connection between specific taps of the transformer simulated interlay-winding short-circuit faults. The voltage transfer functions are obtained as discussed above and shown in Figure 7.
As shown in Figure 7, the resonance points at both 600 and 1500 kHz shift upward. With an increment in tap number, the curve after the resonance at 1500 kHz also shift upward, but when faults 13–14 and above occur, an additional resonance appears at 350 kHz and the curve shifts after the resonance at 1500 kHz varied.
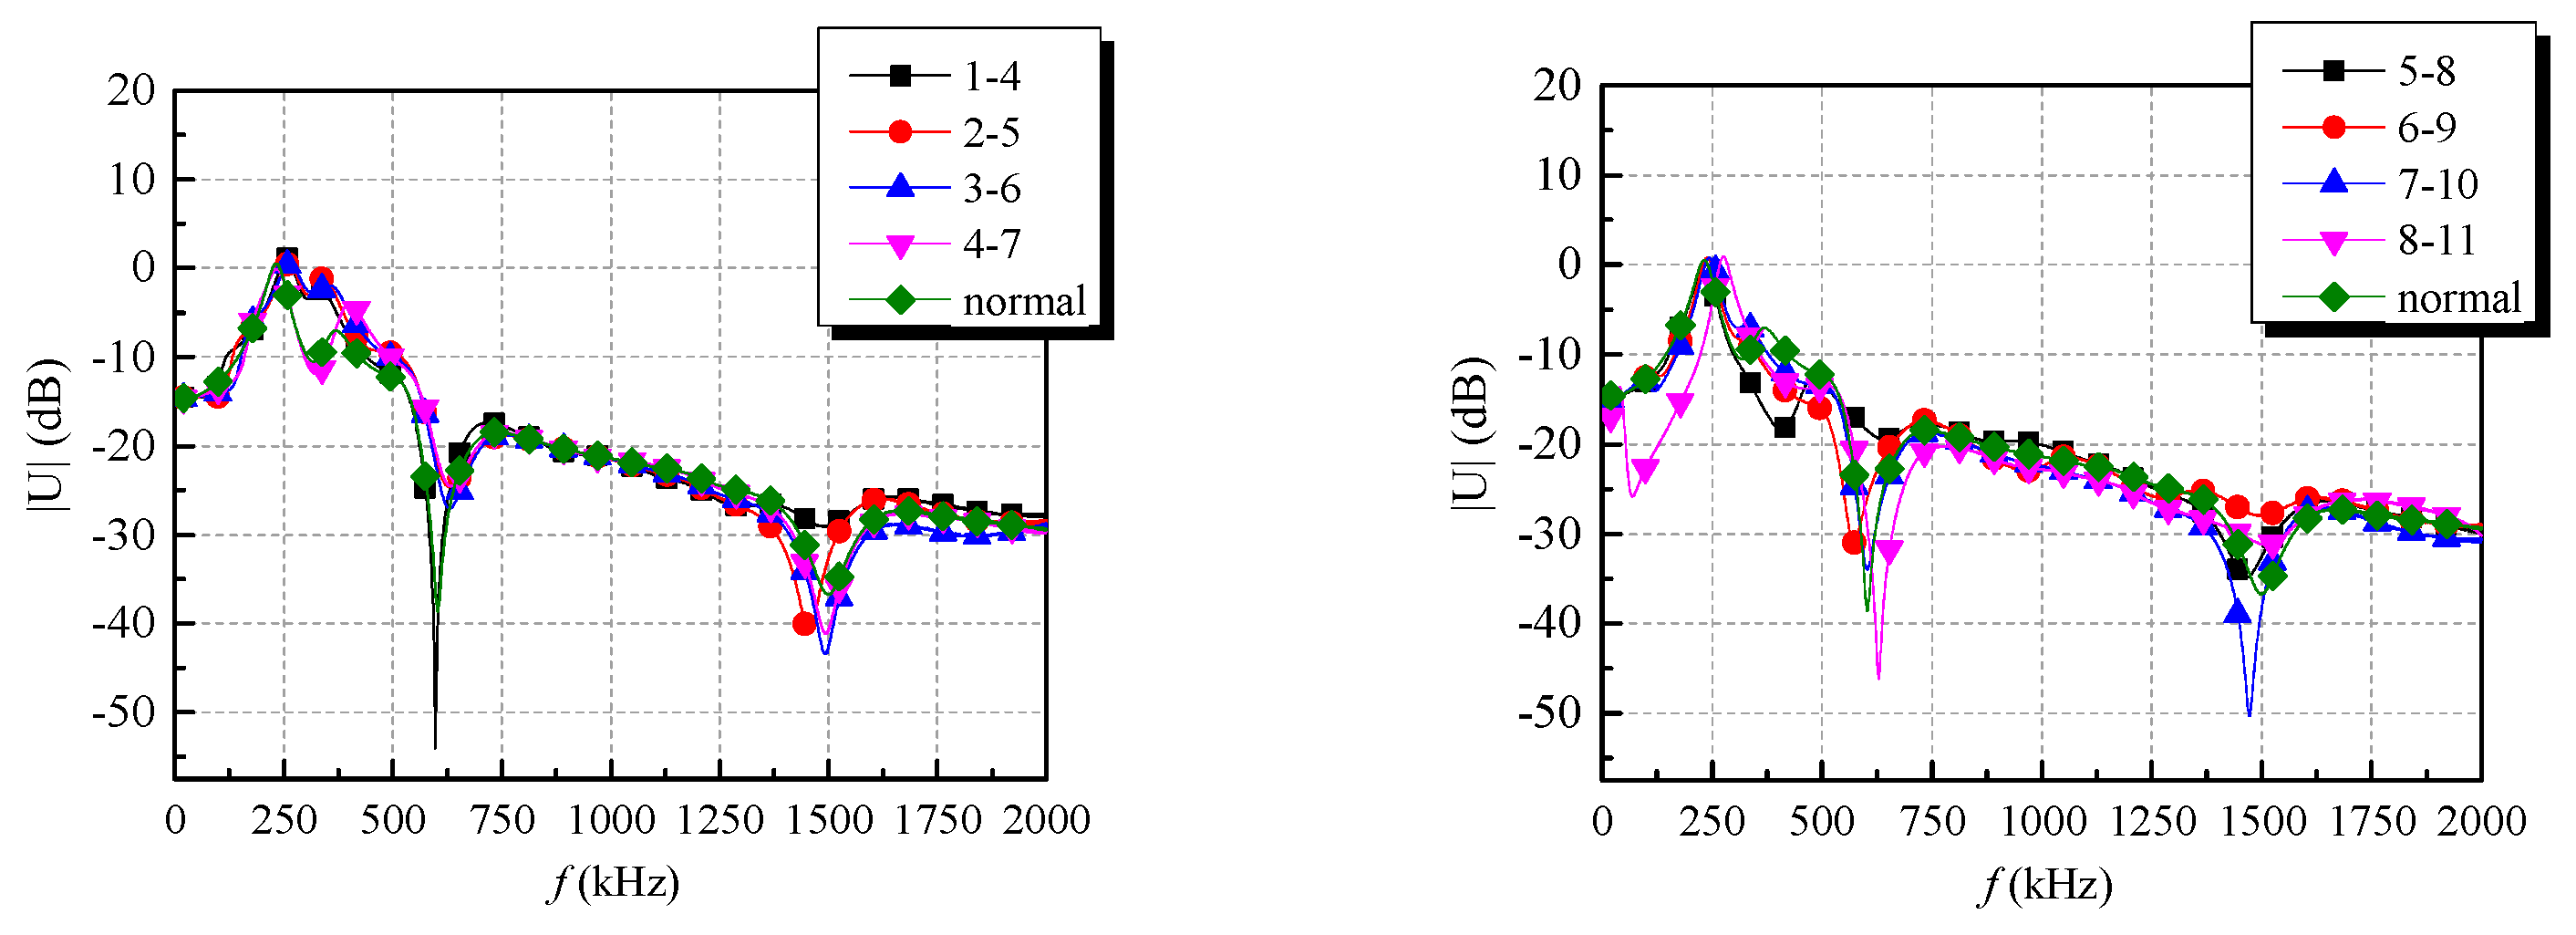
Considering three- and six-interlayer short-circuit faults, Figure 8 shows the respective voltage transfer functions. For shorting of three interlayers, both resonance points shift variably and the entire curve starts to shift; for six interlayers, the resonance point at 600 kHz shifts to the upper left, but other regular patterns are not found.
4.2. Voltage Transfer Function Using the Impulse Wave Method
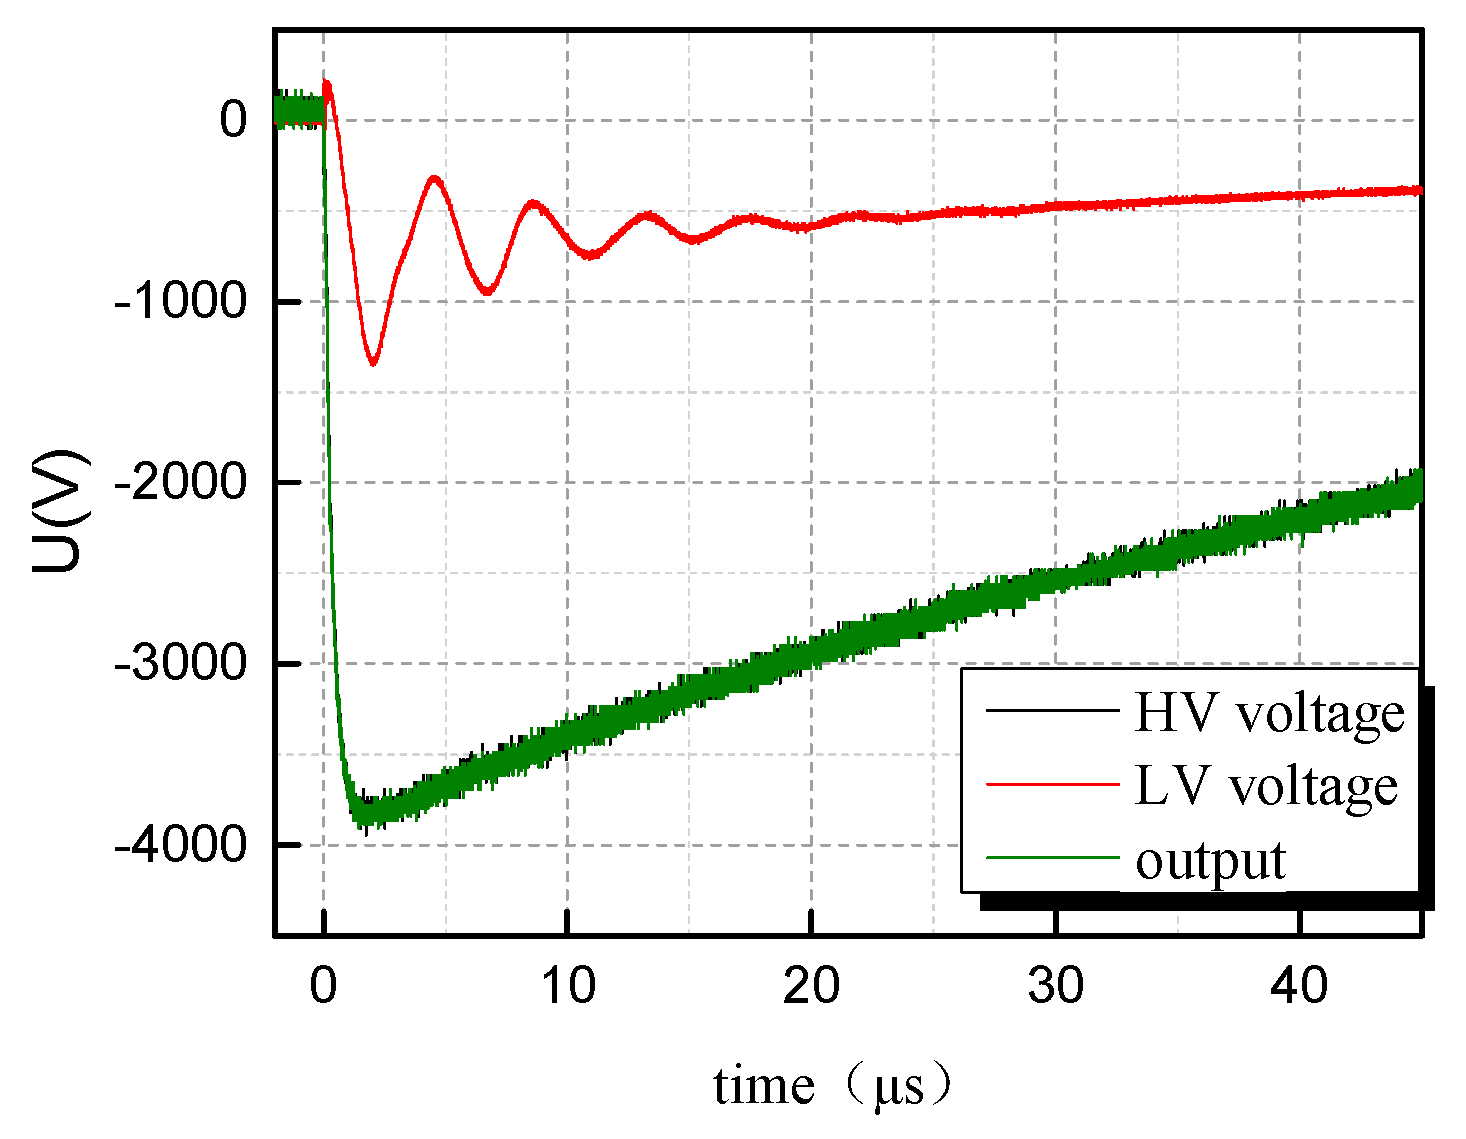
An impulse wave with a front and tail time of 1.2 and 50 μs, respectively, and amplitude of 4 kV, generated by the impulse wave generator as a standard lightning impulse, is injected on the HV side of the transformer. The HV and LV response voltages are measured. The obtained voltage waves at HV and LV are shown in Figure 9.
4.2.1. Voltage Transfer of Winding-Ground Short-Circuit Faults
Short circuits between winding and ground are simulated as described in Section 4.1.1. The resulting frequency response voltage transfer functions calculated from Equation (2) are shown in Figure 10.
There are five resonance points in the transfer function curves acquired by this method: at 300, 550, 750, 1200, and 1650 kHz. When minor winding-ground faults occur, the resonance points at 300 and 550 kHz shift up, while there is little change in the others; when major winding-ground faults occurs, the resonance points at 300 kHz shift down and all others shift upward.
4.2.2. Voltage Transfer of Winding-Interlayer Short-Circuit Faults
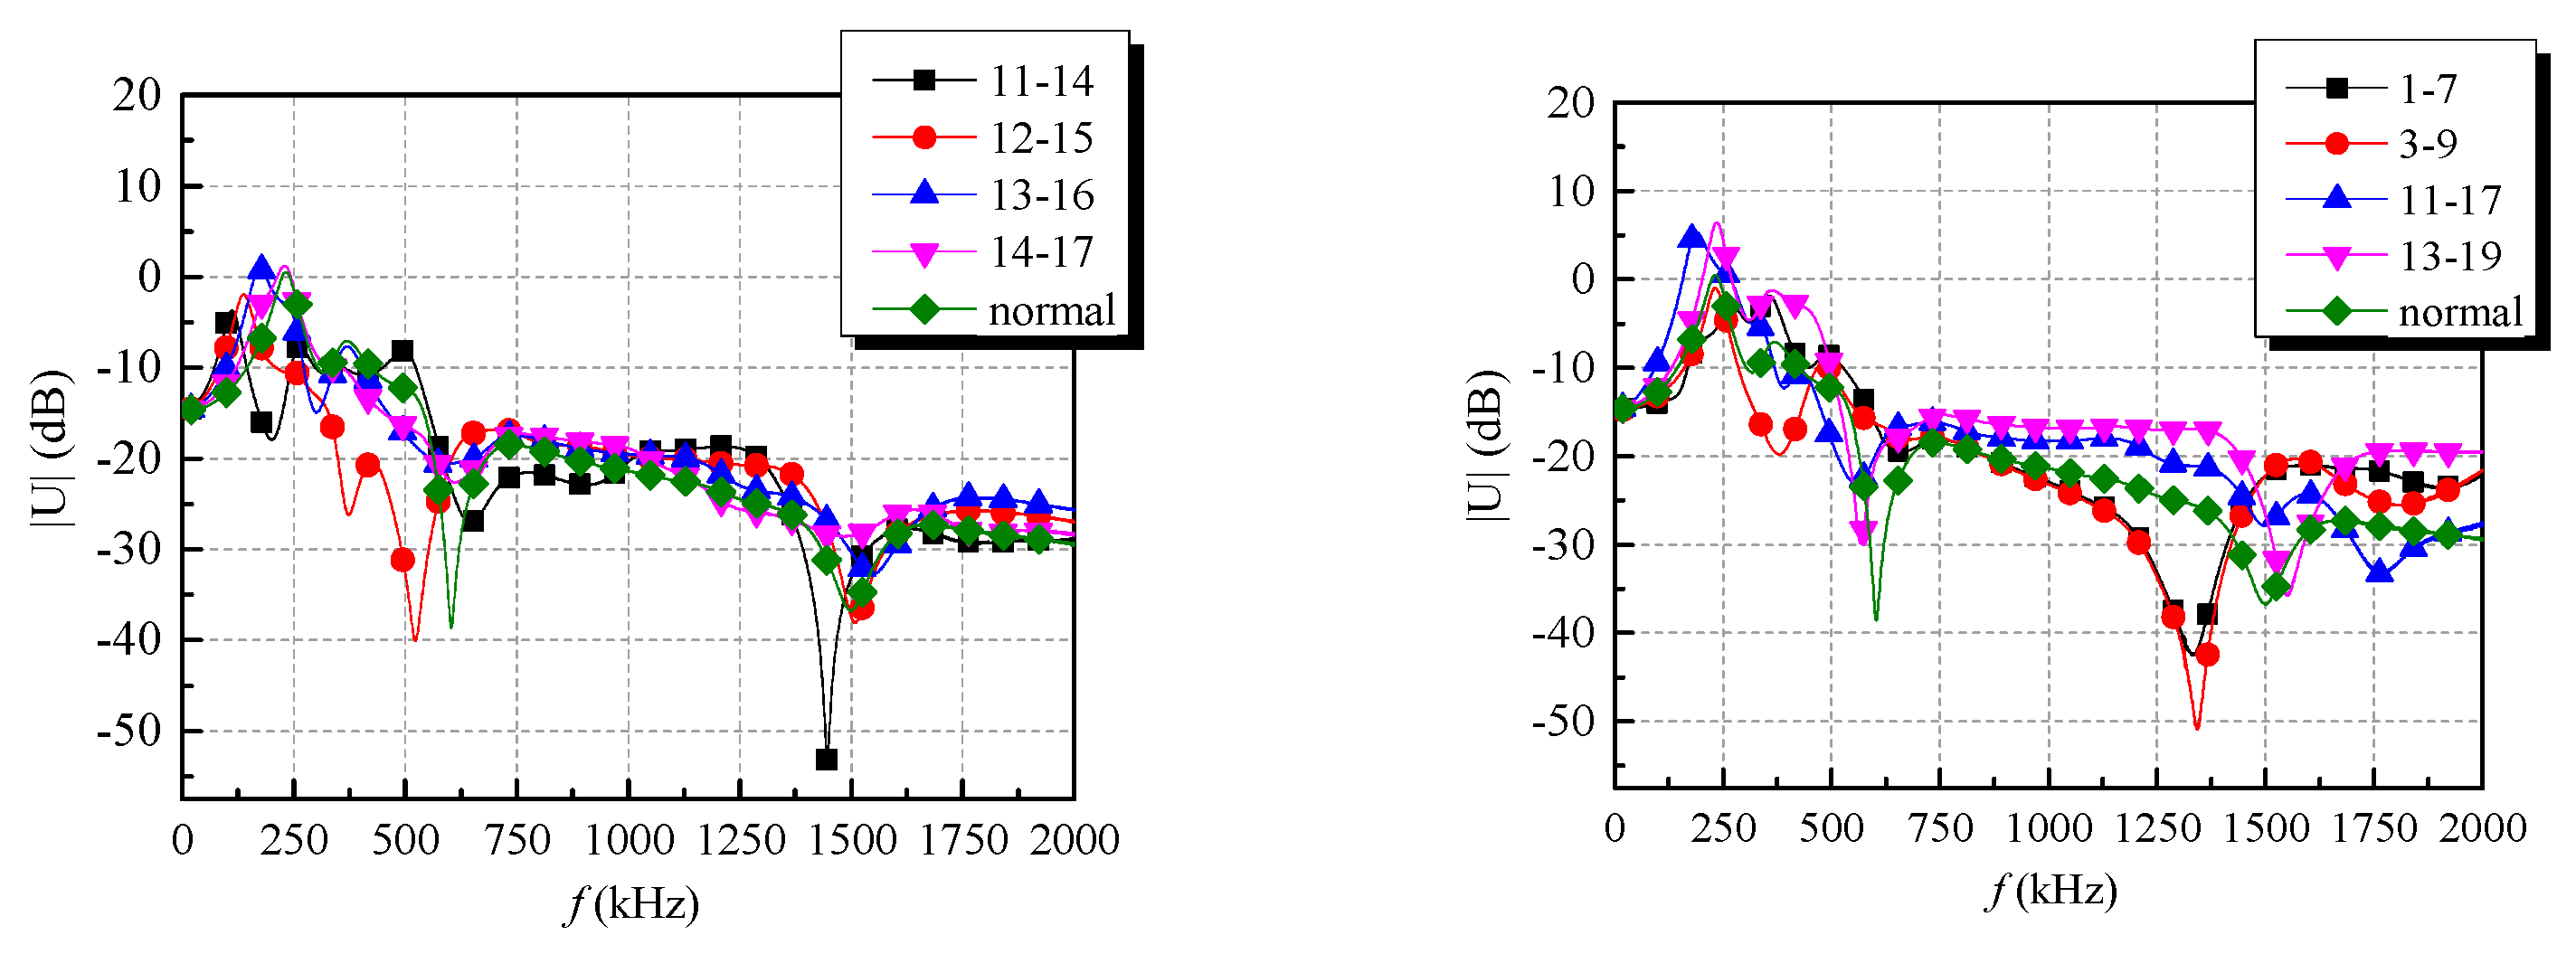
Interlayer-winding short-circuit faults are simulated as described in Section 4.1.2. The calculated voltage transfer functions of adjacent winding tap short-circuit faults are shown in Figure 11. The transfer functions for three- and six-layer short circuits are shown in Figure 12.
As shown in Figure 11, the voltage transfer functions of single interlayer-winding short-circuit faults are obviously different from that under normal conditions. When faults 5–6 and below occur, only changes in the first resonance at 300 kHz are distinguishable. When the fault location approaches the HV ending at tap 20, the curve before the 750 kHz resonance shifts in a variable manner, and other two resonance points shift downward and left.
Figure 12 shows that the 300 kHz resonance point shift upward when three winding interlayers are short circuited at taps 4–7 and below. When the short location approaches the HV end at tap 20, the first resonance point at 300 kHz shifts to the lower left, that at 1200 kHz shifts downward, and the curve before the 750 kHz resonance shifts to the lower left. For a six-interlayer short circuit, the entire curve shifts up and the curve below 750 kHz changes in a variable manner.
For the |U| of parts of the curves greater than 0, as the tests proceed under high voltage conditions, the wave interference caused by reflection and refraction of the impulse waves, which was applied at HV, may cause the voltage obtained at LV to be higher than that at HV. Furthermore, since this phenomenon only appeared beside the resonance points, the equivalent impedance at HV becoming lower, owing to the resonant effect, should also be considered.
5. Comparison of SFRA and Impulse Wave Methods
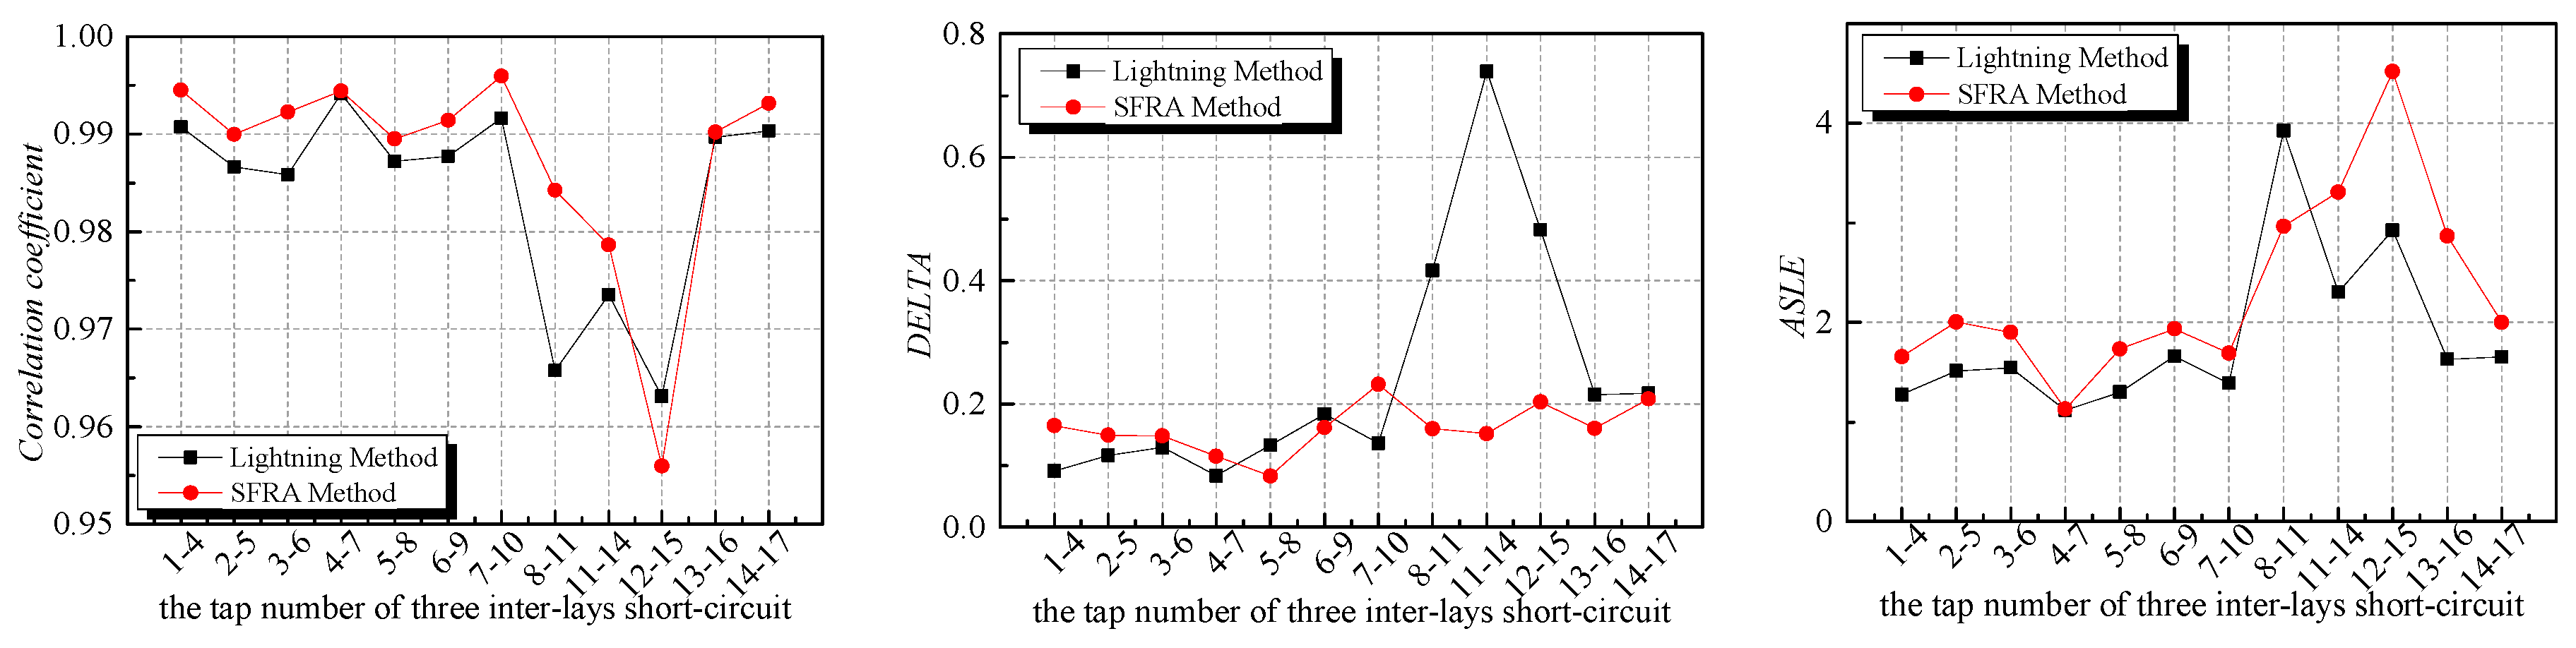
The fault diagnosis of transformer windings can be realized by analyzing the differences of the transfer function curves under normal and fault conditions. To quantitatively analyze the difference between the voltage transfer function under normal and malfunctioning conditions, three statistical indicators are used. The change of statistical indicators under different types of transformer winding faults is presented when the voltage transfer function curves are obtained in the tests. These three indicators are the correlation coefficient, the absolute sum of logarithmic error and the spectrum deviation. The description of the shift of the resonance points is also presented. Since the amount of the resonance points under the impulse wave method is more than that under SFRA, it is hard to find out the characteristics between the shift of the resonance point and the faults. The correlation coefficient ρ(X, Y), spectrum deviation σ(X, Y) (DELTA), and the absolute sum of logarithmic error (ASLE) are, respectively, defined as:
where vectors X = (x1, x2, …, xn) and Y = (y1, y2, …, yn) denote data vectors of the two frequency responses and n is the number of frequency points. These indicators can convert a graphical depiction into a change of value that can directly indicate whether a fault has occurred. The spectrum deviation σ(X, Y) approaches zero and the correlation coefficient ρ(X, Y) approaches 1 when the shapes of X and Y are similar to each other; ASLE is very useful in terms of representing a logarithmic vertical axis.
Figure 13, Figure 14, Figure 15 and Figure 16 compare these three statistical indicators for the SFRA and impulse wave methods under conditions of winding-ground and single-, three-, and six-interlayer-winding faults.
The correlation coefficient of the SFRA method is slightly larger than that of the impulse wave method under the same conditions for all fault cases. As changes of location of the winding-ground and interlayer-winding short-circuit faults occur, the overall trends of the correlation coefficients for both methods are similar. In the case of winding-ground faults, the correlation coefficient decreased with increase of tap number, which means that the smaller the correlation coefficient, the more severe is the fault. In the case of winding-interlayer short circuits, changes of correlation coefficients are related to changes in fault location and have no direct correlation with the severity of the fault. When taps 12 and 13 are metal-connected, the correlation coefficient is smallest.
Considering the DELTA values, the two methods are similar. Under winding-ground conditions, DELTA of the impulse wave method increases when the fault location approaches the HV ending at tap 20, which means that the severity of such faults can be indicated by DELTA from the impulse wave method. For interlayer short-circuit faults, the DELTA values of both methods have their own patterns with respect to changes of position of the fault.
Considering ASLE, the trends for the two methods are the same, with the values of SFRA being larger. In both cases, the ASLE could indicate the severity of a winding-ground fault, but not of an interlayer fault.
The correlation coefficients of the voltage transfer function of the winding-ground fault obtained by the SFRA method and the impulse wave method are both less than 0.99. In addition, the correlation coefficient of the voltage transfer function of the winding-ground fault obtained by the SFRA method and the impulse wave method are both less than 0.98. It can also be found out that the statistical indicators present the same level at magnitude under the same winding fault conditions for both of the two test methods. The sensitivities of the impulse wave and SFRA methods to winding-interlayer short-circuit faults are quite similar for the transformer windings used in this experiment; however, the SFRA method could better determine the severity of winding-ground short-circuit faults. This is because SFRA will commonly apply a frequency range of 1 kHz to 1 MHz to the transformer; however, the frequency response of the impulse wave method can approach 10 MHz. As Figure 10, Figure 11 and Figure 12 show, the differences between transfer function curves mainly occur at frequencies below 1 MHz: the first and second resonance points shift obviously, but there is little change in the others.
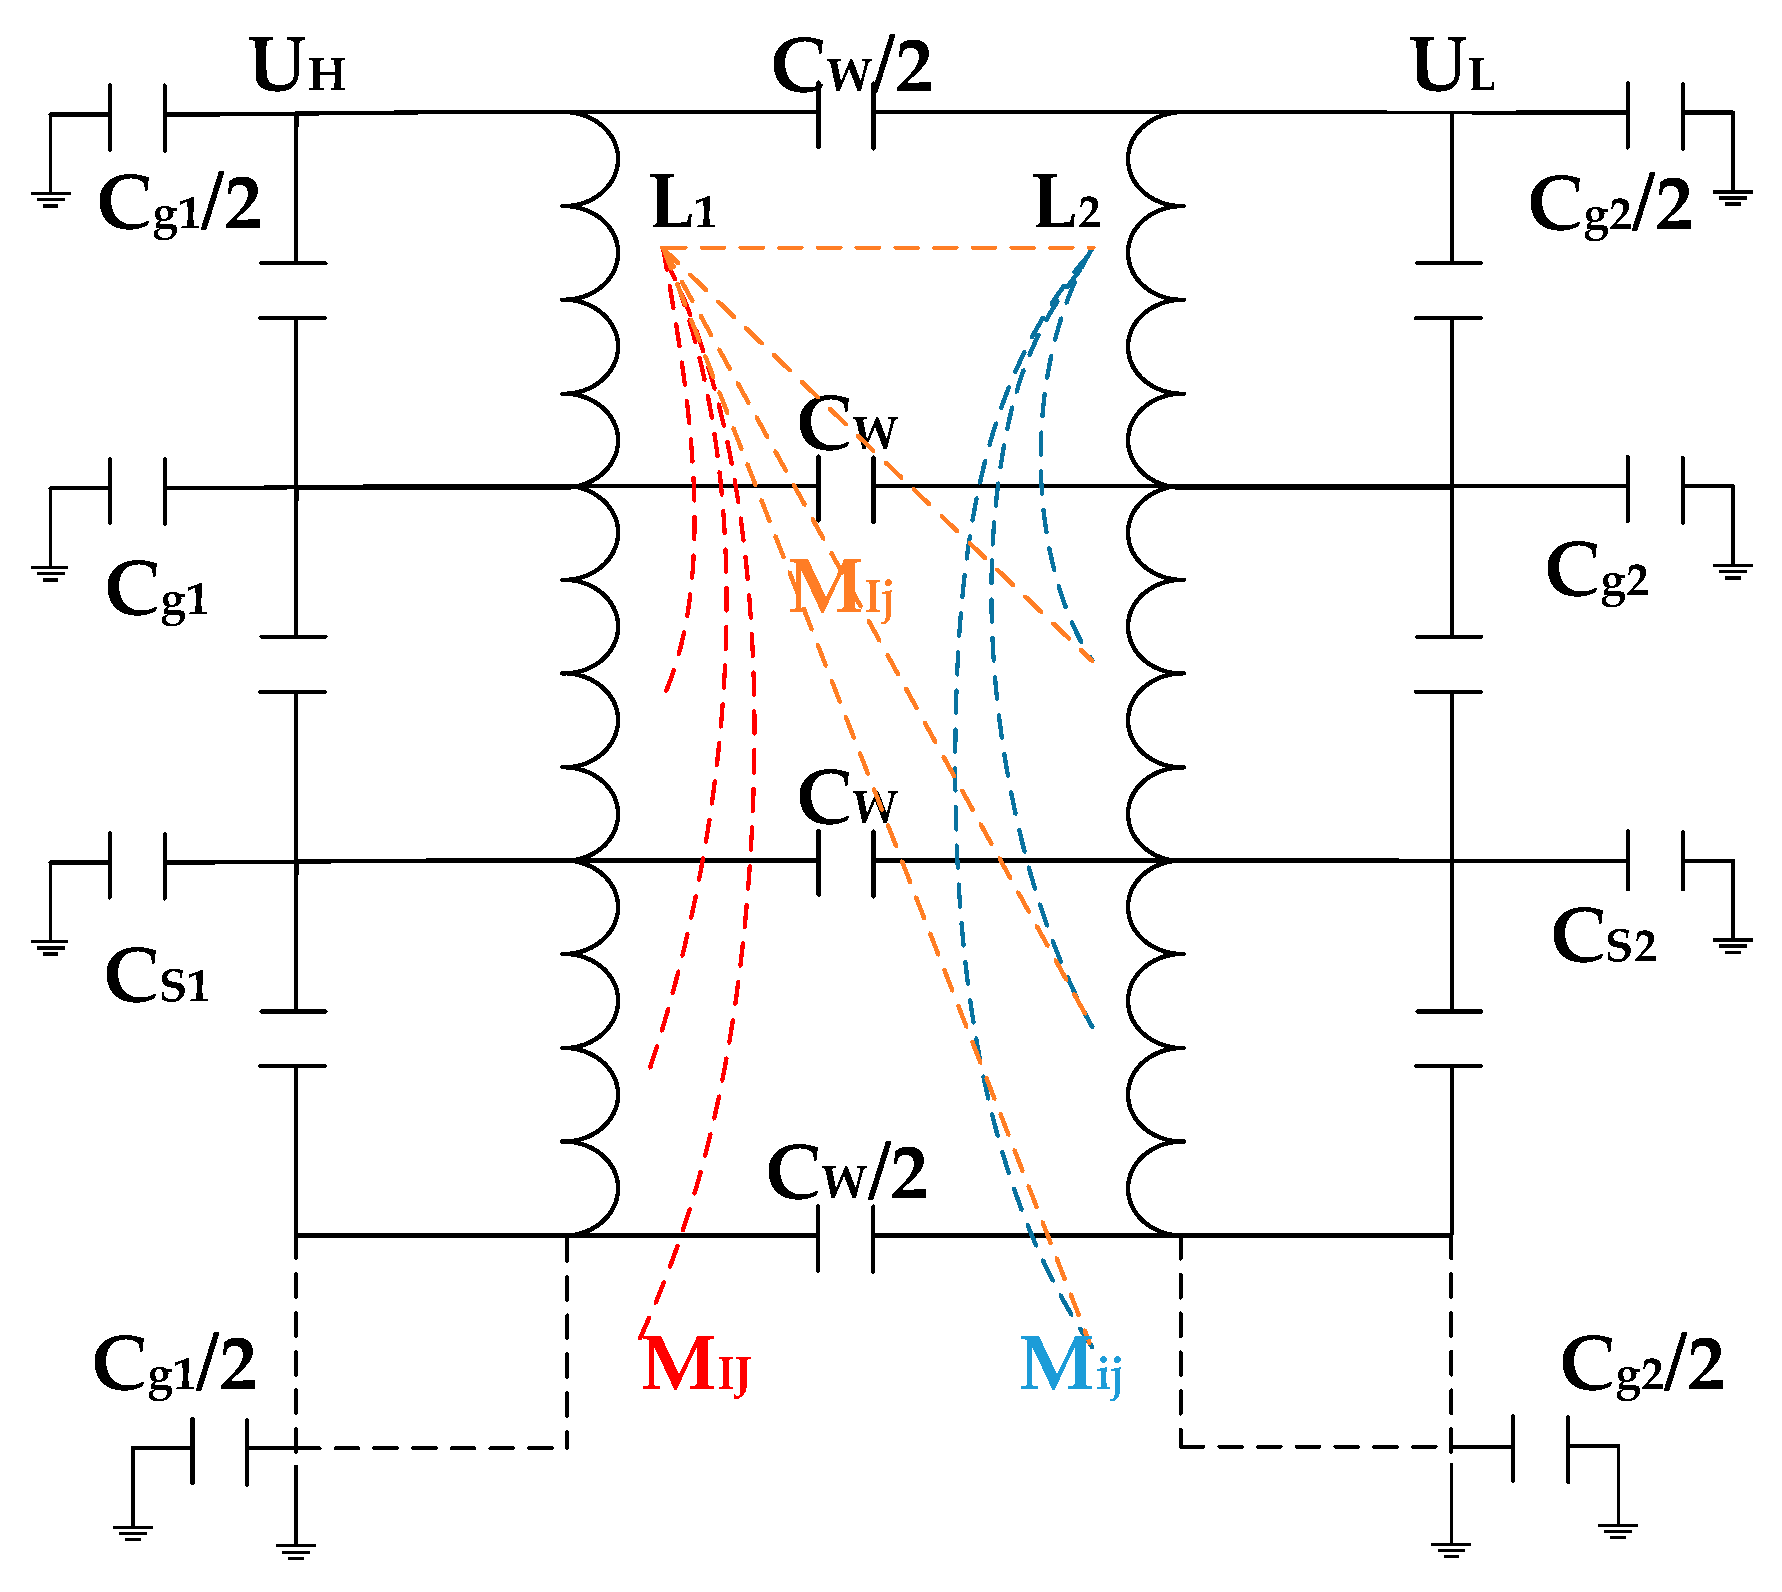
The transformer windings can be considered as a passive two-port network—the equivalent circuit of which consists of resistors, capacitors, and inductors, as shown in Figure 17. The two sides of the windings are represented by a ladder network in the equivalent circuit, comprising a series of inductances L1 and L2, series capacitances CS1 and CS2, shunt capacitances Cg1 and Cg2, and mutual inductances MIJ, Mij, and MIj. The resonance for the impulse wave method and the SFRA method depend on the value of all of these capacitances and inductances, which are affected by the winding itself and the transformer structure. Therefore, the resonances obtained by the two methods are both related to the intrinsic resonance characteristic of the transformer. When the frequency is below 1 kHz, the response characteristic is affected by the winding resistor, which creates fewer resonance points and is less sensitive to changes of distributed capacitance of the transformer winding; when the frequency is above 1 MHz, the inductance is seen as short-circuited by the distributed capacitance, which makes it insensitive to changes of inductance.
Because the HV winding is divided into two cylindrical sections, the injected lightning voltage wave could reflect in the winding and refract at the tap where the voltage waveform is acquired. This could cause abnormal distortion of the waveform and decrease the resolution of the impulse wave method. Another reason for the unusual changes of the transfer functions in Figure 14, Figure 15 and Figure 16 could be wave reflection in the transfer winding. The SFRA method avoids the influences of reflection and refraction.
The shunt effect of the transformer winding-to-ground and inter-winding stray capacitances causes uneven transient voltage distribution. A higher voltage can more clearly reflect slight changes of winding voltage transfer under transient voltages, indicating the state of the transformer core more clearly and accurately compared with a lower voltage. Changes of the transfer function after FFT can also more clearly distinguish the severity of a short circuit.
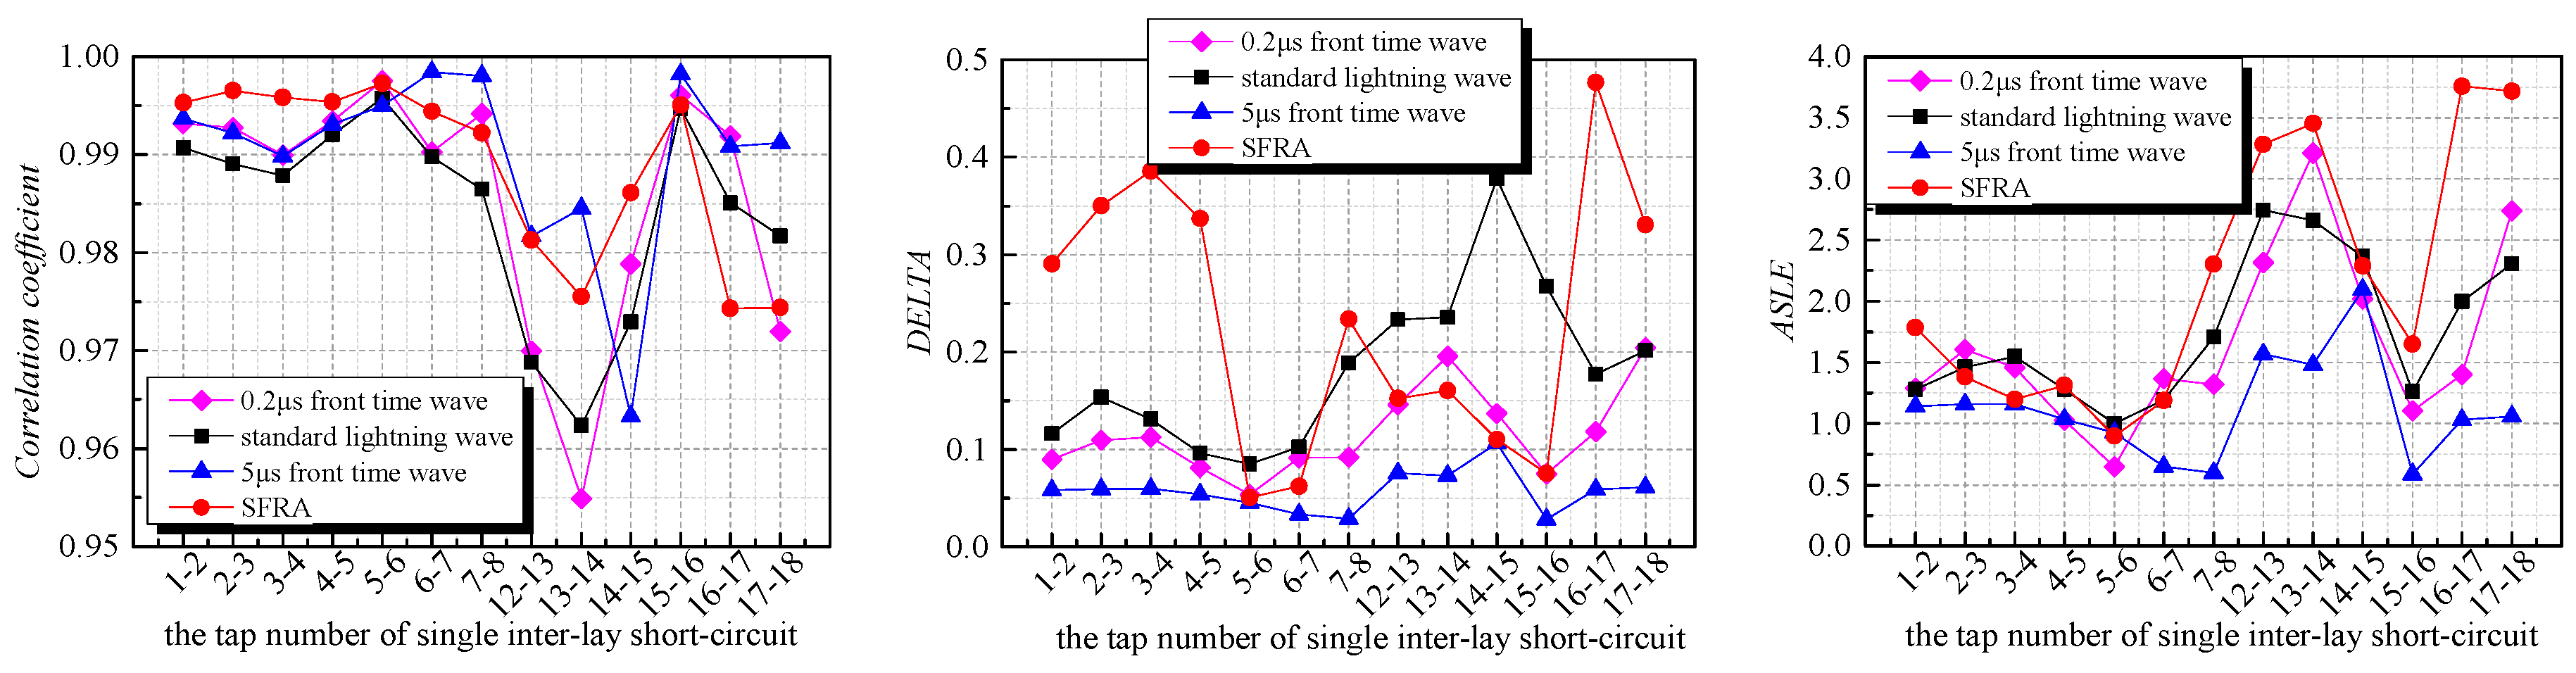
Moreover, in the real application of the impulse wave method based on transient overvoltage monitoring, the shape of the voltage applied on the transformer may be varied. In order to determine the effect of the shape of the applied voltage shape on the sensitivity of the impulse wave method, three lightning voltage wave shapes were selected to be applied to the tests under the single interlayer-winding fault condition. These three waves have the same wave tail time of 50 μs, but the wave front time is 0.2, 1.2 and 5 μs, respectively. The statistical indicators for transfer functions for the SFRA and the impulse wave methods with front time of 0.2, 1.2 and 5 μs under single-interlayer-winding fault conditions are shown in Figure 18.
It can be found by the comparison among the test results shown in Figure 18 that the shape of the applied impulse voltage could affect the response of the applied voltage. However, it can also be found that the statistical indicators show the same level at magnitude for the impulse wave method under three different applied lightning voltage wave shapes and the SFRA method, which shows that the impulse wave method could be applied to diagnose the winding fault even if the impulse voltage applied to the tests is not the standard lightning voltage. It should be noted that when the 5/50 μs lightning voltage is applied to the tests, the sensitivity of the impulse wave method is less than that when 0.2/50 μs and 1.2/50 μs lightning voltage are applied to the tests. This is because the impulse wave method relies on the frequency response. The high frequency part is dominant for the sensitivity of the method.
By measuring the voltages in the HV and LV windings, the voltage transfer function can reflect the transfer characteristics between the two windings. Moreover, if the transient current data can be obtained simultaneously in real applications, the admittance transfer function or ∆U/∆I can be obtained, which is helpful to evaluate the faults along with the voltage transfer function. In our future work, the admittance transfer function or ∆U/∆I would be investigated in our laboratory and field tests.
Since the SFRA method has already been applied to field tests, we believe the impulse wave method could also diagnose the transformer winding fault to some degree based on the test results and analysis. The SFRA test is an offline test, which needs additional exciting signal sources to be injected into the transformer. This may be avoided if the impulse wave method could be applied to diagnose the winding fault and the overvoltage monitoring system is applied to the transformer. However, in the real application of the impulse wave method, it is necessary to consider the electromagnetic interference of the environment. Furthermore, in order to apply this scheme to larger transformers, coupling effects of three phases and magnetic circuit asymmetry must be considered. To extend this scheme to larger transformers, coupling effects of three phases and magnetic circuit asymmetry must be considered. A test platform based on a three-phase transformer will be assessed in the next stage of this research. In addition, the impulse wave method will be further verified in actual applications by long-term observation of the overvoltage monitoring system of Chongqing University in the real power transformer.
6. Conclusions
Experimental analysis of winding-fault diagnosis based on the SFRA and impulse wave methods shows that both methods can effectively determine whether a transformer is operating under normal or fault conditions by analyzing the transfer function. For the transformer winding used in this work, a change of location of short-circuit faults does not change the overall trend of the transfer function frequency response curve but do have an impact on part of the curve. The reason for the unusual changes of the transfer functions could be wave reflection in the transformer winding. The SFRA method avoids the influences of reflection and refraction. By comparison of statistical indicators, it is found that the sensitivities of the two methods are similar with respect to detecting both winding-ground and winding-interlayer short circuits. It is therefore possible to use the transient overvoltage monitoring system for diagnosis of winding faults. Moreover, performance of the impulse wave method on the power transformers in the field should be investigated in future work in order to find out whether the method could be applied to the power system. This could be extended by observing transformers with the overvoltage monitoring system in actual substations.
Acknowledgments
This work is supported by the Innovative Research Groups of China (51321063), Fundamental Research Funds for the Central Universities (106112014CDJZR155501, CDJZR14150001), and Independent Research of the State Key Laboratory of Power Transmission Equipment & System Security and New Technology (2007DA10512713206).
Author Contributions
Qing Yang and Peiyu Su contributed to the tests, analysis and paper writing; Yong Chen contributed to the design of the test transformer.
Conflicts of Interest
The authors declare no conflict of interest.
References
- Asadi, N.; Kelk, H.M. Modeling, analysis, and detection of internal winding faults in power transformers. IEEE Trans. Power Deliv. 2015, 30, 2419–2426. [Google Scholar] [CrossRef]
- Fofana, I.; Hadjadj, Y. Electrical-based diagnostic techniques for assessing insulation condition in aged transformers. Energies 2016, 9, 679. [Google Scholar] [CrossRef]
- Tenbohlen, S.; Coenen, S.; Djamali, M.; Müller, A.; Samimi, M.; Siegel, M. Diagnostic measurements for power transformers. Energies 2016, 9, 347. [Google Scholar] [CrossRef]
- Lee, B.; Park, J.; Crossley, P.; Kang, Y. Induced voltages ratio-based algorithm for fault detection, and faulted phase and winding identification of a three-winding power transformer. Energies 2014, 7, 6031–6049. [Google Scholar] [CrossRef]
- Paul, C.R. Decoupling the multiconductor transmission line equations. IEEE Trans. Microw. Theory Tech. 1996, 44, 1429–1440. [Google Scholar] [CrossRef]
- Yu, Q.; Wang, J.M.L.; Kuh, E.S. Passive multipoint moment matching model order reduction algorithm on multiport distributed interconnect networks. IEEE Trans. Circuits Syst. I Fundam. Theory Appl. 1999, 46, 140–160. [Google Scholar] [CrossRef]
- Chen, W.; Ma, J.; Huang, X.; Fang, Y. Predicting iron losses in laminated steel with given non-sinusoidal waveforms of flux density. Energies 2015, 8, 13726–13740. [Google Scholar] [CrossRef]
- Subramaniam, A.; Bhandari, S.; Bagheri, M.; Sivakumar, N.; Gupta, A.; Panda, S. Online condition monitoring and diagnosis techniques for dry type transformers incipient fault analysis through finite element modelling. In Proceedings of the 2016 IEEE Transportation Electrification Conference and Expo, Asia-Pacific (ITEC Asia-Pacific), Busan, Korea, 1–4 June 2016; pp. 024–028. [Google Scholar]
- Gomez-Luna, E.; Aponte Mayor, G.; Gonzalez-Garcia, C.; Pleite Guerra, J. Current Status and Future Trends in Frequency-Response Analysis with a Transformer in Service. IEEE Trans. Power Deliv. 2013, 28, 1024–1031. [Google Scholar] [CrossRef]
- Palani, A.; Jayashankar, V. Virtual Instrument for Lightning Impulse Tests. IEEE Trans. Power Deliv. 2007, 22, 1309–1317. [Google Scholar] [CrossRef]
- Palani, A.; Santhi, S.; Gopalakrishna, S.; Jayashankar, V. Real-Time Techniques to Measure Winding Displacement in Transformers During Short-Circuit Tests. IEEE Trans. Power Deliv. 2008, 23, 726–732. [Google Scholar] [CrossRef]
- Dick, E.P.; Erven, C.C. Transformer diagnostic testing by frequency-response analysis. IEEE Trans. Power Appar. Syst. 1978, 97, 2144–2153. [Google Scholar] [CrossRef]
- Alsuhaibani, S.; Khan, Y.; Beroual, A.; Malik, N. A Review of Frequency Response Analysis Methods for Power Transformer Diagnostics. Energies 2016, 9, 879. [Google Scholar] [CrossRef]
- Mukhtaruddin, A.; Isa, M.; Adzman, M.R.; Hassan, S.; Rohani, H. Techniques on Partial Discharge Detection and Location Determination in Power Transformer. In Proceedings of the 3rd International Conference on Electronic Design, Phuket, Thailand, 11–12 August 2016. [Google Scholar]
- Noirhomme, B.; Cote, J. Evaluation of underground submersible distribution transformers through oil analysis. In Proceedings of the Conference Record of the IEEE International Symposium on Electrical Insulation, San Juan, PR, USA, 10–13 June 2012. [Google Scholar]
- Bhowmick, S.; Nandi, S. Online Detection of an Interturn Winding Fault in Single-Phase Distribution Transformers Using a Terminal Measurement-Based Modeling Technique. IEEE Trans. Power Deliv. 2015, 30, 1007–1015. [Google Scholar] [CrossRef]
- Kumar, A.; Kumar, S. Core Magnetization Effect in Sweep F requency Response Analysis for Transformer Diagnosis. In Proceedings of the Second International Conference on Advances in Computing and Communication Engineering, Dehradun, India, 1–2 May 2015. [Google Scholar]
- Secue, J.R.; Mombello, E.E. New SFRA measurement interpretation methodology for the diagnosis of power transformers. Electr. Eng. 2014, 96, 183–198. [Google Scholar] [CrossRef]
- Mehta, A.K.; Sharma, R.N.; Chauhan, S.; Agnihotri, S.D. Study and diagnosis the failure of power transformers by sweep frequency response analysis. In Proceedings of the International Conference on Power, Energy and Control, Dindigul, India, 6–8 February 2013; pp. 197–201. [Google Scholar]
- Rahimpour, H.; Mitchell, S.; Tusek, J. The application of sweep frequency response analysis for the online monitoring of power transformers. In Proceedings of the Australasian Universities Power Engineering Conference 2016, Brisbane, Australia, 25–28 September 2016; pp. 1–6. [Google Scholar]
- Leibfried, T.; Feser, K. On-line monitoring of transformers by means of the transfer function method. In Proceedings of the 1994 IEEE International Symposium on Electrical Insulation, Pittsburgh, PA, USA, 5–8 June 1994; pp. 111–114. [Google Scholar]
- Leibfried, T.; Feser, K. Monitoring of power transformers using the transfer function method. IEEE Trans. Power Deliv. 1999, 14, 1333–1341. [Google Scholar] [CrossRef]
- Valecillos, B.; Ramirez, J. Evaluation of Lightning Impulse Test by Frequency Response Analysis. In Proceedings of the IEEE/PES Transmission & Distribution Conference and Exposition, Latin America, San Paulo, Brazil, 15–18 August 2006; pp. 1–6. [Google Scholar]
- De Rybel, T.; Singh, A.; Vandermaar, J.A.; Wang, M.; Marti, J.R.; Srivastava, K.D. Apparatus for Online Power Transformer Winding Monitoring Using Bushing Tap Injection. IEEE Trans. Power Deliv. 2009, 24, 996–1003. [Google Scholar] [CrossRef]
- Wang, Z.; Wang, T.; Zhang, Q.; Yin, Y.; Shi, W.; Chen, W. Measurement and analysis of transient overvoltage distribution in the low-voltage winding of 1000 kK power transformer without oil immersion. IEEE Trans. Dielectr. Electr. Insul. 2014, 21, 1835–1841. [Google Scholar] [CrossRef]
- Alfuhaid, A.S. Frequency Characteristics of Single-Phase Two-Winding Transformers Using Distributed Parameter Modeling. IEEE Power Eng. Rev. 2001, 16, 637–642. [Google Scholar]
- Han, R.; Yang, Q.; Sima, W.; Yuan, T.; Dong, H.; Sun, S. A non-contact electro-optic sensor for lightning overvoltage measurement. In Proceedings of the Lightning Protection, Shanghai, China, 11–18 October 2014; pp. 1147–1150. [Google Scholar]
- Wang, J.; Yang, Q.; Sima, W.; Yuan, T.; Zahn, M. A Smart Online Over-Voltage Monitoring and Identification System. Energies 2011, 4, 599–615. [Google Scholar] [CrossRef]
Figure 1.
(a) Voltage sensor at the tap of a transformer bushing; (b) non-contact voltage sensor installed at a substation.
Figure 1.
(a) Voltage sensor at the tap of a transformer bushing; (b) non-contact voltage sensor installed at a substation.
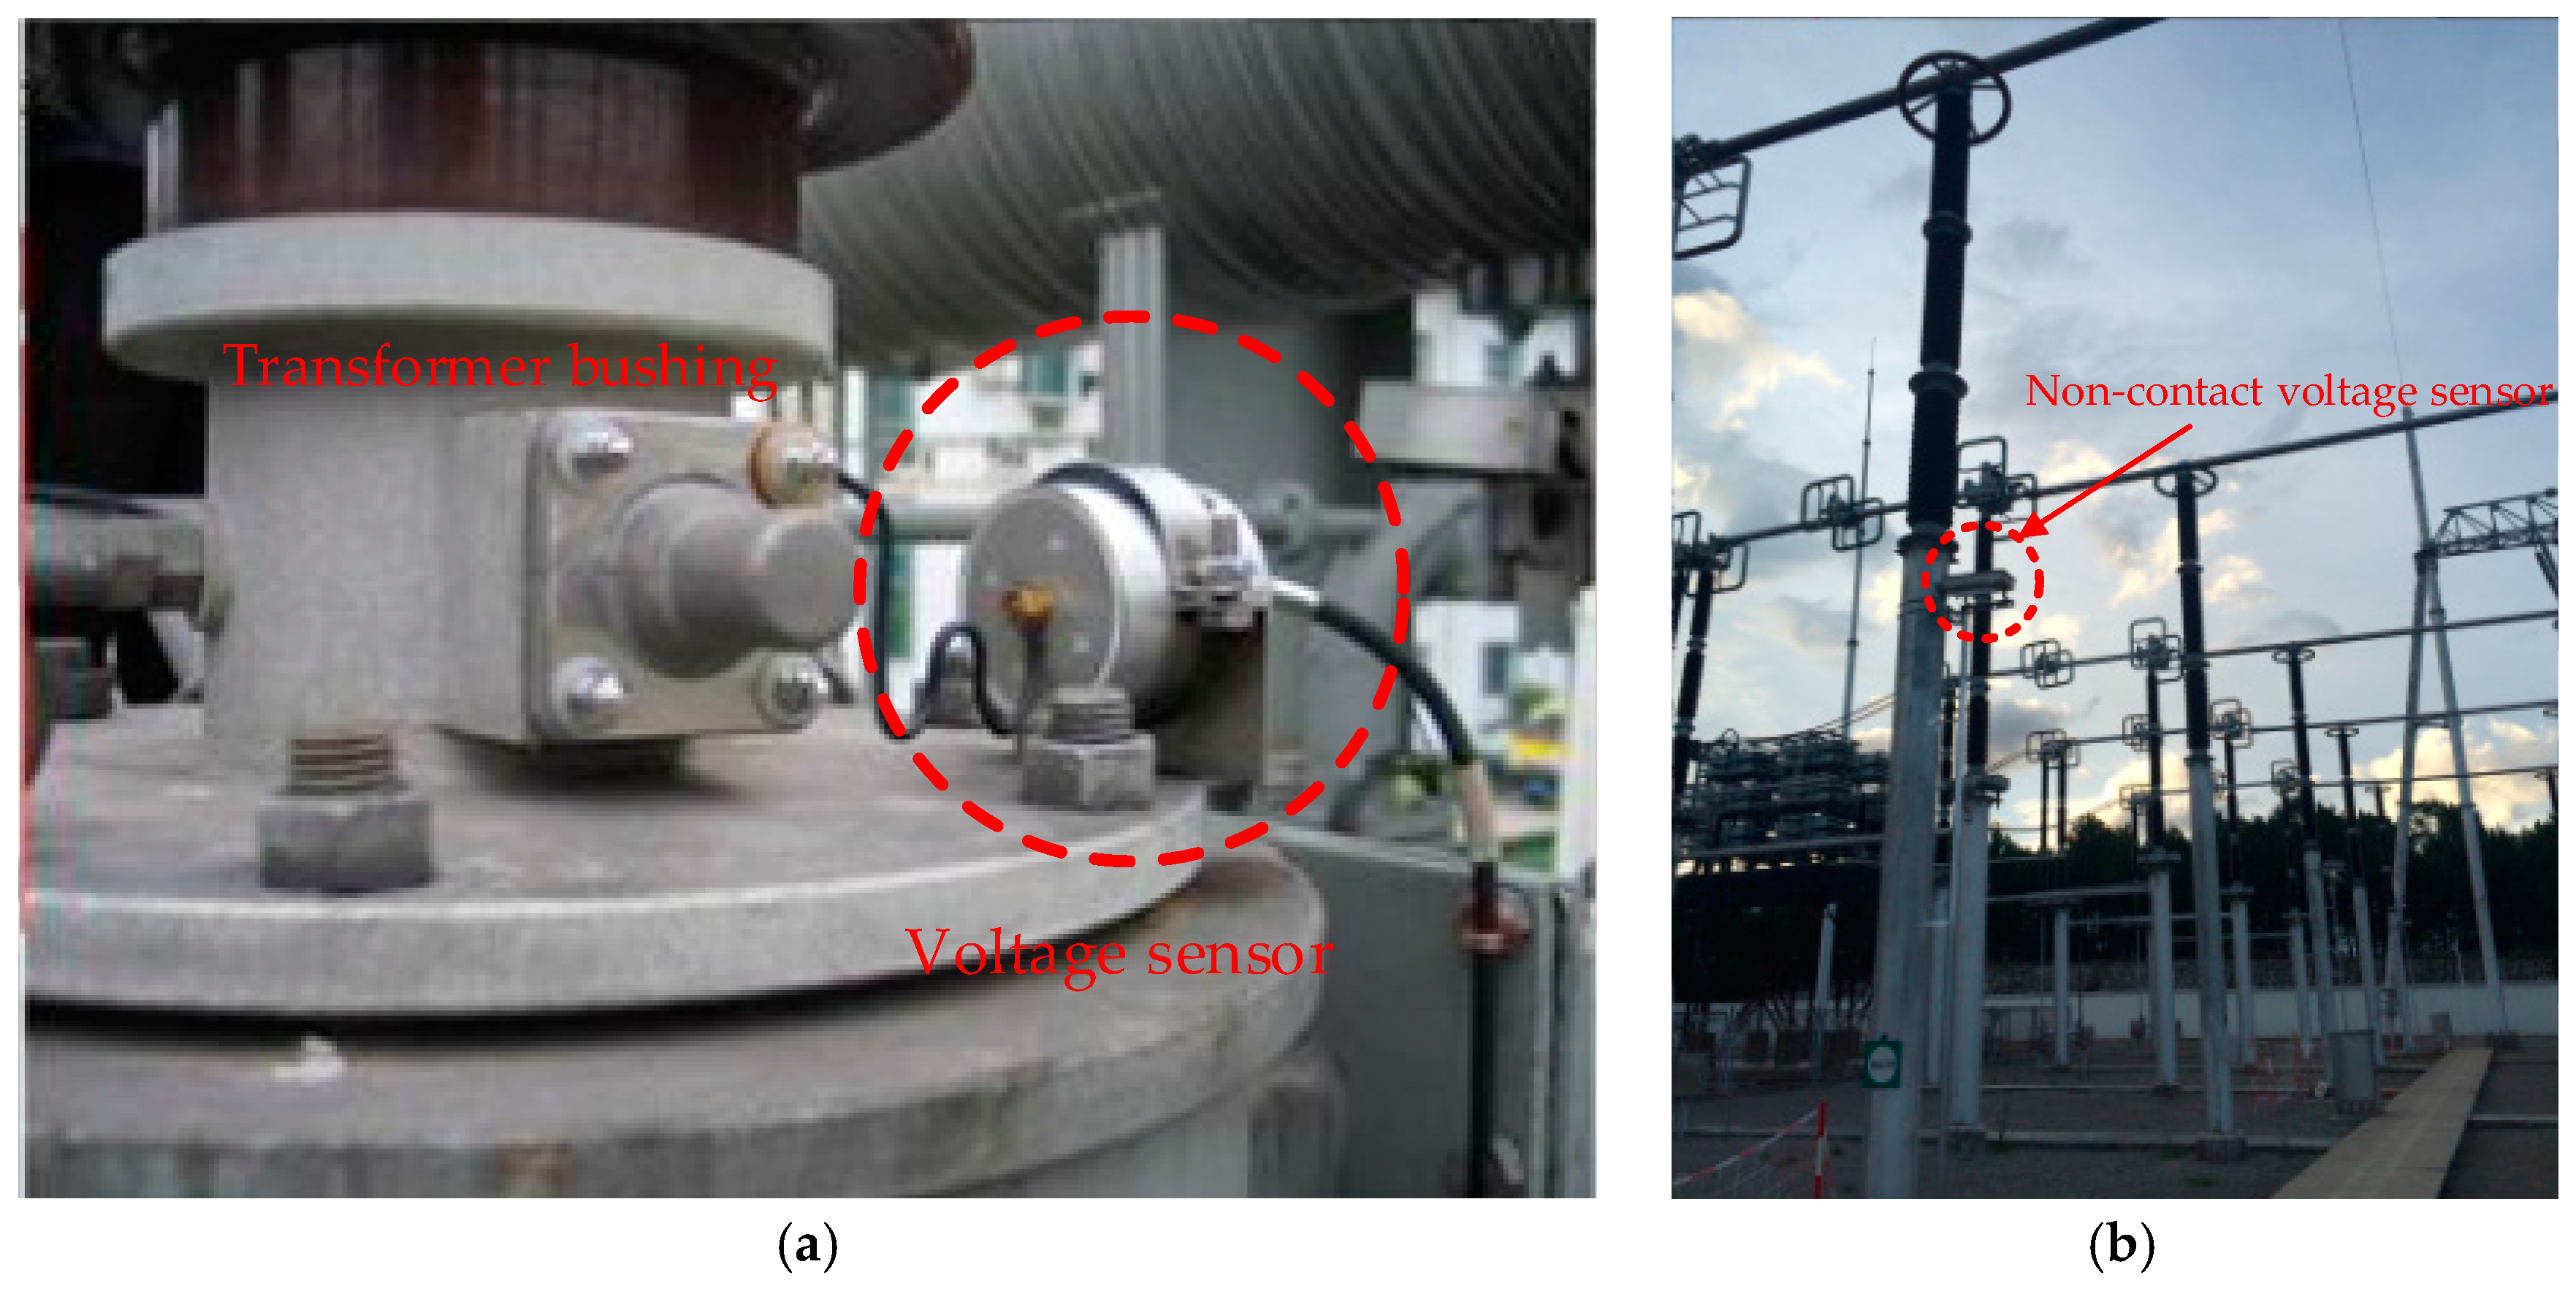
Figure 2.
Schematics of (a) sweep frequency response analysis (SFRA) and (b) impulse wave methods.
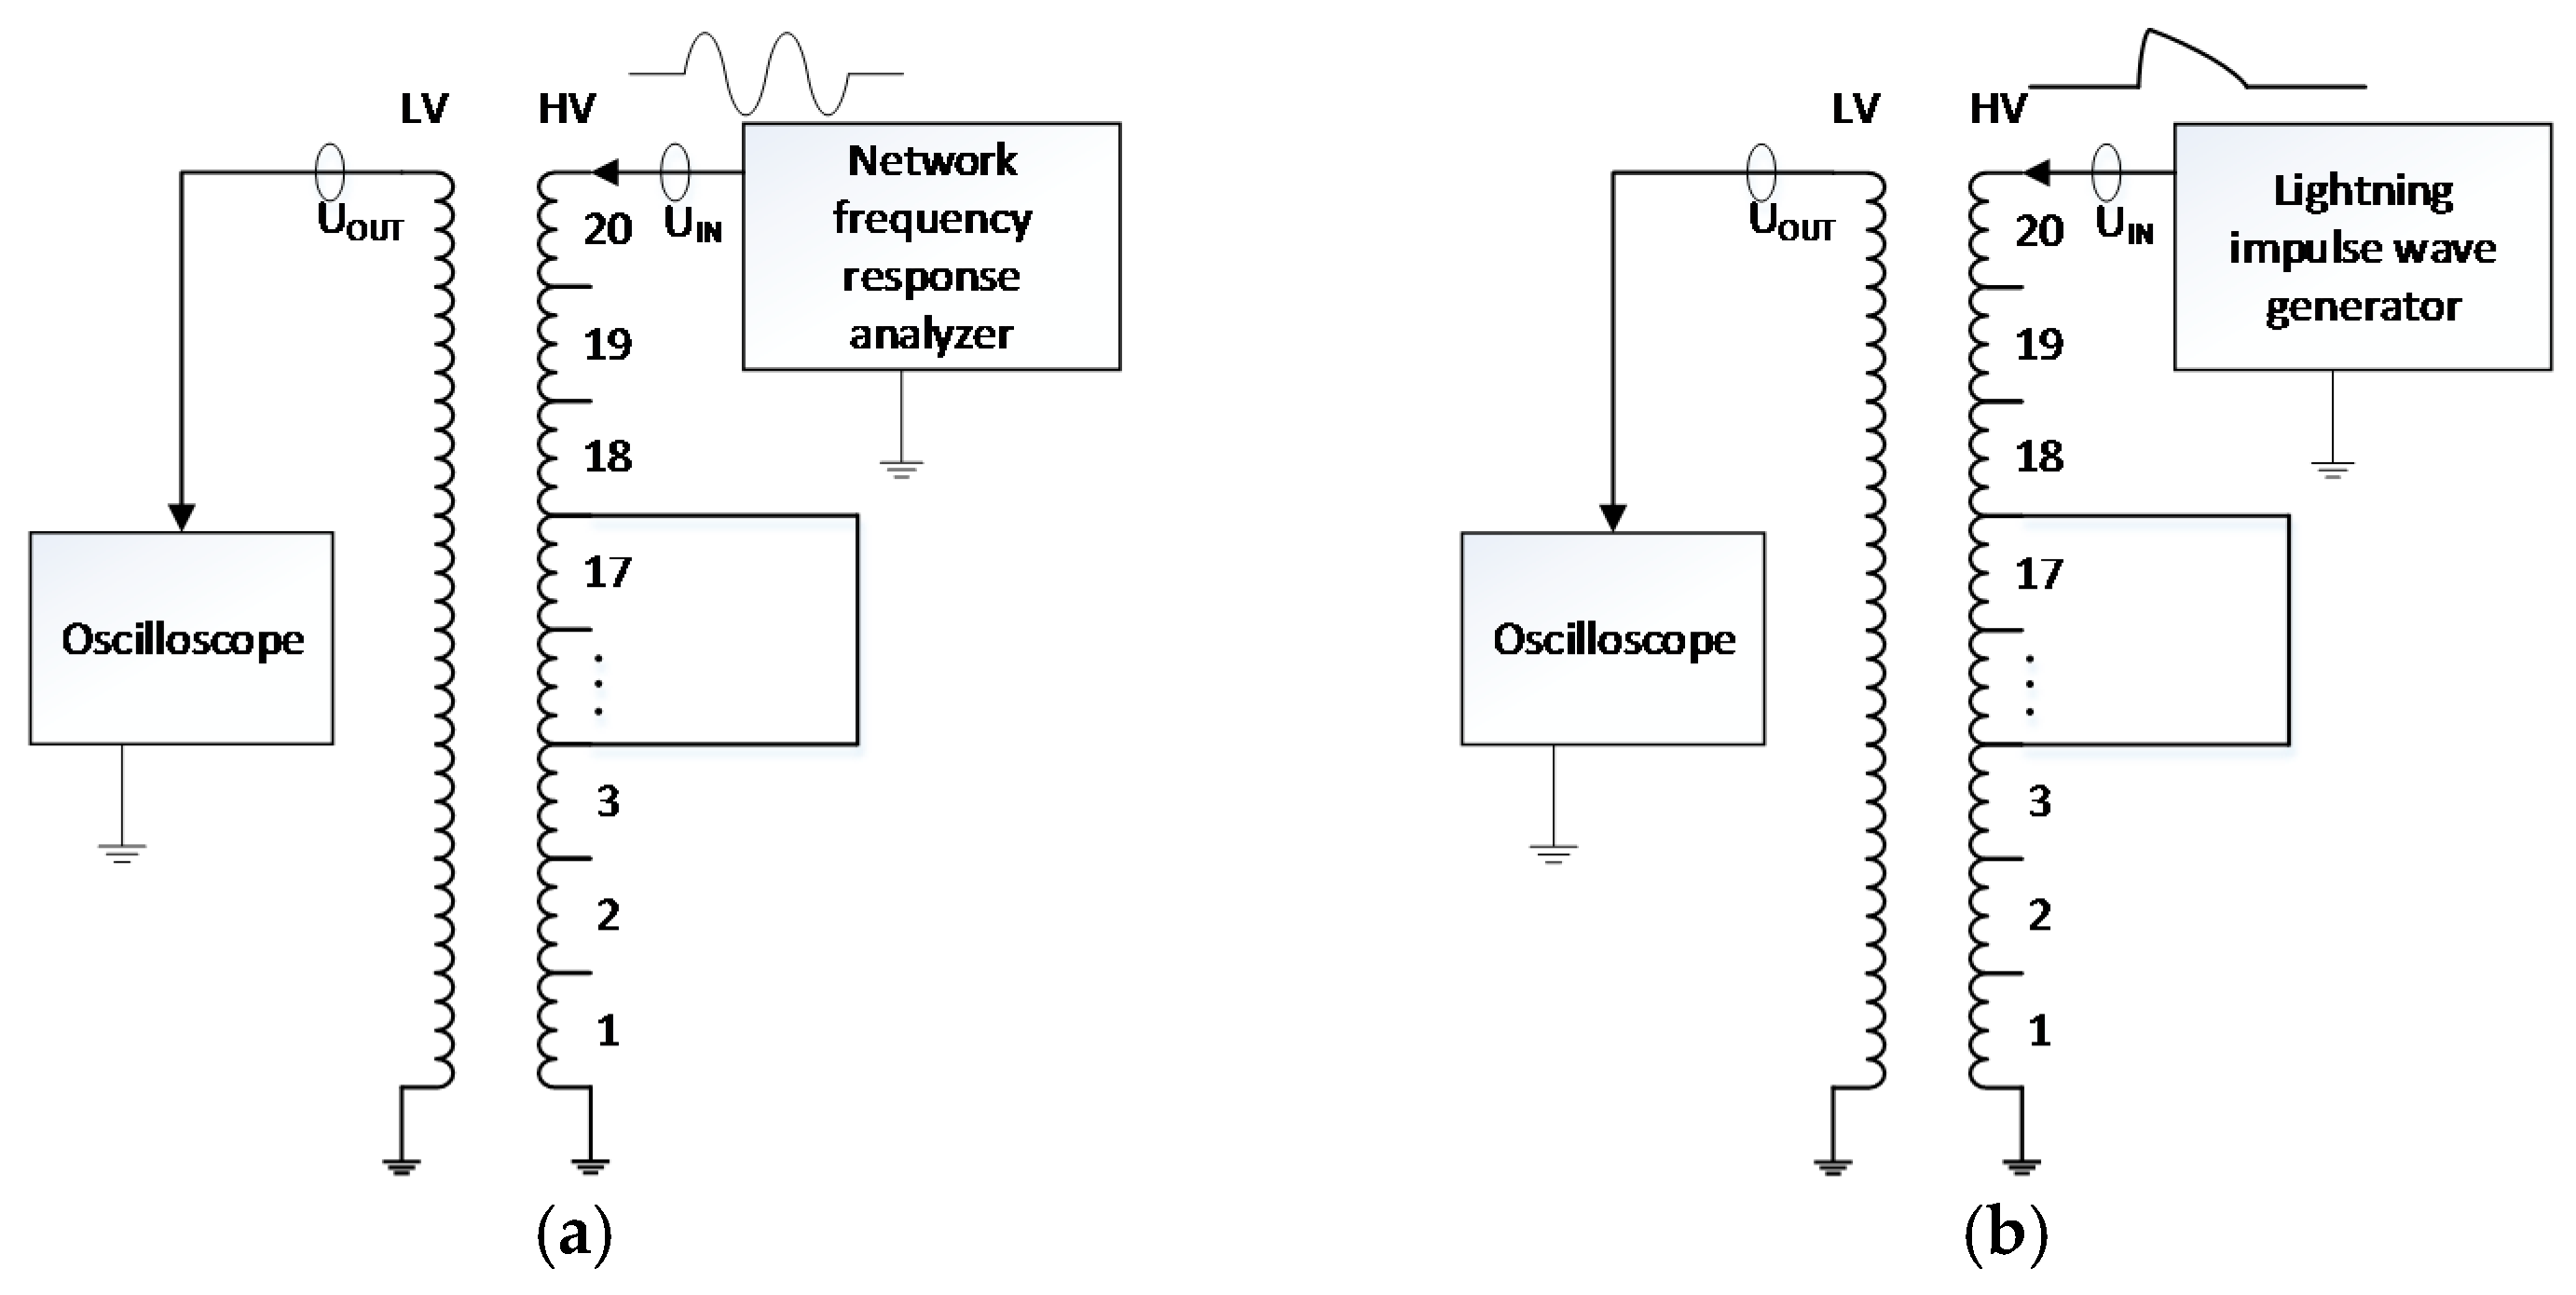
Figure 3.
Test platforms for the (a) SFRA and (b) impulse wave methods.

Figure 4.
Cross-section of transformer iron core (unit: mm).
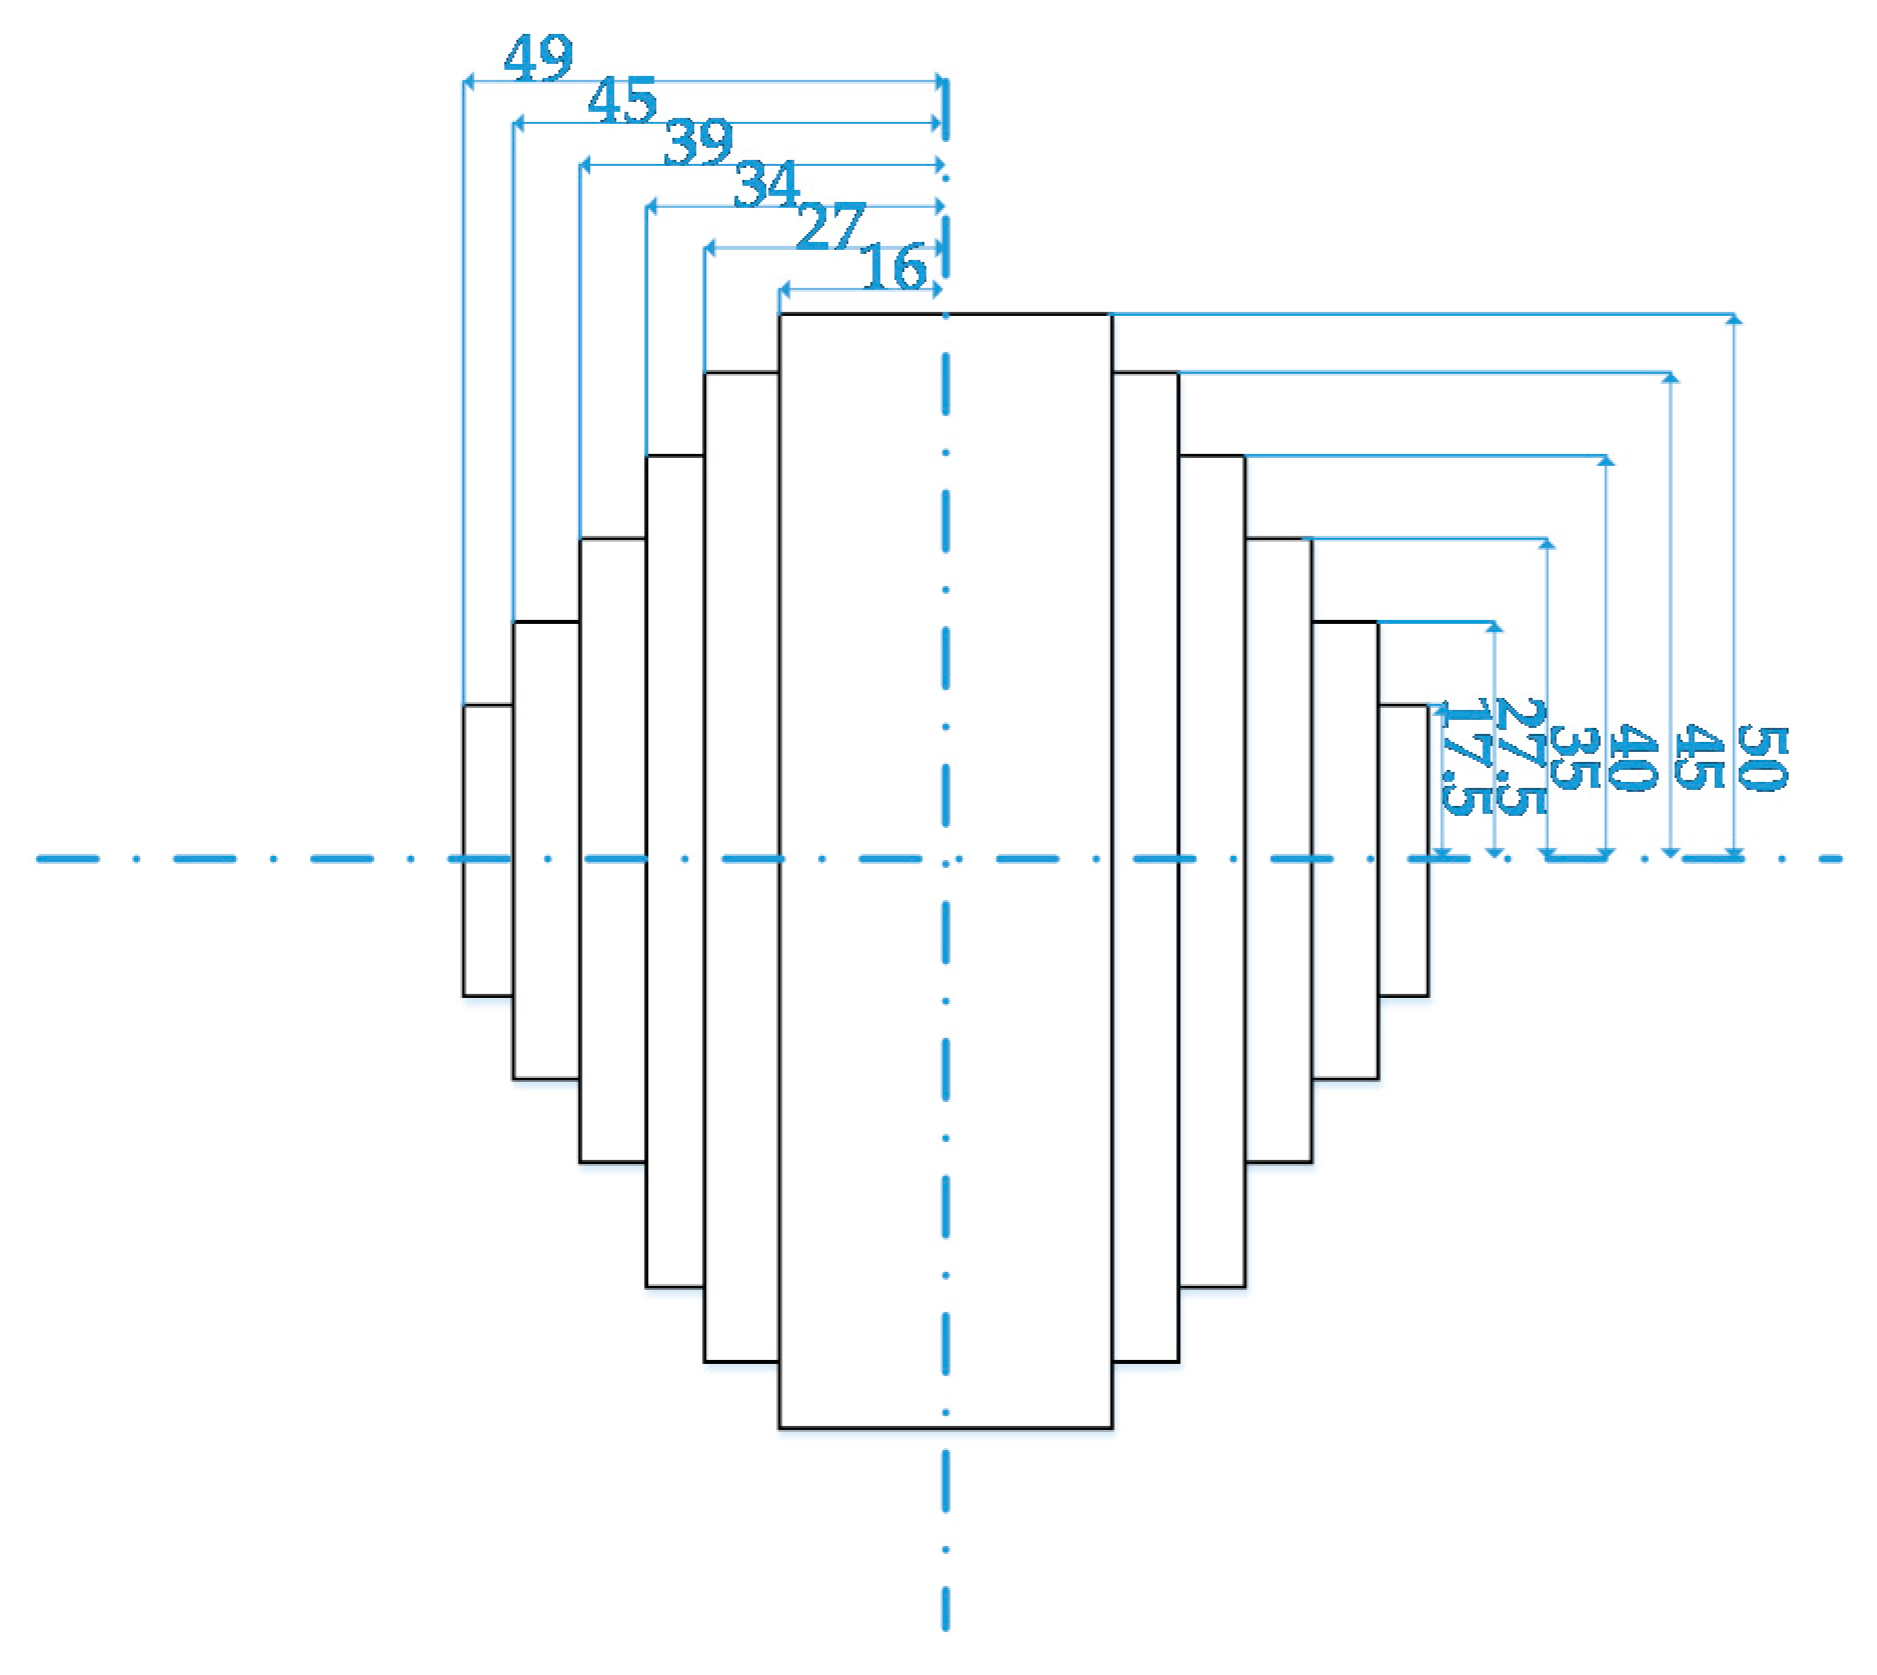
Figure 5.
Schematic of taps out of transformer winding.
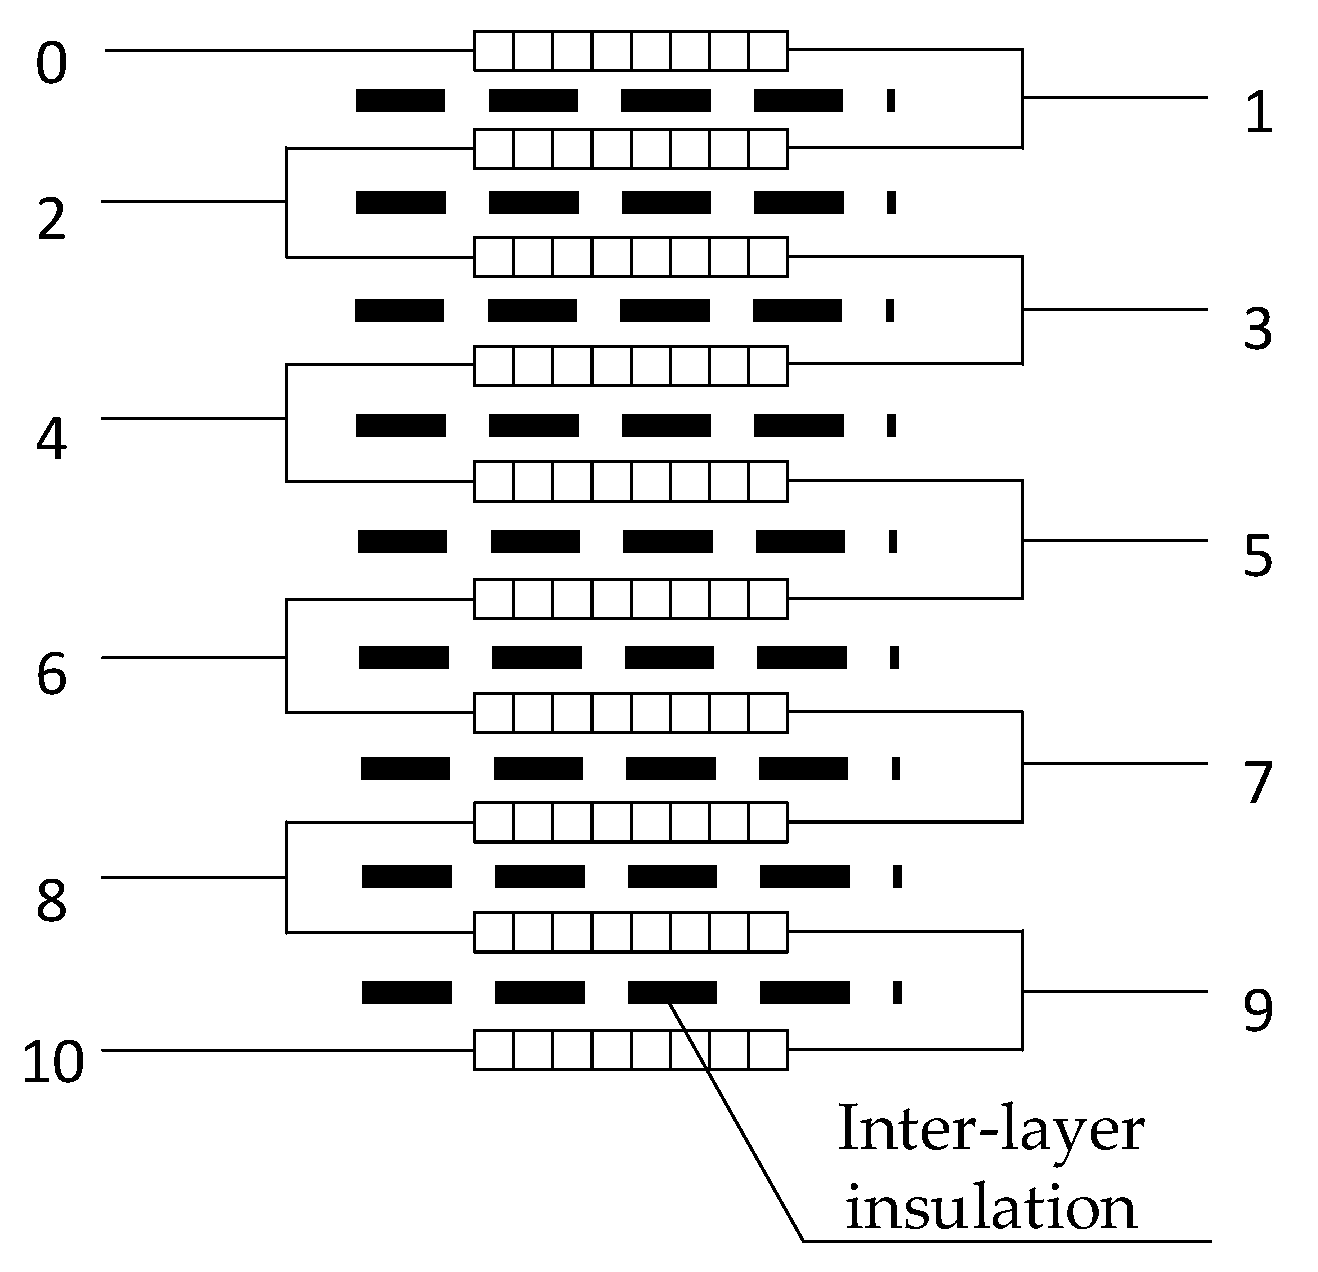
Figure 6.
Voltage transfer of winding-ground short-circuit faults.
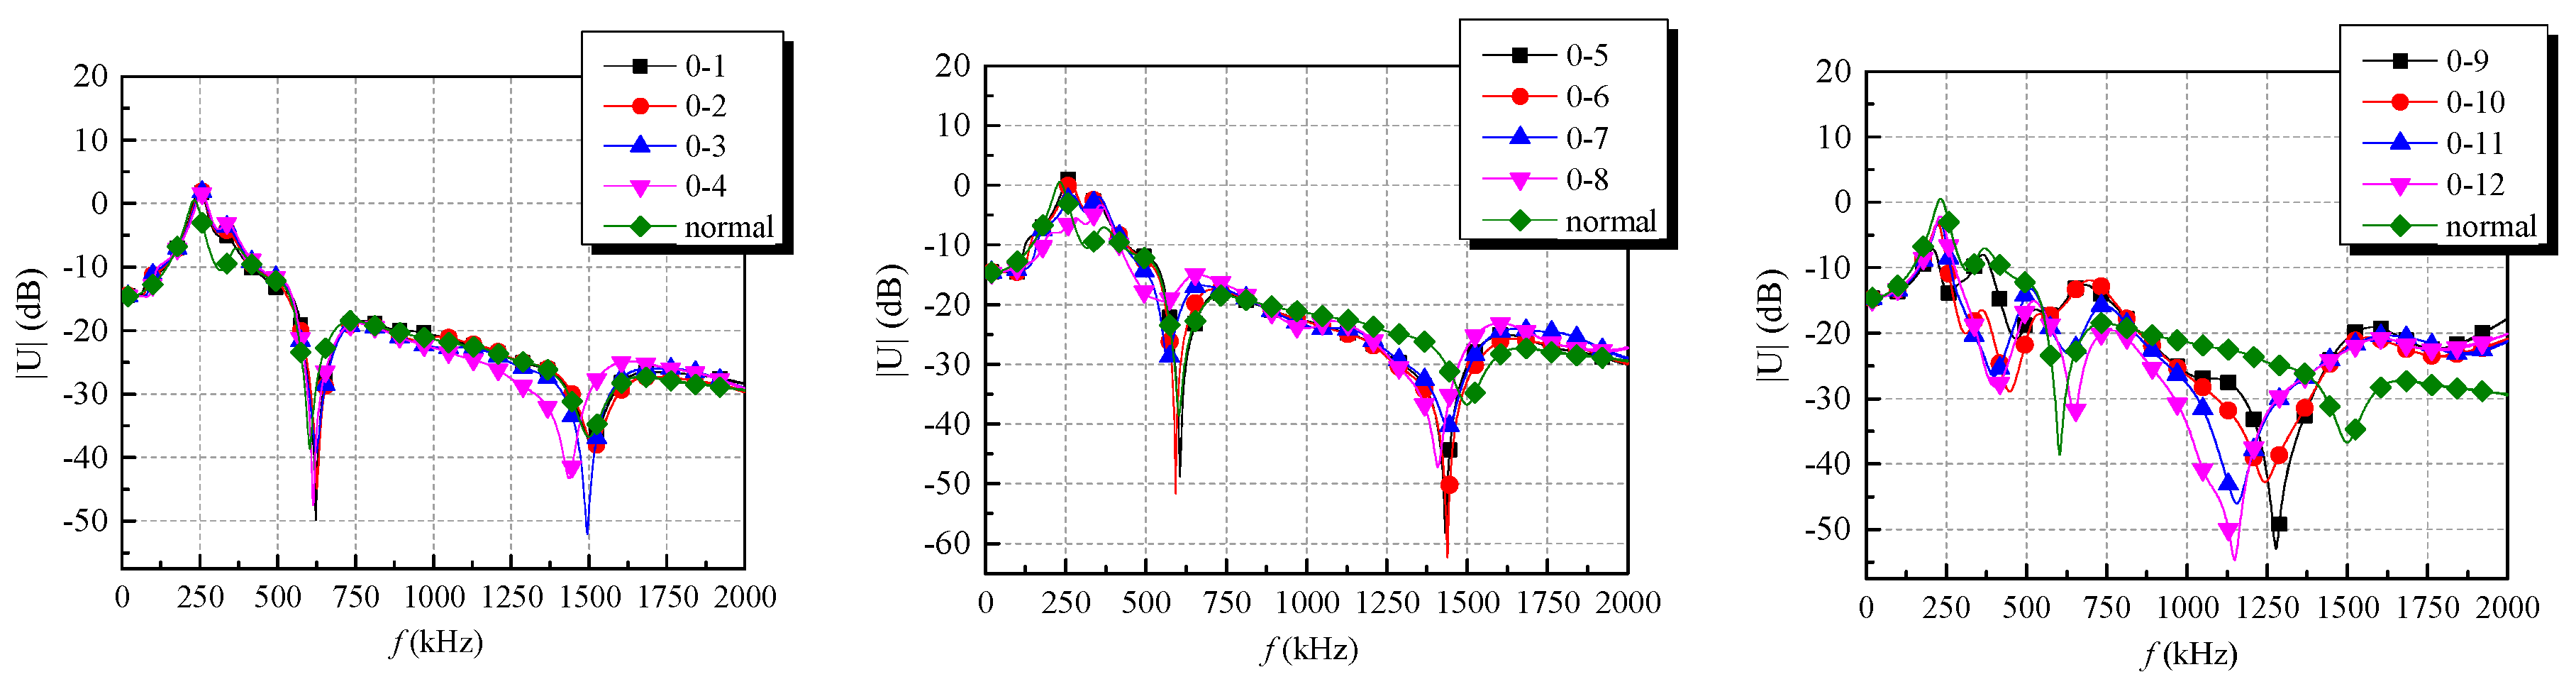
Figure 7.
Voltage transfer of single interlayer-winding short-circuit faults.

Figure 8.
Voltage transfer of three- and six-interlayer-winding short-circuit faults.


Figure 9.
The example of the high-amplitude lightning voltage wave and corresponding responses at high-voltage (HV) and low-voltage (LV).
Figure 9.
The example of the high-amplitude lightning voltage wave and corresponding responses at high-voltage (HV) and low-voltage (LV).

Figure 10.
Voltage transfer of winding-ground short-circuit faults.

Figure 11.
Voltage transfer of single interlayer-winding short-circuit faults.

Figure 12.
Voltage transfer of three- and six-interlayer-winding short-circuit faults.
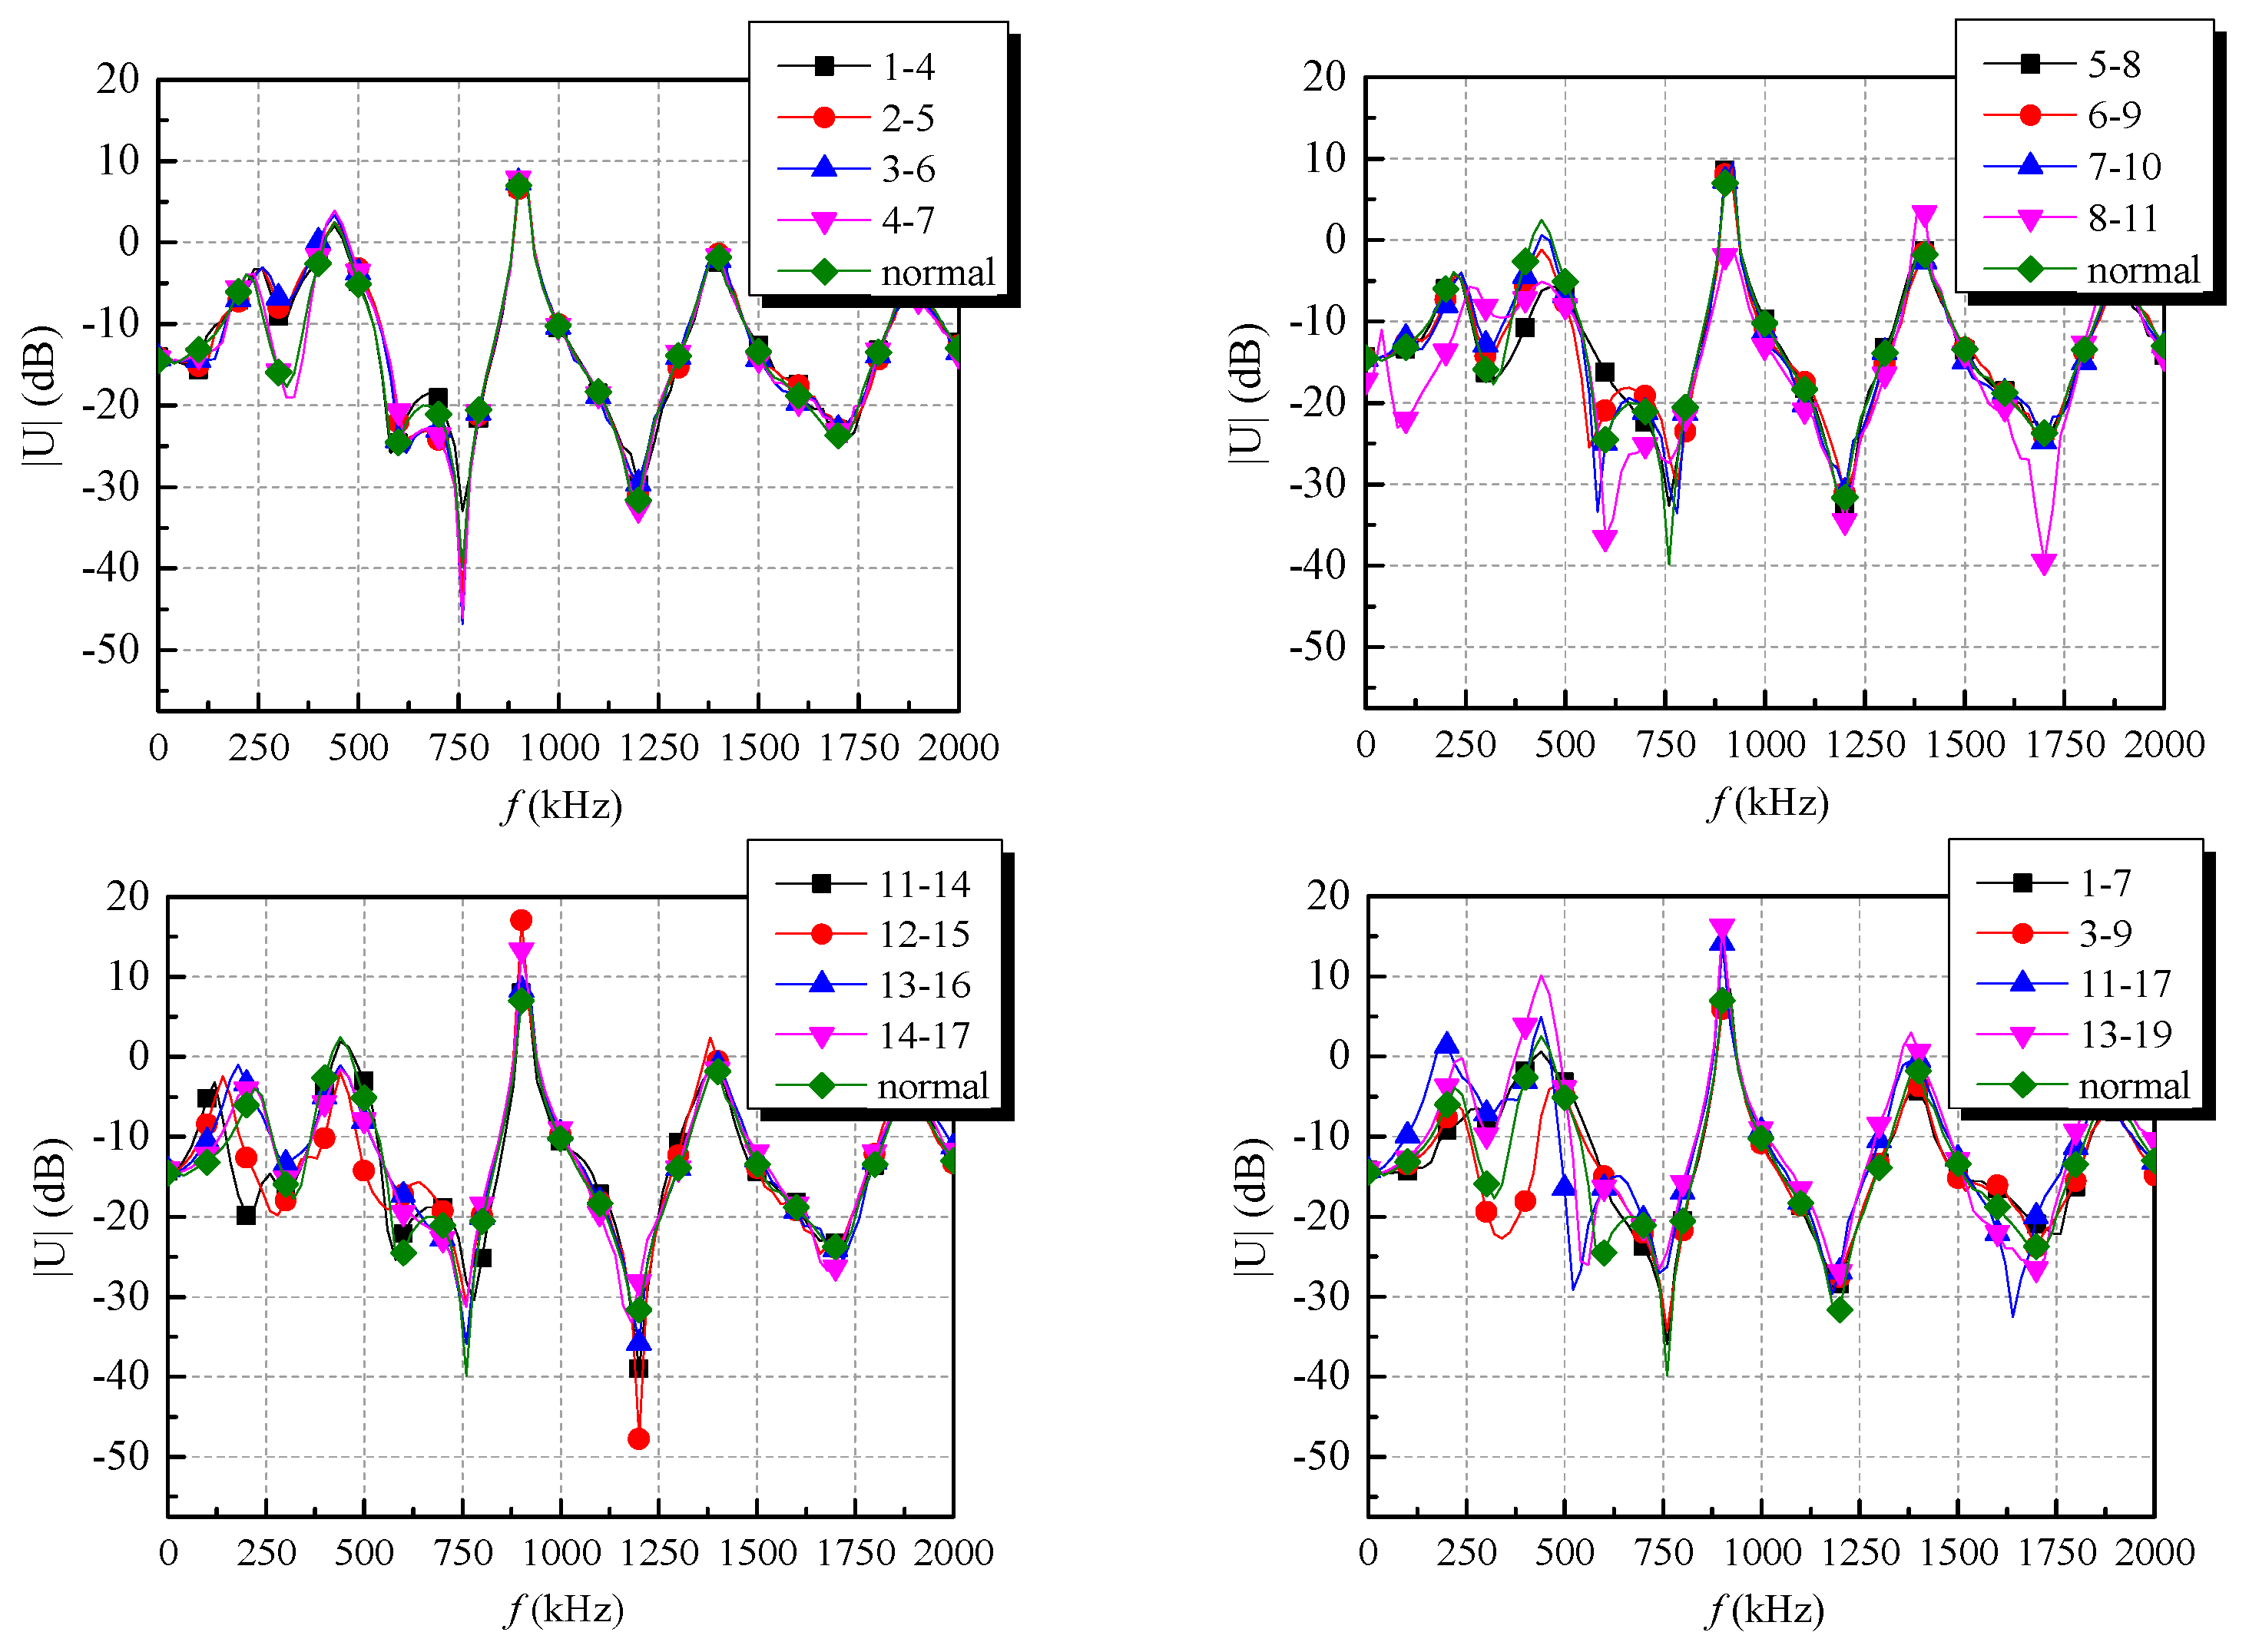
Figure 13.
Comparison of statistical indicators for transfer functions for the SFRA and impulse wave methods under winding-ground fault conditions.
Figure 13.
Comparison of statistical indicators for transfer functions for the SFRA and impulse wave methods under winding-ground fault conditions.

Figure 14.
Comparison of statistical indicators for transfer functions for the SFRA and impulse wave SFRA methods under single-interlayer-winding fault conditions.
Figure 14.
Comparison of statistical indicators for transfer functions for the SFRA and impulse wave SFRA methods under single-interlayer-winding fault conditions.
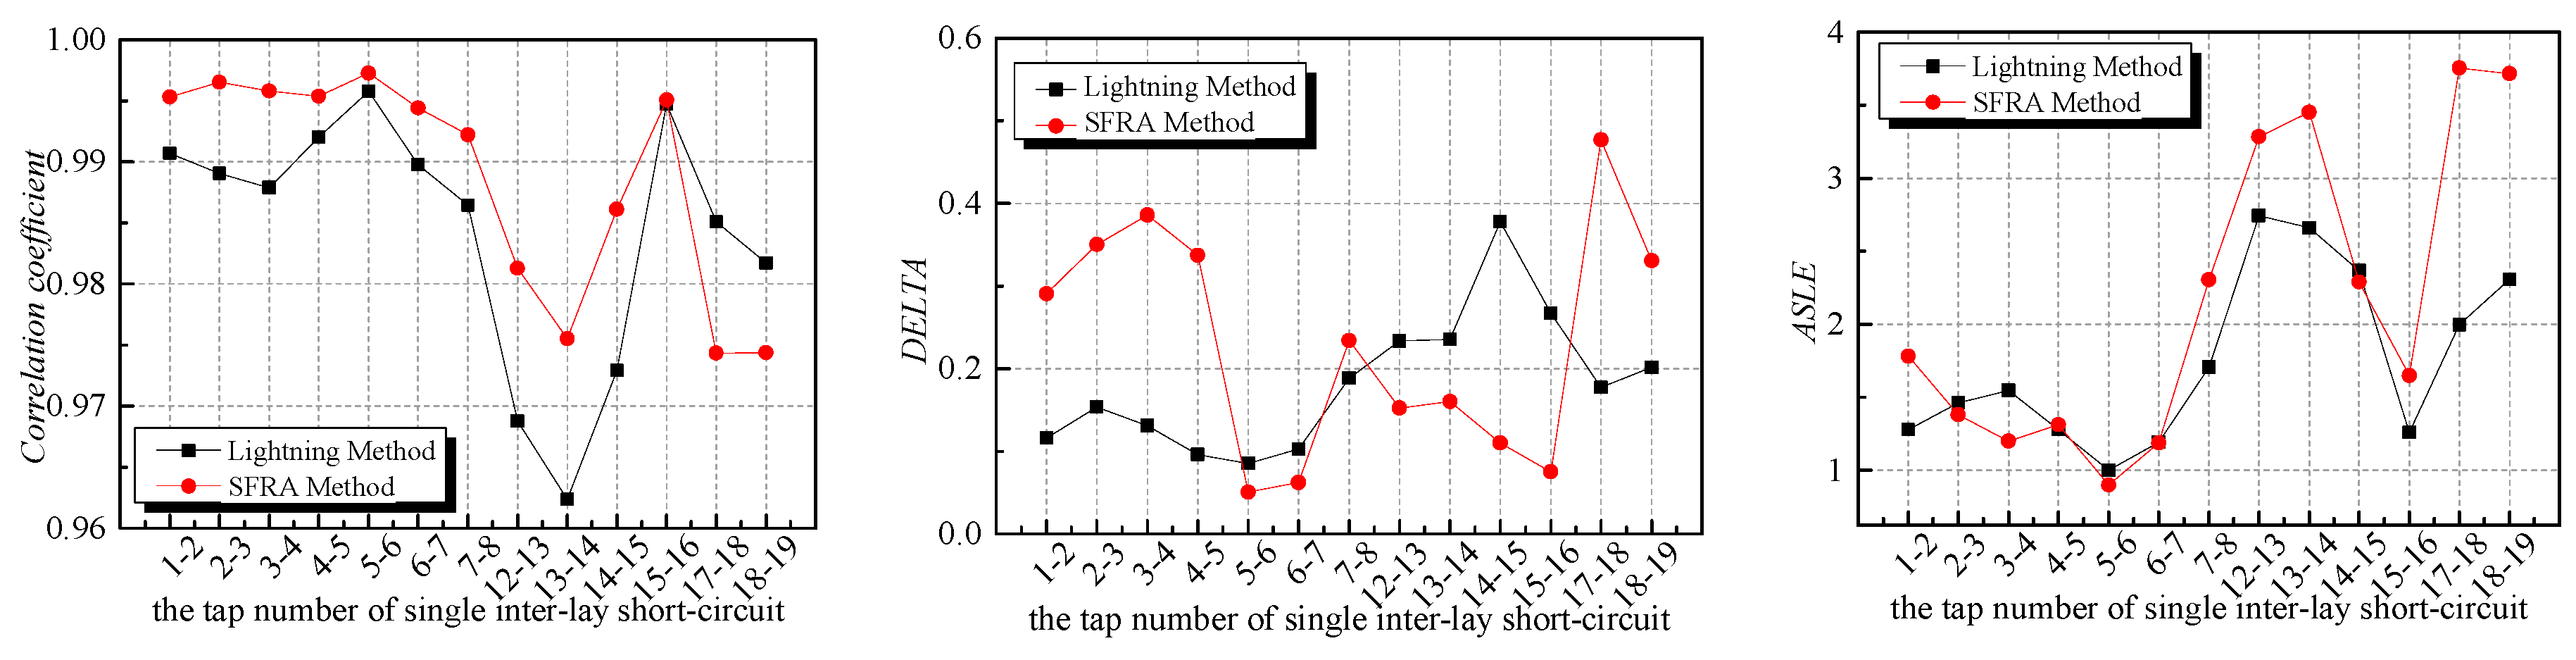
Figure 15.
Comparison of statistical indicators for transfer functions for the SFRA and impulse wave methods under three-interlayer-winding fault conditions.
Figure 15.
Comparison of statistical indicators for transfer functions for the SFRA and impulse wave methods under three-interlayer-winding fault conditions.

Figure 16.
Comparison of the statistical indicators for transfer functions for the SFRA and impulse wave methods under six-interlayer-winding fault conditions.
Figure 16.
Comparison of the statistical indicators for transfer functions for the SFRA and impulse wave methods under six-interlayer-winding fault conditions.
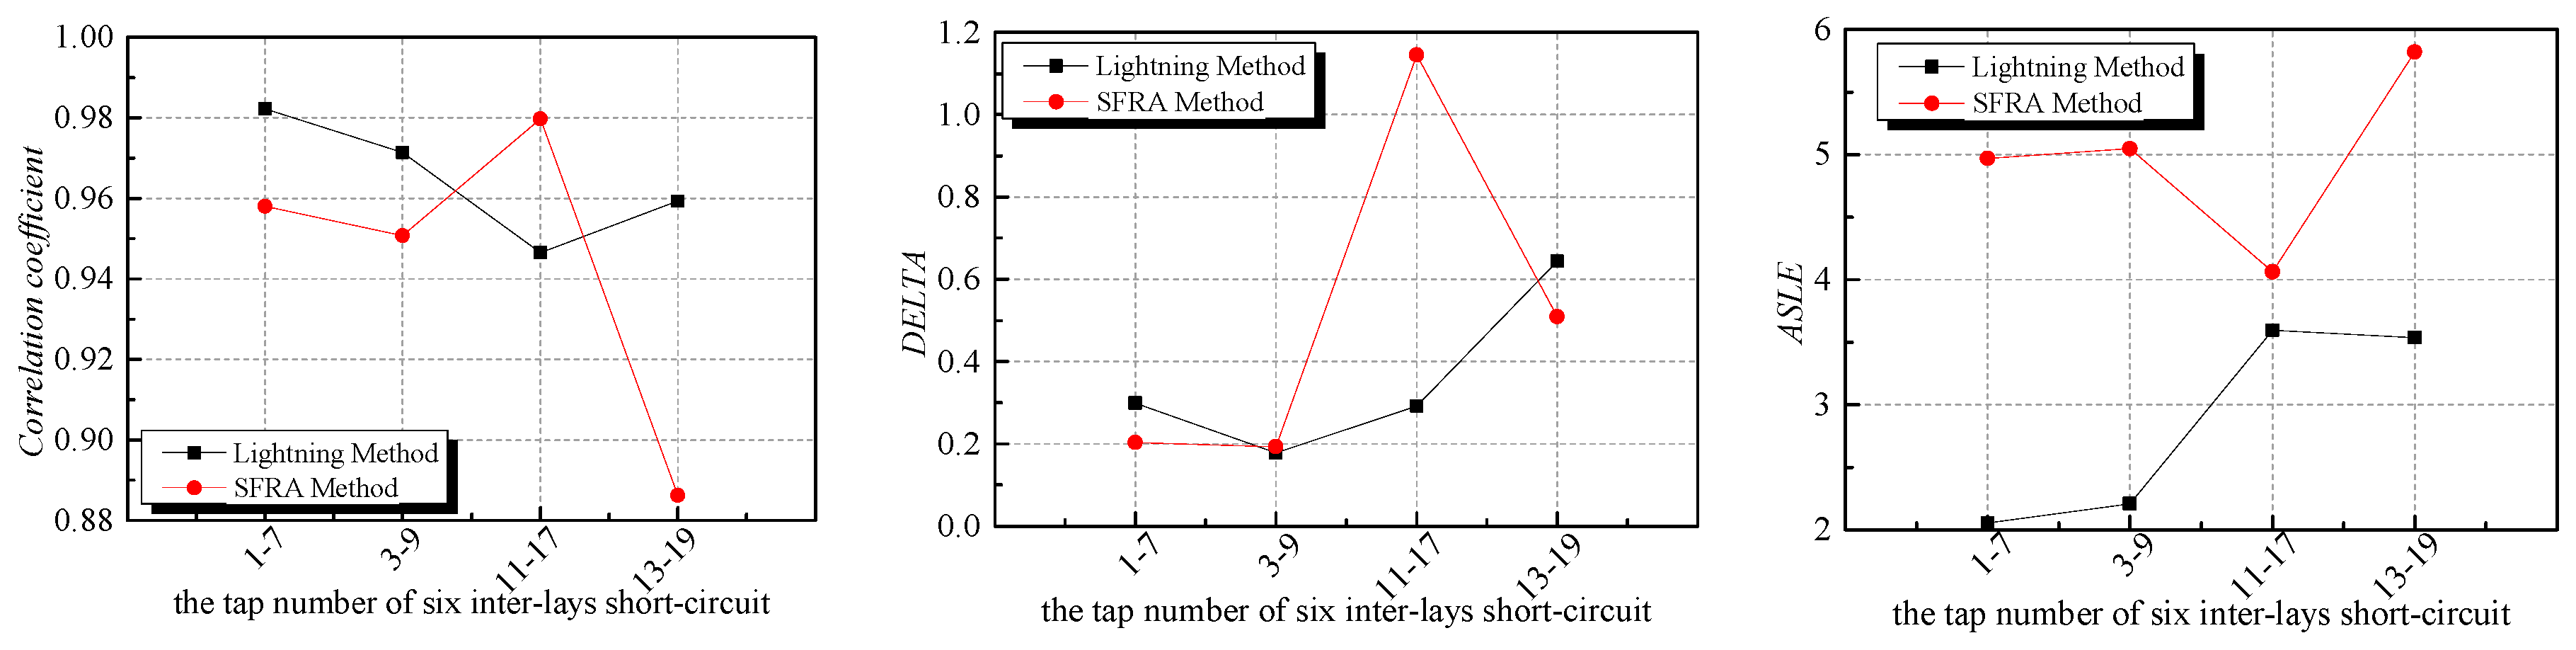
Figure 17.
High-frequency equivalent circuit of transformer.

Figure 18.
Comparison of the statistical indicators for transfer functions for the SFRA and impulse wave methods with front time of 0.2, 1.2 and 5 μs under single-interlayer-winding fault conditions.
Figure 18.
Comparison of the statistical indicators for transfer functions for the SFRA and impulse wave methods with front time of 0.2, 1.2 and 5 μs under single-interlayer-winding fault conditions.

© 2017 by the authors. Licensee MDPI, Basel, Switzerland. This article is an open access article distributed under the terms and conditions of the Creative Commons Attribution (CC BY) license (http://creativecommons.org/licenses/by/4.0/).
Share and Cite
MDPI and ACS Style
Yang, Q.; Su, P.; Chen, Y. Comparison of Impulse Wave and Sweep Frequency Response Analysis Methods for Diagnosis of Transformer Winding Faults. Energies 2017, 10, 431. https://doi.org/10.3390/en10040431
AMA Style
Yang Q, Su P, Chen Y. Comparison of Impulse Wave and Sweep Frequency Response Analysis Methods for Diagnosis of Transformer Winding Faults. Energies. 2017; 10(4):431. https://doi.org/10.3390/en10040431
Chicago/Turabian StyleYang, Qing, Peiyu Su, and Yong Chen. 2017. "Comparison of Impulse Wave and Sweep Frequency Response Analysis Methods for Diagnosis of Transformer Winding Faults" Energies 10, no. 4: 431. https://doi.org/10.3390/en10040431
Note that from the first issue of 2016, this journal uses article numbers instead of page numbers. See further details here.