
Optimal Energy Management Strategy for a Plug-in Hybrid Electric Vehicle Based on Road Grade Information


1
State Key Laboratory of Mechanical Transmissions & School of Automotive Engineering, Chongqing University, Chongqing 400044, China
2
Key Laboratory of Advanced Manufacture Technology for Automobile Parts, Ministry of Education, Chongqing University of Technology, Chongqing 400054, China
3
Department of Mechanical Engineering, University of Michigan-Dearborn, Dearborn, MI 48128, USA
*
Author to whom correspondence should be addressed.
Energies 2017, 10(4), 412; https://doi.org/10.3390/en10040412
Submission received: 9 January 2017
/
Revised: 11 March 2017
/
Accepted: 18 March 2017
/
Published: 23 March 2017
(This article belongs to the Special Issue Advanced Energy Storage Technologies and Their Applications (AESA))
Abstract
:Energy management strategies (EMSs) are critical for the improvement of fuel economy of plug-in hybrid electric vehicles (PHEVs). However, conventional EMSs hardly consider the influence of uphill terrain on the fuel economy and battery life, leaving vehicles with insufficient battery power for continuous uphill terrains. Hence, in this study, an optimal control strategy for a PHEV based on the road grade information is proposed. The target state of charge (SOC) is estimated based on the road grade information as well as the predicted driving cycle on uphill road obtained from the GPS/GIS system. Furthermore, the trajectory of the SOC is preplanned to ensure sufficient electricity for the uphill terrain in the charge depleting (CD) and charge sustaining (CS) modes. The genetic algorithm is applied to optimize the parameters of the control strategy to maintain the SOC of battery in the CD mode. The pre-charge mode is designed to charge the battery in the CS mode from a reasonable distance before the uphill terrain. Finally, the simulation model of the powertrain system for the PHEV is established using MATLAB/Simulink platform. The results show that the proposed control strategy based on road-grade information helps successfully achieve better fuel economy and longer battery life.
1. Introduction
Plug-in hybrid electric vehicles (PHEVs) achieve a longer all-electric range (AER) with a higher battery capacity compared to conventional hybrid electric vehicles (HEVs). Hence, the PHEV has improved fuel economy, as it replaces more fossil fuel with cheaper grid electricity [1]. The fuel economy and power battery are two important PHEV research fields.
Energy management strategies (EMSs) and driving conditions (such as road conditions, traffic conditions, and weather conditions) strongly influence the fuel economy of PHEVs. Hence, the EMSs of conventional HEVs, which aim at optimizing the power split rate between the engine and motor, such as the rules-based control strategy [2], the equivalent-consumption minimization strategy [3], and the EMS based on the driving-pattern recognition [4,5], have been extensively analyzed in previous studies. Furthermore, the vehicles can obtain considerable information of driving conditions, such as traffic lights, traffic congestion, and road grade, with the development of intelligent vehicle technologies. In previous studies, the terrain and trip distance were used to optimize the EMS of an HEV [6,7].
For the power battery of a PHEV, relevant studies focus on the battery state estimation and charging schedule designs. Several estimation approaches have been employed to estimate the accurate SOC of batteries, such as estimation approaches based on data-driven multi-scale extended Kalman filtering [8], battery SOC estimators using a bias correction technique [9] and an adaptive H infinity filter method [10]. Furthermore, optimization algorithms are employed for the charging schedule design; the objectives include load following/stabilization [11], battery health [12], etc.
Different from the EMSs of conventional HEVs, the EMSs for PHEVs are divided into two categories: the charge depleting–charge sustaining (CD–CS) control strategy and blended control strategy. For the CD–CS strategy, PHEVs can operate in either the CD mode or the CS mode. In the CD mode, the motor is the primary power source, consuming considerably cheaper and cleaner grid electricity. The PHEV switches to the CS mode to avoid excessive battery discharge when the state of charge (SOC) of the battery reaches the minimum boundary. In the CS mode, the PHEV is driven by both the engine and the motor to maintain the SOC near a specific value like conventional HEVs [13]. Figure 1 shows the trajectory of the SOC for the CD–CS control strategy. The advantage of the CD–CS strategy is that it has a simple control rule to achieve real-time control. However, the optimal fuel economy cannot be achieved when the range is not within the AER, which is validated [14]. A blended control strategy is developed based on the assumption that the entire driving cycle is known. The optimization algorithms, such as dynamic programming [15] and Pontryagin’s Minimum Principle [16], are utilized to achieve global optimization in the blended strategy. Prof. Xiong in Ref. [15] present a procedure for the design of a near-optimal power management strategy for the hybrid battery and ultracapacitor energy storage system in a plug-in hybrid electric vehicle considering battery durability and longevity performance, and this approach shows excellent performance against uncertain diving cycles and battery packs. In the blended control strategy, electricity and fossil fuel are blended for the consumption at the beginning of the range, and the minimum boundary of the SOC of the battery is reached until the end of range. However, the future driving cycle must be provided accurately. In recent studies, the future driving cycle was predicted using the Markov chain model [17] and the neural network mode [18] using historical traffic data. In addition, the future driving cycle can be predicted using the traffic information obtained from intelligent transportation systems [19,20]. However, an accurate prediction of the driving cycle usually requires considerable traffic data and involves complex calculations. For the blended strategy, the tradeoff between the accuracy of driving-cycle prediction and computational complexity needs further study.
Furthermore, for the real-time control strategies of PHEVs, a good vehicle performance, in terms of fuel economy, power, and battery life, cannot be ensured, if the driving conditions are not considered. The slope is proven to be an important factor that influences the fuel consumption of the HEV [21,22]. PHEVs usually operate in the hybrid-driving mode while driving uphill, and the engine and motor coordinately work together to ensure that the engine operates in the high-efficiency region. However, the SOC of the battery tends to reach the minimum boundary. Moreover, increasing the depth of discharge of the SOC will degrade the battery life [23]. Hence, the PHEV is driven only by the engine to avoid degrading the battery life when the SOC is lower than the minimum boundary. On the other hand, when the vehicle is driven only by the engine, both the power of the vehicle as well as the fuel economy are affected, because the engine cannot be ensured to operate in the high-efficiency region. Currently, to solve this problem, there are two major solutions: (1) maintaining the minimum boundary of the SOC at a higher level in mountainous terrain, such as 50%, to avoid excessive battery discharge during the hybrid driving phase in the CS mode [24]. However, this solution requires more battery capacity to satisfy the requirement of the AER, which will increase the cost of the vehicle; (2) temporarily extending the minimum boundary of the SOC to meet the requirement of excessive electricity during the hybrid driving phase in the CS mode [25]. However, to restore the power of the battery, it needs to be continuously charged by the engine after driving through the uphill terrain, which increases the fuel consumption. Moreover, the increased depth of discharge of the SOC will reduce the battery life. Hence, it is necessary to develop an optimal EMS that can improve the fuel economy and the battery life considering the condition of the road.
This study focuses on two problems for the basic control strategy while driving continuously uphill. Firstly, in the CD mode, the PHEV may switch to the CS mode in uphill terrain, as the SOC reaches the minimum boundary. Therefore, the engine becomes the primary power source to drive the vehicle, which increases the fuel consumption. Secondly, in the CS mode, considerably low SOC will reduce the power or cause excessive battery discharge while driving uphill.
In this study, an optimal EMS for the PHEV based on the road-grade information is proposed to improve both the fuel economy and battery life. The most important issues are analyzed, including the prediction of the electricity consumption for the uphill terrain and the planning of trajectory of the SOC. First, the electricity consumption for the uphill terrain is predicted based on the road grade and the average velocity of the traffic obtained from the GPS/GIS system. Moreover, the trajectory of the SOC is preplanned based on the target SOC for the uphill terrain in the CD and CS modes. The proposed EMS was simulated on the MATLAB/Simulink (R2014a, MathWorks, Natick, MA, USA) platform under the comprehensive driving cycle. The effectiveness of the proposed control strategy was validated by comparing with the results of the basic control strategy.
The rest of the paper is organized as follows: Section 2 presents the structure and the basic control strategy of the powertrain system. Section 3 explains the prediction of the road grade and the electricity consumption for the uphill terrain. Section 4 proposes the energy management of the PHEV considering the condition of the road. Section 5 provides the simulation results and analyses of the proposed approach. Section 6 gives the conclusions of this study.
2. Basic Control Strategy
2.1. The Structure and Parameters of the Powertrain System
Figure 2 shows the structure of the PHEV analyzed in this study. The power sources are the engine and the motor, which is an integrated starter generator (ISG). The engine and ISG are coaxially arranged to achieve dynamic coupling, and the master clutch is placed between the engine and the ISG. Furthermore, a dual-clutch transmission (DCT) is used to meet the different requirements of the driving conditions in terms of speed and torque. The powertrain system of the PHEV can operate in one of six working modes, including the pre-charge mode, the driving and charging mode, the engine-driving mode, the electric-driving mode, the hybrid-driving mode, and the regenerative-braking mode. Moreover, the working modes are switched by changing the status of the master clutch and dual clutches. Table 1 gives the basic parameters of the PHEV.
As the length of the paper is limited, the basic control strategy of the PHEV based on the driving-pattern recognition is introduced directly and used as the reference for the proposed control strategy [26]. The main idea of the basic control strategy is stated as follows: first, the basic control strategy is divided into the CD and CS modes based on the SOC of the battery. Six benchmark driving cycles, namely, ECE, NYCC, UDDS, LA92, HWFET, and US06HWY, are considered as typical driving cycles to represent the different road types, namely urban congestion, suburban, and highway conditions. The driving-pattern recognition is realized using the clustering-analysis method [27]. Moreover, the key control parameters are optimized via the genetic algorithm (GA) under the different typical driving cycles, and the corresponding optimized results are saved in the database. Based on the results of the driving-pattern recognition in real time, the PHEV is controlled by the corresponding optimal parameters, which are obtained from database.
2.2. Control Strategy in CD Mode
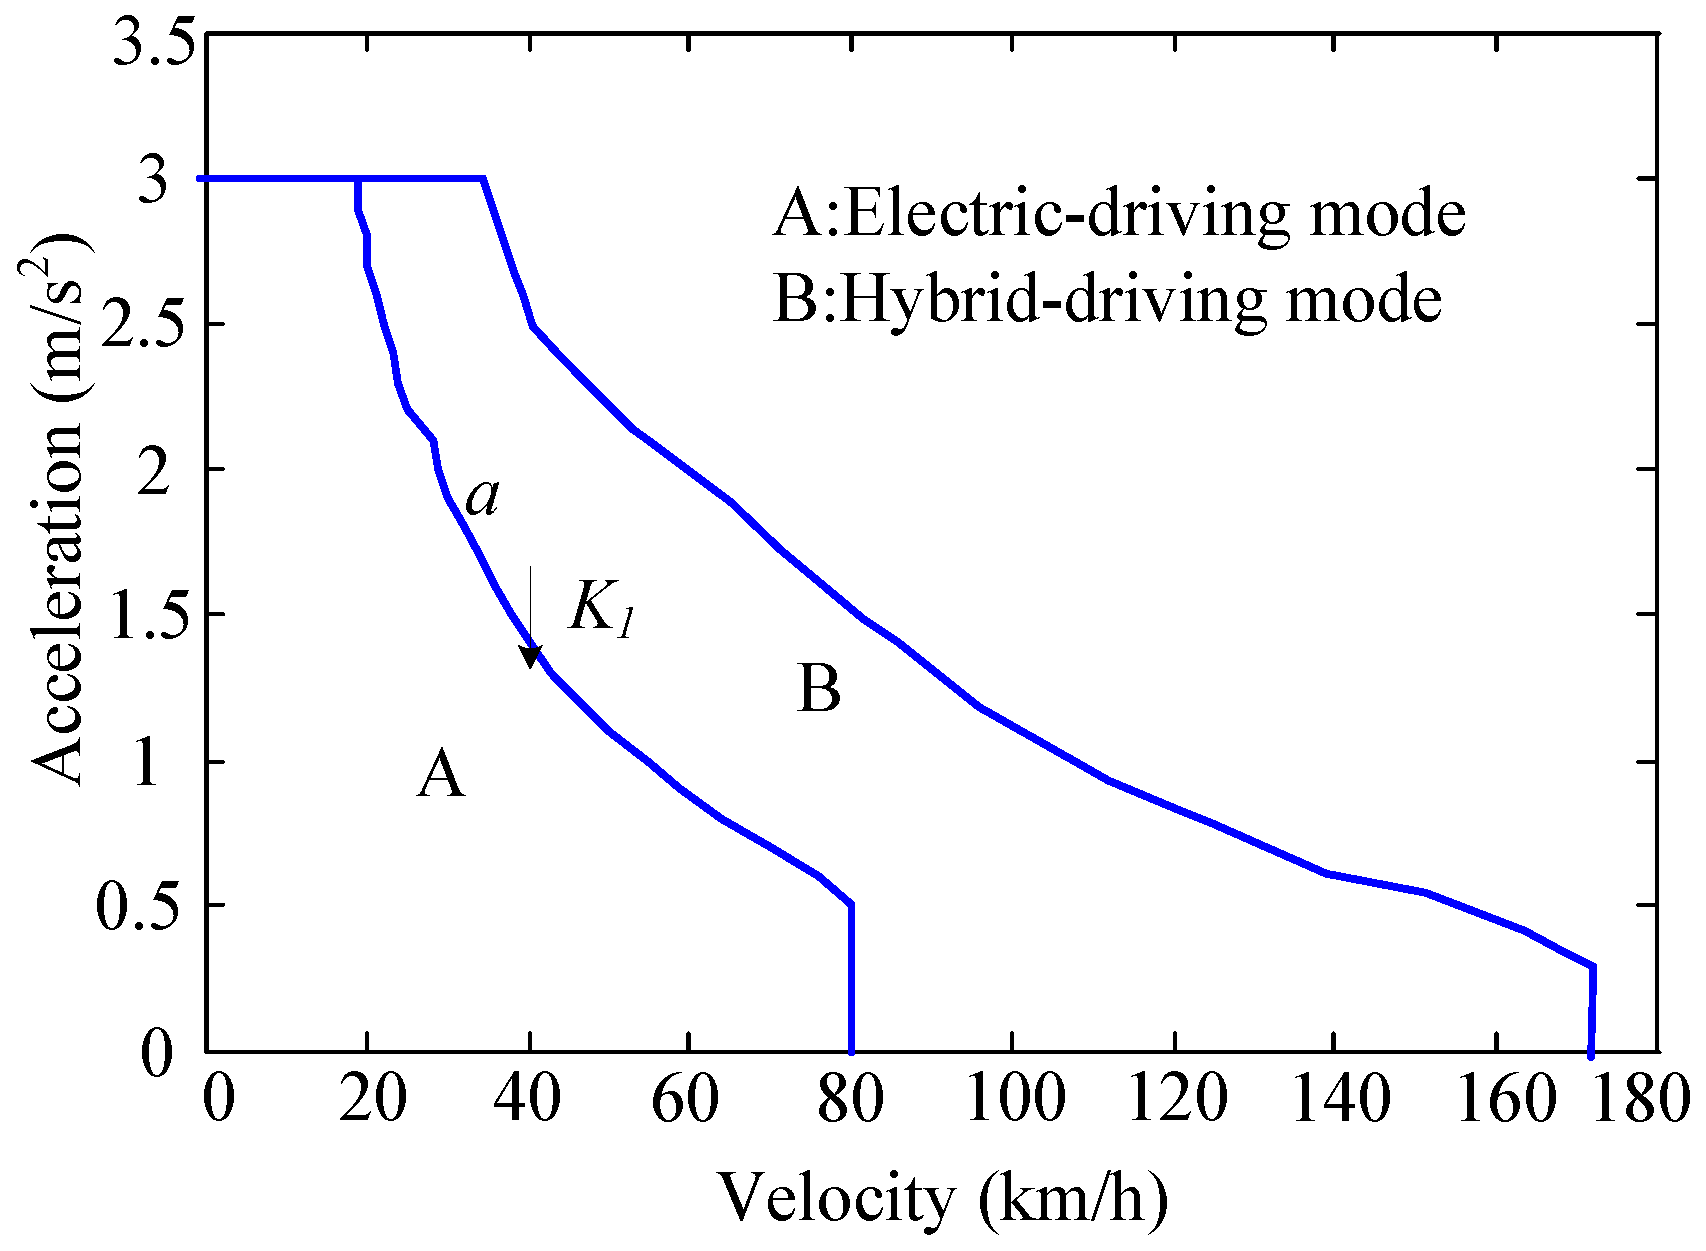
The CD mode of the PHEV comprises the electric-driving and hybrid-driving modes. In the CD mode, the PHEV is mainly driven by the motor to make full use of the battery. If the required power of the vehicle is less than the maximum power of the motor, only the motor will drive the vehicle; otherwise, both the engine and the motor will drive the vehicle together. In our previous research, the efficiency optimization models for the powertrain system under different working modes were developed to obtain the mode-switching schedules [26]. Figure 3 shows the mode-switching schedule of the CD mode.
To achieve better fuel economy, the mode-switching schedule needs to be adaptively modified based on the driving-pattern recognition. Hence, the mode-switching schedule is adjusted by a control parameter K1, which is limited to the range [0, 1] to avoid exceeding the maximum power of the motor (borderline a). Hence, the borderline a will adaptively fluctuate by multiplying the control parameter K1. Furthermore, the control parameter K1 is regarded as a design variable to be optimized offline under different typical driving cycles, and the optimized results are saved in the database.
2.3. Control Strategy in CS Mode
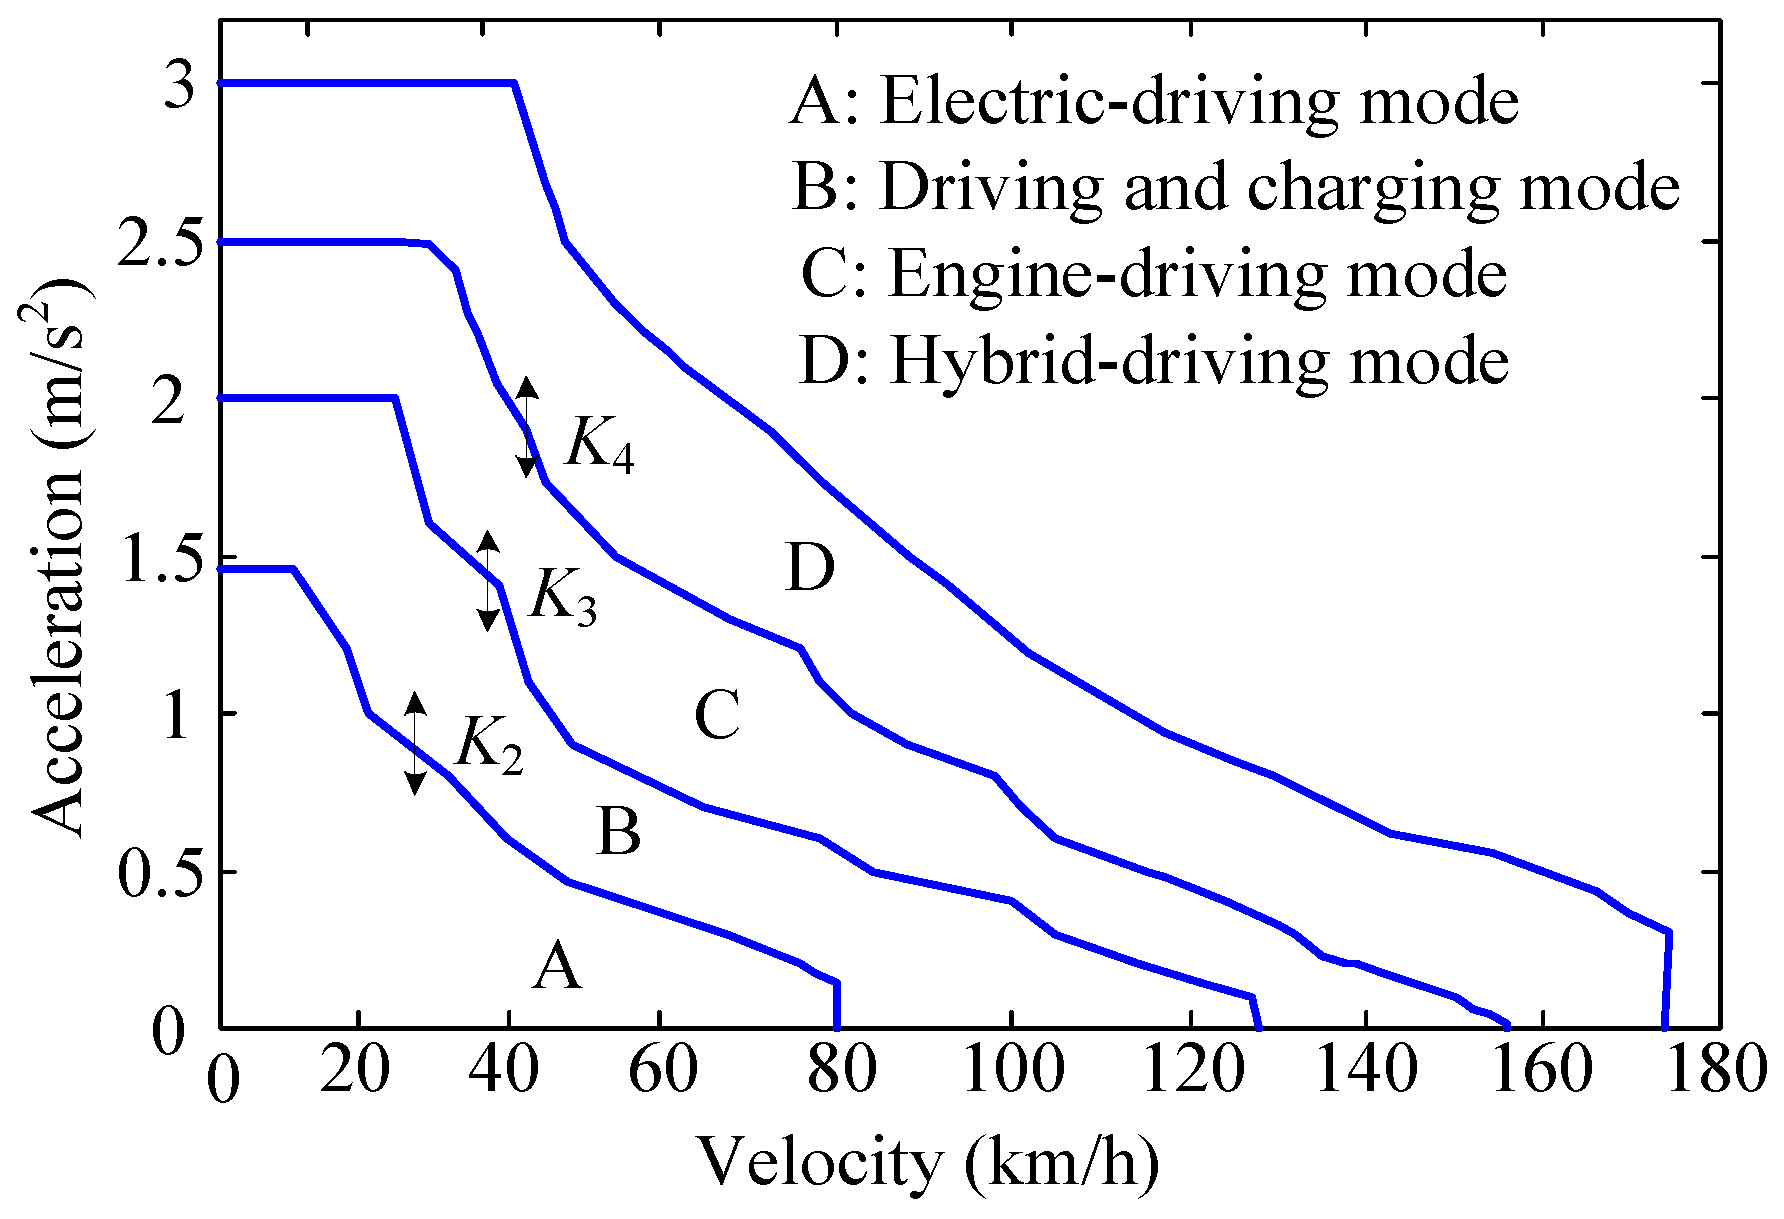
The CS mode of the PHEV comprises the electric-driving mode, driving and charging mode, engine-driving mode, and hybrid-driving mode. In the CS mode, the vehicle is mainly driven by the engine to maintain the battery SOC. Through the optimal torque distribution between the two power sources, the engine operates in the high-efficiency region to improve fuel economy. Figure 4 shows the mode-switching schedule of the CS mode. Similar to the CD mode, the control parameters K2, K3, and K4 are used to modify the mode-switching schedule based on the result of the driving-pattern recognition. The three control parameters are limited to the range [0, 1]. Furthermore, the three control parameters are optimized offline via GA. The controller will select the corresponding optimized parameters from the database based on the result of the driving-pattern recognition.
3. The Prediction of the Electricity Consumption for the Uphill Terrain
The electricity consumption for the uphill terrain is predicted to determine the target SOC of the battery. The road grade and the velocity profile are crucial factors affecting the energy consumption of the HEV, which was validated in a previous research [21]. To determine the target SOC for the uphill terrain, the road grade and the driving cycle need to be predicted.
3.1. Road Grade Information with GPS/GIS System
The PHEV is assumed to be equipped with a GPS/GIS system, which is a reasonable assumption. If the origin and destination of the vehicle are entered in the digital map, the GPS/GIS system can provide the elevation and the length of the road [28]. The location and the distance of the PHEV with respect to the uphill road can be obtained from the GPS, thereby facilitating the prediction of the road grade. Figure 5 illustrates the estimation of the road grade using the length of the uphill road and the difference in altitude between the starting and ending points.
The road grade is estimated using the following expression:
where E2 is the elevation of the road for the sampling point of the road ahead, E1 is the elevation of the road for the current location of the PHEV, and L is the traveling distance between the two sampling points.
3.2. The Prediction of the Driving Cycle along the Slope
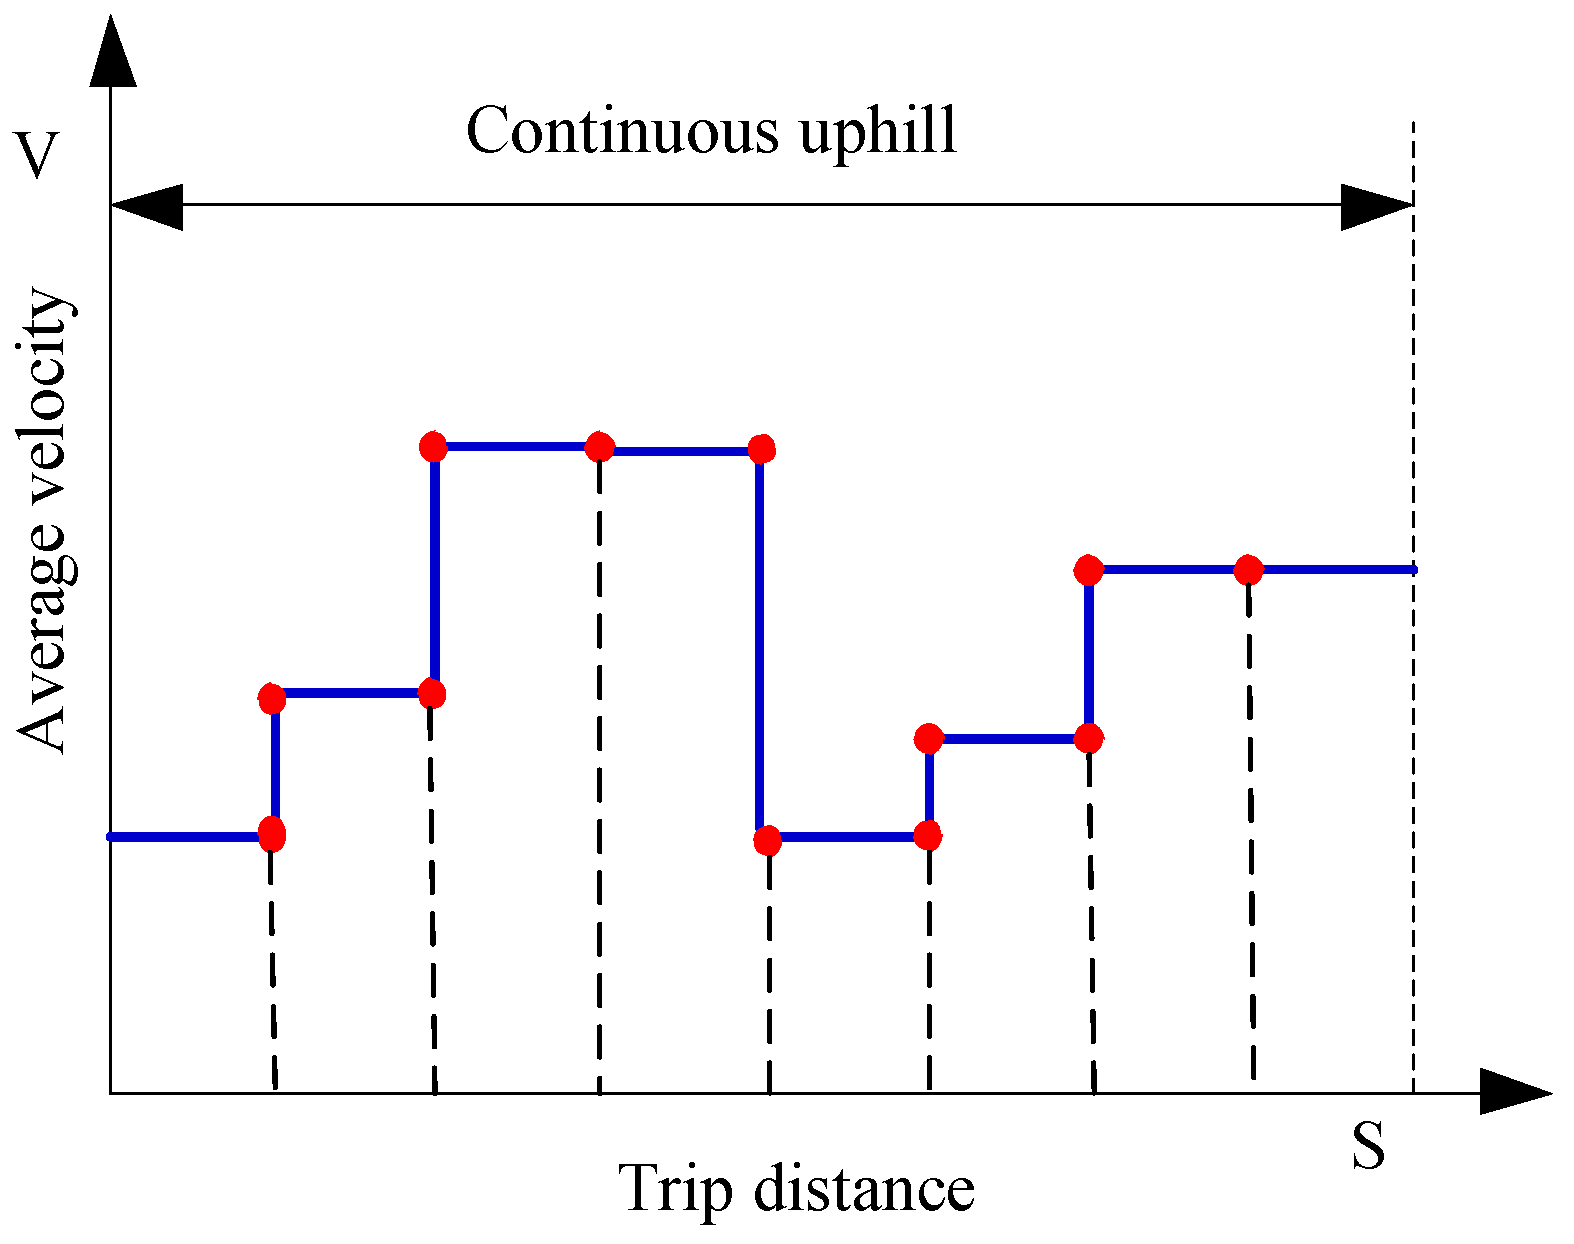
Traffic information, such as traffic flow, velocity limits, and average velocity of the traffic, can be obtained from GPS/GIS. The average velocity of the traffic is the average velocity of all the vehicles on a specific road segment. The average velocity of the traffic on the uphill road is used to predict the driving cycle. First, the uphill road is divided into several segments to sample the average vehicle velocity, and the average velocities of the different segments are used to construct the reference velocity profile in the spatial domain, as shown in Figure 6. The length of the segment for the sampling of the average velocity plays a key role in the accuracy of the prediction. The length of the segment is set as 160 m [29].
The velocity profile in the time domain, which is defined as the reference driving cycle, is obtained by domain transformation. The domain transformation is expressed as follows:
where is the time period for the average-velocity sampling of the segment k in the time domain, is the initial time for the sampling of the segment k in the time domain, is the length of the segment for the average-velocity sampling in the spatial domain, Vs (k) is the average velocity of the vehicle of the segment k in the spatial domain, Vt (k) is the average velocity of the vehicle of the segment k in the time domain, and S is the length of the continuous uphill road.
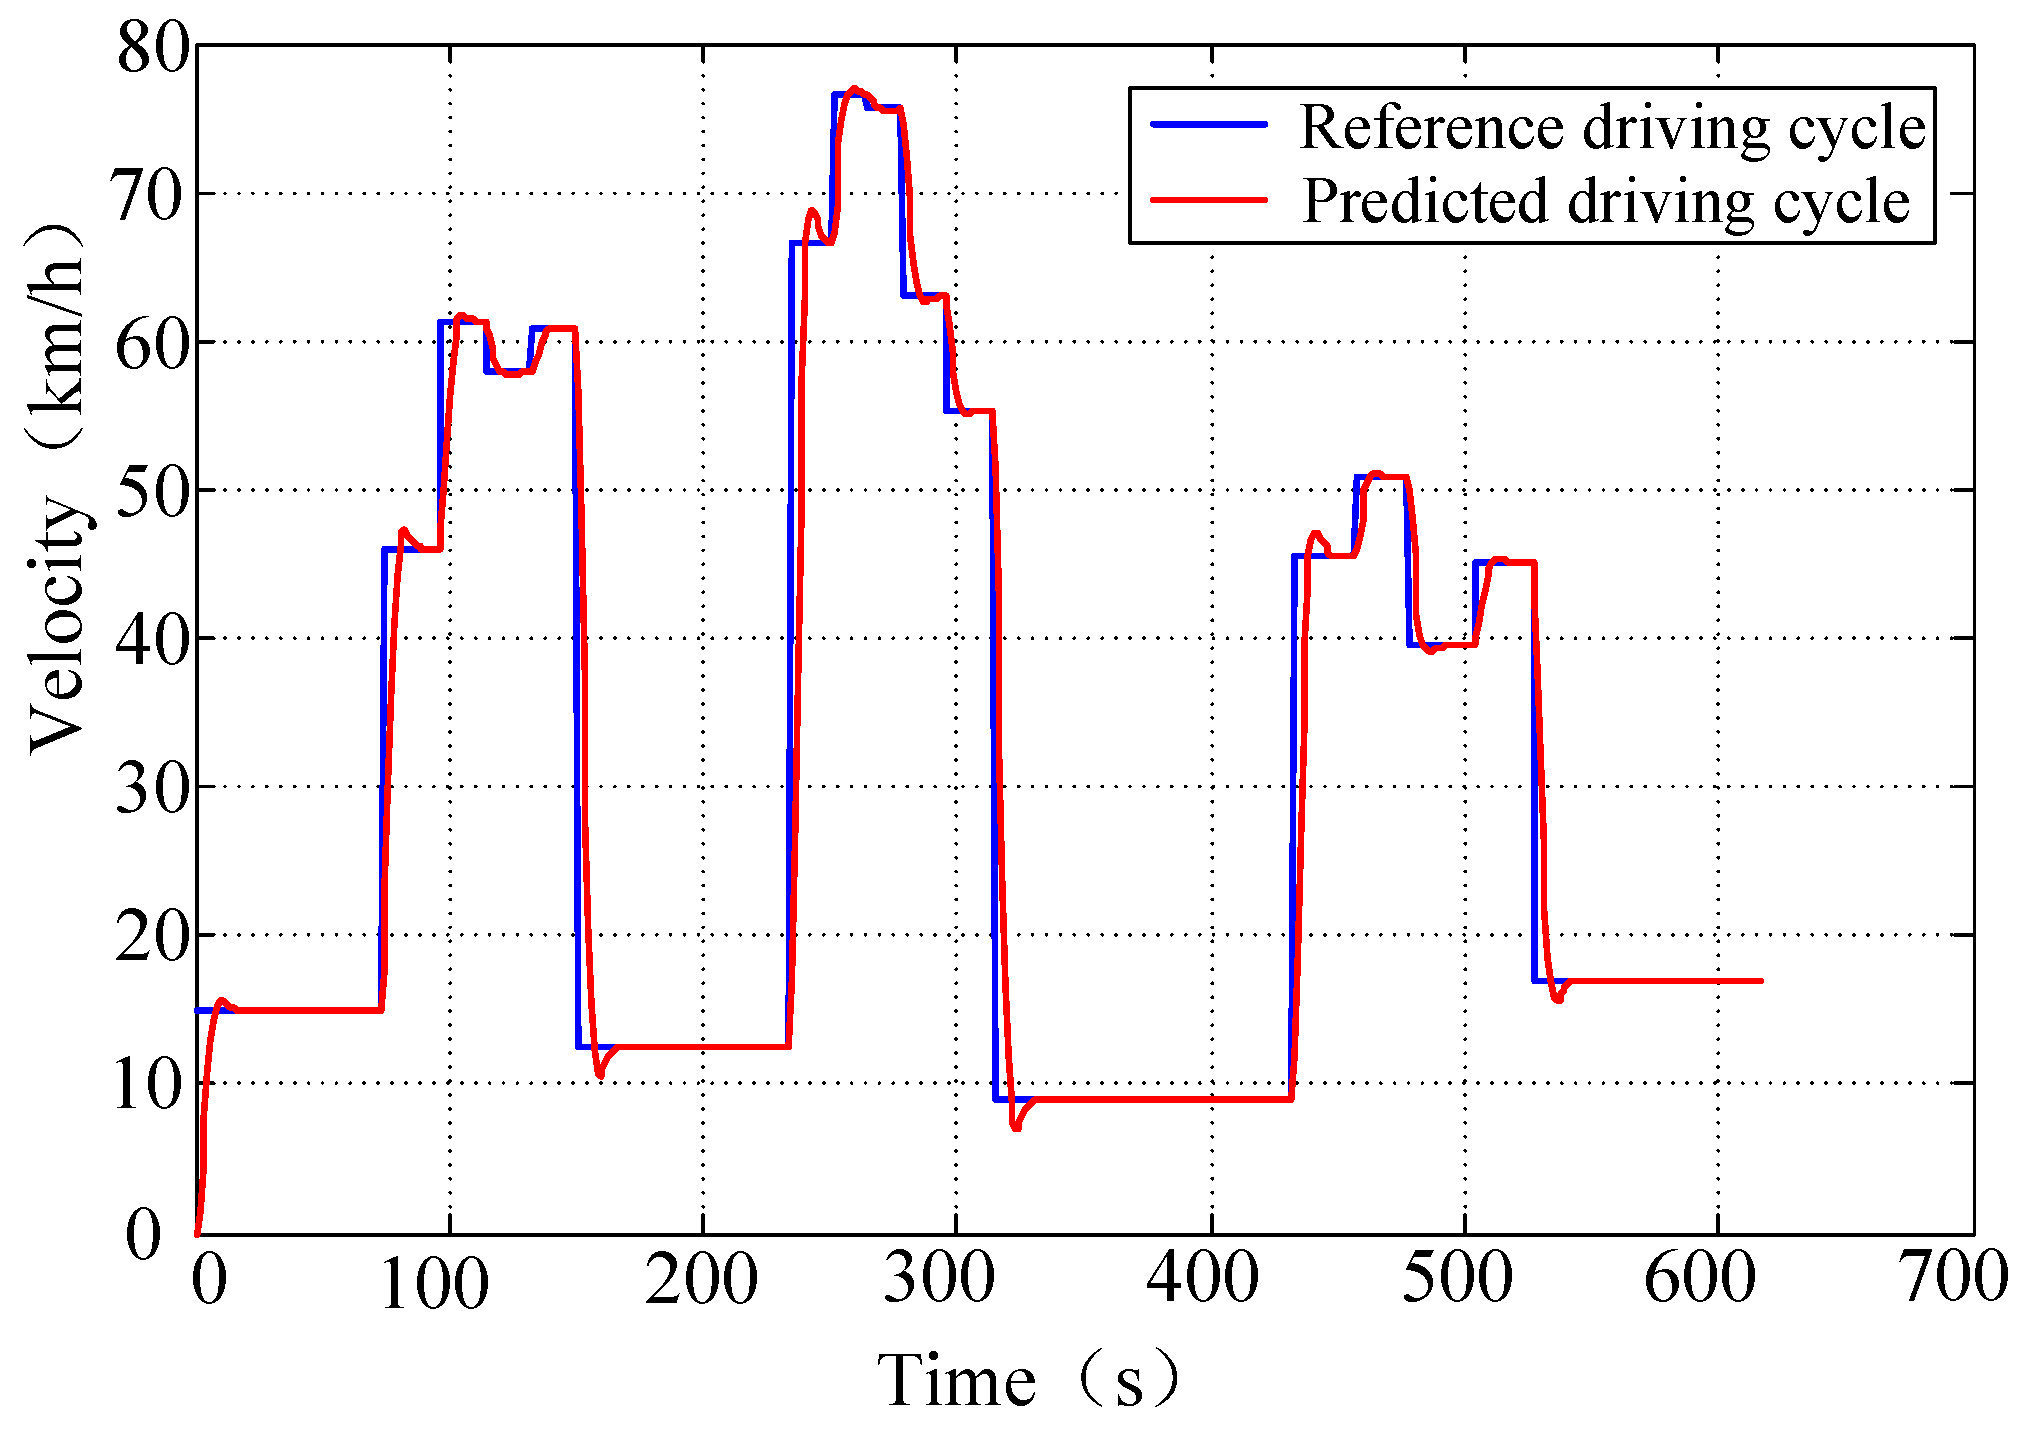
However, the reference driving cycle is not reasonable as the real-driving conditions, as the velocity changes abruptly. To achieve a reasonable driving cycle that reflects the actual driving cycle to the highest possible degree, a second order Butterworth filter with a cut-off frequency of 0.4 Hz is utilized to filter the reference velocity profile. Figure 7 shows the filtering procedure. The filtered velocity profile is selected as the predicted driving cycle for the uphill road. As it is difficult to obtain the traffic information from a simulation environment, this study assumes that the average velocity of the PHEV driving through a specific segment is the same as the average velocity of the traffic obtained from the GPS/GIS system. Hence, the prediction of the driving cycle on the uphill road can be achieved, as shown in Figure 8. The average velocity of the traffic is set as the reference driving cycle, which is obtained from the GPS/GIS. The predicted driving cycles can then be constructed using the Butterworth filter.
3.3. Calculation of Target SOC for the Uphill Terrain
The variation in the SOC during the uphill terrain is calculated based on the road grade and the predicted driving cycle. The traffic information obtained from the GPS/GIS system can be updated every 300 s [30]. Hence, during the interval of the update of the traffic information, the variation in the SOC can be simulated under the predicted driving cycle in time. The simulation model of the powertrain system of the PHEV has been extensively studied, and is not discussed further in this paper. Figure 9 shows the structure of the powertrain-system model.
Based on the variation in the SOC during the uphill terrain, the target SOC for the uphill terrain is determined as follows:
where SOCt is the target SOC for the uphill terrain, SOC0 is the minimum boundary of the SOC, and ΔSOC is the variation in the SOC during the uphill terrain.
4. Energy Management Strategy Based on Road Grade Information
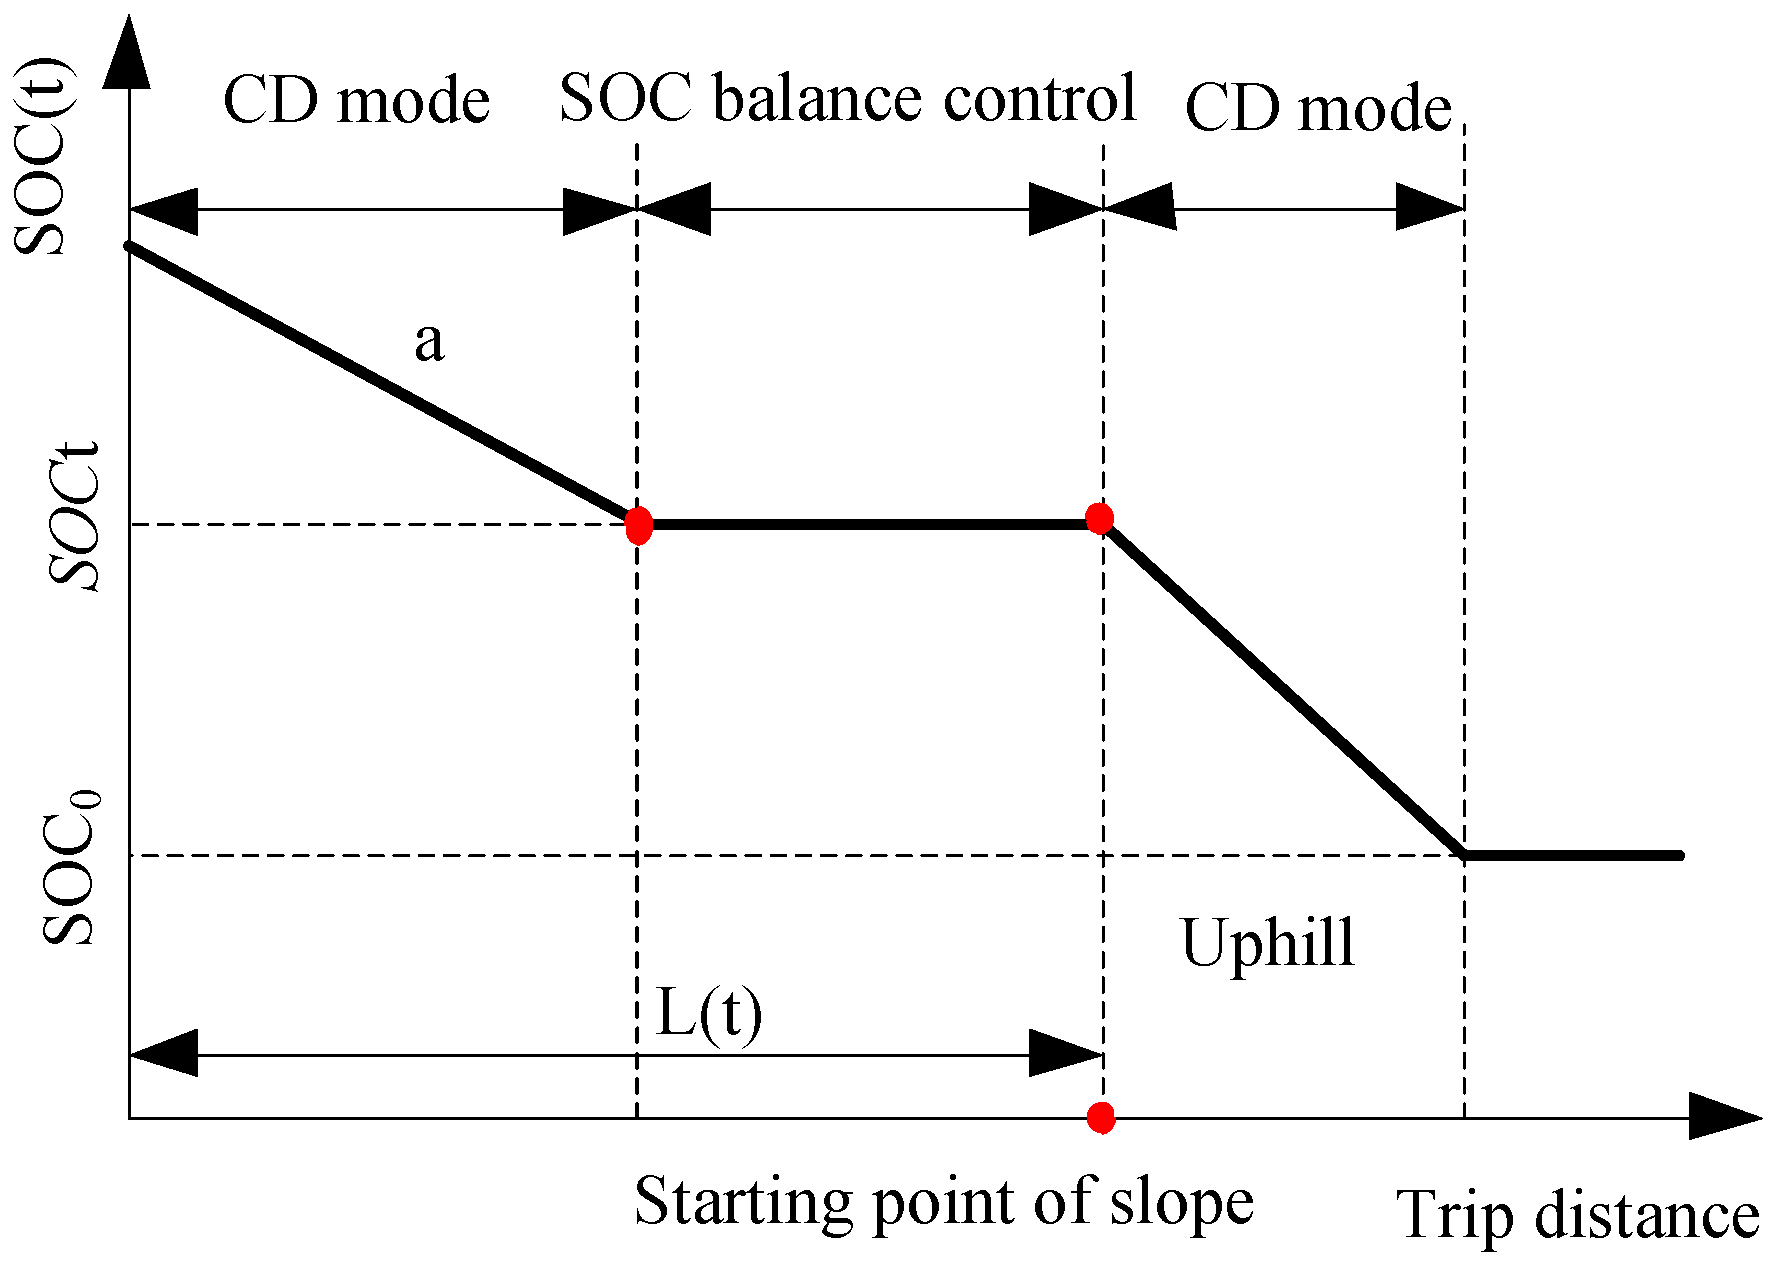
In the paper, in order to avoid excessive battery discharge and reduce the fuel consumption of the PHEV during a continuous uphill terrain trip, an energy management strategy based on road grade information has been proposed for PHEV, whose control diagram is shown in Figure 10. The proposed control strategy is developed based on the basic control strategy.
In the top layer, driving cycles on the uphill road can be predicted with the average vehicle velocity of the traffic obtained from GPS/GIS, and the target SOC for the uphill terrain can be determined by online calculation.
In the bottom layer, the SOC trajectory is preplanned in the CD and CS modes. The SOC trajectory planning strategy can make sure sufficient electricity to drive motor during the uphill terrain. Therefore, the engine can operate in the high-efficiency region with the optimal torque distribution between the engine and motor, which effectively improves the overall efficiency of whole system. The battery SOC is maintained at the target value SOCt through the battery SOC balance control method in the CD mode, and the battery SOC is charged to the target value of SOCt through the pre-charge method in the CS mode. The details of the proposed energy management strategy will be introduced in the following sections.
4.1. Control Strategy for CD Mode
4.1.1. SOC Trajectory Planning Strategy
Due to the sufficient electricity of the power battery in CD mode, it’s necessary to make a judgment whether the current SOC would meet the demand for uphill. The driving mileage per SOC in CD mode denoted by a (km·%−1) was determined offline under different typical driving cycles. The driving mileage per battery SOC, a, which is shown in Table 2, was used to estimate the variation of SOC in the CD mode.
The diagram of SOC trajectory planning in the CD mode is shown in Figure 11, and the control flow is described as follows:
- (1)
- Road grade estimation: The destination of travel, the road path, and the elevation as well as length of the road are determined from the vehicle navigation system (GPS/GIS) before traveling. Then the road grade can be calculated by Equation (1).
- (2)
- Driving cycle prediction: The predicted driving cycle on the uphill road is constructed through average velocity of the traffic on the uphill road obtained from the GPS/GIS.
- (3)
- Target SOC calculation: The variation in SOC during the uphill terrain is calculated, and the target value SOCt for uphill is then determined.
- (4)
- Driving mileage lookup: The type of real-time driving cycle is obtained based on driving pattern recognition, and the driving mileage, a, per SOC is referred from Table 2 based on the real-time driving cycle of PHEV.
- (5)
- SOC control decision: The initial battery SOC for encountering the uphill terrain is calculated before the vehicle took the uphill road. The initial battery SOC for the uphill terrain, which is defined as SOCg, can be calculated using Equation (4). If SOCg is greater than SOCt, the vehicle is still on the electric-driving mode to consume electric energy; otherwise the SOC trajectory is planned by the SOC balance control method:where SOC (t) is the current SOC of power battery, L (t) is the distance between the vehicle current position and uphill road, and a is the driving mileage per SOC in CD mode. Because the result of driving pattern recognition changes with time, the SOCg can be dynamically calculated according to real-time driving cycle.
- (6)
- SOC balance control: The PHEV controller switches to SOC balance control to ensure that the target value SOCt is maintained. As a result, there is sufficient battery power to encounter the uphill terrain when the PHEV took uphill road. Note that the vehicle is controlled by basic strategy after entering the uphill road.
4.1.2. SOC Balance Control
In the SOC balanced control mode, engine and motor work together to maintain a roughly constant battery SOC. It is similar to the basic control strategy in the CS mode. However, the basic control strategy in the CS mode cannot ensure sufficient battery power for uphill terrains, since the battery SOC may change too much during certain driving conditions. Therefore, the SOC balance control method has been proposed, which takes the fuel economy as well as the SOC variation into consideration. The key control parameters of this control strategy are optimized by GA. The optimization target is to obtain optimal parameters to restrict the variation in battery SOC, which can also ensure the fuel economy of PHEV.
(1) Optimization objective function
In order to restrict the battery SOC variation, SOC variation is converted to the corresponding fuel consumption. The equivalent fuel consumption is integrated into the optimization objective function. The SOC correction method has been used for objective function in this paper as follows:
where Δfuel is the equivalent fuel consumption (L), ΔSOC is the variation of battery SOC between the initial and final values, Qcap is the capacity of battery (Ah), is the average value of battery bus voltage during drive cycles (V), is the average value of the engine's power efficiency (g/kW·h), and is the density of gasoline (g/L).
To optimize the fuel economy and prevent excessive variation in the SOC, the fuel consumption and equivalent fuel consumption are integrated in the optimization objective function. Therefore, the optimal control parameters can make sure both the fuel consumption and the SOC variation are the minimum. The fitness function is given by:
where n is the number of optimization variables; are the upper and lower boundaries of the optimization variables, respectively; is the weight coefficient of Δfuel, which is used for adjusting the limitation of SOC variation. The weight coefficient is set as 1.2 using an enumerative technique based on experience and simulation.
(2) Optimized parameters
The mode-switching schedule of the SOC balance control method is the same as that of the basic control strategy in the CS mode, shown in Figure 4. To optimize the fuel economy of the PHEV, the control parameters K2, K3, and K4 are set as the design variables to modify the mode-switching schedule. Furthermore, the electric-driving mode and the driving and charging mode are the most critical modes that influence the variation in the SOC. Hence, two other control parameters SOCele and SOCcharge are created to modify the mode-switching schedule of the electric-driving mode and driving and charging mode, which are given in Equations (7) and (8):
where SOCele is the upper boundary of the SOC in the SOC balance control. The controller switches to the electric-driving mode to consume surplus electric energy when the SOC reaches the upper boundary. Ke is the control parameter that modifies SOCele. SOCcharge is the threshold for switching to the driving and charging mode. To avoid unnecessary fuel consumption, the controller switches to the driving and charging mode only when the SOC is lower than this threshold. Kc is the control parameter that modifies SOCcharge. SOCmin is the lower boundary of the SOC in the SOC balance control, which is considered SOCt based on the calculation of the target SOC for the uphill terrain, given in Section 3.
The five control parameters Ke, K2, K3, K4, and Kc are set as the design variables for the optimization. Table 3 lists the range and initial values of the design variables. The range is selected to ensure that the engine operates in the high-efficiency region and that different working modes will not interfere with each other.
(3) Optimization results
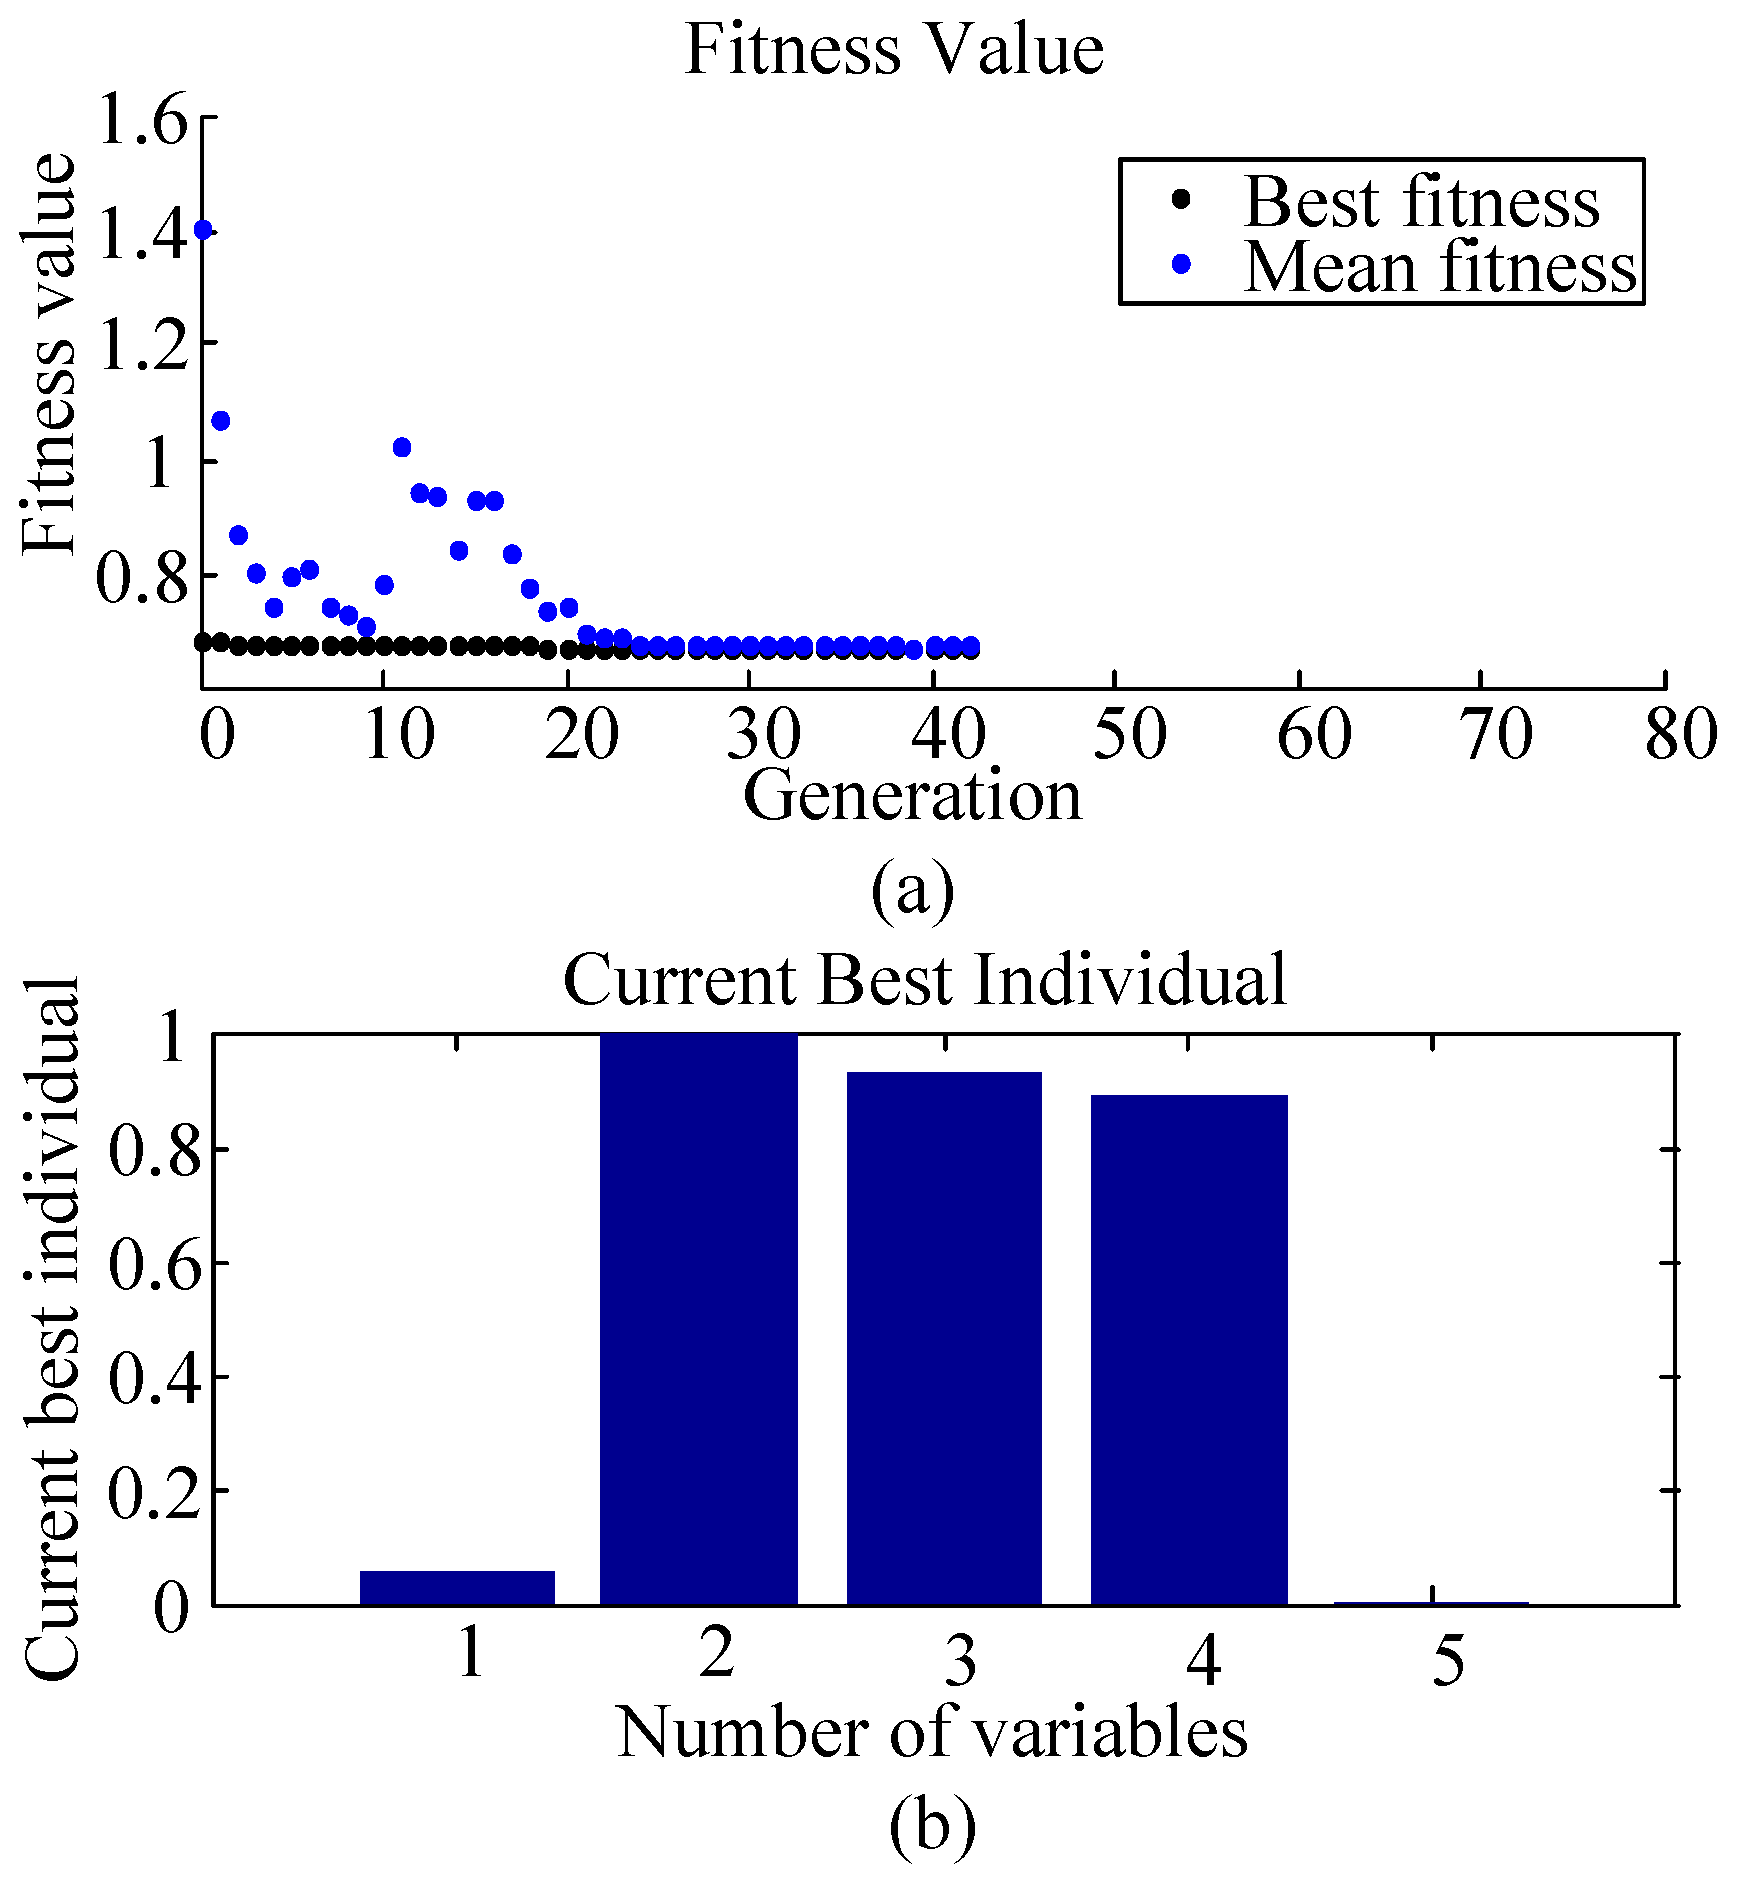
The five design variables are optimized using the GA under the different typical driving cycles. For the optimization of the parameters, the maximum number of generations is set as 80, and the population is initialized by 100 random individuals. Moreover, the elitist amount is set as 10, and the mutation rate is set as 0.4. Table 4 gives the results of the optimization. Figure 12 shows the history of the optimization process for the typical driving cycle LA92.
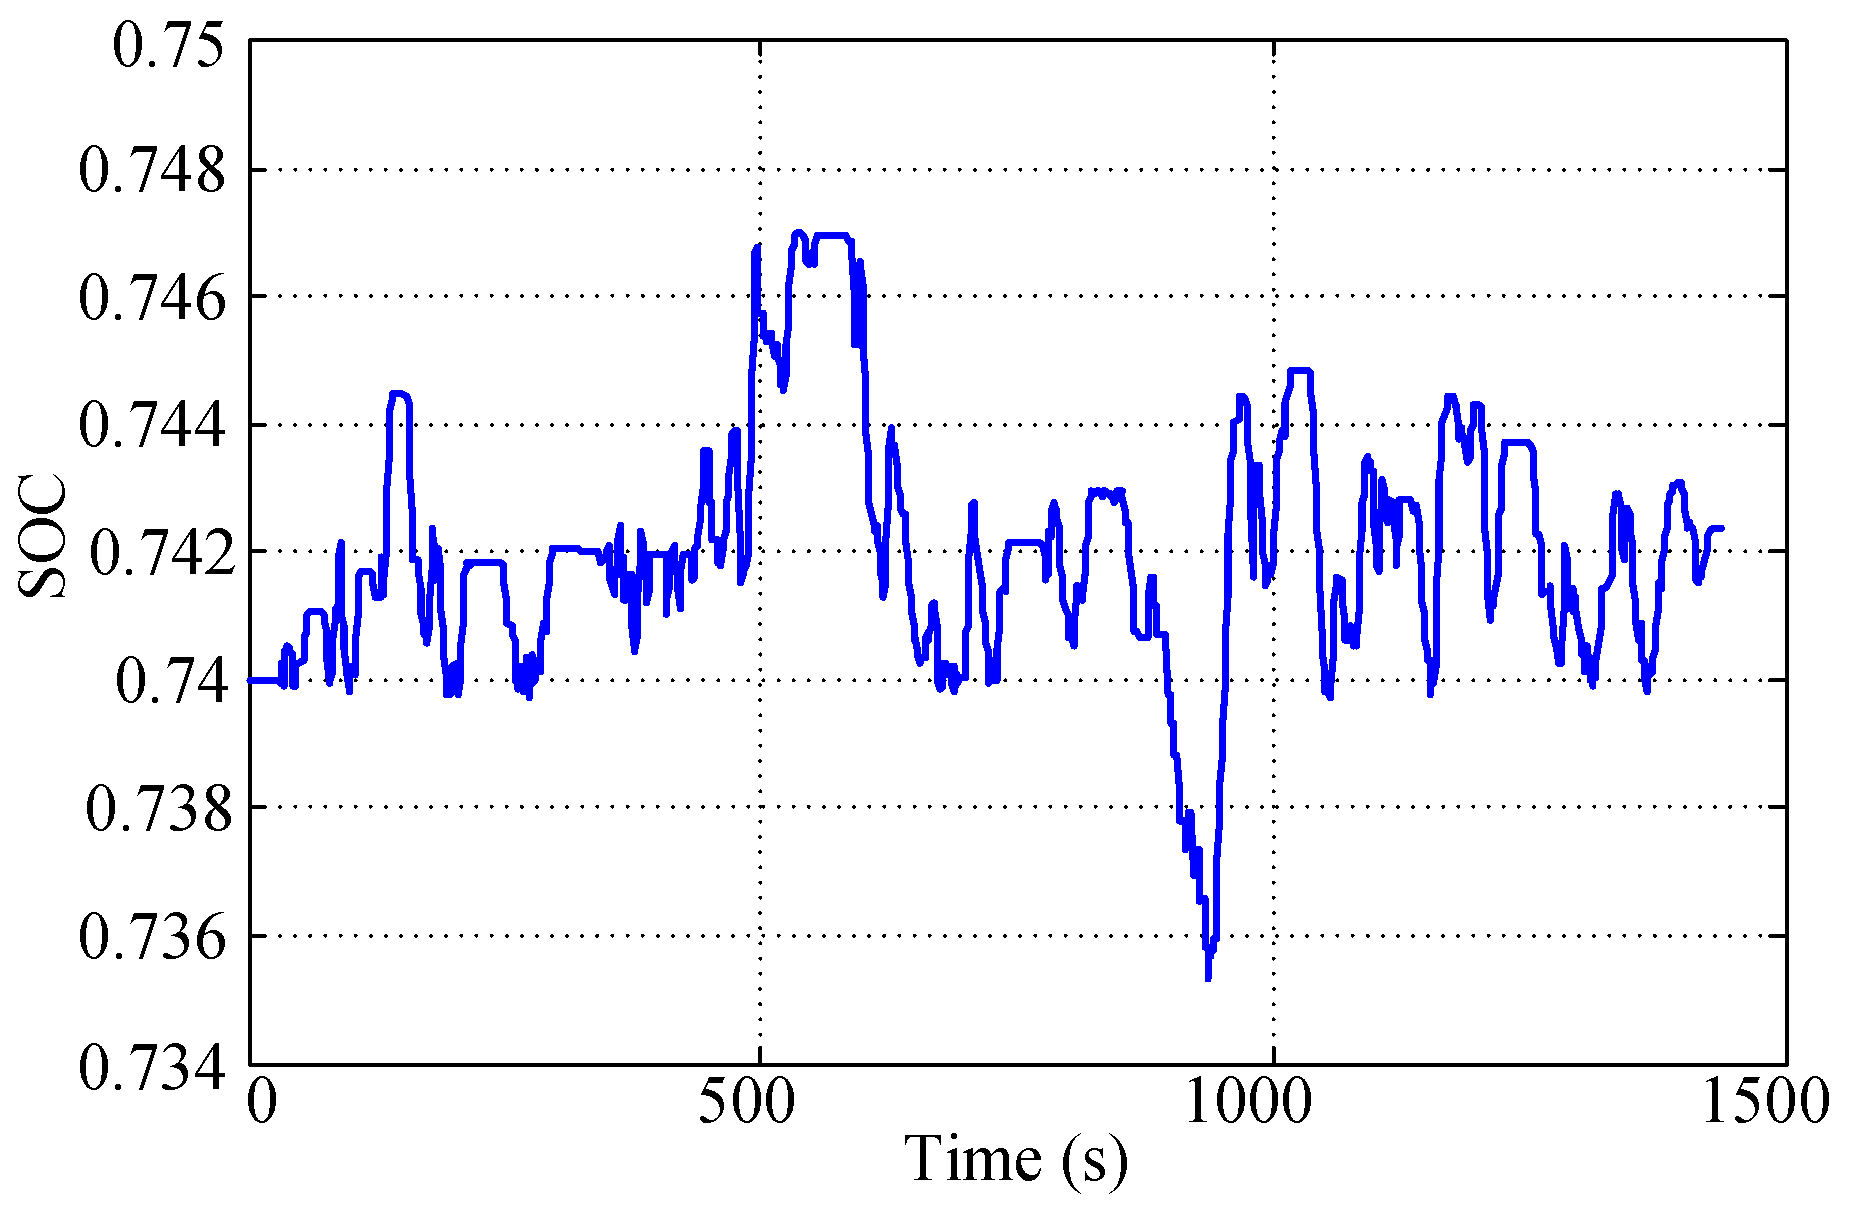
Figure 12a shows the development of the GA. The points terminate after 43 generations, and the fitness value, i.e., the fuel-consumption is 0.674. According to the optimization results, the variation in SOC is maintained within 0.006, 0.002, 0.013, 0.002, 0.003, 0.008 and 0.019, respectively, under the six typical driving cycles. These values satisfy the requirements of the SOC balance control in terms of the consistency of SOC. Figure 13 shows the trajectory of the SOC for the parameter optimization, taking the driving cycle LA92 as an example. The battery SOC is effectively maintained at the initial value.
4.2. Control Strategy for the CS Mode
In the CS mode of the PHEV, the pre-charge mode is designed considering the road grade information based on the basic control strategy. The controller switches to the pre-charge mode before the uphill road based on the prediction of the target SOC for the uphill road, given in Section 3. The pre-charge mode comprises the driving and charging mode, engine-driving mode, and hybrid-driving mode; however, while the electric-driving mode is temporarily terminated to increase the SOC rapidly. As Figure 4 given in Section 2 indicates, the powertrain system of the PHEV will operate in the driving and charging mode when the system behavior is within sections A and B. In the driving and charging mode, the engine operates at the optimal operating points to improve fuel economy, and the remaining power is then used to charge the battery. The vehicle operates only in the electric-driving mode when the velocity of the vehicle is below the launch-speed limit of the engine. The engine launch speed is set as 30 km/h. First, the driving mileage in the pre-charge mode is determined. The driving mileage per battery-SOC variation in the pre-charge mode, defined as b (km·%−1), is determined under different typical driving cycles simulated offline, given in Table 5.
Figure 14 shows the diagram of the SOC trajectory planning in the CS mode. The control flow is described as follows:
- (1)
- Road-grade estimation: The destinations of travel, the path of the road, and the elevation as well as the length of the road are determined from the vehicle navigation system (GPS/GIS) before starting. Then, the road grade can be calculated using Equation (1).
- (2)
- Driving cycle prediction: The predicted driving cycle on the uphill road is developed using the average velocity of the traffic obtained from the GPS/GIS system.
- (3)
- Target-SOC calculation: The variation in the SOC during the uphill terrain is calculated, and the target-battery SOCt for the uphill road is then determined.
- (4)
- Driving mileage lookup: The type of real-time driving cycle is obtained through the driving-pattern recognition, and the driving mileage b per SOC is referred from Table 5 based on the real-time driving cycle of the PHEV.
- (5)
- Pre-charge mode: The particular location between the vehicle and the uphill road is determined. When the PHEV arrives at the particular location, the controller switches to the pre-charge mode at this point. Hence, the SOC increases to the target value when the vehicle enters onto the uphill road. Note that the vehicle is controlled by basic strategy after entering the uphill road. The starting time of the pre-charge mode is given by:where is the distance between the vehicle and the uphill road when the controller switches to the pre-charge mode, SOCt is the target battery SOC for the uphill road, and SOC0 is the minimum boundary of the SOC.
By employing Equations (3) and (9), the distance to the slope at which the controller switches to the pre-charge mode is calculated using Equation (10):
5. Simulation and Analysis
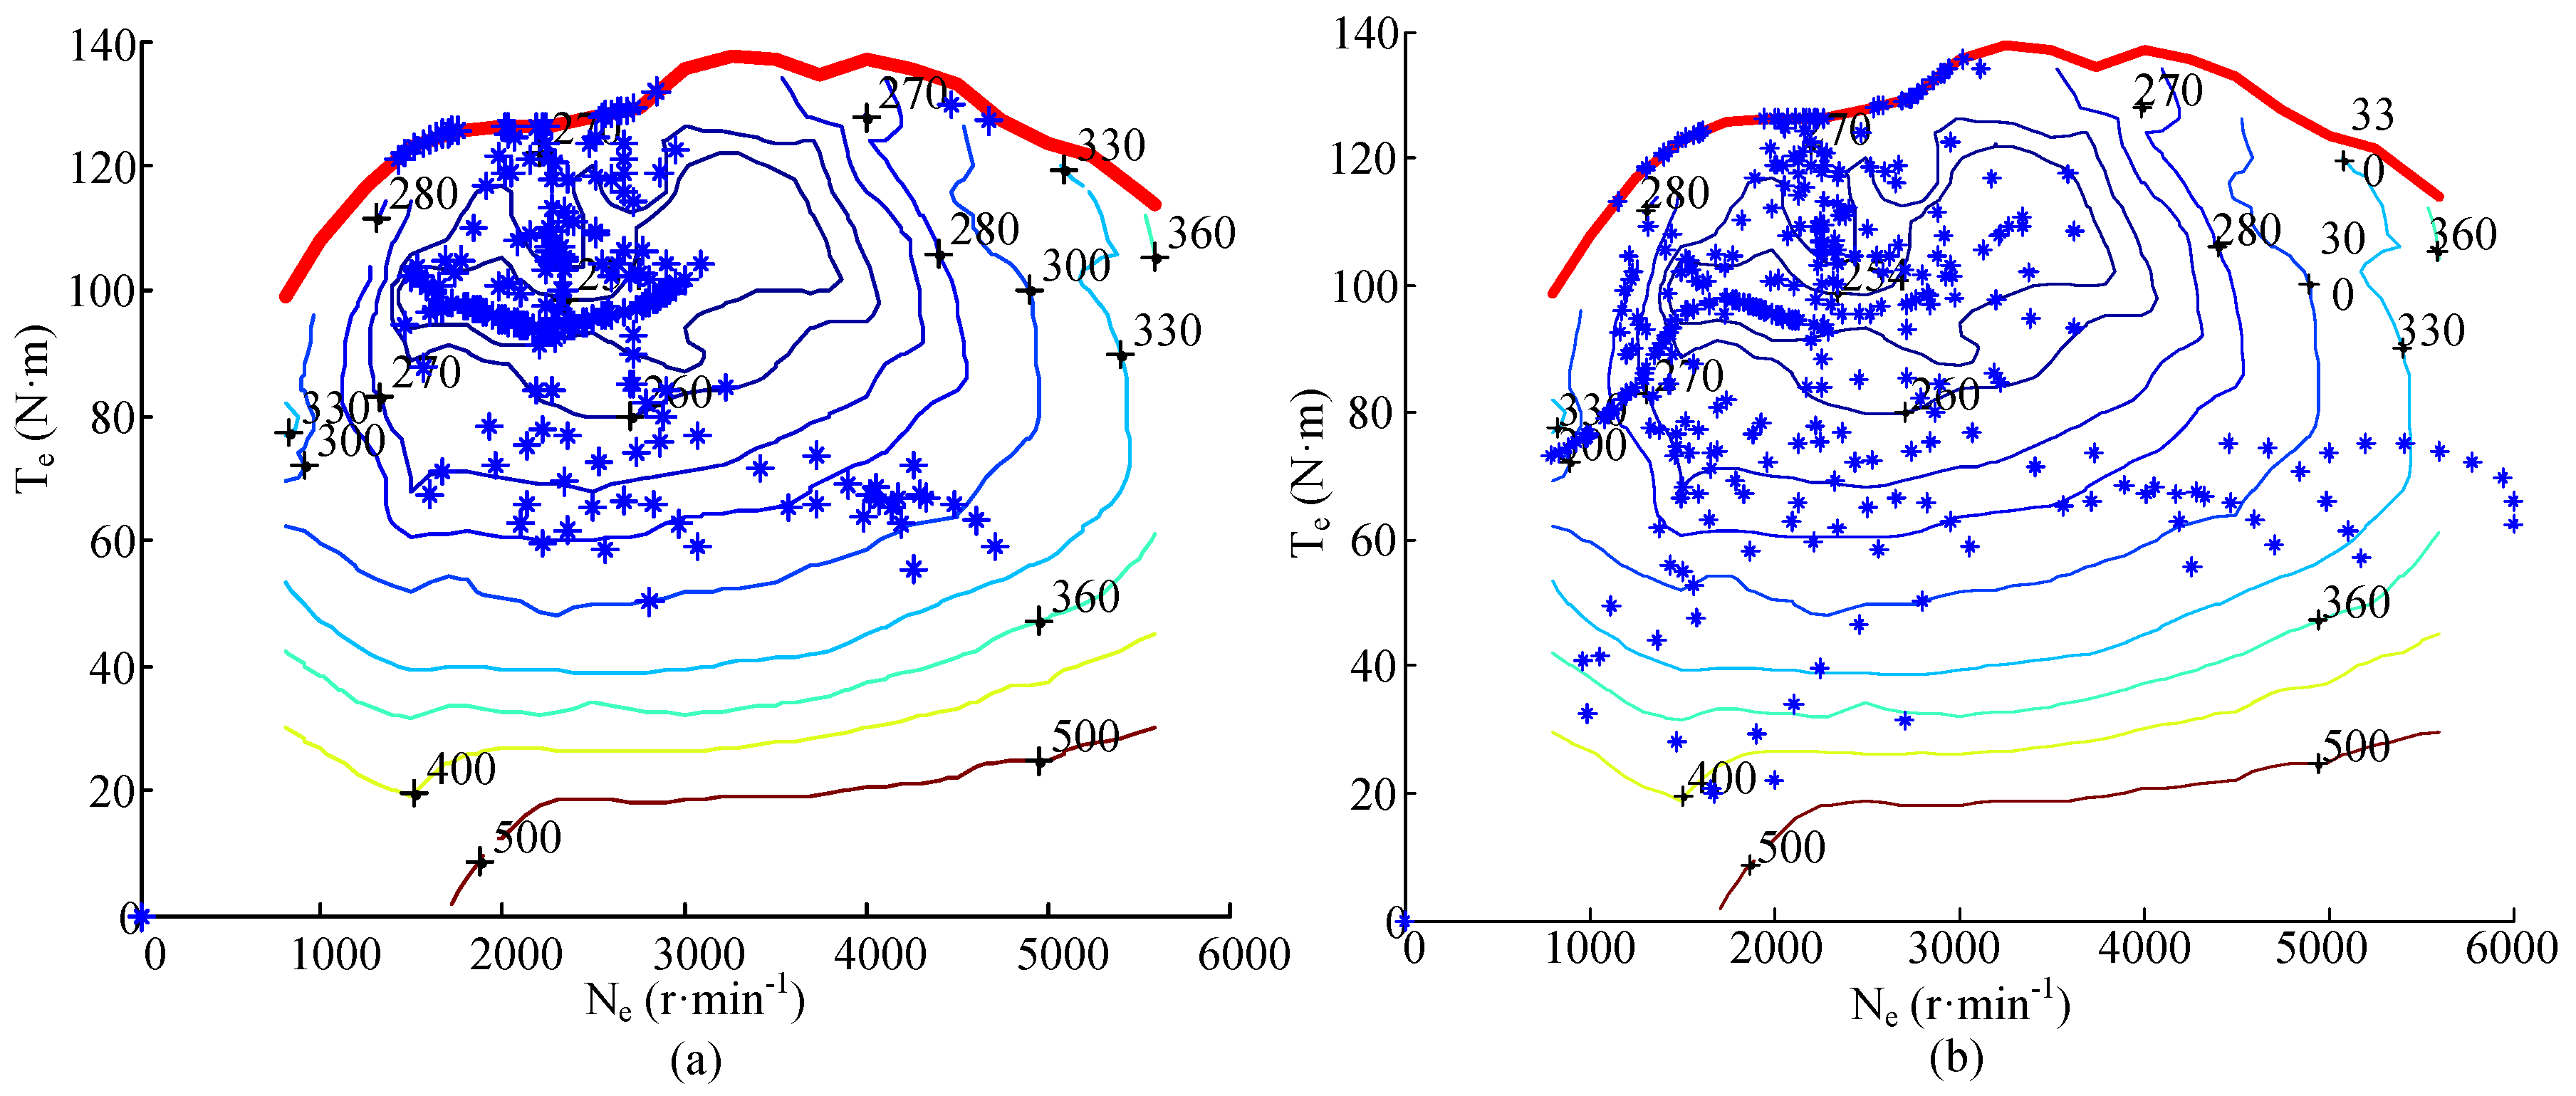
To verify the effectiveness of the proposed control strategy, a backward simulation model has been established using the MATLAB/Simulink platform. The proposed pre-charge mode may lead to double energy conversion losses. In order to evaluate the performance of the proposed strategy, the efficiency models of the key components have been integrated into the simulation model. The efficiency models consist of ISG motor, battery and inverter. The efficiencies of inverter and DCT are modeled as the fixed values 0.92 and 0.95, respectively. The ISG motor working efficiency, which is shown in Figure 15, is obtained from the experiment data. The efficiency model of the power battery is a function of charging/discharging power and SOC as shown in Figure 16. The proposed strategy has been simulated in the CD and CS modes, and the basic strategy is selected as a benchmark strategy for comparison. Table 1 lists the parameters for the simulation.
5.1. Simulation in the CD Mode
Five types of driving cycles (New York bus, 1015, Manhattan, WVUSUB, and HL07) were successively combined into a comprehensive cycle to simulate and evaluate the performance of the proposed control strategy. The information of the road grade and average velocity of the traffic are assumed to be known. The continuous uphill road has a road grade of 4%, an overall length of 3.3 km, and appears at 4724 s, as shown in Figure 17. Table 6 and Figure 18 give the comparison results between the control strategy based on the road grade information and the basic control strategy.
Different from the conventional HEV, a PHEV is mainly driven by the motor in the CD mode, and the power comes from two components: the electricity from the power grid and the fossil fuel. Hence, the cost of energy consumption, which is defined as Qc, is adopted to evaluate the energy economy of the PHEV in the CD mode [31]. The cost of energy consumption is expressed using the following equation:
where Jf is the fuel price (RMB/L), which is set as 7.8 RMB/L; Je is the electricity price (RMB/kW·h) which is set as 0.52 RMB/kW·h; Qf is the fuel consumption (L); Qe is the electricity consumption (kW·h).
As shown in Figure 18b, the proposed strategy switches to the SOC balance control at 4565 s, and the target SOC is 0.402. The SOC balance control is maintained for 156 s, and the SOC of the proposed strategy effectively maintains at SOCt, as the initial SOC for the uphill terrain only slightly changes to 0.391. However, the initial SOC for the uphill terrain in the basic strategy drops to 0.322, as the road grade is not considered. As shown in Figure 18a, the fuel consumption of the proposed strategy is higher than that of the basic strategy during the SOC balance control, as the engine works in tandem with the motor to conserve the battery power. When the PHEV enters the uphill road, the proposed strategy maintains the vehicle operate in the CD mode. The electric motor becomes the primary power source for the proposed control strategy; hence, the fuel consumption reduces. However, for the basic strategy, the PHEV switches to the CS mode at 4756 s because it reaches the minimum boundary of the SOC. Moreover, the engine becomes the primary power source, thereby increasing the fuel consumption of the basic control strategy.
Compared to the basic strategy, the fuel consumption and the cost of energy consumption of the proposed strategy improve by 6.878% and 3.688%, respectively. Hence, the proposed control strategy effectively improves the fuel economy in the CD mode.
5.2. Simulation in the CS Mode
The five selected types of driving cycles (New York bus, 1015, Manhattan, WVUSUB, and HL07) were successively combined into a longer comprehensive cycle for the simulation process to ensure that the range of variation in the SOC includes the CS mode. The information of the road grade and average velocity of the traffic are assumed to be known. The continuous uphill road has a road grade of 8%, an overall length of 5.1 km, and appears at 9350 s, as shown in Figure 19. When the SOC is lower than the minimum boundary and the required power of vehicle is more than that generated by the engine at the optimal operating point, the basic strategy has two different cases: (1) the vehicle is driven only by the engine to avoid excessive battery discharge [13]; (2) the vehicle is driven by both the engine and the motor together while the range of the SOC in the CS mode is temporarily extended to ensure fuel economy and power [25]. The two cases of basic strategy have both been simulated for comparison with the proposed strategy. Table 7 and Figure 20 give the simulation results of the proposed control strategy and the basic control strategy.
Note that the electricity consumption is only estimated in the CD mode. Generally, the electricity consumption is estimated only using the electricity from the power grid. However, in the CS mode, the consumed electricity mainly comes from the fossil fuel in the driving and charging mode. As slopes are not encountered during the CD mode, with the same control rules in the CD mode, the electricity consumptions of the two strategies are both 4.135 kW·h, as shown in Figure 20d.
In the first case, for the basic strategy, the vehicle is driven only by the engine when the SOC is lower than the minimum boundary. The proposed strategy effectively improves the fuel economy. As shown in Figure 20c, the controller switches to the pre-charge mode at 7640 s, and the SOC increases to 0.355 when the vehicle enters the slope. After the uphill terrain, the final SOC of the proposed control strategy is 0.301, which is close to the minimum boundary without excessively discharging the battery. As shown in Figure 20b, the proposed strategy significantly reduces the fuel consumption on the uphill road owing to the optimal torque distribution between the engine and motor. Figure 21 illustrates that, during the uphill terrain, the proposed strategy can ensure that the engine operates at relatively optimal operating points; furthermore, the vehicle can be driven in the electric-driving mode at low speed and torque, which effectively improves the efficiency and reduces the emission of the engine. Compared to the basic control strategy, the proposed control strategy improves the fuel consumptions by 0.616% and 24.431% in the whole trip and during the uphill terrain, respectively.
In the second case, for the basic strategy, the motor works in tandem with the engine during the uphill terrain. The proposed control strategy effectively improves the fuel economy and battery life of the PHEV. As shown in Figure 20c, for the proposed strategy, the electricity of the battery is sufficient because the controller switches to the pre-charge mode before encountering the uphill road; whereas in the basic strategy, the SOC drops to 0.251 after the uphill terrain. Hence, the depth of discharge in the basic strategy is lower than the minimum boundary by 16.43%, thereby excessively discharging the battery. There is an evident difference between the ending SOCs of the two strategies. Hence, the SOC correction method based on the SAE J1711 standard is necessary to calculate the equivalent fuel consumption that compensates for the difference in the SOC [32]. By using this method, the fuel economy of the proposed strategy improves by 2.744%. Furthermore, the battery discharges excessively in the basic strategy, which reduces the battery life.
6. Conclusions
An optimal EMS for the PHEV based on the road grade information is proposed in this study. The effectiveness of the proposed strategy is validated via the simulation, which improves both the fuel economy and battery life of the PHEV. The following work was conducted in this study:
- (1)
- An algorithm that predicts the electricity consumption during the uphill terrain was developed based on the information obtained from the GPS/GIS system. The road-grade information is obtained from the GPS system, and the driving cycles on the uphill road are predicted through the average velocity of the traffic obtained from the GIS system. Furthermore, the target SOC for the uphill road is calculated based on the road grade information and predicted driving cycles.
- (2)
- In the CD mode, the trajectory of the SOC is preplanned using the SOC balance control method based on the target SOC. The key control parameters are optimized using the GA to balance the SOC and improve the fuel economy. Compared to the basic control strategy, the simulation results show that the proposed strategy improves the fuel consumption and cost of energy consumption by 6.878% and 3.688%, respectively.
- (3)
- In the CS mode, the trajectory of the SOC is preplanned using the pre-charge mode. The power battery is charged to the target SOC before entering the uphill road. Moreover, the proposed strategy improves the fuel consumption in the CS mode compared to that of the basic control strategy, and the excessive battery discharge is avoided during the continuous uphill terrain.
Acknowledgments
The work presented in this paper is funded by the China Postdoctoral Science Foundation (No. 2016M602925XB), and the Fundamental Research Funds for the Central Universities (No. 106112016CDJXY330001), the Key Laboratory of Advanced Manufacture Technology for Automobile Parts, Ministry of Education (No. 2016KLMT06) and the Chongqing Key Technology Innovation Project of Key Industries(No. CSTC2015ZDCY-ZTZX60013).
Author Contributions
Yonggang Liu wrote the paper and provided algorithms; Jie Li and Zhenzhen Lei completed the simulation for case studies; Ming Ye analyzed the simulation results; Datong Qin and Yi Zhang conceived the structure and research direction of the paper.
Conflicts of Interest
The authors declare no conflict of interest.
References
- Gong, Q.; Li, Y.; Peng, Z.-R. Optimal power management of plug-in HEV with intelligent transportation system. In Proceedings of the 2007 IEEE/ASME International Conference on Advanced Intelligent Mechatronics, Seattle, WA, USA, 11–15 November 2007. [Google Scholar]
- Hofman, T.; Steinbuch, M.; Van Druten, R.; Serrarens, A. Rule-based energy management strategies for hybrid vehicles. Int. J. Electr. Hybrid Veh. 2007, 1, 71–94. [Google Scholar] [CrossRef]
- Sciarretta, A.; Back, M.; Guzzella, L. Optimal control of parallel hybrid electric vehicles. IEEE Trans. Control Syst. Technol. 2004, 12, 352–363. [Google Scholar] [CrossRef]
- Jeon, S.-I.; Jo, S.-T.; Park, Y.-I.; Lee, J.-M. Multi-mode driving control of a parallel hybrid electric vehicle using driving pattern recognition. J. Dyn. Syst. Meas. Control 2002, 124, 141–149. [Google Scholar] [CrossRef]
- Zhang, S.; Xiong, R. Adaptive energy management of a plug-in hybrid electric vehicle based on driving pattern recognition and dynamic programming. Appl. Energy 2015, 155, 68–78. [Google Scholar] [CrossRef]
- Zhang, C.; Vahidi, A. Route preview in energy management of plug-in hybrid vehicles. IEEE Trans. Control Syst. Technol. 2012, 20, 546–553. [Google Scholar] [CrossRef]
- Zhang, C.; Vahidi, A.; Pisu, P.; Li, X.; Tennant, K. Role of terrain preview in energy management of hybrid electric vehicles. IEEE Trans. Veh. Technol. 2010, 59, 1139–1147. [Google Scholar] [CrossRef]
- Xiong, R.; Sun, F.; Chen, Z.; He, H. A data-driven multi-scale extended Kalman filtering based parameter and state estimation approach of lithium-ion olymer battery in electric vehicles. Appl. Energy 2014, 113, 463–476. [Google Scholar] [CrossRef]
- Sun, F.; Xiong, R.; He, H. A systematic state-of-charge estimation framework for multi-cell battery pack in electric vehicles using bias correction technique. Appl. Energy 2016, 162, 1399–1409. [Google Scholar] [CrossRef]
- Zhang, Y.; Xiong, R.; He, H.; Shen, W. A lithium-ion battery pack state of charge and state of energy estimation algorithms using a hardware-in-the-loop validation. IEEE Trans. Power Electr. 2016, 32, 4421–4431. [Google Scholar] [CrossRef]
- Callaway, D.S.; Hiskens, I.A. Achieving controllability of electric loads. Proc. IEEE 2011, 99, 184–199. [Google Scholar] [CrossRef]
- Ma, Z.; Zou, S.; Liu, X. A distributed charging coordination for large-scale plug-in electric vehicles considering battery degradation cost. IEEE Trans. Control Syst. Technol. 2015, 23, 2044–2052. [Google Scholar] [CrossRef]
- Banvait, H.; Anwar, S.; Chen, Y. A rule-based energy management strategy for plug-in hybrid electric vehicle (PHEV). In Proceedings of the 2009 American Control Conference, St. Louis, MO, USA, 10–12 June 2009. [Google Scholar]
- Karbowski, D.; Pagerit, S.; Kwon, J.; Rousseau, A.; von Pechmann, K.-F.F. “Fair” Comparison of Powertrain Configurations for Plug-In Hybrid Operation Using Global Optimization; SAE Technical Paper 0148-7191; SAE: Warrendale, PA, USA, 2009. [Google Scholar]
- Zhang, S.; Xiong, R.; Cao, J. Battery durability and longevity based power management for plug-in hybrid electric vehicle with hybrid energy storage system. Appl. Energy 2016, 179, 316–328. [Google Scholar] [CrossRef]
- Zhang, S.; Xiong, R.; Zhang, C. Pontryagin’s minimum principle-based power management of a dual-motor-driven electric bus. Appl. Energy 2015, 159, 370–380. [Google Scholar] [CrossRef]
- Sun, C.; Hu, X.; Moura, S.J.; Sun, F. Velocity predictors for predictive energy management in hybrid electric vehicles. IEEE Trans. Control Syst. Technol. 2015, 23, 1197–1204. [Google Scholar]
- Di Cairano, S.; Bernardini, D.; Bemporad, A.; Kolmanovsky, I.V. Stochastic MPC with learning for driver-predictive vehicle control and its application to HEV energy management. IEEE Trans. Control Syst. Technol. 2014, 22, 1018–1031. [Google Scholar] [CrossRef]
- Zheng, C.; Xu, G.; Xu, K.; Pan, Z.; Liang, Q. An energy management approach of hybrid vehicles using traffic preview information for energy saving. Energy Convers. Manag. 2015, 105, 462–470. [Google Scholar] [CrossRef]
- Valera, J.; Heriz, B.; Lux, G.; Caus, J.; Bader, B. Driving cycle and road grade on-board predictions for the optimal energy management in EV-PHEVs. In Proceedings of the 2013 World Electric Vehicle Symposium and Exhibition (EVS27), Barcelona, Spain, 17–20 November 2013. [Google Scholar]
- Younes, Z.; Boudet, L.; Suard, F.; Gérard, M.; Rioux, R. Analysis of the main factors influencing the energy consumption of electric vehicles. In Proceedings of the 2013 IEEE International Electric Machines & Drives Conference (IEMDC), Chicago, IL, USA, 12–15 May 2013. [Google Scholar]
- Khayyer, P.; Wollaeger, J.; Onori, S.; Marano, V.; Özgüner, Ü.; Rizzoni, G. Analysis of impact factors for plug-in hybrid electric vehicles energy management. In Proceedings of the 2012 15th International IEEE Conference on Intelligent Transportation Systems, Anchorage, AK, USA, 16–19 September 2012. [Google Scholar]
- Serrao, L.; Onori, S.; Sciarretta, A.; Guezennec, Y.; Rizzoni, G. Optimal energy management of hybrid electric vehicles including battery aging. In Proceedings of the 2011 American Control Conference, San Francisco, CA, USA, 29 June–1 July 2011. [Google Scholar]
- Bockstette, J.; Habermann, K.; Ogrzewalla, J.; Pischinger, M.; Seibert, D. Performance Plus Range: Combined Battery Concept for Plug-In Hybrid Vehicles. SAE Int. J. Altern. Powertrains 2013, 2, 156–171. [Google Scholar] [CrossRef]
- Kamichi, K.; Yamamoto, M.; Fushiki, S.; Yoda, T.; Kurachi, S.; Kojima, K. Development of Plug-in Hybrid System for Midsize Car; SAE Technical Paper 0148–7191; SAE: Warrendale, PA, USA, 2012. [Google Scholar]
- Qin, D.; Zhao, X.; Su, L.; Yang, G. Variable parameters energy management strategy for plug-in hybrid electric vehicle. China J. Highway Transp. 2015, 28, 112–118. (In Chinese) [Google Scholar]
- Gu, B.; Rizzoni, G. An adaptive algorithm for hybrid electric vehicle energy management based on driving pattern recognition. In Proceedings of the ASME 2006 International Mechanical Engineering Congress and Exposition, Chicago, IL, USA, 5–10 November 2006. [Google Scholar]
- Rajagopalan, A.; Washington, G. Intelligent Control of Hybrid Electric Vehicles Using GPS Information; SAE Technical Paper 0148–7191; SAE: Warrendale, PA, USA, 2002. [Google Scholar]
- Sun, C.; Moura, S.J.; Hu, X.; Hedrick, J.K.; Sun, F. Dynamic traffic feedback data enabled energy management in plug-in hybrid electric vehicles. IEEE Trans. Control Syst. Technol. 2015, 23, 1075–1086. [Google Scholar]
- Chen, C.; Petty, K.; Skabardonis, A.; Varaiya, P.; Jia, Z. Freeway performance measurement system: Mining loop detector data. Transp. Res. Rec. J. Transp. Res. Board 2001, 1748, 96–102. [Google Scholar] [CrossRef]
- Moura, S.J.; Callaway, D.S.; Fathy, H.K.; Stein, J.L. Tradeoffs between battery energy capacity and stochastic optimal power management in plug-in hybrid electric vehicles. J. Power Sources 2010, 195, 2979–2988. [Google Scholar] [CrossRef]
- Hou, C.; Ouyang, M.; Xu, L.; Wang, H. Approximate Pontryagin’s minimum principle applied to the energy management of plug-in hybrid electric vehicles. Appl. Energy 2014, 115, 174–189. [Google Scholar] [CrossRef]
Figure 1.
The trajectory of the SOC in the CD–CS control strategy.
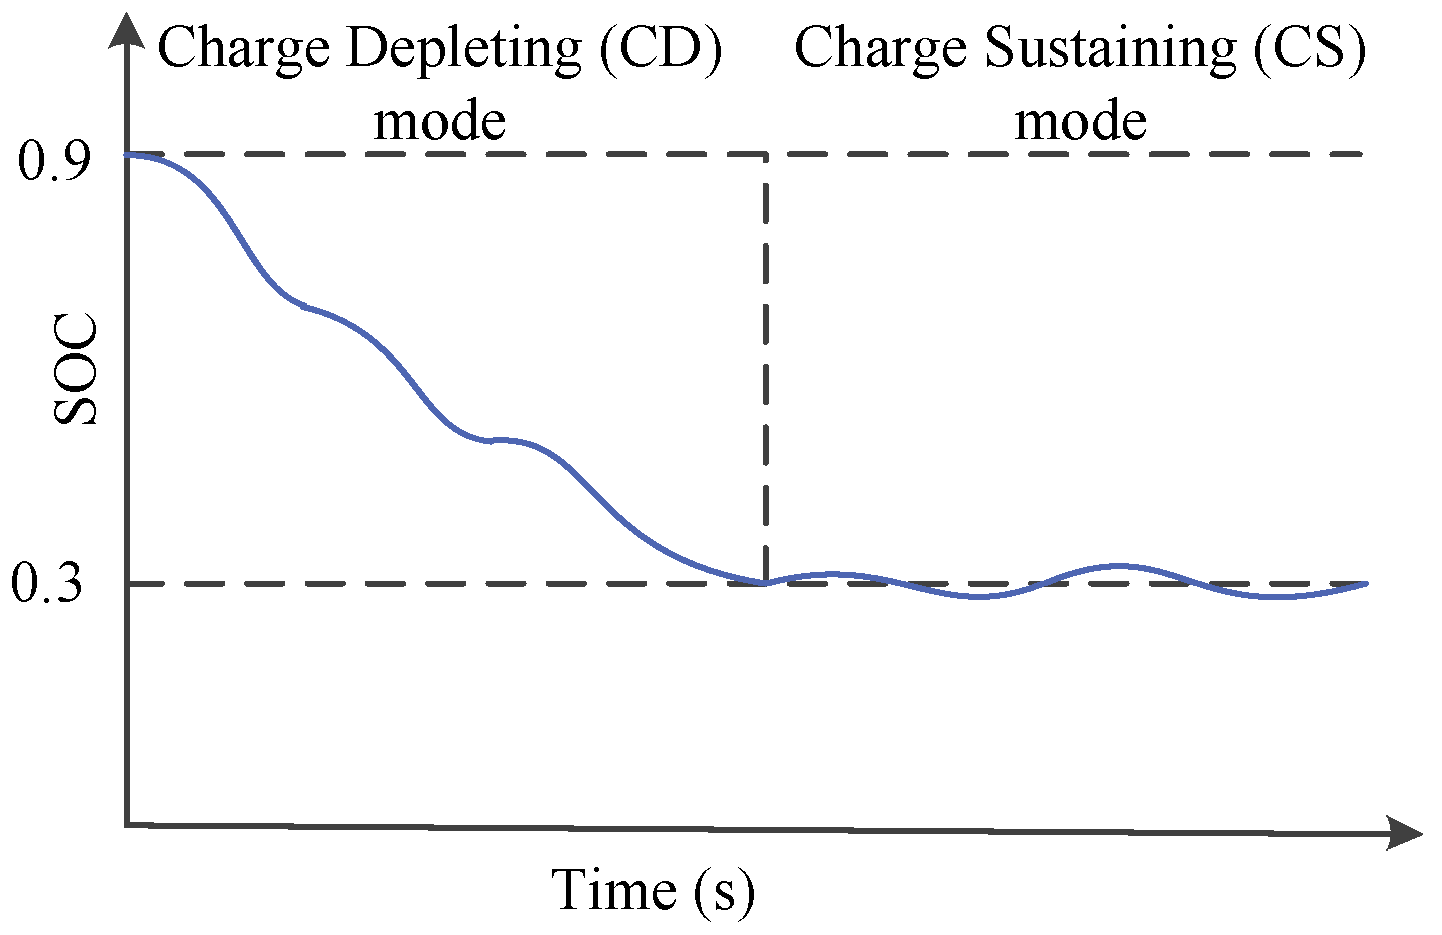
Figure 2.
The powertrain configuration of the PHEV.

Figure 3.
The mode-switching schedule in the CD mode.

Figure 4.
The mode-switching schedule in the CS mode.

Figure 5.
Road grade estimation using GPS/GIS.
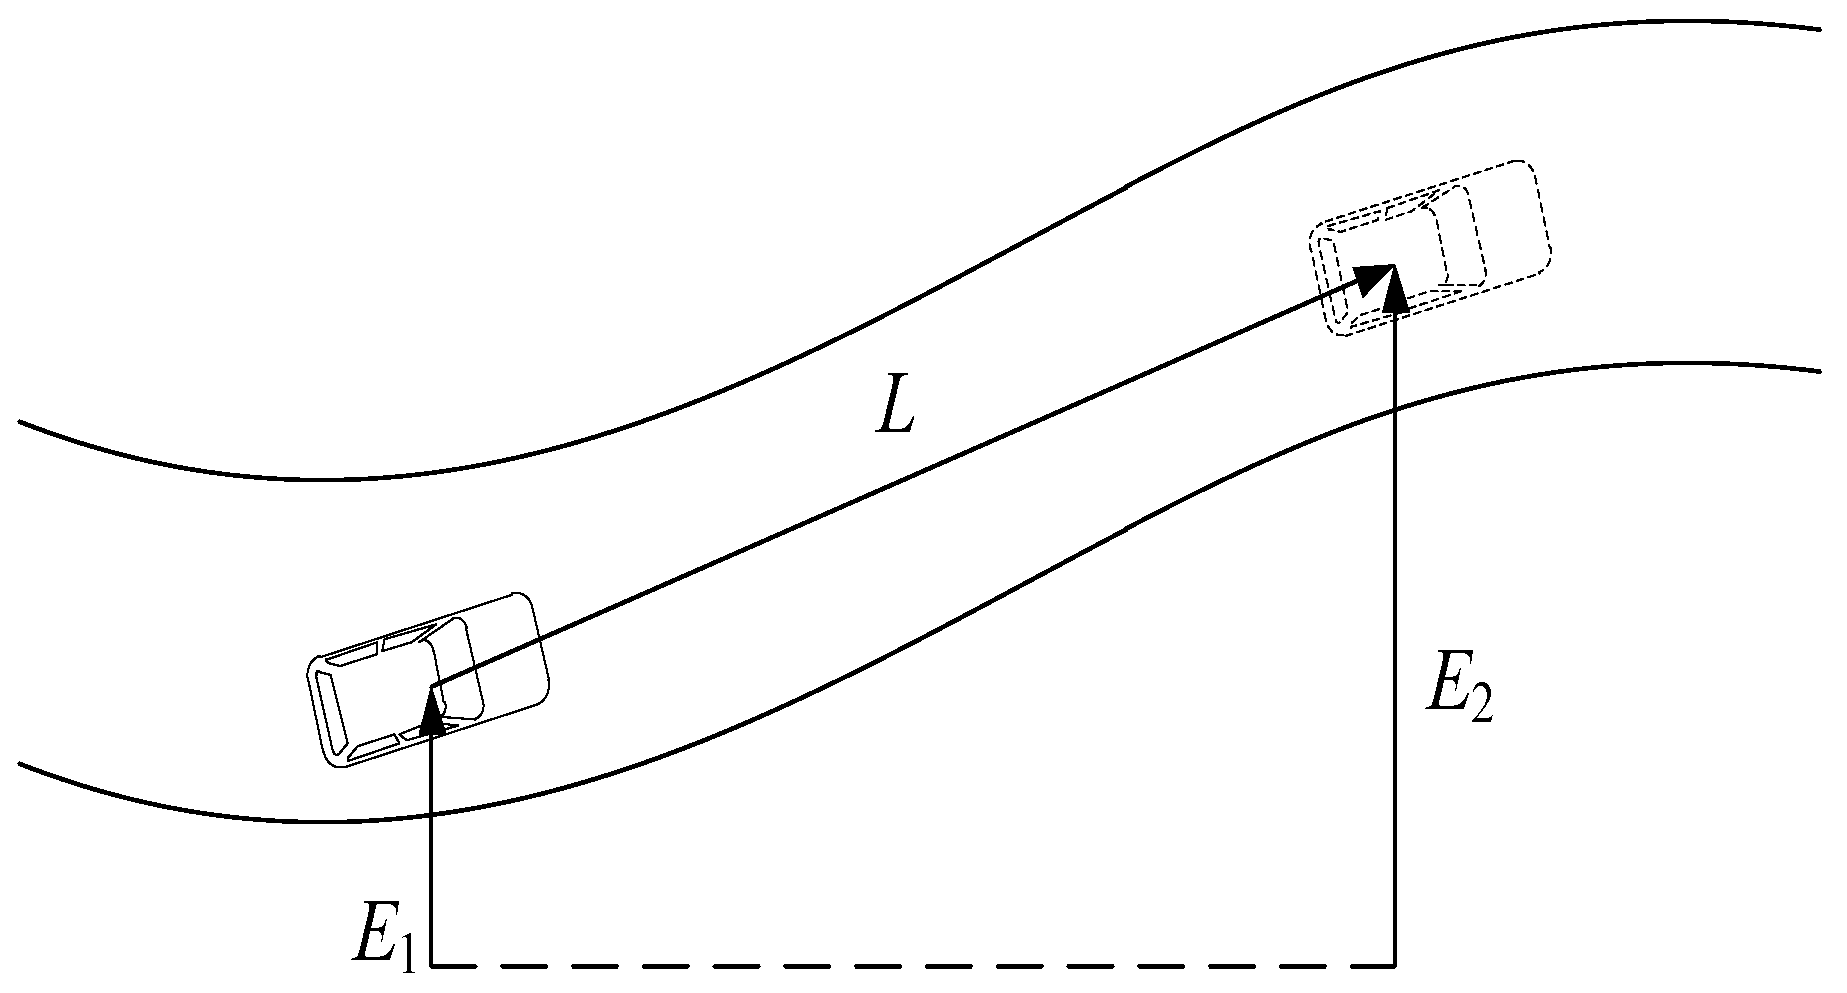
Figure 6.
An example of the velocity profile in the spatial domain.

Figure 7.
Filtering procedure for the velocity profile.
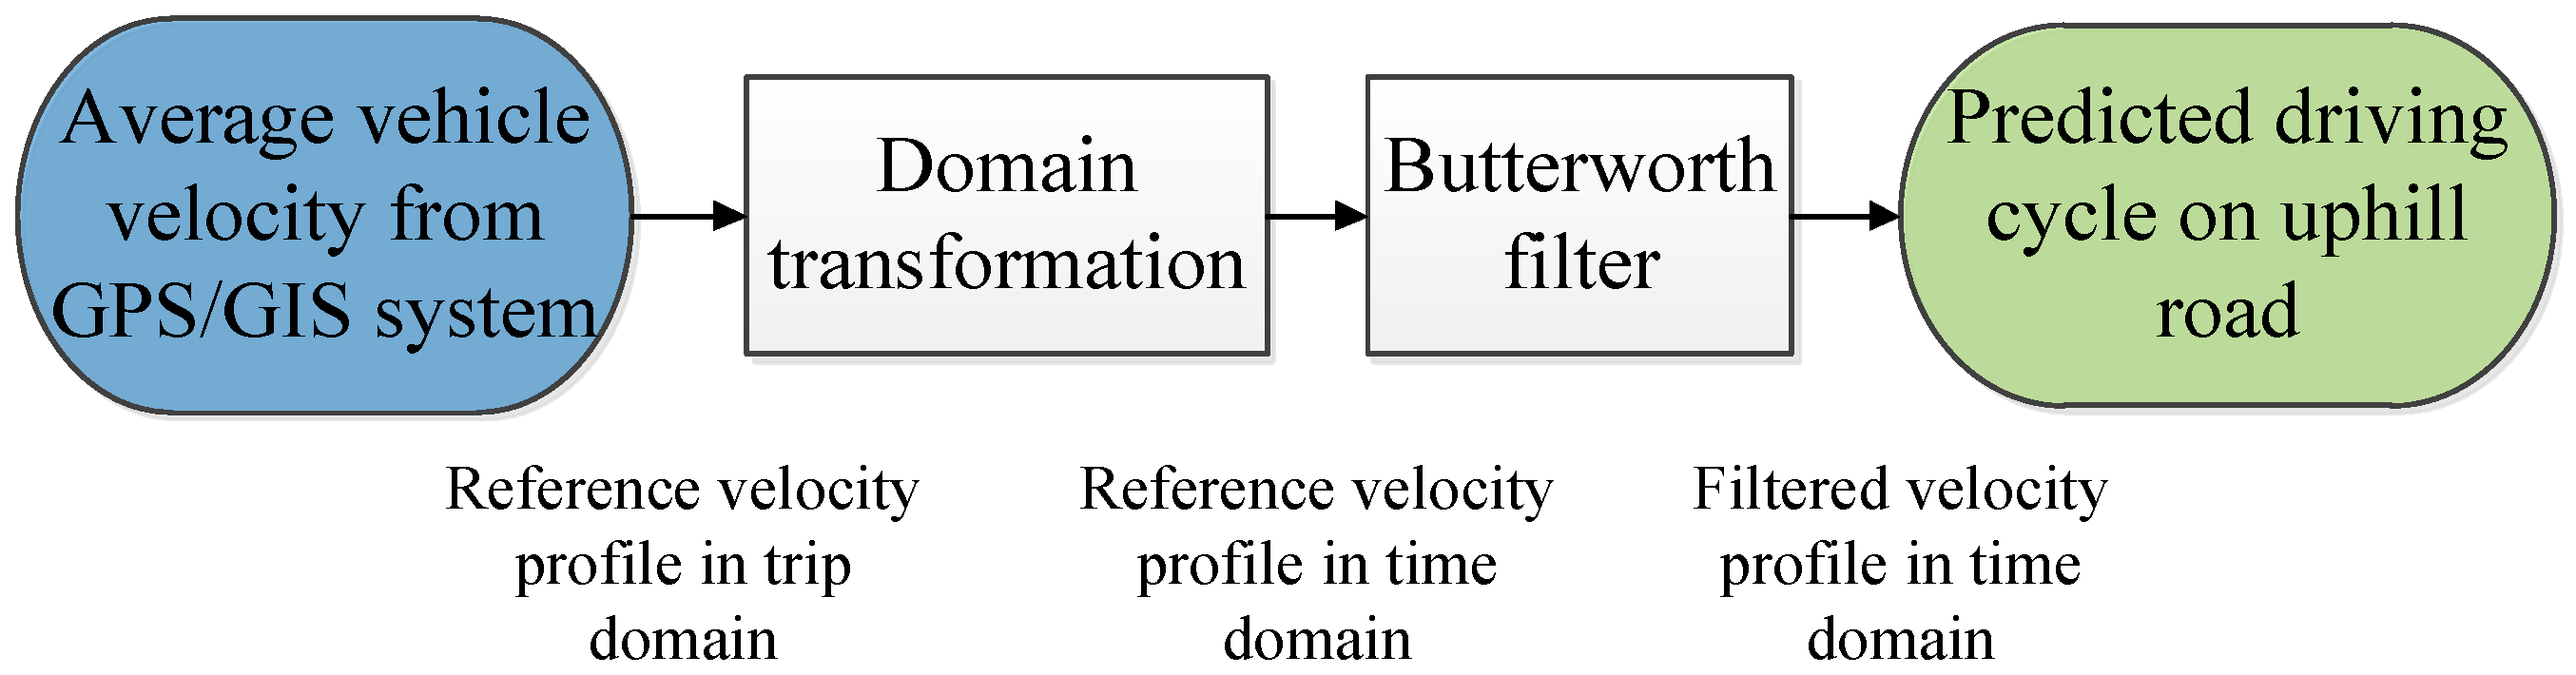
Figure 8.
An example of the prediction for the driving cycle.

Figure 9.
Structure of PHEV powertrain system model.
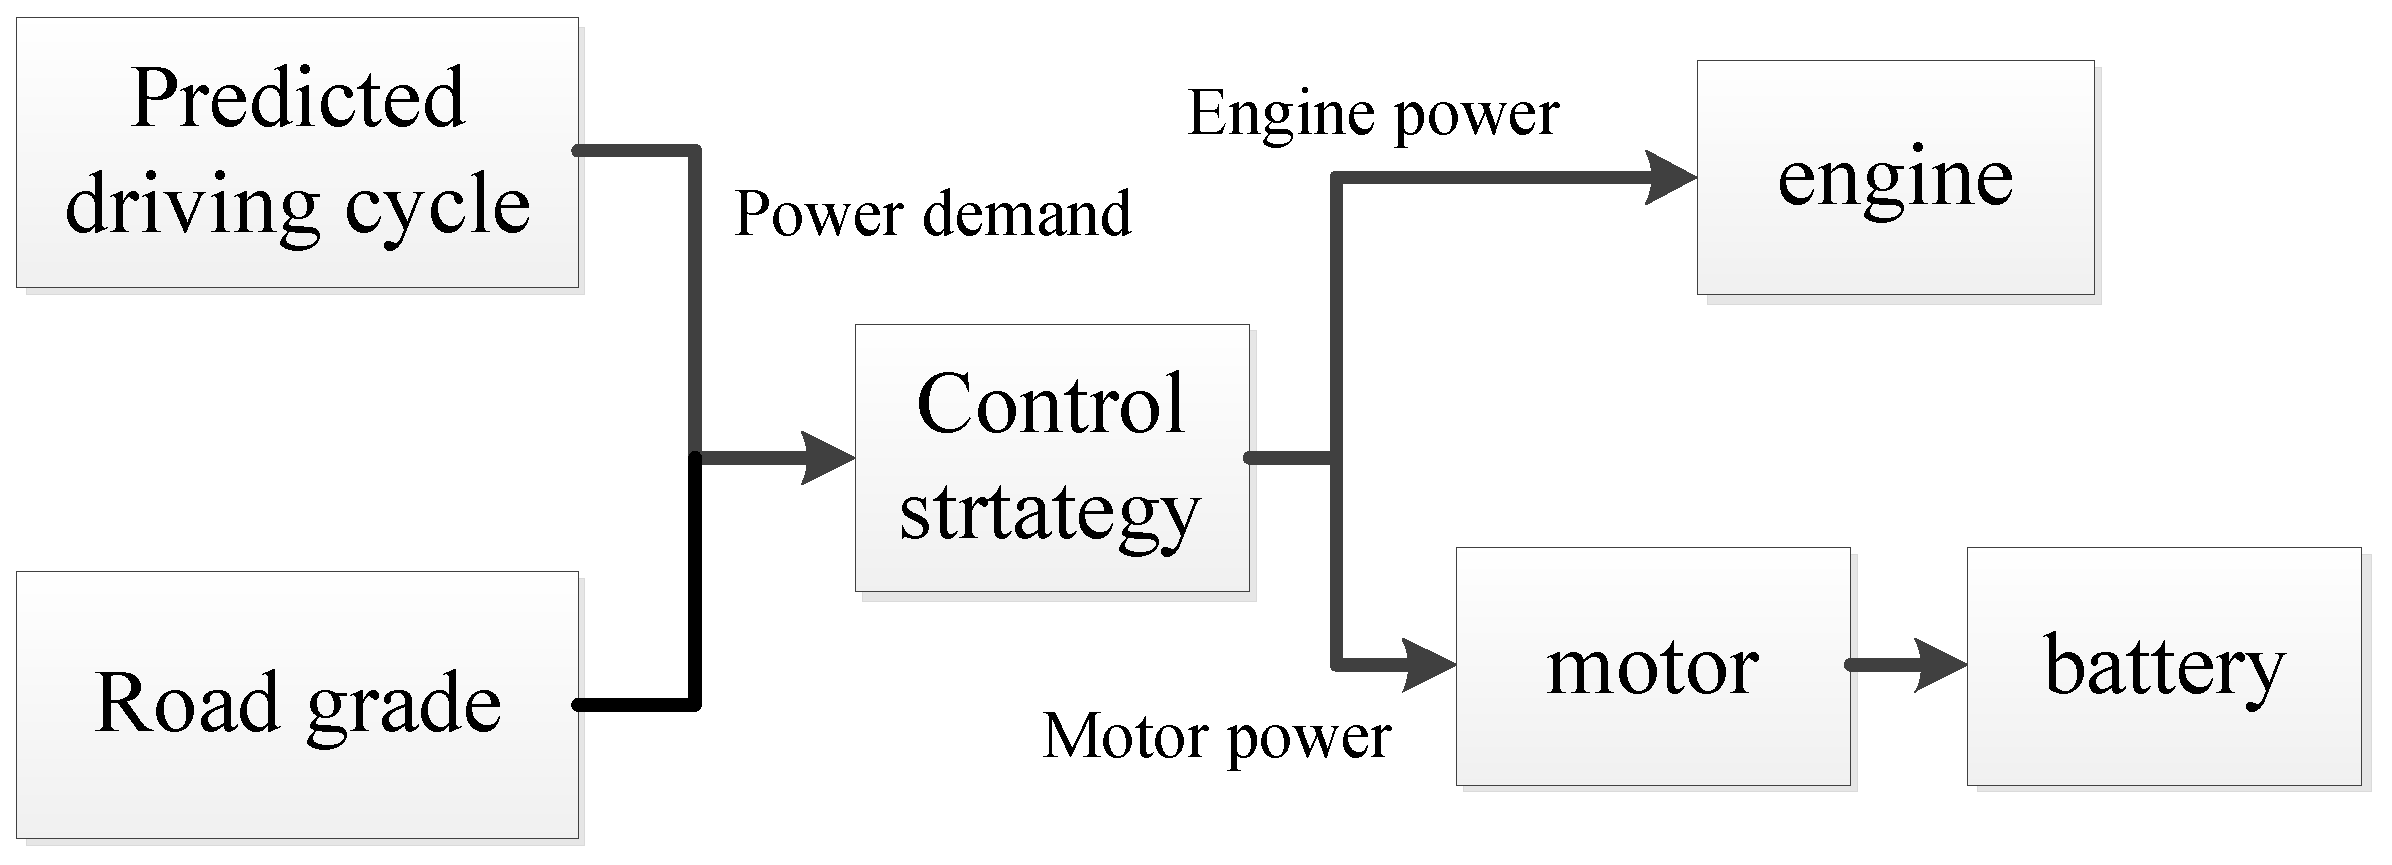
Figure 10.
Control diagram for the proposed control strategy.
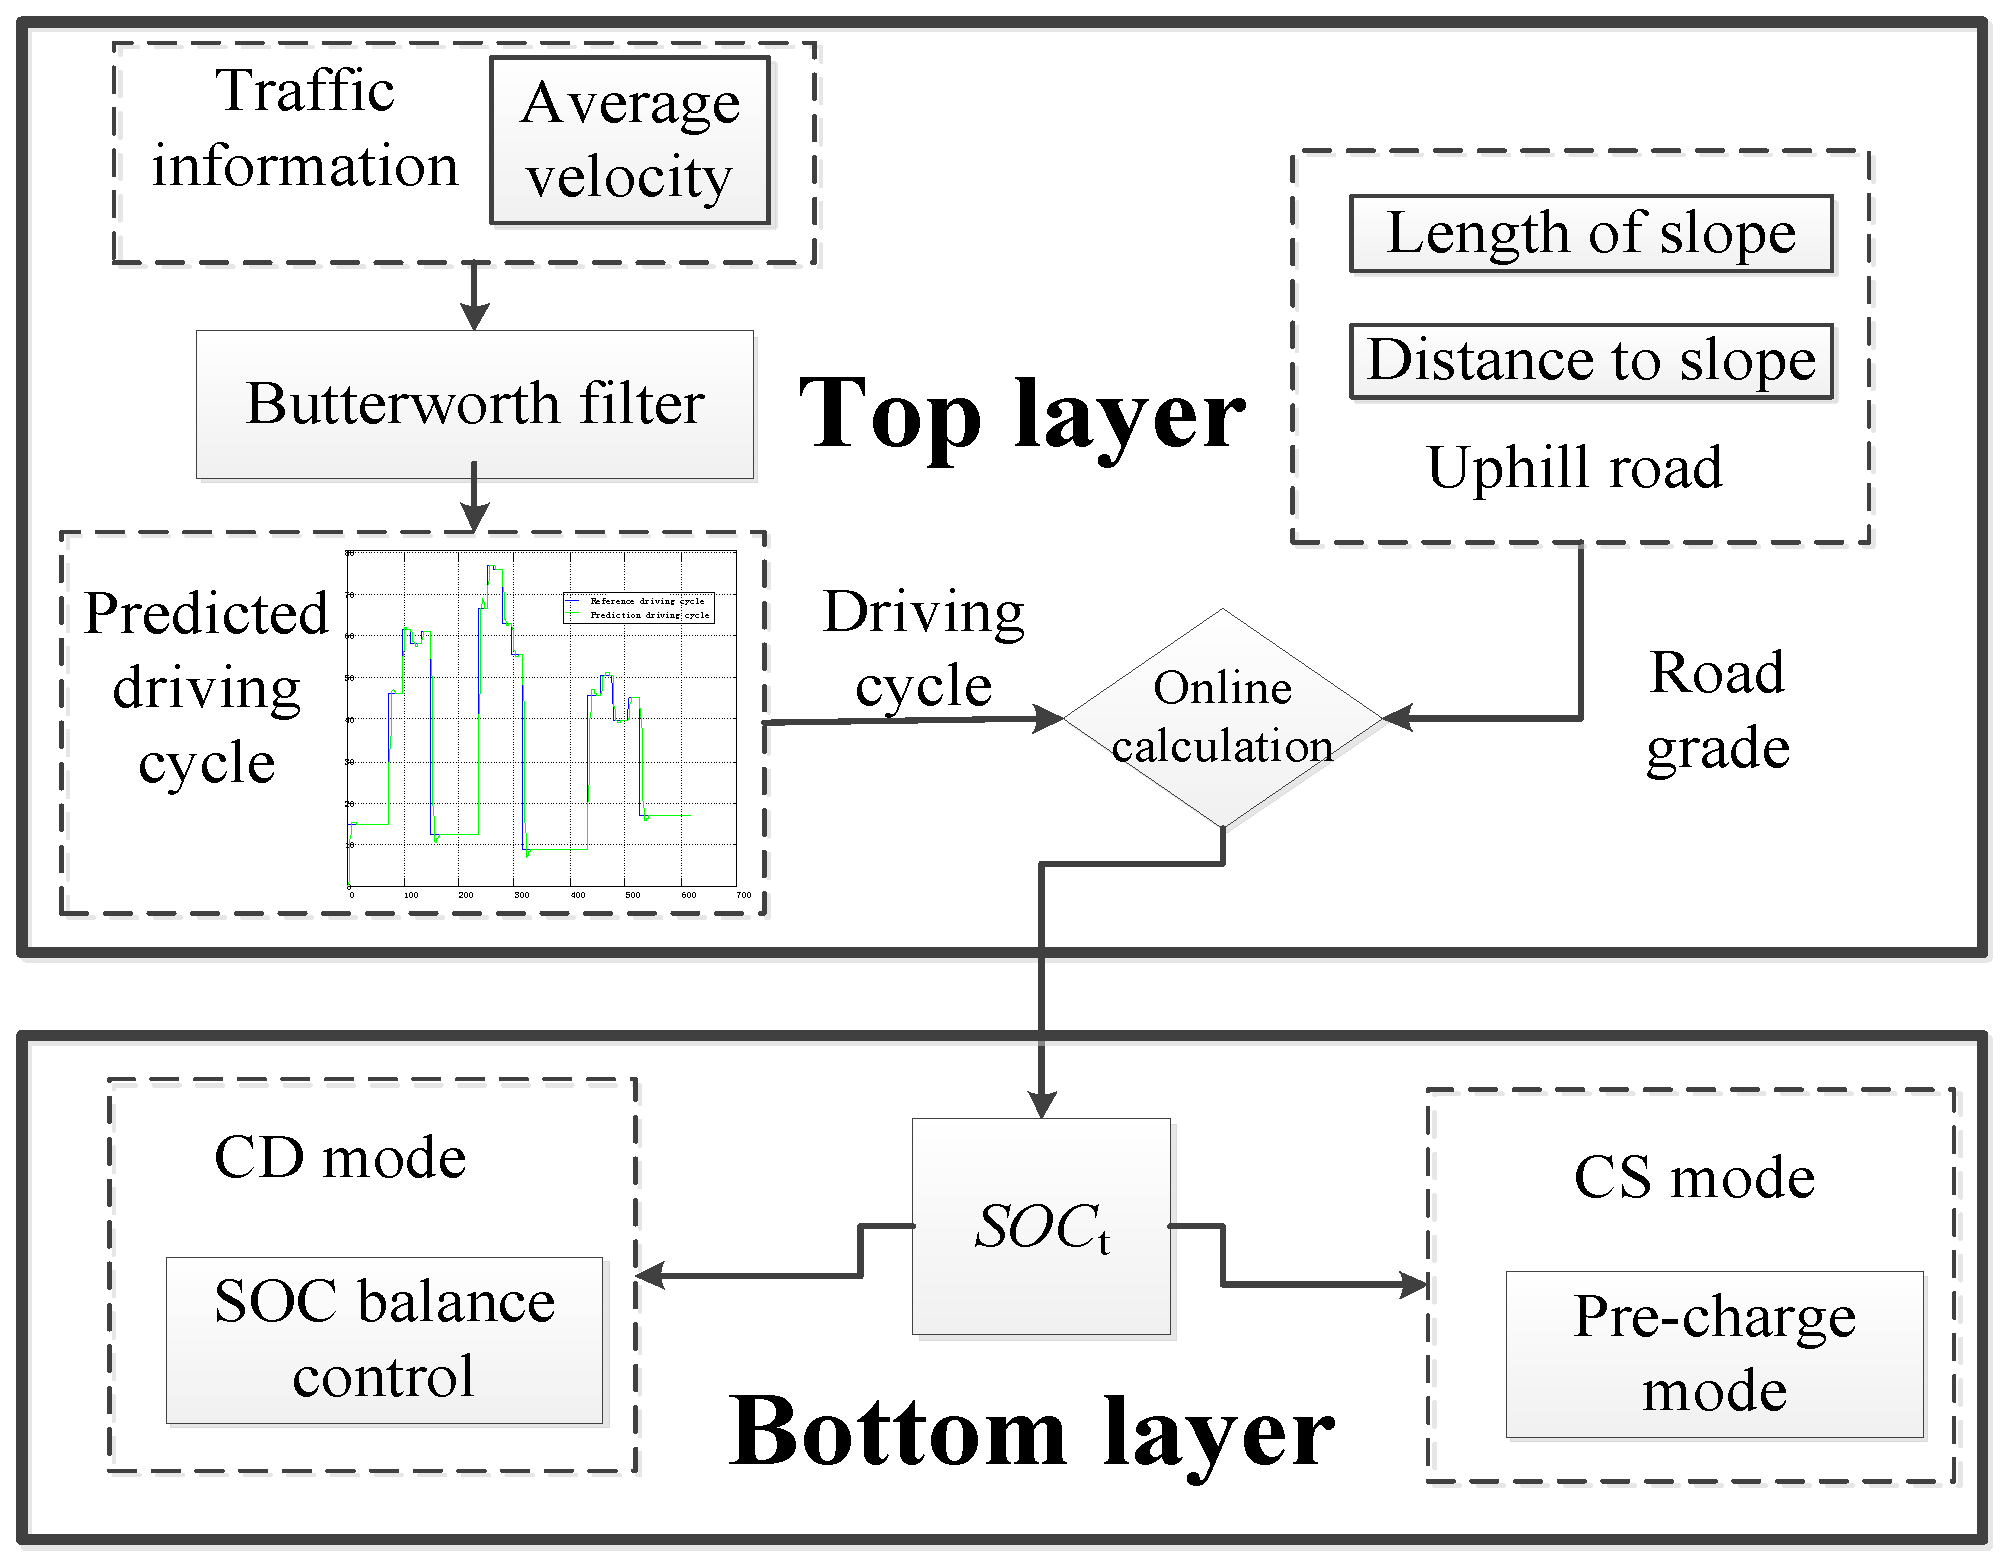
Figure 11.
Diagram of the battery SOC trajectory in CD mode.

Figure 12.
Optimization result under the driving cycle LA92. (a) Best fitness of optimization under the driving cycle LA92; (b) Best individual of optimization under the driving cycle LA92.
Figure 12.
Optimization result under the driving cycle LA92. (a) Best fitness of optimization under the driving cycle LA92; (b) Best individual of optimization under the driving cycle LA92.

Figure 13.
The trajectory of the SOC under the driving cycle LA92.

Figure 14.
Diagram of the battery SOC trajectory in CD mode.

Figure 15.
ISG motor efficiency map.
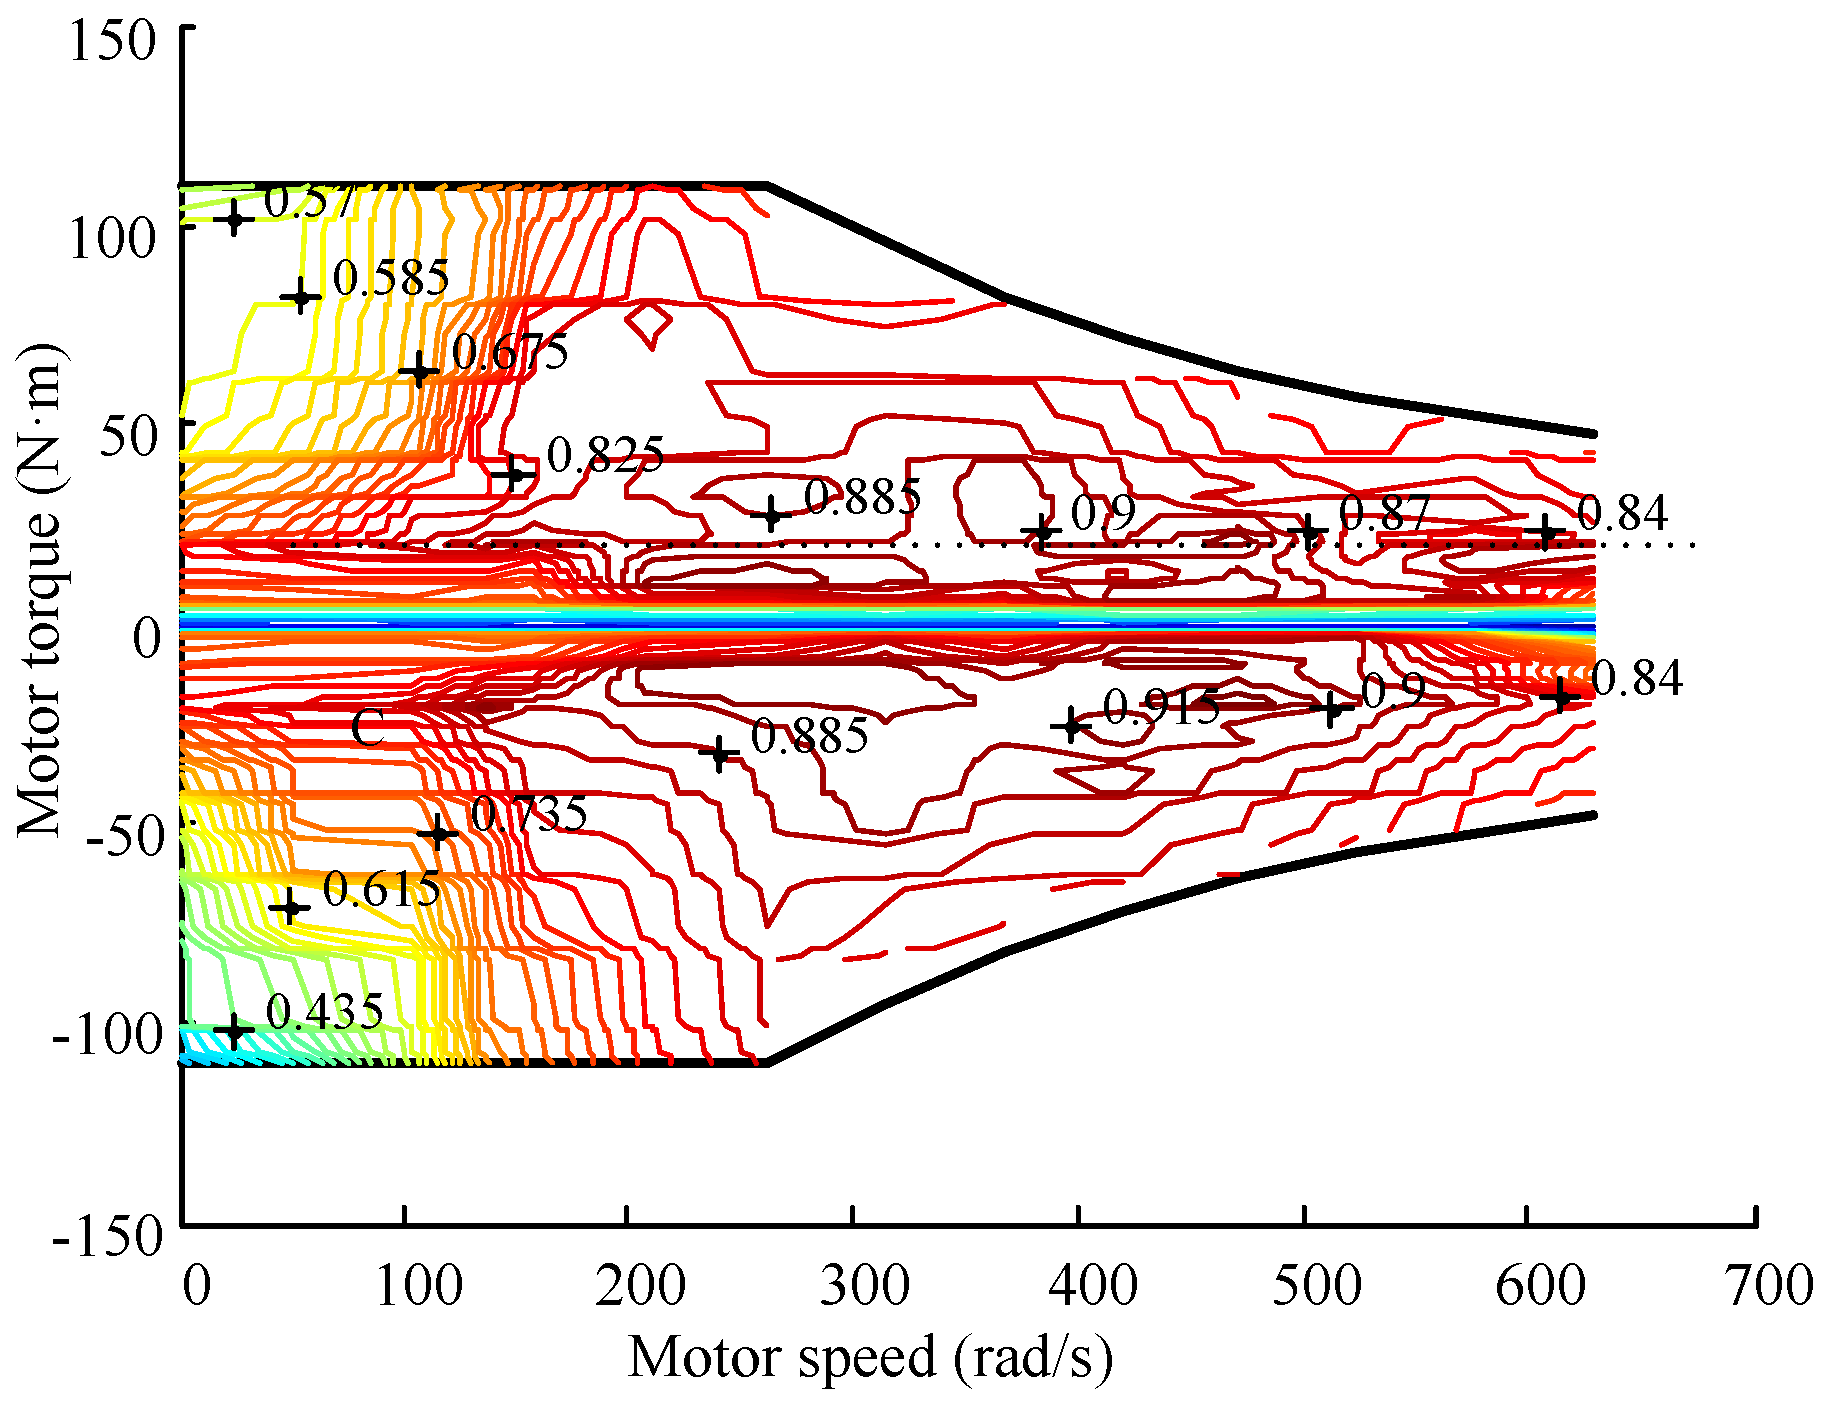
Figure 16.
Power battery efficiency model. (a) Charging efficiency model of battery; (b) Discharging efficiency model of battery.
Figure 16.
Power battery efficiency model. (a) Charging efficiency model of battery; (b) Discharging efficiency model of battery.

Figure 17.
Test driving cycle for the CD mode.

Figure 18.
Simulation results in the CD mode. (a) Fuel consumption under the test driving cycle; (b) SOC trajectories under the test driving cycle; (c) Electricity consumption under the test driving cycle.
Figure 18.
Simulation results in the CD mode. (a) Fuel consumption under the test driving cycle; (b) SOC trajectories under the test driving cycle; (c) Electricity consumption under the test driving cycle.
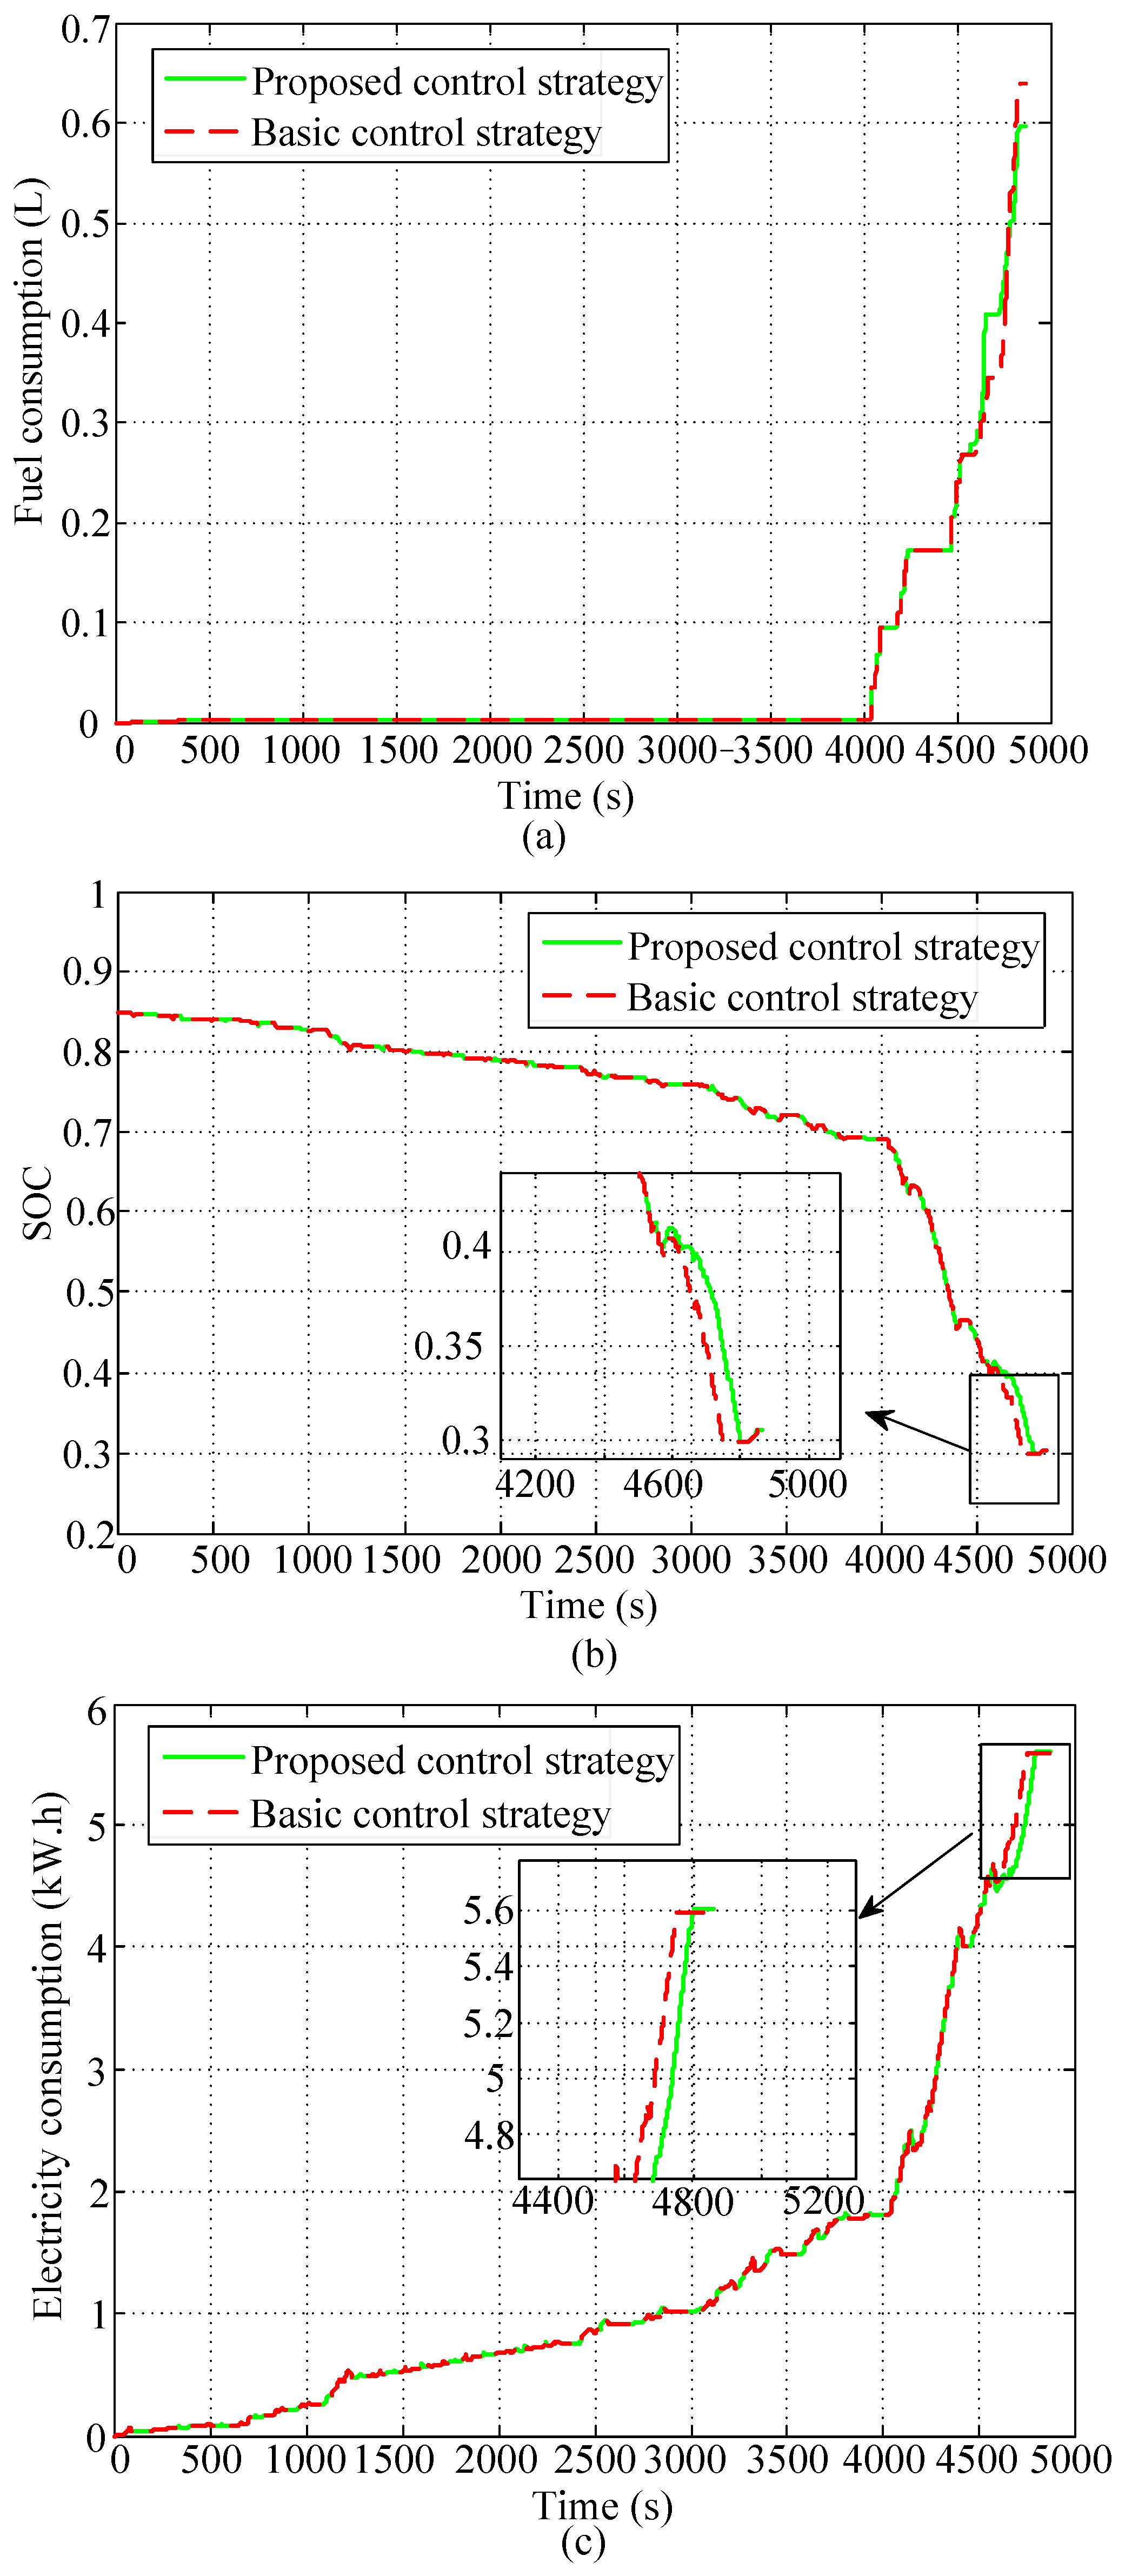
Figure 19.
Test driving cycle for CS mode.

Figure 20.
Simulation results in CS mode. (a) Fuel consumption under the test driving cycle; (b) Fuel consumption during the uphill terrain; (c) SOC trajectories under the test driving cycle; (d) Electricity consumption under the test driving cycle.
Figure 20.
Simulation results in CS mode. (a) Fuel consumption under the test driving cycle; (b) Fuel consumption during the uphill terrain; (c) SOC trajectories under the test driving cycle; (d) Electricity consumption under the test driving cycle.
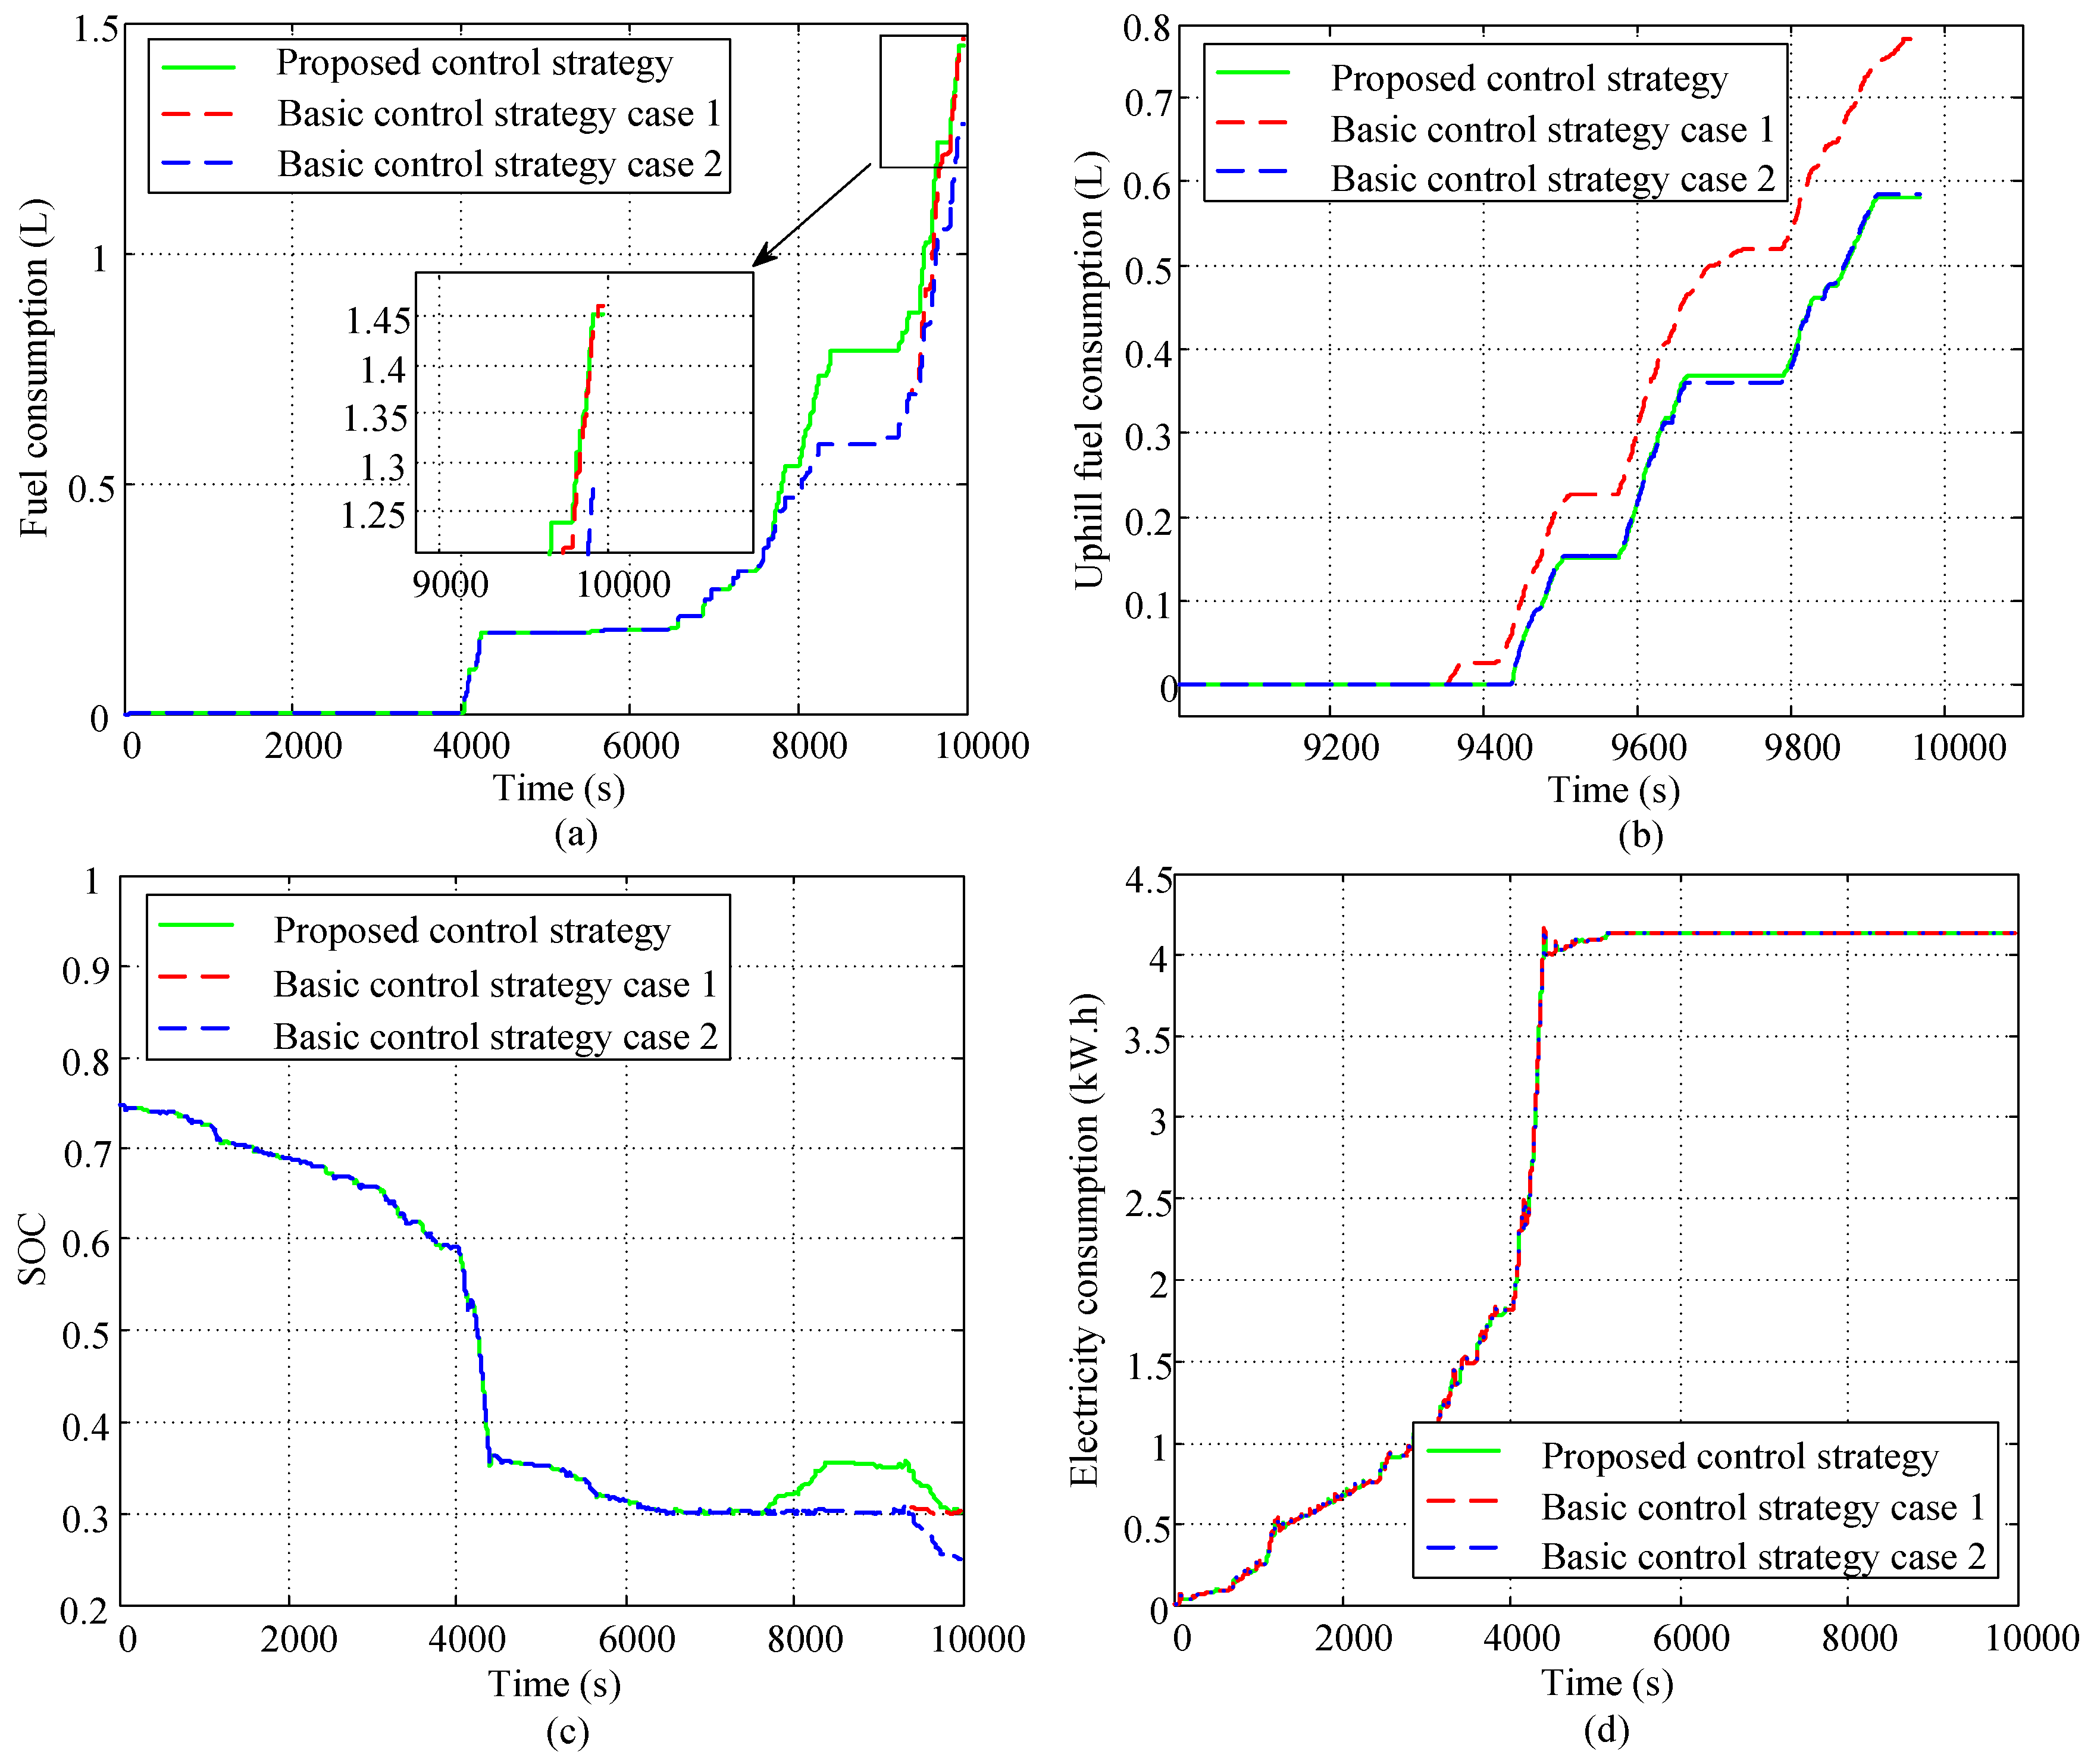
Figure 21.
Engine operating points during uphill terrain. (a) Engine working point for the proposed control strategy; (b) Engine working point for the basic control strategy.
Figure 21.
Engine operating points during uphill terrain. (a) Engine working point for the proposed control strategy; (b) Engine working point for the basic control strategy.

Table 1.
Basic parameters of the PHEV.
| Description | Parameters | Value |
|---|---|---|
| Basic parameters of the vehicle | vehicle mass/kg | 1325 |
| frontal area/m2 | 2.275 | |
| drag coefficient | 0.3146 | |
| rolling radius/m | 0.308 | |
| rolling resistance coefficient | 0.00995 | |
| ISG | peak power/kW | 30 |
| maximum torque/N·m | 115 | |
| Engine | peak power/kW | 80 |
| maximum torque/N·m | 140 | |
| NI-H power battery | capacity/A·h | 38.5 |
| rated voltage/V | 288 | |
| initial SOC | 0.85 | |
| minimum SOC | 0.3 | |
| DCT | speed ratio | 3.917/2.429/1.436 |
| 1.021/0.848/0.667 | ||
| efficiency | 0.95 |
Table 2.
Driving mileage per SOC (km·%−1) in CD mode.
| Driving Cycle | ECE | NYCC | NEDC | UDDS | LA92 | HWFET | US06HWY |
|---|---|---|---|---|---|---|---|
| a | 1.401 | 1.222 | 0.786 | 0.783 | 0.592 | 0.599 | 0.525 |
Table 3.
Range of the design variables.
| Design Variable | Initial Value | Range |
|---|---|---|
| Ke | 0 | 0~0.1 |
| K2 | 1 | 0.6~1 |
| K3 | 1 | 0.6~1 |
| K4 | 1 | 0.6~1 |
| Kc | 0 | 0~0.1 |
Table 4.
Optimization results of design variables.
| Driving Cycle | Ke | K2 | K3 | K4 | Kc |
|---|---|---|---|---|---|
| ECE | 0.078 | 0.774 | 0.808 | 1 | 0.012 |
| NYCC | 0.005 | 0.846 | 0.993 | 0.889 | 0.000 |
| NEDC | 0.000 | 0.718 | 0.643 | 0.610 | 0.058 |
| UDDS | 0.063 | 0.948 | 0.972 | 0.845 | 0.054 |
| LA92 | 0.060 | 0.998 | 0.931 | 0.886 | 0.001 |
| HWFET | 0.001 | 0.654 | 0.663 | 0.628 | 0.048 |
| US06HWY | 0.077 | 0.794 | 0.991 | 0.962 | 0.003 |
Table 5.
Driving mileage per SOC (km·%−1) in the pre-charge mode.
| Driving Cycle | ECE | NYCC | NEDC | UDDS | LA92 | HWFET | US06HWY |
|---|---|---|---|---|---|---|---|
| b | 0.157 | 0.330 | 0.443 | 0.641 | 0.783 | 1.636 | 8.026 |
Table 6.
Comparing results for the CD mode.
| Result | Basic Strategy | Proposed Strategy | Savings (%) |
|---|---|---|---|
| Fuel consumption (L) | 0.640 | 0.596 | 6.878 |
| Electricity consumption (kw·h) | 5.591 | 5.693 | −1.789 |
| Initial SOC for uphill | 0.322 | 0.391 | - |
| Final SOC for uphill | 0.303 | 0.304 | - |
| Cost of energy consumption (RMB) | 7.897 | 7.605 | 3.688 |
Table 7.
Comparing results for CS mode.
| Result | Proposed Strategy | Basic Strategy | Savings (%) | ||
|---|---|---|---|---|---|
| Case 1 | Case 2 (Corrected) | Case 1 | Case 2 (Corrected) | ||
| Fuel consumption (L) | 1.453 | 1.462 | 1.494 | 0.616% | 2.744% |
| Fuel consumption for uphill (L) | 0.582 | 0.770 | 0.585 | 24.431% | 0.547% |
| Electricity consumption (kw·h) | 4.135 | 4.135 | 4.135 | 0 | 0 |
| Initial SOC for uphill | 0.355 | 0.308 | 0.308 | - | - |
| Final SOC for uphill | 0.301 | 0.303 | 0.251 | - | - |
© 2017 by the authors. Licensee MDPI, Basel, Switzerland. This article is an open access article distributed under the terms and conditions of the Creative Commons Attribution (CC BY) license (http://creativecommons.org/licenses/by/4.0/).
Share and Cite
MDPI and ACS Style
Liu, Y.; Li, J.; Ye, M.; Qin, D.; Zhang, Y.; Lei, Z. Optimal Energy Management Strategy for a Plug-in Hybrid Electric Vehicle Based on Road Grade Information. Energies 2017, 10, 412. https://doi.org/10.3390/en10040412
AMA Style
Liu Y, Li J, Ye M, Qin D, Zhang Y, Lei Z. Optimal Energy Management Strategy for a Plug-in Hybrid Electric Vehicle Based on Road Grade Information. Energies. 2017; 10(4):412. https://doi.org/10.3390/en10040412
Chicago/Turabian StyleLiu, Yonggang, Jie Li, Ming Ye, Datong Qin, Yi Zhang, and Zhenzhen Lei. 2017. "Optimal Energy Management Strategy for a Plug-in Hybrid Electric Vehicle Based on Road Grade Information" Energies 10, no. 4: 412. https://doi.org/10.3390/en10040412
Note that from the first issue of 2016, this journal uses article numbers instead of page numbers. See further details here.