Article

A New Method to Monitor the Primary Neutral Integrity in Multi-Grounded Neutral Systems

1
School of Electrical Engineering, Shandong University, Jinan 250061, China
2
Key Laboratory of Power System Intelligent Dispatch and Control Ministry of Education, Shandong University, Jinan 20061, China
3
FortisAlberta, Calgary T3K6E8, AB, Canada
*
Author to whom correspondence should be addressed.
Energies 2017, 10(3), 380; https://doi.org/10.3390/en10030380
Submission received: 14 December 2016 / Revised: 26 February 2017 / Accepted: 13 March 2017 / Published: 16 March 2017
(This article belongs to the Special Issue Power Electronics and Power Quality)

Abstract

:
In the three-phase four-wire system, there are usually multiple grounding points in the primary neutral line due to safety and economic considerations. The rising “neutral to earth voltage (NEV)” caused by a broken primary neutral can threaten the safety of nearby facilities and humans; therefore, the integrity of the primary neutral conductor is of vital importance for the multi-grounded neutral (MGN) system. In this paper, a new passive method is proposed to monitor the integrity of the primary neutral line in the MGN system. The method is based on the measured voltage and current data at the service transformer, and there is no need to install any signal generators. Therefore, it causes no disturbance to the utility and customer. In the paper, the equivalent analysis circuit is established and a new parameter is proposed to reflect the neutral condition. The value of the parameter is estimated based on the measured data, and then, the equivalent impedance of the primary neutral groundings can be obtained. On the other hand, the impedance value for the primary neutral under normal operating conditions can be estimated based on the derived analytical formulas. By comparing the monitored primary neutral impedance with its normal value, the broken neutral condition in the primary system can be detected. Different primary neutral broken cases are analyzed in the paper based on the Monte Carlo simulation. The results indicate that the integrity condition in the primary neutral can be accurately monitored by the proposed method.

1. Introduction

Nowadays, the three-phase four-wire multi-grounded neutral (MGN) system has been widely adopted in many utilities due to its lower installation costs and higher sensitivity of fault protection compared with the three-phase three-wire system [1,2]. Since the primary neutral line is grounded through multiple points, the unbalanced current in the system will flow through the neutral into the earth, which can produce neutral to earth voltage (NEV) at the customer side. Especially, when the MGN network experiences a broken neutral or loose-connected neutral, more current will be forced into the ground, resulting in a rising NEV [3,4]. The NEV is very harmful to the safety of nearby facilities and humans [5,6]. Therefore, in order to guarantee that the MGN system works safely and efficiently, it is necessary for the utility to routinely monitor the neutral integrity condition of the MGN primary system.
Due to the complicated construction of the MGN system, the detection of the primary neutral integrity is not a trivial task. There is not even an accurate model for the multiple neutral grounding systems, and the impact of the primary neutral is either merged into the phase wires or directly neglected in order to simplify the simulation of an MGN system. From 2000, a full-scale model for the MGN distribution system was introduced in [1]. However, in this method, the multiple grounding electrodes were represented by only one node. Other research about the MGN system mainly focuses on the power flow analysis or ground fault analysis [7,8,9,10,11], and the research on the broken neutral integrity monitoring is relatively little. Some researchers have proposed the method of measuring the primary neutral impedance, such as “fall of potential”-based methods [12] and “staged fault”-based methods. However, for these methods, it is difficult to find a “true” ground to measure the voltage in order to calculate the primary neutral impedance. Moreover, once the soil conditions and some other conditions are changed, the potential electrode has to be relocated [13,14,15]. In [16], an active method based on the disturbance generated by a signal generator is proposed to reflect the neutral condition. This is generally a good detection method for the primary neutral condition, but usually, the customers are reluctant to install signal generators at their homes, which is needed for the active method.
In this paper, a new passive method to monitor the primary neutral integrity is proposed. Rather than directly measuring the primary neutral impedance, it is proposed to estimate the primary neutral condition based on the measured primary and secondary neutral current at the monitored transformer. There is no need for the method to install any devices or proxy loads to generate the disturbance signal; therefore, the method causes no disturbance to the utility and customer. In the paper, a parameter is first proposed to reflect the condition of the primary neutral. The actual value of the parameter can be estimated based on the measured neutral current. Then, the equivalent impedance of the MGN system in the primary side can be calculated. The theoretical value of the equivalent impedance can be calculated based on the system parameters under normal operating conditions. By comparing the monitored primary neutral impedance with its normal value, the condition of the multi-grounding neutral in the primary system can be determined.
The remainder of the paper is organized as follows: Section 2 illustrates the proposed passive method. Section 3 introduces the data selection criteria for calculating the proposed parameter and further summarizes the flowchart of the proposed method. Section 4 verifies the validity of the proposed method by using the Monte Carlo simulation. Finally, the conclusions of the paper are given in Section 5.

2. The Proposed Primary Neutral Monitoring Method

2.1. Establishment of the Equivalent Analysis Circuit

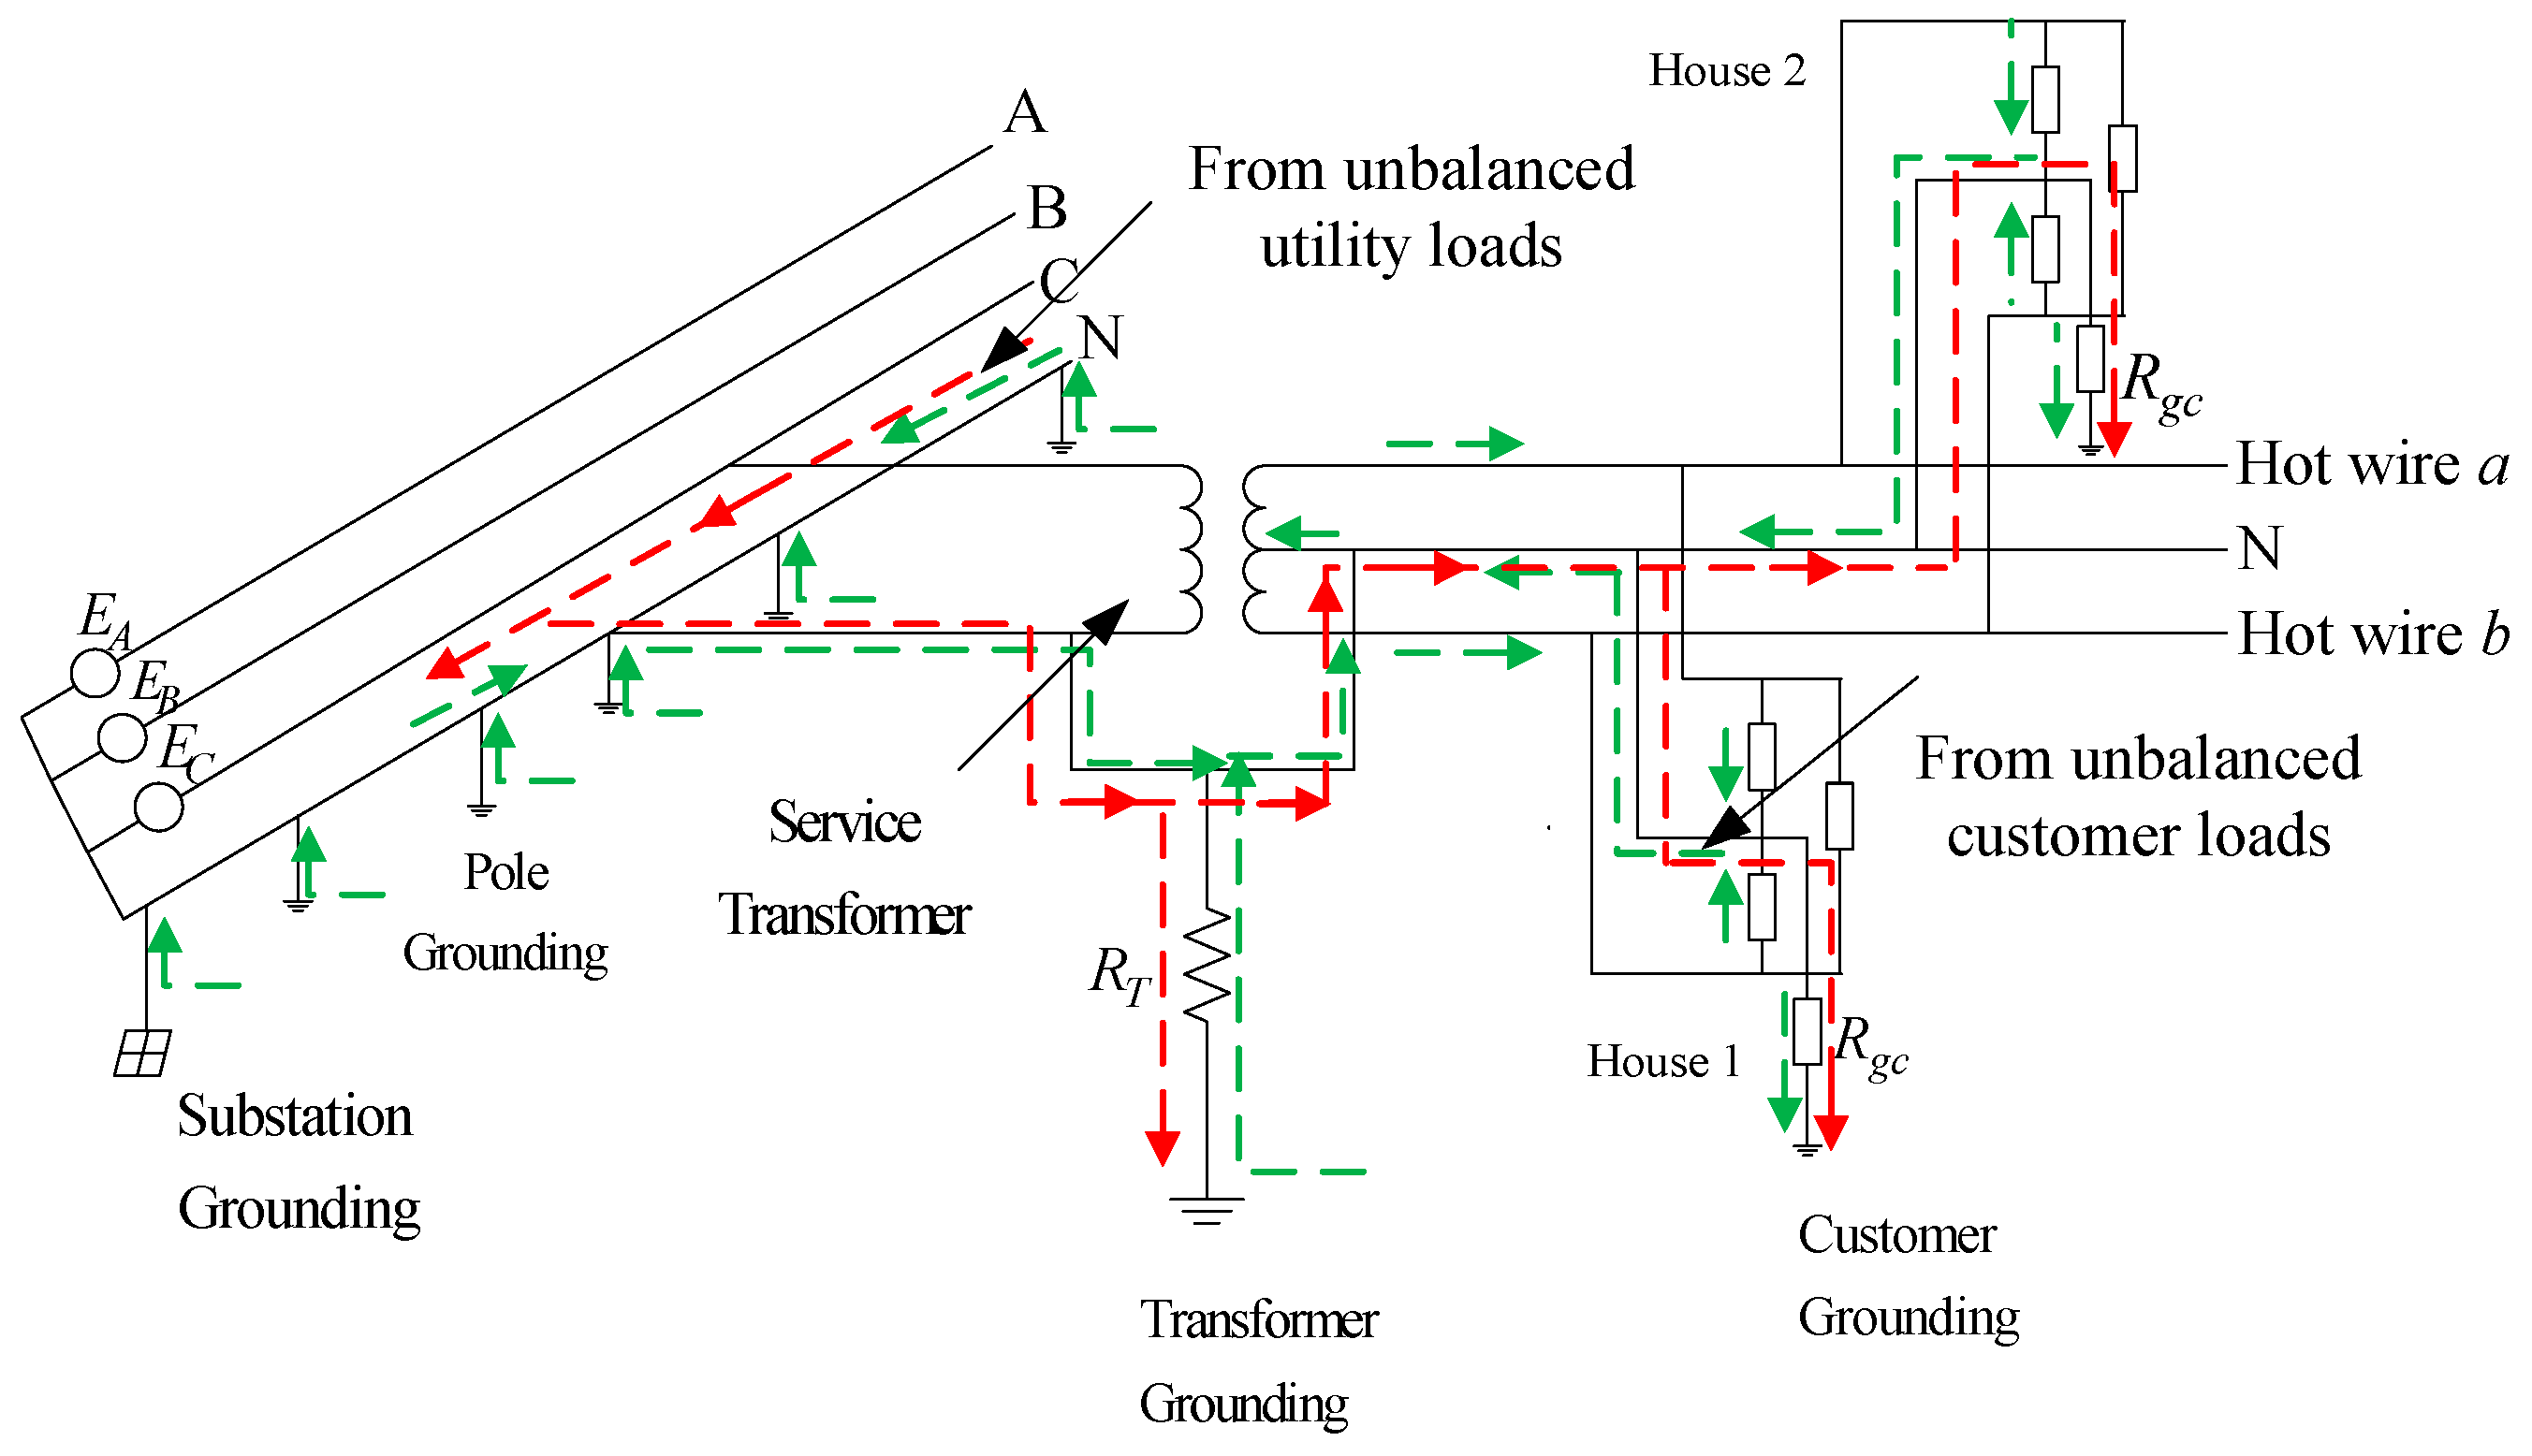
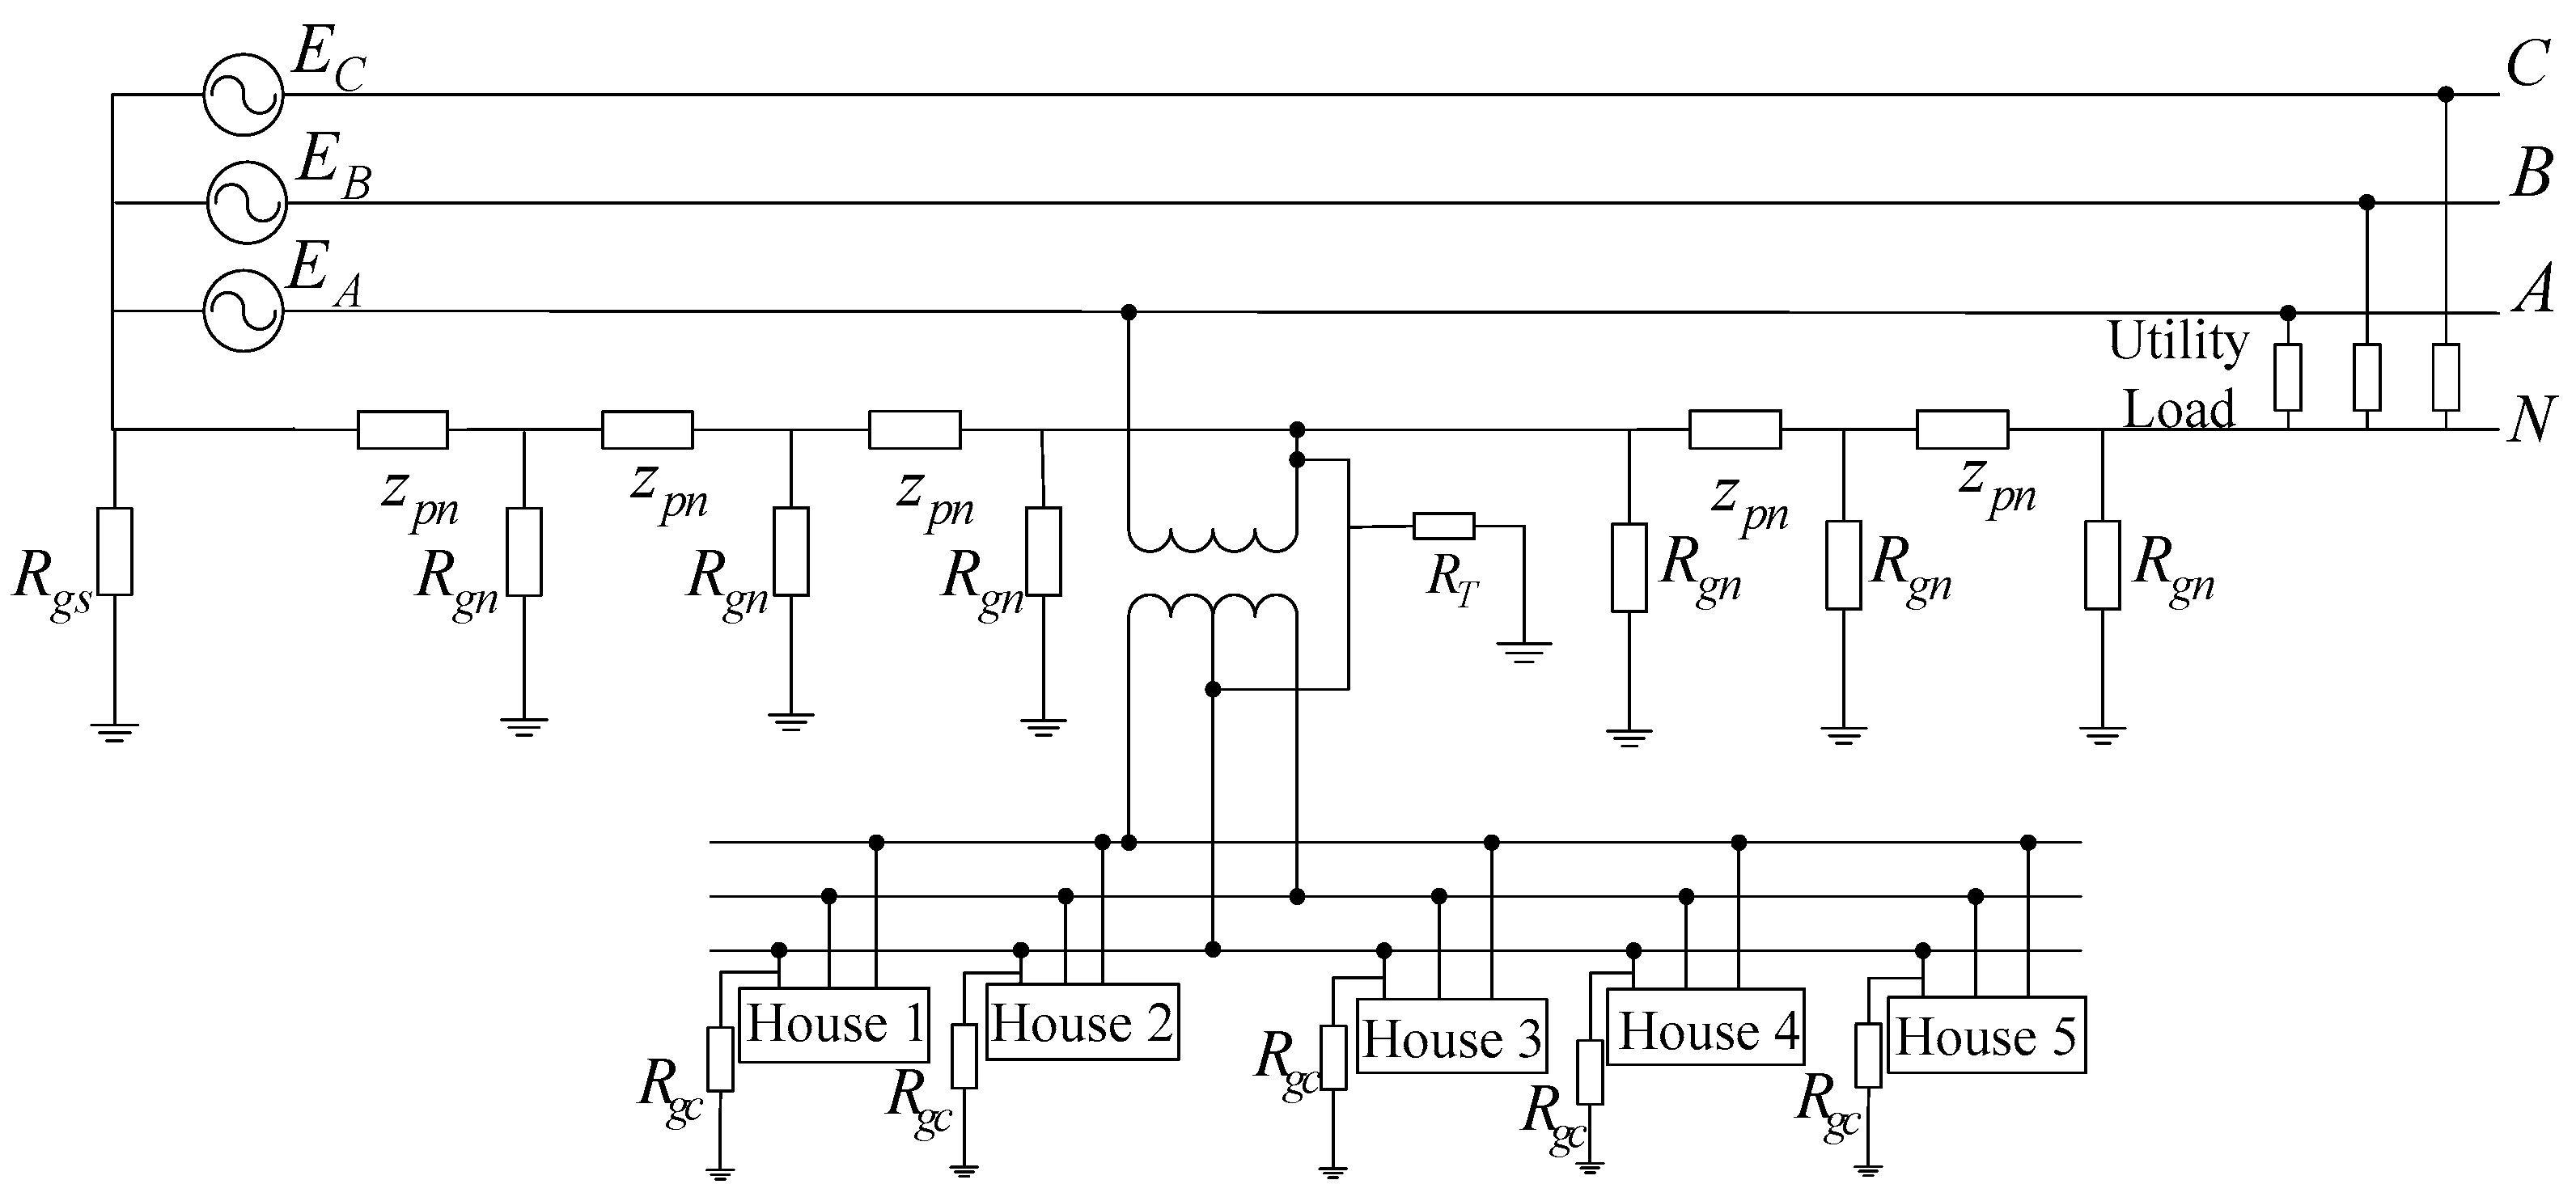
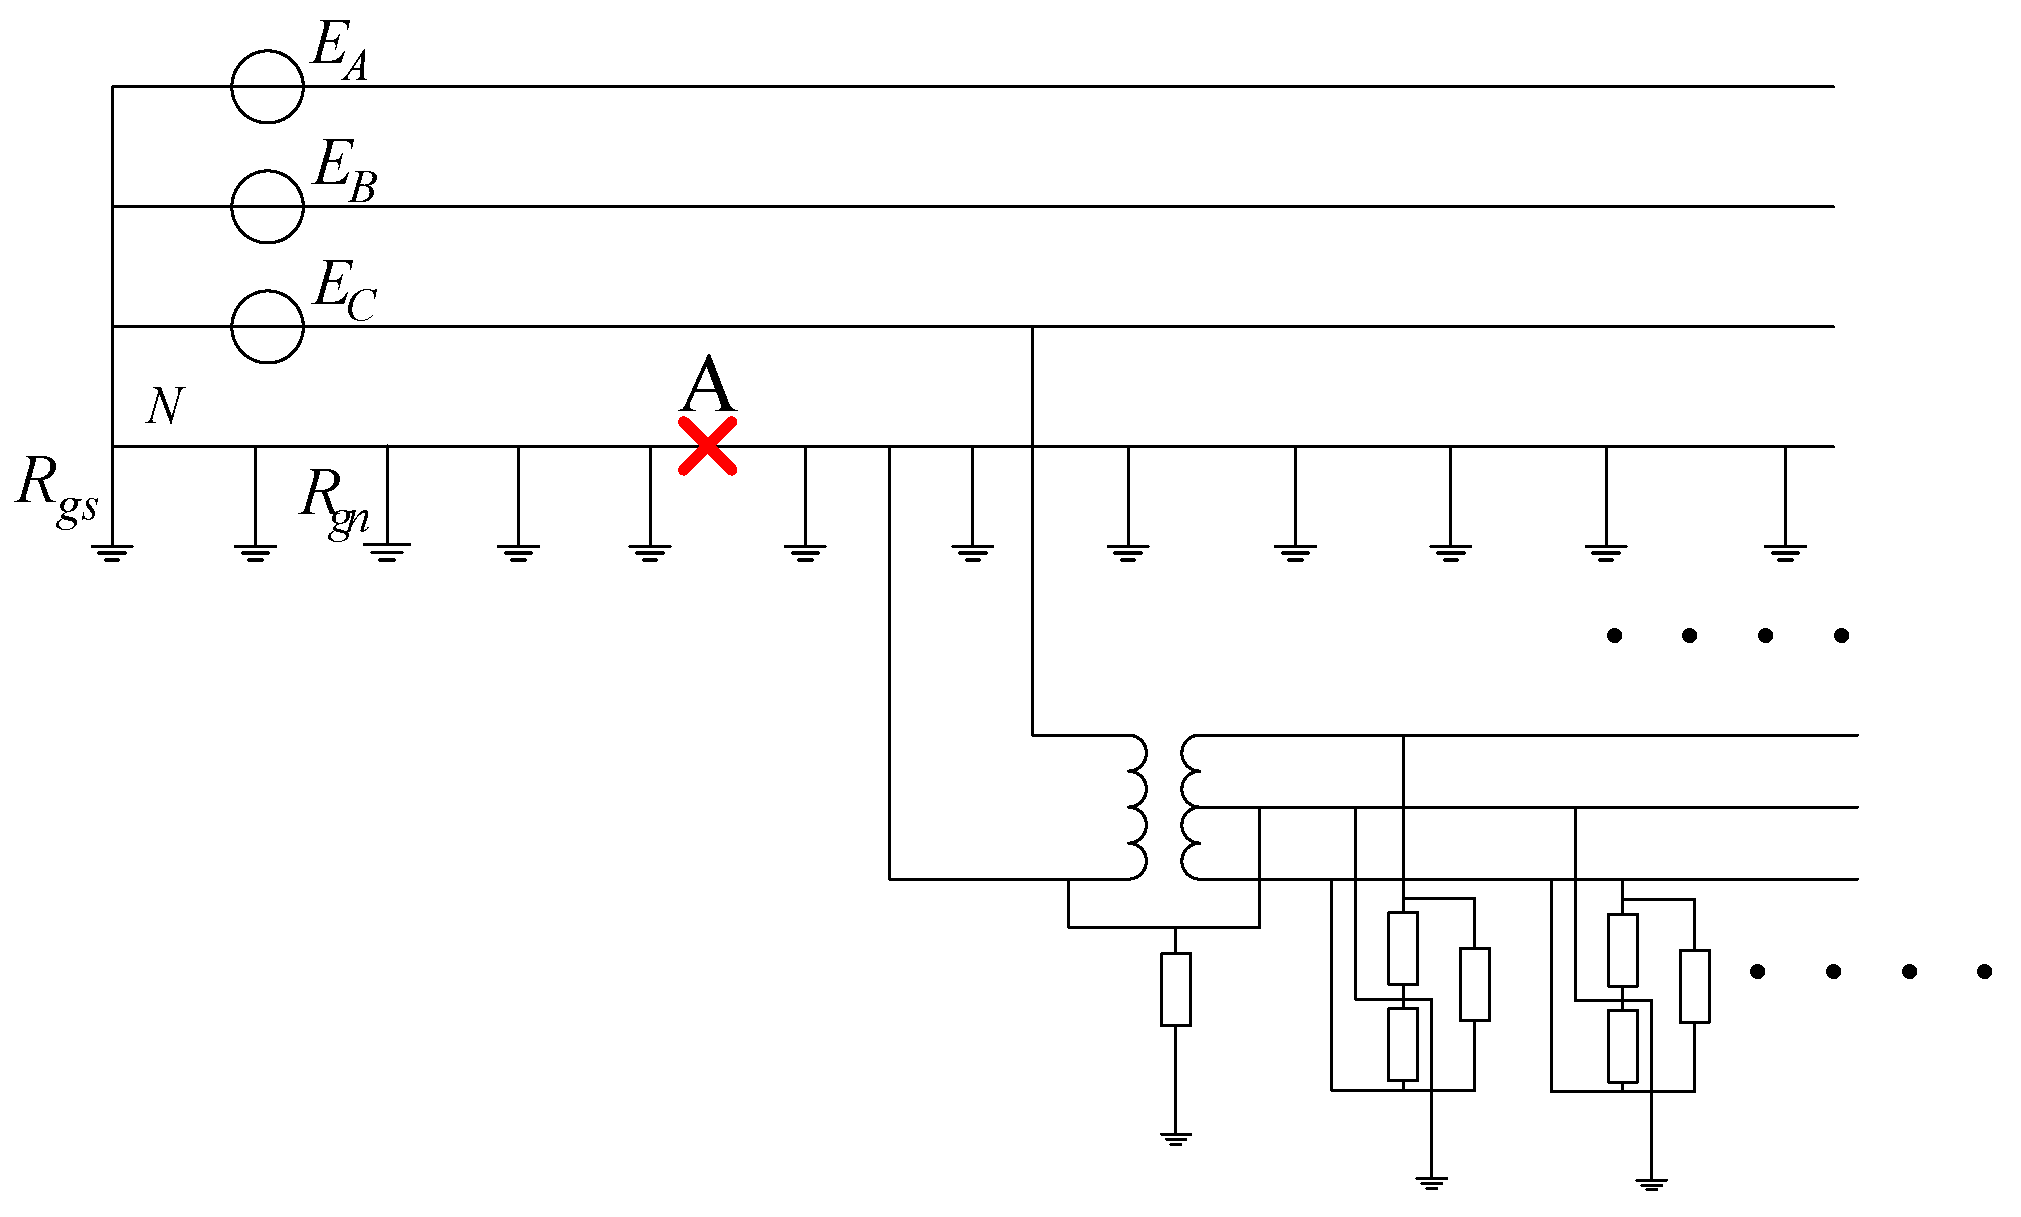
The single-line diagram of a typical three-phase four-wire system with multiple primary neutral groundings is shown in Figure 1. The neutral line in the primary system is grounded at multiple electrodes along its route. For the North American power system, there are usually at least four grounds per 1.6 km [17]. The primary neutral and secondary neutral are often tied at the service transformer grounding, as shown in Figure 1. Here, for simplification, only one phase of the distribution transformer is depicted. The loads in the transformer secondary side are represented by customer houses. Generally, one service transformer supplies dozens or hundreds of individual houses depending on the community size. At the transformer secondary side, the neutral is grounded via the grounding resistance at the service panels of the customer. In Figure 1, RT represents the transformer grounding resistance, and Rgc represents the customer grounding resistance. Under normal operating conditions, the current flowing in the neutral line of the MGN system is mainly caused from the unbalanced utility loads and customer loads, and the flow of current is shown in Figure 1. In Figure 1, the green line represents the unbalanced current caused by the unbalanced customer loads, and the red line represents the unbalanced current caused by the unbalanced utility loads.
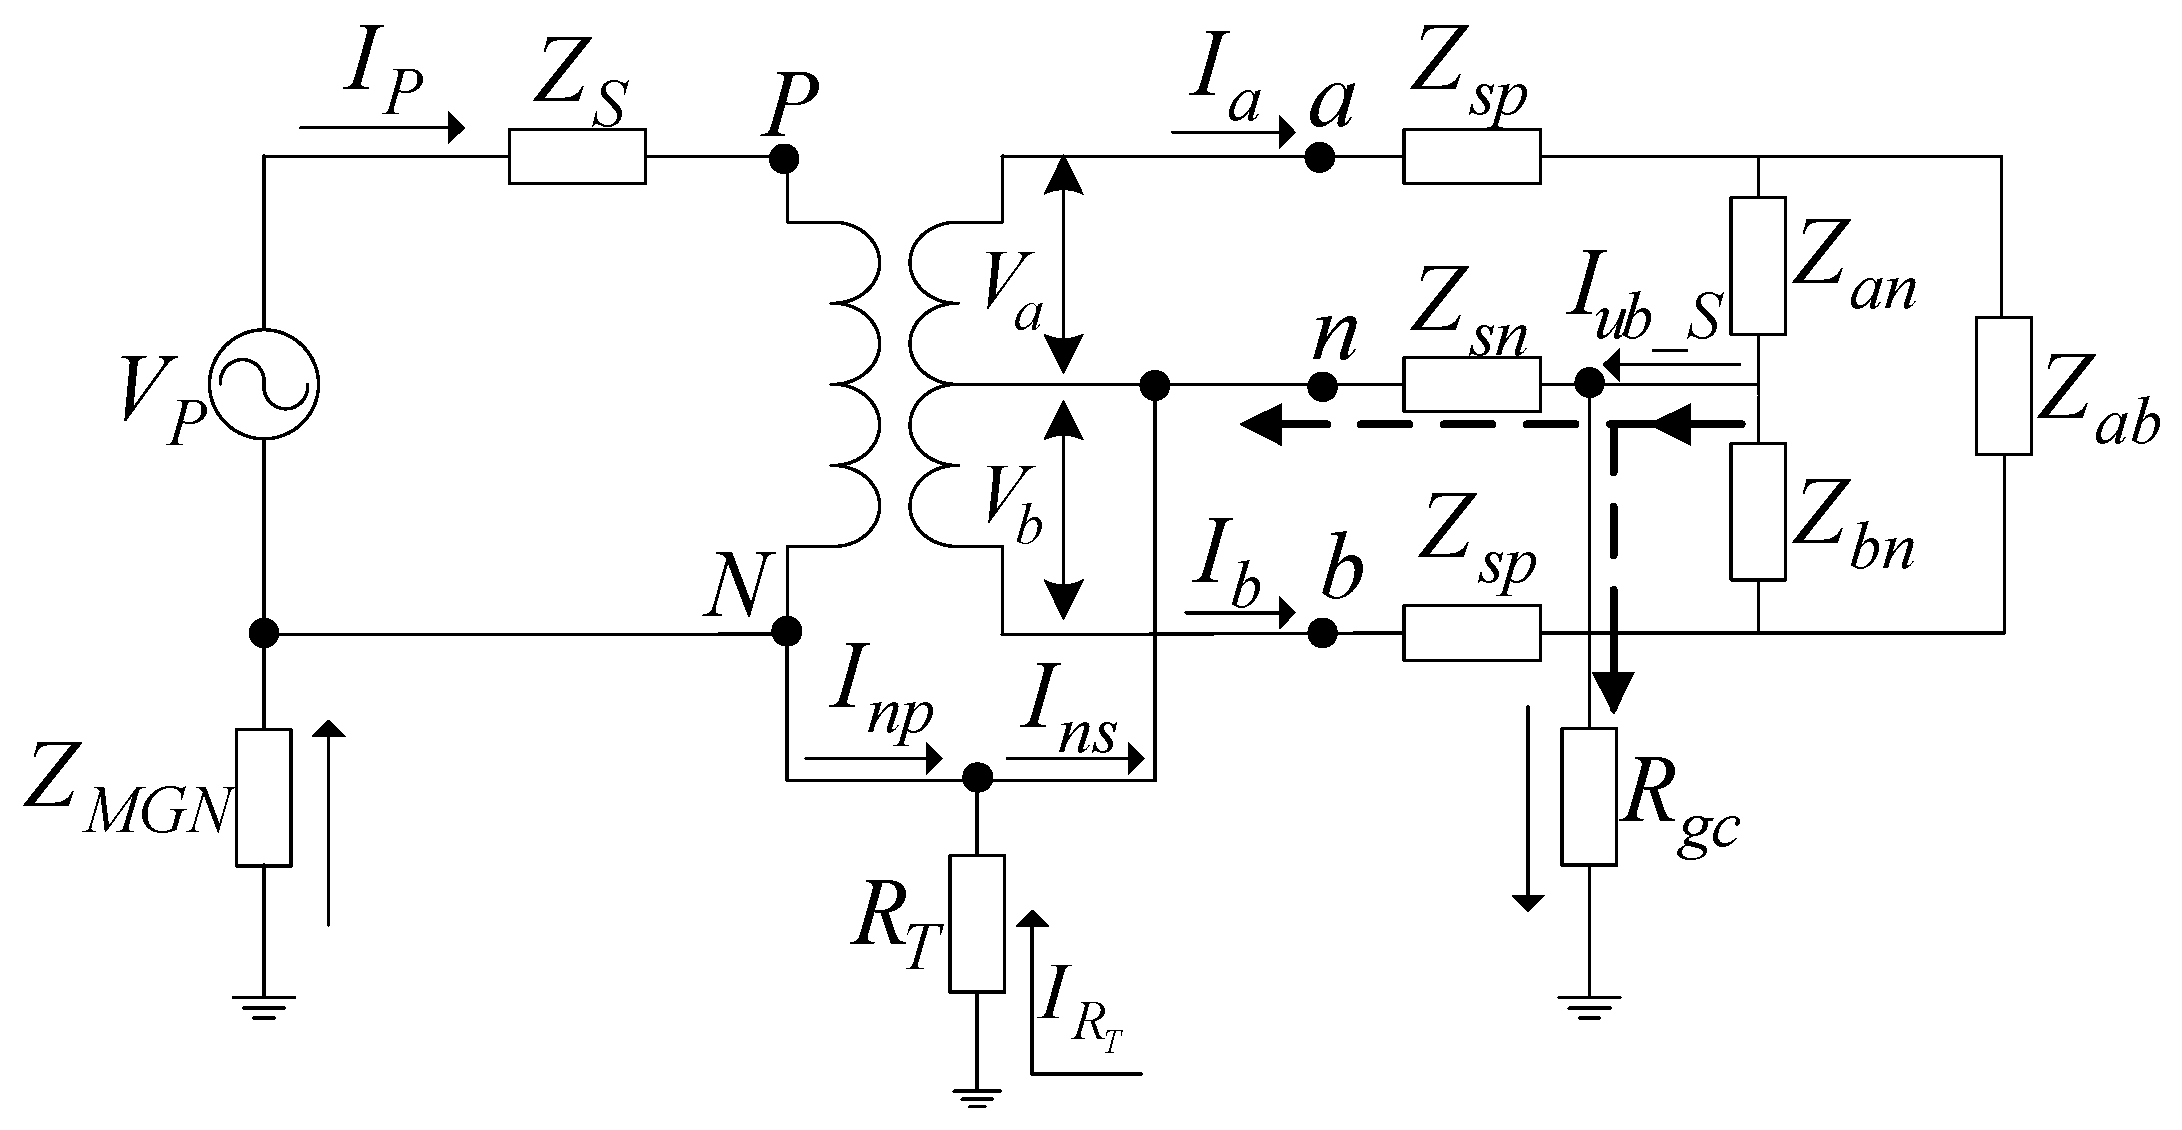
In order to analyze the neutral current at the transformer primary and secondary side, an equivalent circuit is first established, as shown in Figure 2. The transformer primary system is equivalent to be a Thévenin circuit represented by VP and ZS, where VP is the phase to neutral voltage and ZS is the equivalent impedance for the primary system. ZMGN represents the equivalent impedance of the primary multiple groundings. The derivation process for the value of ZMGN will be discussed in the next subsection. Zan represents the equivalent customer loads between the hot wire a and neutral; Zbn represents the equivalent customer loads between the hot wire b and neutral; Zab represents the equivalent customer loads between the hot wire a and b. Zsn is the impedance of the neutral line in the transformer secondary side, and Zsp is the distribution line impedance. In Figure 2, the current flowing in the primary neutral is labeled as Inp, and the current flows in the secondary neutral are labeled as Ins. Ia, Va and Ib, Vb represent the phase current and voltage of the secondary side. IP represents the current in the transformer primary side, and I R T represents the grounding current of the transformer. The unbalanced current in the transformer secondary side is labeled as Iub_S in Figure 2.
Suppose that the neutral current is totally caused by the customer, and the utility has no contribution. According to Figure 2, there are two circulation paths for this unbalanced current caused by the customer loads. One part of it flows through the secondary neutral line and then back to the customer loads. The other part flows into the ground through the customer grounding Rgc and then flows from the earth to the transformer grounding RT and primary grounding ZMGN. This neutral current further circulates back to the transformer secondary neutral.
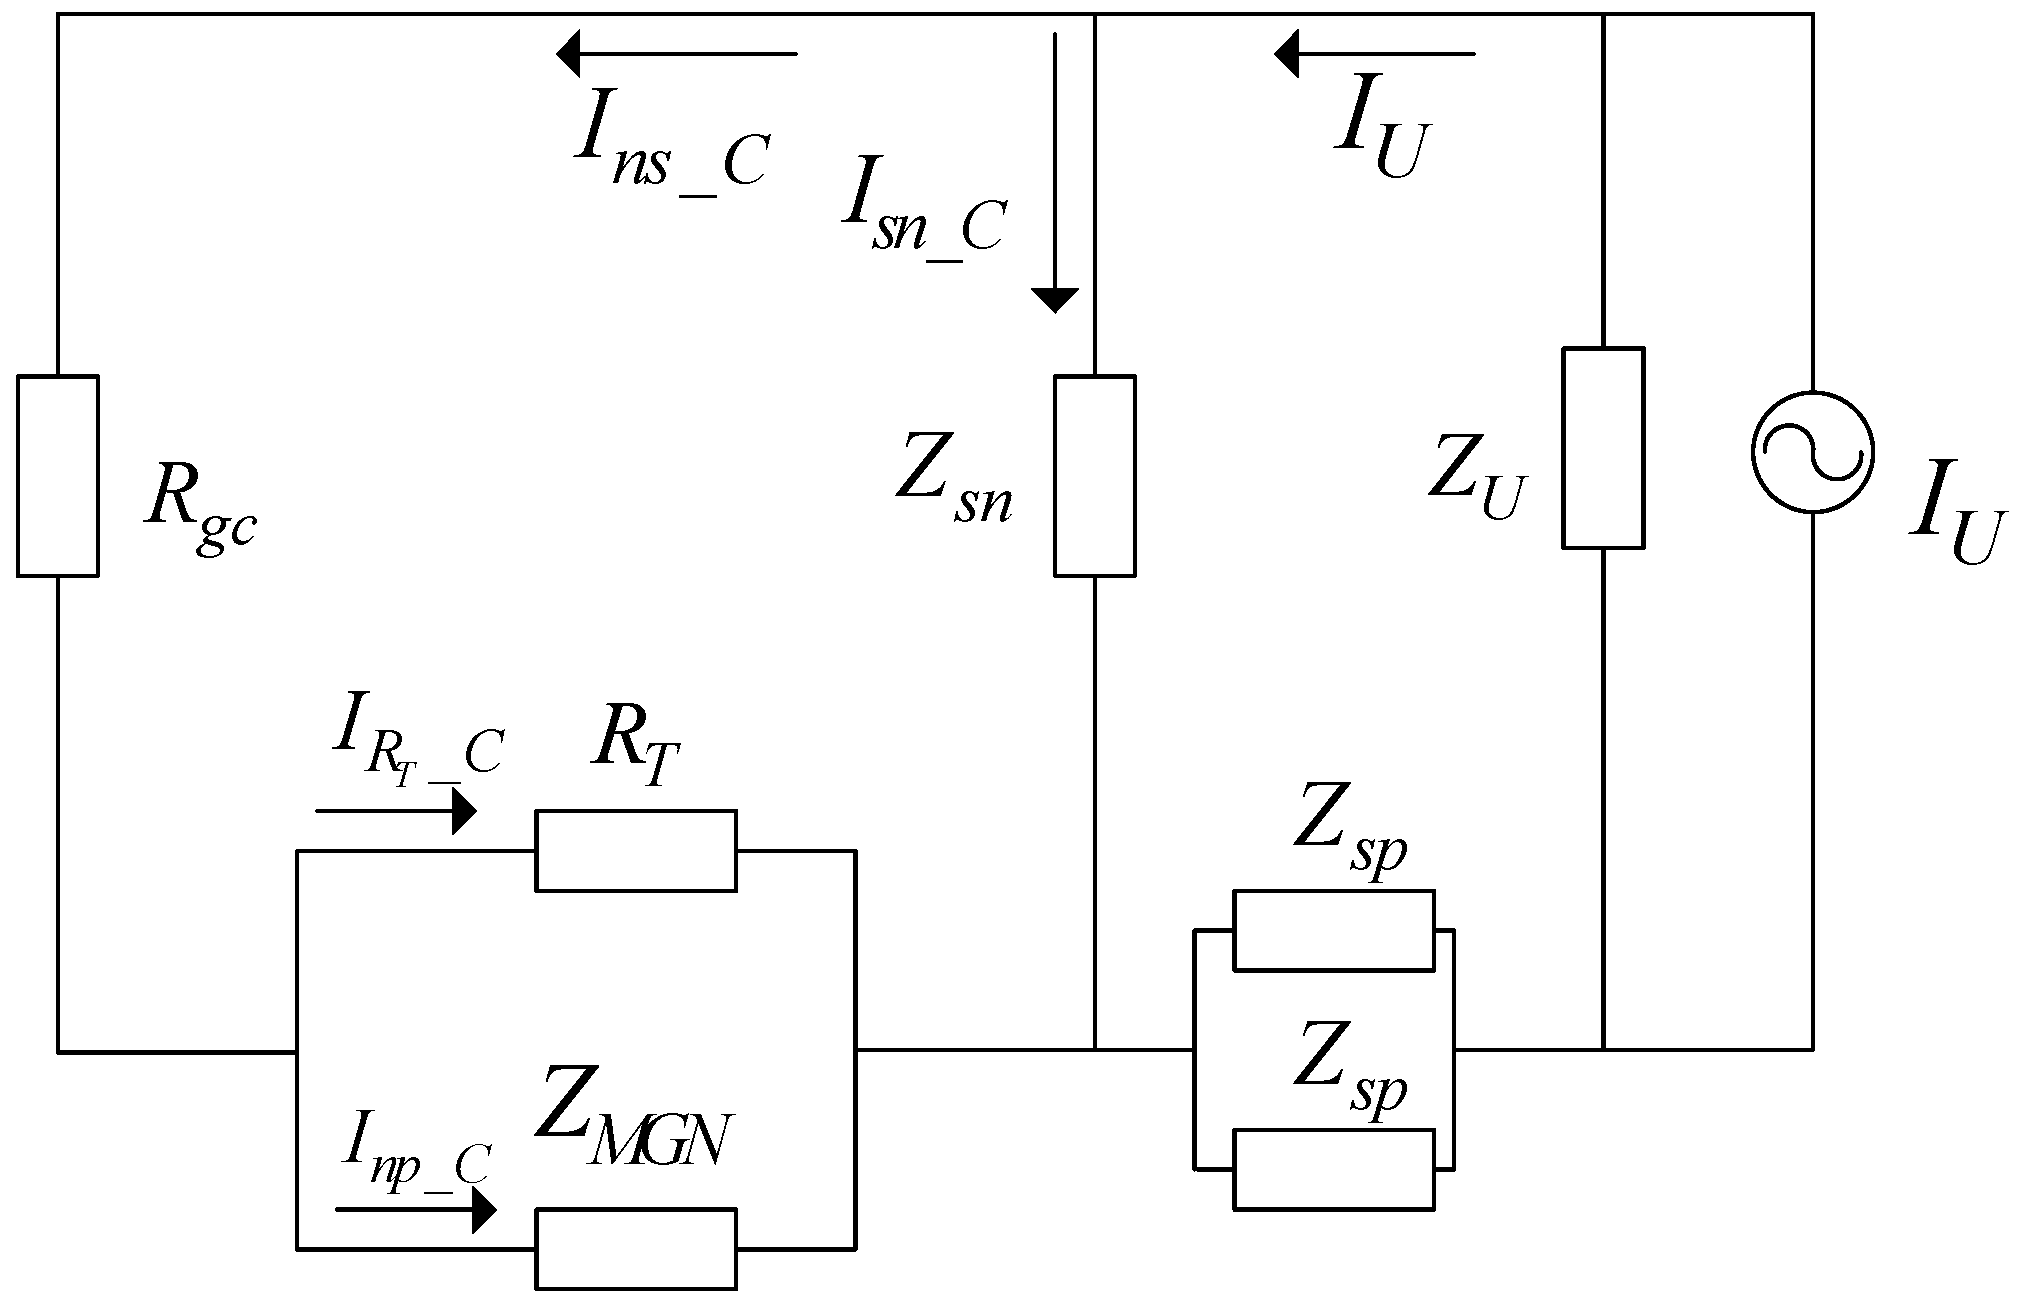
According to the above descriptions, the equivalent circuit for the neutral current circulation can be simplified as shown in Figure 3. In the figure, the current source IU is determined by the unbalanced voltage VU and the equivalent load impedance ZU, which is caused by the imbalance of the two single-phase loads (Zan and Zbn). The analytical formulas to calculate ZU and IU are given in Equations (1) and (2).
Z U = Z a n / / Z b n = Z a n × Z b n Z a n + Z b n
I U = V U / Z U
VU is the equivalent unbalanced voltage source, which can be calculated based on the transformer secondary rated voltage VN.
V U = Z b n Z a n Z a n + Z b n × V N
In Figure 3, Isn_C represents the current flowing through the secondary neutral line, and Ins_C represents the current flowing into the ground through the customer grounding impedance Rgc. The current Ins_C is split into two parts as IRT_C and Inp_C. The subscript C in each variable represents that the neutral currents are caused only by the customer. Based on Figure 3, it can be seen that the current flowing in the neutral of the primary system Inp_C can be calculated by Equation (4).
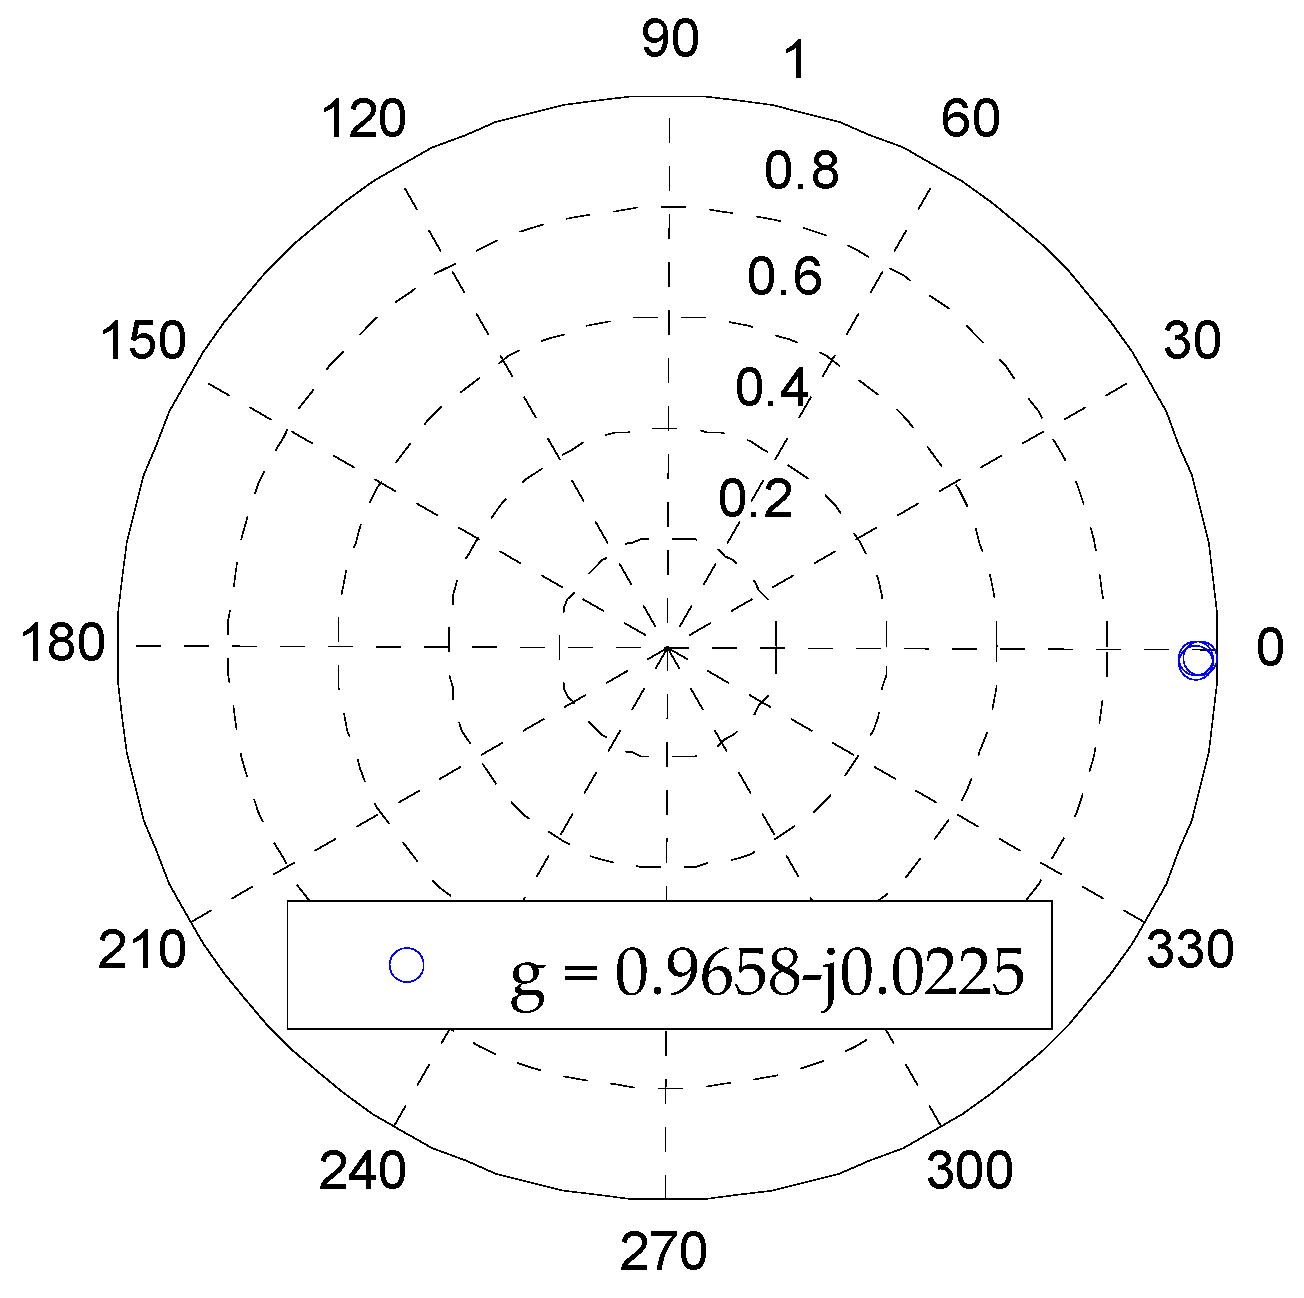
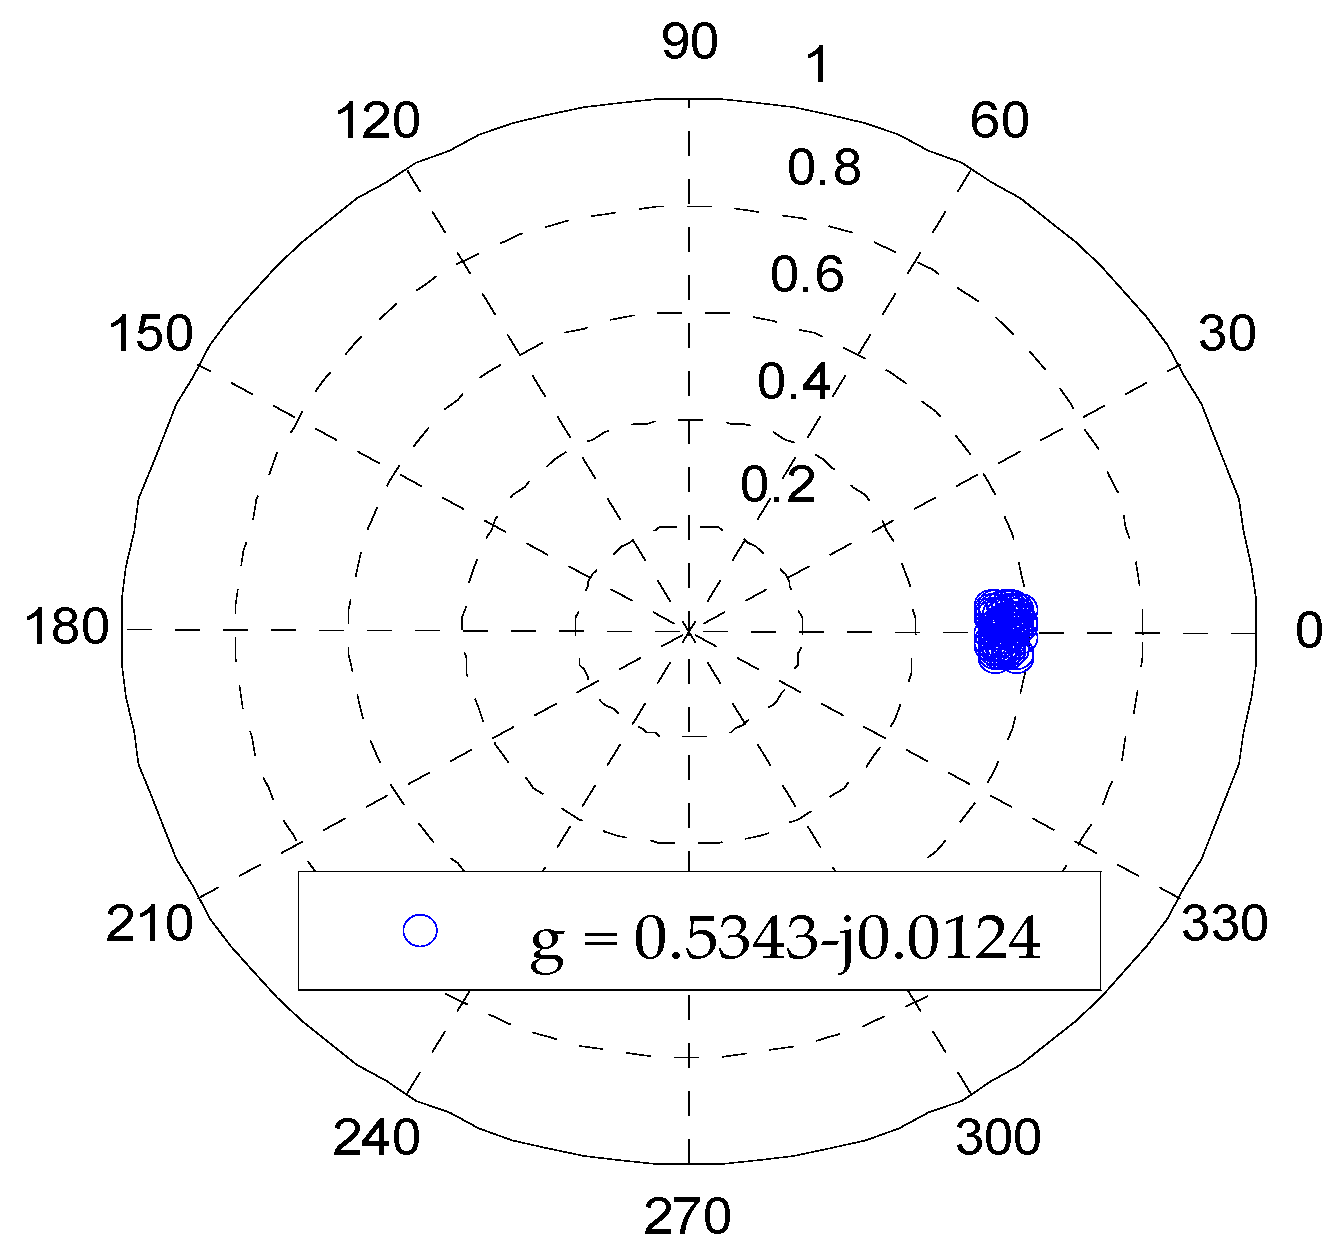
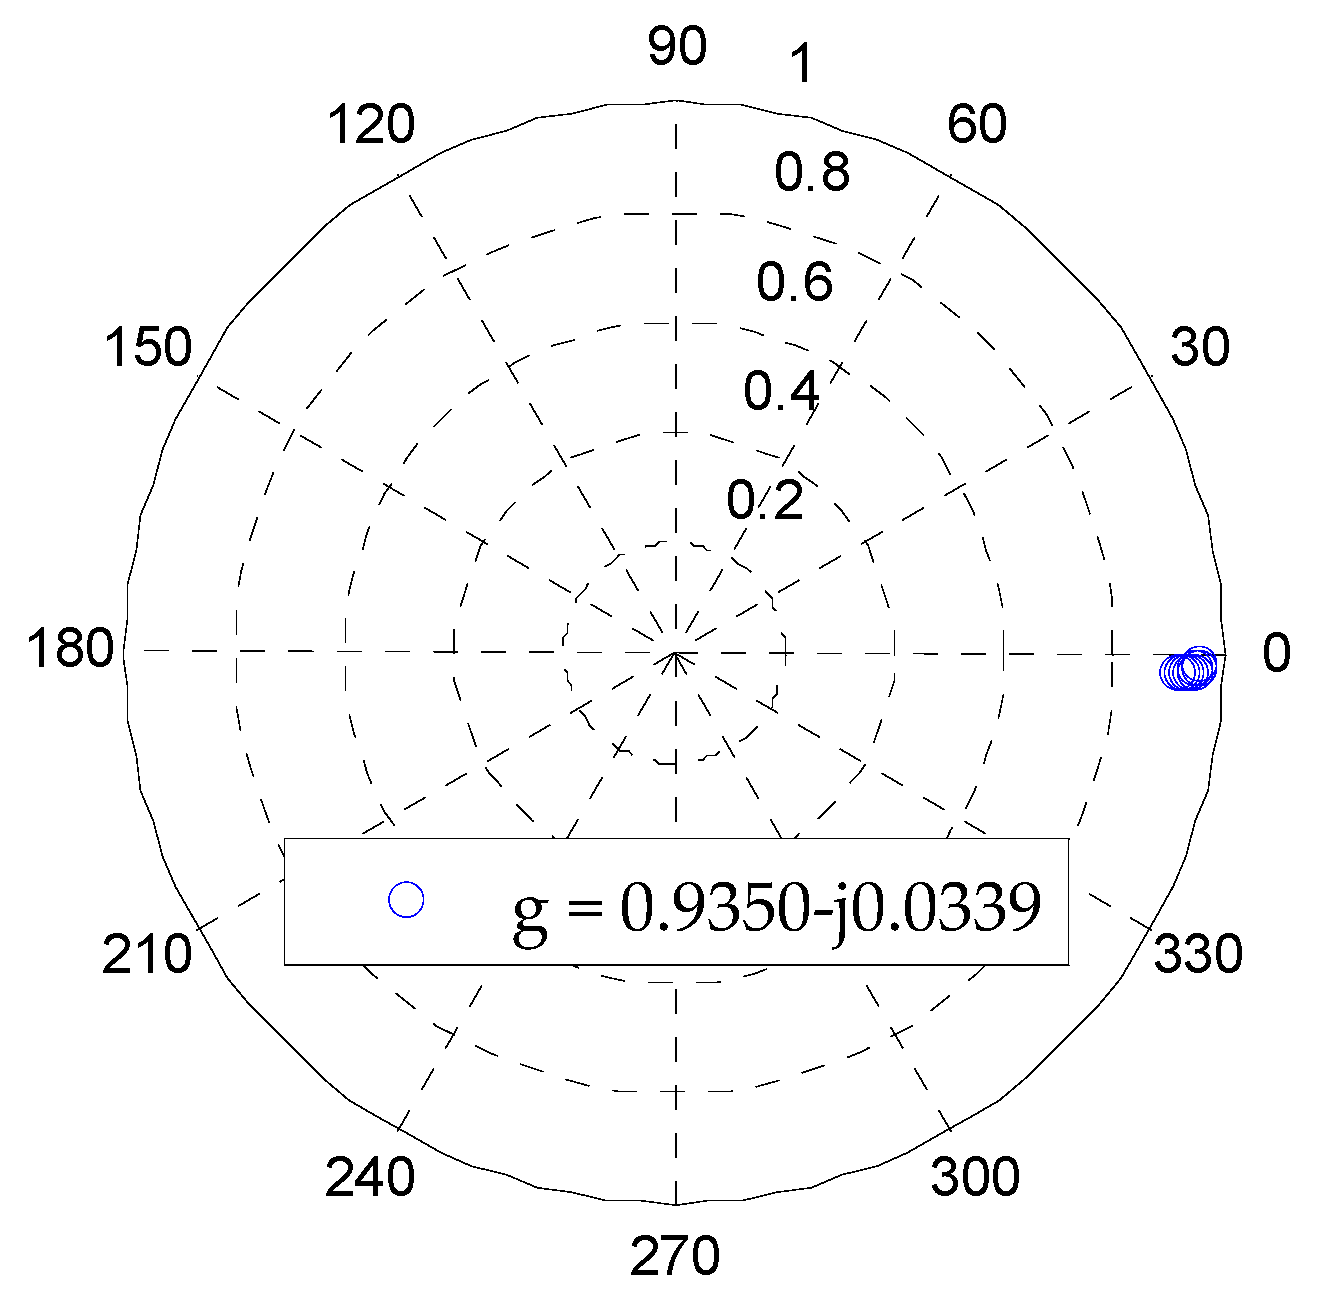
I n p _ C = R T R T + Z M G N I n s _ C
Here, a parameter g is introduced, which is shown in Equation (5).
g = R T R T + Z M G N
It can be seen that the value of parameter g is determined by the transformer grounding impedance RT and the primary neutral equivalent impedance ZMGN. For an MGN system, the transformer grounding resistance RT is usually constant. Therefore, the value of g is mainly determined by the equivalent neutral impedance ZMGN of the primary system. If the primary system neutral is broken, the equivalent impedance ZMGN should increase, and the value of parameter g should decrease. Therefore, the variation for the value of parameter g can be used to reflect the primary neutral condition.

2.2. Impedance Determination under Normal Operating Conditions

Under normal operating conditions, the value of transformer grounding impedance RT can be estimated based on the substation database. The value of impedance ZMGN can be determined based on the following procedures.
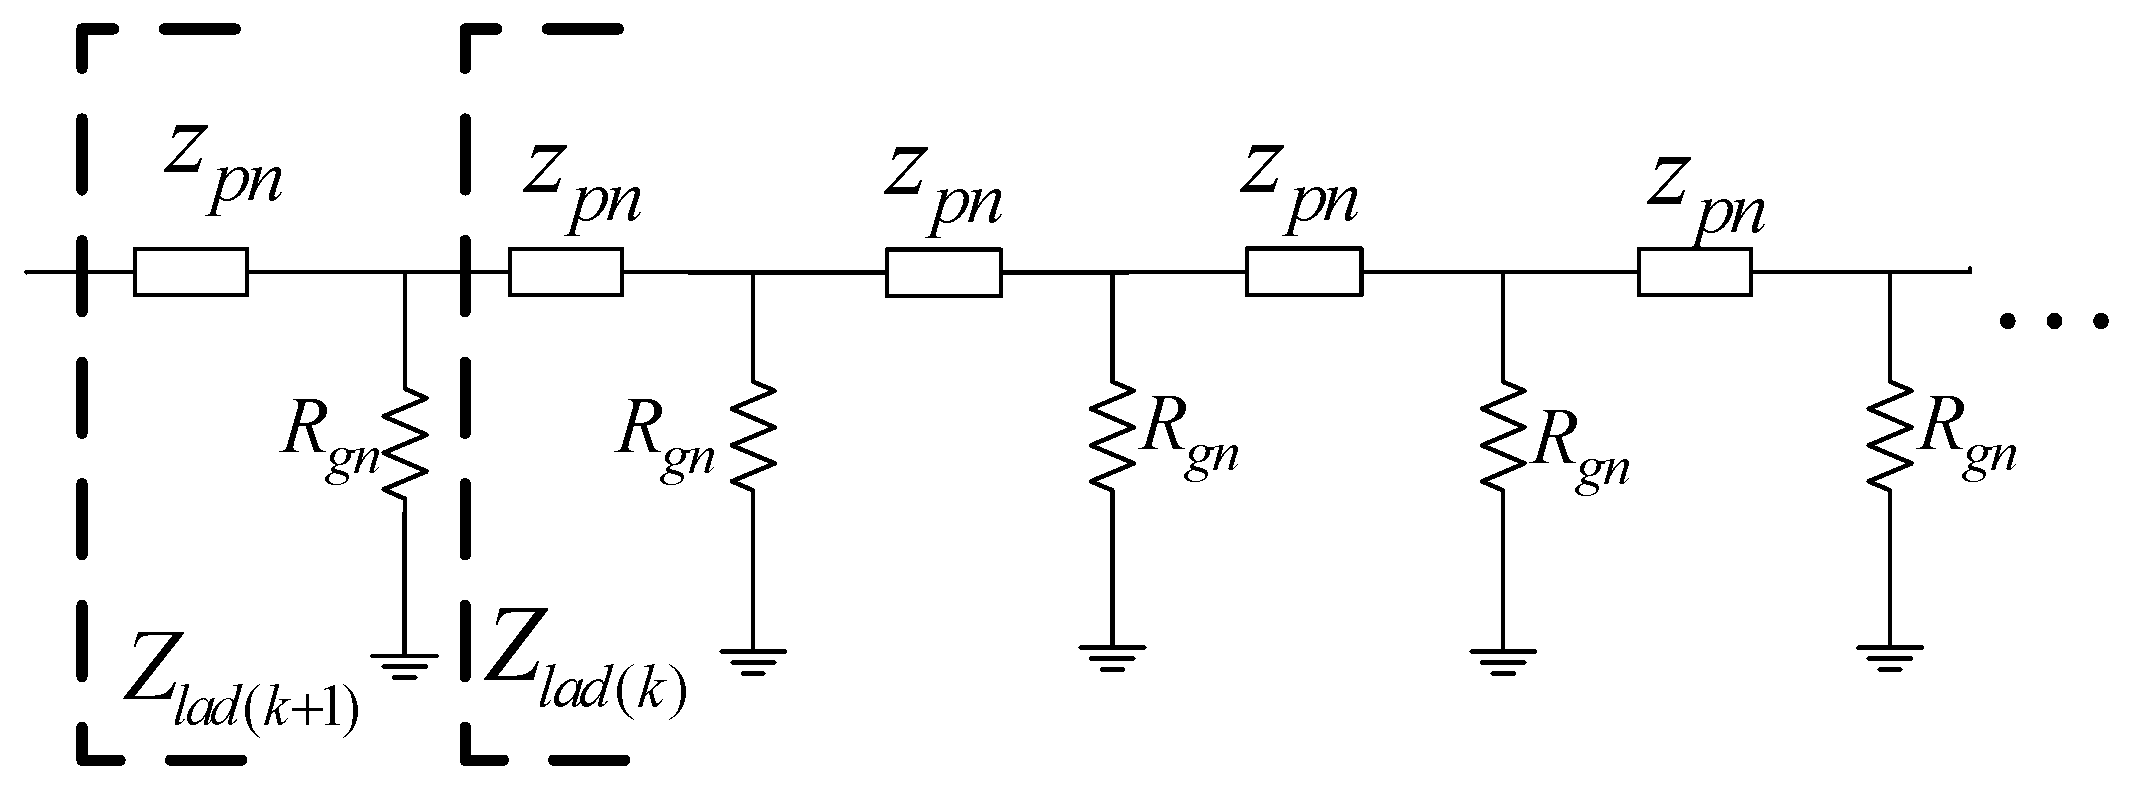
The primary neutral line of an MGN system is naturally a ladder network, as shown in Figure 4, where zpn is the primary neutral conductor impedance between two grounding poles. Rgn represents the pole grounding resistance. Zlad(k) and Zlad(k+1) represent the equivalent impedance for the multiple grounding system with k or (k + 1) grounding poles, respectively. The equivalent impedance of a ladder network with (k + 1) grounding poles can be calculated according to Equation (6) [18].
Z l a d ( k + 1 ) = Z l a d ( k ) R g n Z l a d ( k ) + R g n + z p n
For the ladder network shown in Figure 4, a ladder network has the property that after certain more parallel networks are added, the change in the equivalent impedance becomes insignificant; therefore, when the number k is sufficiently large, Zlad(k)Zlad(k+1).
Then, Equation (6) can be expressed as Equation (7).
Z l a d ( k ) = Z l a d ( k ) R g n Z l a d ( k ) + R g n + z p n
After certain rearrangement of Equation (7), Equation (8) can be obtained:
Z l a d 2 z p n Z l a d z p n R g n = 0 Z l a d = 1 2 ( z p n ± z p n 2 + 4 z p n R g n )
The subscript (k) is omitted for simplicity in Equation (8). The positive root of Zlad is the equivalent impedance of the ladder network; thus, Equation (9) is derived.
Z l a d = 1 2 ( z p n + z p n 2 + 4 z p n R g n )
Since the neutral conductor impedance z p n is much smaller than R g n , Equation (9) can be simplified to Equation (10).
Z l a d z p n R g n
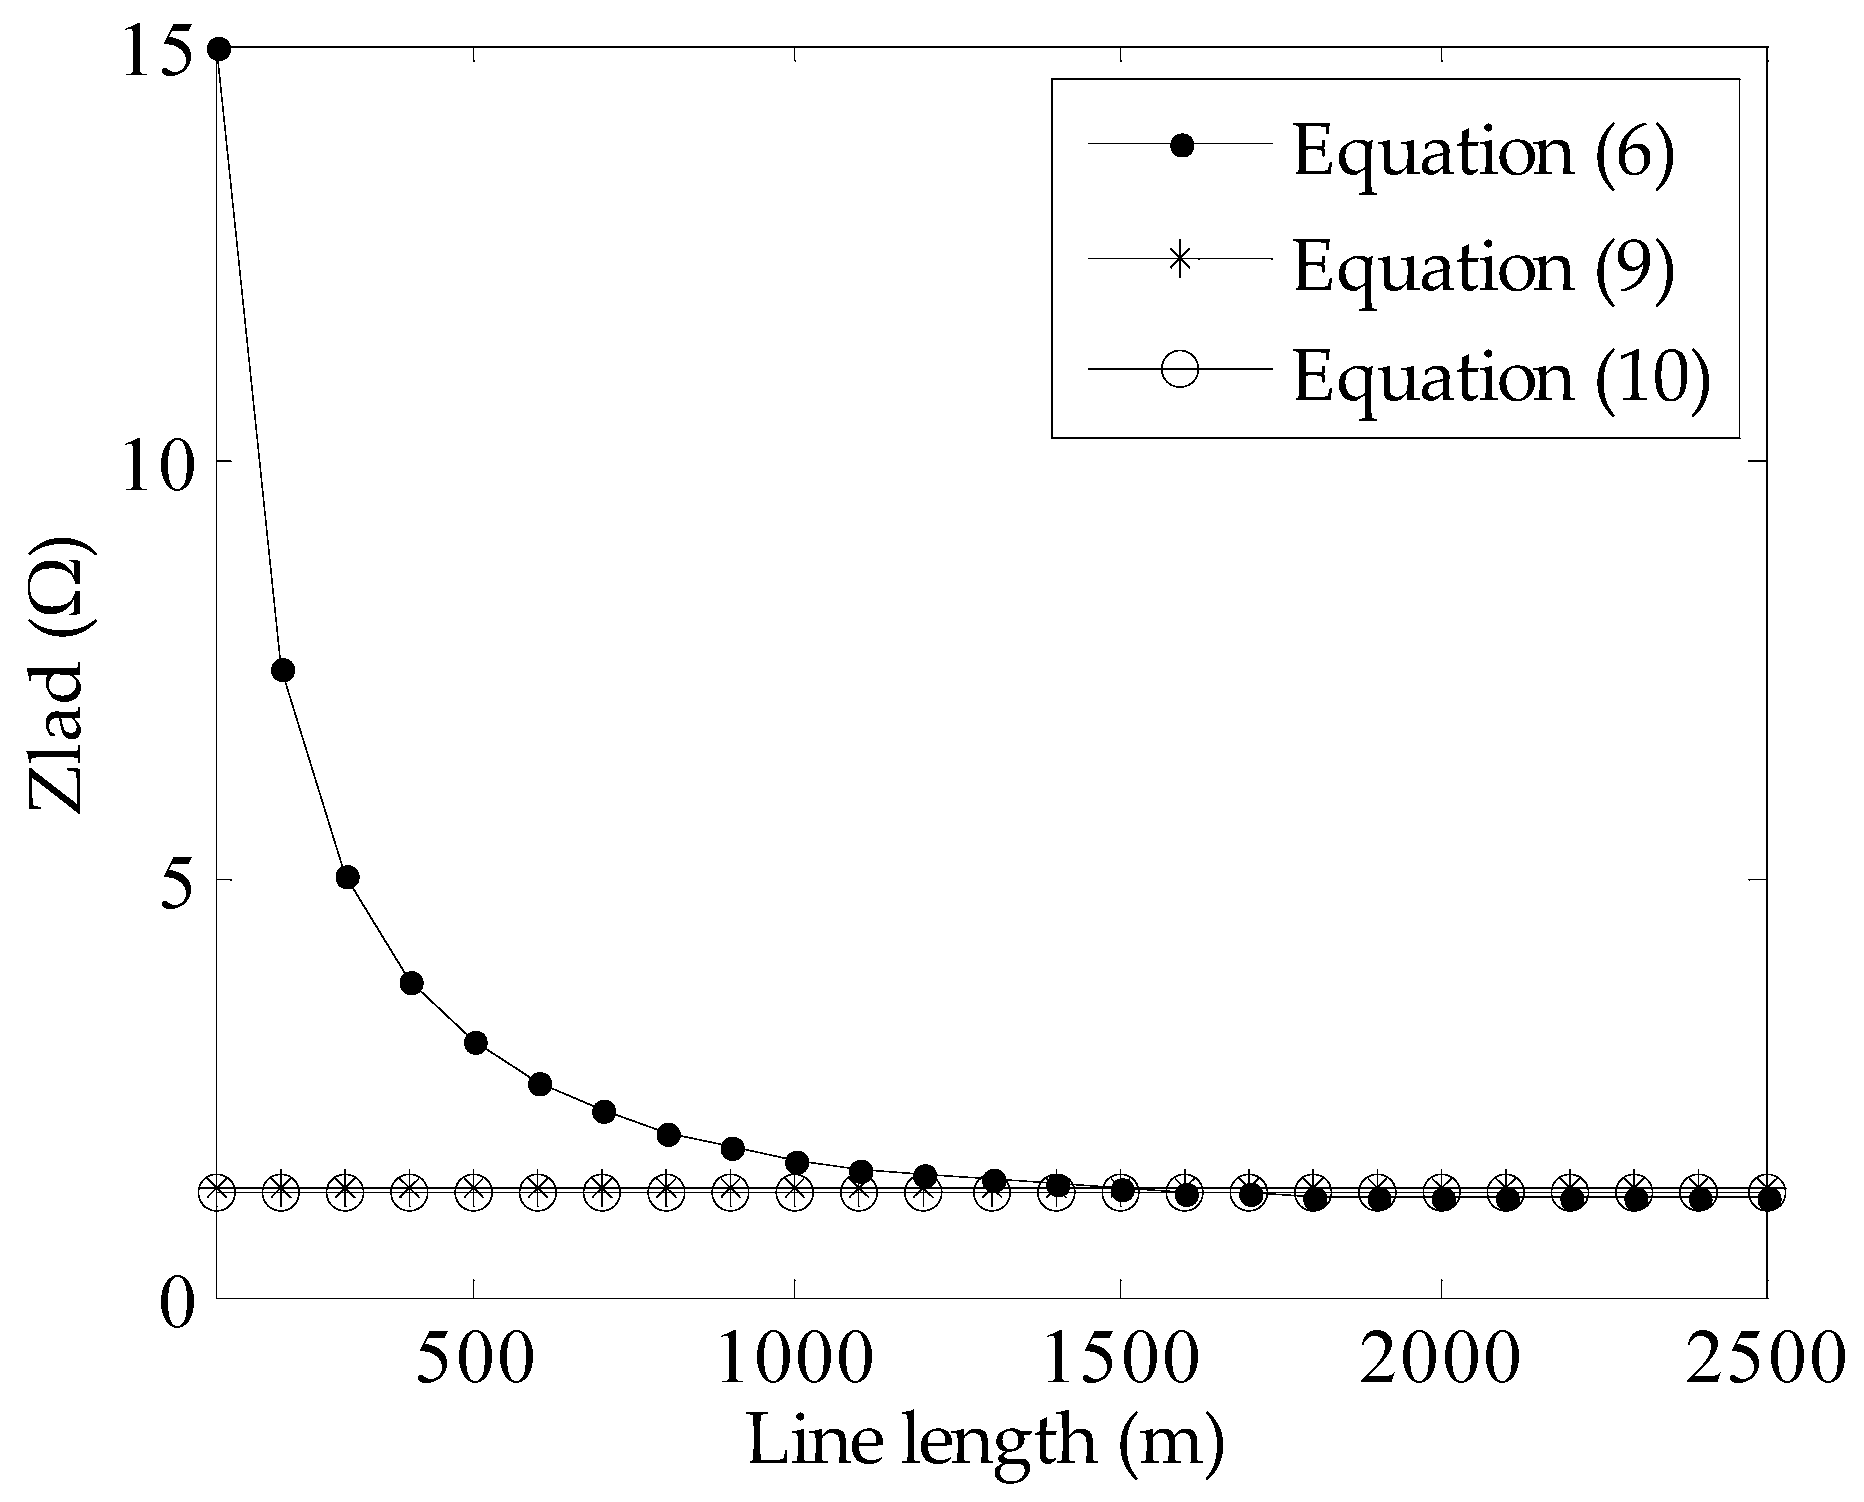
The impedance calculation result based on Equation (10) is compared with the results from Equations (6) and (9) for an example system. The parameters for the MGN system are: z p n = ( 0.0427 + j 0.0961 ) Ω and R g n = 15   Ω . The estimation results for the equivalent impedance of the ladder network are shown in Figure 5. It is apparent that the equivalent impedance of the ladder network reaches a constant value when the length of the ladder network is larger than 1000 m.
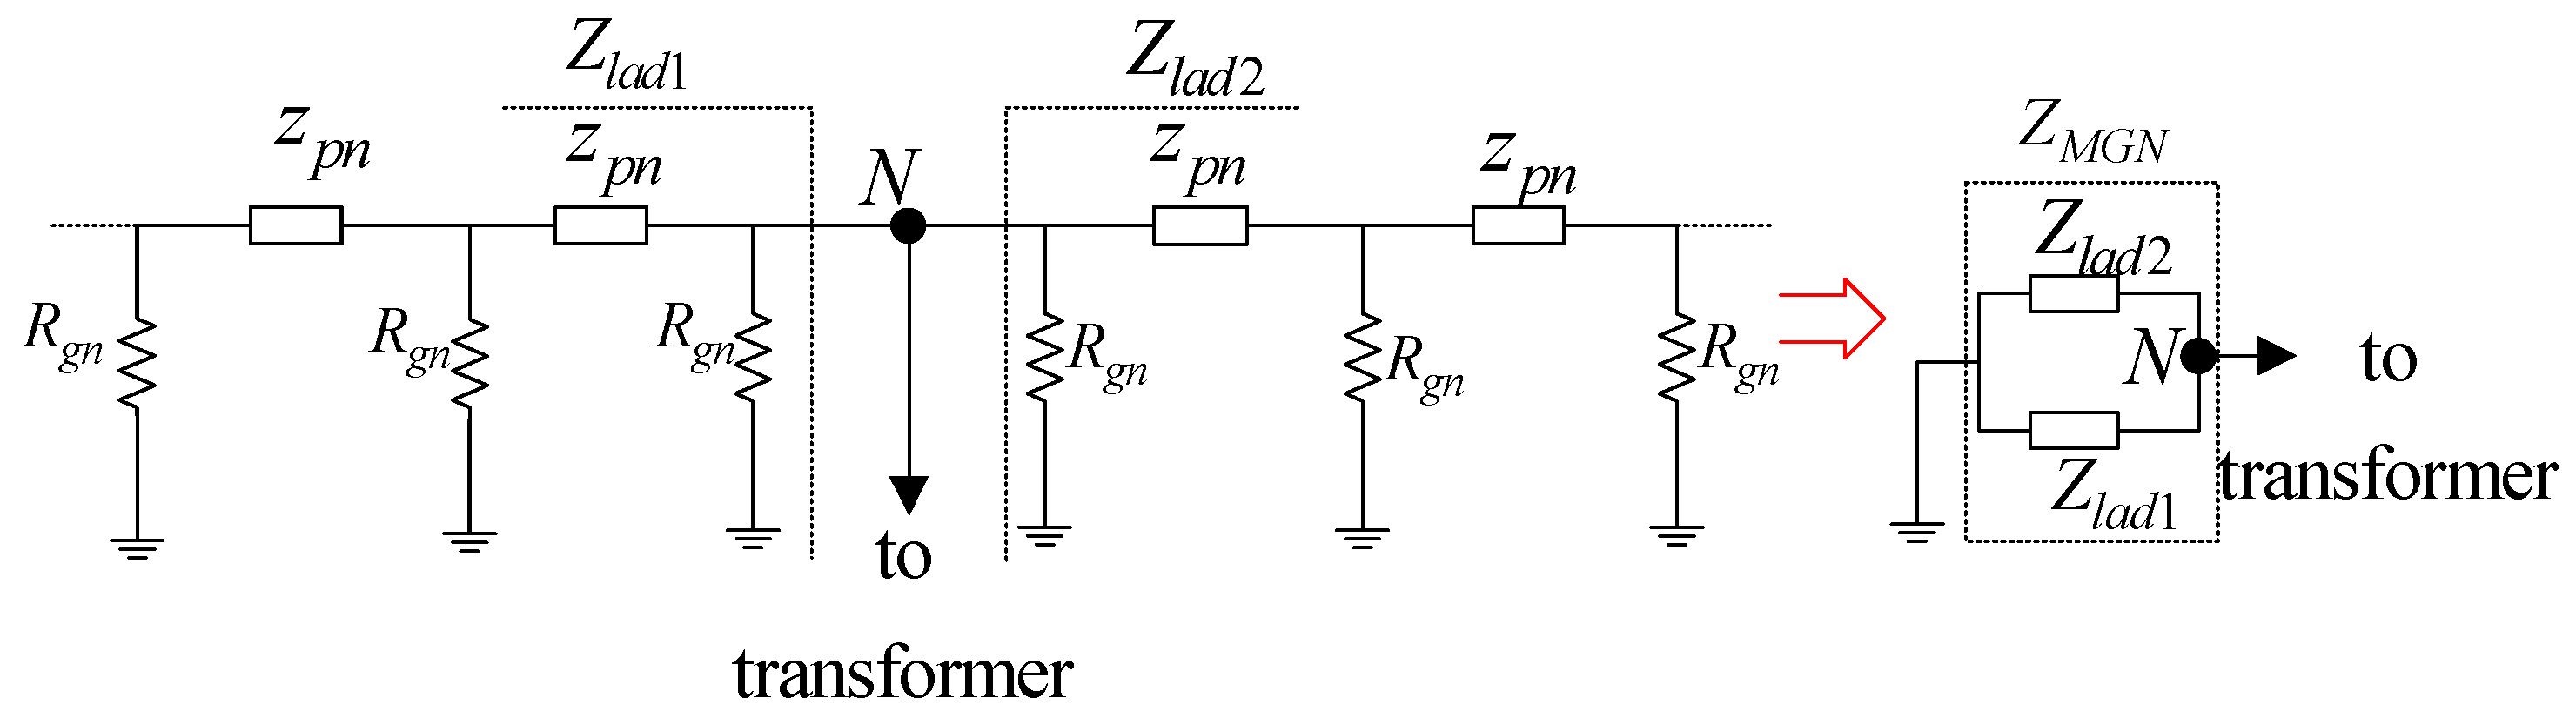
The neutral system seen from the transformer primary node N (referring to Figure 2) can be equivalent to the circuit shown in Figure 6. It can be seen that, from the transformer connection point N, the multi-grounding primary system can be seen as two parallel ladder networks, labeled as Zlad1 and Zlad2. The equivalent impedance of each network can be estimated by Equation (10). Additionally, the equivalent primary system impedance seen from the transformer connection point can be calculated by the parallel connection of Zlad1 and Zlad2 according to the analytical formula shown in Equation (11).
Z M G N Z l a d 1 / / Z l a d 2 = z p n R g n / / z p n R g n = 1 2 z p n R g n

2.3. Impedance Determination Based on the Measurement Data

Referring to the multi-grounding system shown in Figure 2, the neutral current in the primary system is caused simultaneously by both the utility and customer; therefore, the primary neutral current Inp can be divided into two parts, as shown in Equation (12).
I n p = I n p _ U + I n p _ C
Inp_U is the primary neutral current caused by the utility, and Inp_C is the primary neutral current caused by the customer. Similarly, the neutral current in the secondary system Ins is also composed of two parts, Ins_U and Ins_C.
I n s = I n s _ U + I n s _ C
Bring Equations (4) and (5) into Equations (12) and (13), the following relation can be derived.
I n p = I n p _ U + g ( I n s I n s _ U )
Based on the measurement data of two consecutive time instants t1 and t2, Equation (14) can be rewritten as Equations (15) and (16).
I n p , 1 = I n p _ U , 1 + g ( I n s , 1 I n s _ U , 1 )
I n p , 2 = I n p _ U , 2 + g ( I n s , 2 I n s _ U , 2 )
Subscripts 1 and 2 indicate that the data are for time instants t1 and t2, respectively. Subtracting Equation (15) from Equation (16), then Equation (17) can be obtained.
Δ I n p = Δ I n p _ U + g ( Δ I n s Δ I n s _ U )
Here, Δ is used to indicate the difference between the values of each variable at different time instants. From Equation (17), it can be seen that, if the utility causes no variation to the neutral current, ΔInp_U and ΔIns_U will both equal zero. Equation (17) can be further simplified to Equation (18); therefore, parameter g can be calculated by Equation (19).
Δ I n p = g Δ I n s
g = Δ I n p Δ I n s
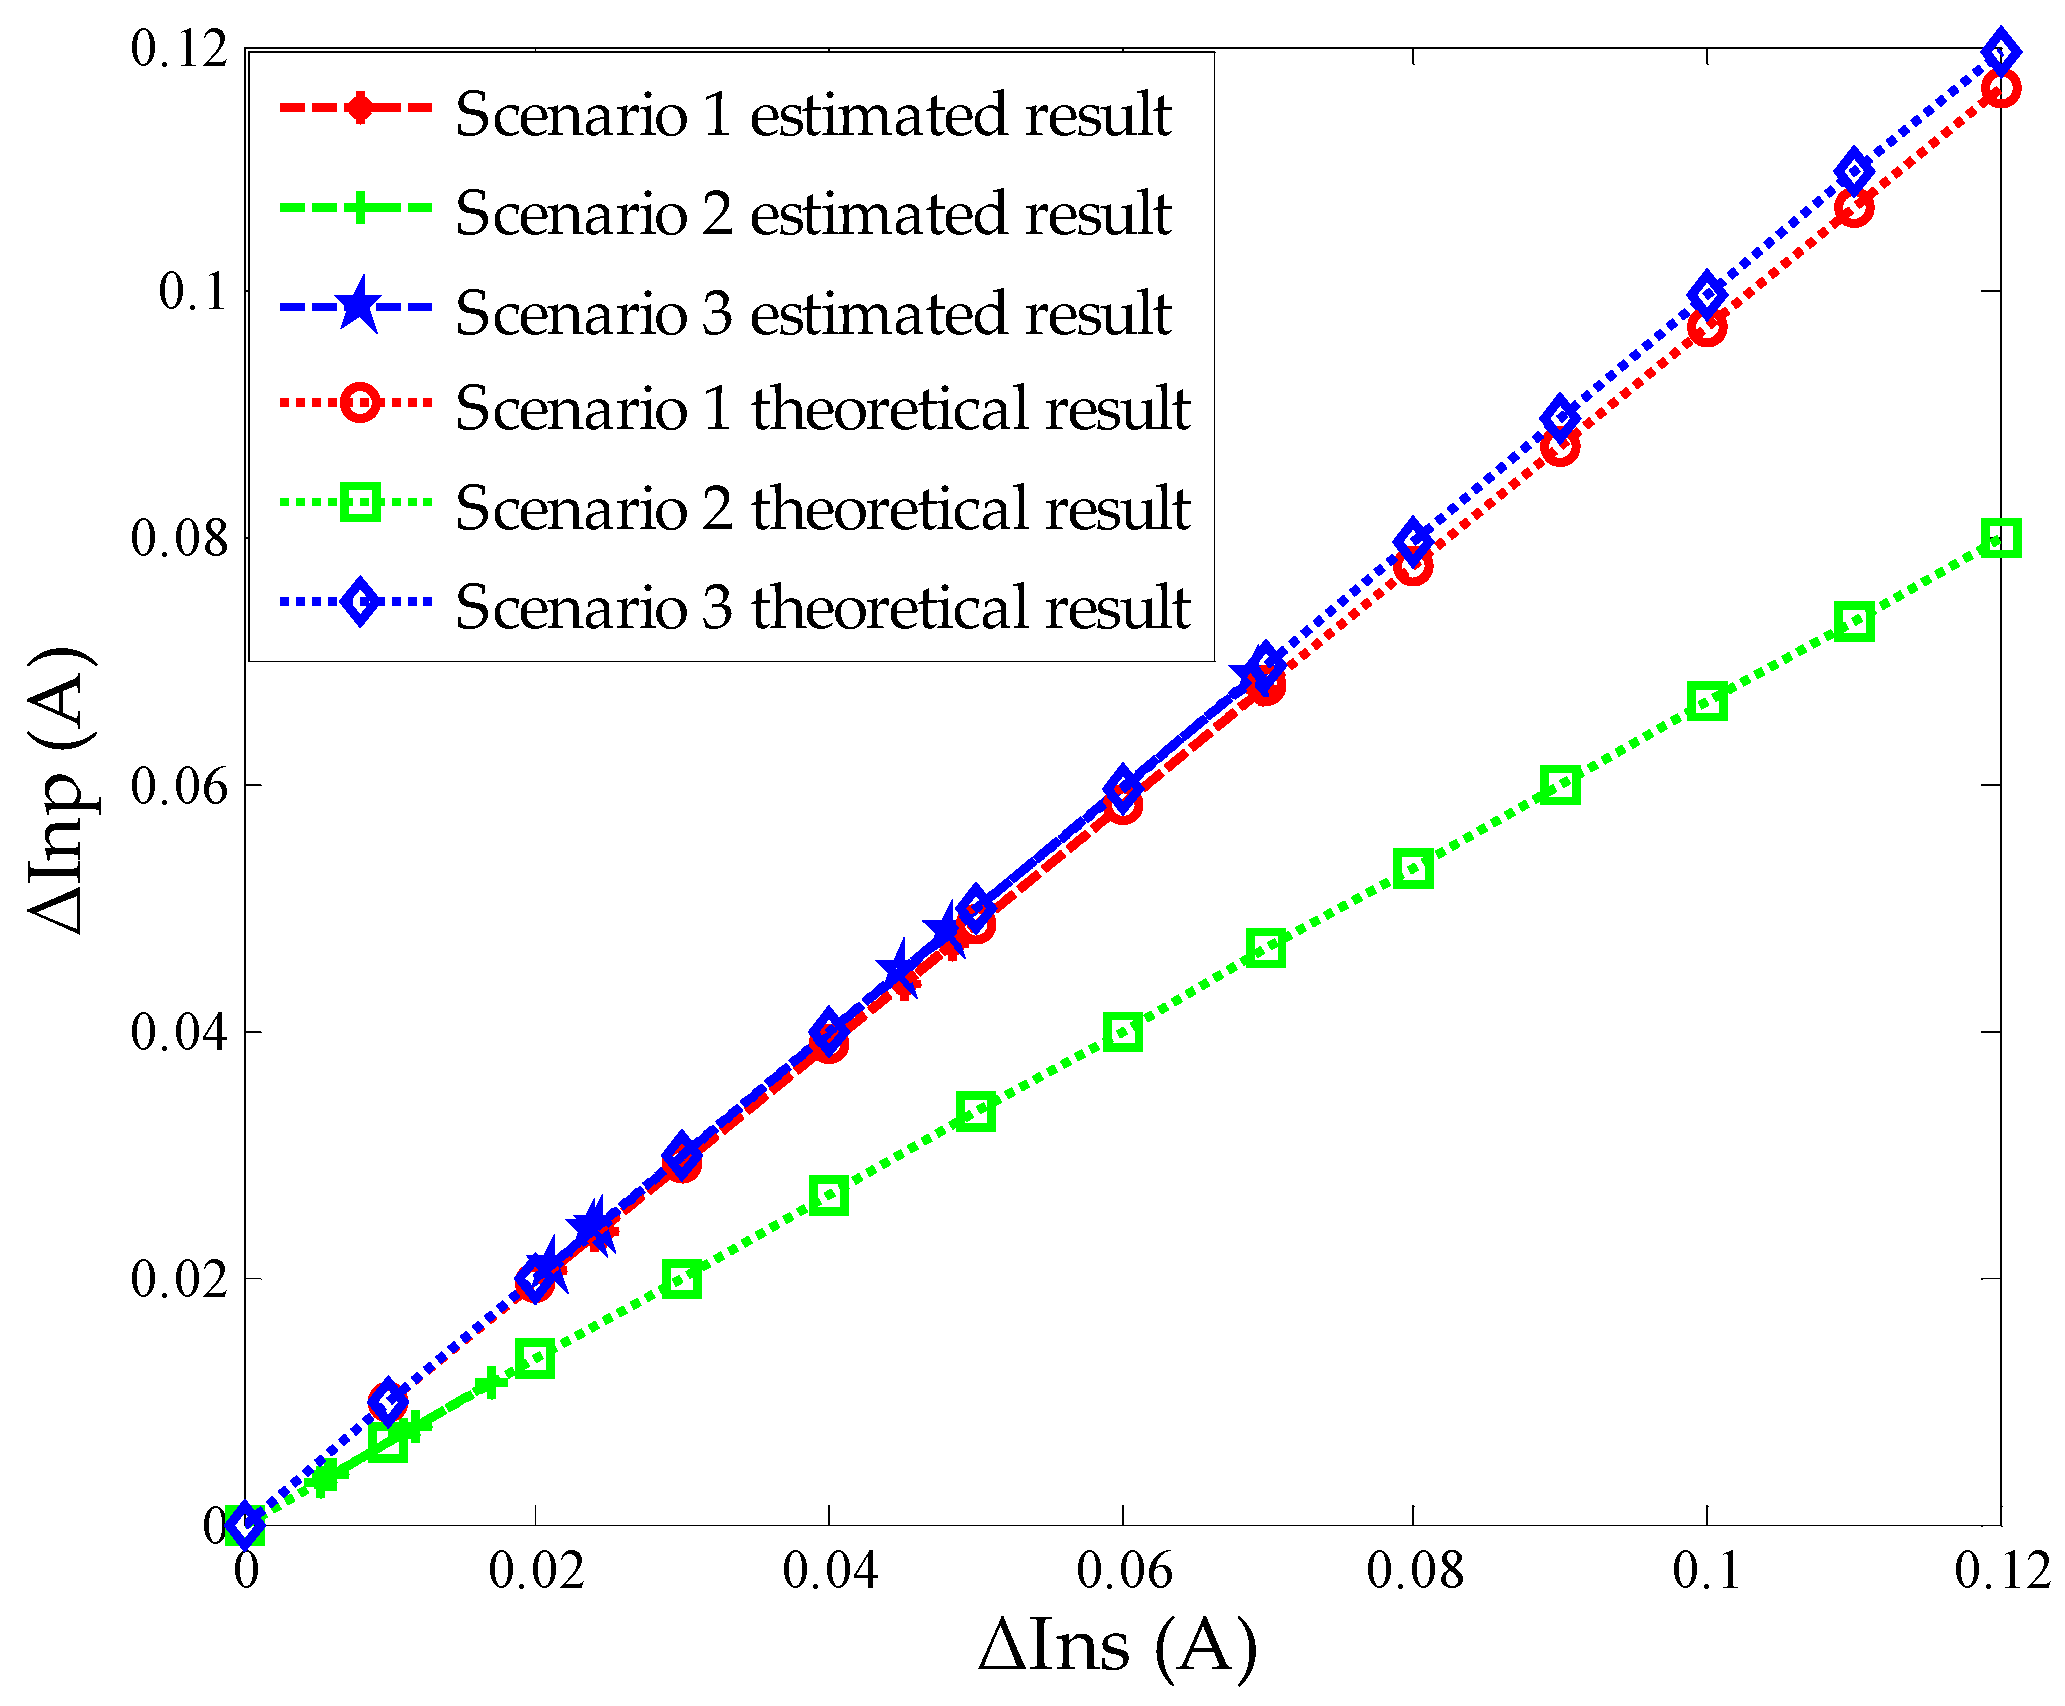
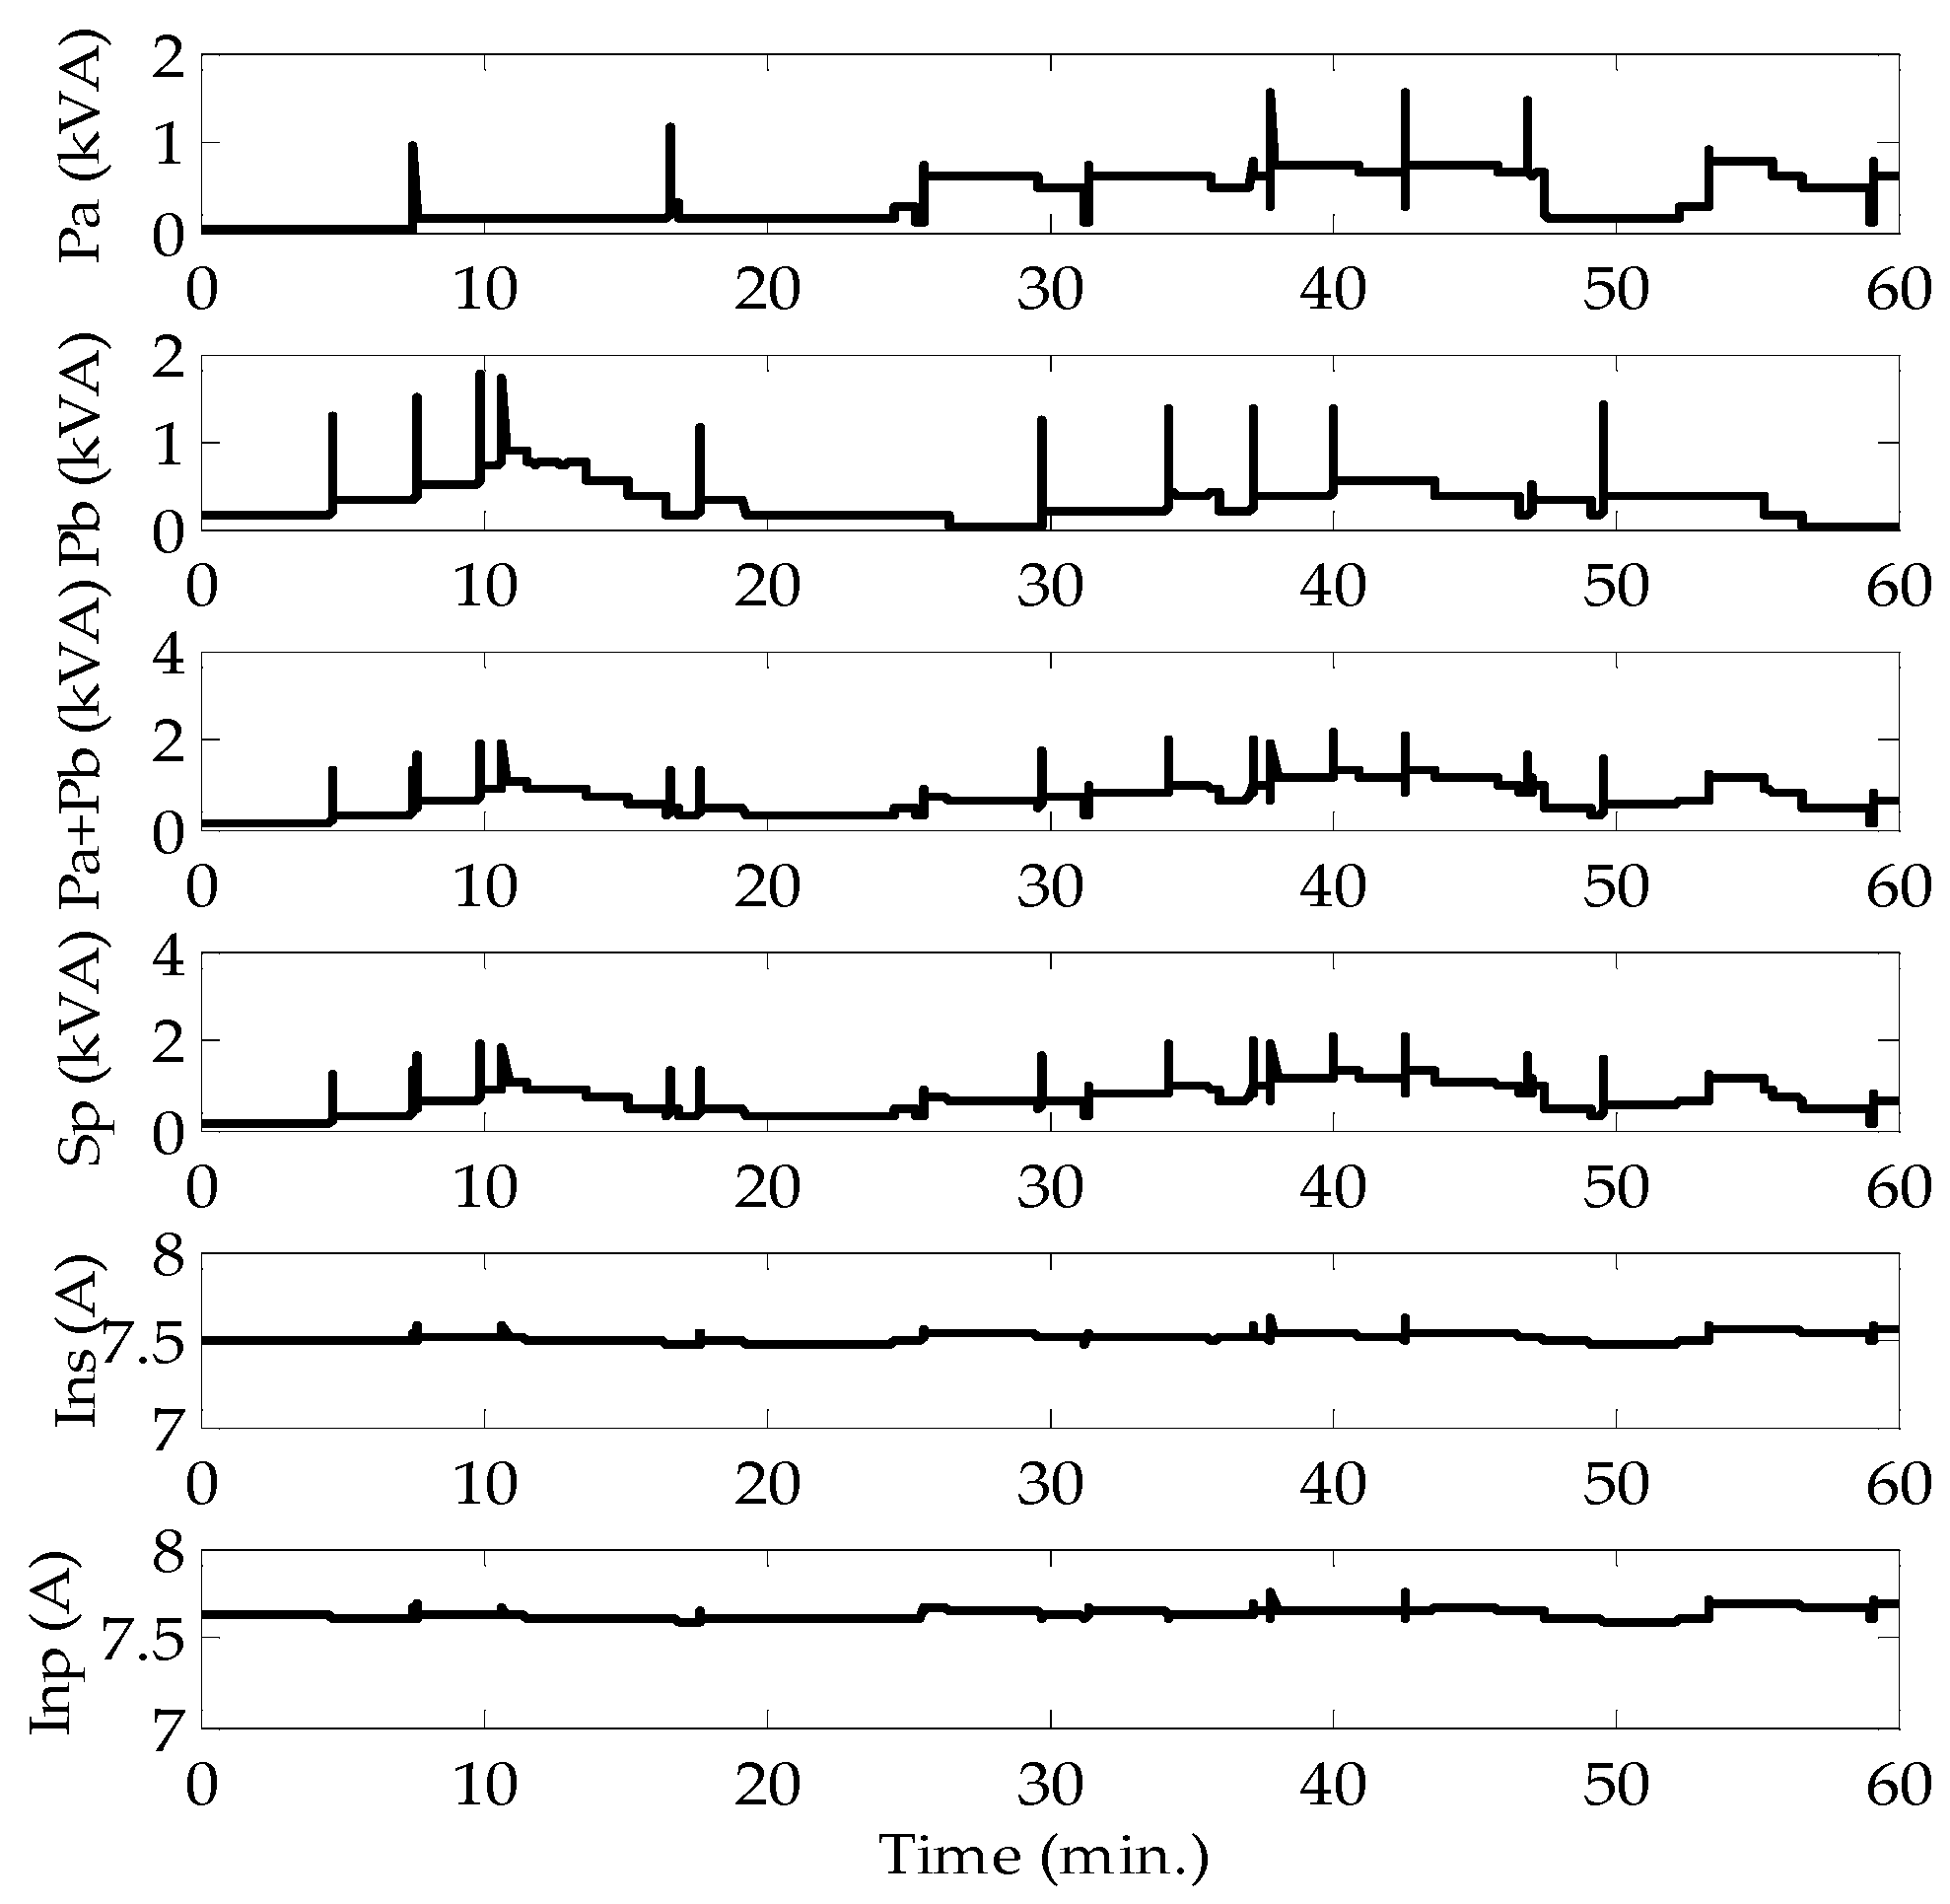
Therefore, the variation of Inp and Ins can be used to estimate the value of parameter g. Furthermore, based on the estimated parameter g, the primary neutral impedance ZMGN can be estimated from Equation (20) according to Equation (5).
Z M G N = 1 g g × R T

2.4. Determination of the Primary Neutral Condition

Under normal operating conditions, the equivalent impedance ZMGN of the primary neutral system can be calculated according to Equation (11). The actual value of ZMGN can be estimated based on the procedures shown in Section 2.3. When the primary neutral line is loosened or broken, the equivalent impedance of the primary neutral conductor ZMGN should increase. Therefore, by monitoring the value of ZMGN, the condition of the primary neutral integrity can be known.
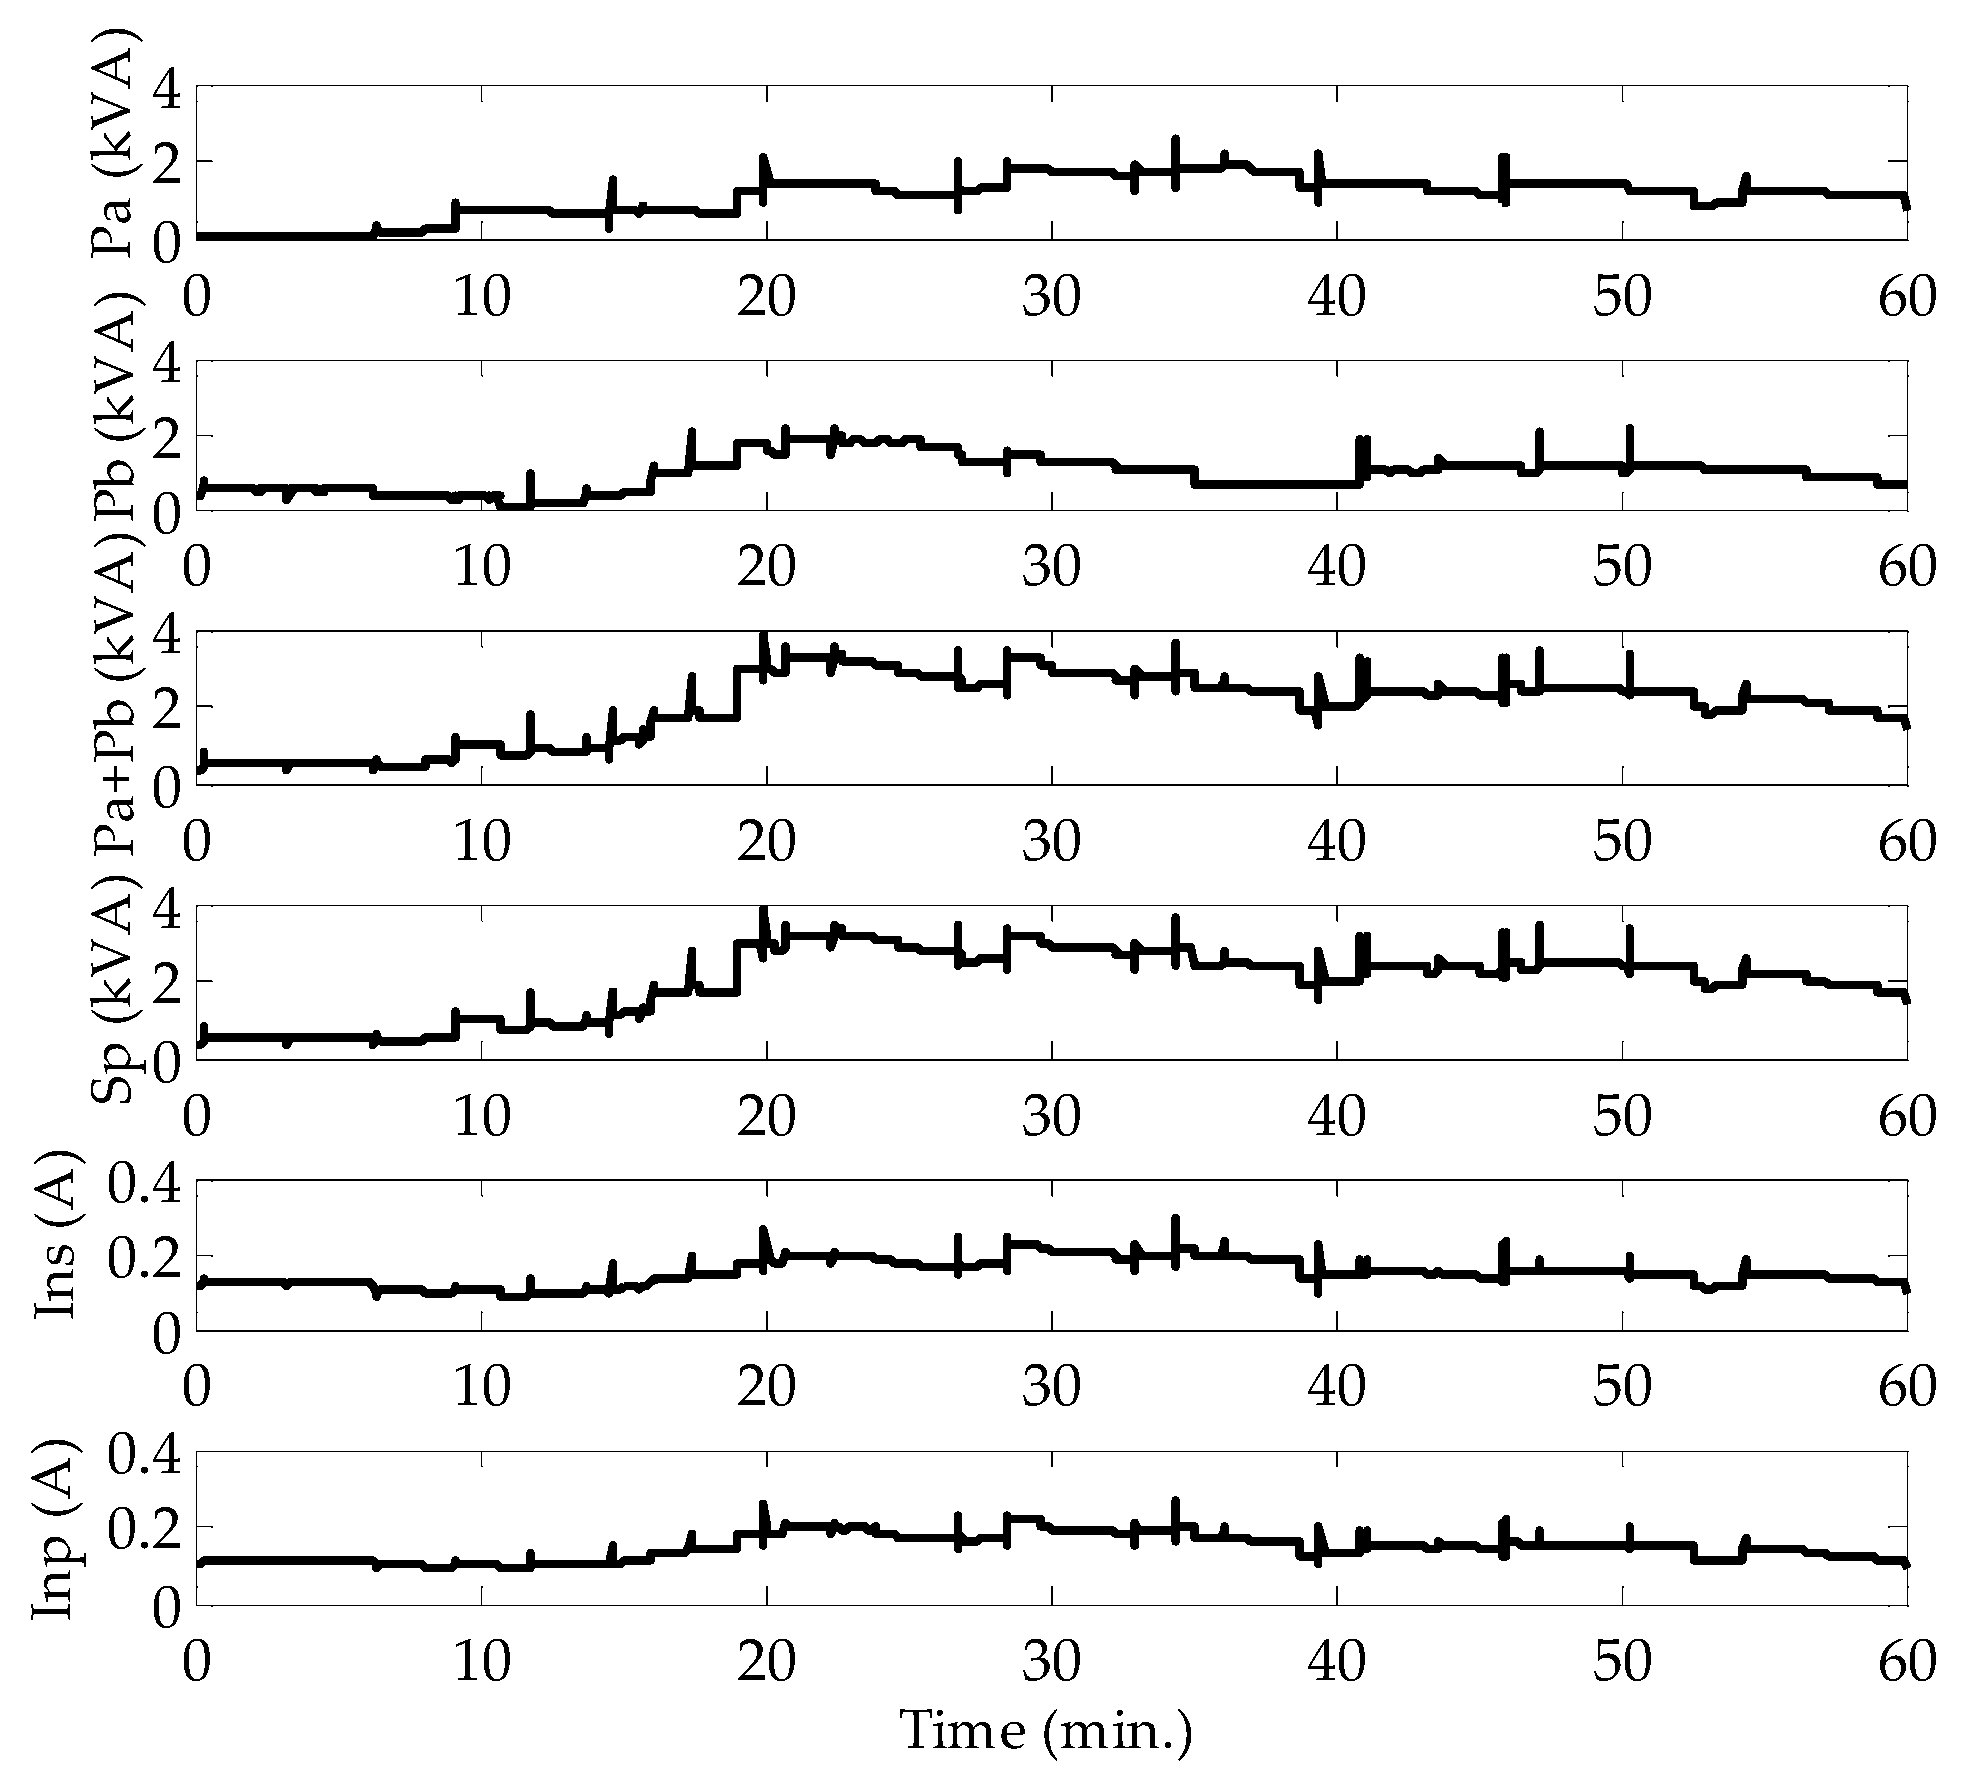
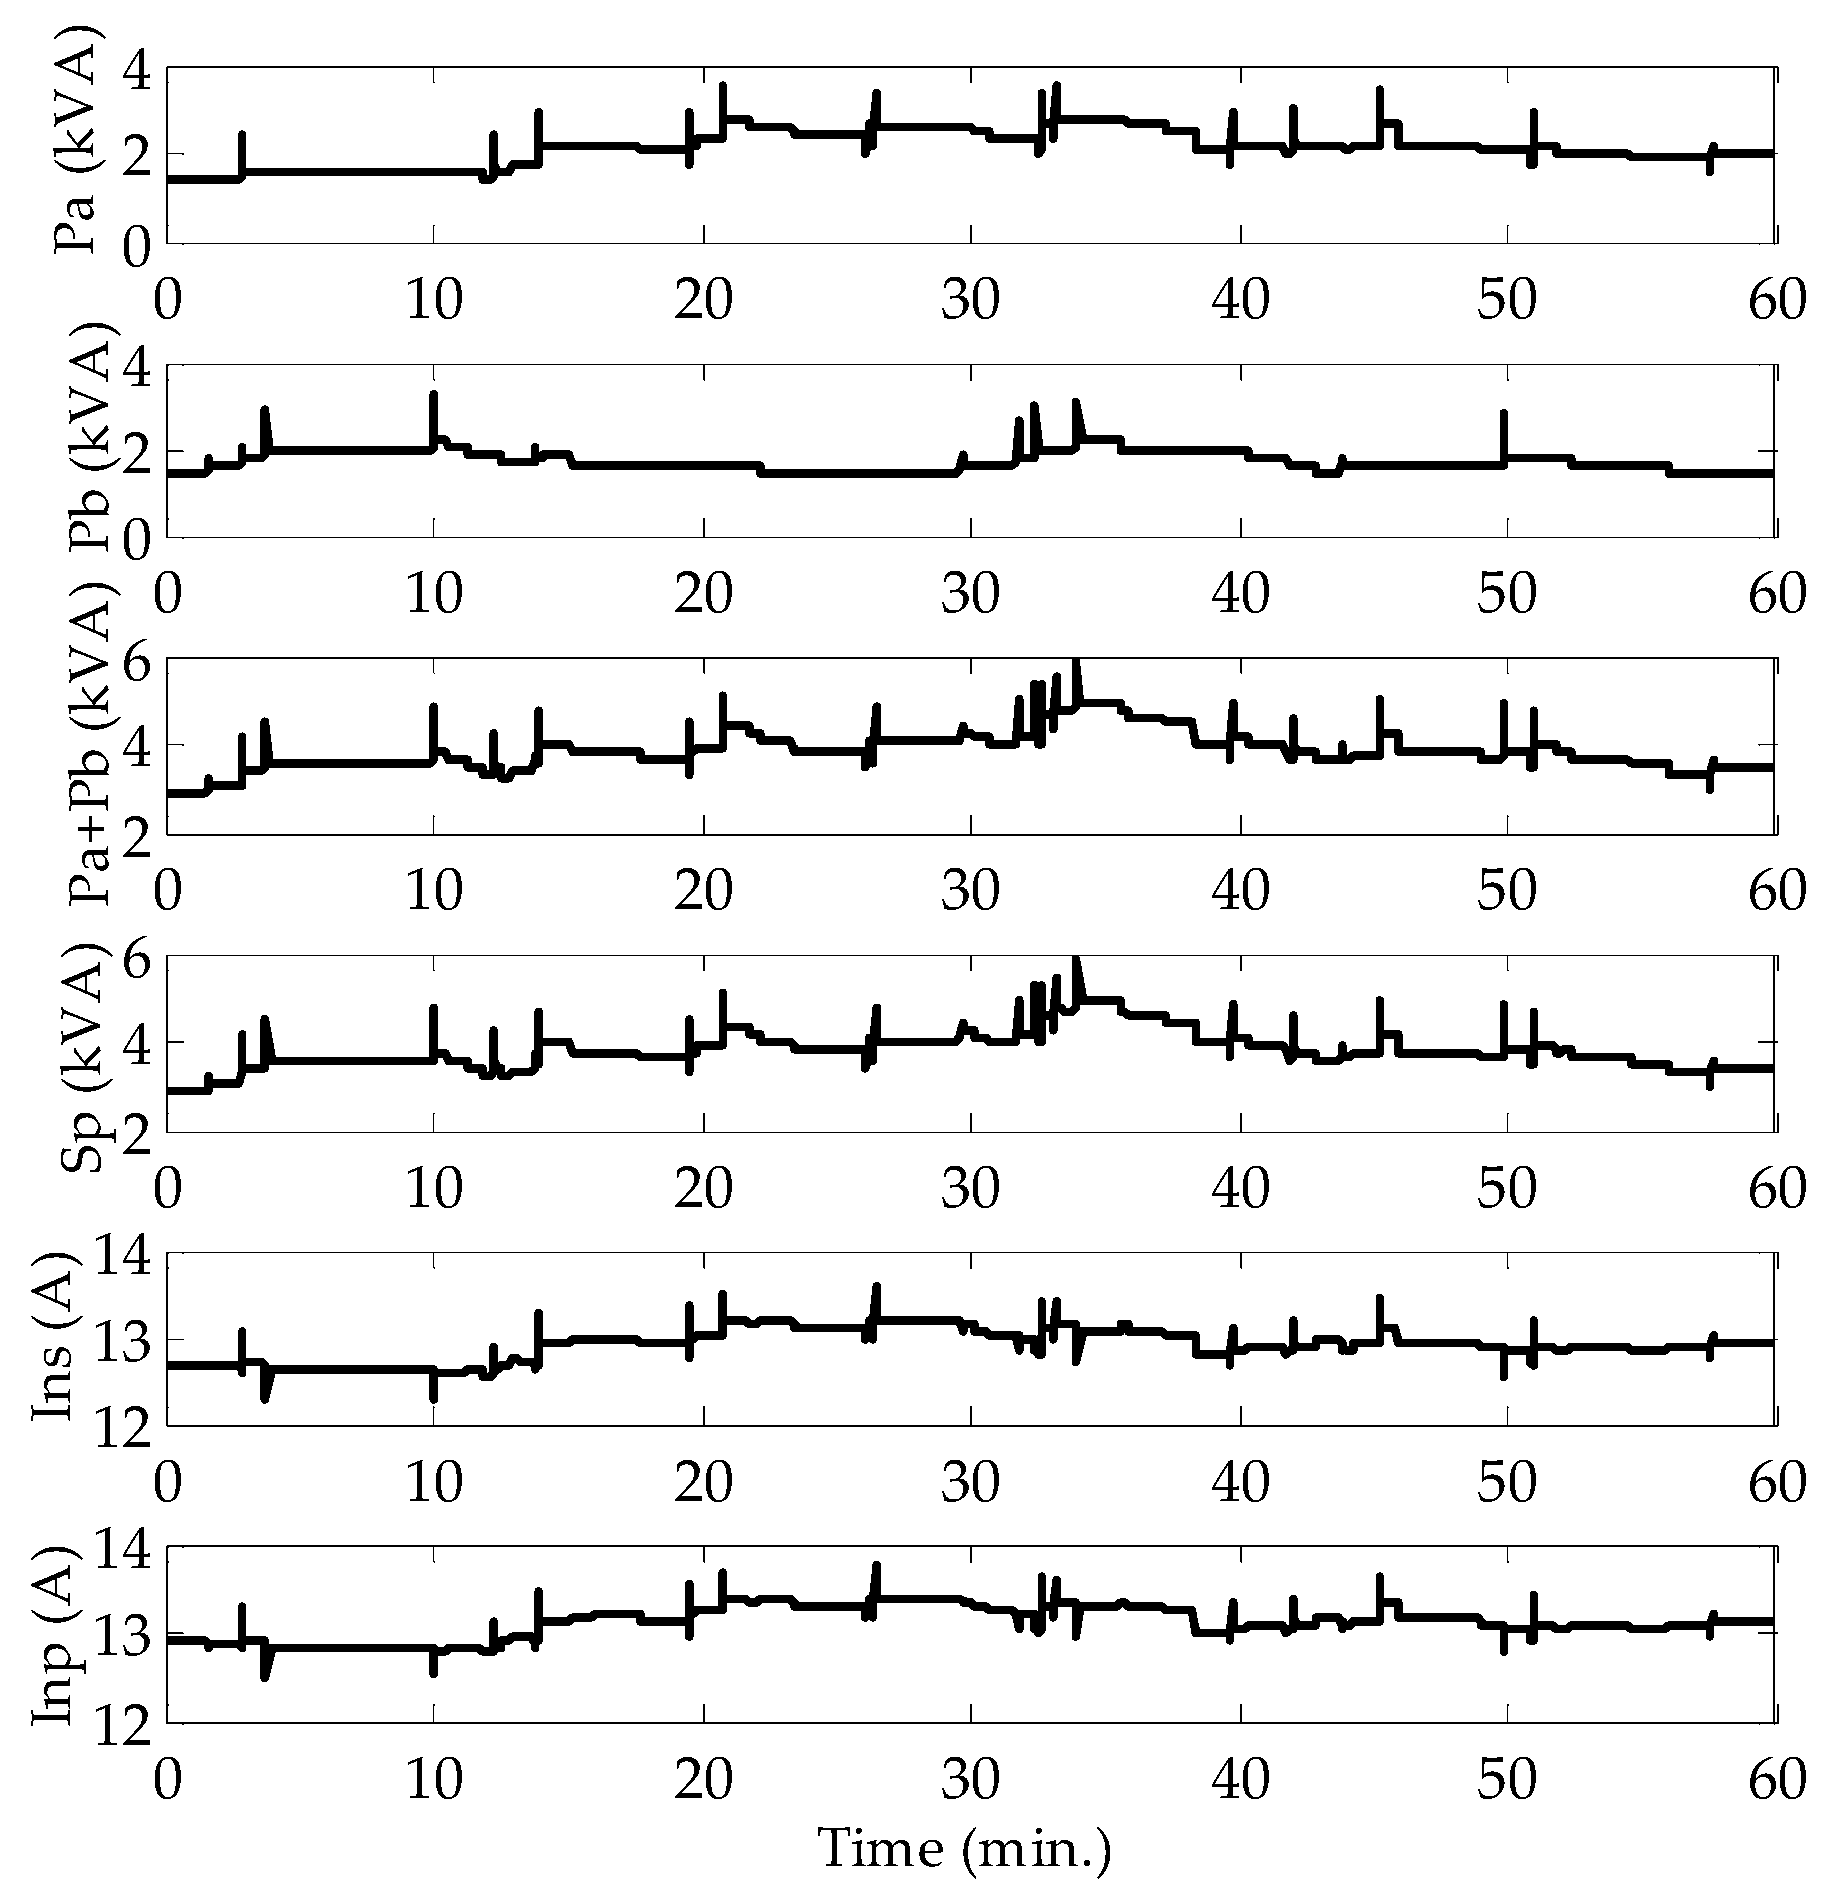
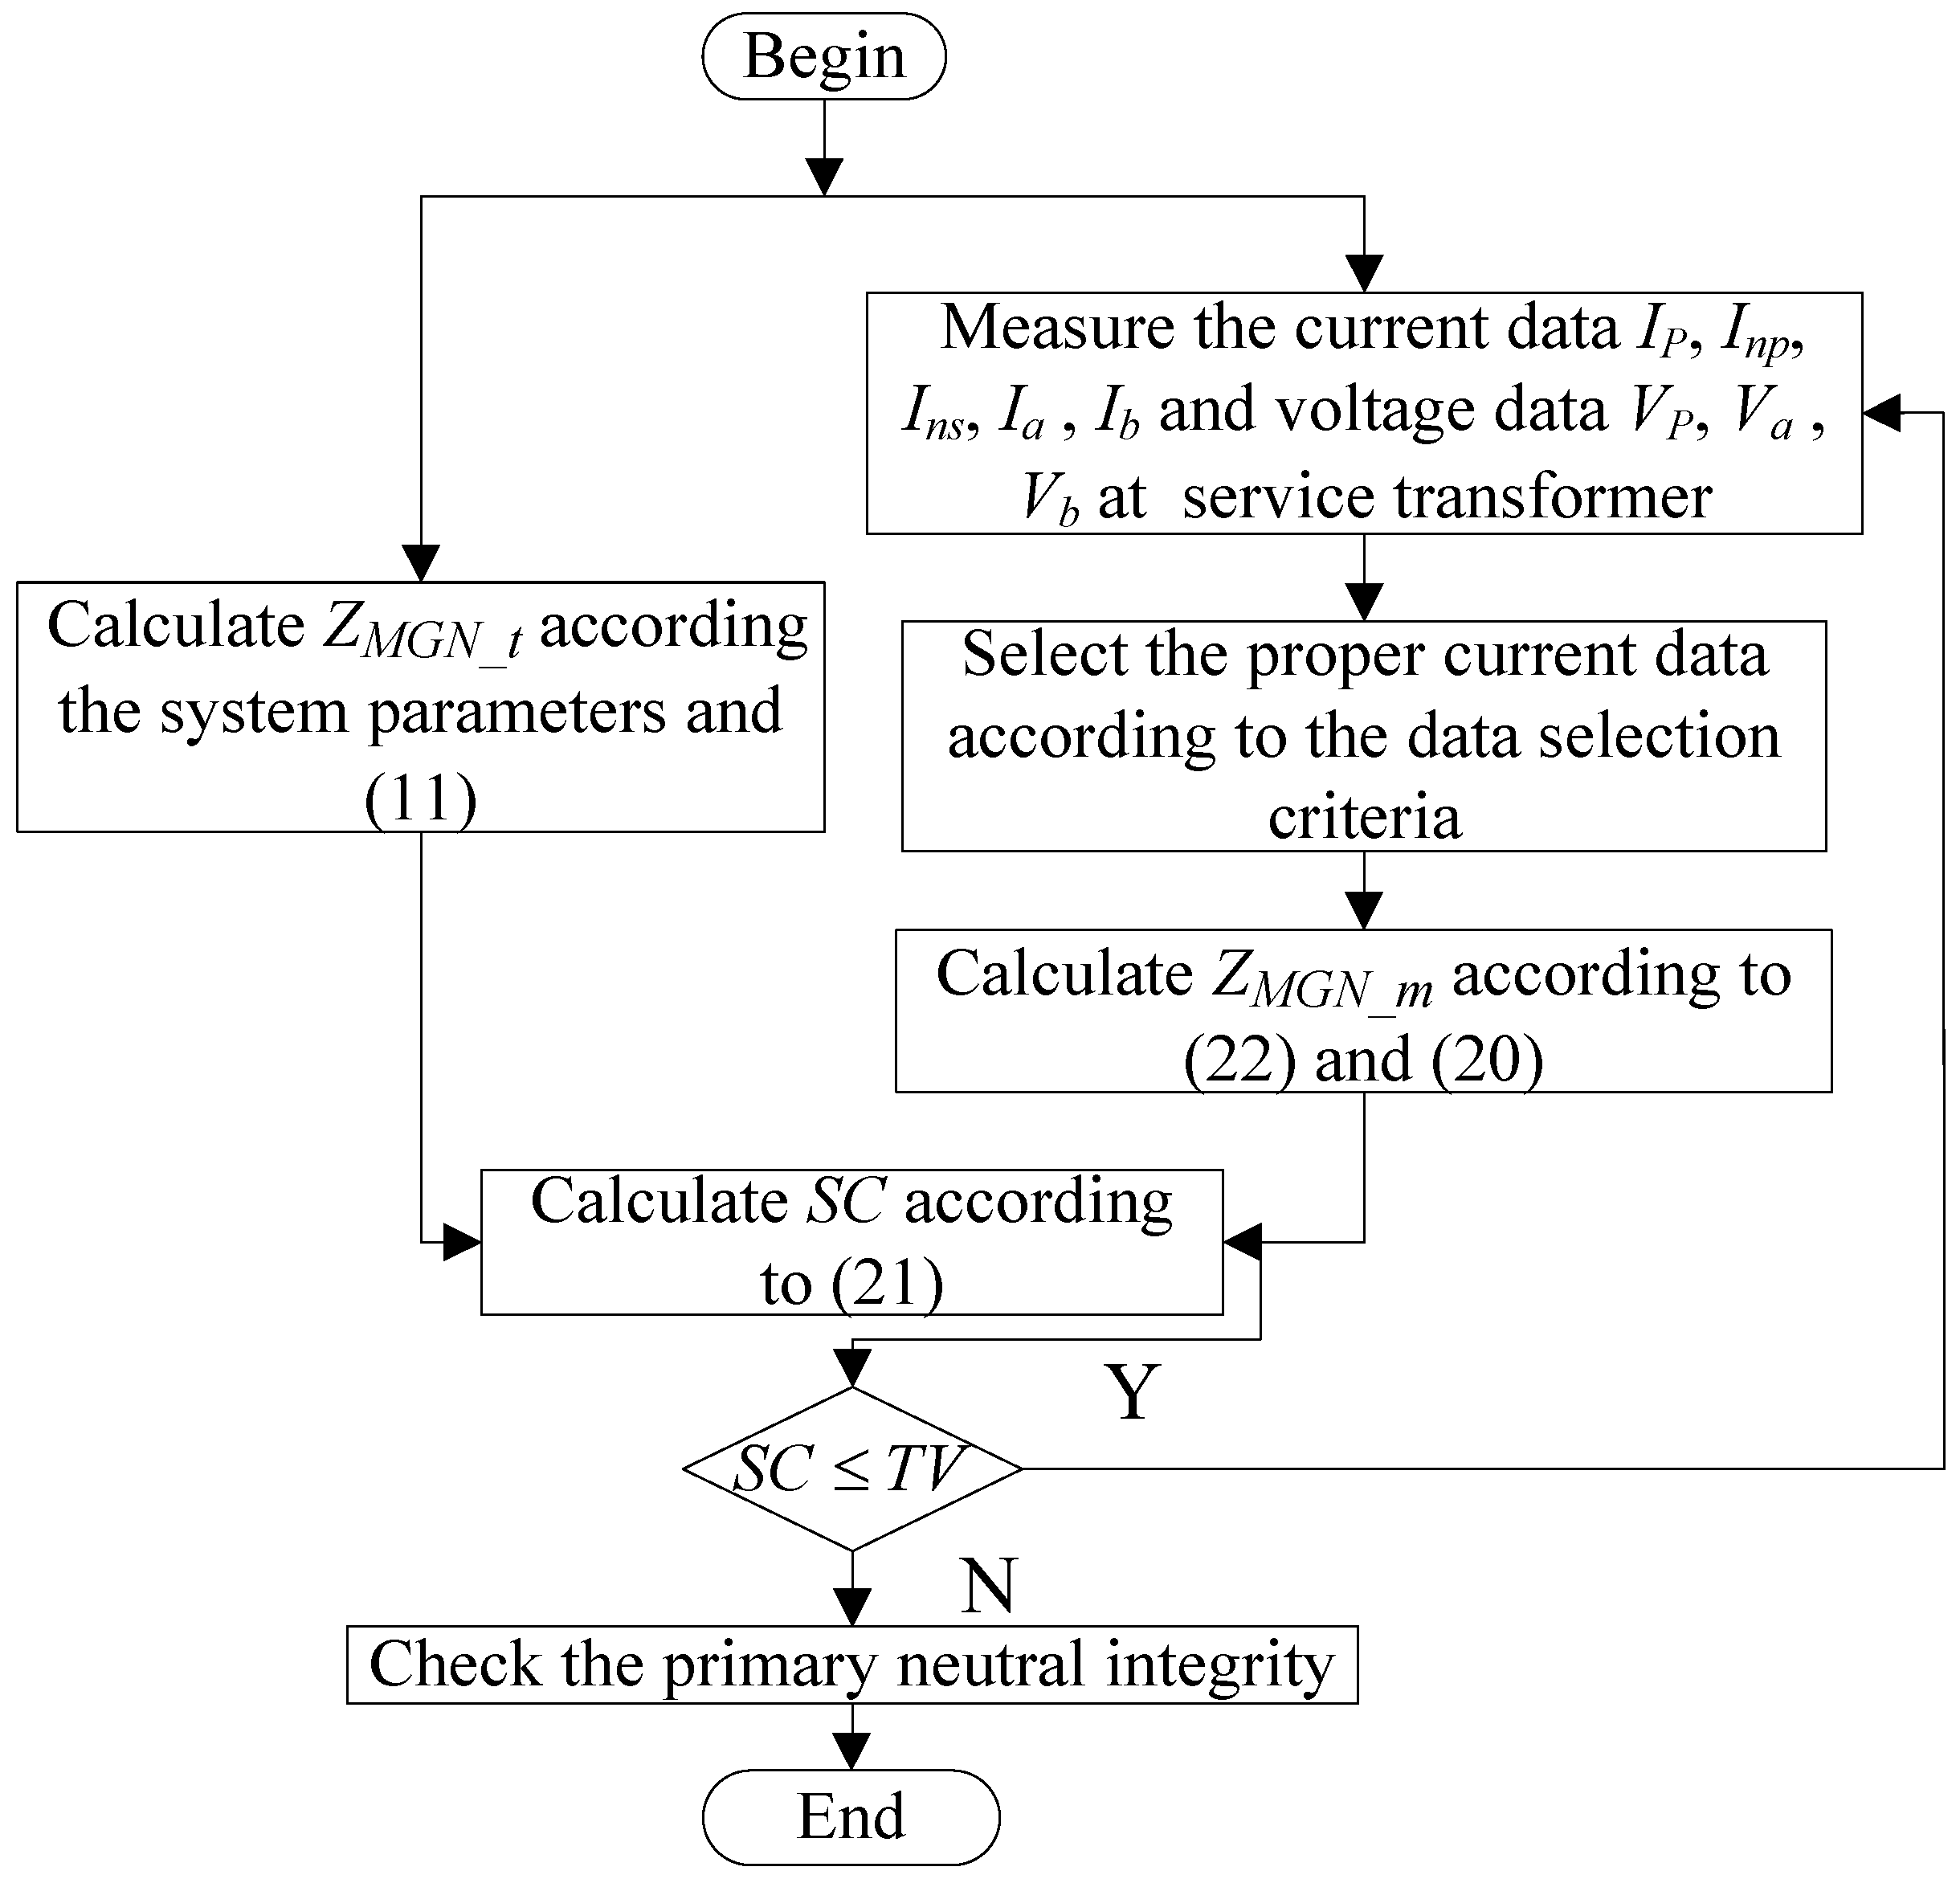
In the actual application, data acquisition devices can be installed at the service transformer, and the neutral currents Inp and Ins can be monitored continuously. Therefore, parameter g can be estimated according to Equation (19) based on the variation of the neutral current. The transformer grounding impedance can be known based on the substation data, and then ZMGN can be estimated by Equation (20).
A sensitivity coefficient SC is proposed to evaluate the discrepancy between the monitored ZMGN and theoretical ZMGN.
S C = | Z M G N _ m Z M G N _ t | | Z M G N _ t | × 100 %
where ZMGN_t is the theoretical value of ZMGN obtained from Equation (11), which represents the primary neutral impedance of a normal operating system; ZMGN_m is the monitored value of ZMGN based on Equation (20), which can reflect the actual condition of the primary neutral groundings. Under normal operating conditions, the monitored parameter ZMGN_m should equal its theoretical value ZMGN_t, and 
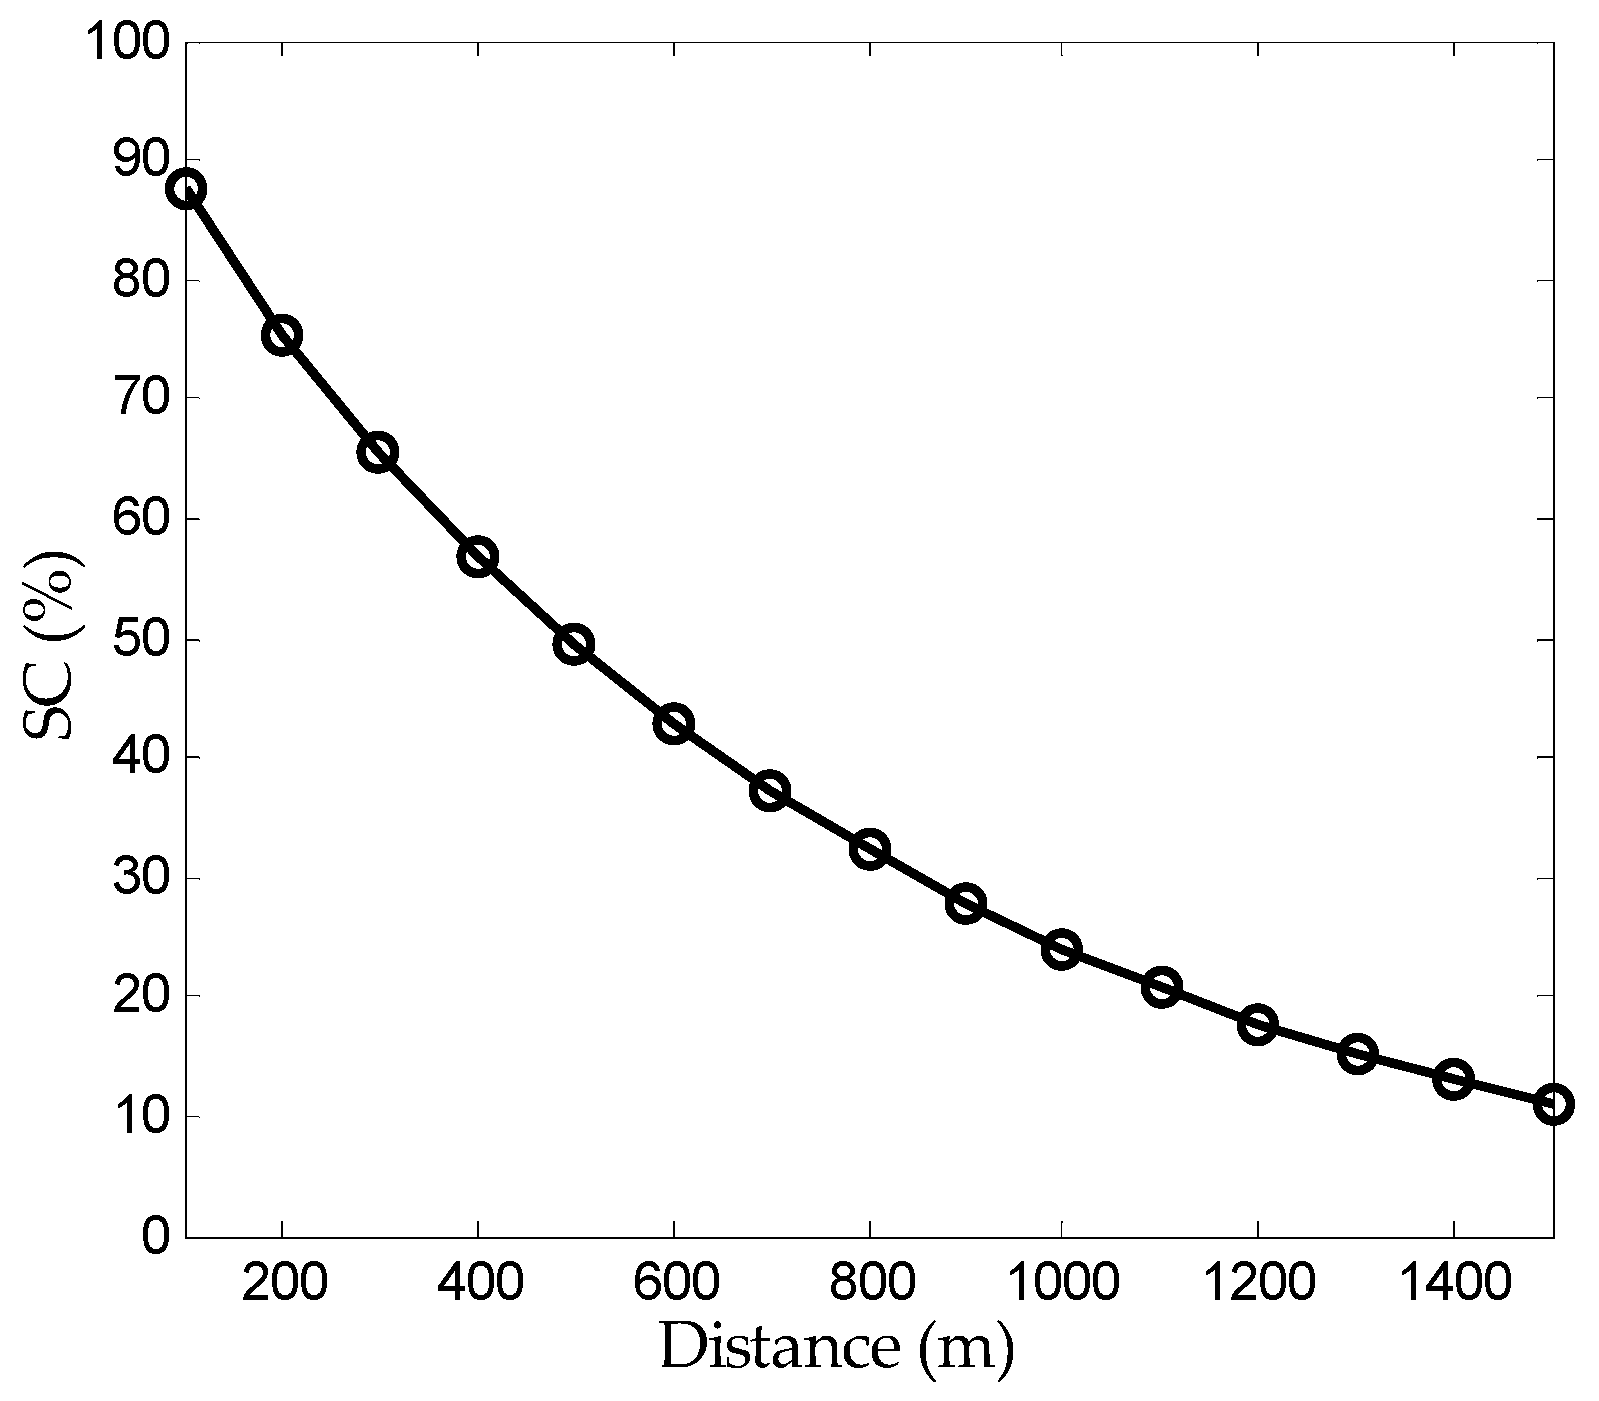
SC should be of a value nearly of zero. If there is a neutral broken problem happening at the primary side, the value of 
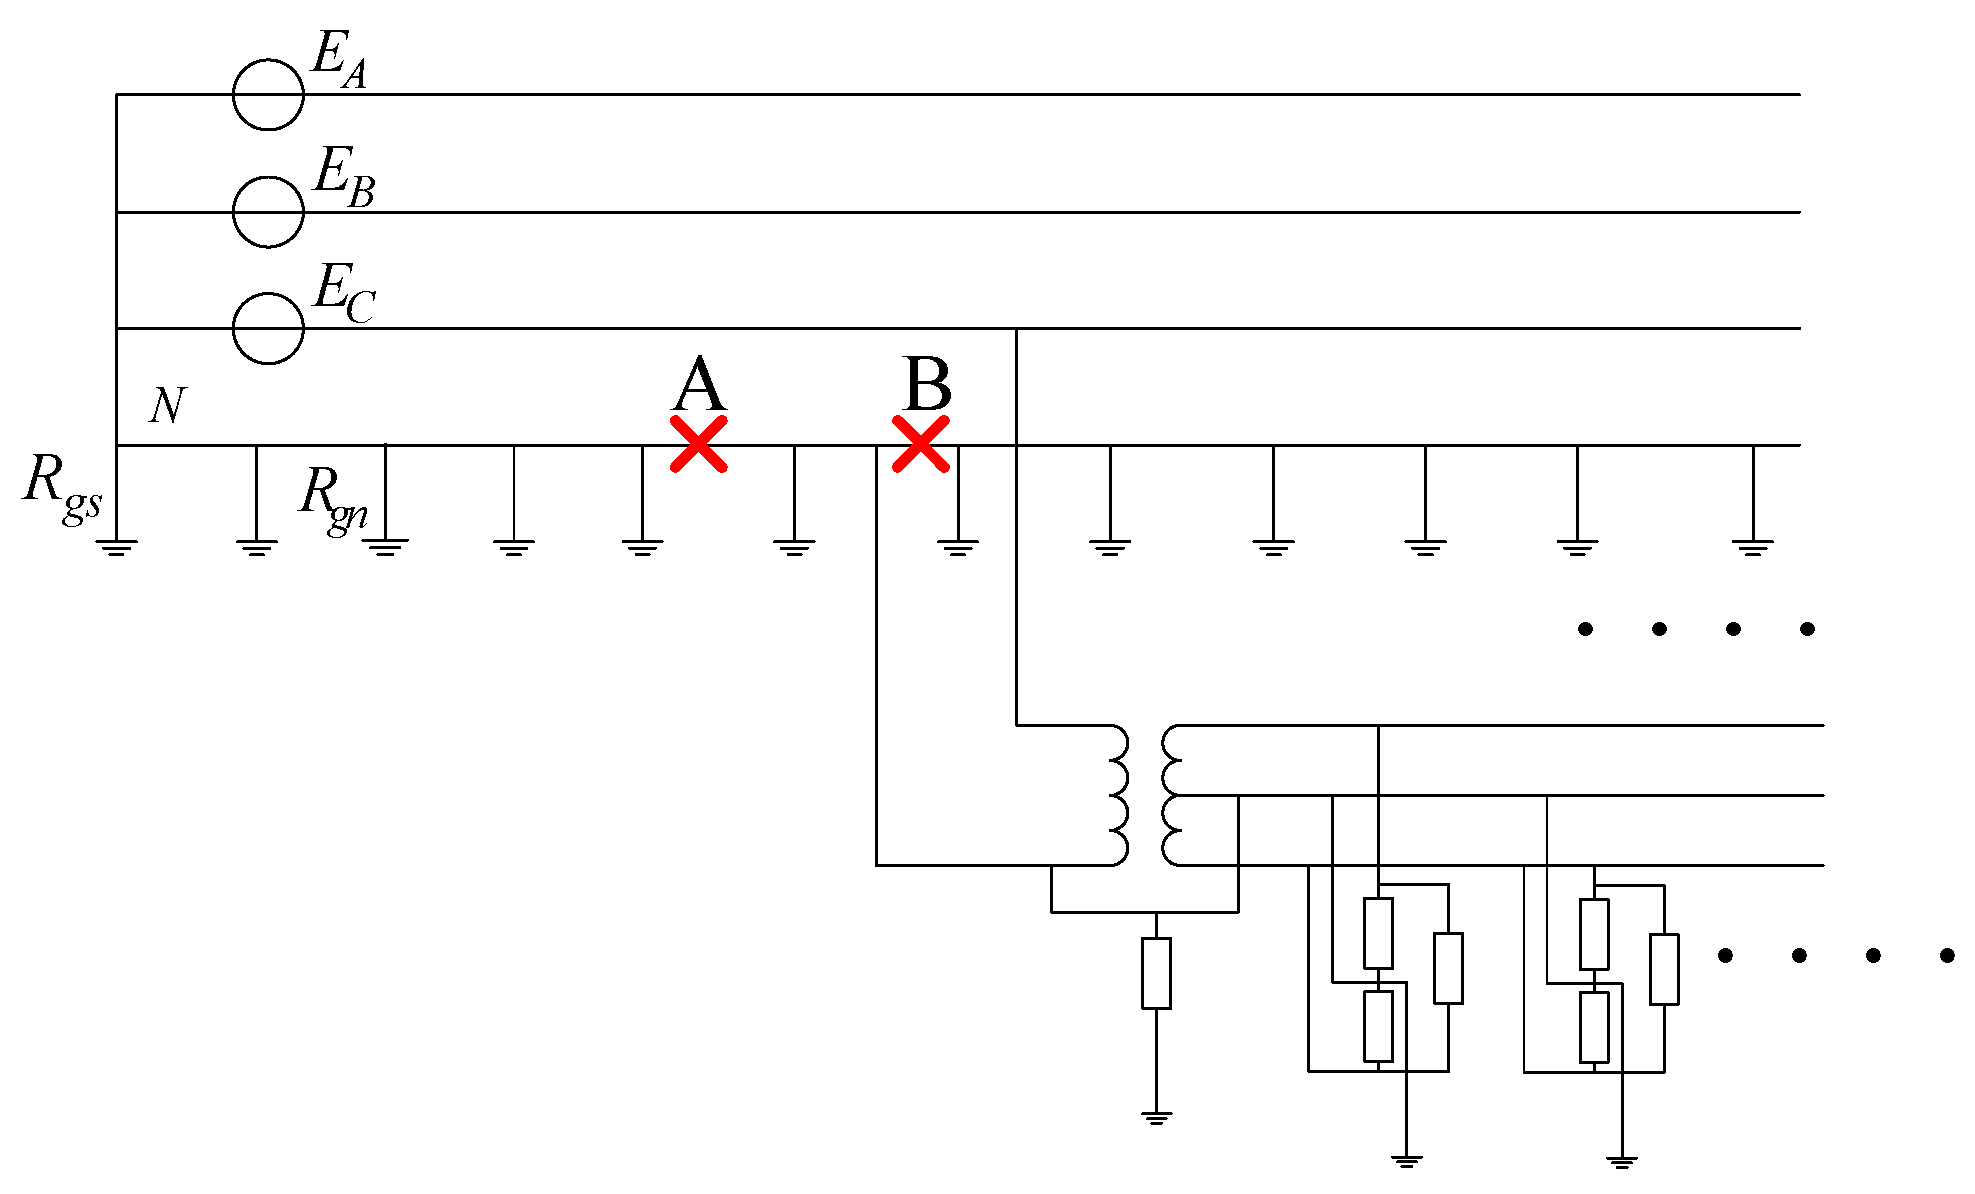
ZMGN_m will increase. Referring to Figure 1, it is known that the nearer the neutral broken point to the monitored transformer, the larger ZMGN and the larger SC. Therefore, the value of SC not only reflects the primary neutral condition, but also reflects the distance of the primary neutral broken point to the monitored service transformer.

3. Data Selection Criteria

The derivation of Equation (19) is based on the assumption that the neutral current variation is totally caused by the customer and the utility has no contribution. Actually, under most situations, the variation of neutral current is caused by both the utility and customer. Therefore, in order to use Equation (19) to estimate parameter g, the data corresponding to the variation of load should be first selected out.
Under normal operating conditions, the neutral current caused by the utility is mainly due to the unbalanced loads in the system. In order to guarantee that there is no contribution of the utility to the neutral current variation, the load at the primary side should remain constant. On the other hand, in order to select out the data that corresponds to the variation of customer load, there should be enough variation in the phase a and phase b loads of the monitored transformer. In summary, in order to select out the proper data, the following data selection criterion should be satisfied: (a) variations of the sum power consumed by customer side loads have to be small enough; therefore, the neutral current caused by the utility can be neglected; (b) the individual variations for the transformer secondary single phase power Pa and Pb should be large enough in order to guarantee that enough neutral current disturbances can be generated by the customer load. Moreover, the time interval between two consecutive sampled data should be short enough in order to further assure that the current variation caused by the primary side is small. The data that can satisfy the above criterion are selected out, and then, the time instants corresponding to these data are determined. Since the estimation of parameter g is based on the variation of neutral current in the primary and secondary neutral, the neutral current data corresponding to the above time instants are further selected out and used for the parameter estimation according to Equation (19).
In practice, many groups of neutral current ΔInp and ΔIns can be selected out according to the above data selection criterion. Assume that there are N groups of neutral current that can meet the above requirements, such as ( Δ I n s , 1 , Δ I n p , 1 ) , ( Δ I n s , 2 , Δ I n p , 2 ) , …, ( Δ I n s , i , Δ I n p , i ) , …, ( Δ I n s , N , Δ I n p , N ) . According to the least square method, parameter g can be estimated based on the selected datasets as shown in Equation (22).
g = i = 1 N ( Δ I n p , i Δ I ¯ n p ) ( Δ I n s , i Δ I ¯ n s ) i = 1 N ( Δ I n s , i Δ I ¯ n s ) 2
where subscript i indicates the i-th selected data, and Δ I ¯ n p = i = 1 N Δ I n p , i / N , Δ I ¯ n s = i = 1 N Δ I n s , i / N .
After obtaining the value of parameter g, the equivalent impedance for the primary multi-grounding ZMGN_m can be estimated, and the sensitivity coefficient SC can be determined according to Equation (21). Parameter ZMGN_m can be estimated at a certain time interval based on the continuously monitored data, and thus, the value of SC can be updated for each time period. The broken or loosened problems happening in the primary neutral line can be reflected by the variation of SC. A threshold value (TV) to evaluate the variation of SC should be set beforehand based on the parameters of the power system. If SC is less than TV, this indicates that the condition of the primary neutral system is good. Otherwise, one should check the primary neutral condition near the monitored transformer.
To summarize, the estimation flowchart of the proposed method for the monitoring of the primary neutral integrity is presented in Figure 7.

4. Simulation Verification

In this section, the validity of the proposed method is verified based on the simulation studies. There are three parts for the verification. Firstly, the validity of using the variation of neutral current to calculate parameter g is verified based on the system shown in Figure 2. Secondly, Monte Carlo simulation is set up to imitate a real distribution network that contains five residential houses. The parameters g and ZMGN are estimated, and SC is calculated based on the proposed method; and the results are compared with their theoretical values. Finally, in the third part, the broken primary neutral situations are simulated, and the proposed method is used to reflect the primary neutral condition.

4.1. Validity Verification of Parameter g

The simulation system is constructed as the equivalent circuit shown in Figure 2. The system is 60 Hz, and the capacity of the service transformer is 37.5 KVA. The rated voltage for the primary and secondary of the step-down transformer is 14.4 kV and 120 V, respectively. Other parameters of the system are listed in Table 1. The system is set up in MATLAB Simulink (The MathWorks, Natick, MA, USA).
Based on the analysis in Section 2, it is known that the value of parameter g is influenced by the primary system equivalent neutral impedance ZMGN and the transformer grounding impedance RT. In order to verify the proposed method for systems under different neutral integrity conditions, the following three scenarios are simulated.
Scenario 1:
A normal operating condition of the system with RT = 15 Ω and ZMGN = 0.4404 Ω.
Scenario 2:
A broken primary neutral condition with RT = 15 Ω and ZMGN = 7.5 Ω.
Scenario 3:
A transformer neutral broken condition with RT = 150 Ω and ZMGN = 0.4404 Ω.
The theoretical value of parameter g can be calculated according to Equation (5). Additionally, for the above three scenarios, the theoretical values of g are shown below.
Scenario 1 : g = R T R T + Z M G N = 15 15 + 0.4404 = 0.9715 Scenario 2 : g = R T R T + Z M G N = 15 15 + 7.5 = 0.6667 Scenario 3 : g = R T R T + Z M G N = 150 150 + 0.4404 = 0.9971
Under normal operating conditions, parameter g can be estimated based on the variations of neutral current Inp and Ins. Additionally, the parameter calculation should be under the assumption that the neutral current variation is caused only by the customer. Therefore, by adjusting the individual load power in the two hot wires of the customer and at the same time maintaining the total load power to be constant, many cases have been generated. Due to space limitation, the results for four cases of each scenario are shown in Table 2. Based on the variation of the neutral current, parameter g can be calculated based on Equation (19), and the estimation results of g are compared with their theoretical value.
From Figure 8, it can be seen that the value of parameter g can correctly reflect the condition of the neutral grounding system. For example, in Scenario 2, when the primary neutral is broken, ZMGN becomes larger, and the value of g should be less than its normal value. Correctly, the estimation result of g based on the variation of the neutral currents reflects this situation. In Scenario 3, when the transformer grounding is broken, RT becomes larger, and the value of g should become larger than its normal value. Again, the estimated result correctly reflects this situation. Moreover, the estimation values of parameter g for all cases nearly overlap with their theoretical values. Therefore, analysis in this section reveals that the proposed parameter g can correctly reflect the neutral condition in the MGN system, and the method to estimate g based on the variation of neutral current is valid and accurate.

4.2. Verification of the Proposed Method Based on a Typical MGN Network

A typical MGN network in North America is depicted in Figure 9. It contains a three-phase 25-kV MGN distribution system, a single-phase service transformer (14.4/0.12 kV) and five houses connected in parallel in the secondary side of the transformer. The span of primary neutral between two grounded points is 100 m [17]. The total length of the distribution line is 5 km. The distance between two houses is 20 m. Since the residential loads of each house are time-varying during a day, the Monte Carlo method is adopted to simulate this characteristic [19]. The Monte Carlo simulation is performed to provide a realistic one-hour load behavior for the studied system. Then, the proposed method can be verified based on the data provided by the Monte Carlo simulation.
Other parameters for the simulated system are listed in Table 3, where Rgs is the substation grounding resistance (less than 1 Ω), Rgn is the pole grounding resistance, Zline1 is the primary phase conductor impedance, zpn is the primary neutral conductor impedance, RT is the transformer grounding resistance, Rgc is the customer grounding resistance, Zline2 is the secondary phase conductor impedance and Zsn is the secondary neutral conductor impedance.
Under normal operating conditions, the equivalent neutral impedance for the above MGN system is estimated as follows.
Z M G N _ t = 1 2 z p n R g n = 0.5265 + j 0.3422
Therefore, the theoretical value of parameter g can be calculated according to Equation (24).
g t = R T R T + Z M G N _ t = 0.9656 j 0.0213
In the Monte Carlo simulation, the power flow of the system is calculated once every second, so there are 3600 sets of data for the one-hour simulation time period. The datasets of the transformer power are shown in Figure 10. Pa and Pb represent the phase a and phase b loads in the transformer secondary side, respectively. (Pa + Pb) is the total load in this phase of the transformer. Sp represents the total three-phase power for the whole transformer. The quantitative data selection criterion for this system is summarized as shown in Equation (25).
{ Δ ( P a + P b ) / ( P a + P b ) 1 % Δ S p / S p 1 % Δ P a / P a 3 % Δ P b / P b 3 %
Based on the proposed data selection criteria, the proper power data are selected out, and the corresponding neutral current data are determined. The result of the estimated g is shown in Figure 11 according to Equation (22). Then, according to Equation (20), ZMGN_m can be obtained, and the results of ZMGN_m and SC are shown in Table 4.
From the results, it can be seen that, under normal operating conditions, the monitored ZMGN_m matches the theoretical ZMGN_t very well, and the value of SC is very small. This means that the quantitative data selection criterion is proper and the proposed method is accurate to estimate the equivalent primary neutral impedance ZMGN under normal operating conditions.

4.3. Monitoring of the Primary Neutral Broken Condition

In order to verify the effectiveness of the proposed method to monitor the neutral condition in the primary system, two different neutral broken cases are simulated. In the first case, the primary neutrals at both sides of the transformer are broken. In the second case, only the primary neutral is broken at one side of the transformer. Moreover, monitoring of the broken transformer grounding neutral is also simulated. Furthermore, in this part, the sensitivity of parameter ZMGN to reflect the primary neutral condition is studied, and the threshold value of SC is proposed.

4.3.1. Broken Primary Neutral at Two Sides

Figure 12 shows the case that the primary neutrals are broken at both sides of the service transformer. The distance between the broken Point A and the monitored transformer is greater than 100 m and less than 200 m. The distance of broken Point B away from the service transformer is less than 100 m. Under this condition, the primary neutral system changes from a ladder network to a single point grounding system. Monte Carlo simulation is used to generate a realistic one-hour load behavior for the system. The powers and neutral currents at the transformer primary and secondary side are shown in Figure 13. The neutral current data that can meet the data selection criteria are selected out, and parameter g is estimated shown in Figure 14 according to Equation (21). The estimated value of parameter ZMGN is shown in Table 5. The theoretical value ZMGN_t under normal operating conditions can be used as a reference to check the estimated ZMGN_m value. Then, the sensitivity coefficient SC can be calculated according to Equation (21), which is an indicator that can be used to reflect the primary neutral integrity.
From Table 5, it can be seen that the value of SC reaches a very high value of 2002.1%, which is a good indicator that the primary neutral is broken near the monitored transformer.

4.3.2. Broken Primary Neutral at One Side

Figure 15 shows the condition that the primary neutral is broken at only one side of the service transformer. The distance of broken Point A is greater than 100 m and less than 200 m from the monitored transformer.
According to Equation (25), the proper neutral current data are selected out from Figure 16. The parameter g can be estimated from the selected data, and the result is shown in Figure 17. The theoretical values of ZMGN_t and SC are given in Table 6.
Based on the results shown in Table 6, it can be seen that, when the primary neutral is broken at only one side of the transformer, the estimated parameter ZMGN_m is larger than its normal value, and the sensitivity parameter SC can reach a value of 87.64%, which can correctly reflect the broken neutral condition in the primary system near this transformer. However, SC is smaller than the two-broken-point case; this is reasonable since the neutral broken at two sides of the transformer is more serious than the neutral broken at only one side of the transformer. By changing the distances between the neutral broken point and the service transformer, the relationship between the broken distance and parameter SC is analyzed, whose results are shown in Figure 18. Additionally, from the results, it can be seen that, when the broken neutral is close to the transformer, SC is large. As the distance between the broken neutral and the transformer increases, SC becomes smaller. This is reasonable since the sensitivity of SC will get lower for the broken neutral happening far away from the monitored transformer.
Based on the analysis results, the threshold value of SC is suggested to be 10%, which also means that the monitoring distance of one service transformer is about 1500 m. Additionally, if the distance between two adjacent transformers is less than 3000 m, the primary neutral condition between these two transformers can be under good monitoring.

4.3.3. Broken Transformer Grounding

The proposed method can also be used to monitor the condition of the transformer grounding. Theoretically, if the transformer grounding is broken, the transformer grounding resistance will significantly increase compared with the normal situation. Therefore, based on Equation (5), it is known that the value of parameter g should increase. Thus, by comparing the value of estimated g and theoretical g, the neutral condition of the monitored transformer can be directly determined.
In this part, the situation of broken transformer grounding is simulated by setting the transformer neutral resistance to 150 ohms. Figure 19 shows the variation of transformer secondary and primary powers. Additionally, proper data can be selected out to calculate parameter g from Figure 19. The results of the estimated g based on the LSM method is g = 0.9880 − j0.0025.
Therefore, the value of parameter g has increased compared with its normal value, as shown in Equation (24) (g = 0.9656 − j0.0213). Therefore, the result indicates that there is a broken problem in the transformer grounding.

5. Conclusions

A new method to monitor the integrity of the primary neutral in an MGN system is proposed in this paper. The method is based on the measurement data at the service transformer. Therefore, it does not need any signal generator and causes no disturbance to the utility and customer. The equivalent impedance for the primary neutral can be estimated based on the monitored neutral currents at the service transformer. By comparing the calculated value of the primary neutral impedance with its theoretical value under normal conditions, the integrity of the multiple grounding neutral in the primary side can be reflected. The method is verified based on an MGN distribution system using the Monte Carlo simulation. From the simulation results, it can be concluded that the proposed parameter can correctly detect the existence of a broken neutral in the primary system. Moreover, the method can also be used to reflect the broken condition in the transformer grounding.

Acknowledgments

This work was supported by the National Natural Science Foundation of China (51577108) and Young Scholars Program Shandong University (2016WLJH07). The authors appreciate Wilsun Xu at the University of Alberta for the discussion about this work.

Author Contributions

Yuanyuan Sun and Xun Long proposed the main idea of the method. Xiangmin Xie and Yuanyuan Sun established the model and validated the proposed method, including conducting the simulation study, doing the sensitivity analysis and writing the paper. Bingwei Zhang has actively contributed to finalizing the manuscript.

Conflicts of Interest

The authors declare no conflict of interest.

References

  1. Chen, T.H.; Yang, W.C. Analysis of multi-grounded four-wire distribution systems considering the neutral grounding. IEEE Trans. Power Deliv. 2001, 16, 710–717. [Google Scholar] [CrossRef]
  2. Parise, G.; Martirano, L.; Parise, L. Ecodesign of ever net-load microgrids. IEEE Trans. Ind. Appl. 2014, 50, 10–16. [Google Scholar] [CrossRef]
  3. Bouford, J.D. The utility’s perspective on calculating stray voltage. In Proceedings of the 2008 General Meeting of the IEEE-Power-and-Energy-Society, Pittsburgh, PA, USA, 20–24 July 2008; pp. 1–3.
  4. Dorr, D.; McGranaghan, M.; Perry, C. Standardized measurements for elevated NEV concerns. In Proceedings of the IEEE/PES Transmission and Distribution Conference and Exhibition, Dallas, TX, USA, 21–26 May 2006; pp. 268–271.
  5. Mitolo, M. Of electrical distribution systems with multiple grounded neutrals. IEEE Trans. Ind. Appl. 2010, 46, 1541–1546. [Google Scholar] [CrossRef]
  6. Burke, J.; Marshal, M. Distribution system neutral grounding. In Proceedings of the 16th IEEE PES Transmission and Distribution Conference and Exposition, Atlanta, GA, USA, 28 October–2 November 2001; pp. 166–170.
  7. Agudelo, L.; Ortiz, R.H.; Montoya, M.; Zapata, W.H.; Cardenas, C.; Echeverri, J.C.; Moreno, G. Transferred voltages in multigrounded systems. In Proceedings of the IEEE PES Transmission and Distribution Conference and Exposition-Latin America, Bogota, Colombia, 13–15 August 2008; pp. 1–5.
  8. Ciric, R.M.; Ochoa, L.F.; Padilla-Feltrin, A.; Nouri, H. Fault analysis in four-wire distribution networks. IEE Proc. Gener. Transm. Distrib. 2005, 152, 977–982. [Google Scholar] [CrossRef]
  9. Alam, M.J.E.; Muttaqi, K.M.; Sutanto, D. A three-phase power flow approach for integrated 3-wire MV and 4-wire multi-grounded LV networks with rooftop solar PV. IEEE Trans. Power Syst. 2013, 28, 1728–1737. [Google Scholar] [CrossRef]
  10. Ciric, R.M.; Feltrin, A.P.; Ochoa, L.F. Power flow in four-wire distribution networks—General approach. IEEE Trans. Power Syst. 2003, 18, 1283–1290. [Google Scholar] [CrossRef]
  11. Halevidis, C.; Koufakis, E. Power flow in PME distribution systems during an open neutral condition. IEEE Trans. Power Syst. 2013, 28, 1083–1092. [Google Scholar] [CrossRef]
  12. Choi, J.; Ahn, Y.; Ryu, H.; Jung, G.; Han, B.; Kim, K. A new method of grounding performance evaluation of multigrounded power systems by ground current measurement. In Proceedings of the International Conference on Power System Technology (POWERCON 2004), Singapore, 21–24 November 2004; pp. 1144–1146.
  13. Gustafson, R.; Pursley, R.; Albertson, V. Seasonal grounding resistance variations on distribution systems. IEEE Trans. Power Deliv. 1990, 5, 1013–1018. [Google Scholar] [CrossRef]
  14. Long, X.; Dong, M.; Xu, W.; Li, Y.W. Online monitoring of substation grounding grid conditions using touch and step voltage sensors. IEEE Trans. Smart Grid 2012, 3, 761–769. [Google Scholar] [CrossRef]
  15. Sunderman, W.G.; Dugan, R.; Dorr, D. The neutral-to-earth voltage (NEV) test case and distribution system analysis. In Proceedings of the 2008 General Meeting of the IEEE-Power-and-Energy-Society, Pittsburgh, PA, USA, 20–24 July 2008; pp. 1–7.
  16. Long, X. Distribution System Condition Monitoring Using Active Disturbances. Ph.D. Thesis, University of Alberta, Edmonton, AB, Canada, 2013. [Google Scholar]
  17. IEEE Standard. National Electrical Safety Code C2-2012; Institute of Electrical and Electronics Engineers: New York, NY, USA, 2012. [Google Scholar]
  18. Acharya, J.R.; Wang, Y.; Xu, W. Temporary overvoltage and GPR characteristics of distribution feeders with multi-grounded neutral. IEEE Trans. Power Deliv. 2010, 25, 1036–1044. [Google Scholar] [CrossRef]
  19. Torquato, R.; Shi, Q.; Xu, W.; Freitas, W. A Monte Carlo simulation platform for studying low voltage residential networks. IEEE Trans. Smart Grid 2014, 5, 2766–2776. [Google Scholar] [CrossRef]
Figure 1. The single line diagram of the three-phase four-wire multi-grounded neutral system.
Energies 10 00380 g001
Figure 2. The equivalent analysis circuit for the multi-grounded neutral (MGN) system.
Energies 10 00380 g002
Figure 3. The equivalent analysis circuit for the unbalanced current totally caused by the customer.
Energies 10 00380 g003
Figure 4. The equivalent circuit of multi-grounding neutral ladder network.
Energies 10 00380 g004
Figure 5. The system equivalent impedance versus the neutral line length.
Energies 10 00380 g005
Figure 6. Estimation of ZMGN under normal operating conditions.
Energies 10 00380 g006
Figure 7. Flowchart of the proposed method for monitoring the primary neutral integrity.
Energies 10 00380 g007
Figure 8. Results comparison for parameter g under three different scenarios.
Energies 10 00380 g008
Figure 9. Single-line circuit for the typical MGN system.
Energies 10 00380 g009
Figure 10. The powers and neutral currents of the transformer under normal operating conditions.
Energies 10 00380 g010
Figure 11. Results of the estimated g based on LSM.
Energies 10 00380 g011
Figure 12. Two broken neutral points at both sides of the monitored service transformer.
Energies 10 00380 g012
Figure 13. The powers and neutral currents of the transformer for the two-side broken neutral condition.
Energies 10 00380 g013
Figure 14. Results of the estimated g based on LSM (two broken points).
Energies 10 00380 g014
Figure 15. One broken neutral point near the monitored service transformer.
Energies 10 00380 g015
Figure 16. The powers and neutral currents of the transformer for the single-point neutral-broken condition.
Energies 10 00380 g016
Figure 17. Results of the estimated g based on LSM (single broken point).
Energies 10 00380 g017
Figure 18. The relationship between the broken point distance and parameter SC.
Energies 10 00380 g018
Figure 19. The secondary and primary side power for the transformer.
Energies 10 00380 g019
Table 1. Equivalent circuit parameters for the studied system.
#ParametersValues
Primary SystemZS (Ω)0.00249
ZMGN (Ω)0.4404
RT (Ω)15
Secondary SystemRgc (Ω)1.0000
Zsn, Zsp (Ω)0.0498, 0.0249
Zan, Zbn, Zab (Ω)20, 12, 10
Table 2. Simulation data for the estimation of parameter g in three different scenarios.
#ParametersCase 1Case 2Case 3Case 4
Equivalent customer loadsZan (Ω)17181920
Zbn (Ω)13.412.912.412
Zab (Ω)10101010
Scenario 1Ins (A)0.062770.087250.11130.1324
Inp (A)0.060980.084760.10810.1286
Scenario 2Ins (A)0.015330.021310.027170.03233
Inp (A)0.010220.014200.018120.02156
Scenario 3Ins (A)0.062300.086590.11040.1314
Inp (A)0.062120.086330.11010.1310
Table 3. System parameters of the Monte Carlo simulation.
ParameterValue
Rgs (Ω)0.15
Rgn (Ω)15
Zline1 (Ω/km)0.2494 + 0.8782
zpn (Ω)0.04271 + j0.09609
RT (Ω)15
Rgc (Ω)1
Zline2 (Ω/km)0.2028 + j0.0936
Zsn (Ω/km)0.5500 + j0.3650
Table 4. Estimation results of ZMGN_m and SC.
ParameterValue
ZMGN_m (Ω)0.5227 + j0.3616
ZMGN_t (Ω)0.5265 + j0.3422
SC (%)3.15%
Table 5. Estimation results of ZMGN_m and SC.
ParameterValue
ZMGN_m (Ω)13.0590 + j0.6512
ZMGN_t (Ω)0.5265 + j0.3422
SC (%)2002.1%
Table 6. Estimation results of ZMGN_m and SC.
ParameterValue
ZMGN_m (Ω)1.0216 + j0.5826
ZMGN_t (Ω)0.5265 + j0.3422
SC (%)87.64%

