Article

Spatial Heterogeneity of Energy-Related CO2 Emission Growth Rates around the World and Their Determinants during 1990–2014

1
Institute of Geographic Sciences and Natural Resources Research, Chinese Academy of Sciences, Beijing 100101, China
2
University of Chinese Academy of Sciences, Beijing 100049, China
3
College of Territorial Resources and Tourism, Anhui Normal University, Wuhu 241003, China
4
The CAE Center for Strategic Studies, Chinese Academy of Engineering, Beijing 100088, China
5
Department of Chemical Engineering, Tsinghua University, Beijing 100084, China
*
Author to whom correspondence should be addressed.
Energies 2017, 10(3), 367; https://doi.org/10.3390/en10030367
Submission received: 31 December 2016 / Revised: 24 February 2017 / Accepted: 11 March 2017 / Published: 15 March 2017
(This article belongs to the Special Issue Energy Policy and Climate Change 2016)

Abstract

:
Understanding the spatial heterogeneity and driving force identification of energy-related CO2 emissions (ECEs) can help build consensus for mitigating CO2 emissions and designing appropriate policies. However, previous studies on ECEs that focus on both the global-regional scale and the interaction of factors have been seldom conducted. In this paper, ECE data from 143 countries from 1990 to 2014 were selected to analyze regional differences in ECE growth rates by using the coefficient of variation. Then a geographical detector was used to analyze the key determinant factors on ECE growth rates around the world and in eight types of regions. The results show that: (1) the ECE growth rate in the Organization for Economic Cooperation and Development (OECD) region is low and tended to decrease, while in the non-OECD region it is high and tended to increase; (2) the coefficient of variation and detection factor of ECE growth rates at a regional scale are higher than those at a global scale; (3) in terms of the key determinant factors, population growth rate, growth rate of per capita GDP, and energy intensity growth rate are the three key determinant factors of ECE growth rates in the OECD region and most of the non-OECD regions such as non-OECD European and Eurasian (NO-EE), Asia (NO-AS), non-OECD Americas (NO-AM). The key determinant factors in the African (NO-AF) region are population growth rates and natural gas carbon intensity growth rates. The key determinant factors of the Middle East (NO-ME) are population growth rate, coal carbon intensity growth rate and per capita GDP growth rate; (4) the determinant power of the detection factor, the population growth rate at the global scale and regional scale is the strongest, showing a significant spatial consistency. The determinant power of per capita GDP growth rate and energy intensity growth rate in the OECD region, respectively, rank second and third, also showing a spatial consistency. However, the carbon intensity growth rates of the three fossil fuels contribute little to the growth rate of ECEs, and their spatial coherence is weak; (5) from the perspective of the interaction of detection factors, six detection factors showed bilinear or non-linear enhancement at a global and a regional scale, and the determinant power of the interaction of factors was significantly enhanced; and (6) from the perspective of ecological detection, the growth rate of carbon intensity and the growth rate of natural gas carbon intensity at the global scale and NO-ME region are significantly stronger than other factors, with a significant difference in the spatial distribution of its incidence. Therefore, the OECD region should continue to reduce the growth of energy intensity, and develop alternative energy resources in the future, while those that are plagued by carbon emissions in non-OECD regions should pay more attention to the positive influence of lower population growth rates on reducing the growth rate of energy-related CO2 emissions. Reducing energy intensity growth rates and reducing, fossil energy consumption carbon intensity.

1. Introduction

In 2014, fossil energy accounted for 82% of the global energy use as the main contributor to global energy consumption [1]. Energy-related CO2 emissions are one of the research hotspots in the field of climate change [2]. According to the International Energy Agency (IEA), the global annual average growth rate of energy-related CO2 emissions fell from 1.96% in 1990–2010 to 1.60% in 2010–2014, but continued to grow at an average annual rate of 1.9% during the 1990–2014 period [1]. There is a significant difference in the average annual growth rate of energy-related CO2 emissions in each region, such as Asia (NO-AS) (5.83%) with the highest average annual growth rate from 1990 to 2014, while the lowest is non-OECD European and Eurasian (NO-EE) (−1.97%).
Energy-related CO2 emissions are currently being studied in two major ways: (1) identifying the driving forces for energy-related CO2 emissions, which is critical for regions and countries to design carbon emission reduction policies [3]. Economic development is considered to be one of the key determinant factors affecting carbon emissions, but decoupling studies show that their relationship needs to consider them in different regions and different stages of development [4]. Later, the introduction of Structural Decomposition Analysis (SDA) and Index Decomposition Analysis (IDA) decomposition methods overcame the limitations of previous studies [5,6,7]. The Kaya formula has become one of the main analytical frameworks for studying the changing characteristics of CO2 emissions and their influencing factors [8]. Population, energy intensity, affluence and energy carbon intensity are the key determinant factors [9]. On the basis on the Kaya formula, subsequent research on drivers in structure, size, technology and other directions continues to expand and enrich. However, literature on whether these driving forces of CO2 emissions (ECEs) play an independent role interact is still scarce; (2) spatial heterogeneity analysis on ECEs mostly in China, the United States, the former Soviet Union, the European Union, ASEAN (Association of Southeast Asian Nations) and other typical countries and regions [2,10,11,12,13]. Studies in 33 countries have shown that reducing energy intensity and improving energy efficiency are critical to reducing CO2 emissions in fast developing countries such as China and India [11,14,15]. Increasing energy productivity in the industrial sector contributed most to carbon reduction in China (72%) in 2013, followed by households [3]. However, some studies have suggested that technological progress has less contribution to CO2 emissions in developing countries, such as China, compared to population growth and income levels [16]. Technological innovation and energy structure transition are important factors in reducing carbon emissions in Europe [17]. In addition, studies have also focused on changes in the main drivers of the same region or country over time. Such as the seasonal differences in carbon emissions from fossil fuels in North America [12,13]. The increase in carbon emissions in the United States in 1997–2007 was mainly driven by economic growth, with lower emissions after 2007 mainly due to economic recession and substitution of natural gas for coal [12]. During the period of economic growth in the former Soviet Union, the increase in wealth was partially offset by a reduction in energy intensity, which was mainly due to a decline in wealth and a reduction in the share of fossil energy use [18]. Growth of CO2 emissions in Beijing during the period from 1997 to 2010 is mainly due to changes in industrial structure and population growth [19]. The short-term causal relationship of CO2 emissions in the G20 region is discussed in [20]. In addition, the study also extends to specific sectors such as lifestyles and consumption patterns [16], urbanization [20], international trade [21], industrial sector, power generation [22], and the transportation industry [20,23], which has greatly enriched the content of ECE research through extensive empirical and comparative studies within and among countries and broadened the research horizons. In addition, literatures have considered the following aspects: lifestyles and consumption patterns [16], urbanization [20], international trade [21] or industrial sectors [23], electricity production [22], transportation [20,23] and so on, which have greatly enriched ECE studies. However, the literature has mainly focused on a few typical countries and regions, and there is a lack of comparisons of spatial heterogeneity in many regions and countries at the global scale over a long period of time, and a lack of cognition from macro-view and comparisons of the contribution of driving forces to ECEs in the same time and space. In recent years, some studies have paid more and more attention to the study of ECE estimation, prediction and policy evaluation in some regions and countries [24,25,26,27,28].
There are mainly two decomposition approaches for exploring the impact factors on CO2 emissions, one is the structural decomposition based on input-output methods, such as SDA and Data Envelopment Analysis (DEA) [11,29], and the other is based on index decomposition approaches, such as IDA and Logarithmic Mean Divisia Index (LMDI) [15,30]. These approaches have contributed significantly to revealing the impact factors on CO2 emissions in some regions and countries. However, previous studies on ECEs that focus on both global-regional scale and the interaction of factors have been seldom conducted. Geophysical detectors are widely used to reveal the causes of multi-scale spatial heterogeneity and the interactions between factors, without having to accept a hypothesis of test for homoskedasticity and normal distribution. Therefore, this paper, from the growth rate perspective, based on 143 countries as the basic geographic unit, attempts to reveal the spatial heterogeneity of ECEs growth rate at the global-region multi-scale by geophysical detectors and their determinant factors.

2. Methodology

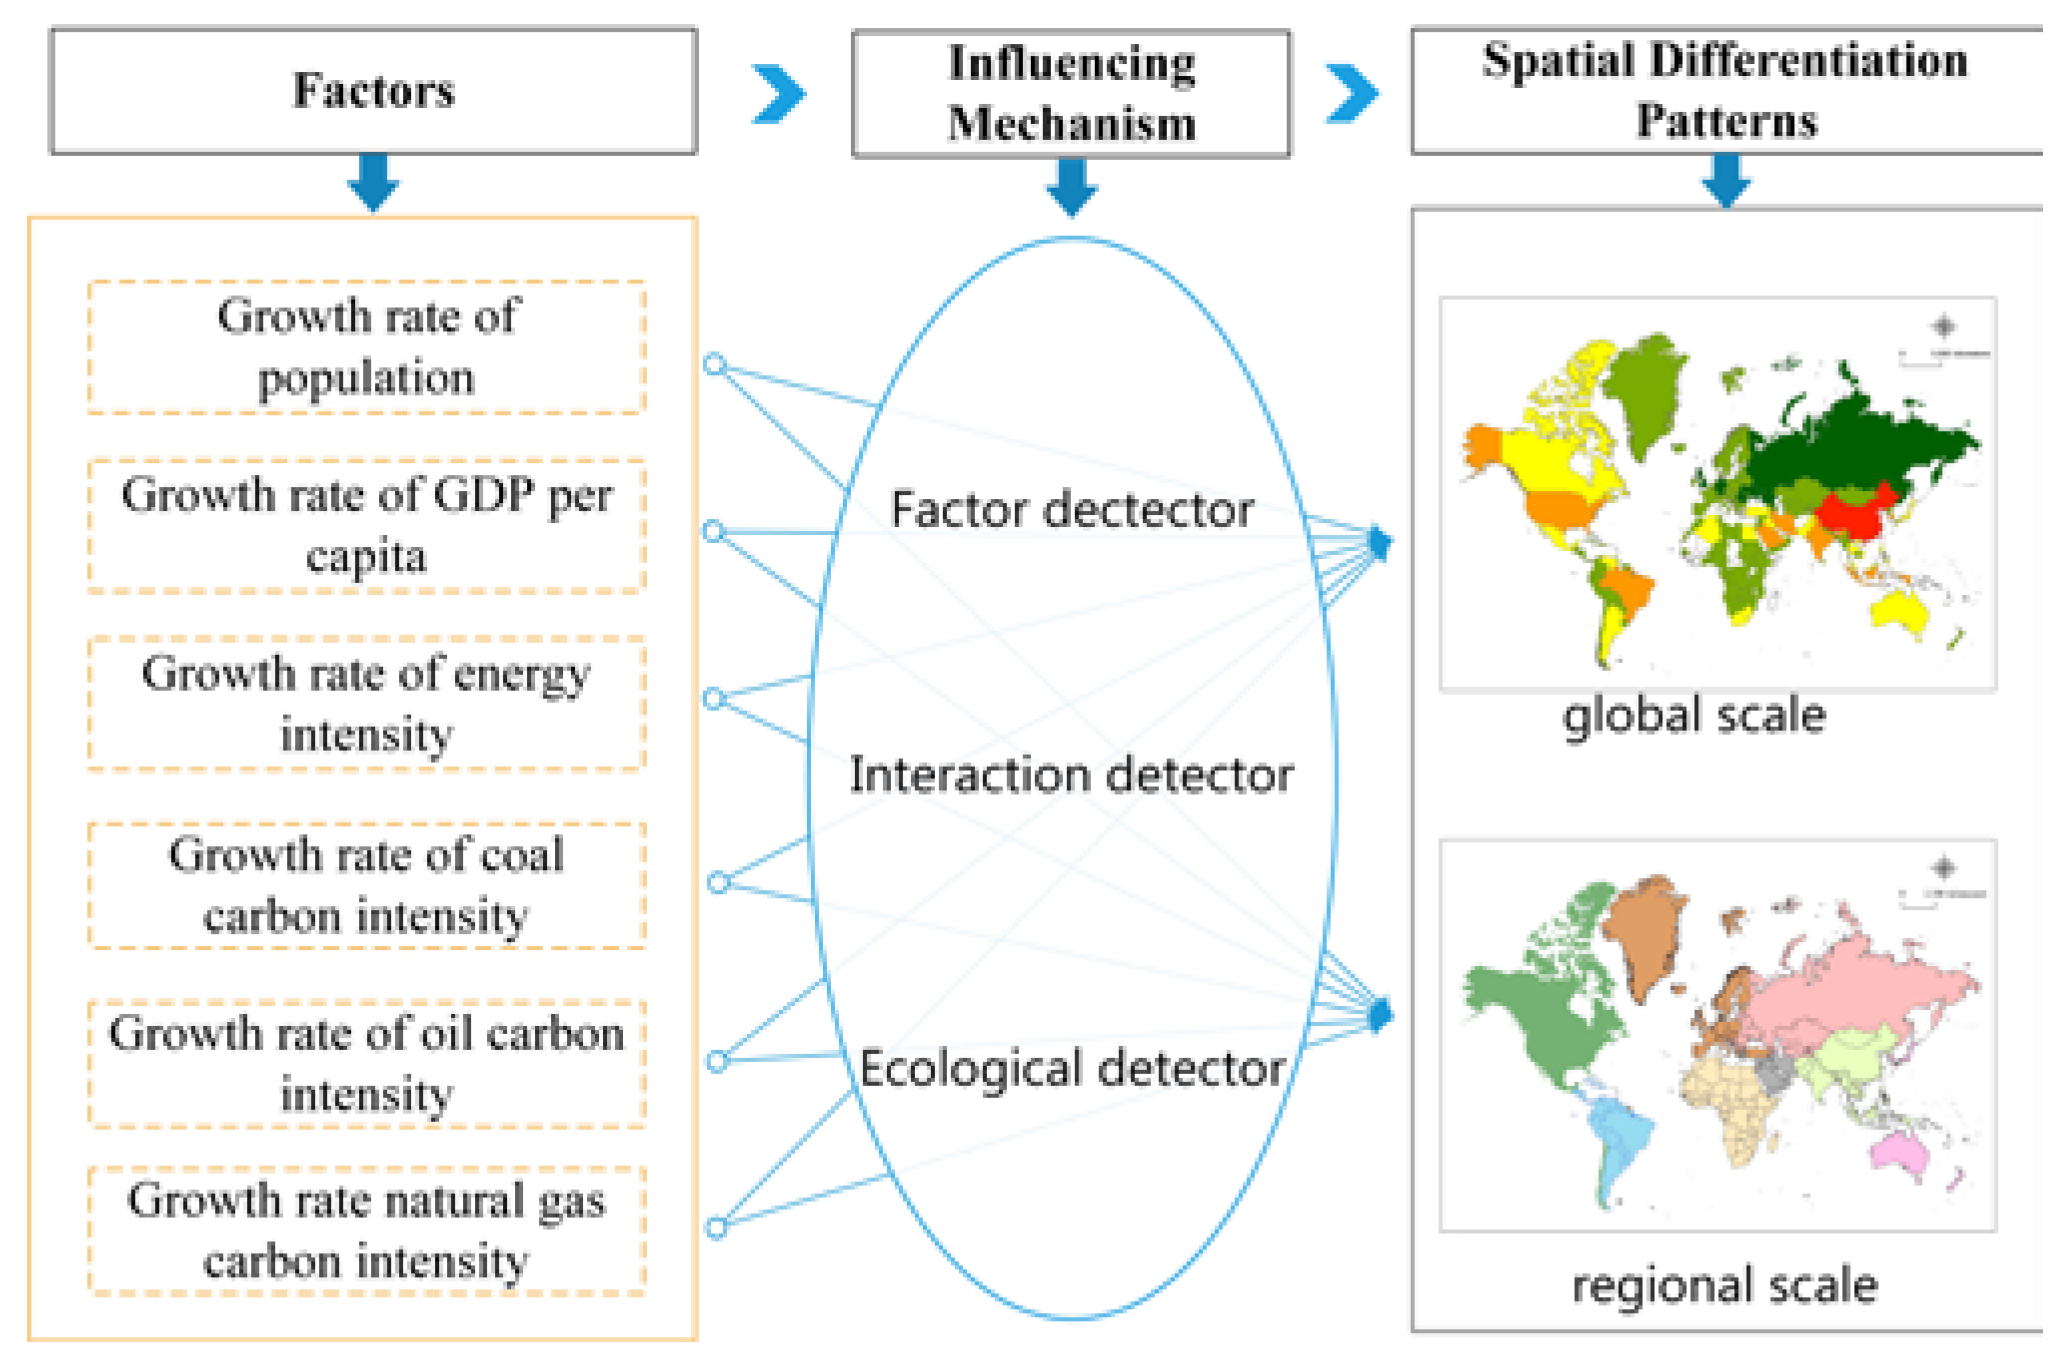
2.1. Research Framework

The literature shows that countries’ global carbon emissions vary due to the combined effect of population, per capita GDP, energy intensity, CI and other factors, but there is a lack of analysis of multi-scale global regional contrasts. Fossil energy consumption is a large contributor to ECEs, however, nuclear, hydro and other renewable energy sources and other non-fossil energy sources are not considered CO2 emission sources [1], and the term the energy in this paper only refers to fossil fuel energy, and CI can be further decomposed into CIcoal, CIoil, CIgas. From the perspective of growth, combined with the availability of data, this paper selects the growth of the above factors as major indicators, and analyses the spatial heterogeneity of global ECE growth rates by the coefficient of variation. Secondly, the growth rate of ECEs and the impact of the index were clustered into 5 levels and then matched each other. Thirdly, geophysical methods are used to explore the interaction between the key determinant factors and the factors in the multi-scale space from the global-local multi-scale perspective, ECE factor detection, interactive detection and ecological detection analysis.
Finally, the paper discusses the future energy structure transformation and emission reduction of various regions, and puts forward policy recommendations (Figure 1).

2.2. Data Source and Processing

Energy and emissions data are mainly from the International Energy Agency (IEA), while population(P) and GDP data are mainly from the World Bank (WB) (Table 1). The study area includes 143 countries. According to the global regional division by BP and IEA, the world is divided into eight types of regions: OECD Americas (O-AM, including four countries), non-OECD Americas (NO-AM including 22 countries), OECD Europe (O-EU including 25 countries), non-OECD European and Eurasian (NO-EE including 26 countries), Middle East (NO-ME including 12 countries), Africa (NO-AF including 30 countries), OECD Asia Oceania (O-AO including five countries), Asia (NO-AS including 19 countries except Korea and Japan). The research period is mainly from 1990 to 2014. However, there are some different research periods in such countries as Suriname (2000–2014), Cambodia (1995–2014), South Sudan (2014), Namibia (1992–2014), Niger (2000–2014), Eritrea (1992–2014), Montenegro (2005–2014), Kosovo (2000–2014), because of the disintegration of existing regimes and other reasons. IEA estimates include use of fuels, but exclude emissions from non-energy use of fuels:
  • CO2 emissions from fuel combustion, including international marine and aviation bunkers but excluding process emissions.
  • per capita GDP (GP): calculated as GDP (in 2014 USD PPP) divided by population per capita GDP is an indicator of a region’s standard of living, and one of the four drivers of CO2 emissions (Kaya decomposition).
  • Carbon Intensity of energy supply (CI): calculated as CO2 emissions per unit of Total Primary Energy Supply (TPES). Carbon intensity of energy consumption is further decomposed into Carbon Coal Consumption Intensity (CIcoal), Oil Consumption in Carbon Intensity (CIoil) and Natural Gas Consumption Carbon Intensity (CIgas).
  • Energy Intensity (EI): calculated as TPES per unit of GDP (in 2014 USD PPP), and its reduction indicates an increase in energy efficiency.

2.3. Analysis Method

2.3.1. Coefficient of Variation (Cv)

The coefficient of variation has been widely used in the study of geographical spatial heterogeneity, and its advantage is that it can eliminate the influence of units and mean differences on the results. In this paper, we use Cv to measure the difference between ECE growth rates in different countries and their degree, and describe the temporal and spatial heterogeneity of carbon emission growth rates. The formula as follows:
C v = S G ¯ × 100 % = 1 G ¯ × ( i = 1 n G i G ¯ n 1 ) 1 2 × 100 %
where Cv is coefficient of variation of one regional ECEs growth rate; S is an unbiased estimation for a regional standard for ECEs growth rate; G ¯ is the mean of a region ECEs growth rate; G i is the growth rate of energy-related CO2 emissions in country i in a region; n is the number of countries, which is a ECE region.

2.3.2. The Geographical Detector

Its core idea is that geographical things always exist in a specific spatial position, while the environmental factors affecting the development and changes in the space are different, if the environmental factors and geographical things in space have significant consistency, then this kind of environmental factors play a decisive role in the occurrence and development of geographical matter [32]. In recent years, as an important method to detect the cause and determinants of the spatial heterogeneity of a specified element, it has been gradually applied to the study of social, economic and natural problems [33,34,35]. Factor detection, interactive detection and ecological detection are three functions of the geographical detector:
(1)
Factor detector identifies the risk factors that contribute to the risk and is used to reflect the degree to which a determinant explains the prevalence of the growth rate of energy-related CO2 emissions (G). We rename it the Px,G, defined as follows [32]:
P x , G = 1 1 n σ 2 h = 1 L n h σ h 2
where G denotes the growth rate of ECEs; Px,G denotes the explanatory power of the impact factor x on G. A study area is composed of n units and is stratified in h = 1, 2,… , L stratum; n and σ2 denote the area and the variance of G prevalence of the study area, respectively. nh and σ h 2 denote the h layer sample size and variance of G, respectively. The value of Px,G is required to be within [0, 1]: 1 if the determinant completely controls G, 0 if the determinant is completely unrelated to G. The greater the value, the stronger the explanatory power of the impact factor x to the ECE growth rate. A value of zero indicates that the impact factor is completely unrelated to the ECE growth rate, and a value of 1 indicates that the impact factor can fully explain the ECE growth rate distribution differences.
(2)
The interaction detector identifies the interaction between the ECE growth rate factor xi and the factor xj, explaining the impact factor as an independent function or having interactions [32].
If P ( x i x j ) < min ( P ( x i ) , P ( x j ) ) , which shows that the interaction between factor x i and x j is weak and univariate, where the symbol ‘∩’ denotes the intersection between x i and x j . If min ( P ( x i ) , P ( x j ) ) < P ( x i x j ) < max ( P ( x i ) , P ( x j ) ) , which indicates that the interaction between factor x i and x j is the unidirectionally weakened. If P ( x i x j ) > max ( P ( x i ) , P ( x j ) ) , which indicates that the interaction between factor x i and x j is the bilinear strengthening. If P ( x i x j ) > P ( x i ) + P ( x j ) , which indicates that the interaction between factor x i and x j is nonlinear and enhance. If P ( x i x j ) = P ( x i ) + P ( x j ) , which indicates that the interaction between factor x i and x j is independent.
(3)
The ecological detector mainly identifies the impact differences of two factors. By comparing the differences of total variance of ECE growth indexes among different influencing factors, this paper explores the influence of different influencing factors on the ECE growth rate distribution and the role of whether there are significant differences, measured by F test [32]:
F = n x i , p ( n x i , p 1 ) σ x i , p 2 n x j , p ( n x j , p 1 ) σ x j , p 2
where F denotes the F-test value in statistical test, n x i , p and n x j , p denote the sample size of impact factor x i and x j in the unit p, respectively, σ x i , p 2 and σ x j , p 2 denote the variance of the impact factor x i and x j , respectively, and the statistical expression must followthe distribution F ( n x i , p 1 , n x j , p 1 ) and d f ( n x i , p , n x j , p ) . The model null hypothesis is H 0 : σ x i , p 2 = σ x j , p 2 . The impact factor x i controlling the ECE growth rate is significantly higher than the impact factor x j if the null hypothesis is rejected when p < 0.05.

3. Results

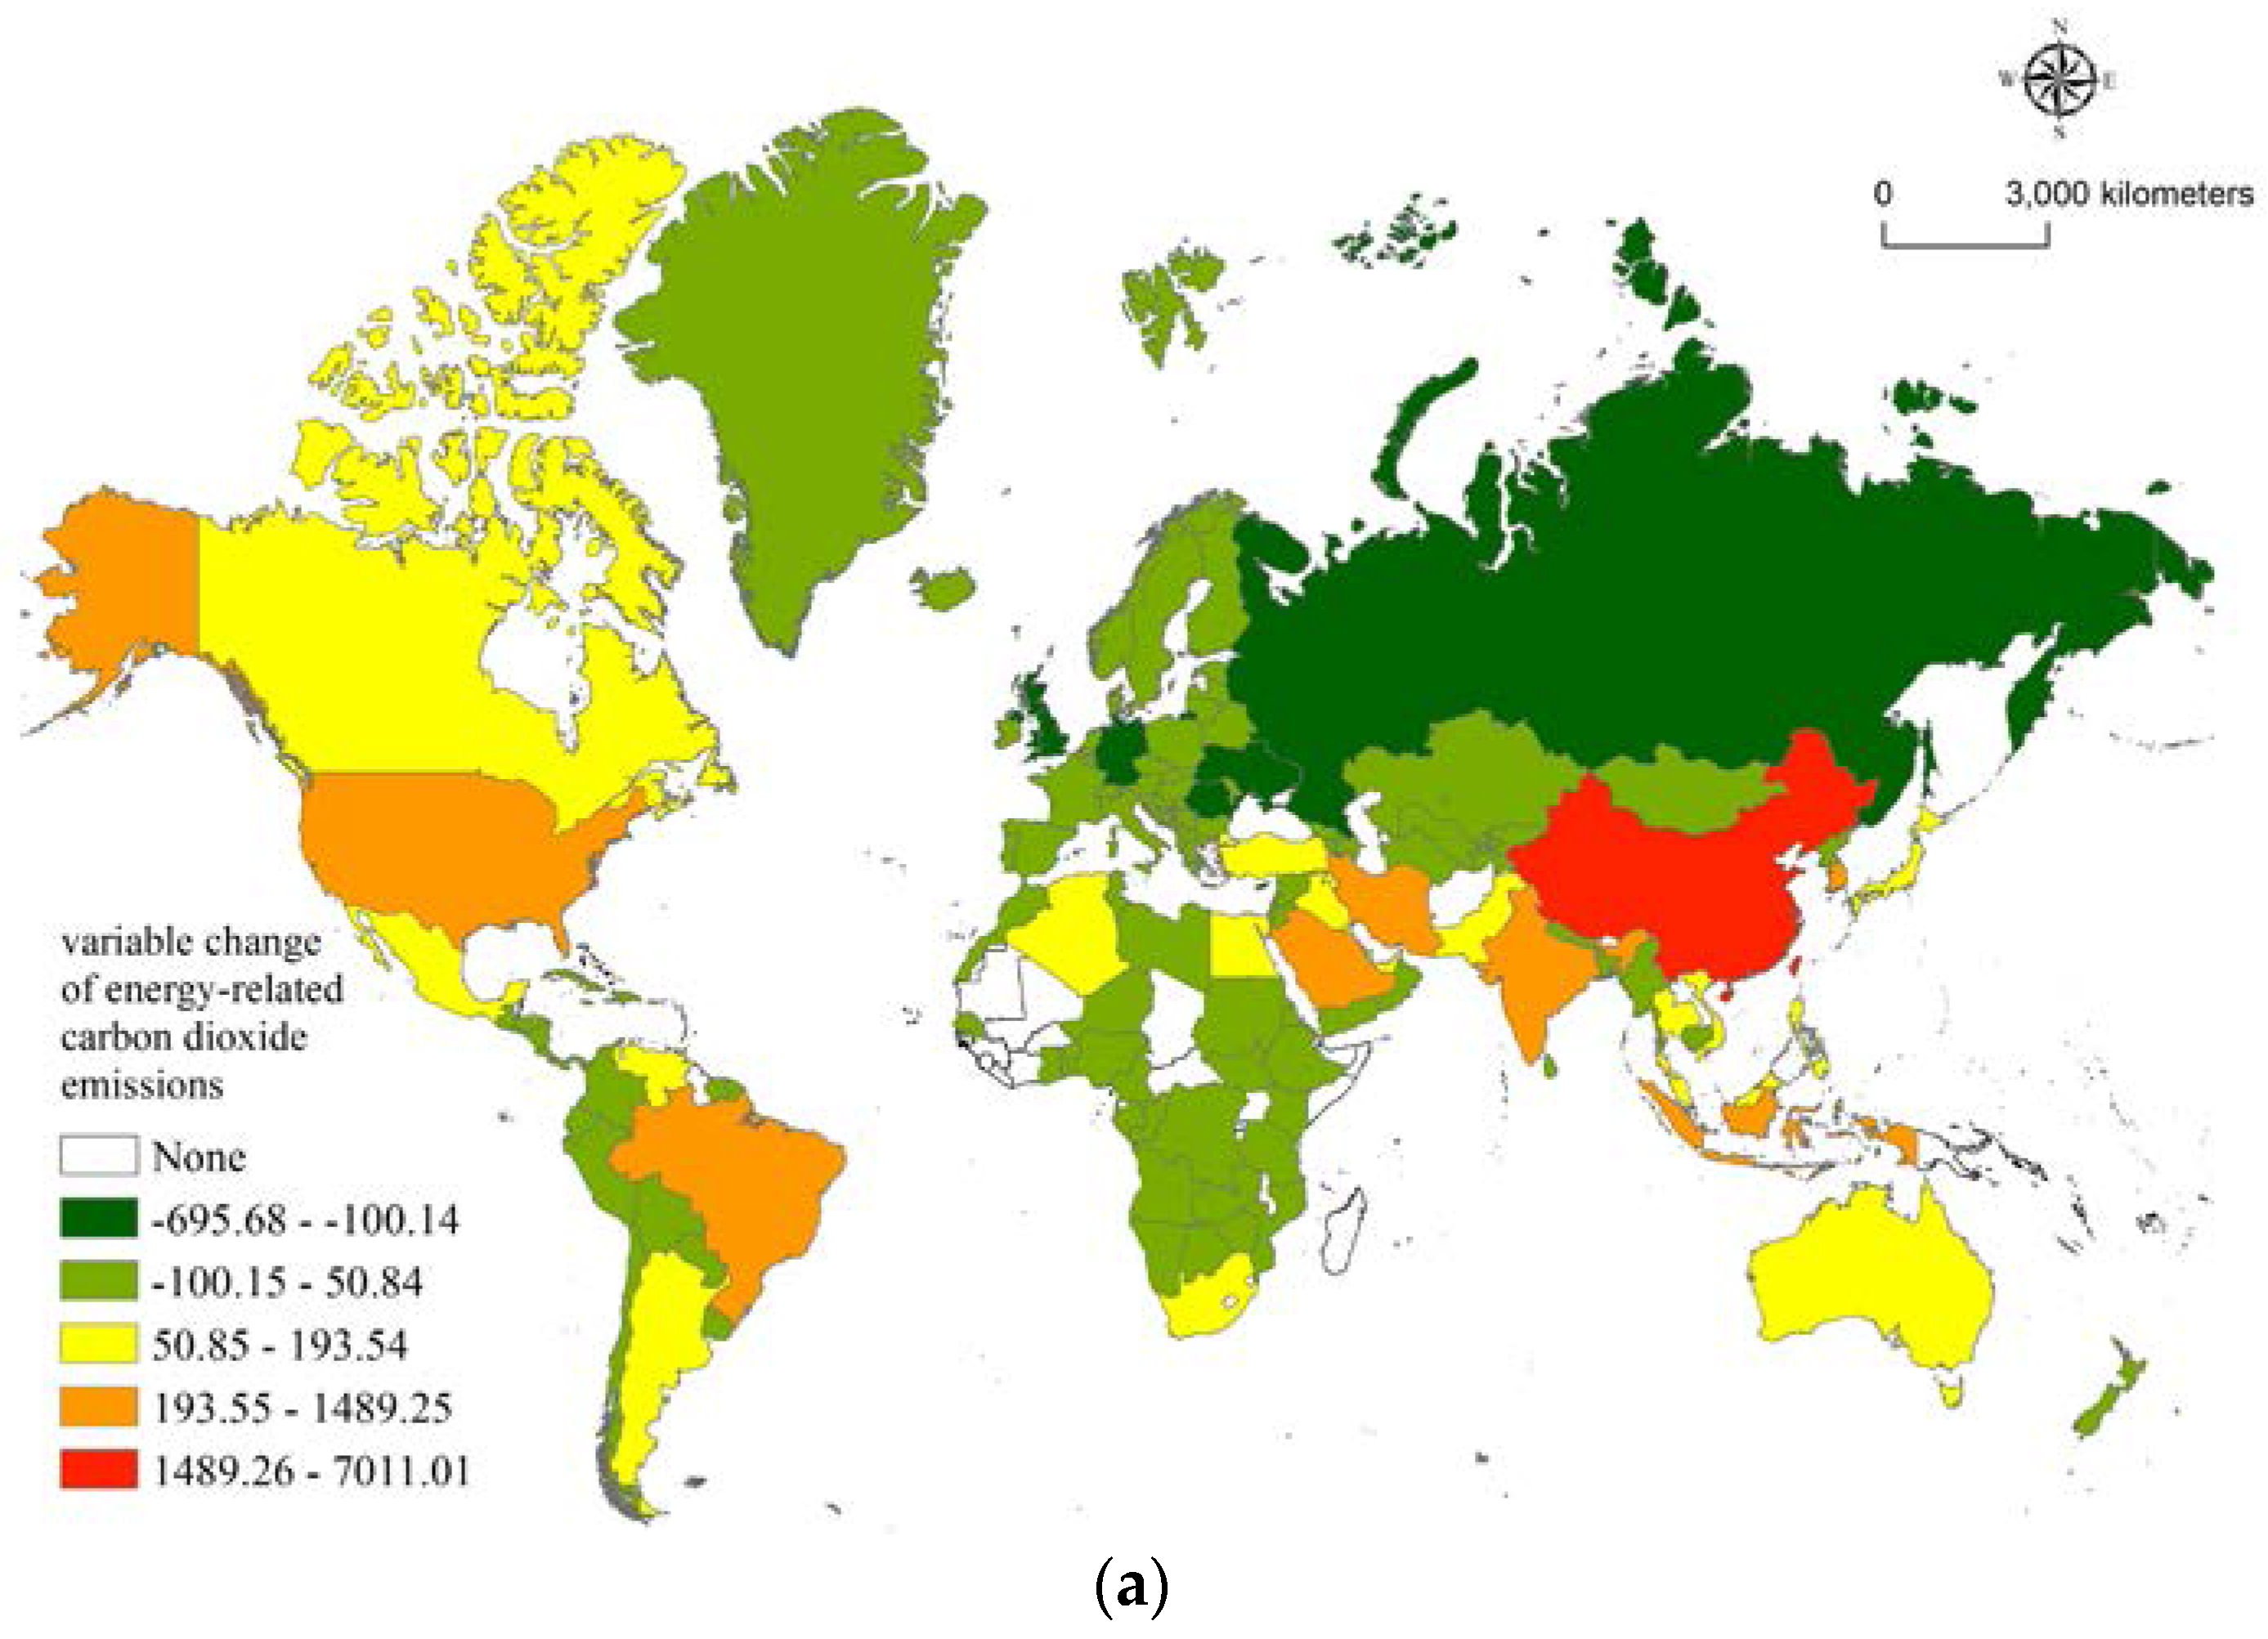
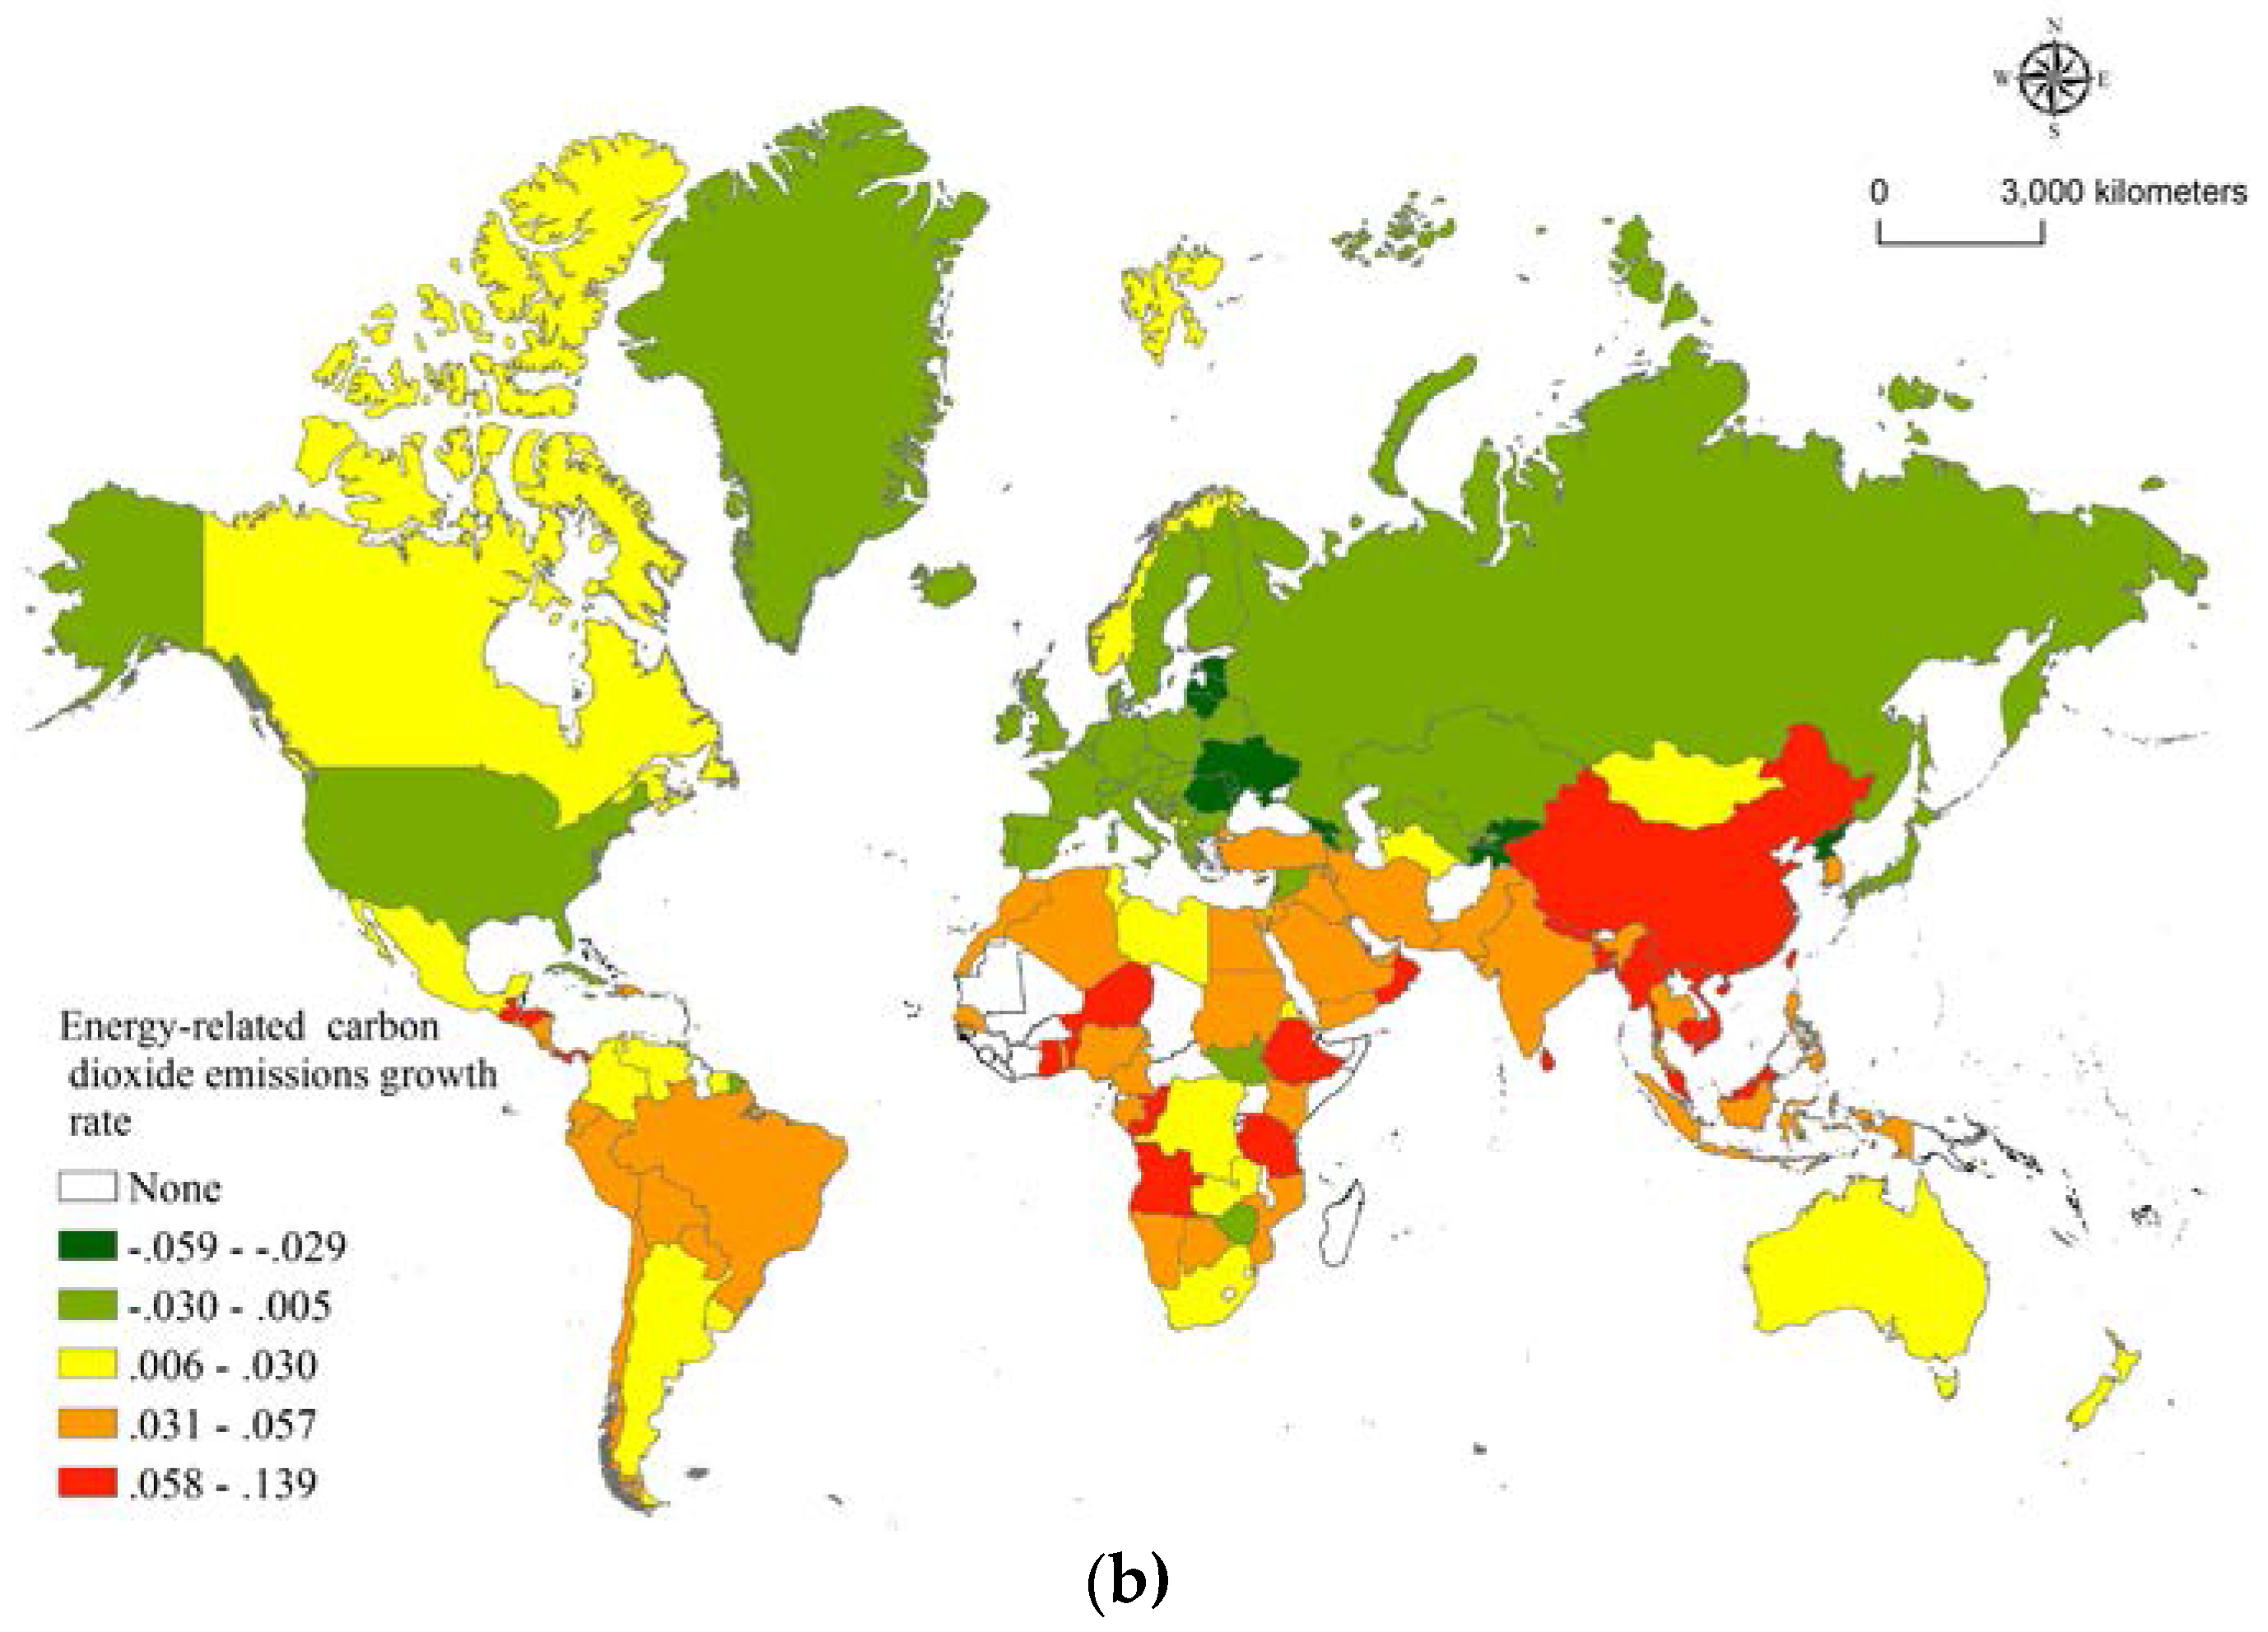
3.1. Global Distribution of Energy-Related CO2 Emission Growth Rates

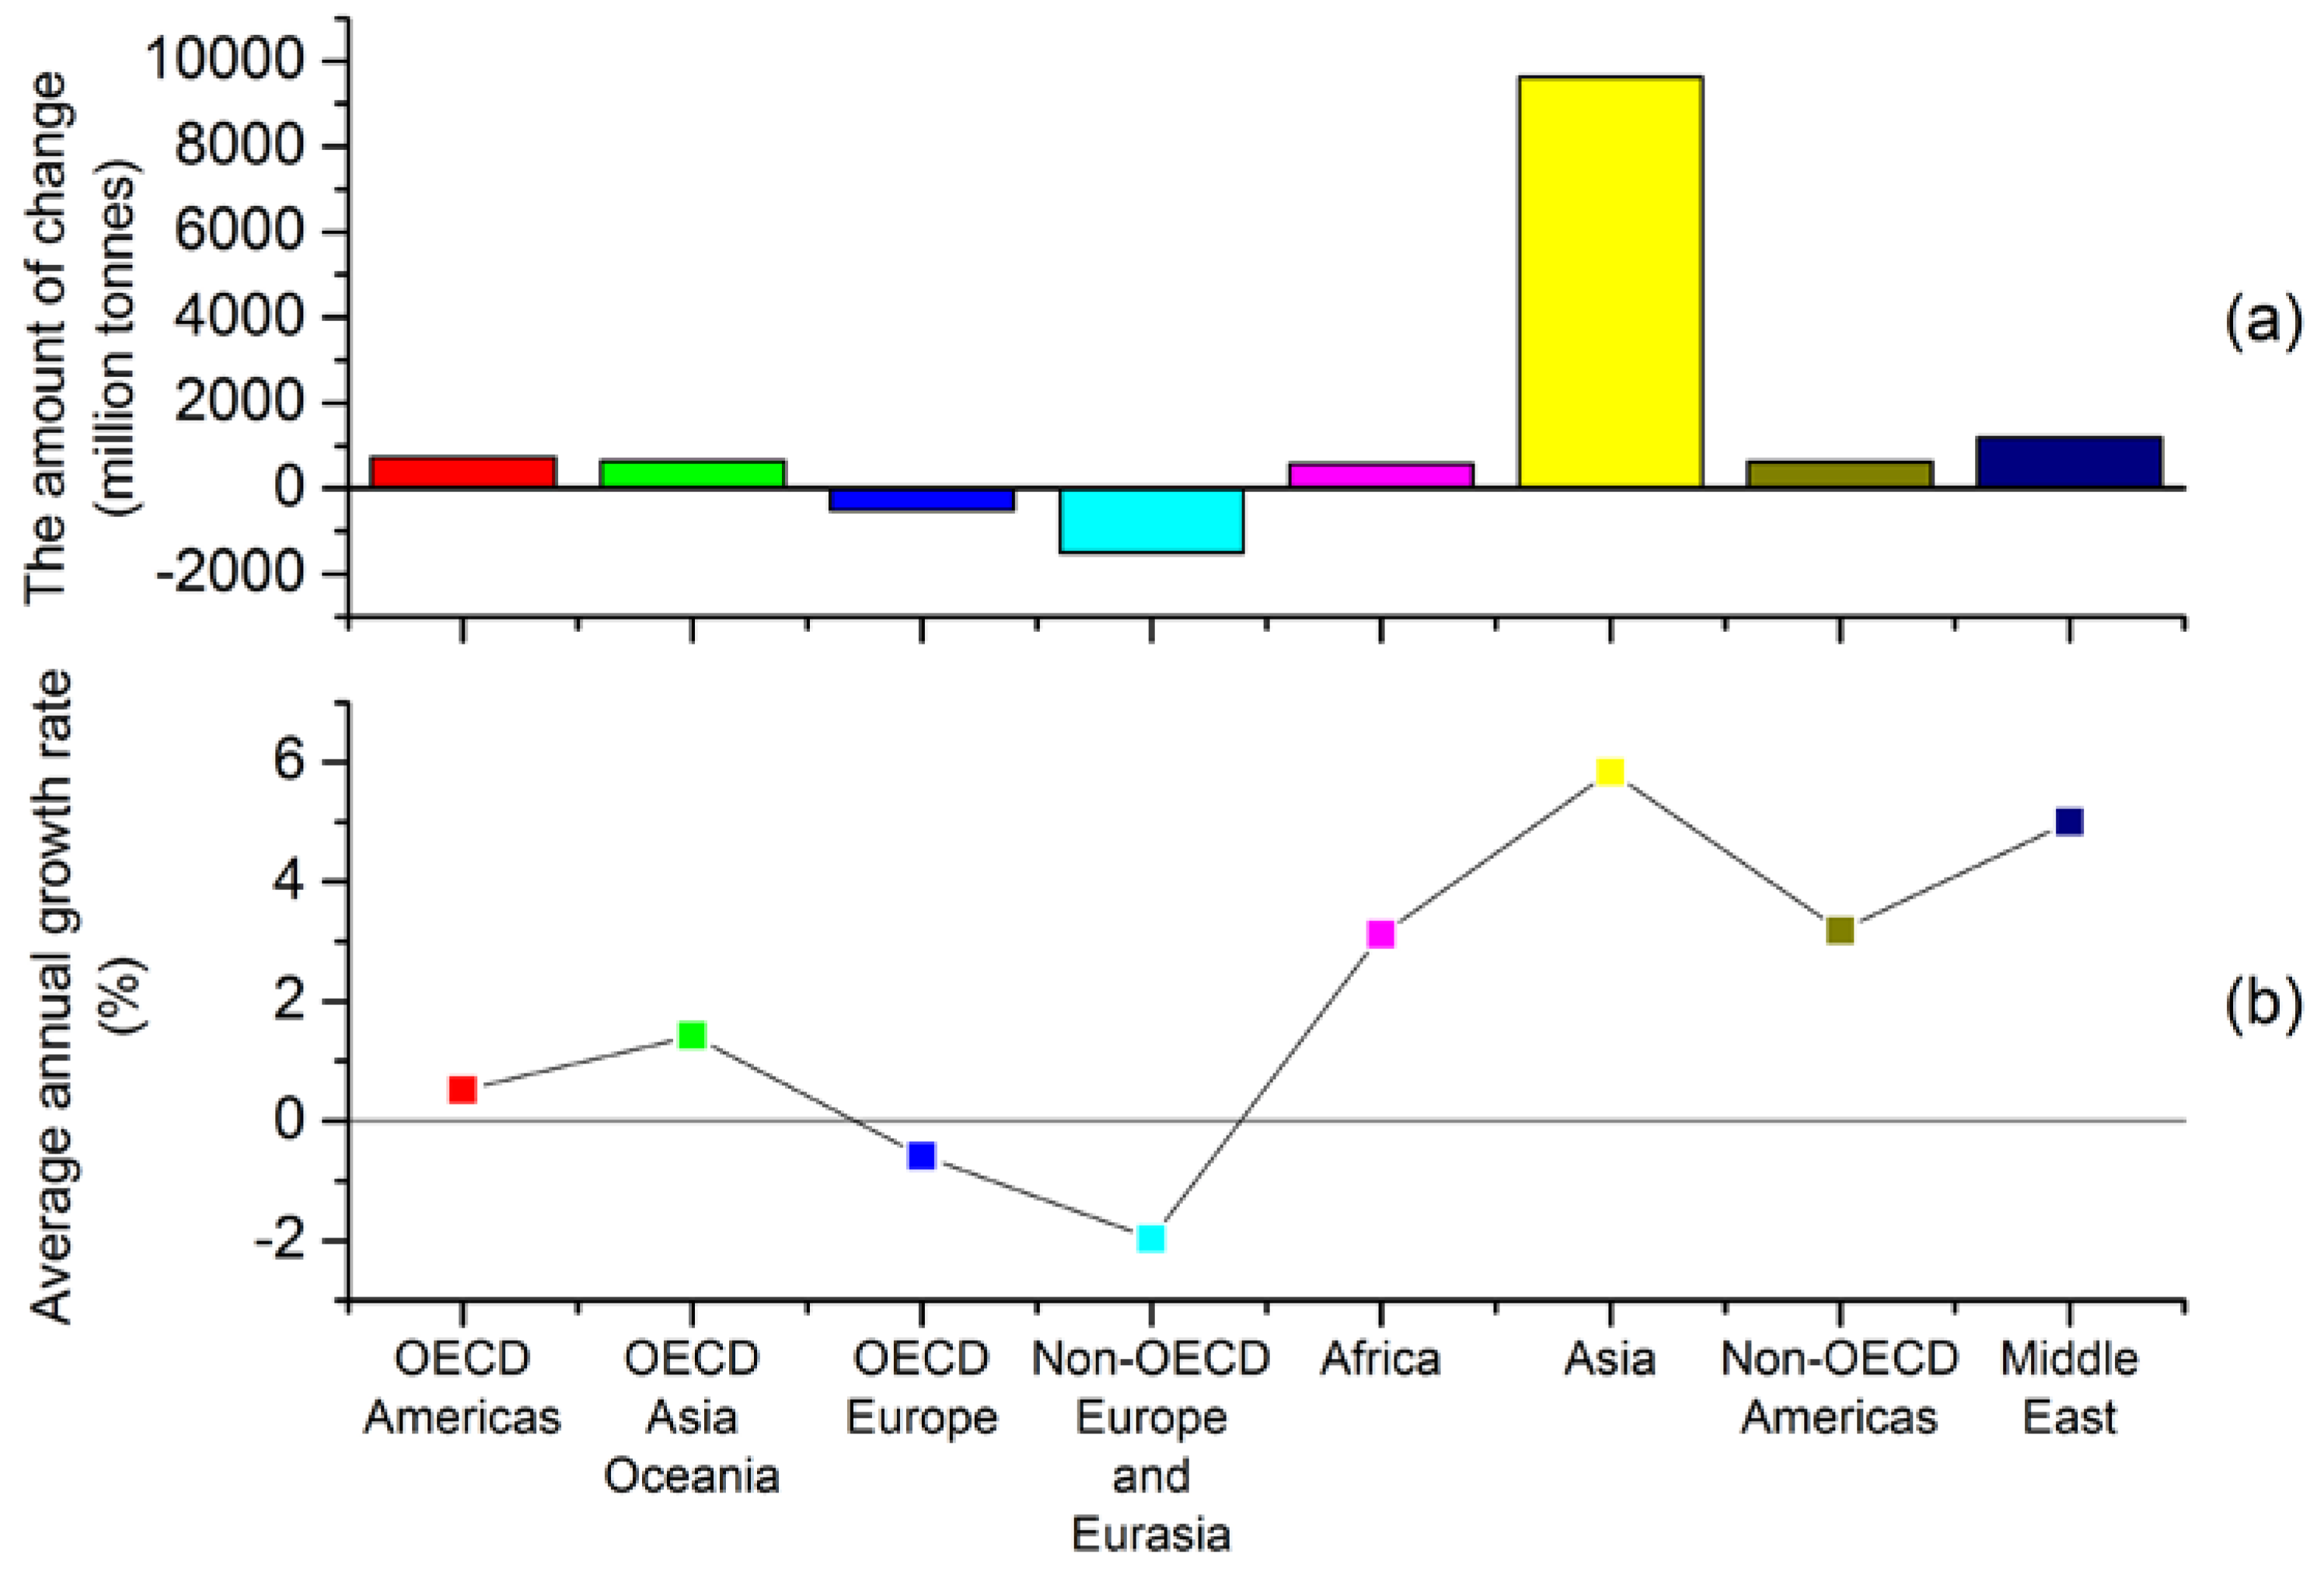
3.1.1. Regional Growth Characteristics of Energy-Related CO2 Emissions (ECEs)

The growth rates of global ECEs are classified into five levels by the natural breaks classification method. The difference of ECE growth rates between 1990 and 2014 is significant. The negative and positive increase in ECEs occurred mainly in the “heartland” of Eurasia, where the largest increase in emissions happened in China (7011.0 million tons), the lowest in Russia (−695.7 million tons) (Figure 2a). Higher growth rates are mainly in the low latitudes, such as in Asia, the Middle East, East Africa and West Africa, Latin America and other regions in the low latitudes of the developing countries (Figure 2b). In terms of specific countries, the average annual growth rate of Benin’s emissions is the highest (13.83%), and the one of Georgia is the lowest (−5.93%). The reason for the differences in emission growth rates is to a certain extent connected with the development stage and level of countries.
Compared with 1990, the amount of ECEs from other regions except O-EU, NO-EE increased in 2014, which adds up to NO-AS (Figure 3a). The main reason is the rapid economic development of NO-AS due to large-scale population’s greater demand for fossil fuels, energy structure, energy inefficiency and other reasons. The growth rate in those regions except O-EU and NO-EE is positive, and the order of growth rate of ECEs in those regions is NO-AS > NO-ME > NO-AM > NO-AF > O-AO > O-AM (Figure 3b).

3.1.2. Regional Characteristics of Impact Factors on the Growth Rate of ECEs

From the global viewpoint, the coal carbon intensity growth rate (2.47%) is the fastest growth of all factors, and EI shows the slowest growth (−0.88%), which indicates that the high demand for coal is mainly for thermal power generation, and construction in some industries, especially in a number of developing countries. From the regional view, the average annual population growth rate in the OECD region is generally lower, and Non-OECD countries, except NO-EE with negative growth, showed more than 1% growth (Table 2). The average annual per capita GDP growth rate in NO-AS is the highest, which the other Non-OECD areas are slightly higher than OECD; the growth rate of EI in NO-AS and NO-EE is the lowest, while on the contrary NO-ME is the highest. The highest average annual growth rate of CIcoal appears in NO-ME (up 10.26%), far more than other regions, however, that in O-AM and O-EU region showed negative growth. The average growth rate of CIoil and CIgas in non-OECD countries is higher except, that in NO-EE which is negative, but OECD countries had low or negative growth. NO-AS has become the fastest growing region in CIcoal, while NO-EE has become the slowest growing region in CIcoal. NO-ME has become the fastest growing region in CIgas.

3.2. Regional Differentiation of Energy-related CO2 Emission Growth Rates

The regional variation coefficients can reflect the degree of regional differences. According to coefficients of regional variation from 1990, 2000, 2010 and 2014, the following main characteristics can be seen (Table 3): (1) from a global perspective, the coefficient of variation of global ECEs is larger than that of the sub-regions, and the coefficient of variation is increasing, which indicates that the differences of emission growth in sub-regions are greater and growing over time; (2) from a regional perspective. Firstly, the coefficient of variation constantly tend to increase in non-OECD regions, especially NO-AS. In contrast, that of the OECD regions, especially O-AO, tend to decrease. Secondly, the coefficients of variation (less than 2) are smaller and smaller, mainly in the OECD regions, such as O-AM, O-EU, O-AO. The main reason is that there is a high degree of consistency and strong stability for ECE growth rates in the OECD countries. Furthermore, there is a high similarity in the influencing factors, development level and development stage in those countries. Thirdly, the coefficient of variation (more than 2) tends to be widened, mainly in non-OECD regions such as NO-EE, NO-AF, NO-AS. This is mainly due to the large differences in the level of development, stage of development and speed of development among the Non-OECD countries, especially with the rapid development of the BRICs and other emerging economies such as China and India in recent years. Finally, the coefficient of variation of NO-ME is lower than that of other non-OECD regions. The main reason is that there is greater similarity in the energy consumption structure, industrial structure, development level and development stage among NO-ME countries.

3.3. The Reason for Spatial Heterogeneity of Energy-Related CO2 Emissions

3.3.1. Factor Detection Analysis

(1) Factor Detection at a Global Scale
Factor detection is mainly used to detect the degree of interpretation of the growth rate of the factors on ECE growth rates. The order of contribution to ECE growth rate on a global scale is: population growth rate > the growth rate of per capita GDP > energy intensity growth rate > natural gas carbon intensity growth rate > coal carbon intensity growth rate > petroleum carbon intensity growth rate (Table 4). In this paper, we determine whether the factor is the key determinant factors with P value (=0) and q statistic value (≥0.10), then a key determinant factor in the world includes the population growth rate, The growth rate of per capita GDP, energy intensity growth rate (Table 5). The factor of population growth rate (0.240) has the largest determinative power, indicating that global ECE growth is most strongly controlled by the population growth rate factor, which has the strongest consistency with the ECE growth rates.
The reason is that the increase in population leads to a significant increase in energy demand, both in developed countries and developing countries. and the increase in urbanization, population aging, and economic levels has resulted in an increase in ECEs due to the increase in population growth, which explains why although OECD countries have low population growth rates, the population growth rate has become the key determinant factors in the eight types of regions. In addition, it also shows that the current global energy efficiency and the proportion of renewable energy consumption growth may lag behind the increase in population, and it is sometimes difficult to offset the impact on population growth. The sub-important decisive factor is the growth rate of per capita GDP whose determinative power is 0.178, which indicates that the growth rate of per capita GDP is one of the important factors affecting global ECE growth rates. The main reason is that the increase in the growth rate of per capita GDP results in an increase in per capita income, lifestyle, consumption patterns will be further enhanced, with a corresponding increase in energy demand. When the energy consumption structure is still dominated by fossil fuels, it will directly lead to growth of the ECE rates. The contribution of energy intensity growth to global ECE growth ranks third among all factors. The main reason is that there are great differences in development stages among different countries. The values of X4, X5, and X6 are generally smaller (less than 0.1) on the global scale, due in part to differences in energy carbon intensity across the world, such as X4, X5 and X6, of the decision-making power is partially offset and weakened.
(2) Factor Detection at a Regional Scale
The order of contribution to ECE growth rate in O-AM is: population growth rate > the growth rate of per capita GDP > energy intensity growth rate > natural gas carbon intensity growth rate > coal carbon intensity growth rate > petroleum carbon intensity growth rate (Table 4). The key determinant factors on O-AM are population growth rate, the growth rate of per capita GDP and energy intensity growth rate for the reason that with the rapid development of alternative energy, there are differences in the energy consumption structures and fossil energy growth rates among countries (Table 5). The order of contribution to ECE growth rates in NO-AS is: population growth rate > the growth rate of per capita GDP > energy intensity growth rate > coal carbon intensity growth rate > natural gas carbon intensity growth rate > petroleum carbon intensity growth rate. The key determinant factors in NO-AS are: population growth rate, the growth rate of per capita GDP and energy intensity growth rate for the rapid development of renewable energies such as nuclear energy, hydropower, and the difference of energy consumption structure and growth rate of energy consumption. The order of contribution to ECE growth rates in O-EU is: population growth rate > the growth rate of per capita GDP > energy intensity growth rate > petroleum carbon intensity growth rate > coal carbon intensity growth rate > natural gas carbon intensity growth rate. The key determinant factors in the O-EU region are: population growth rate, the growth rate of per capita GDP, energy intensity growth rate because of the rapid development of the nuclear energy, hydropower, wind energy and other renewable energies, and the larger difference of natural gas growth rate among those countries. The order of contribution to ECE growth rates in the O-EE region is: population growth rate > energy intensity growth rate > the growth rate of per capita GDP > petroleum carbon intensity growth rate > natural gas carbon intensity growth rate > coal carbon intensity growth rate. The key determinant factors in O-EE are: population growth rate, energy intensity growth rate, the growth rate of per capita GDP, because of the inconsistency of factors such as the fossil energy consumption structure and growth rate in O-EE countries. The order of contribution to ECE growth rates in NO-AF is: population growth rate > GDP growth rate > energy intensity growth rate > natural gas carbon intensity growth rate > coal carbon intensity growth rate > petroleum carbon intensity growth rate. The key determinant factors in NO-AF are: population growth rate, the growth rate of per capita GDP, energy intensity growth rate, natural gas carbon intensity growth rate, for the main reason that the stability and consistency of the natural gas carbon intensity increase is slightly better than that of the petroleum carbon intensity and coal carbon intensity in NO-AF countries. In addition, compared to the proportion of annual consumption, the proportion of annual carbon emissions and the average annual carbon intensity of coal and oil, those of natural gas in the non-OECD region are usually much higher (Table 2). The order of contribution to ECE growth rates in NO-AS is: population growth rate > the growth rate of per capita GDP > energy intensity growth rate > natural gas carbon intensity growth rate > petroleum carbon intensity growth rate > coal carbon intensity growth rate. The key determinant factors in the NO-AS region are: population growth rate, the growth rate of per capita GDP, energy intensity growth rate, for the great difference of the fossil energy consumption of carbon intensity and structure of energy consumption. The order of contribution to ECEs growth rate in NO-AM is: population growth rate > the growth rate of per capita GDP > energy intensity growth rate > natural gas carbon intensity growth rate > coal carbon intensity growth rate > petroleum carbon intensity growth rate. The key determinant factors on NO-AM are: population growth rate and per capital GDP growth rate, for the reason of the larger difference of the growth rate of petroleum carbon intensity in NO-AM. The order of contribution to ECE growth rates in NO-ME is: population growth rate > growth rate of carbon intensity of coal > growth rate of per capita GDP > growth rate of energy intensity > growth rate of natural gas carbon intensity > growth rate of petroleum carbon intensity. The key determinant factors in NO-ME is population growth rate, coal carbon intensity growth rate and per capital GDP growth rate, which have a high similarity and consistency in NO-ME. In addition, although the carbon intensity of the Middle East is smaller than that of other factors, the growth rate of the carbon intensity is the largest because coal is used to generate electricity instead of oil in some countries.
(3) Factor Detection from the Factor Itself
The decisive force of the regional scale detection factor is generally high, which indicates that the decisive factors contribute more to the smaller spatial scale. From the perspective of detection factors, the factors show a certain consistency and different characteristics in the change of ECE growth rates in different regions. Population growth rate (X1) is more consistent on the global scale and in all regions, ranking the first among all factors (Table 5). This suggests that the increase in population growth over the past 25 years, regardless of the degree of regional economic development, results in an increase in energy demand and an increase in CO2 emissions. X1, X2, and X3 have been shown to be more prominent in the OECD and in some non-OECD regions, especially in the OECD. The detection factors of X1, X2 and X3 played a more pronounced decisive role in some areas, especially showing a high consistency in OECD. The main reason is just strong similarity for OECD countries in socio-economic development speed, development level, industrialization process, urbanization level, population growth. With the smaller regional differences and the rapid development of renewable energy sources, the difference in the growth rate of energy emissions is relatively small. The determinant power of X2 and X3 maintain a certain consistency in the non-OECD region, due to a large difference between X2 and X3 in NO-EE and NO-ME. With the larger difference of the energy intensity growth of X4, X5 and X6, their contribution to the growth rate of ECEs is weak, which indicates that the differences of ECE growth rates are more affected by factors such as population growth rate, the growth rate of per capita GDP and energy intensity growth rate, which reflect socio-economic, policy and technical factors. The determination factors of X4, X5 and X6 in non-OECD region are slightly larger than those in the OECD.

3.3.2. Interaction Detector Analysis

The interaction detector is used to check whether two factors impacting on the ECEs growth rate work independently or not. The result is as follows:
(1)
Global scale: the factors X4 and X5 were found to enhance each other to increase the growth rate of ECEs, which is a nonlinear relationship. The interactions of factors X4 and X6, and interactions of factors X5 and X6. had a similar effect. The relationship between the other detector factors is bilinear, when the factors enhance each other to increase the decisive power of factors to ECEs growth rate. X5 and X6 were found to enhance each other (X5X6(0.077) > 0.060 = X5(0.009) + X6(0.051)), which indicates synergistic effect on ECEs is generated by power of determinant (Px,G) of X5X6.
(2)
Regional scale: In the O-AM region, all factors were found to enhance each other, and the relationship of the power of determinant (Px,G) of X2X6 is nonlinear, which is the same as the power of determinant (Px,G) of X5X6, while the relationship of the other factors is bilinear. X2 and X6 were found to enhance each other to (X2X6(0.399) > 0.379 = X2(0.342) + X6(0.037)), which indicates synergistic effect on ECEs is generated by power of determinant (Px,G) of X2X6.
In the O-AO region, all factors were found to enhance each other, and the relationship of power of determinant (Px,G) of X1X6 is nonlinear, which is the same as power of determinant (Px,G) of X5X6. While the relationship of the other factors is bilinear. X1 and X6 were found to enhance each other to (X1X6(0.537) > 0.523 = X1(0.506) + X6(0.017)), which indicates synergistic effect on ECEs is generated by power of determinant (Px,G) of X1X6.
In the O-EU region, all factors were found to enhance each other, and the relationship of power of determinant (Px,G) of X1X6 is nonlinear, which is the same as the power of determinant (Px,G) of X2X6, X3X6, and X5X6. The relationship of the other factors is bilinear. X1 and X6 were found to enhance each other to (X1X6(0.541) > 0.537 = X1(0.527) + X6(0.008)), which indicates synergistic effect on ECEs is generated by power of determinant (Px,G) of X1X6.
In the NO-EE region, all factors were found to enhance each other, and the relationship of power of determinant (Px,G) of X1X4 is nonlinear, which is the same as the power of determinant (Px,G) of X1X5, X2X3, X2X4, and X5X6, while the relationship of the other factors is bilinear. X1 and X5 were found to enhance each other to (X1X5(0.486) > 0.478 = X1(0.428) + X5(0.050)), which indicates synergistic effect on ECEs is generated by power of determinant (Px,G) of X1X5.
In the NO-AF region, all factors were found to enhance each other, and the relationship of power of determinant (Px,G) of X1X5 is nonlinear, which is the same as power of determinant (Px,G) of X5X2, X5X3, X5X4, and X5X6. The relationship of the other factors is bilinear. X1 and X5 were found to enhance each other to (X1X5(0.225) > 0.220 = X1(0.219) + X5(0.001)), which indicates synergistic effect on ECEs is generated by power of determinant (Px,G) of X1X5.
In the NO-AS region, all factors were found to enhance each other, and the relationship of power of determinant (Px,G) of X1X4 is nonlinear, which is the same as power of determinant (Px,G) of X1X5, X2X4, X2X5, X3X5, X4X5, X4X6, and X5X6, while the relationship of the other factors is bilinear. X1 and X5 were found to enhance each other to (X1X5(0.430) > 0.425 = X1(0.421) + X5(0.004)), which indicates synergistic effect on ECEs is generated by power of determinant (Px,G) of X1X5.
In the NO-AM region, all factors were found to enhance each other, and the relationship of power of determinant (Px,G) of X4X5 is nonlinear, which is the same as power of determinant (Px,G) of X5X6. The relationship of the other factors is bilinear. X2 and X3 were found to enhance each other to (X2X3(0.142) > 0.177 = X2(0.110) + X3(0.067)), which indicates synergistic effect on ECEs is generated by power of determinant (Px,G) of X2X3.
In the NO-ME region, all factors were found to enhance each other, and the relationship of power of determinant (Px,G) of X1X5 is nonlinear, which is the same as power of determinant (Px,G) of X2X3 and X5X6, while the relationship of the other factors is bilinear. X1 and X5 were found to enhance each other to (X1X5(0.184) > 0.179 = X1(0.176) + X5(0.002)), which indicates synergistic effect on ECEs is generated by power of determinant (Px,G) of X1X5.
We draw the conclusion that there was no weakening effect, single linear weakening effect and independent effect between the six factors. The interaction detection results show that the determinant power of any two factors show bilinear or non-linear enhancements in the study area. That is, under the control of any two detectors, the difference of ECE growth rates will decrease and the determinant power of factors was significantly enhanced.

3.3.3. Ecological Detection Analysis

The results of the ecological detection focused on whether there were significant differences in the effects of detection factors on the spatial distribution of ECEs growth rates. The results show that: (1) on a global scale, the incidence of ECE growth rates between X5 and X6 is significantly different at the 95% confidence level; (2) on a regional scale, the incidence of ECE growth rates between X5 and X6 is significantly different at the 95% confidence level in the Africa region. There is no statistically significance in the statistics for explanatory power between the detection factors in other regions and no significant difference in spatial distribution, because the explanatory power of other factors are smaller. Compared to other factors, the explanatory power of the growth rate of oil carbon intensity and the growth rate of natural gas carbon intensity factor is much bigger. Therefore, reducing the growth rate of oil and carbon intensity and natural gas carbon intensity is a common problem faced by all regions, especially in Africa.

4. Conclusions and Discussion

4.1. Conclusions

This paper examines the changes of the global energy-related CO2 emission growth rates during 1990–2014. We analyze the regional differences in the growth rate of global energy-related CO2 emissions by the coefficient of variation, and explain the determinant factors of energy-related CO2 emission growth rates by means of geographical detector methods, and provide a new perspective and methods for relevant carbon dioxide emission research. The results can provide a guide for those regions on how to reduce energy-related CO2 emissions. Results show that:
(1)
Overall, the highest and lowest growth rate of global energy-related CO2 emissions during 1990–2014 were mainly in the Non-OECD regions such as NO-AS, NO-EE and NO-ME. The growth rate of energy-related CO2 emissions in Non-OECD regions are higher than in the OECD regions due to the development stage and development level of the countries, especially in the NO-AS.
(2)
The coefficient of variation of energy-related CO2 emissions growth rate on the global scale is larger than on the regional scale. As far as the eight types of regions is concerned, the spatial heterogeneity is smaller and tends to decrease in the OECD, while that in non-OECD regions tends to expand, with the spatial heterogeneity being the largest in NO-AS and the smallest in O-AO.
(3)
The determination factor of the detection factor on the global scale is not as good as that on the sub-scale scale. The main reason is that the differences of the detection factors are large at the global scale, which weakens the decisive force.
(4)
At the global scale, the key determinant factors on energy-related CO2 emission growth rates are population growth rate, the growth rate of per capita GDP, and energy intensity growth rate. At the regional scale, determinant power of the key determinant factors on the growth rate of energy-related CO2 emissions are different in the eight types of regions. The determinant power of the key determinant factors on O-AM, O-EU and NO-AS are: population growth rate > the growth rate of per capita GDP > energy intensity growth rate. The determinant power of the key determinant factors on NO-EE are: population growth rate > energy intensity growth rate > the growth rate of per capita GDP. The determinant power of the key determinant factors in NO-AF are: population growth rate > the growth rate of per capita GDP > energy intensity growth rate > natural gas carbon intensity growth rate. The determinant power of the key determinant factors in NO-AM are: population growth rate > the growth rate of per capita GDP. The determinant power of the key determinant factors in NO-ME are: population growth rate > coal carbon intensity growth rate > the growth rate of per capita GDP.
(5)
From the perspective of detection factors, the determinant power of the factors in the different regions of the energy-related CO2 emissions growth rate of decisive force showed a specific consistency and difference. The population growth rate is the strongest of the determinant power of the factors in the world and in all regions, showing a significant degree of consistency. In general, the determinant power of the growth rates of coal carbon intensity, petroleum carbon intensity and natural gas carbon intensity, with great differences in each area, have little effect on the energy-related CO2 emission growth rates. However, the impact of the determinant power on non-OECD is slightly increased. For example, the growth rate of coal carbon intensity is the second decisive factor in non-OECD Middle East.
(6)
In the world and in each region, it is significantly enhanced with bilinearity or non-linearity for the determinant power of factors that any two factors interact with each other at the global scale or at the regional scale.
(7)
The high conversion between oil and natural gas in the process of production and consumption, in addition, the demand for oil and gas growth in the world is more synchronized. Thus, the interaction between the growth rate of oil and gas is more significant than that of other factors. As a result, at the global scale or in the non-OECD Middle East region, the determinant power of X5X6 are significantly stronger than other impact factors on energy-related CO2 emissions growth rates, with significant differences in their spatial distribution.

4.2. Discussion

The future, the proportion and growth rate of fossil energy will be further reduced due to the rapid of renewable energy development, after the Paris Agreement. Based on the above analysis, the determinant power of the factors of energy intensity and energy carbon intensity has less influence on the OECD countries than that of non-OECD ones. Despite the relatively low population growth rate and the slow GDP growth rate in the OECD, these factors contribute most to the growth rate of energy-related CO2 emissions. Therefore, in improving energy efficiency and increasing the development and utilization of alternative energy sources at the same time, more attention should be paid for the impact of factors population and affluence, for example, raising awareness of low-carbon consumption and low-carbon living habits in OECD countries. For non-OECD regions, the future policy focus should be to reduce the growth rate of energy intensity and to decrease the intensity of fossil energy consumption due to their relatively high determinant power while controlling the growth rate of per capita GDP.
However, this study is still preliminary with some limitations. Firstly, this paper only uses selected six important indicators from viewpoint of growth rate, yet other factors reflecting structure and technology, such as population, industry, renewable energy, are excluded from this study. These factors may also affect the reason of spatial heterogeneity of energy-related CO2 emission growth rates, but, considering the difficulties of data acquisition for all of the countries, further research in consideration of these issues would contribute to understanding the spatial heterogeneity. Secondly, it is noteworthy that, although the coal consumption in non-OECD Middle East is relatively small, the growth rate of coal carbon intensity is the highest growth rate of all fossil energy carbon intensities, and the coal carbon intensity growth rate has become the area of growth of energy-related CO2 emissions, second only to the population growth rate, and thus is also worthy of close research attention. Furthermore, this paper only classifies the world into eight types of region according to the IEA, further study on energy-related CO2 could focus on types of global climate negotiations, types of national development stage, and types of national energy utilization by using the geographical detector method.

Acknowledgments

This study was supported by the National Natural Science Foundation of China (No. 41301127), the National Key Research and Development Program of China (No. 2016YFA0602800), and the Youth Project of Humanities and Social Sciences of Ministry of Education in China (No. 13YJCZH037). Meanwhile, the authors would like to thank the editor of this journal and all anonymous reviewers for their valuable comments and suggestions.

Author Contributions

Yebing Fang designed this research and wrote this paper; Limao Wang provided professional guidance; Zhoupeng Ren gave some advices for the paper; and Yan Yang collected data with Chufu Mou and Qiushi Qu.

Conflicts of Interest

The authors declare no conflict of interest.

References

  1. International Energy Agency (IEA). CO2 Emissions from Fuel Combustion Highlights 2016. Available online: http://www.iea.org/publications/freepublications/publication/CO2EmissionsfromFuelCombustion_Highlights_2016.pdf (accessed on 12 October 2016).
  2. Raupach, M.R.; Marland, G.; Ciais, P.; Le Quere, C.; Canadell, J.G.; Klepper, G.; Field, C.B. Global and regional drivers of accelerating CO2 emissions. Proc. Natl. Acad. Sci. USA 2007, 104, 10288–10293. [Google Scholar] [CrossRef] [PubMed]
  3. Qi, T.; Weng, Y.; Zhang, X.; He, J. An analysis of the driving factors of energy-related CO2 emission reduction in China from 2005 to 2013. Energy Econ. 2016, 60, 15–22. [Google Scholar] [CrossRef]
  4. Schmalensee, R.; Stoker, T.M.; Judson, R.A. World carbon dioxide emissions: 1950–2050. Rev. Econ. Stat. 1998, 80, 15–27. [Google Scholar] [CrossRef]
  5. Zhang, W.; Li, K.; Zhou, D.; Zhang, W.; Gao, H. Decomposition of intensity of energy-related CO2 emission in Chinese provinces using the LMDI method. Energy Policy 2016, 92, 369–381. [Google Scholar] [CrossRef]
  6. Su, B.; Ang, B.W. Multi-region comparisons of emission performance: The structural decomposition analysis approach. Ecol. Indic. 2016, 67, 78–87. [Google Scholar] [CrossRef]
  7. Ang, B.W. The LMDI approach to decomposition analysis: A practical guide. Energy Policy 2005, 33, 867–871. [Google Scholar] [CrossRef]
  8. Lima, F.; Nunes, M.L.; Cunha, J.; Lucena, A.F.P. A cross-country assessment of energy-related CO2 emissions: An extended kaya index decomposition approach. Energy 2016, 115, 1361–1374. [Google Scholar] [CrossRef]
  9. Zhou, X.; Zhang, M.; Zhou, M.; Zhou, M. A comparative study on decoupling relationship and influence factors between China’s regional economic development and industrial energy related carbon emissions. J. Clean. Prod. 2017, 142, 783–800. [Google Scholar] [CrossRef]
  10. Ang, B.W.; Goh, T. Carbon intensity of electricity in asean: Drivers, performance and outlook. Energy Policy 2016, 98, 170–179. [Google Scholar] [CrossRef]
  11. Andreoni, V.; Galmarini, S. Drivers in CO2 emissions variation: A decomposition analysis for 33 world countries. Energy 2016, 103, 27–37. [Google Scholar] [CrossRef]
  12. Feng, K.; Davis, S.J.; Sun, L.; Hubacek, K. Drivers of the us CO2 emissions 1997–2013. Nat. Commun. 2015, 6, 7714. [Google Scholar] [CrossRef] [PubMed] [Green Version]
  13. Gregg, J.S.; Losey, L.M.; Andres, R.J.; Blasing, T.J.; Marland, G. The temporal and spatial distribution of carbon dioxide emissions from fossil-fuel use in north america. J. Appl. Meteorol. Climatol. 2009, 48, 2528–2542. [Google Scholar] [CrossRef]
  14. Xiao, B.; Niu, D.; Guo, X. The driving forces of changes in CO2 emissions in China: A structural decomposition analysis. Energies 2016, 9, 259. [Google Scholar] [CrossRef]
  15. Cansino, J.M.; Román, R.; Ordóñez, M. Main drivers of changes in CO2 emissions in the spanish economy: A structural decomposition analysis. Energy Policy 2016, 89, 150–159. [Google Scholar] [CrossRef]
  16. Feng, K.; Hubacek, K.; Guan, D. Lifestyles, technology and CO2 emissions in China: A regional comparative analysis. Ecol. Econ. 2009, 69, 145–154. [Google Scholar] [CrossRef]
  17. Xu, S.-C.; He, Z.-X.; Long, R.-Y.; Chen, H.; Han, H.-M.; Zhang, W.-W. Comparative analysis of the regional contributions to carbon emissions in China. J. Clean. Prod. 2016, 127, 406–417. [Google Scholar] [CrossRef]
  18. Brizga, J.; Feng, K.; Hubacek, K. Drivers of CO2 emissions in the former soviet union: A country level IPAT analysis from 1990 to 2010. Energy 2013, 59, 743–753. [Google Scholar] [CrossRef]
  19. Wang, Y.; Zhao, H.; Li, L.; Liu, Z.; Liang, S. Carbon dioxide emission drivers for a typical metropolis using input output structural decomposition analysis. Energy Policy 2013, 58, 312–318. [Google Scholar] [CrossRef]
  20. Arvin, M.B.; Pradhan, R.P.; Norman, N.R. Transportation intensity, urbanization, economic growth, and CO2 emissions in the G-20 countries. Util. Policy 2015, 35, 50–66. [Google Scholar] [CrossRef]
  21. Wu, R.; Geng, Y.; Dong, H.; Fujita, T.; Tian, X. Changes of CO2 emissions embodied in China Japan trade: Drivers and implications. J. Clean. Prod. 2016, 112, 4151–4158. [Google Scholar] [CrossRef]
  22. Ang, B.W.; Su, B. Carbon emission intensity in electricity production: A global analysis. Energy Policy 2016, 94, 56–63. [Google Scholar] [CrossRef]
  23. Xu, S.-C.; He, Z.-X.; Long, R.-Y.; Chen, H. Factors that influence carbon emissions due to energy consumption based on different stages and sectors in China. J. Clean. Prod. 2016, 115, 139–148. [Google Scholar] [CrossRef]
  24. Seo, J.; Park, J.; Oh, Y.; Park, S. Estimation of total transport CO2 emissions generated by medium-and heavy-duty vehicles (MHDVS) in a sector of korea. Energies 2016, 9, 638. [Google Scholar] [CrossRef]
  25. Singh, S.; Kennedy, C. Estimating future energy use and CO2 emissions of the world’s cities. Environ. Pollut. 2015, 203, 271–278. [Google Scholar] [CrossRef] [PubMed]
  26. Aydin, G. The development and validation of regression models to predict energy-related CO2 emissions in Turkey. Energy Sources Part B Econ. Plan. Policy 2015, 10, 176–182. [Google Scholar] [CrossRef]
  27. Promjiraprawat, K.; Limmeechokchai, B. Assessment of thailand’s energy policies and CO2 emissions: Analyses of energy efficiency measures and renewable power generation. Energies 2012, 5, 3074–3093. [Google Scholar] [CrossRef]
  28. Deng, X.; Han, J.; Yin, F. Net energy, CO2 emission and land-based cost-benefit analyses of Jatropha biodiesel: A case study of the panzhihua region of Sichuan province in China. Energies 2012, 5, 2150–2164. [Google Scholar] [CrossRef]
  29. Ramanathan, R. An analysis of energy consumption and carbon dioxide emissions in countries of the middle East and North Africa. Energy 2005, 30, 2831–2842. [Google Scholar] [CrossRef]
  30. Deng, M.; Li, W.; Hu, Y. Decomposing industrial energy-related CO2 emissions in Yunnan province, China: Switching to low-carbon economic growth. Energies 2016, 9, 23. [Google Scholar] [CrossRef]
  31. World Bank. Available online: http://data.worldbank.org/indicator (accessed on 12 October 2016).
  32. Wang, J.F.; Li, X.H.; Christakos, G.; Liao, Y.L.; Zhang, T.; Gu, X.; Zheng, X.Y. Geographical detectors based health risk assessment and its application in the neural tube defects study of the Heshun region, China. Int. J. Geogr. Inf. Sci. 2010, 24, 107–127. [Google Scholar] [CrossRef]
  33. Zhu, H.; Jiaming, L.; Hui, T.; Le, L.; Run, W. Temporal-spatial pattern and contributing factors of urban rbds in Beijing. Acta Geogr. Sin. 2015, 70, 1215–1228. [Google Scholar]
  34. Ding, Y.; Cai, J.; Ren, Z.; Yang, Z. Spatial disparities of economic growth rate of China’s national-level ETDZs and their determinants based on geographical detector analysis. Progr. Geogr. 2014, 33, 657–666. [Google Scholar]
  35. Hu, Y.; Wang, J.; Li, X.; Ren, D.; Zhu, J. Geographical detector-based risk assessment of the under-five mortality in the 2008 Wenchuan earthquake, China. PLoS ONE 2011, 6, e21427. [Google Scholar] [CrossRef] [PubMed]
Figure 1. Conceptual framework of impact factors on energy-related CO2 emissions growth rate.
Energies 10 00367 g001
Figure 2. Change of global energy-related CO2 emissions (1990–2014). (a) The average annual change; (b) the average annual growth rate.
Energies 10 00367 g002aEnergies 10 00367 g002b
Figure 3. Energy-related CO2 emissions of change (1990–2014) from energy. (a) The amount of change; (b) Average annual growth rate.
Energies 10 00367 g003
Table 1. Index system for energy-related CO2 emissions (ECEs) growth rate.
IndicatorSpecific ContentsFormulaData Source
X1Population growth rate(Pi+1Pi)/PiWB [31]
X2per-capital Gross Domestic Product growth rate(GPi+1GPi)/GPiWB [31]
X3energy intensity of the economy growth rate(EIi+1EIi)/EIiIEA [1]
X4carbon intensity of coal consumption growth rate ( C I i + 1 c o a l C I i c o a l ) / C I i c o a l IEA [1]
X5carbon intensity of oil consumption growth rate ( C I i + 1 o i l C I i o i l ) / C I i o i l IEA [1]
X6carbon intensity of gas consumption growth rate ( C I i + 1 g a s C I i g a s ) / C I i g a s IEA [1]
Table 2. Volume of variation and average annual growth rate of energy CO2 emissions and their factors in the world from 1990 to 2014.
RegionPGPEICIcoalCIoilCIgasECEs
Value (106)Rate (%)Value (106 $)Rate (%)Value (kg/$)Rate (%)Value (t)Rate (%)Value (t)Rate (%)Value (t)Rate (%)Value (106t)Rate (%)
O-AM114.151.1110.851.35−2.92−1.66−113.30−0.25223.610.38616.251.79729.480.52
O-AO22.170.4610.811.29−0.46−0.43425.382.44−105.57−0.53297.984.48639.561.42
O-EU60.450.488.631.23−1.68−1.55−601.95−1.75−235.66−0.67289.081.75−508.99−0.58
NO-EE−0.96−0.011.560.91−11.97−2.18−664.33−2.71−641.52−3.17−215.20−0.71−1493.94−1.97
NO-AF529.232.580.451.13−3.32−0.85174.272.39236.702.88165.325.74576.303.12
NO-AS1012.911.312.836.04−11.81−2.497298.566.001576.844.58709.358.819623.295.83
NO-AM136.071.403.221.78−0.54−0.3654.503.26374.442.77191.784.49620.723.18
NO-ME97.002.393.441.822.800.9511.4810.26548.813.78631.607.041191.885.00
World1971.021.332.911.43−1.87−0.886584.622.471977.640.942686.162.3111378.291.90
Table 3. Coefficient of variation of energy-related CO2 emissions growth rate in the eight types of regions.
Region1990200020102014
O-AM1.661.631.571.55
O-AO1.321.131.021.06
O-EU1.381.261.211.26
NO-EE2.733.093.073.05
NO-AF2.462.442.392.34
NO-AS2.722.73.143.15
NO-AM1.81.961.922.05
NO-ME1.281.331.31.3
World3.363.573.874.05
Table 4. The determinant power of impact factors on the energy-related CO2 emissions growth rate in the eight types of regions and the world from 1990 to 2014.
RegionX1X2X3X4X5X6
O-AM0.518 ***0.342 ***0.219 ***0.0800.0610.037
O-AO0.506 ***0.393 ***0.256 ***0.0250.0020.017
O-EU0.527 ***0.351 ***0.281 ***0.053 ***0.096 ***0.008
NO-EE0.428 ***0.195 ***0.260 ***0.0030.050 *0.025 **
NO-AF0.219 ***0.172 ***0.147 ***0.082 ***0.0000.123 ***
NO-AS0.421 ***0.334 ***0.155 ***0.0010.0040.073 ***
NO-AM0.122 ***0.110 ***0.067 ***0.053 ***0.0000.054 ***
NO-ME0.176 ***0.107 ***0.035 **0.125 ***0.0020.012
World0.240 ***0.178 ***0.131 ***0.016 ***0.009 *0.051 ***
Note: “*” means 0.01 ≤ p-value < 0.05; “**” means 0.001 ≤ p-value < 0.01; “***” means p-value < 0.001; the smaller the p-value, the stronger the evidence against the null hypothesis. X1 denotes Population growth rate; X2 denotes per-capital Gross Domestic Product growth rate; X3 denotes energy intensity of the economy growth rate; X4 denotes carbon intensity of coal consumption growth rate; X5 denotes carbon intensity of oil consumption growth rate; X6 denotes carbon intensity of gas consumption growth rate.
Table 5. Proportion and rank of decision force of detector factors in individual regions.
RegionX1X2X3X4X5X6
%Rank%Rank%Rank%Rank%Rank%Rank
O-AM411272173645536
O-AO42133221324-615
O-EU401272213457416
NO-EE451203272-65435
NO-AF291232203115-6174
NO-AS431342163-6-574
NO-AM301272173135-6134
NO-ME39123384272-635
World381282213351684
Note: “-”denotes that the value is less than 0.5 or less.

