
Numerical Study of the Effects of Thermal Barrier Coating and Turbulence Intensity on Cooling Performances of a Nozzle Guide Vane

Abstract
:1. Introduction
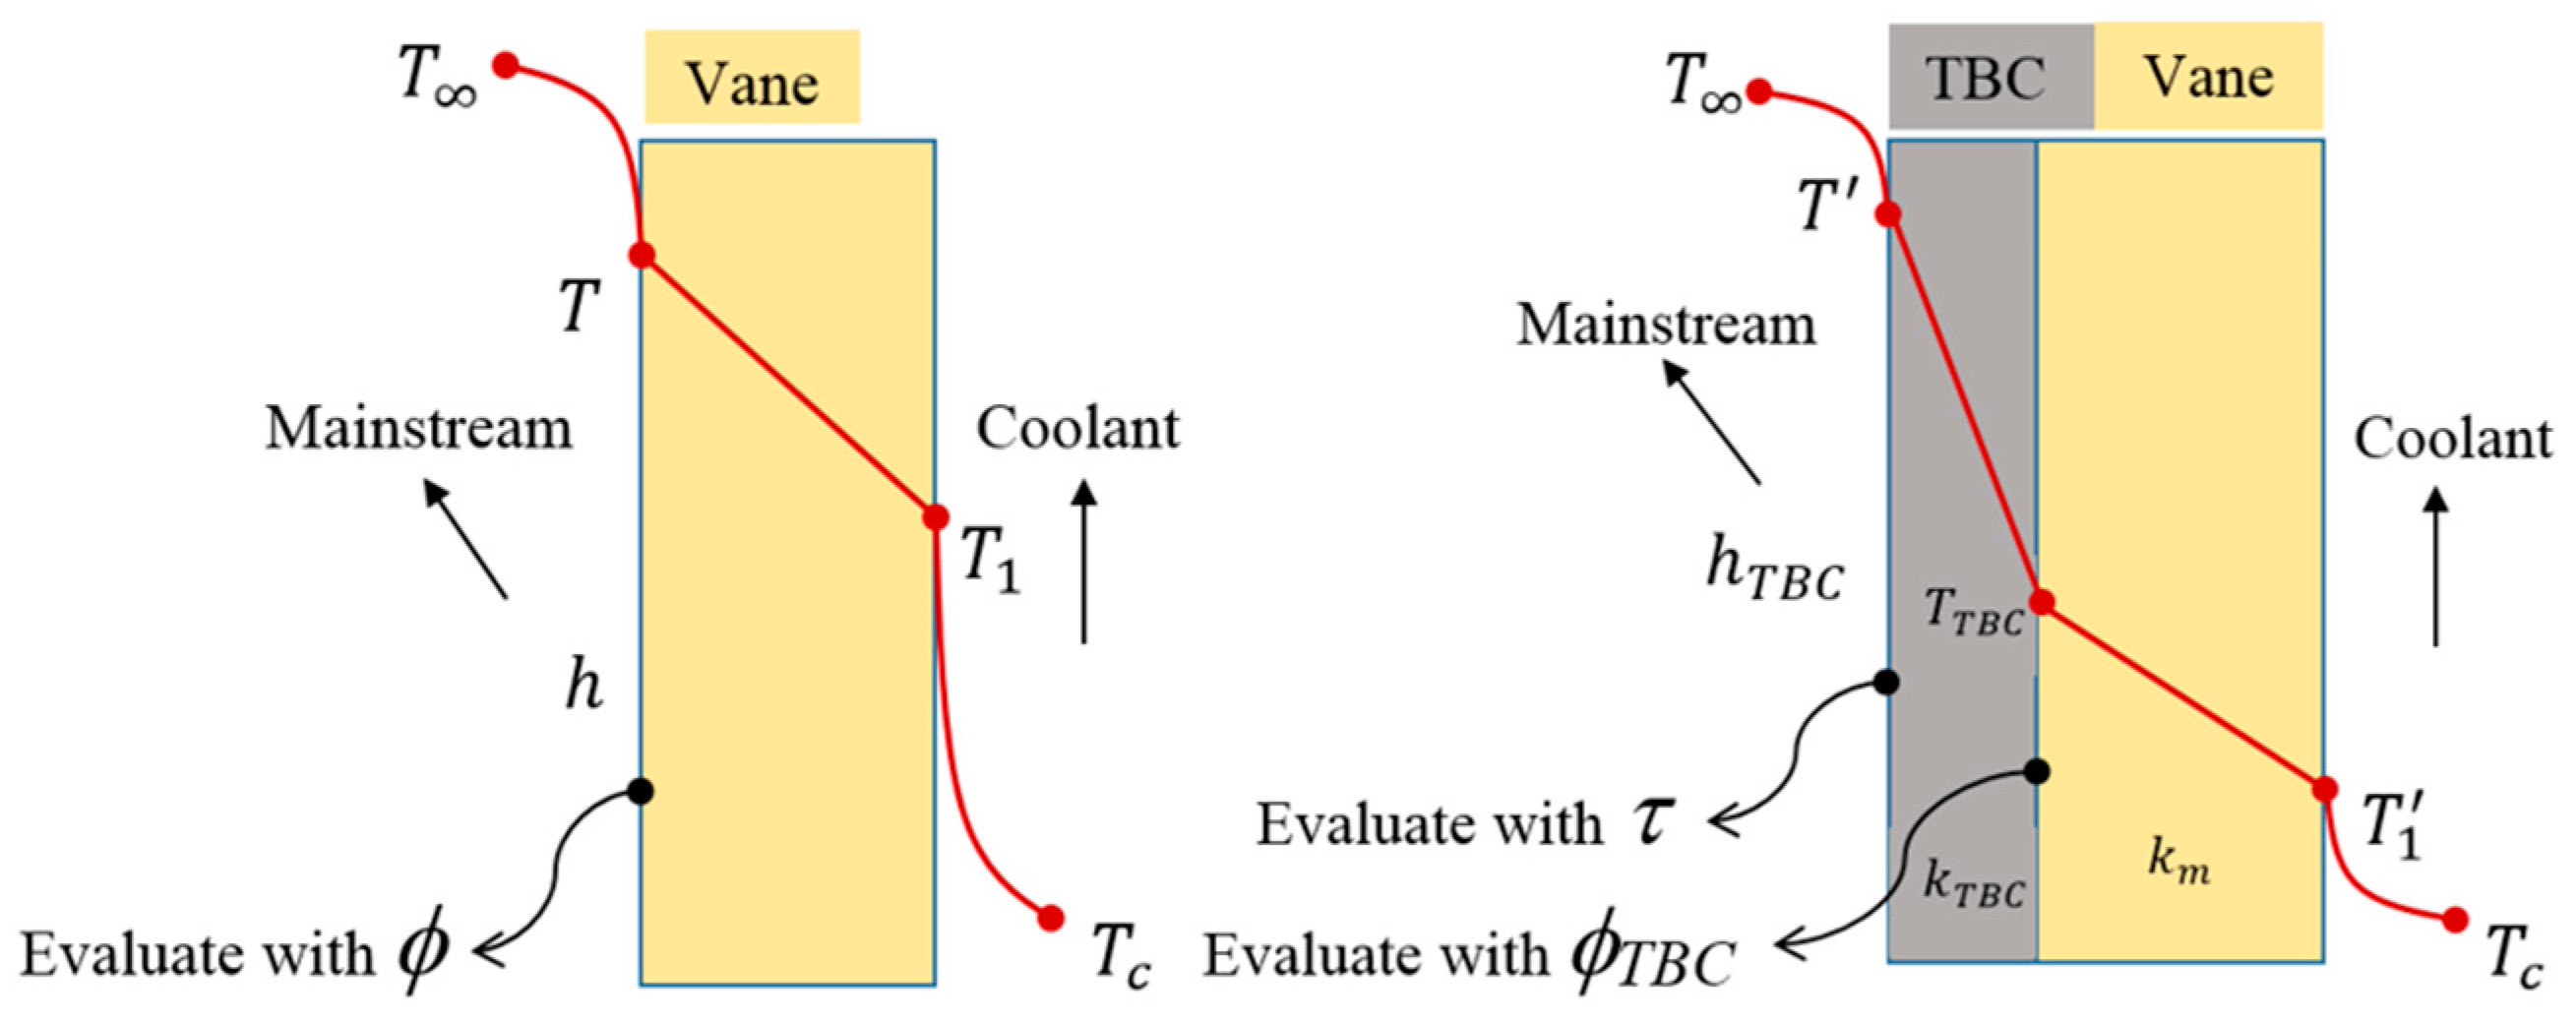
2. Thermal Parameters
- (1)
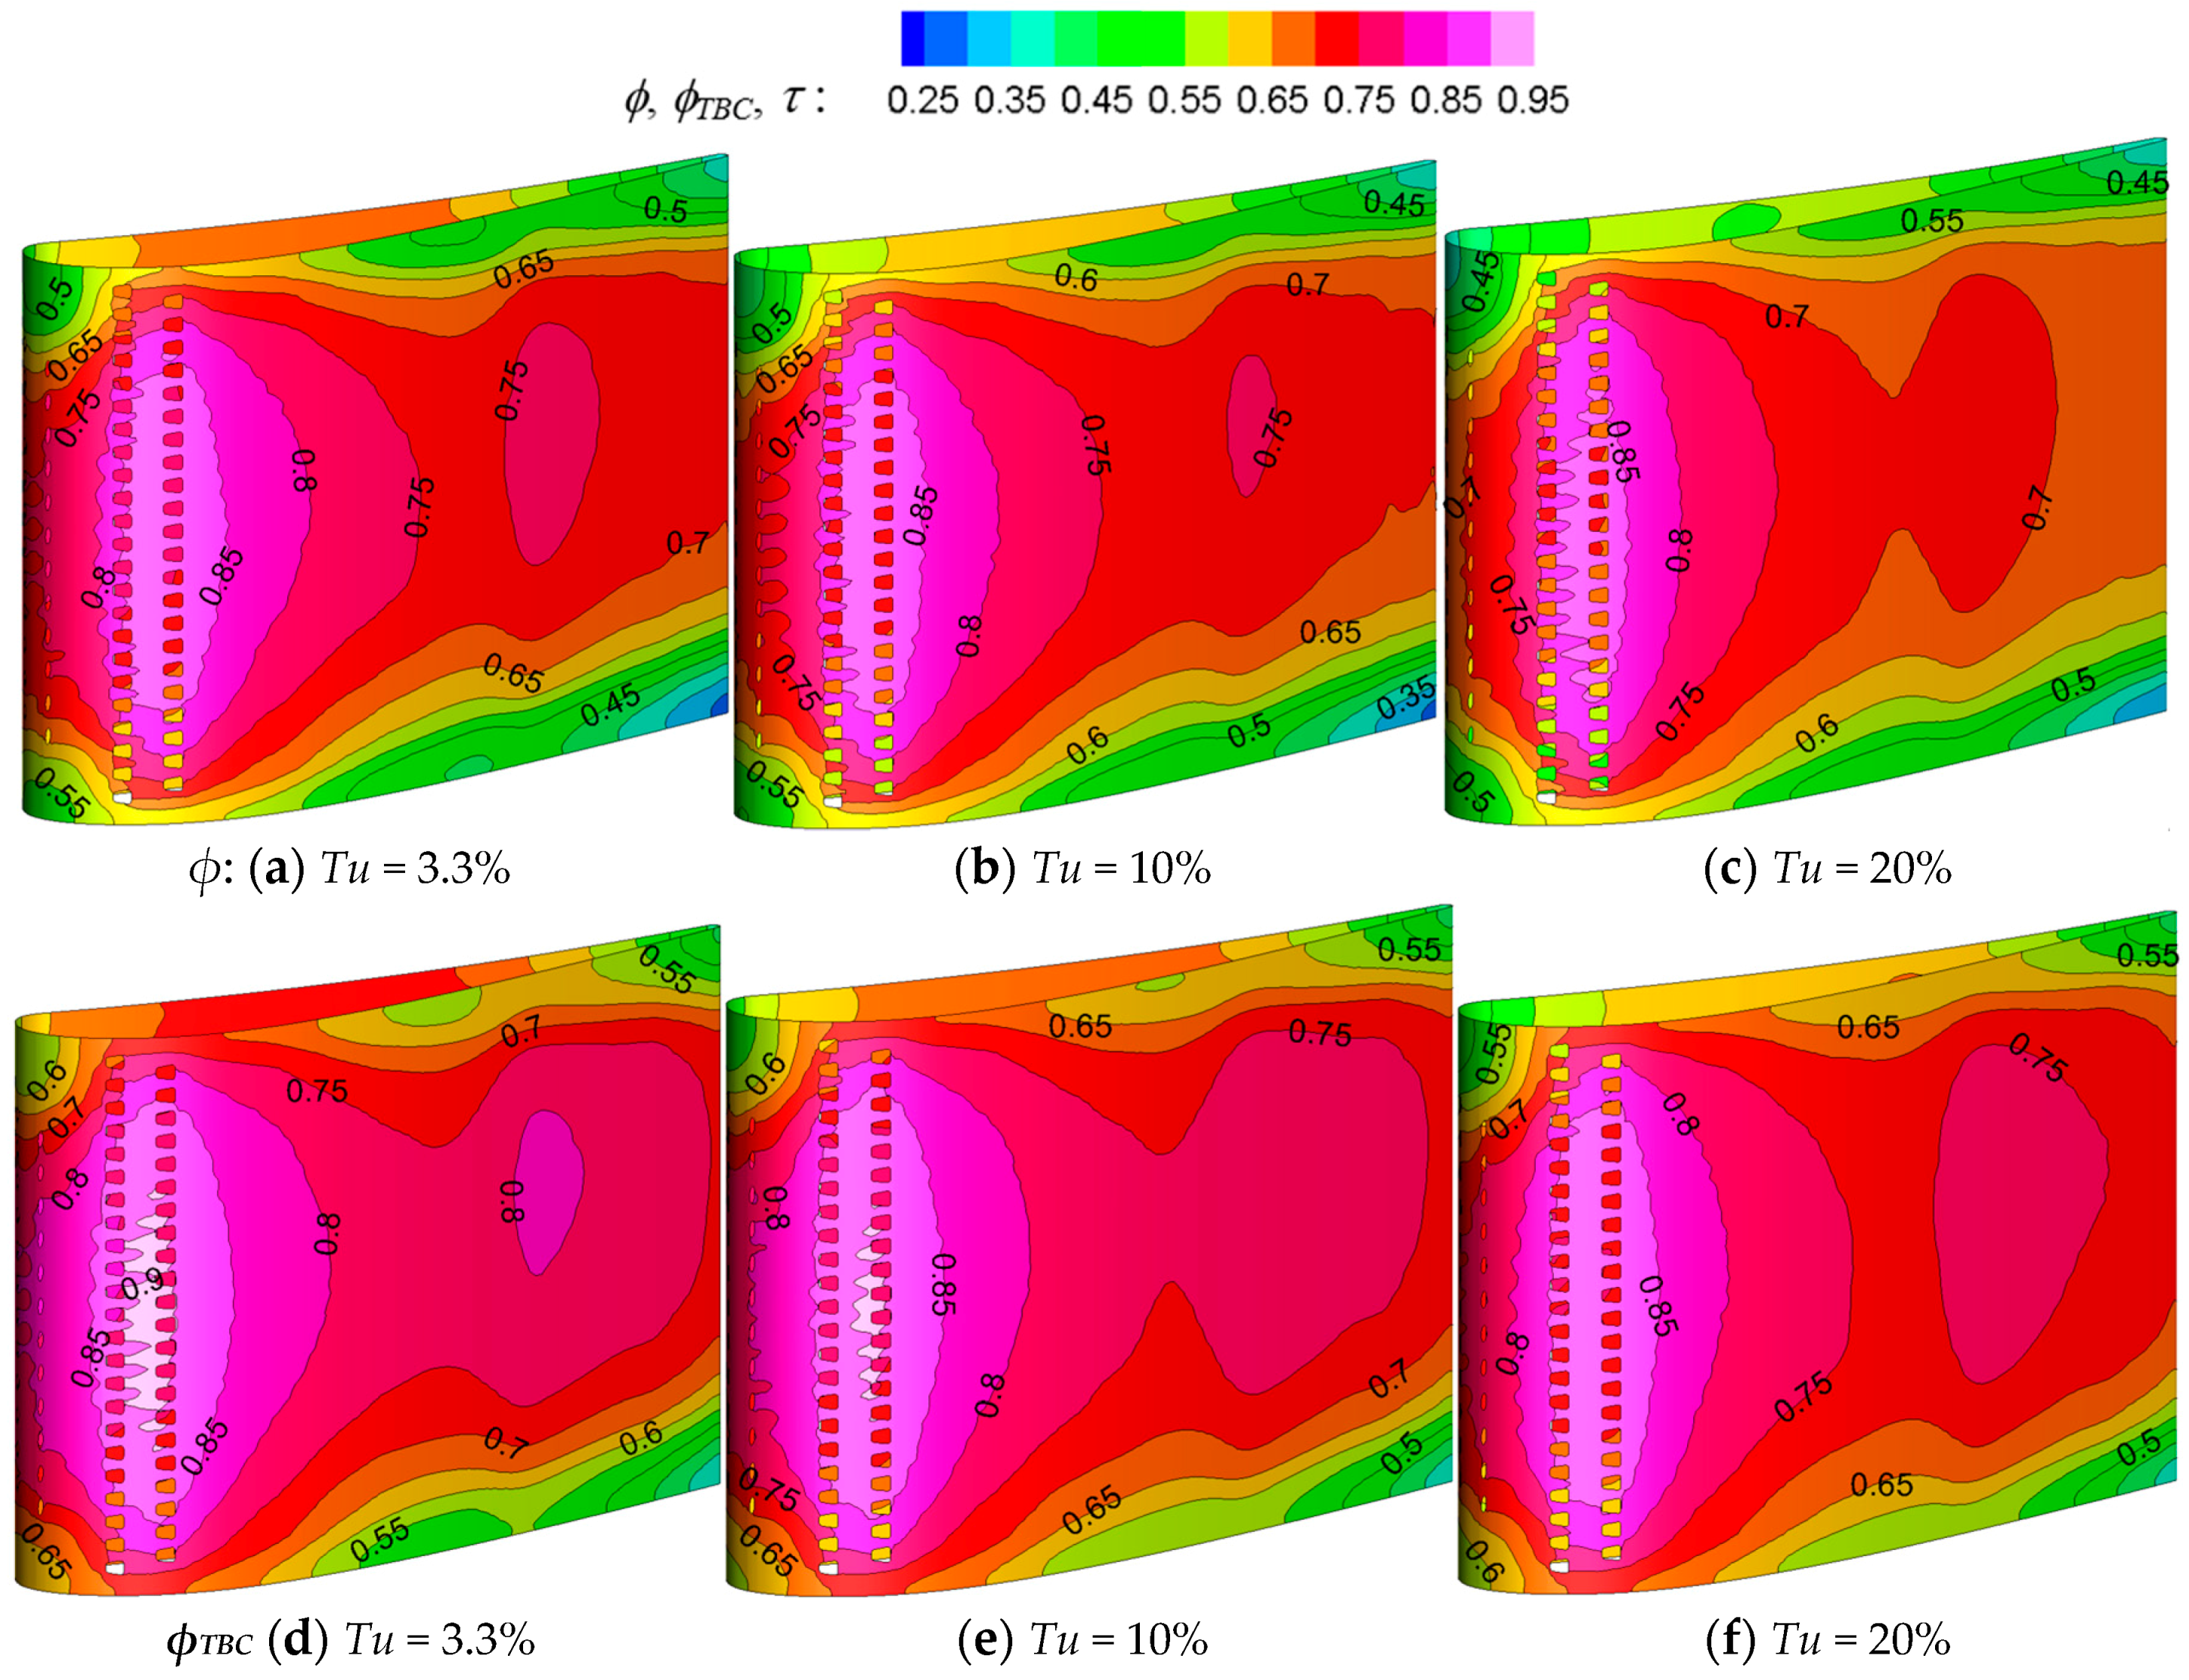
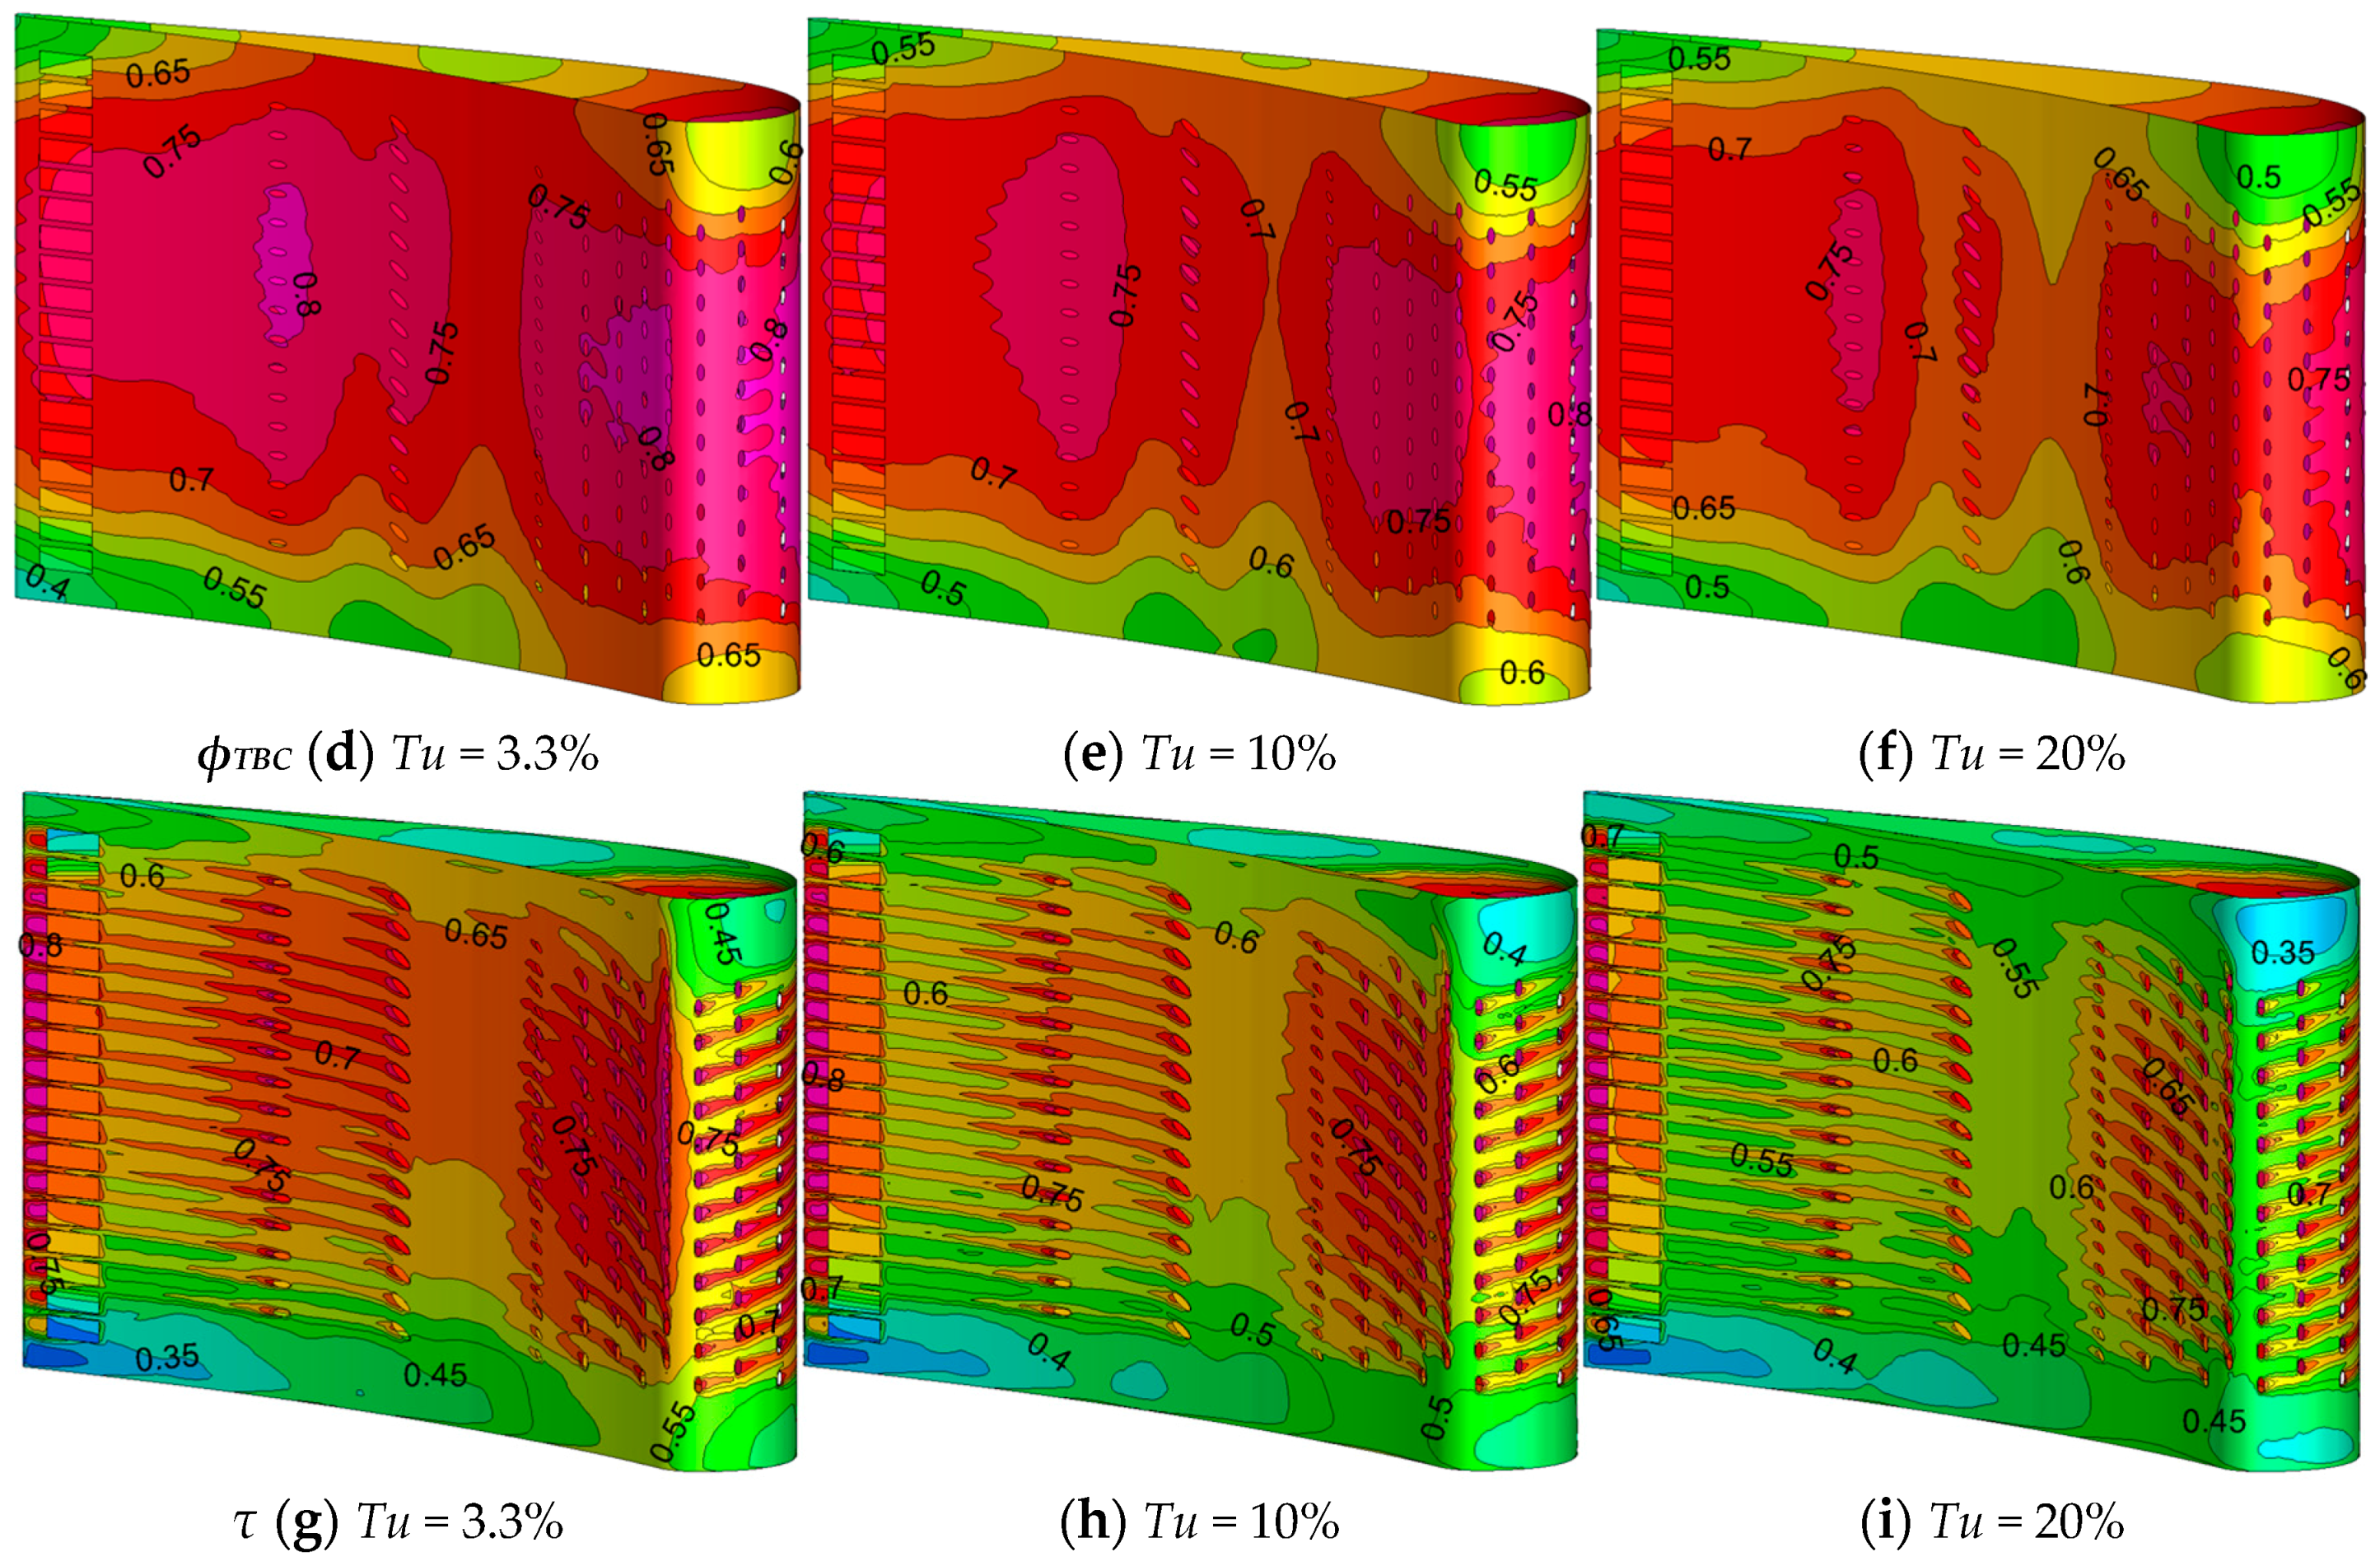
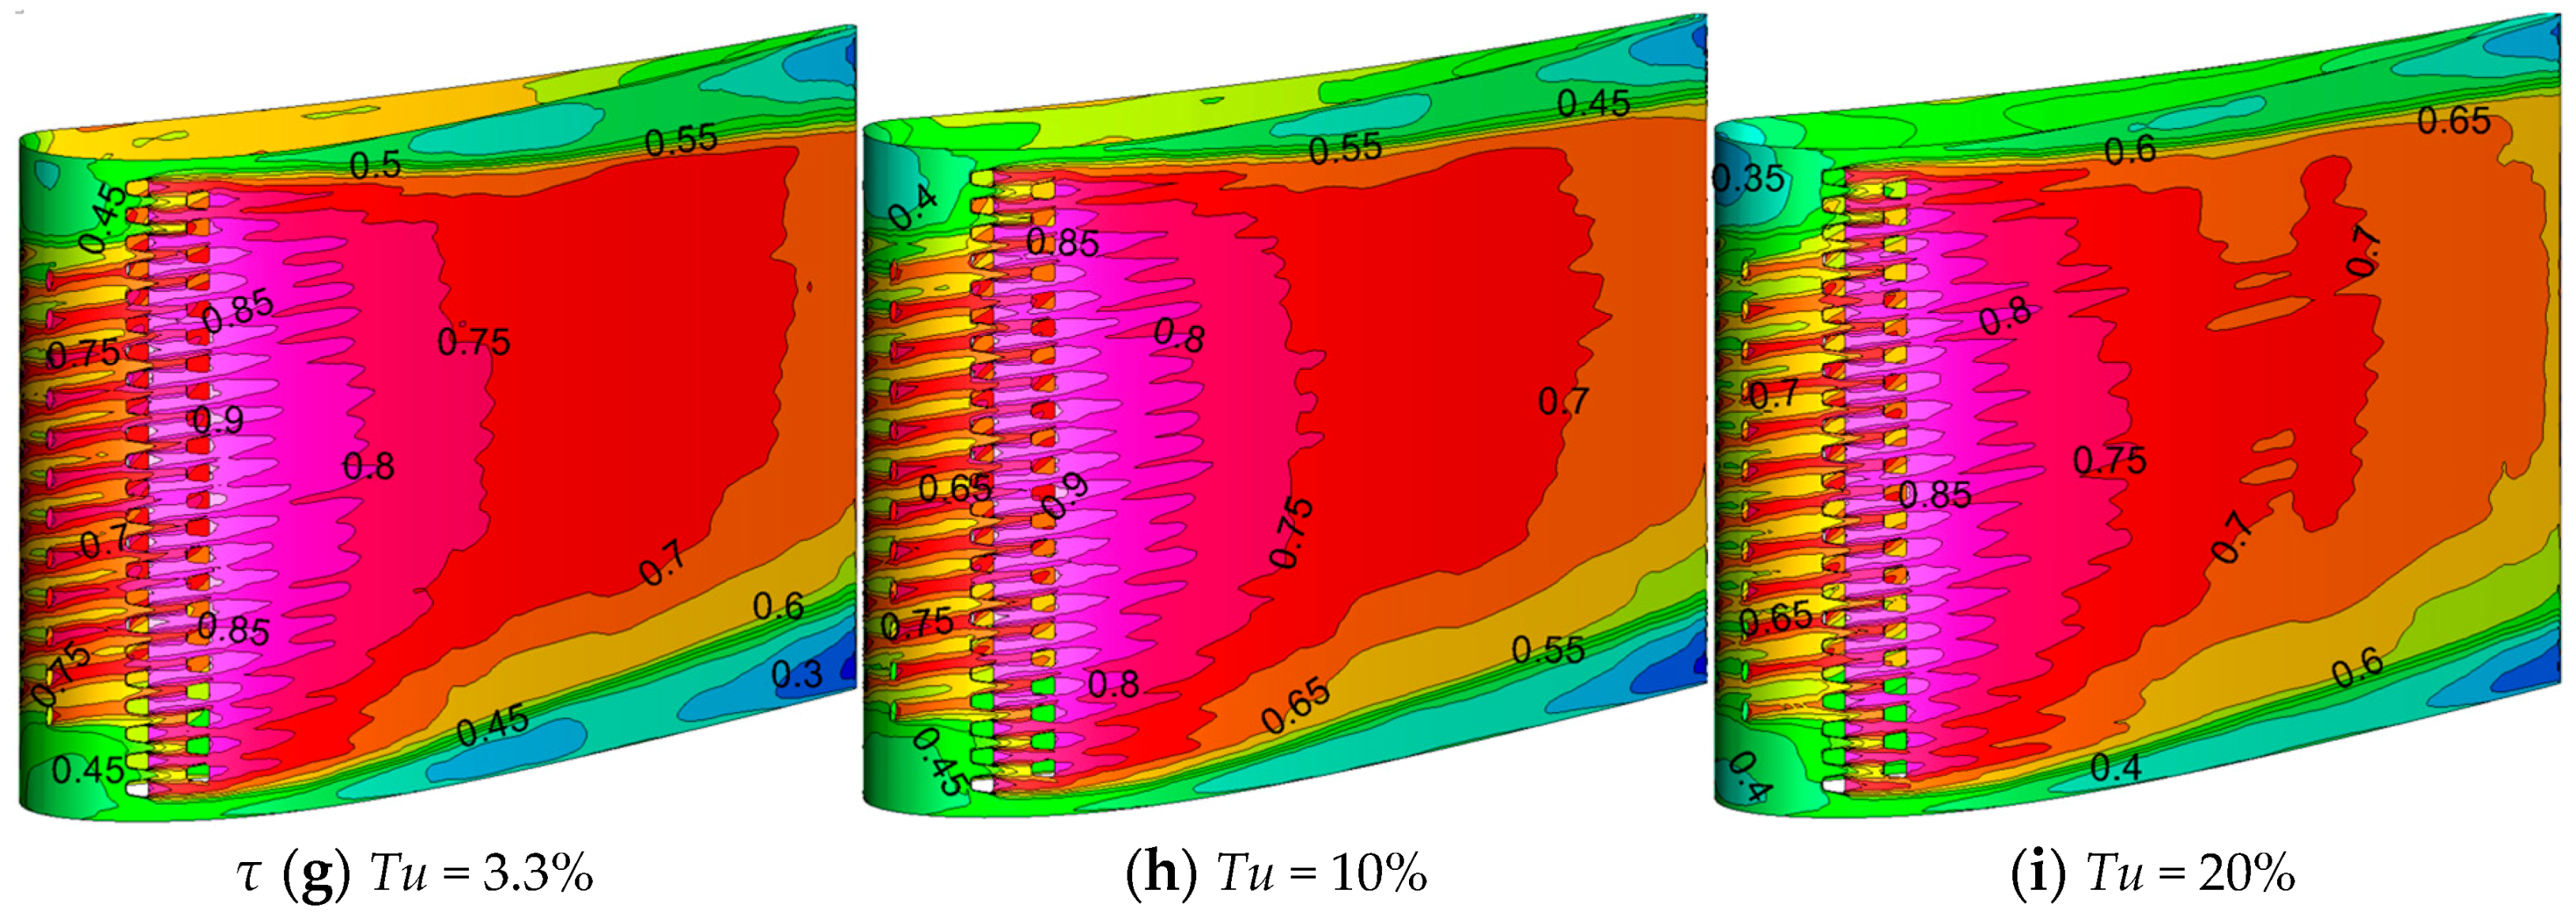
- Overall cooling effectiveness (φ):where . This parameter is used to evaluate the cooling performance on the outside metal surface using the CHT analysis.
- (2)
- TBC effectiveness (τ):This parameter is defined to discuss the effect of TBC on the outside temperature of TBC.
- (3)
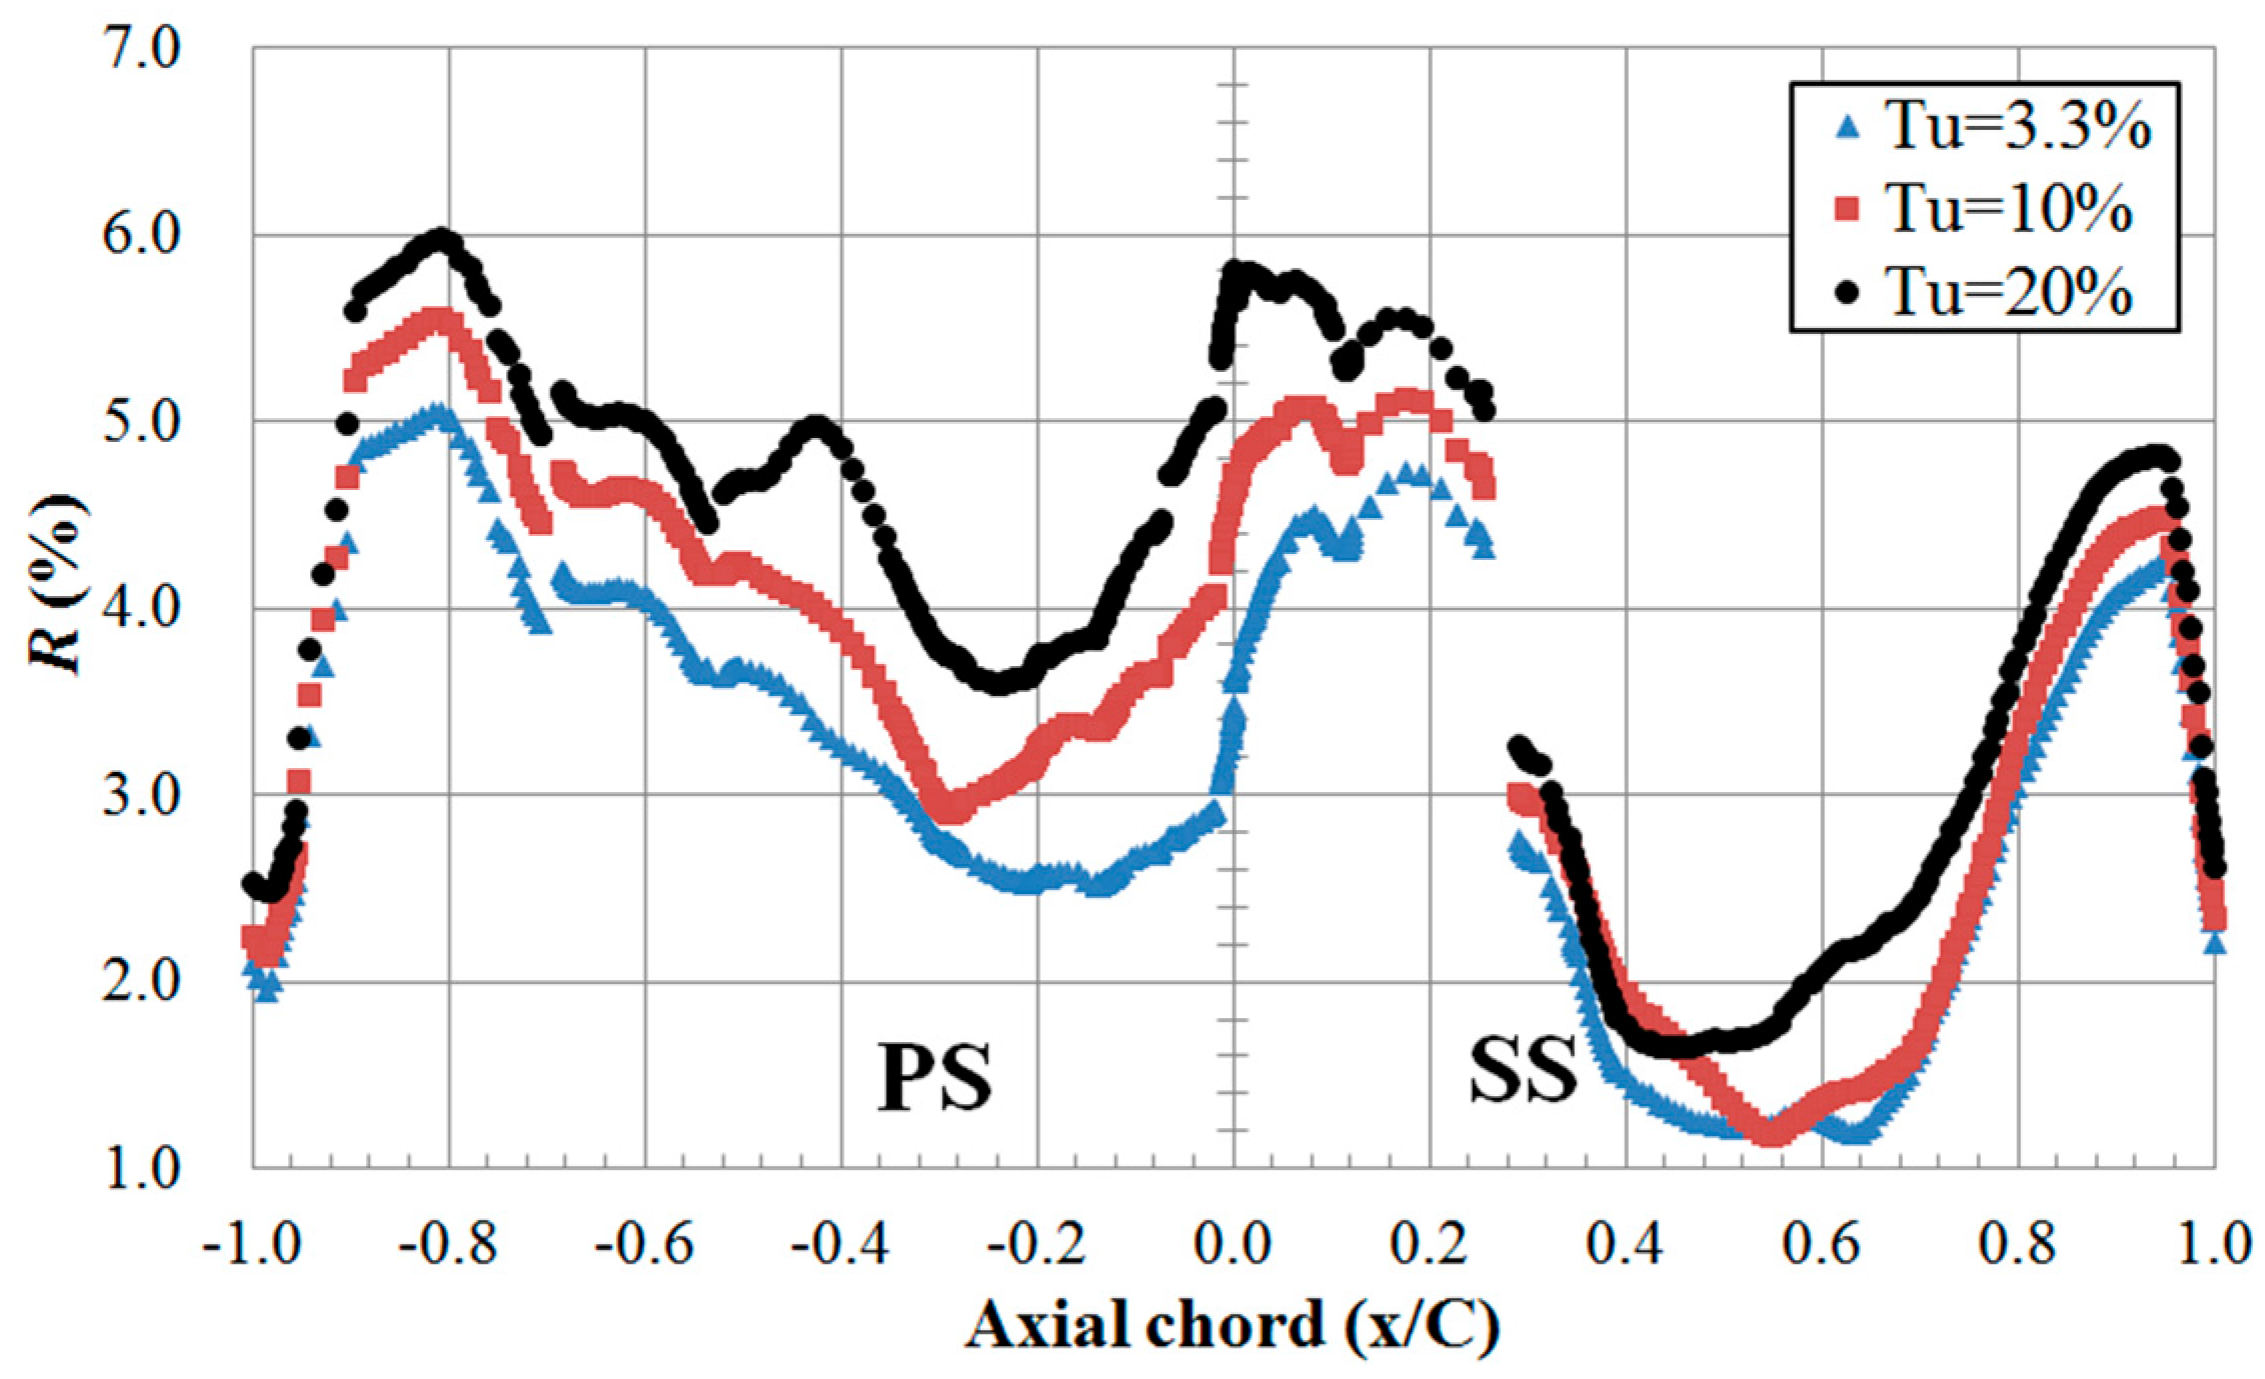
- Percentage of temperature reduction (R):This parameter is used to evaluate the ability of TBC to reduce the metal temperature of the vane.
- (4)
- Increment of overall cooling effectiveness (Δφ):This parameter is used to evaluate the effect of TBC on the metal temperature at each Tu.
- (5)
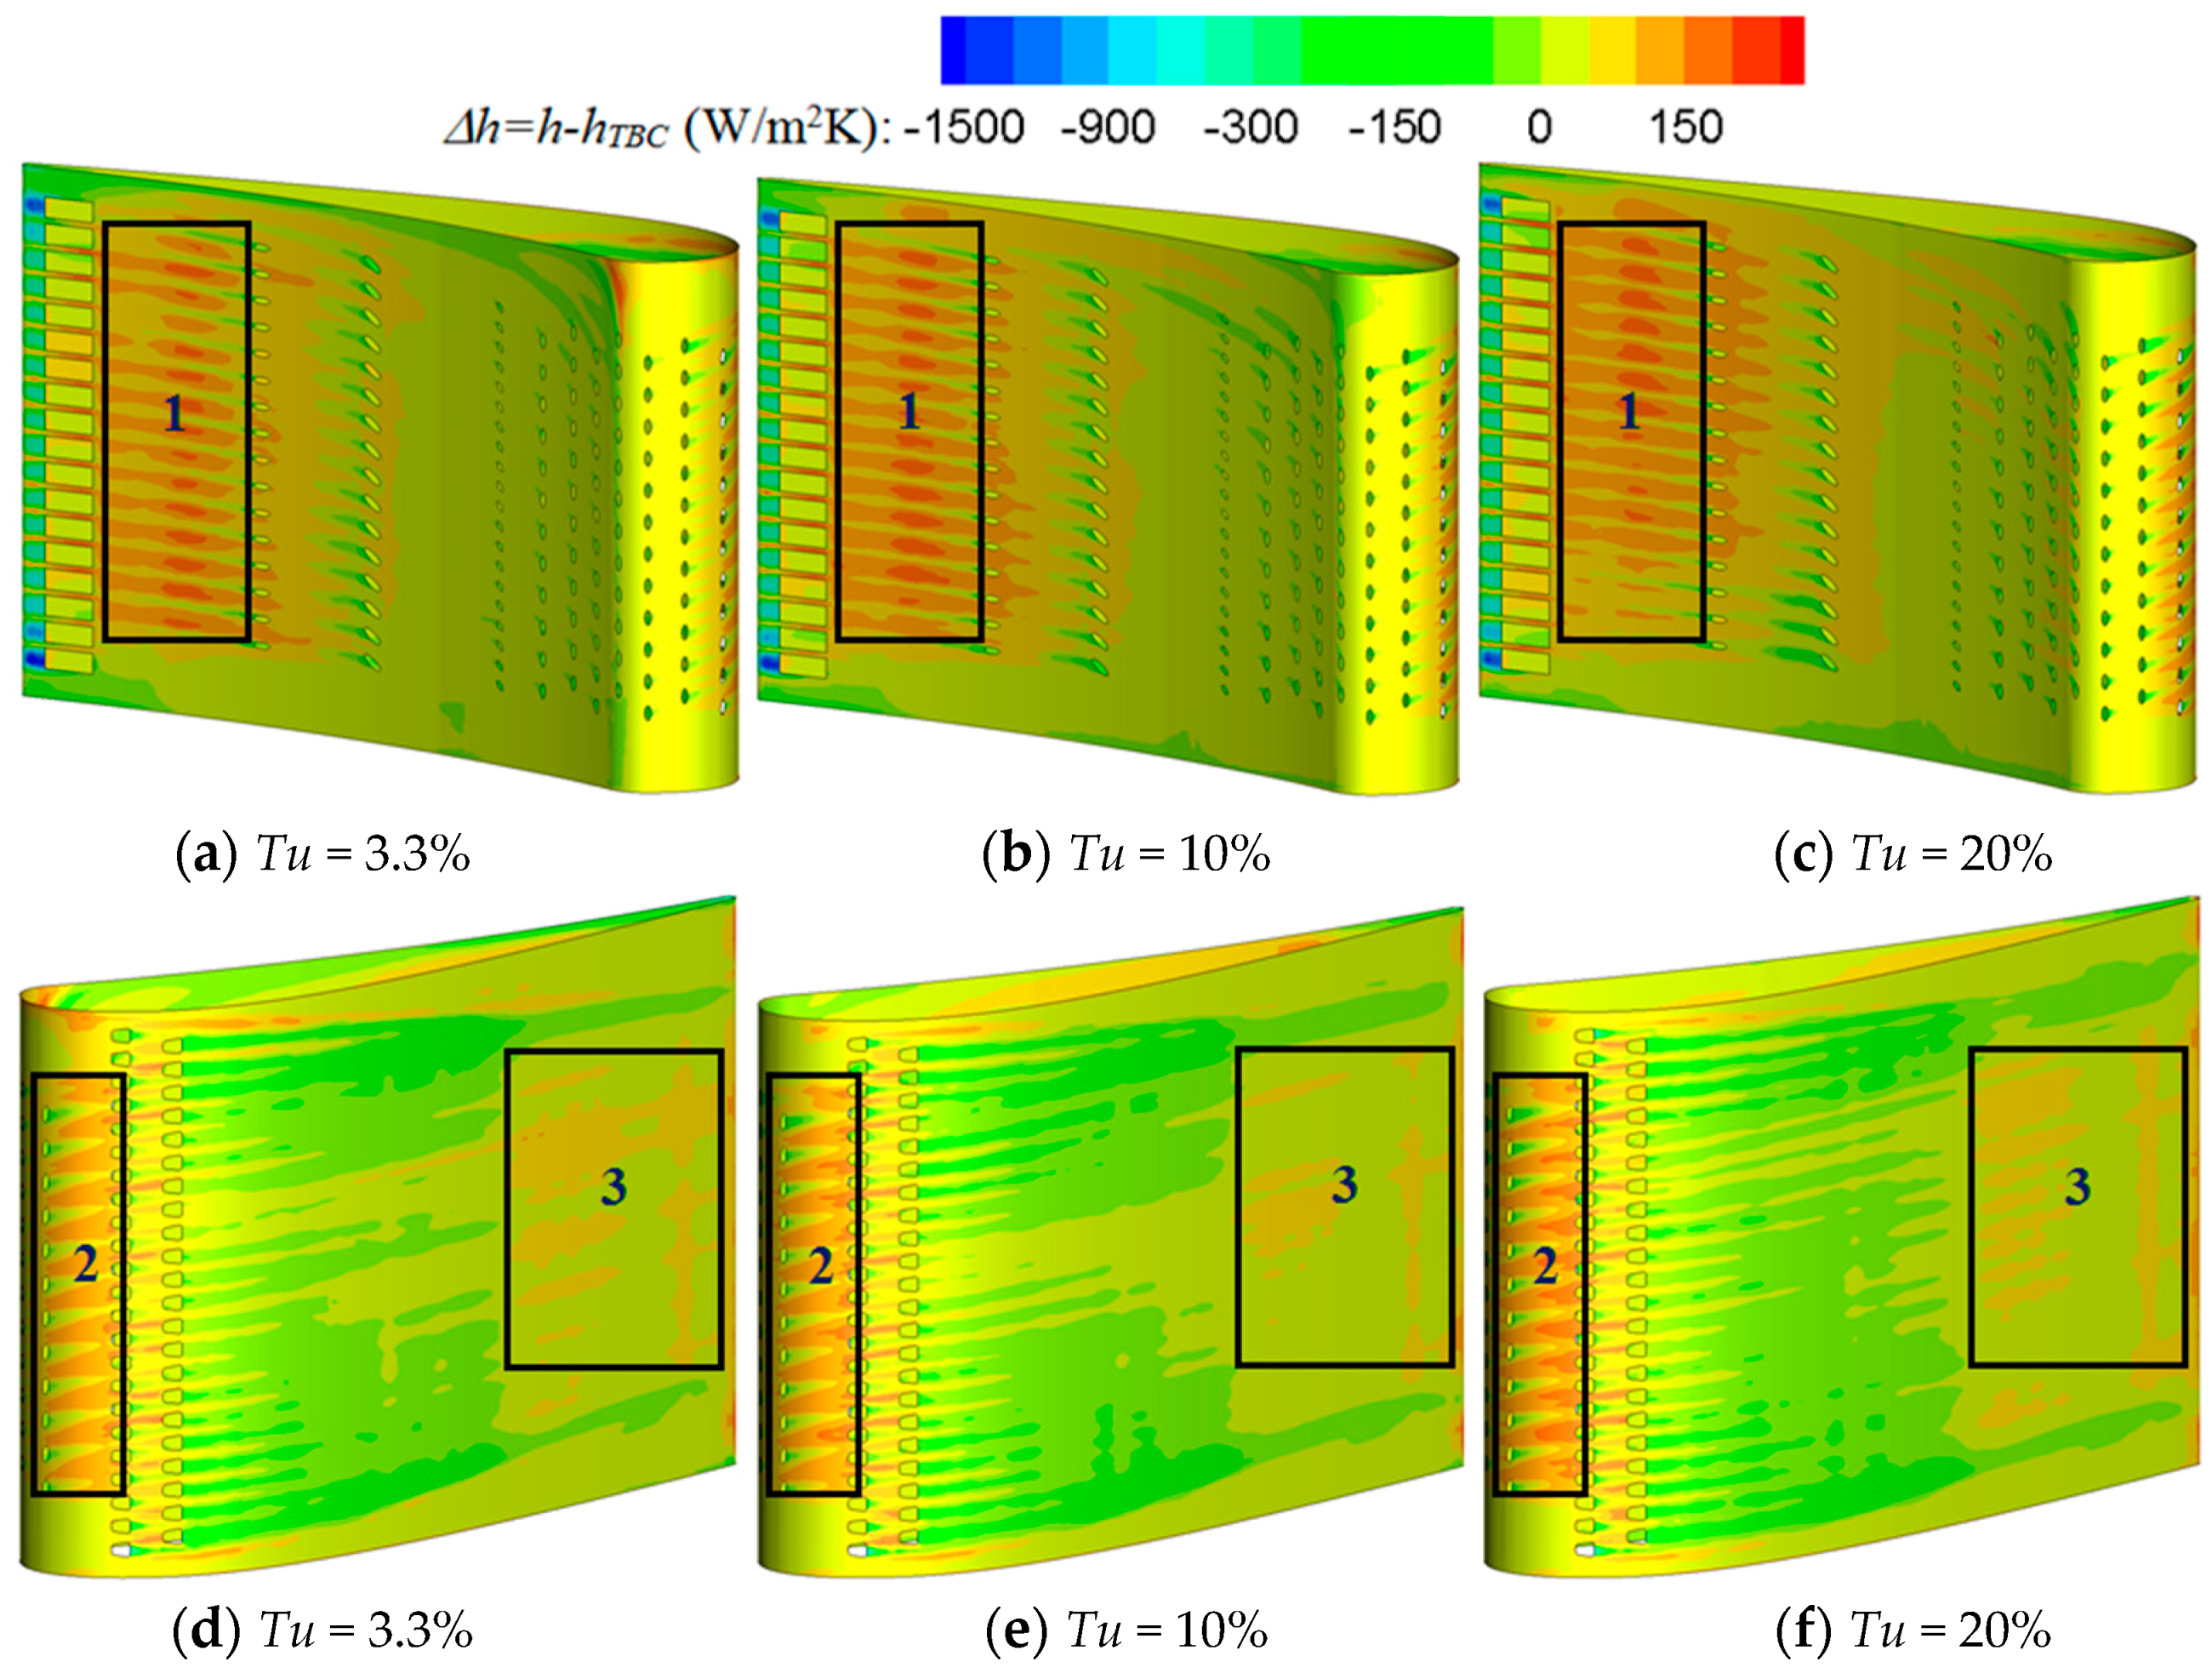
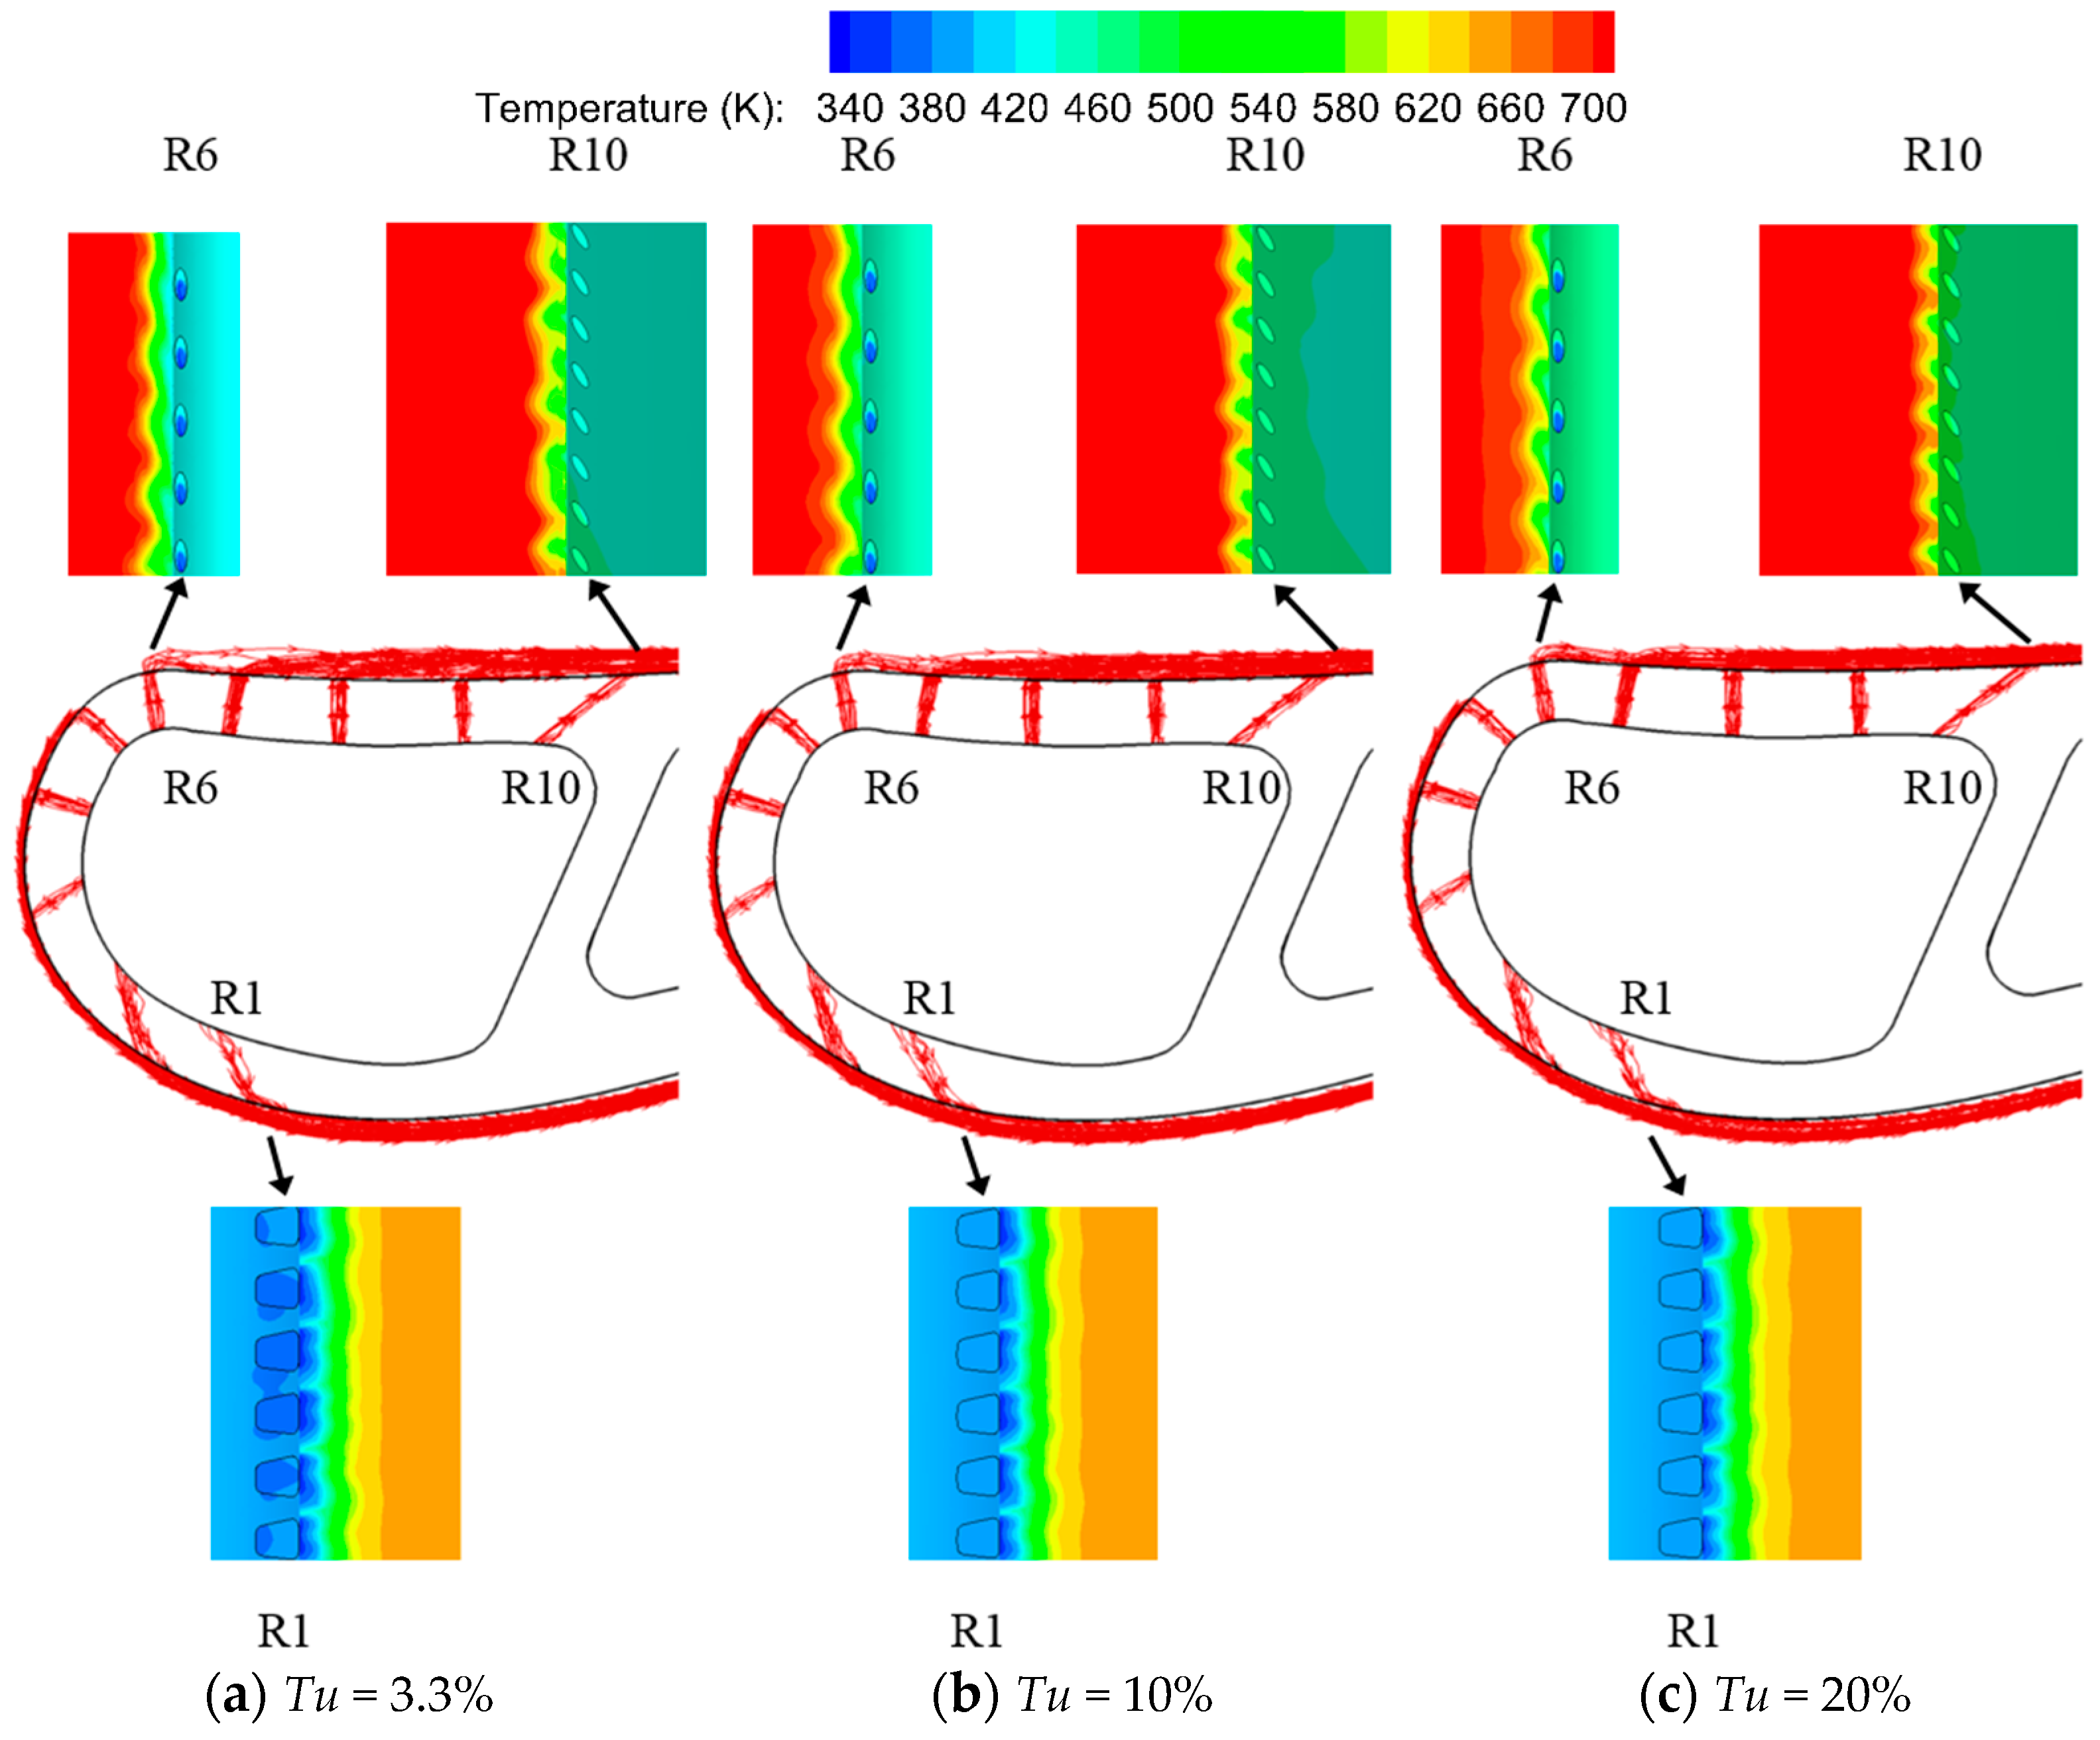
- Variation of heat transfer coefficient (Δh):Δh = h − hTBCIt is worth noting that the heat transfer coefficient defined by Equation (6) is based on the local wall surface temperature and mainstream temperature. A negative h means that heat transfers from the surface to the mainstream. On the other hand, h is positive when heat transfers from the mainstream to the vane surface.
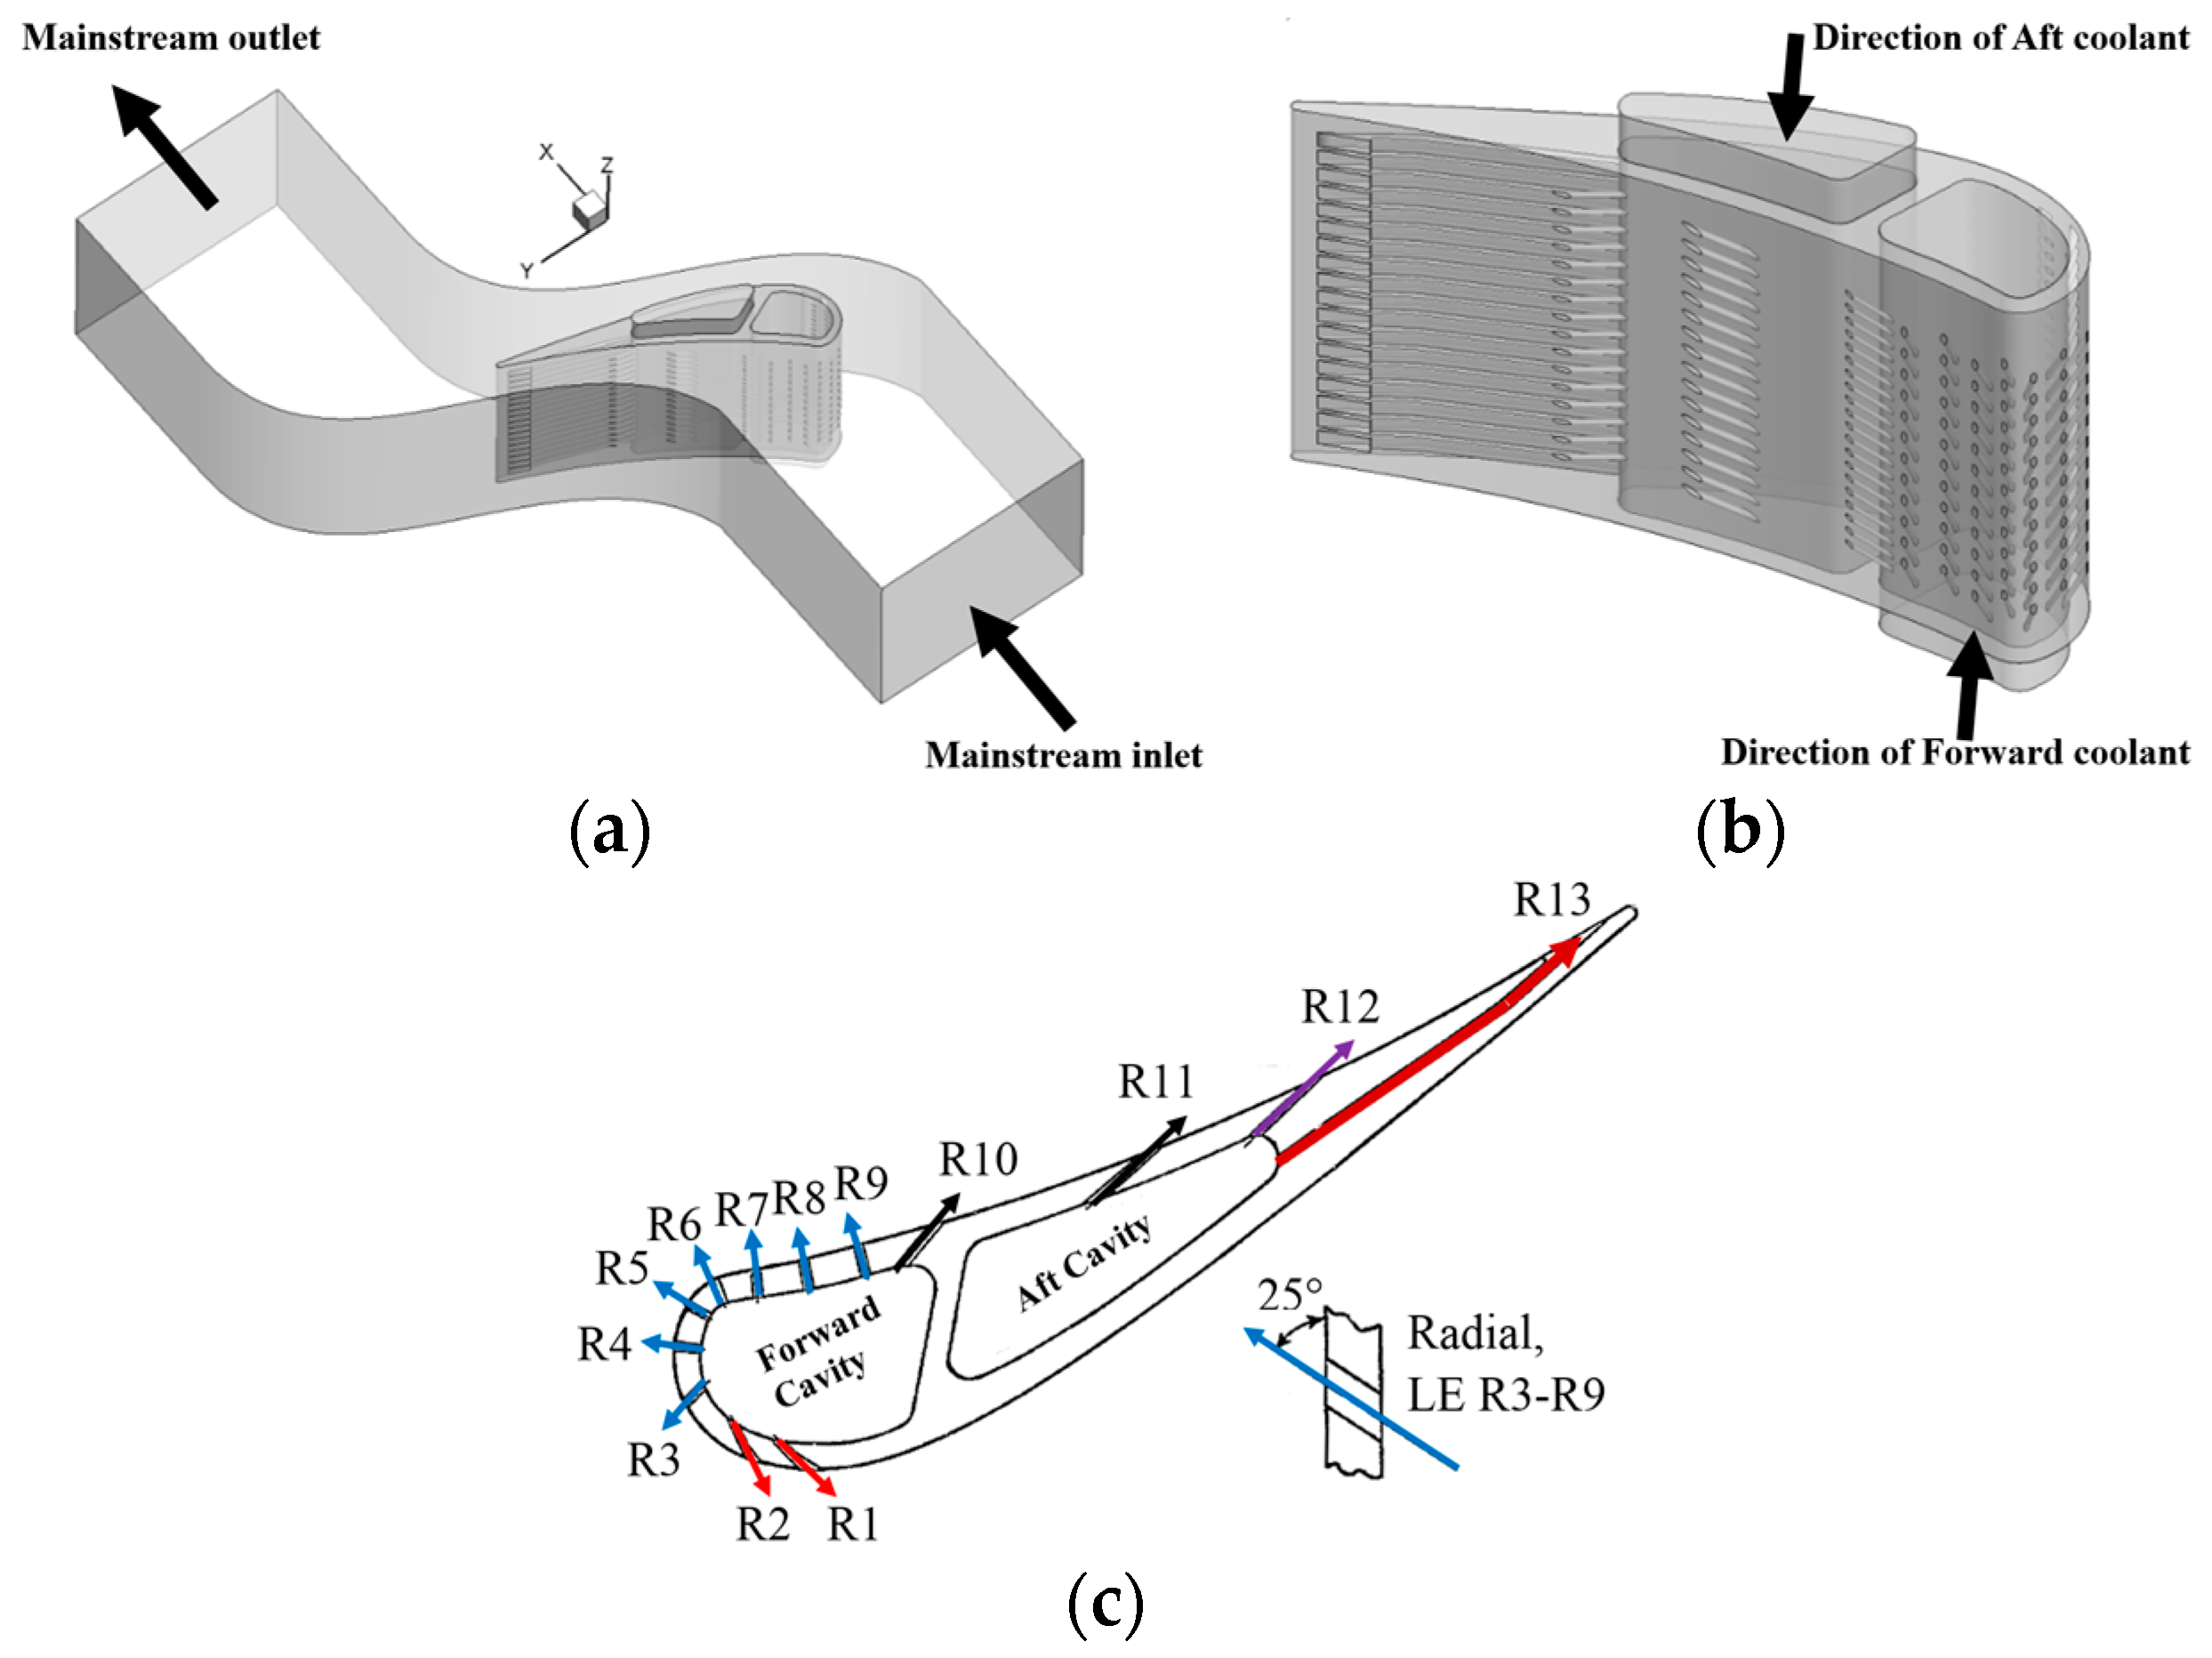
3. Geometric Configuration
4. Computational Procedures
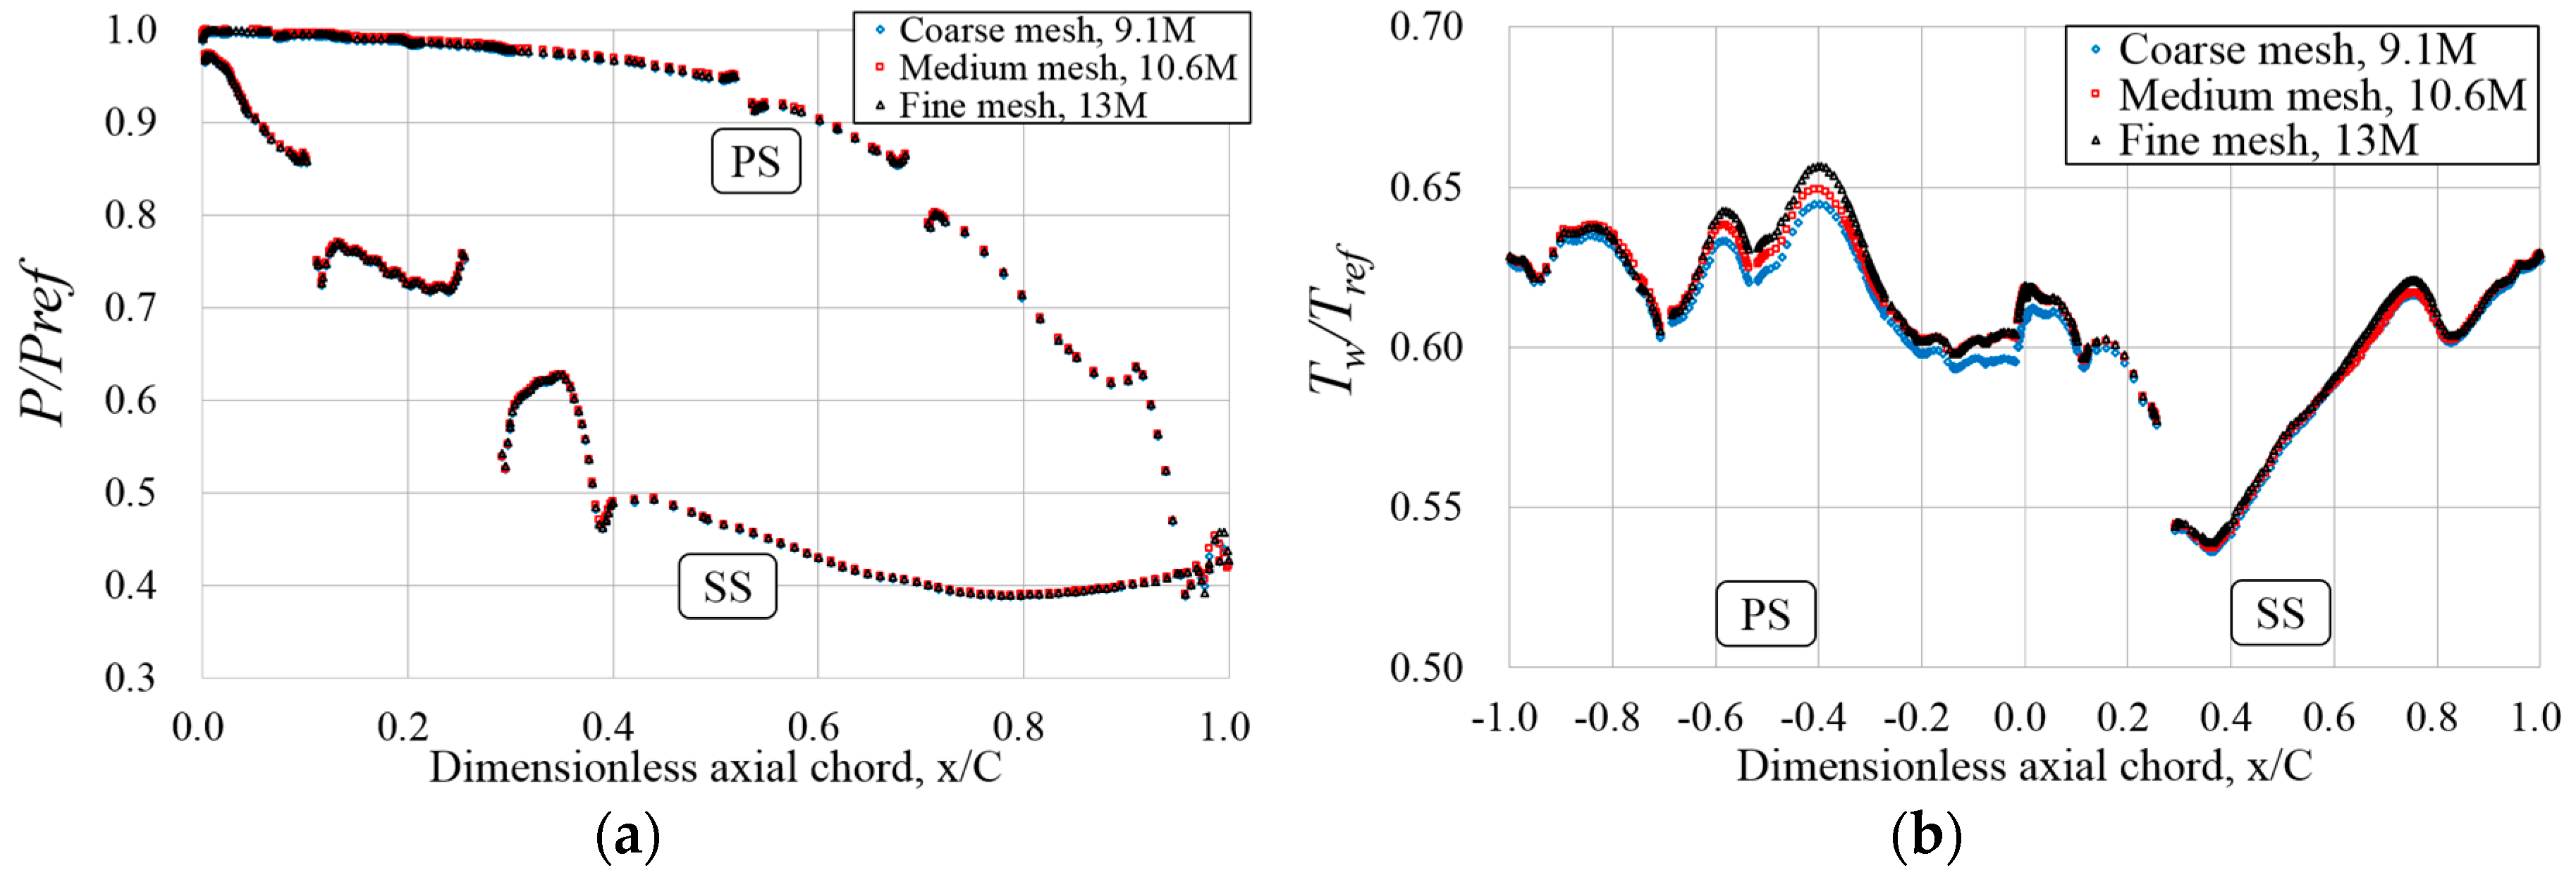
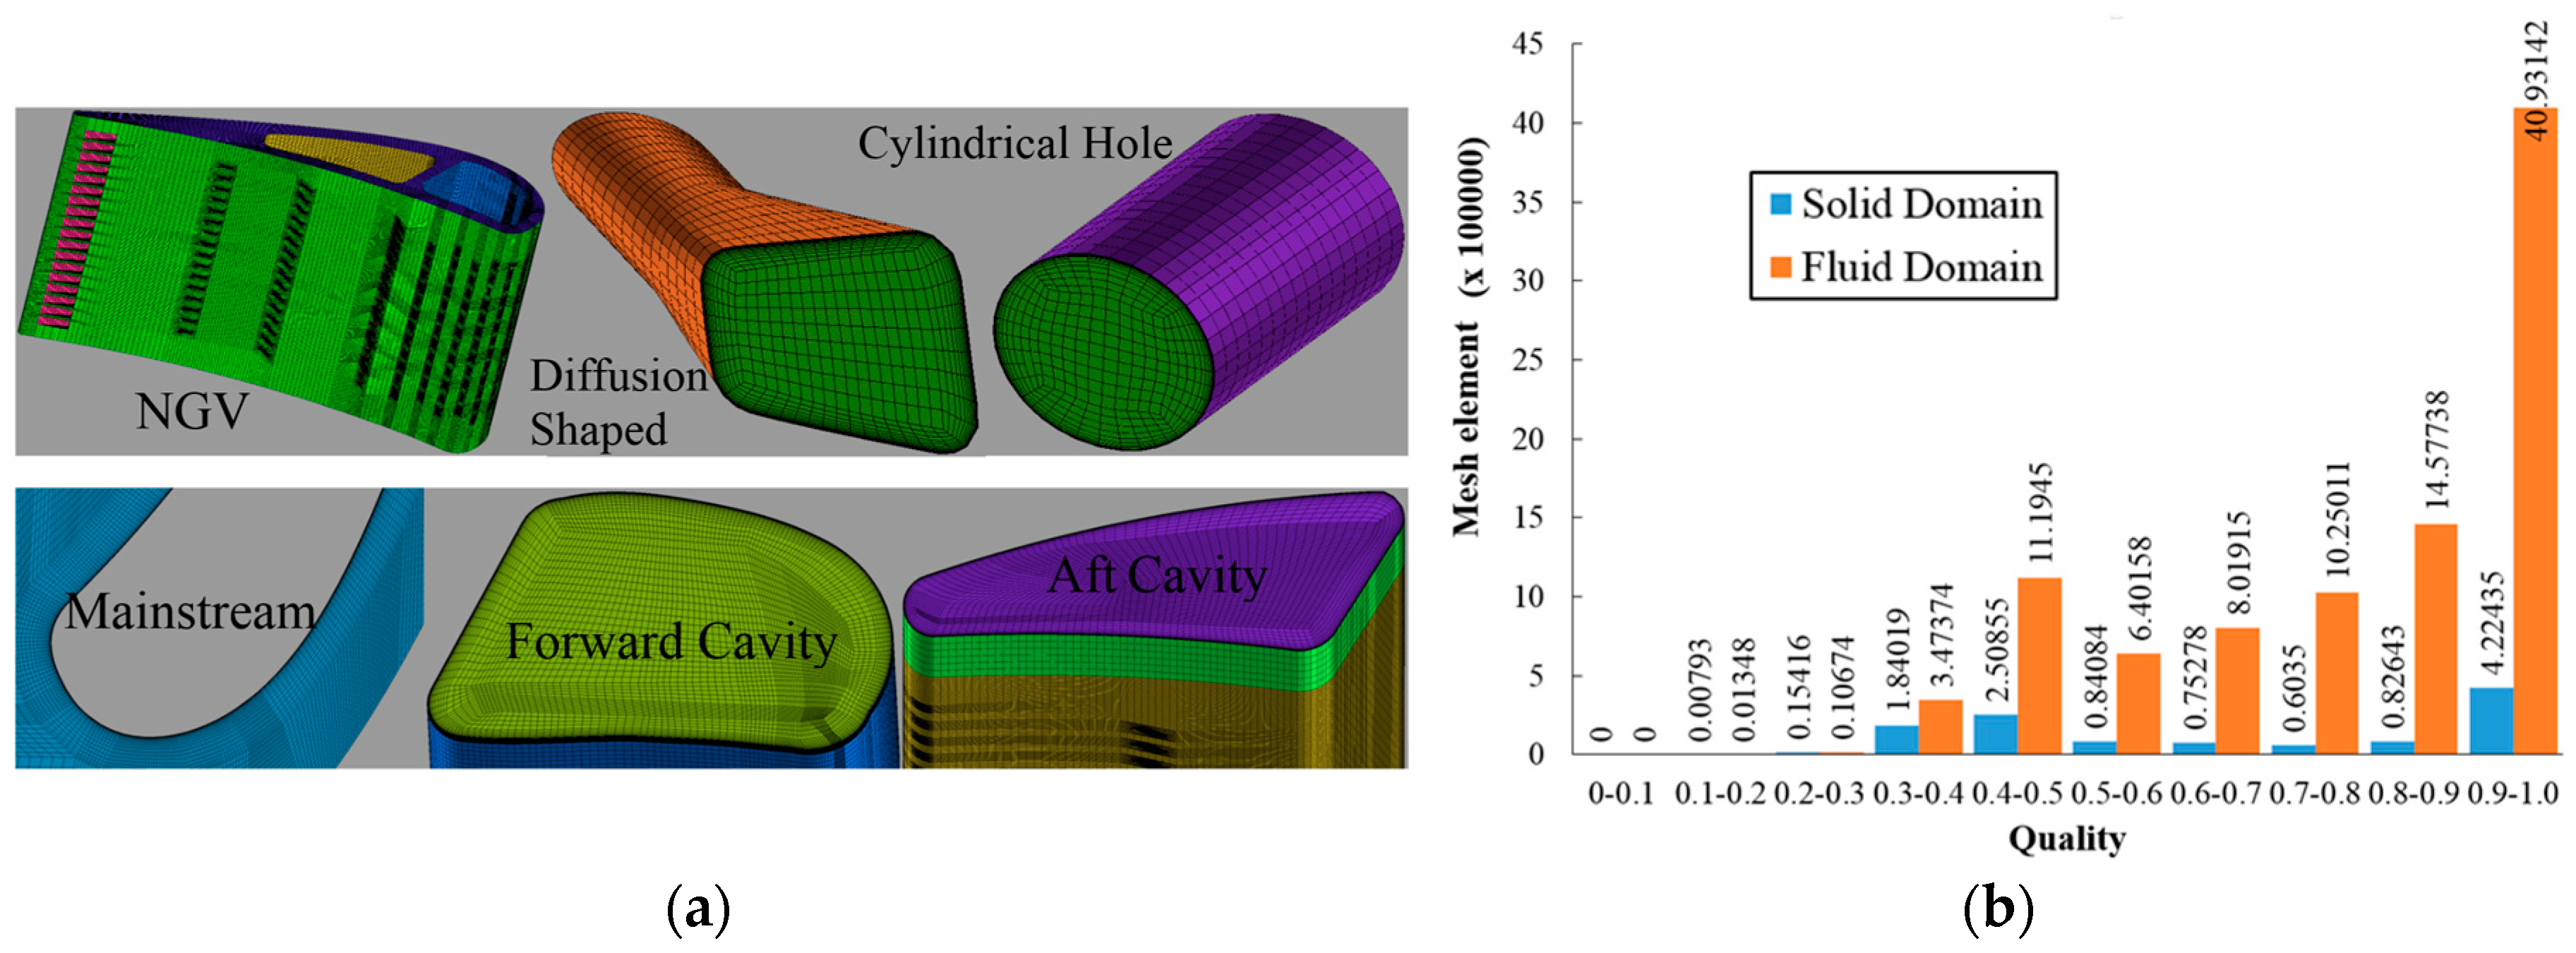
4.1. Computational Mesh
4.2. Calculation Techniques
4.3. Boundary Conditions
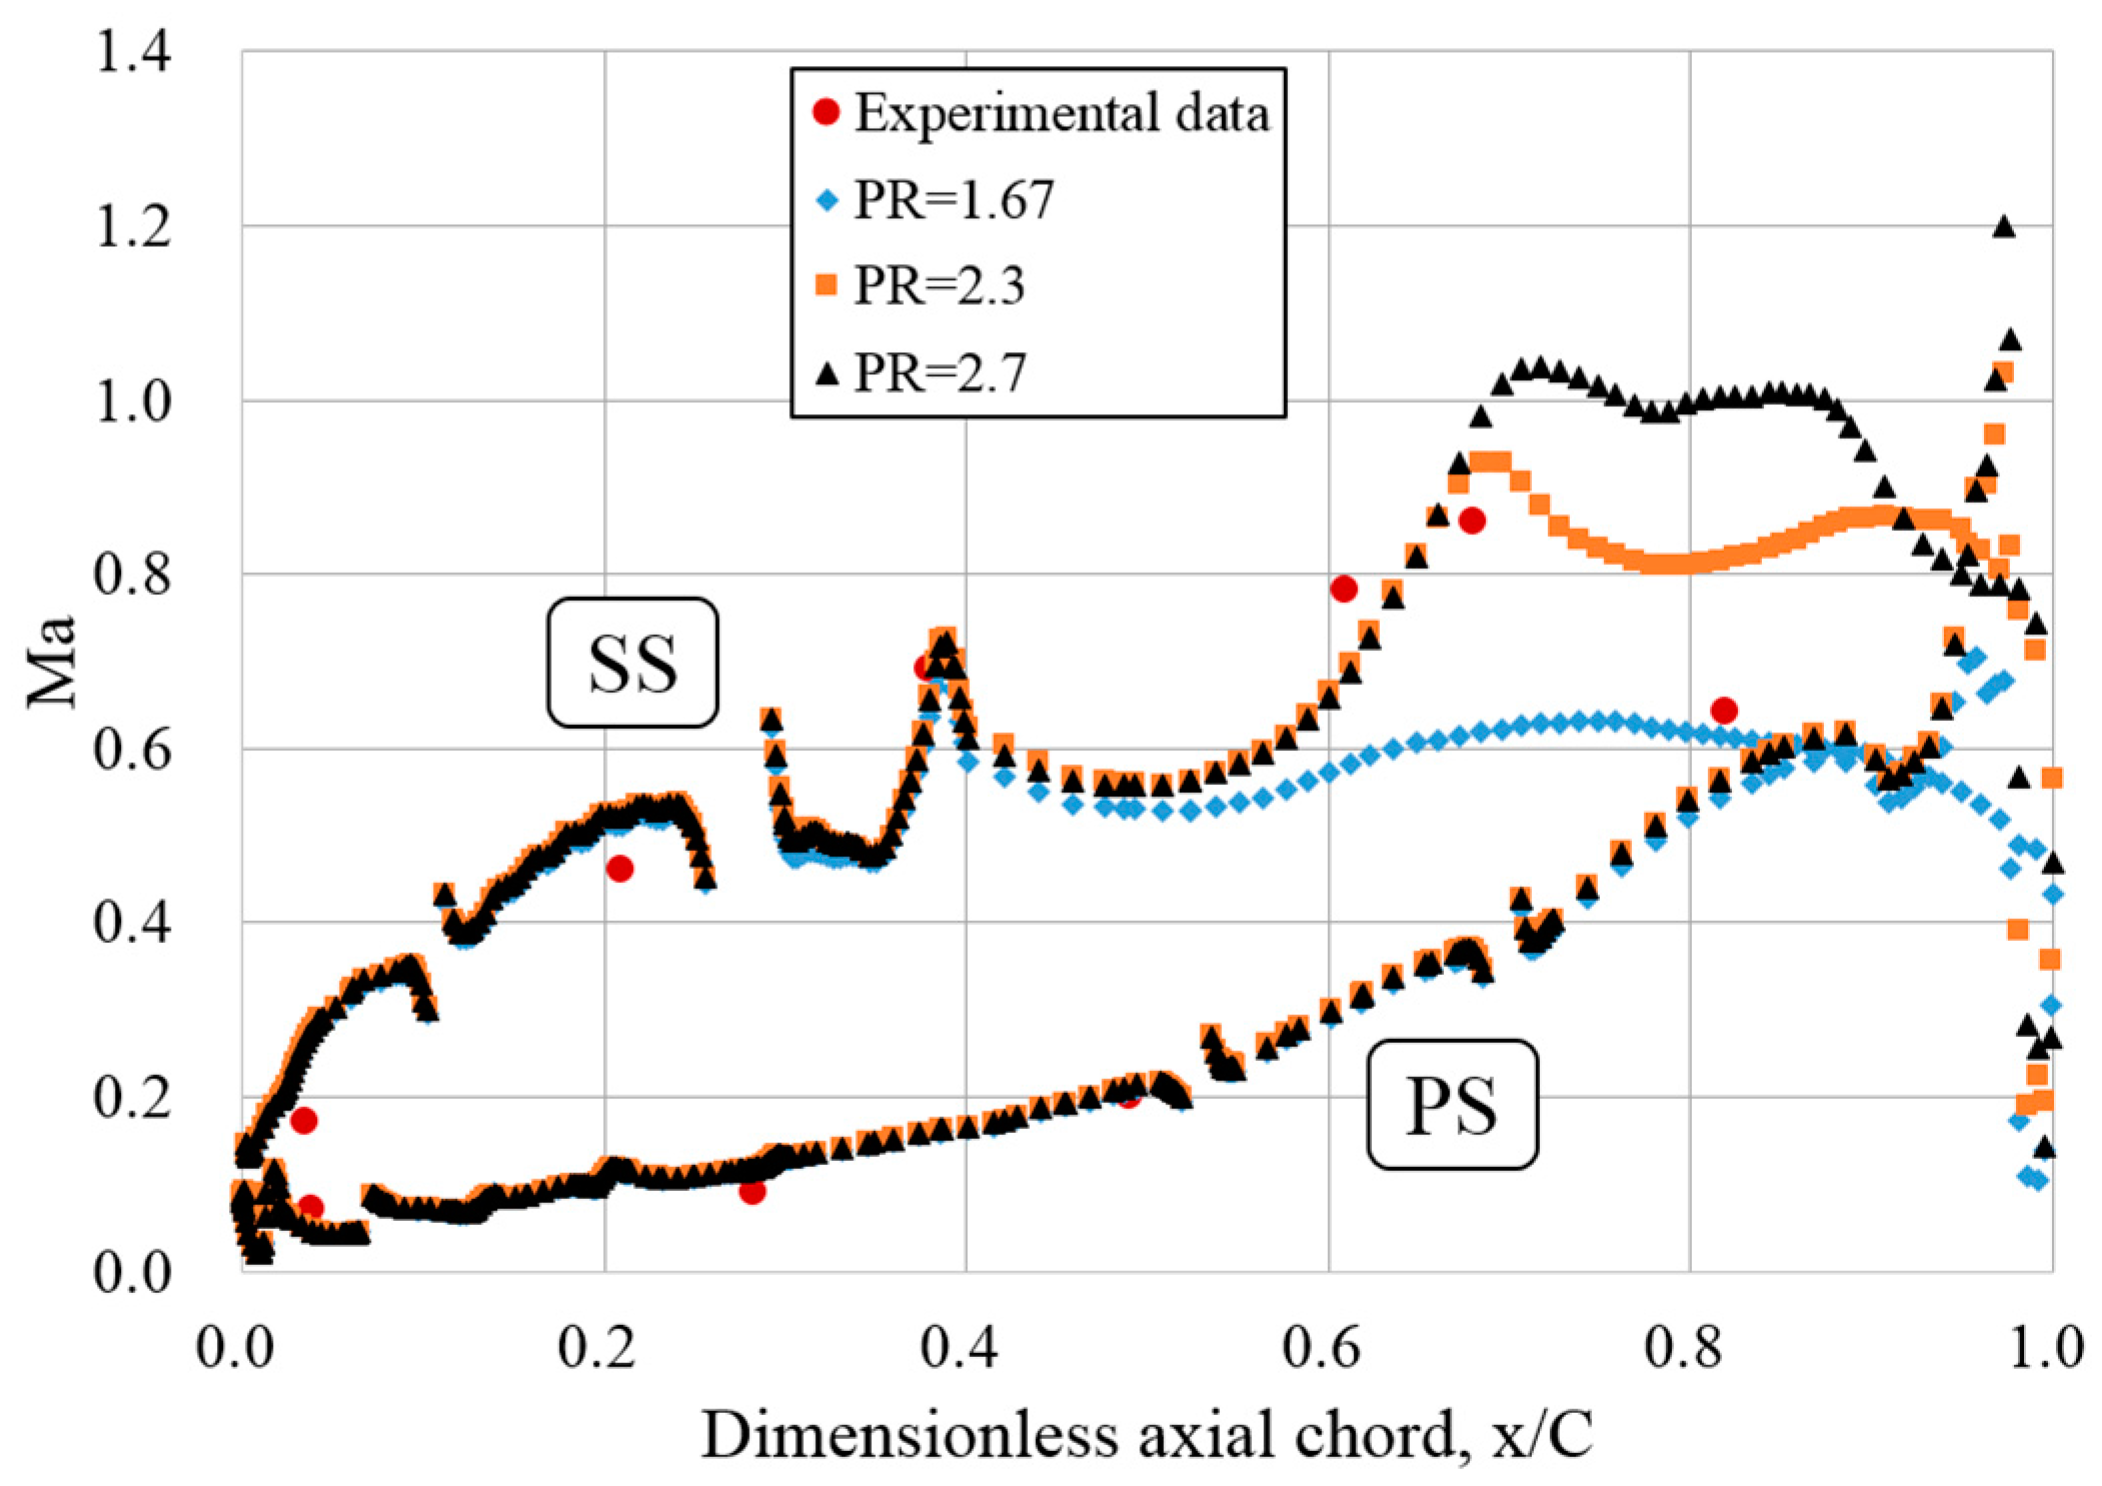
4.4. Validation of the Turbulence Model
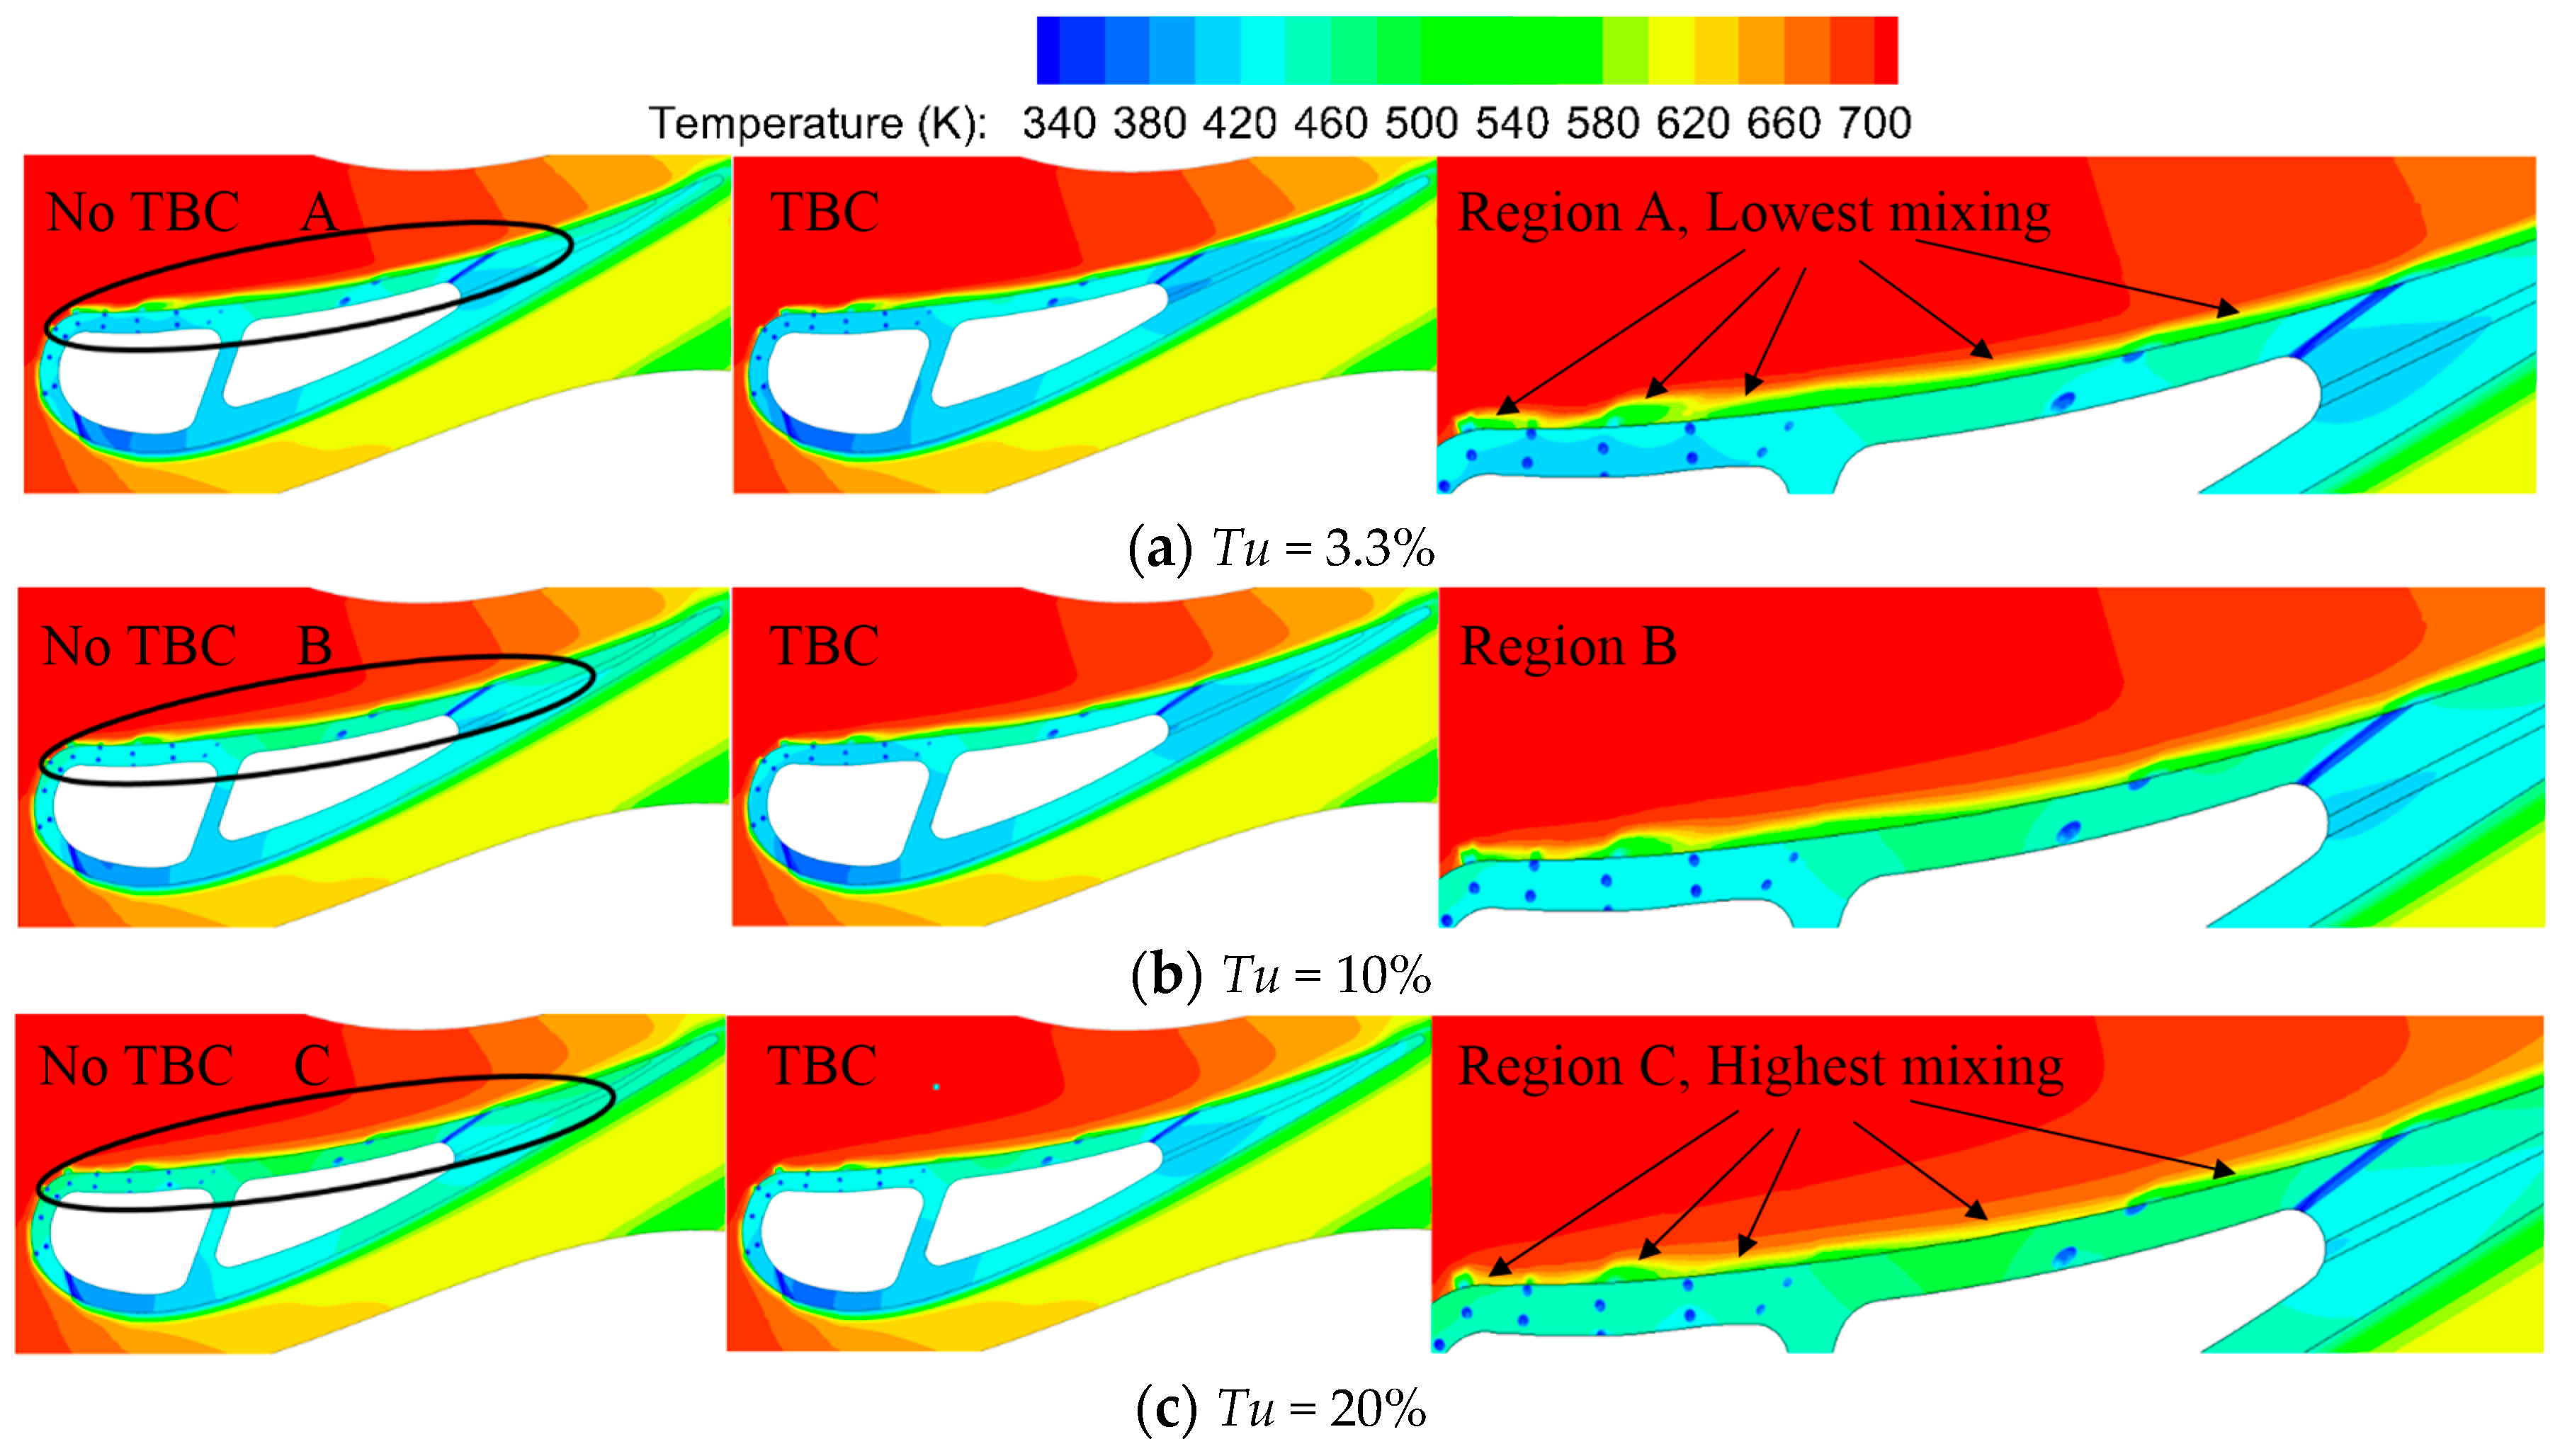
5. Results and Discussions
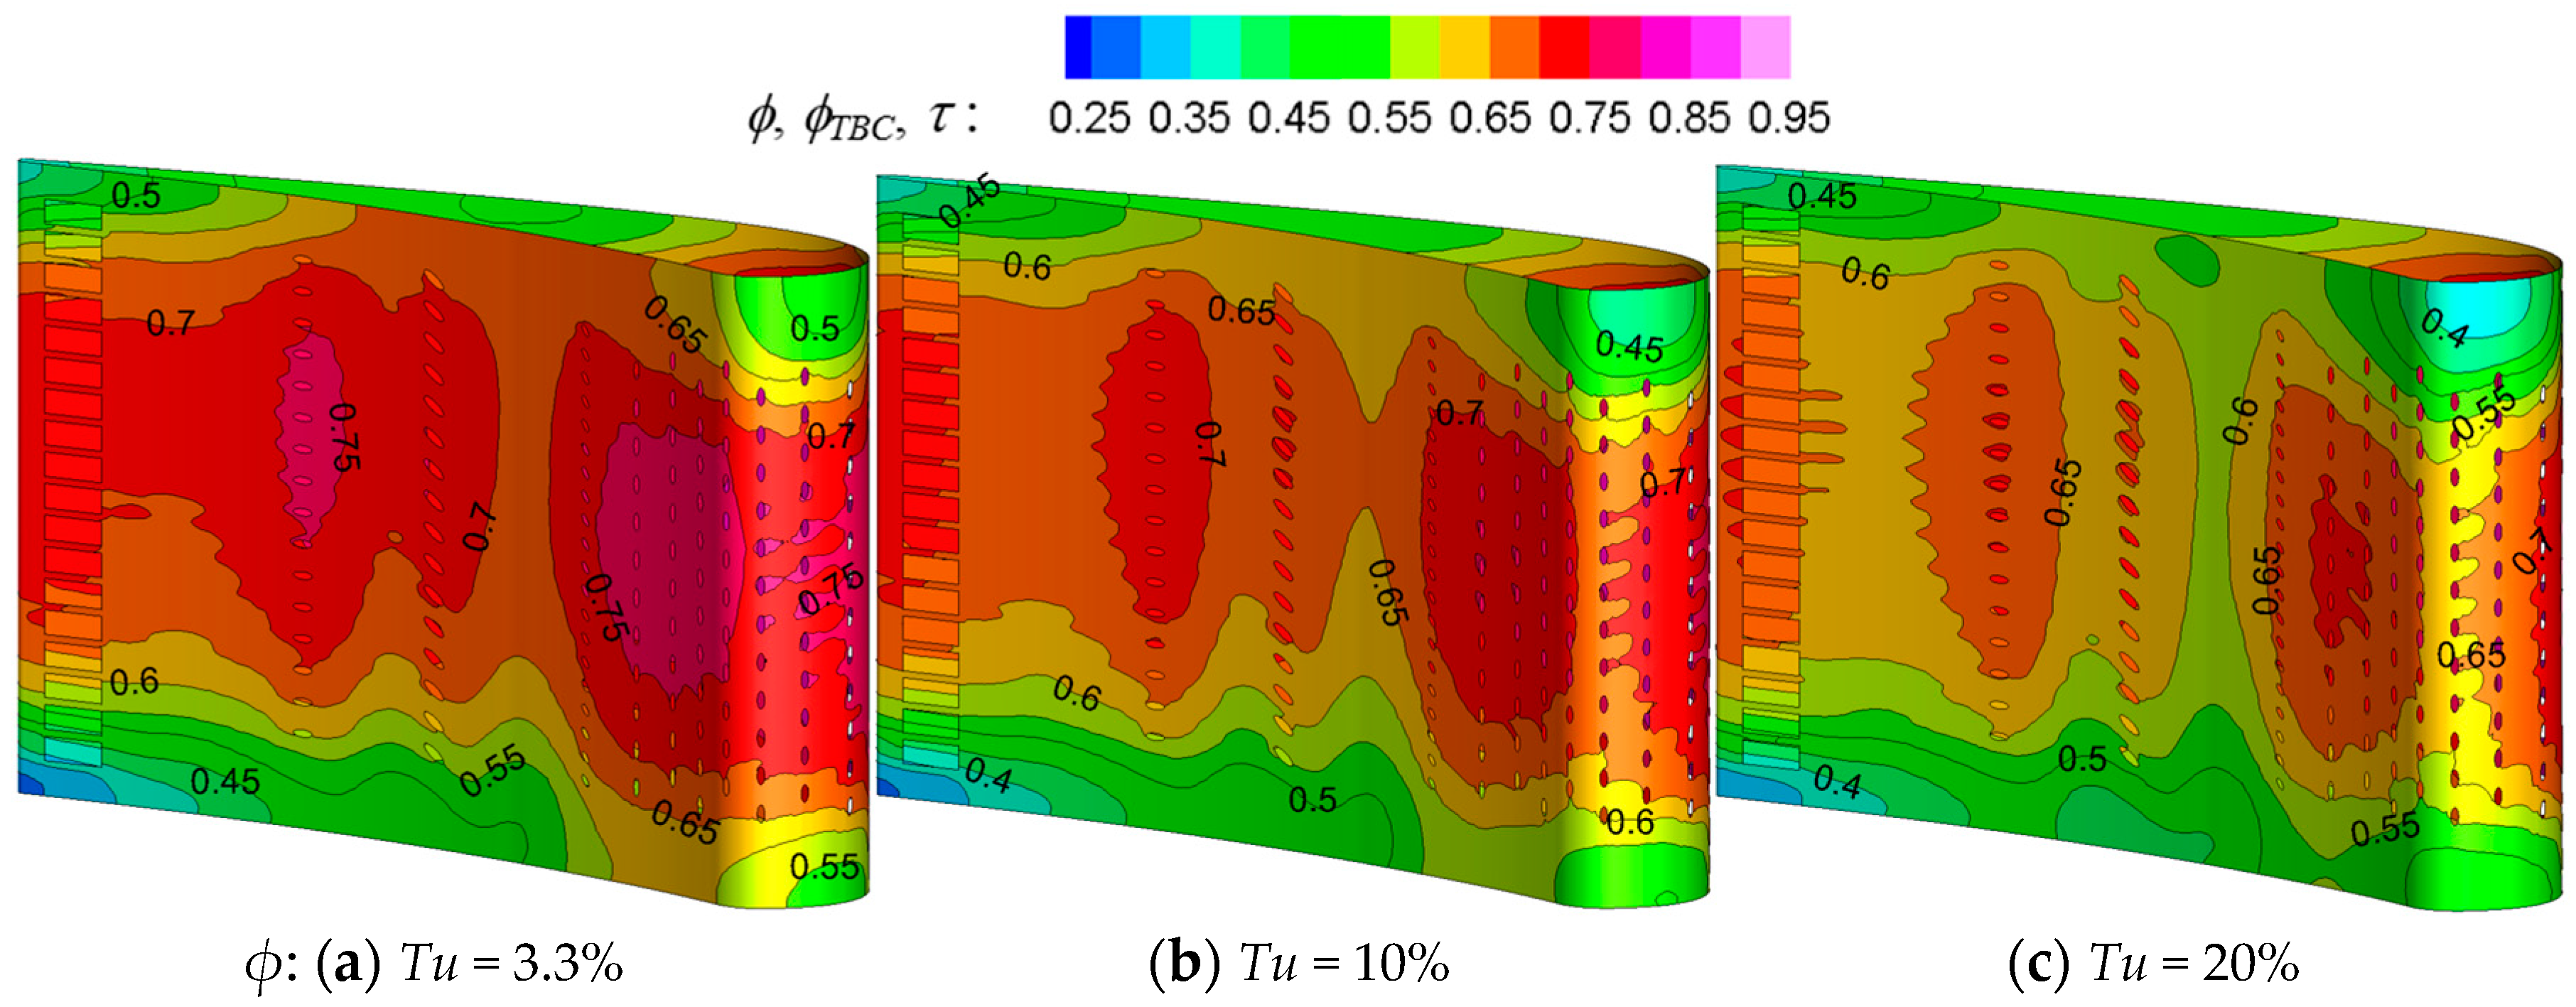
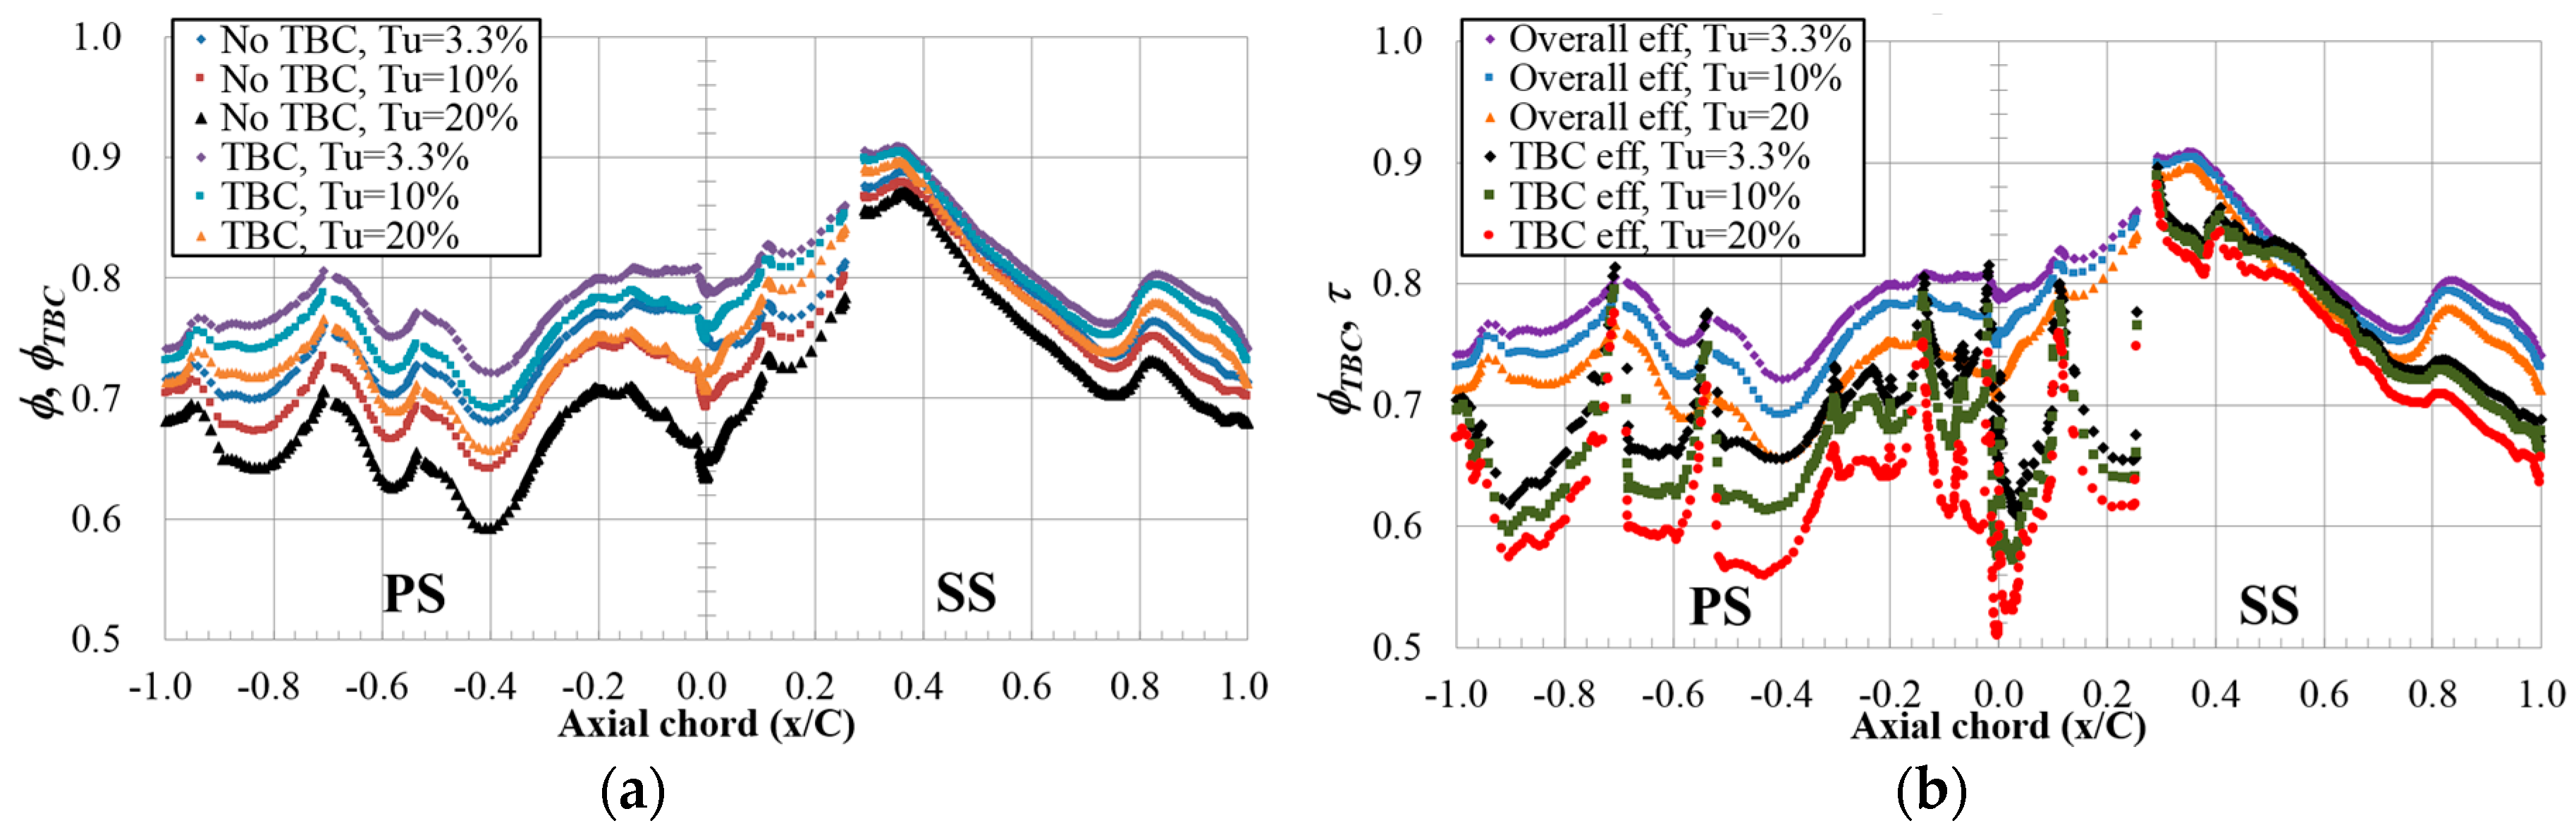
5.1. Overall Cooling Effectiveness and TBC Effectiveness
5.2. Effects of TBC and Tu on Overall Cooling Effectiveness
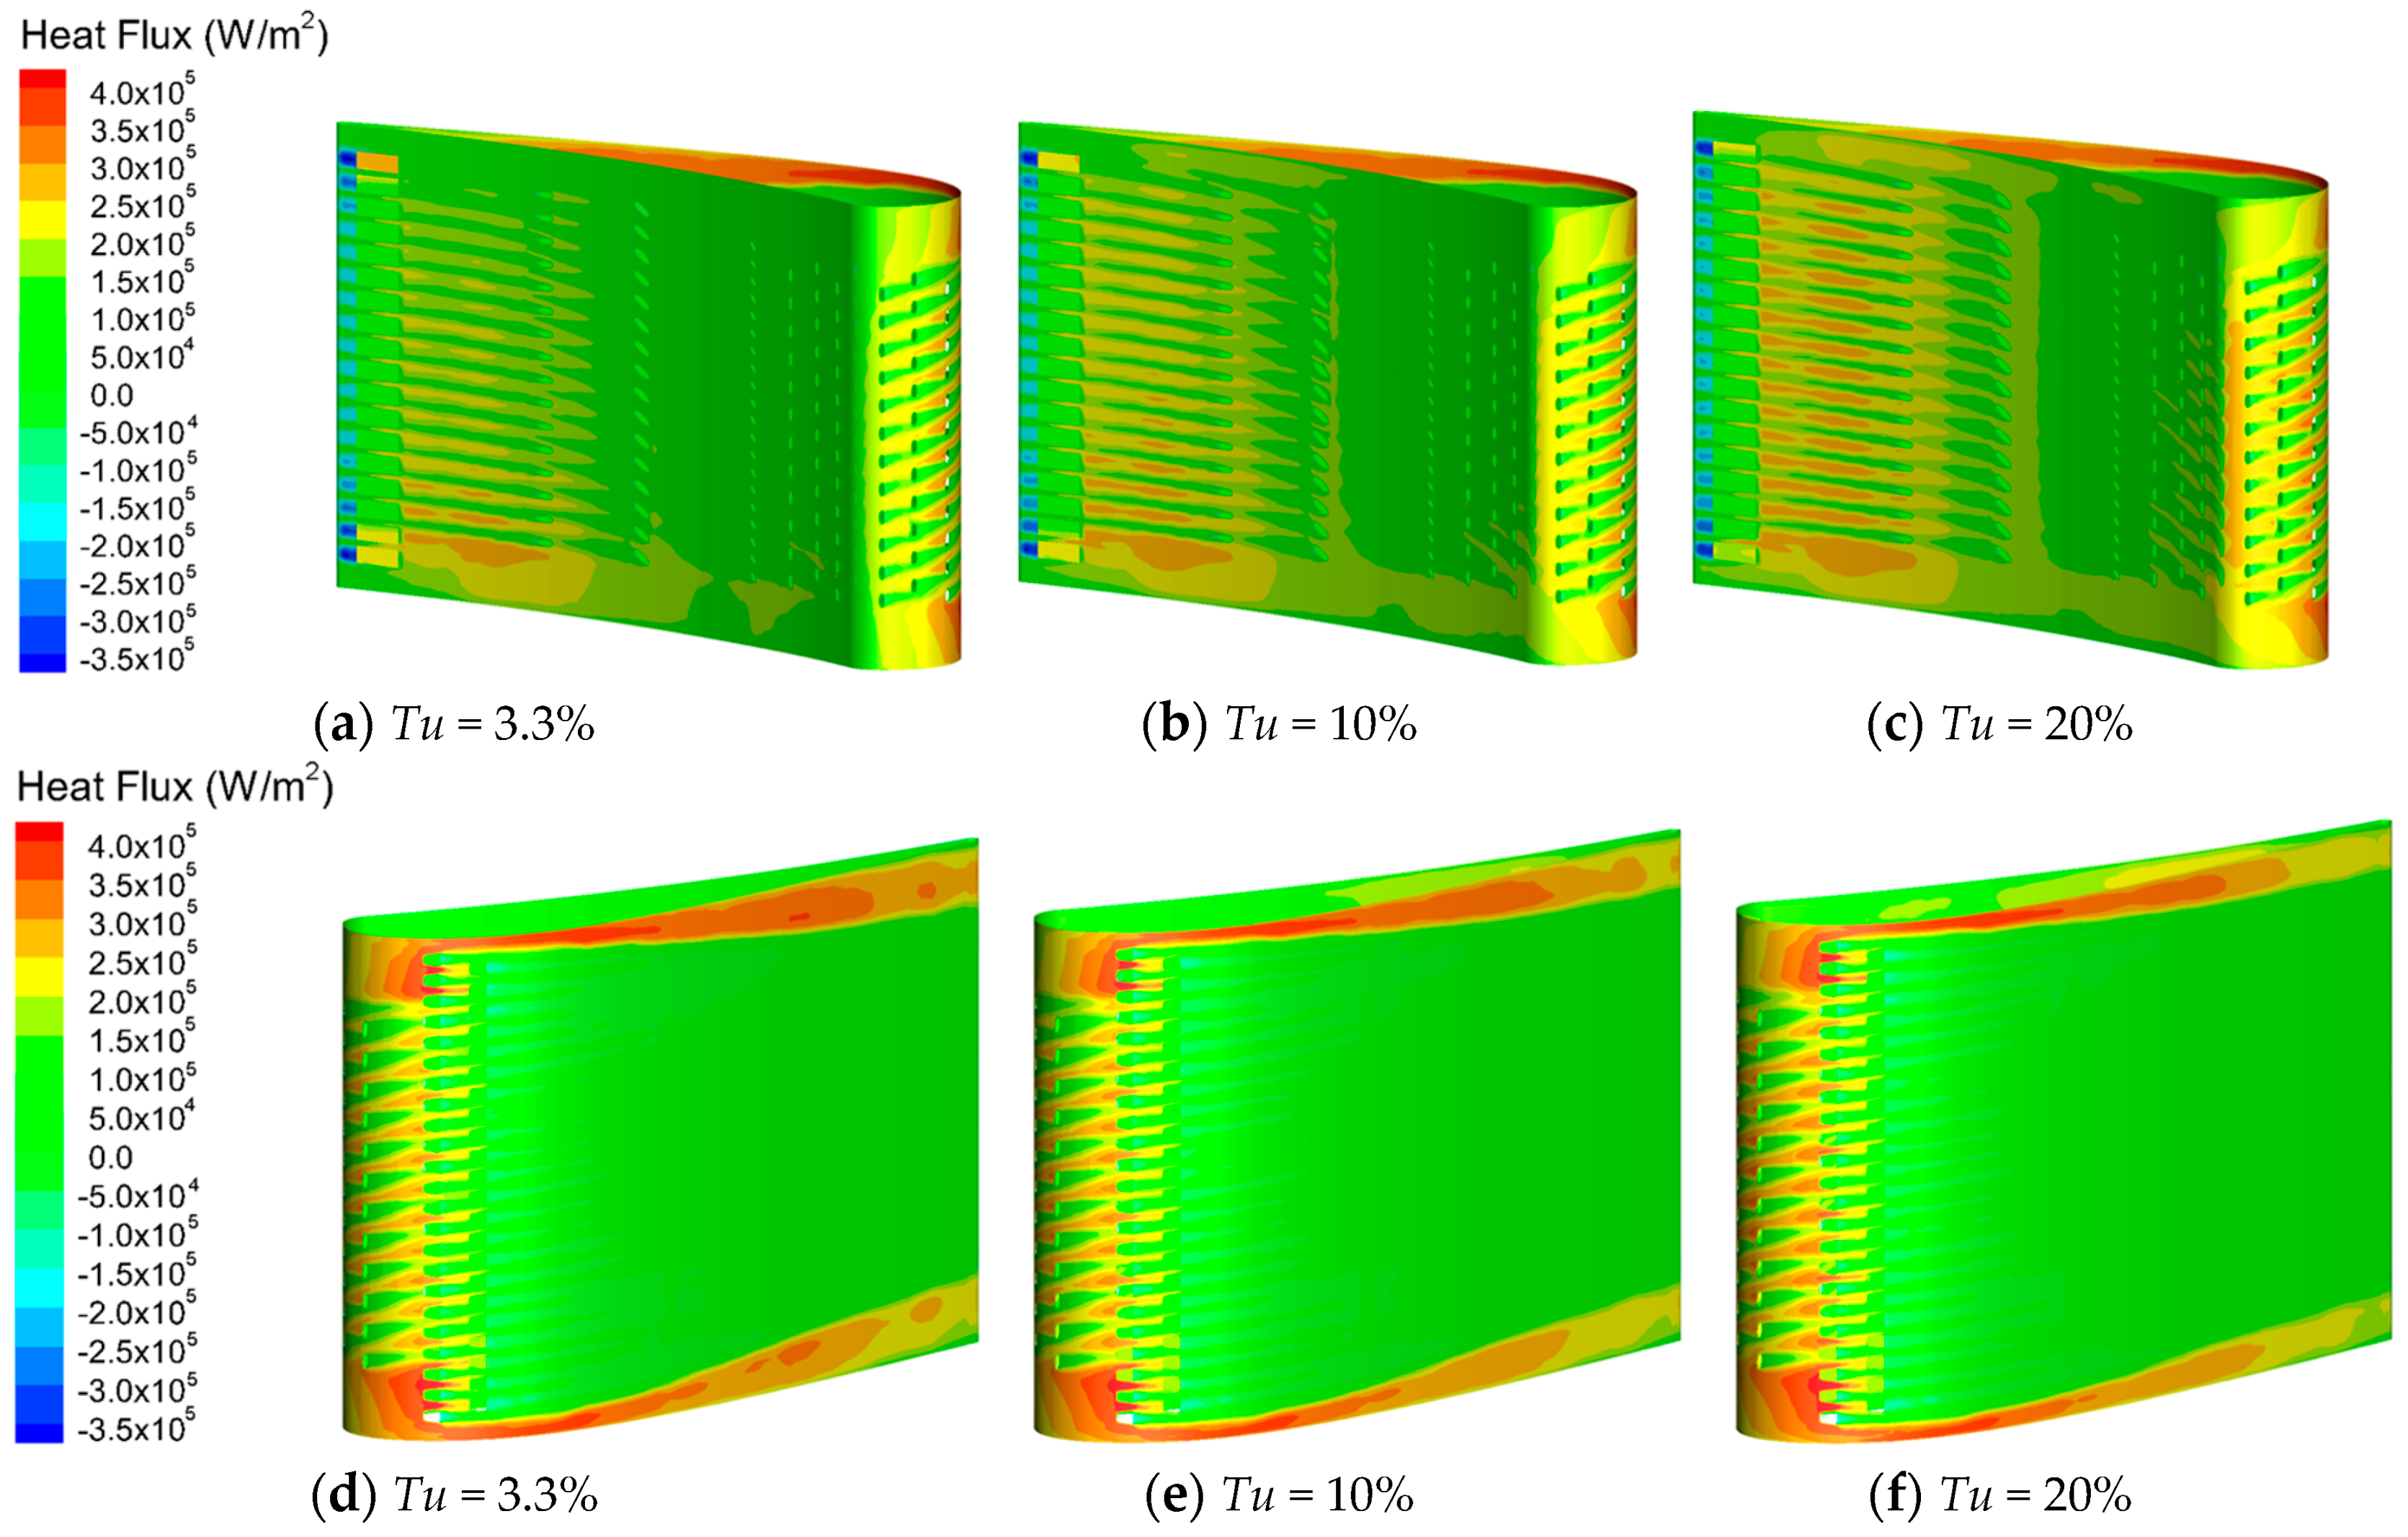
5.3. Effects of TBC and Tu on Heat Transfer Coefficient
6. Conclusions
- (1)
- TBC increases significantly the overall cooling effectiveness on the basis of the vane metal surface, but it does not alter the trends of distribution of the overall cooling effectiveness for all three Tus.
- (2)
- For this test case, with only two rows of film holes on the SS, TBC is more effective on the PS than on the SS. The role of TBC on the increment in the overall cooling effectiveness is relatively higher in the ineffectively cooled regions, i.e., the tip and hub of the vane, but is relatively lower in the regions close to the exits of film holes, the downstream of the diffusion shaped-holes on the SS, and the TE.
- (3)
- When Tu increases, the increment in the overall cooling effectiveness due to TBC in the ineffectively cooled regions can reach up to 24% or 38 K at Tu = 20%, but increases slightly in the exits and downstream of the diffusion shaped-holes on the SS, as well as the TE.
- (4)
- TBC can block heat flux from mainstream into the vane, but it can also blocks the heat flux transferred from the solid vane into the mixing fluid of cooling air and the mainstream. When Tu increases, these effects becomes more significant.
Acknowledgments
Author Contributions
Conflicts of Interest
Nomenclature
| cp,f | specific heat capacity of fluid (J/kg·K) |
| cp,m | specific heat capacity of solid (J/kg·K) |
| cp,TBC | specific heat capacity of TBC (J/kg·K) |
| h | heat transfer coefficient at metal surface (W/m2·K) |
| hTBC | heat transfer coefficient at TBC surface (W/m2·K) |
| Δh | variation of heat transfer coefficient (W/m2·K) |
| kf | thermal conductivity of fluid (W/m·K) |
| km | thermal conductivity of solid (W/m·K) |
| kTBC | thermal conductivity of TBC (W/m·K) |
| Lu | turbulence length scale (m) |
| P | pressure (Pa) |
| PR | pressure ratio |
| Ps | static pressure (Pa) |
| PT,c | total pressure at coolant inlet (Pa) |
| PT,∞ | total pressure at mainstream inlet (Pa) |
| Pref | reference pressure (3.44740 × 10⁵ Pa) |
| qflux | heat flux at the interface of solid and fluid (W/m2) |
| R | percentage of metal temperature reduction (%) |
| T | metal surface temperature without TBC (K) |
| Tc | inlet temperature of cooling air (K) |
| Tref | reference temperature (709 K) |
| TTBC | metal surface temperature with TBC (K) |
| Tw | vane local wall temperature (K) |
| T∞ | inlet temperature of mainstream (K) |
| T′ | TBC surface temperature (K) |
| Tu | free-stream turbulence intensity (%) |
| ΔT | temperature reduction in metal surface |
| temperature gradient at the interface of solid and fluid (K/m) | |
| Greek Symbols | |
| ρf | density of mainstream and coolant (kg/m3) |
| ρm | density of metal (kg/m3) |
| ρTBC | density of TBC (kg/m3) |
| φ | overall cooling effectiveness on the metal surface without TBC |
| φTBC | overall cooling effectiveness on the metal surface with TBC |
| τ | TBC effectiveness |
| Δφ | increment of overall cooling effectiveness on the vane surface |
References
- Boyle, R.J.; Giel, P.W.; Ames, F.E. Predictions for the effects of free stream turbulence on turbine blade heat transfer. In Proceedings of the ASME Turbo Expo, Vienna, Austria, 14–17 June 2004.
- Mayhew, J.E.; Baughn, J.W.; Byerley, A.R. The Effect of freestream turbulence on film cooling adiabatic effectiveness. Int. J. Heat Fluid Flow 2003, 24, 669–679. [Google Scholar] [CrossRef]
- Ou, S.; Han, J.C. Influence of mainstream turbulence on leading edge film cooling heat transfer through two rows of inclined film slots. J. Turbomach. 1992, 114, 724–733. [Google Scholar] [CrossRef]
- Ekkad, S.V.; Du, H.; Han, J.C. Local heat transfer coefficient and film effectiveness distributions on a cylindrical leading edge model using a transient liquid crystal image method. J. Flow Vis. Image Process. 1996, 3, 129–140. [Google Scholar] [CrossRef]
- Thole, K.A.; Radomsky, R.W.; Kang, M.B.; Kohli, A. Elevated freestream turbulence effects on heat transfer for a gas turbine vane. Int. J. Heat Fluid Flow 2002, 23, 137–147. [Google Scholar] [CrossRef]
- Dyson, T.E.; Bogard, D.G.; Bradshaw, S.D. A CFD evaluation of multiple RANS turbulence models for prediction of boundary layer flows on a turbine vane. In Proceedings of the ASME Turbo Expo, San Antonio, TX, USA, 3–7 June 2013.
- Foroutan, H.; Yavuzkurt, S. A model for simulation of turbulent flow with high free stream turbulence implemented in OpenFOAM®. J. Turbomach. 2013, 135, 031022. [Google Scholar] [CrossRef]
- Morata, E.C.; Gourdain, N.; Duchaine, F.; Gicquel, L.Y.M. Effects of free-stream turbulence on high pressure turbine blade heat transfer predicted by structured and unstructured LES. Int. J. Heat Mass Trans. 2012, 55, 5754–5768. [Google Scholar] [CrossRef]
- Henze, M.; Bogdanic, L.; Muehlbauer, K.; Schnieder, M. Effect of the Biot number on metal temperature of thermal-barrier-coated turbine parts: Real engine measurements. J. Turbomach. 2013, 135, 031029. [Google Scholar] [CrossRef]
- Witz, G.; Bossmann, H.-P. Determination of thermal barrier coatings average surface temperature after engine operation for lifetime validation. J. Eng. Gas Turbines Power 2012, 134, 122507. [Google Scholar] [CrossRef]
- Davidson, E.T.; Kistenmacher, D.A.; Bogard, D.G. Film cooling with a thermal barrier coating: Round holes, craters and trenches. J. Turbomach. 2013, 136, 041007. [Google Scholar] [CrossRef]
- Davidson, E.T.; Dees, J.E.; Bogard, D.G. An experimental study of thermal barrier coatings and film cooling on an internally cooled simulated turbine vane. In Proceedings of the ASME Turbo Expo, Vancouver, BC, Canada, 6–10 June 2011.
- Meitner, P.L. Analysis of Metal Temperature and Coolant Flow with a Thermal-Barrier Coating on a Full-Coverage Film Cooled Turbine Vane; NASA Technical Report 78-20; NASA: Greenbelt, MD, USA, 1978.
- Feuerstein, A.; Knapp, J.; Taylor, T.; Ashary, A.; Bolcavage, A.; Hitchman, N. Technical and economical aspects of current thermal barrier coating systems for gas turbine engines by thermal spray and EBPVD: A review. J. Therm. Spray Technol. 2008, 17, 199–213. [Google Scholar] [CrossRef]
- Ni, R.H.; Humber, W.; Fan, G.; Johnson, P.D.; Downs, J.; Clark, J.P.; Koch, J.P. Conjugate heat transfer analysis of a film-cooled turbine vane. In Proceedings of the ASME Turbo Expo, Vancouver, BC, Canada, 6–10 June 2011.
- Mazur, Z.; Herna’ndez-Rossette, A.; Garcı’a-Illescas, R.; Luna-Ramı’rez, A. Analysis of conjugate heat transfer of a gas turbine first stage nozzle. Appl. Therm. Eng. 2006, 26, 1796–1806. [Google Scholar] [CrossRef]
- Yoshiara, T.; Sasaki, D.; Nakahashi, K. Conjugate heat transfer simulation of cooled turbine blades using unstructured-mesh CFD solver. In Proceedings of the AIAA 49th Aerospace Sciences Meeting including the New Horizons Forum and Aerospace Exposition, Orlando, FL, USA, 4–7 January 2011.
- Zhang, H.J.; Zou, Z.P.; Li, Y.; Ye, J.; Song, S.H. Conjugate heat transfer investigations of turbine vane based on transition models. Chin. J. Aeronaut. 2013, 26, 890–897. [Google Scholar] [CrossRef]
- Hylton, L.D.; Mihelc, M.S.; Turner, E.R.; Nealy, D.A.; York, R.E. Analytical and Experimental Evaluation of the Heat Transfer Distribution over the Surface of Turbine Vanes; NASA No. CR-168015; NASA: Greenbelt, MD, USA, 1983.
- Bohn, D.E.; Becker, V.J. A conjugate 3-D flow and heat transfer analysis of a thermal barrier cooled turbine guide vane. In Proceedings of the ASME the International Gas Turbine & Aeroengine Congress & Exhibition, Stockholm, Sweden, 2–5 June 1998.
- Baldwin, B.S.; Lomax, H. Thin layer approximation and algebraic model for separated turbulent flows. In Proceedings of the AIAA 16th Aerospace Sciences Meeting, Huntsville, AL, USA, 6–18 January 1978.
- Bohn, D.E.; Tümmers, C. Numerical 3-D conjugate flow and heat transfer investigation of a transonic convection-cooled thermal barrier coated turbine guide vane with reduced cooling fluid mass flow. In Proceedings of the ASME Turbo Expo, Atlanta, GA, USA, 16–19 June 2003.
- Alizadeh, M.; Izadi, A.; Fathi, A. Sensitivity analysis on turbine blade temperature distribution using conjugate heat transfer simulation. J. Turbomach. 2014, 136, 011001. [Google Scholar] [CrossRef]
- Rossette, A.H.; Mazur C, Z.; Demeulenaere, A.; Roque López Hernández, J.A. The effect of start-up cycle in ceramic coating used as thermal barrier for a gas turbine bucket. Appl. Therm. Eng. 2009, 29, 3056–3065. [Google Scholar] [CrossRef]
- Spalart, P.R.; Allmaras, S.R. A one equation turbulence model for aerodynamic flows. In Proceedings of the 30th Aerospace Sciences Meeting & Exhibit, Reno, NV, USA, 6–9 January 1992.
- Timko, L.P. Energy Efficient Engine High Pressure Turbine Component Test Performance Report; NASA CR-168289; NASA Lewis Research Center: Cleveland, OH, USA, 1984.
- Halila, E.E.; Lenahan, D.T.; Thomas, T.T. High Pressure Turbine Test Hardware Detailed Design Report; NASA CR-167955; NASA Lewis Research Center: Cleveland, OH, USA, 1982.
- Zhang, Q.B.; Xu, H.Z.; Wang, J.H.; Li, G.; Wang, L.; Wu, X.Y.; Ma, S.Y. Evaluation of CFD predictions using different turbulence models on a film cooled guide vane under experimental conditions. In Proceedings of the ASME Turbo Expo, Montreal, QC, Canada, 15–19 June 2015.
- Prapamonthon, P.; Xu, H.Z.; Wang, J.H.; Li, G. Predicting adiabatic film effectiveness of a turbine vane by two-equation turbulence models. In Proceedings of the ASME Turbo Expo, Montreal, QC, Canada, 15–19 June 2015.
- Ke, Z.Q.; Wang, J.H. Numerical investigations of pulsed film cooling on an entire turbine vane. Appl. Therm. Eng. 2015, 87, 117–126. [Google Scholar] [CrossRef]
- Kingery, J.E.; Ames, F.E. Full coverage shaped-hole film cooling in an accelerating boundary layer with high freestream turbulence. J. Turbomach. 2016, 138, 071002. [Google Scholar] [CrossRef]


| Row | Number of Holes | Hole Diameter (cm) | Type/Angle |
|---|---|---|---|
| 1 | 22 | 0.061 | Axial, Diffusion shaped |
| 2 | 23 | 0.061 | Axial, Diffusion shaped |
| 3 | 12 | 0.048 | Radial |
| 4 | 12 | 0.048 | Radial |
| 5 | 12 | 0.048 | Radial |
| 6 | 12 | 0.048 | Radial |
| 7 | 12 | 0.048 | Radial |
| 8 | 12 | 0.048 | Radial |
| 9 | 12 | 0.048 | Radial |
| 10 | 20 | 0.036 | Compound Angle 45° |
| 11 | 16 | 0.061 | Compound Angle 60° |
| 12 | 16 | 0.048 | Axial |
| 13 | 18 | 0.061 × 0.155 | Pressure side slot |
| Property of Material | Air: Mainstream and Cooling Air | Steel: Vane Structure | ZrO2: TBC |
|---|---|---|---|
| Density (kg·m−3) | ρf = ideal gas assumption | ρm = 8055 | ρTBC = 5500 |
| Specific heat capacity (J·kg−1·K−1) | cp,f = 938 + 0.196 T | cp,m = 438.5 + 0.177 T | cp,TBC = 418 |
| Thermal conductivity (W·m−1·K−1) | kf = 0.0102 + 5.8 × 10⁻⁵ T | km = 11.2 + 0.0144 T | kTBC = 1.04 |
| Viscosity (kg·m−1·s−1) | Three-equation of Sutherland model | - | - |
| Boundary | Condition |
|---|---|
| Mainstream inlet | T∞ = 709 K, PT,∞ = 3.44740 × 10⁵ Pa, Lu = 6 cm, Tu = 3.3%, 10% and 20% |
| Mainstream outlet | PR = 1.67, Intended PR of Timko [26] |
| Forward coolant inlet | Tc = 339 K, PT,c = 3.50950 × 10⁵ Pa |
| Forward coolant outlet | Adiabatic wall with non-slip condition |
| Aft coolant inlet | Tc = 339 K, PT,c = 3.50950 × 10⁵ Pa |
| Aft coolant outlet | Adiabatic wall with non-slip condition |
© 2017 by the authors. Licensee MDPI, Basel, Switzerland. This article is an open access article distributed under the terms and conditions of the Creative Commons Attribution (CC BY) license ( http://creativecommons.org/licenses/by/4.0/).
Share and Cite
Prapamonthon, P.; Xu, H.; Yang, W.; Wang, J. Numerical Study of the Effects of Thermal Barrier Coating and Turbulence Intensity on Cooling Performances of a Nozzle Guide Vane. Energies 2017, 10, 362. https://doi.org/10.3390/en10030362
Prapamonthon P, Xu H, Yang W, Wang J. Numerical Study of the Effects of Thermal Barrier Coating and Turbulence Intensity on Cooling Performances of a Nozzle Guide Vane. Energies. 2017; 10(3):362. https://doi.org/10.3390/en10030362
Chicago/Turabian StylePrapamonthon, Prasert, Huazhao Xu, Wenshuo Yang, and Jianhua Wang. 2017. "Numerical Study of the Effects of Thermal Barrier Coating and Turbulence Intensity on Cooling Performances of a Nozzle Guide Vane" Energies 10, no. 3: 362. https://doi.org/10.3390/en10030362