
An Autonomous Coil Alignment System for the Dynamic Wireless Charging of Electric Vehicles to Minimize Lateral Misalignment

 , ,
, ,
Abstract
:1. Introduction
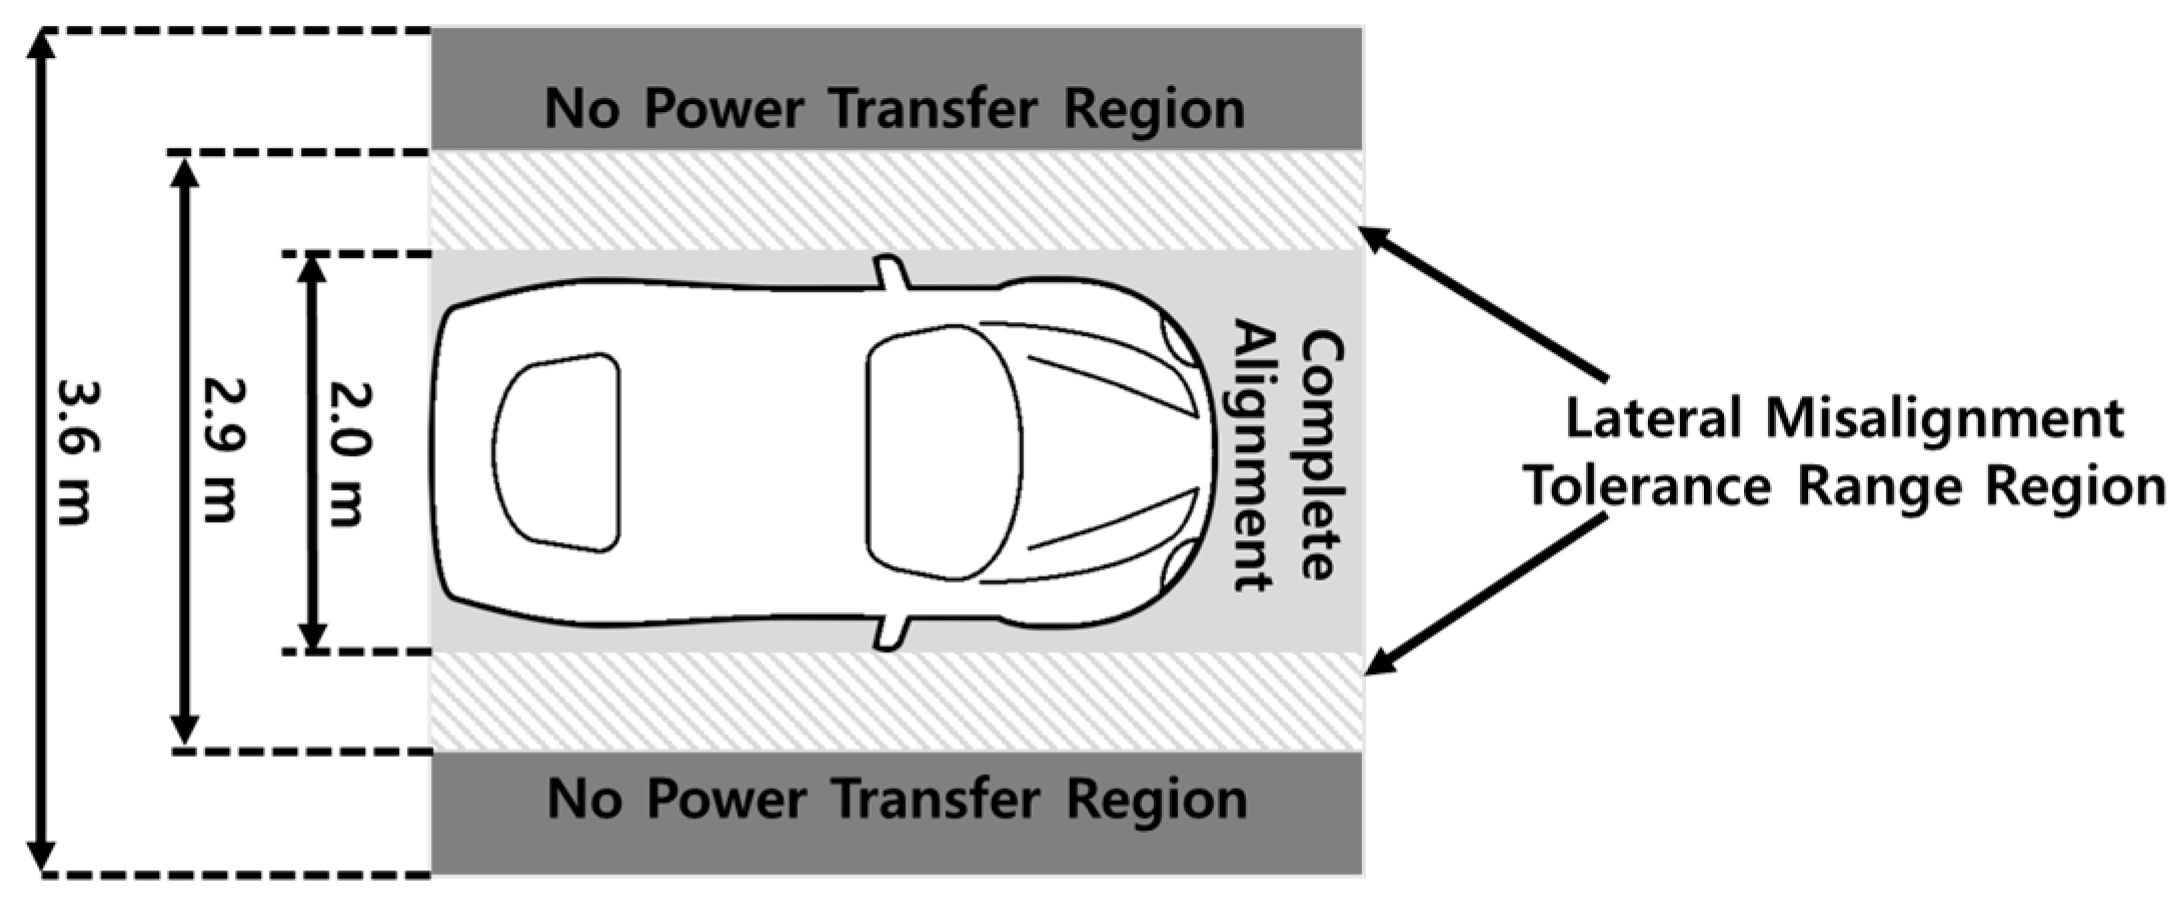
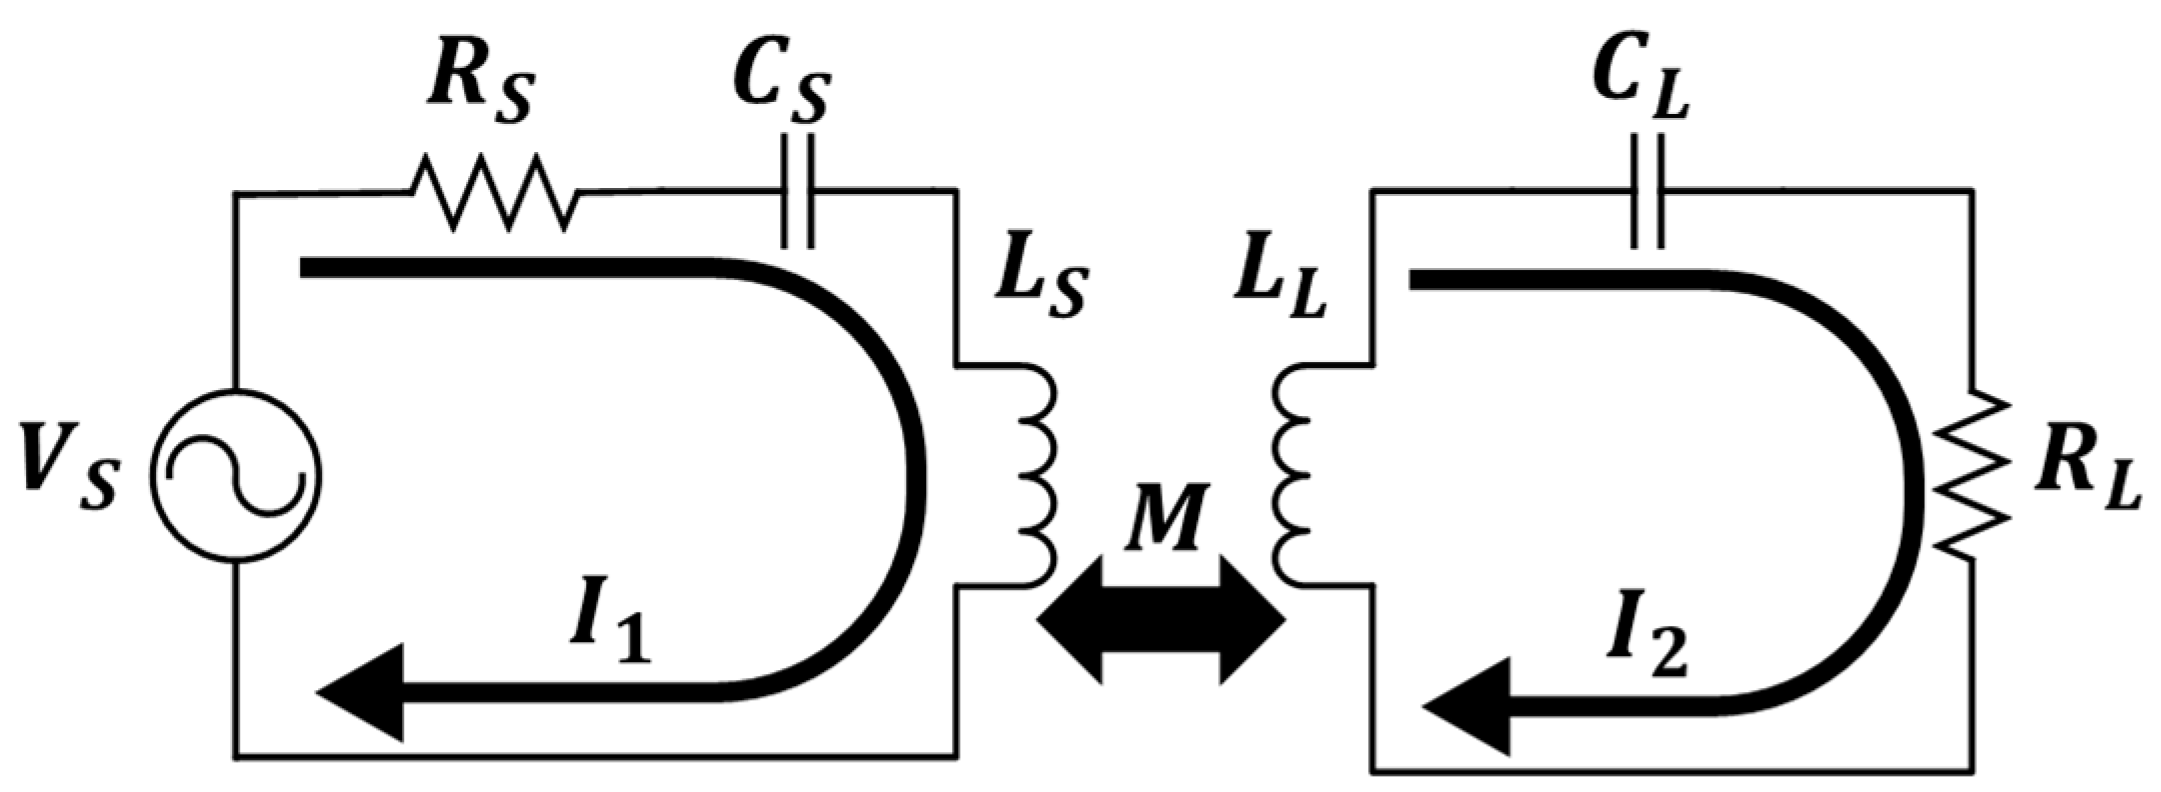
2. Analysis of Power Loss Due to Lateral Misalignment in Dynamic Wireless Charging (DWC) Systems
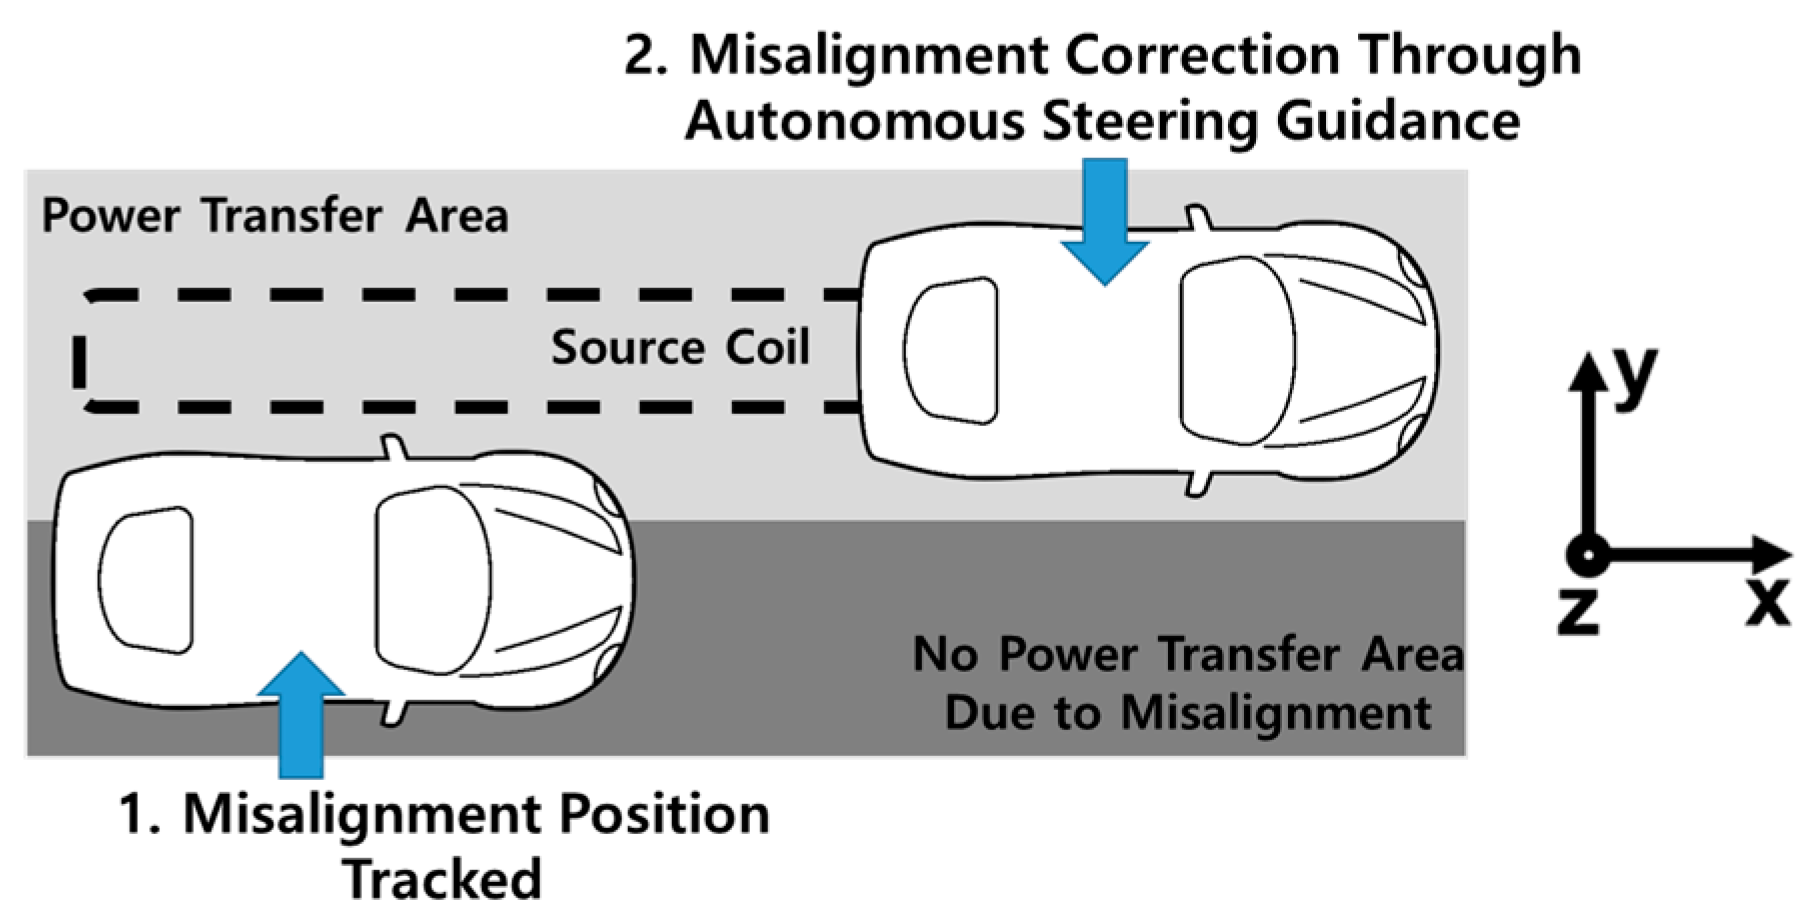
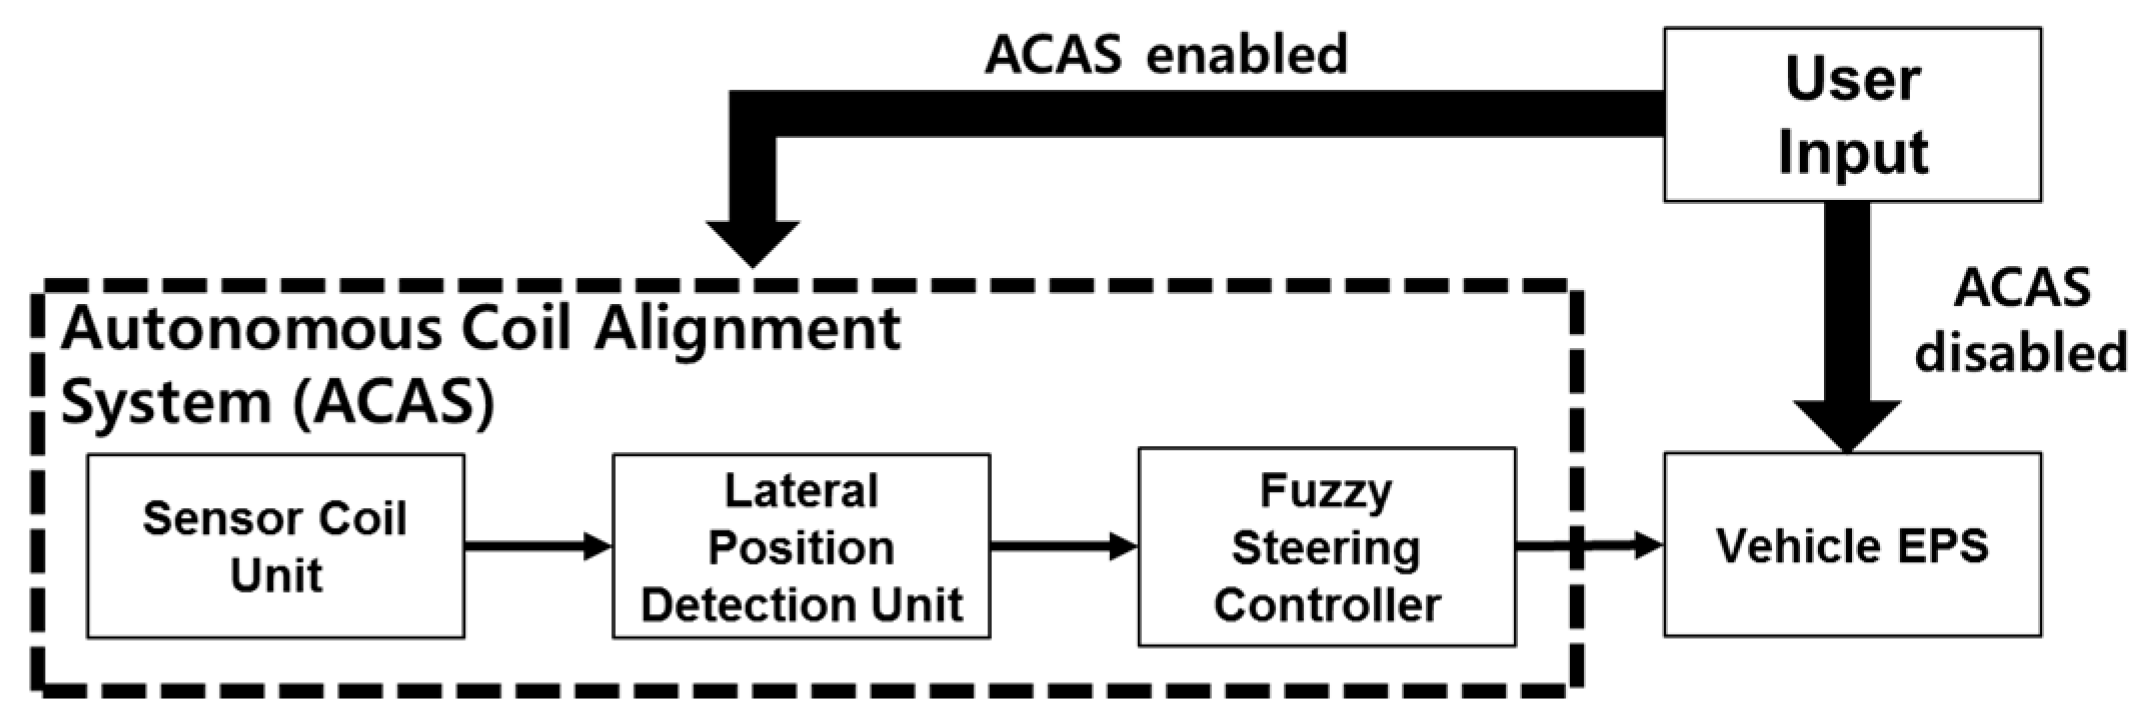
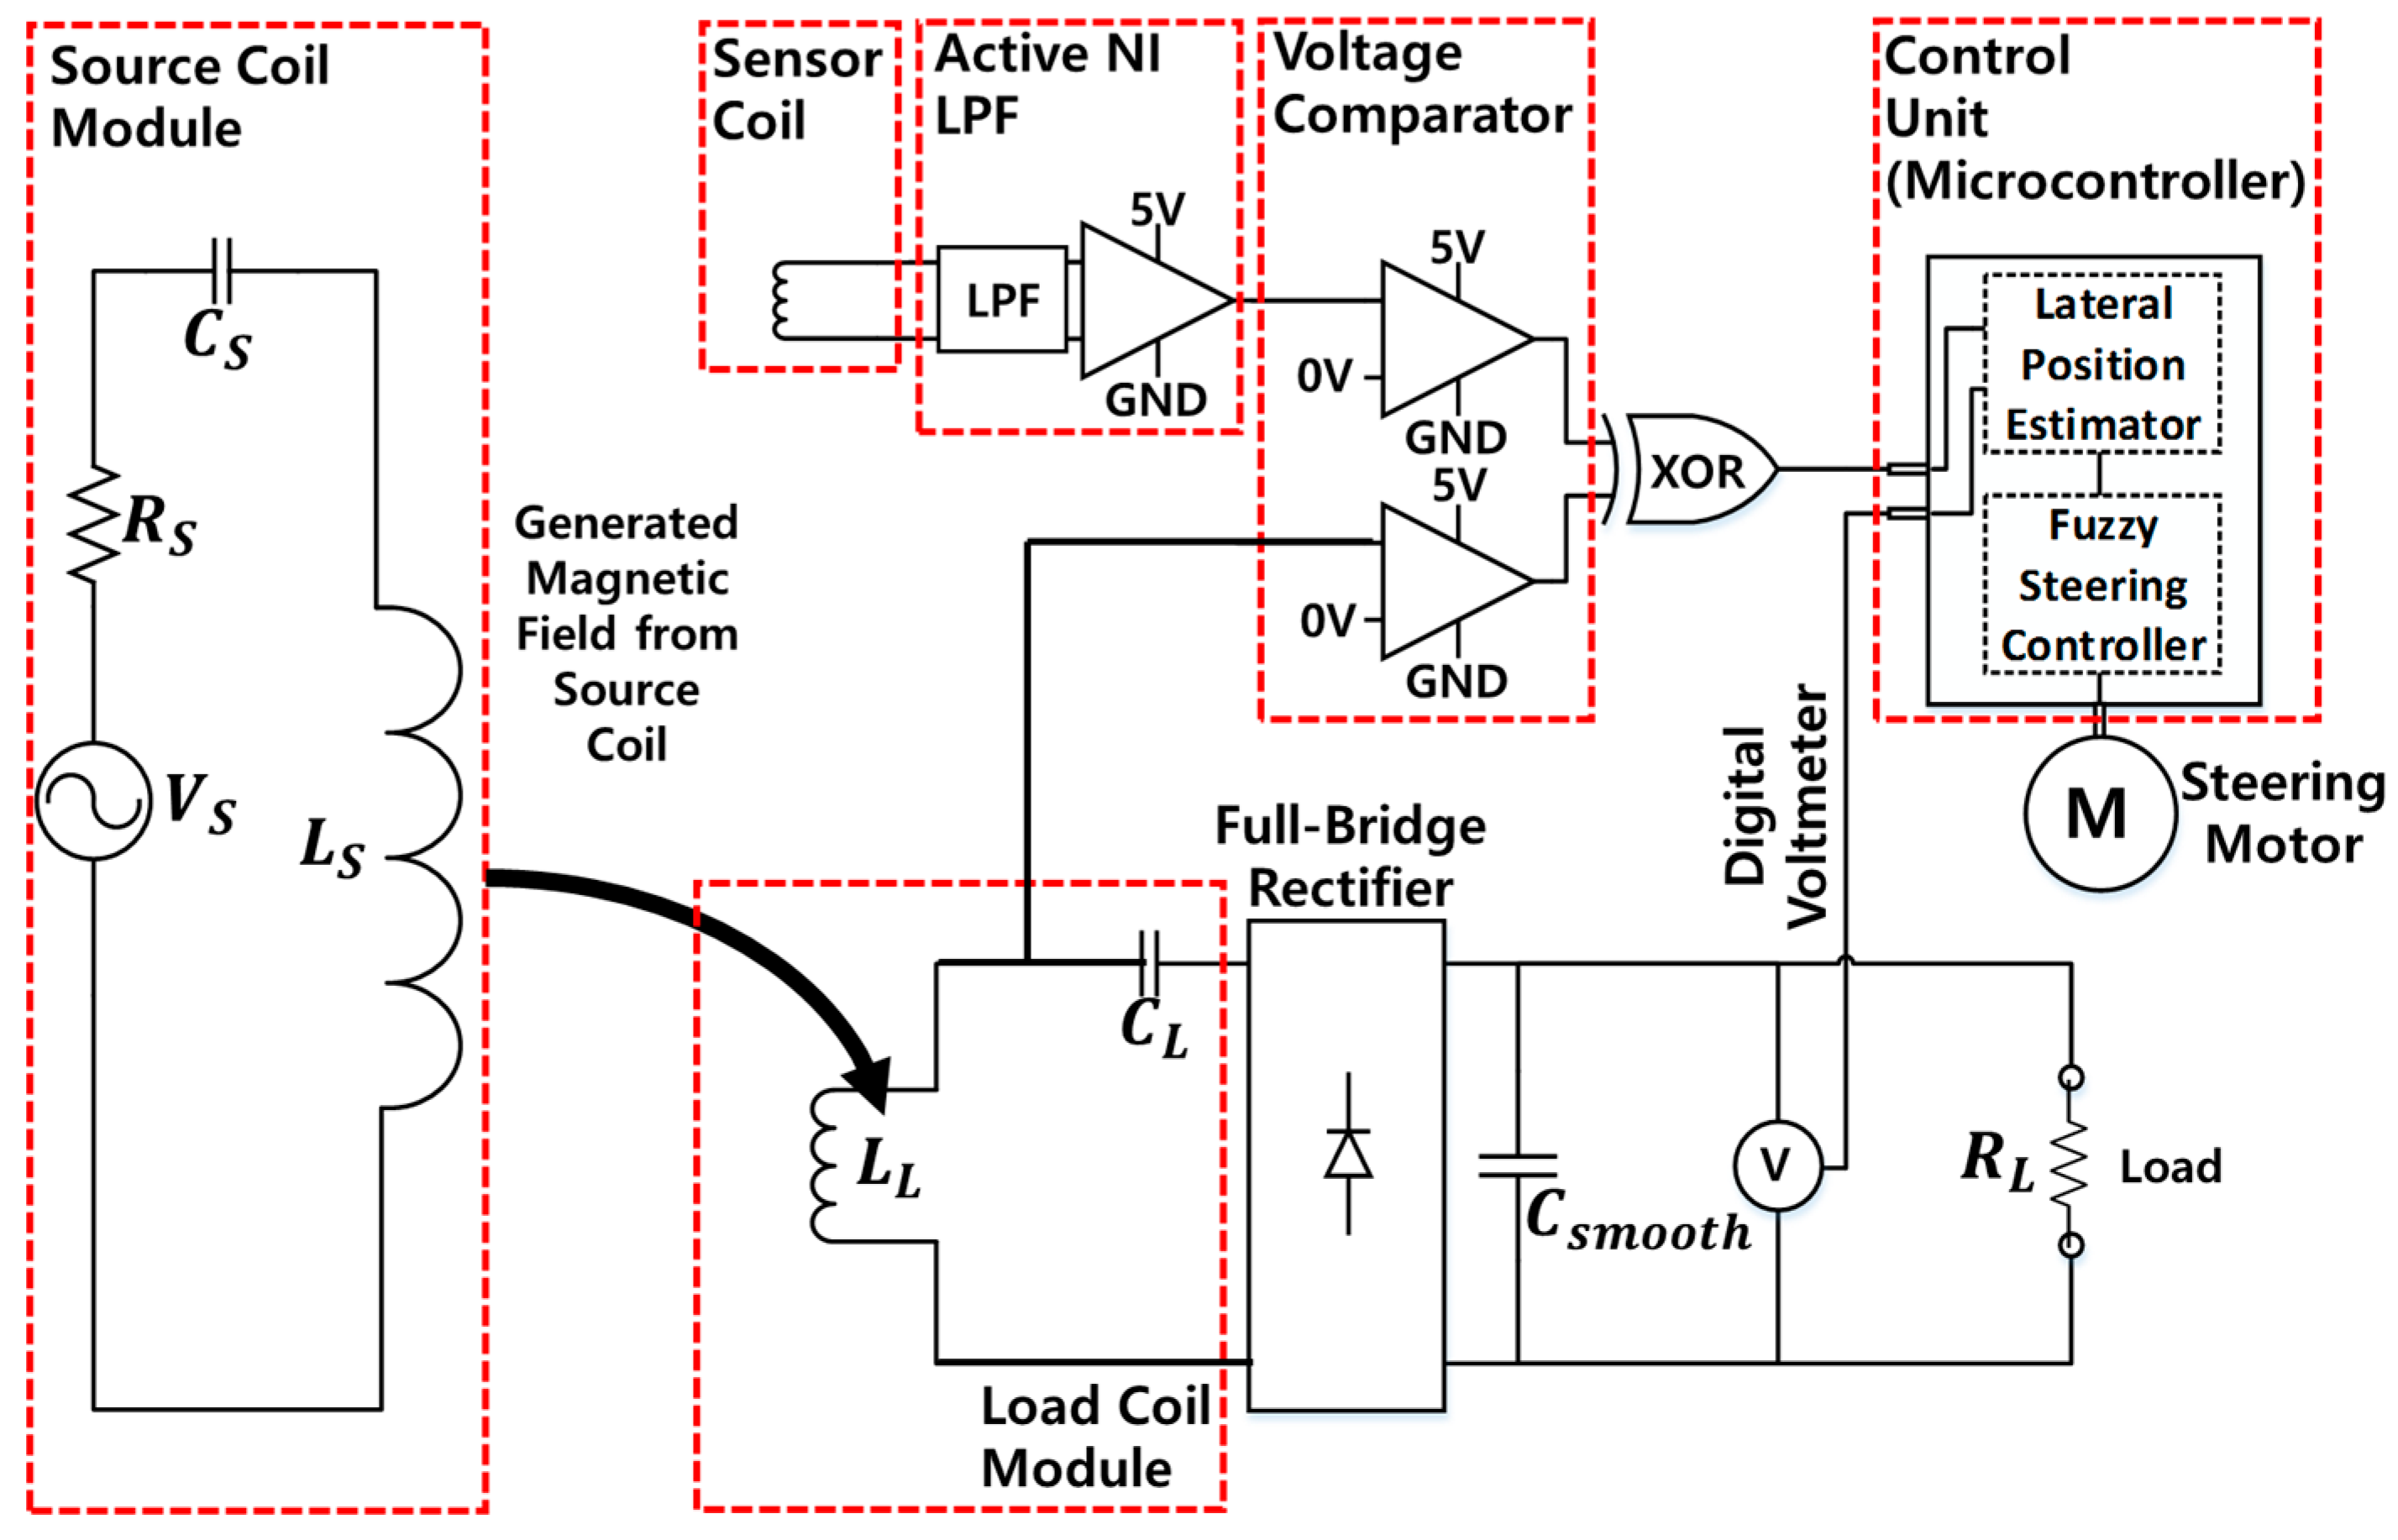
3. Concept of the Autonomous Coil Alignment System (ACAS)
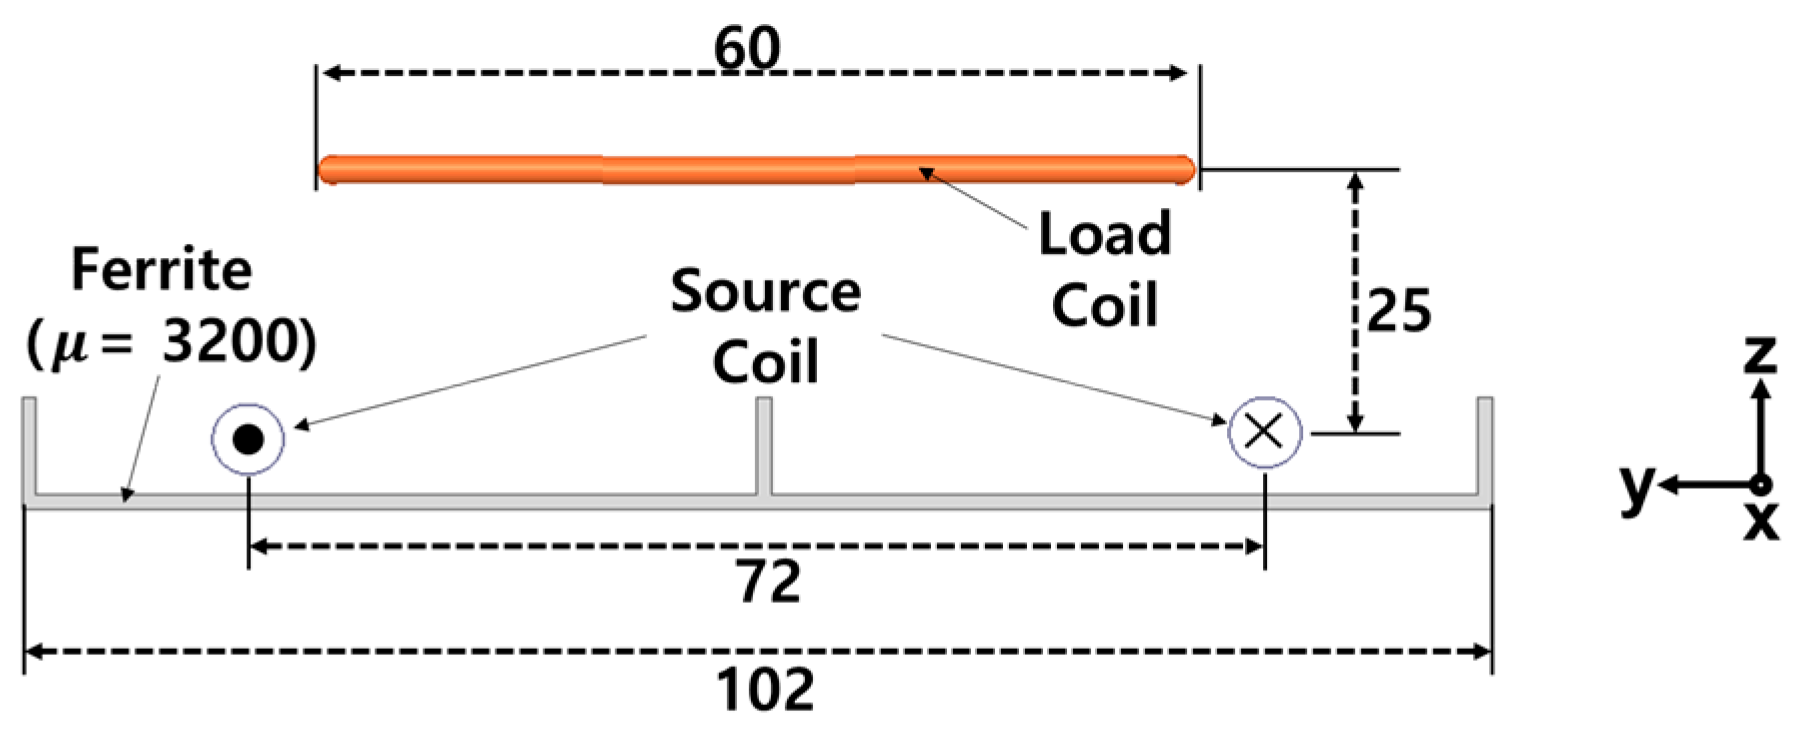
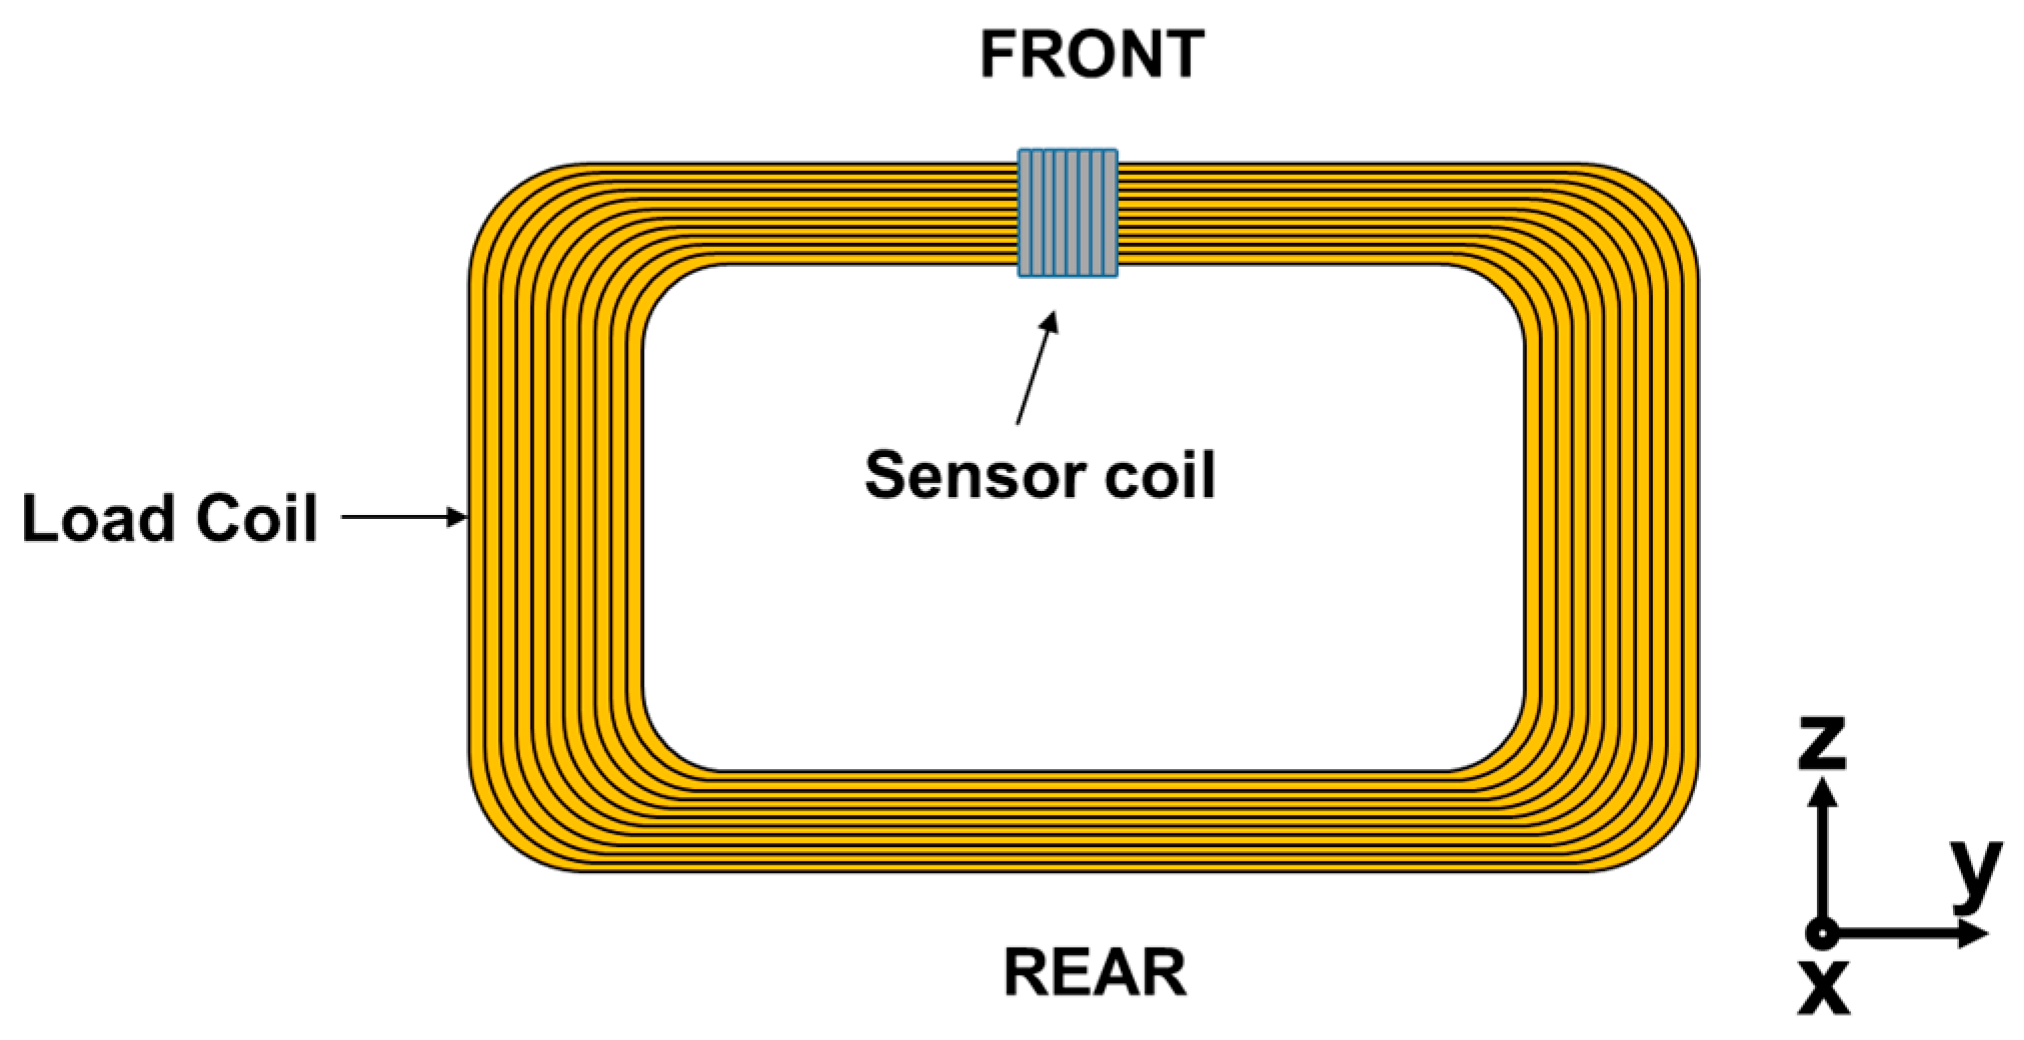
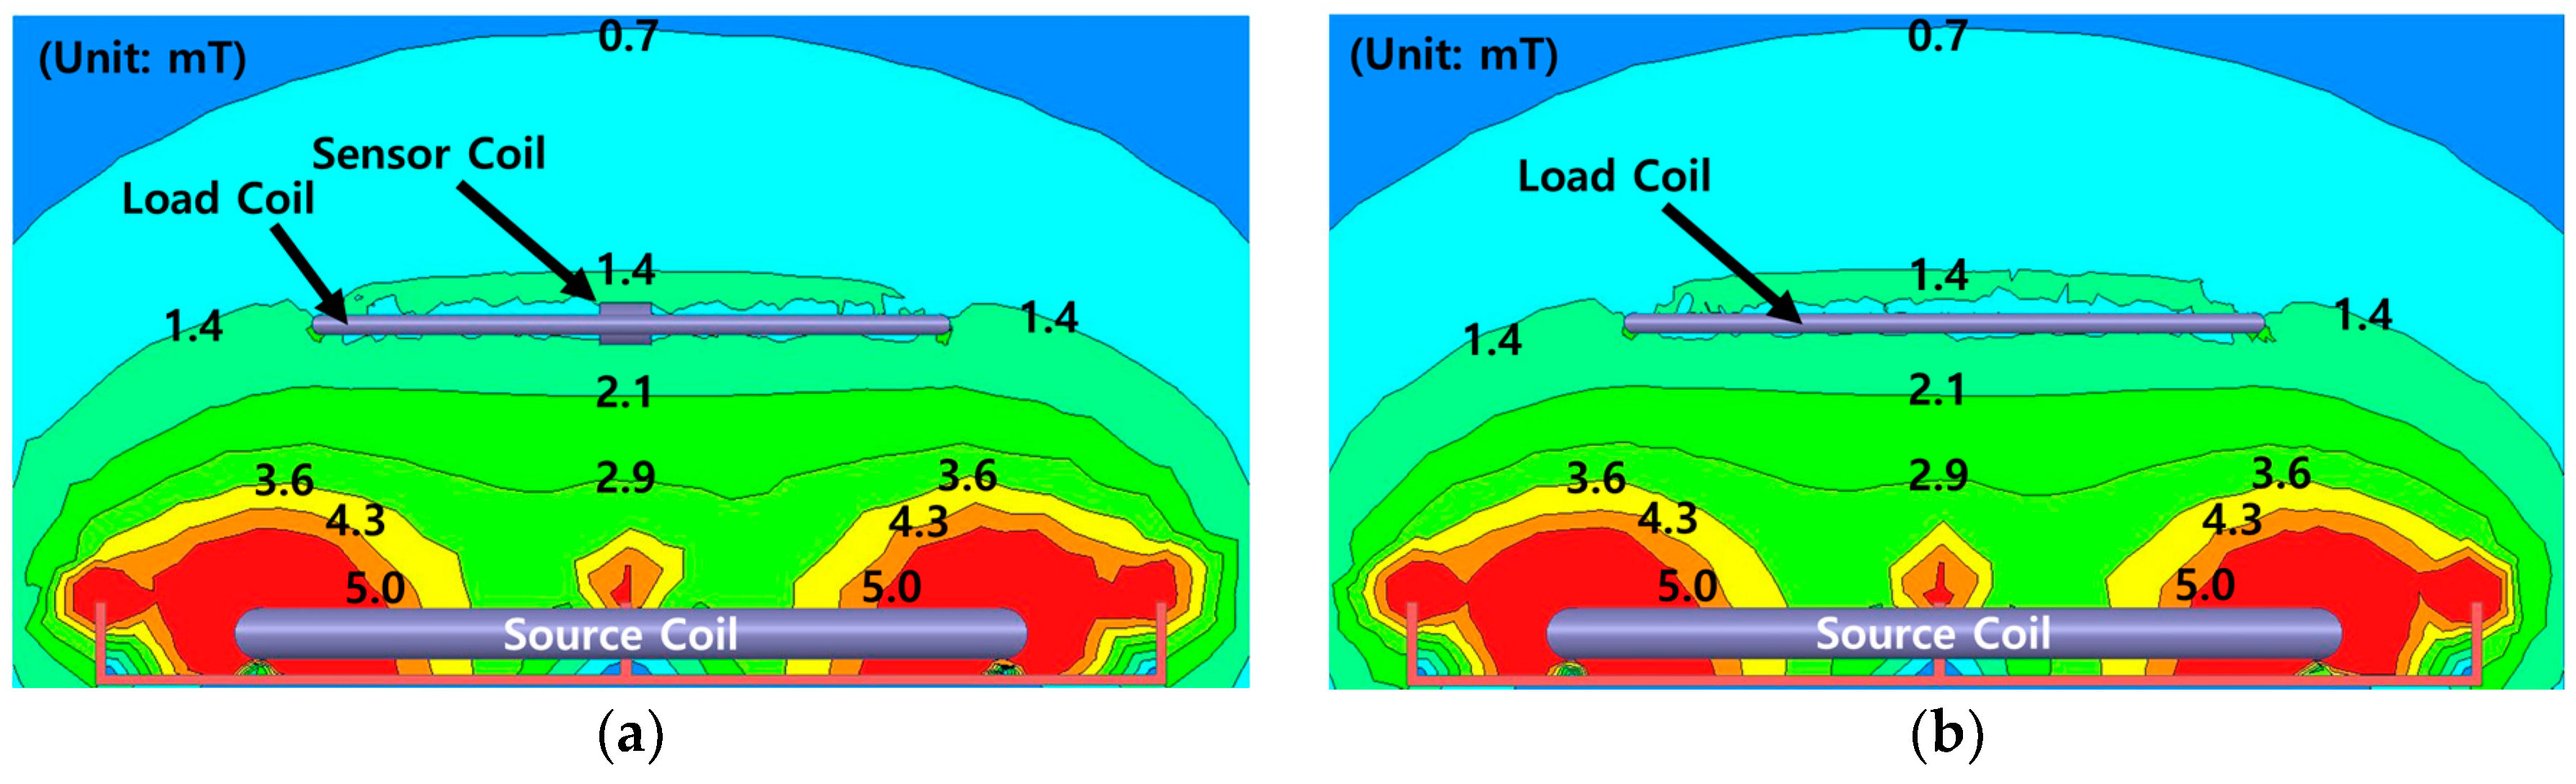
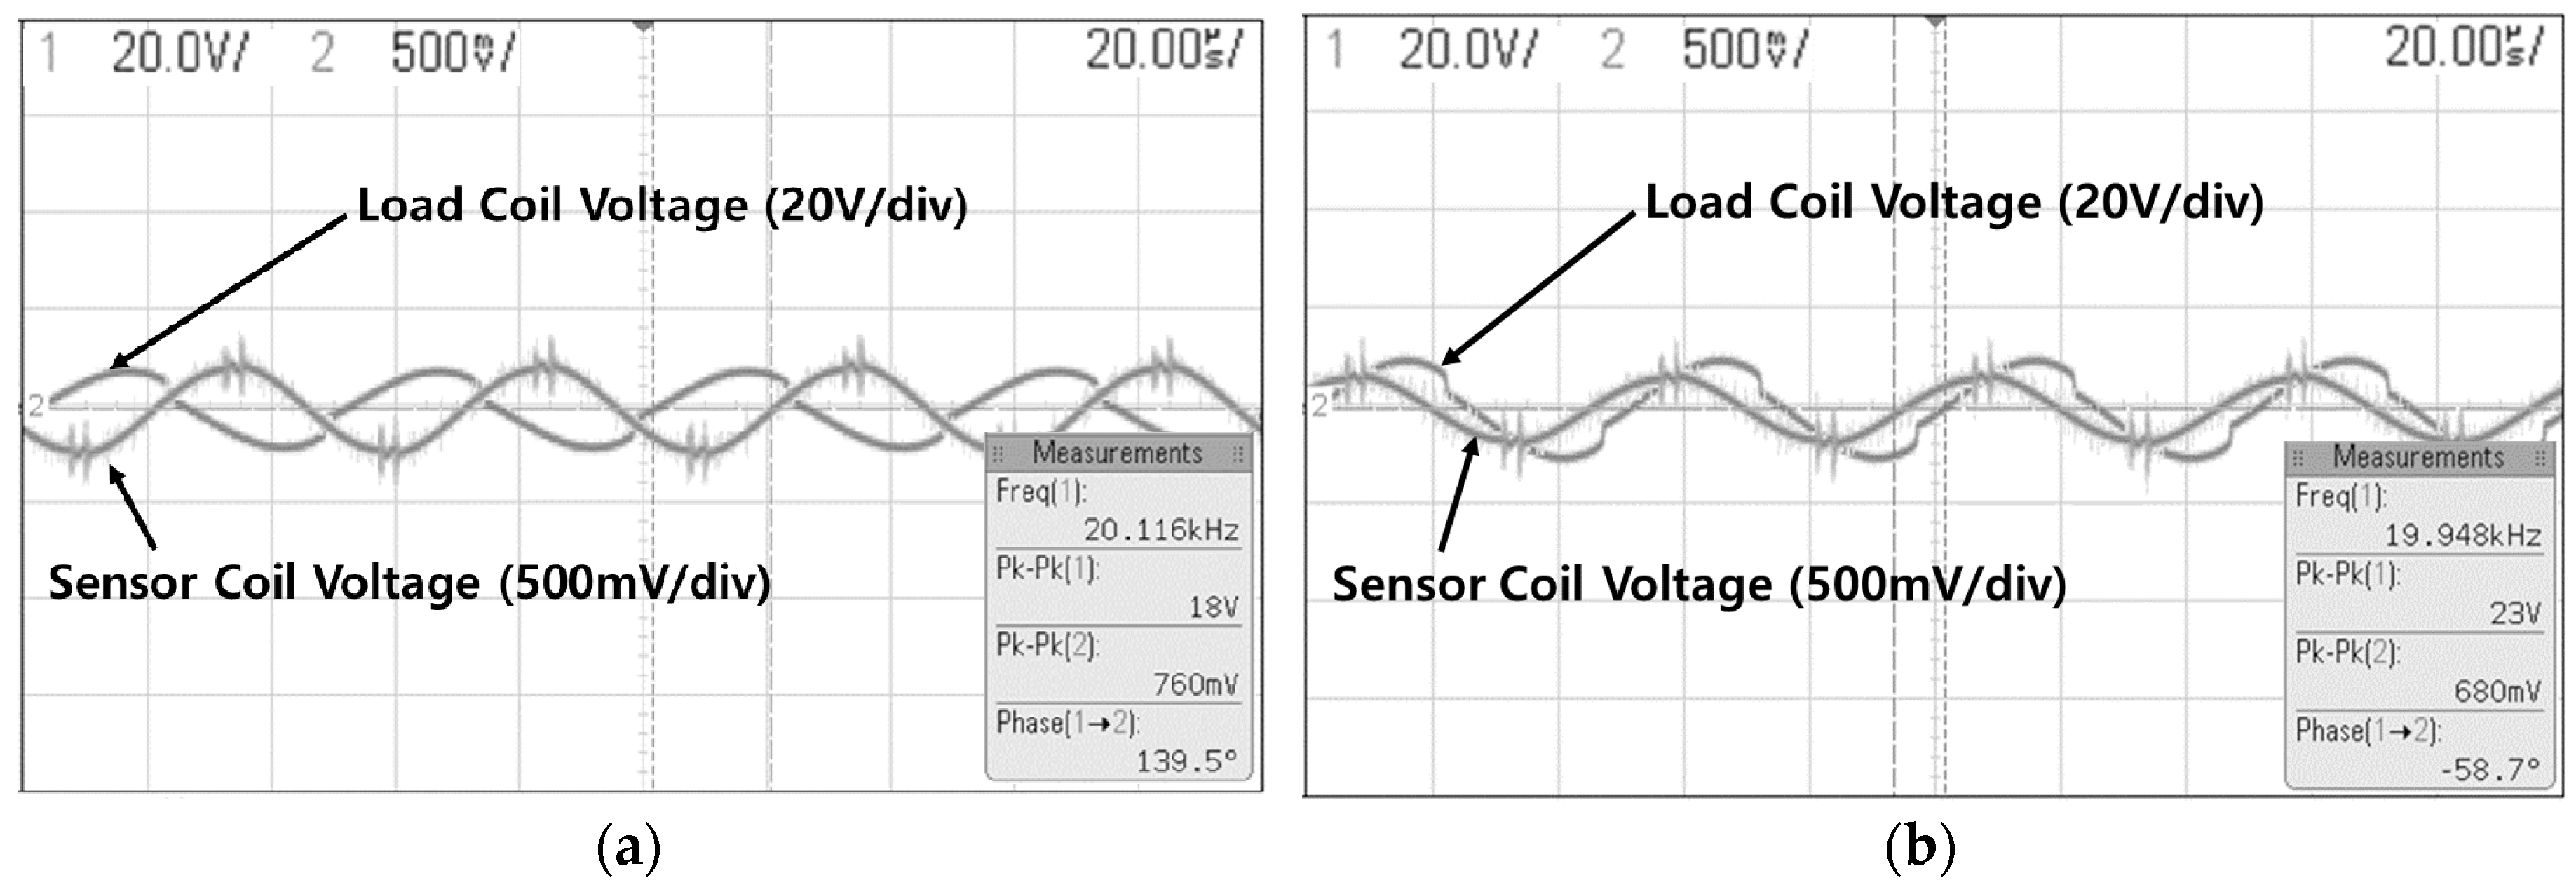
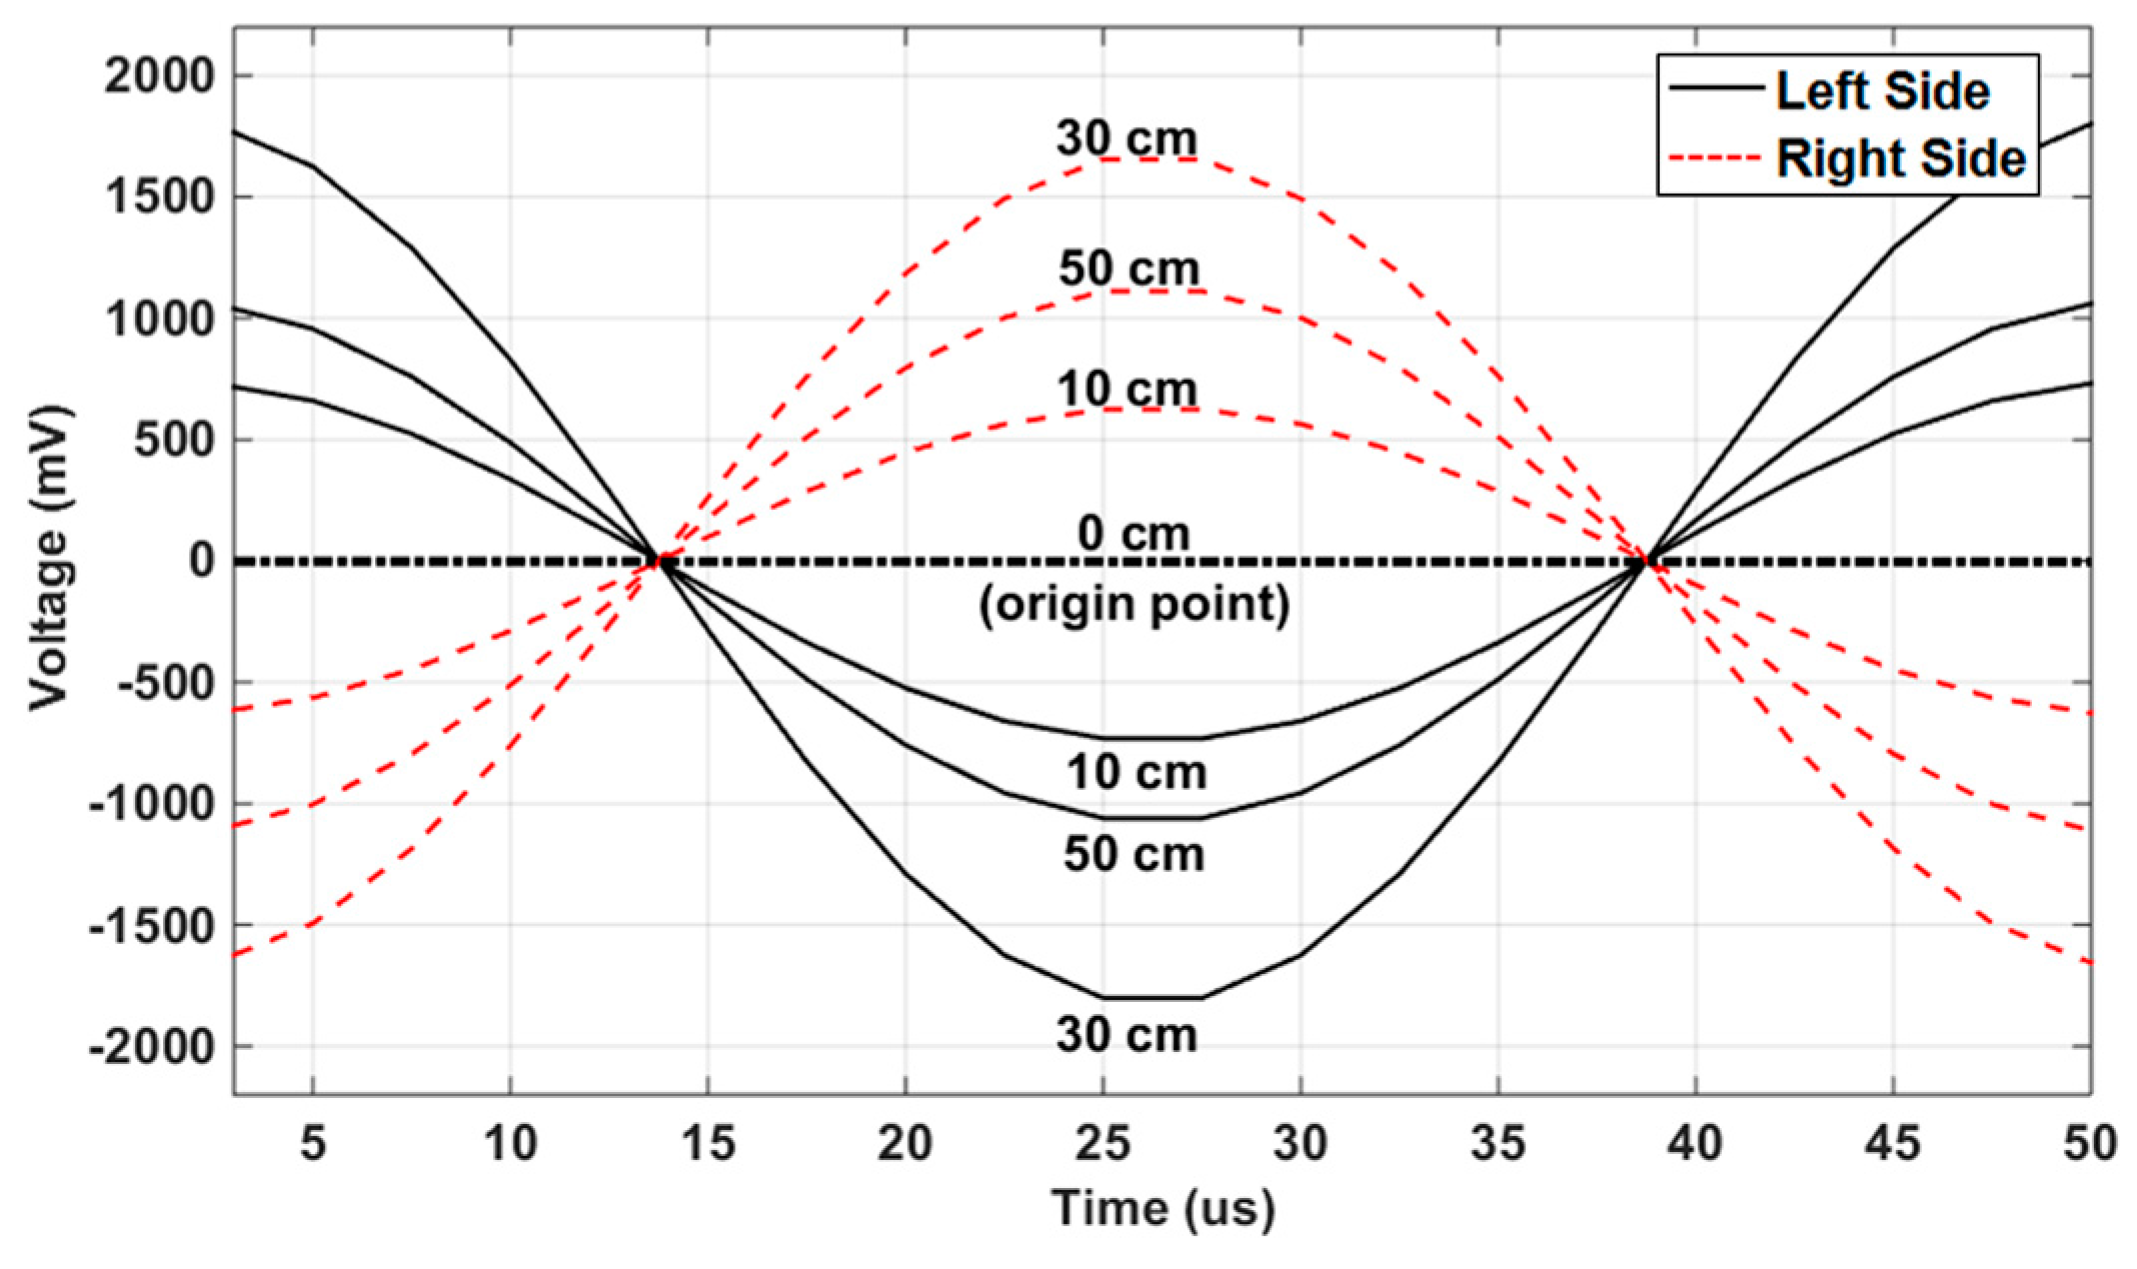
3.1. ACAS Sensor Coil Unit
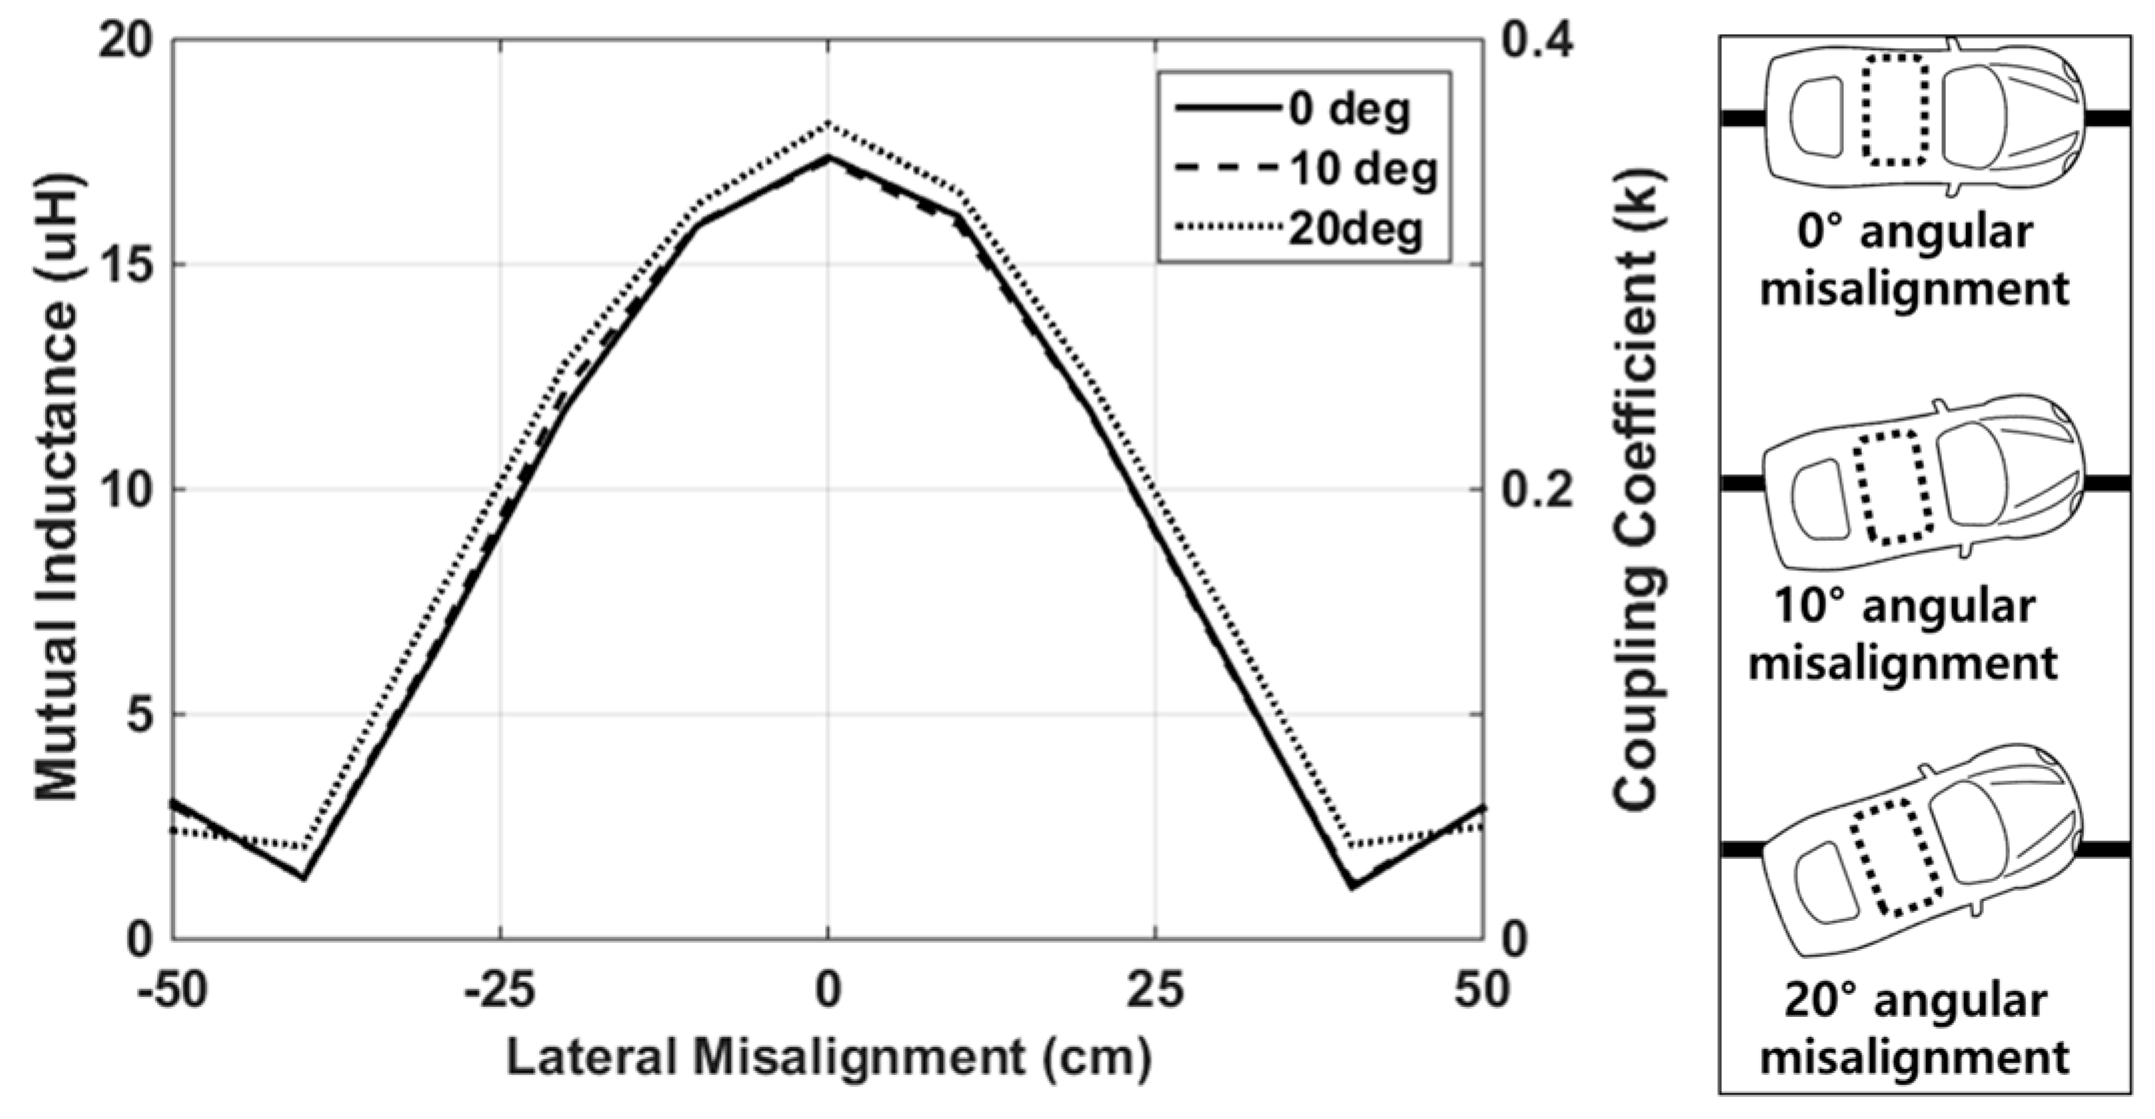
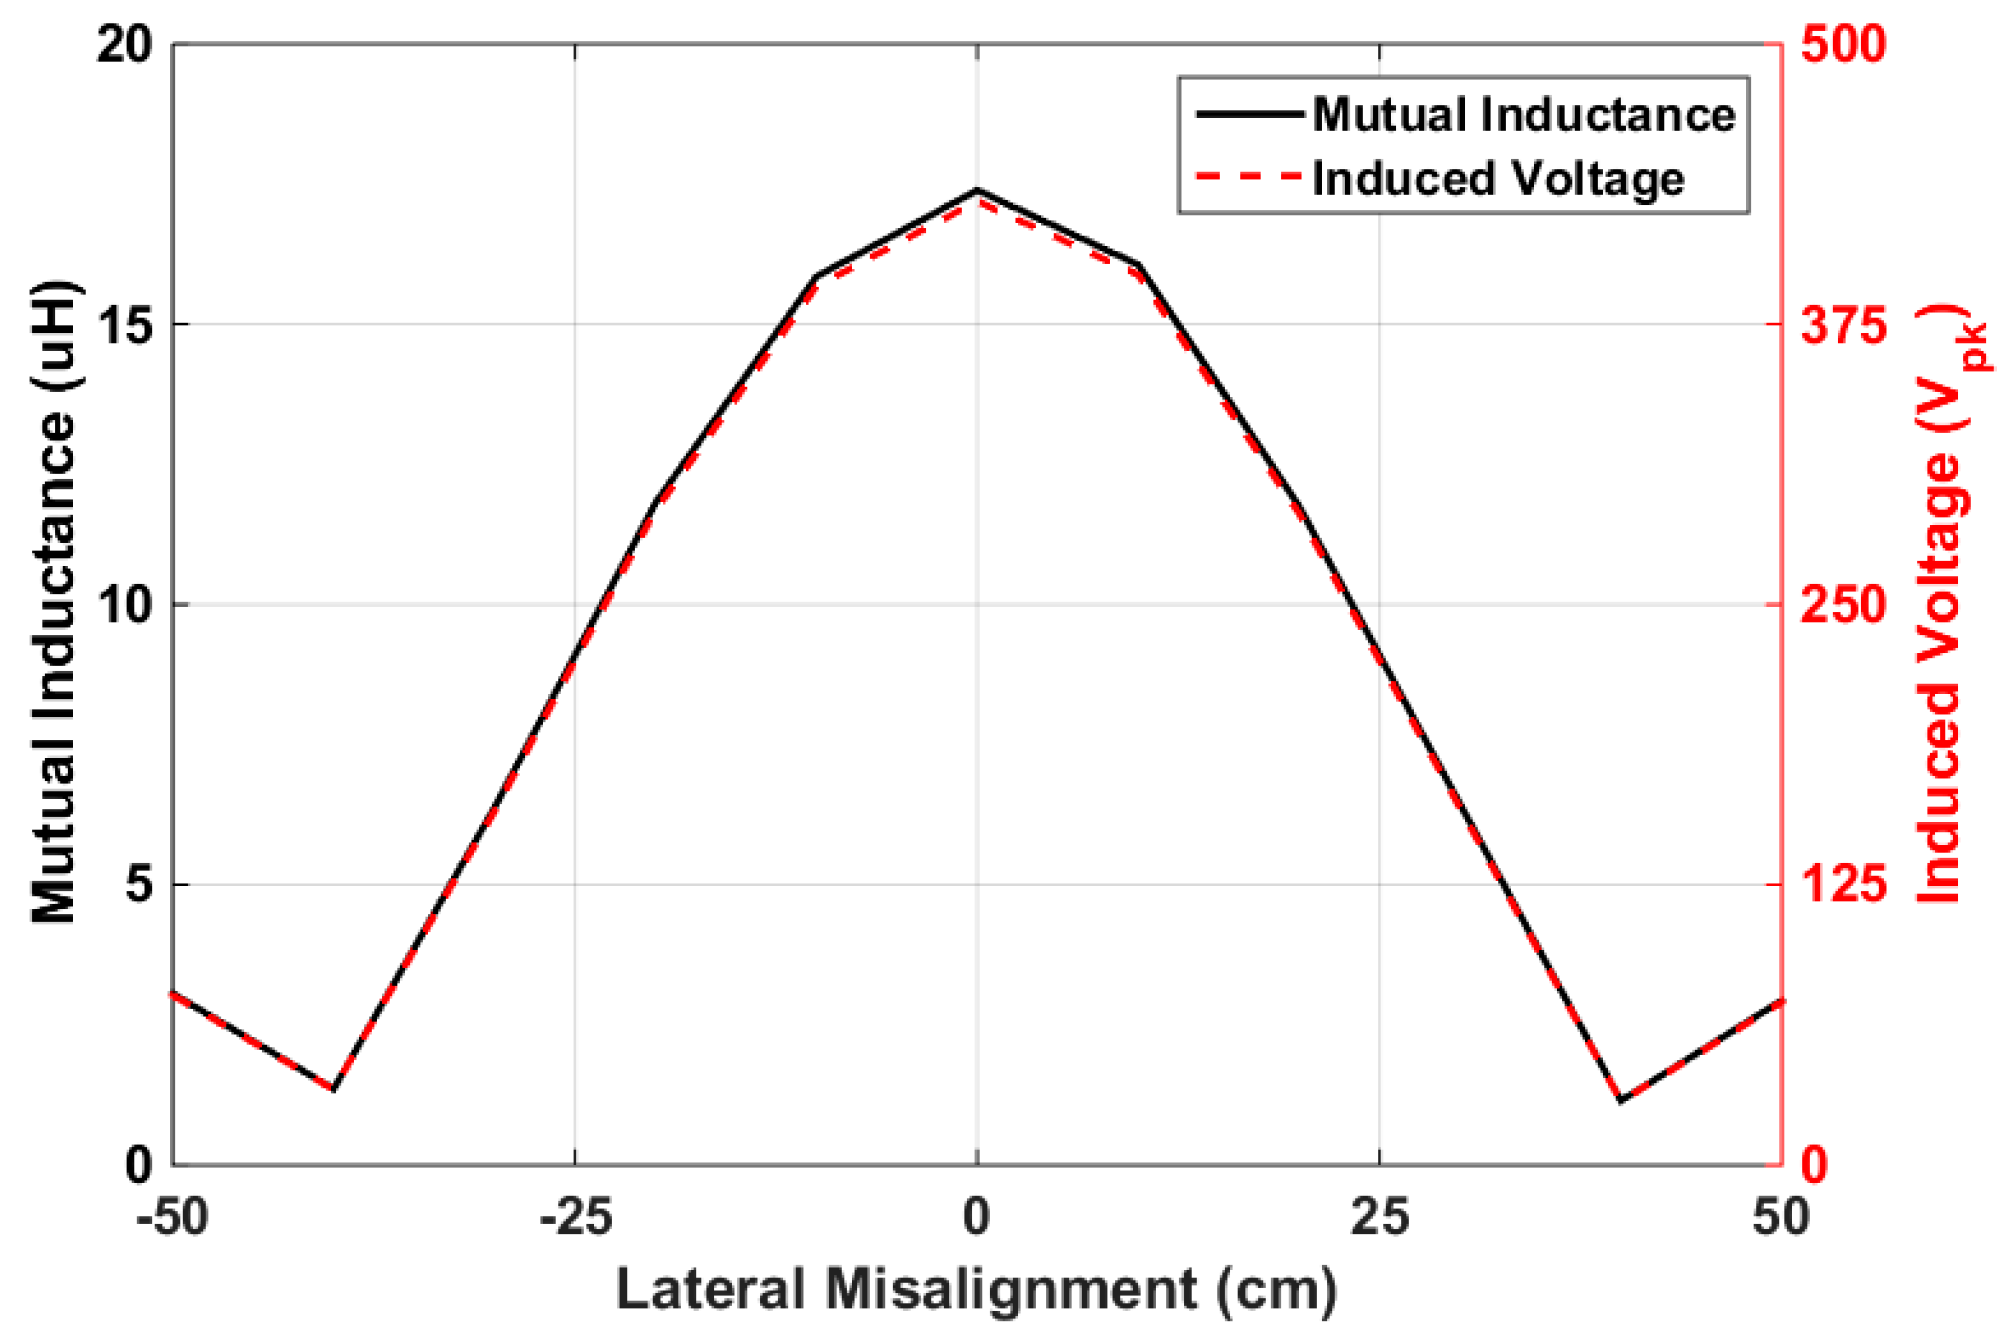
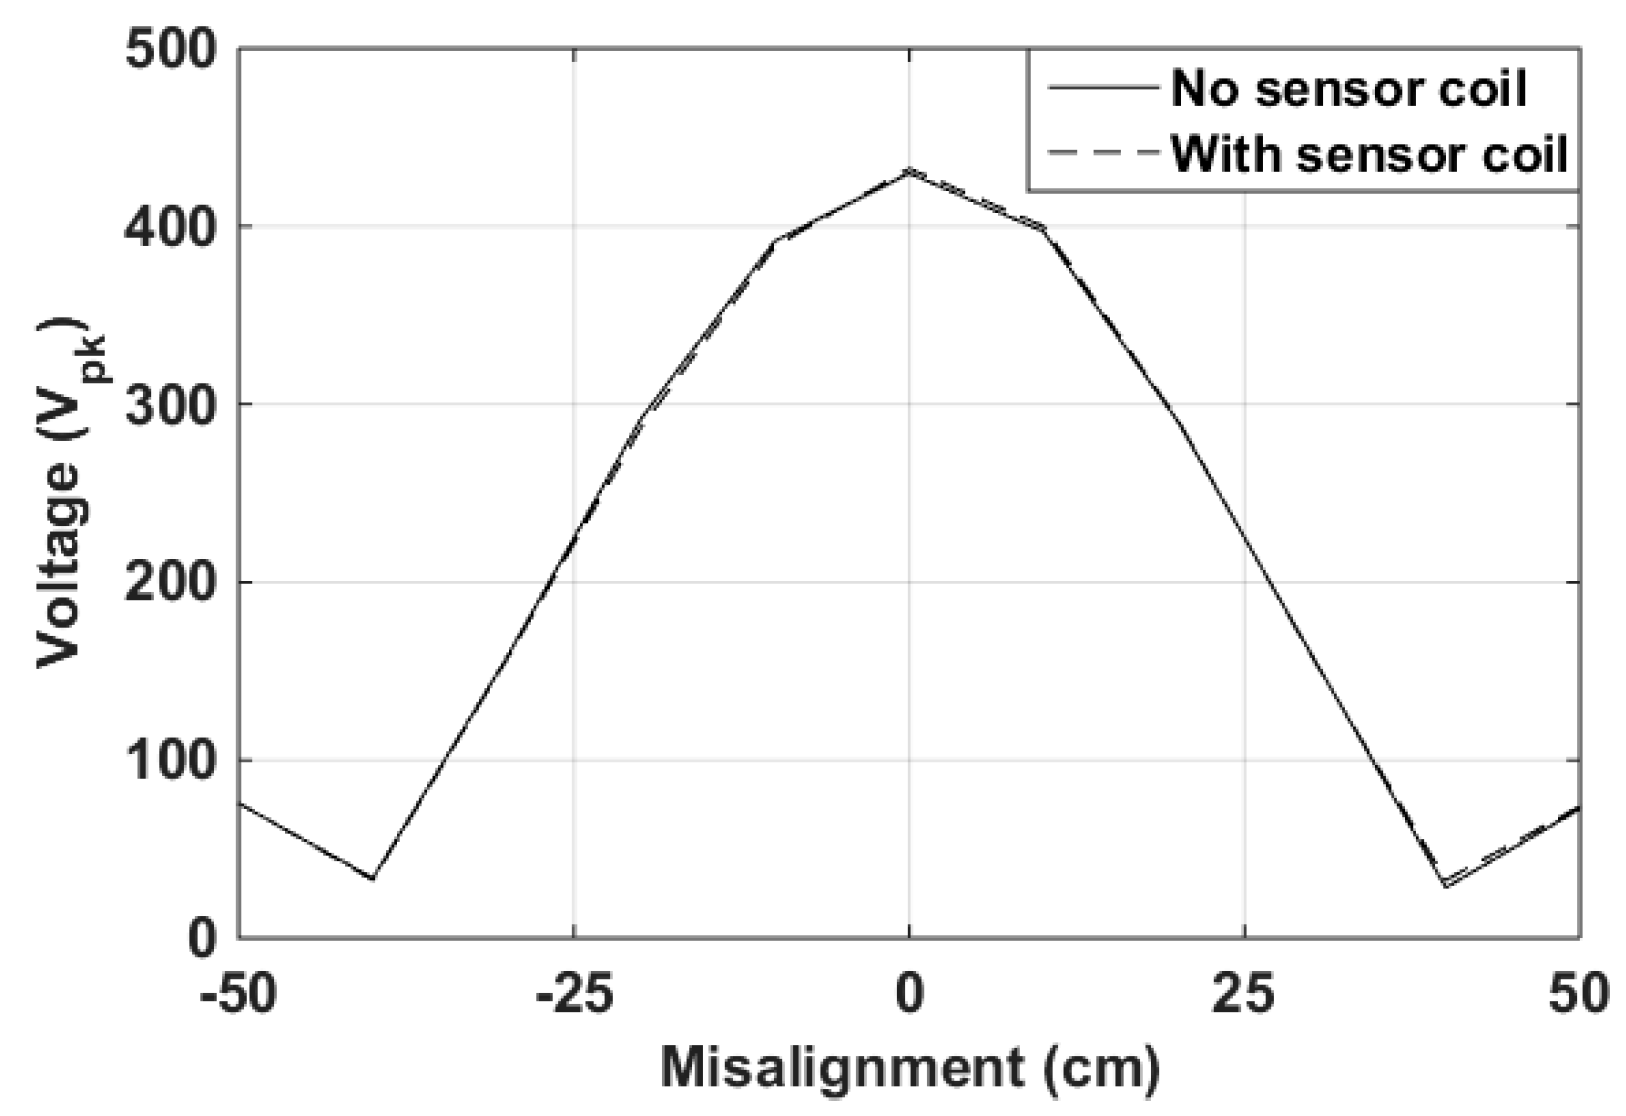
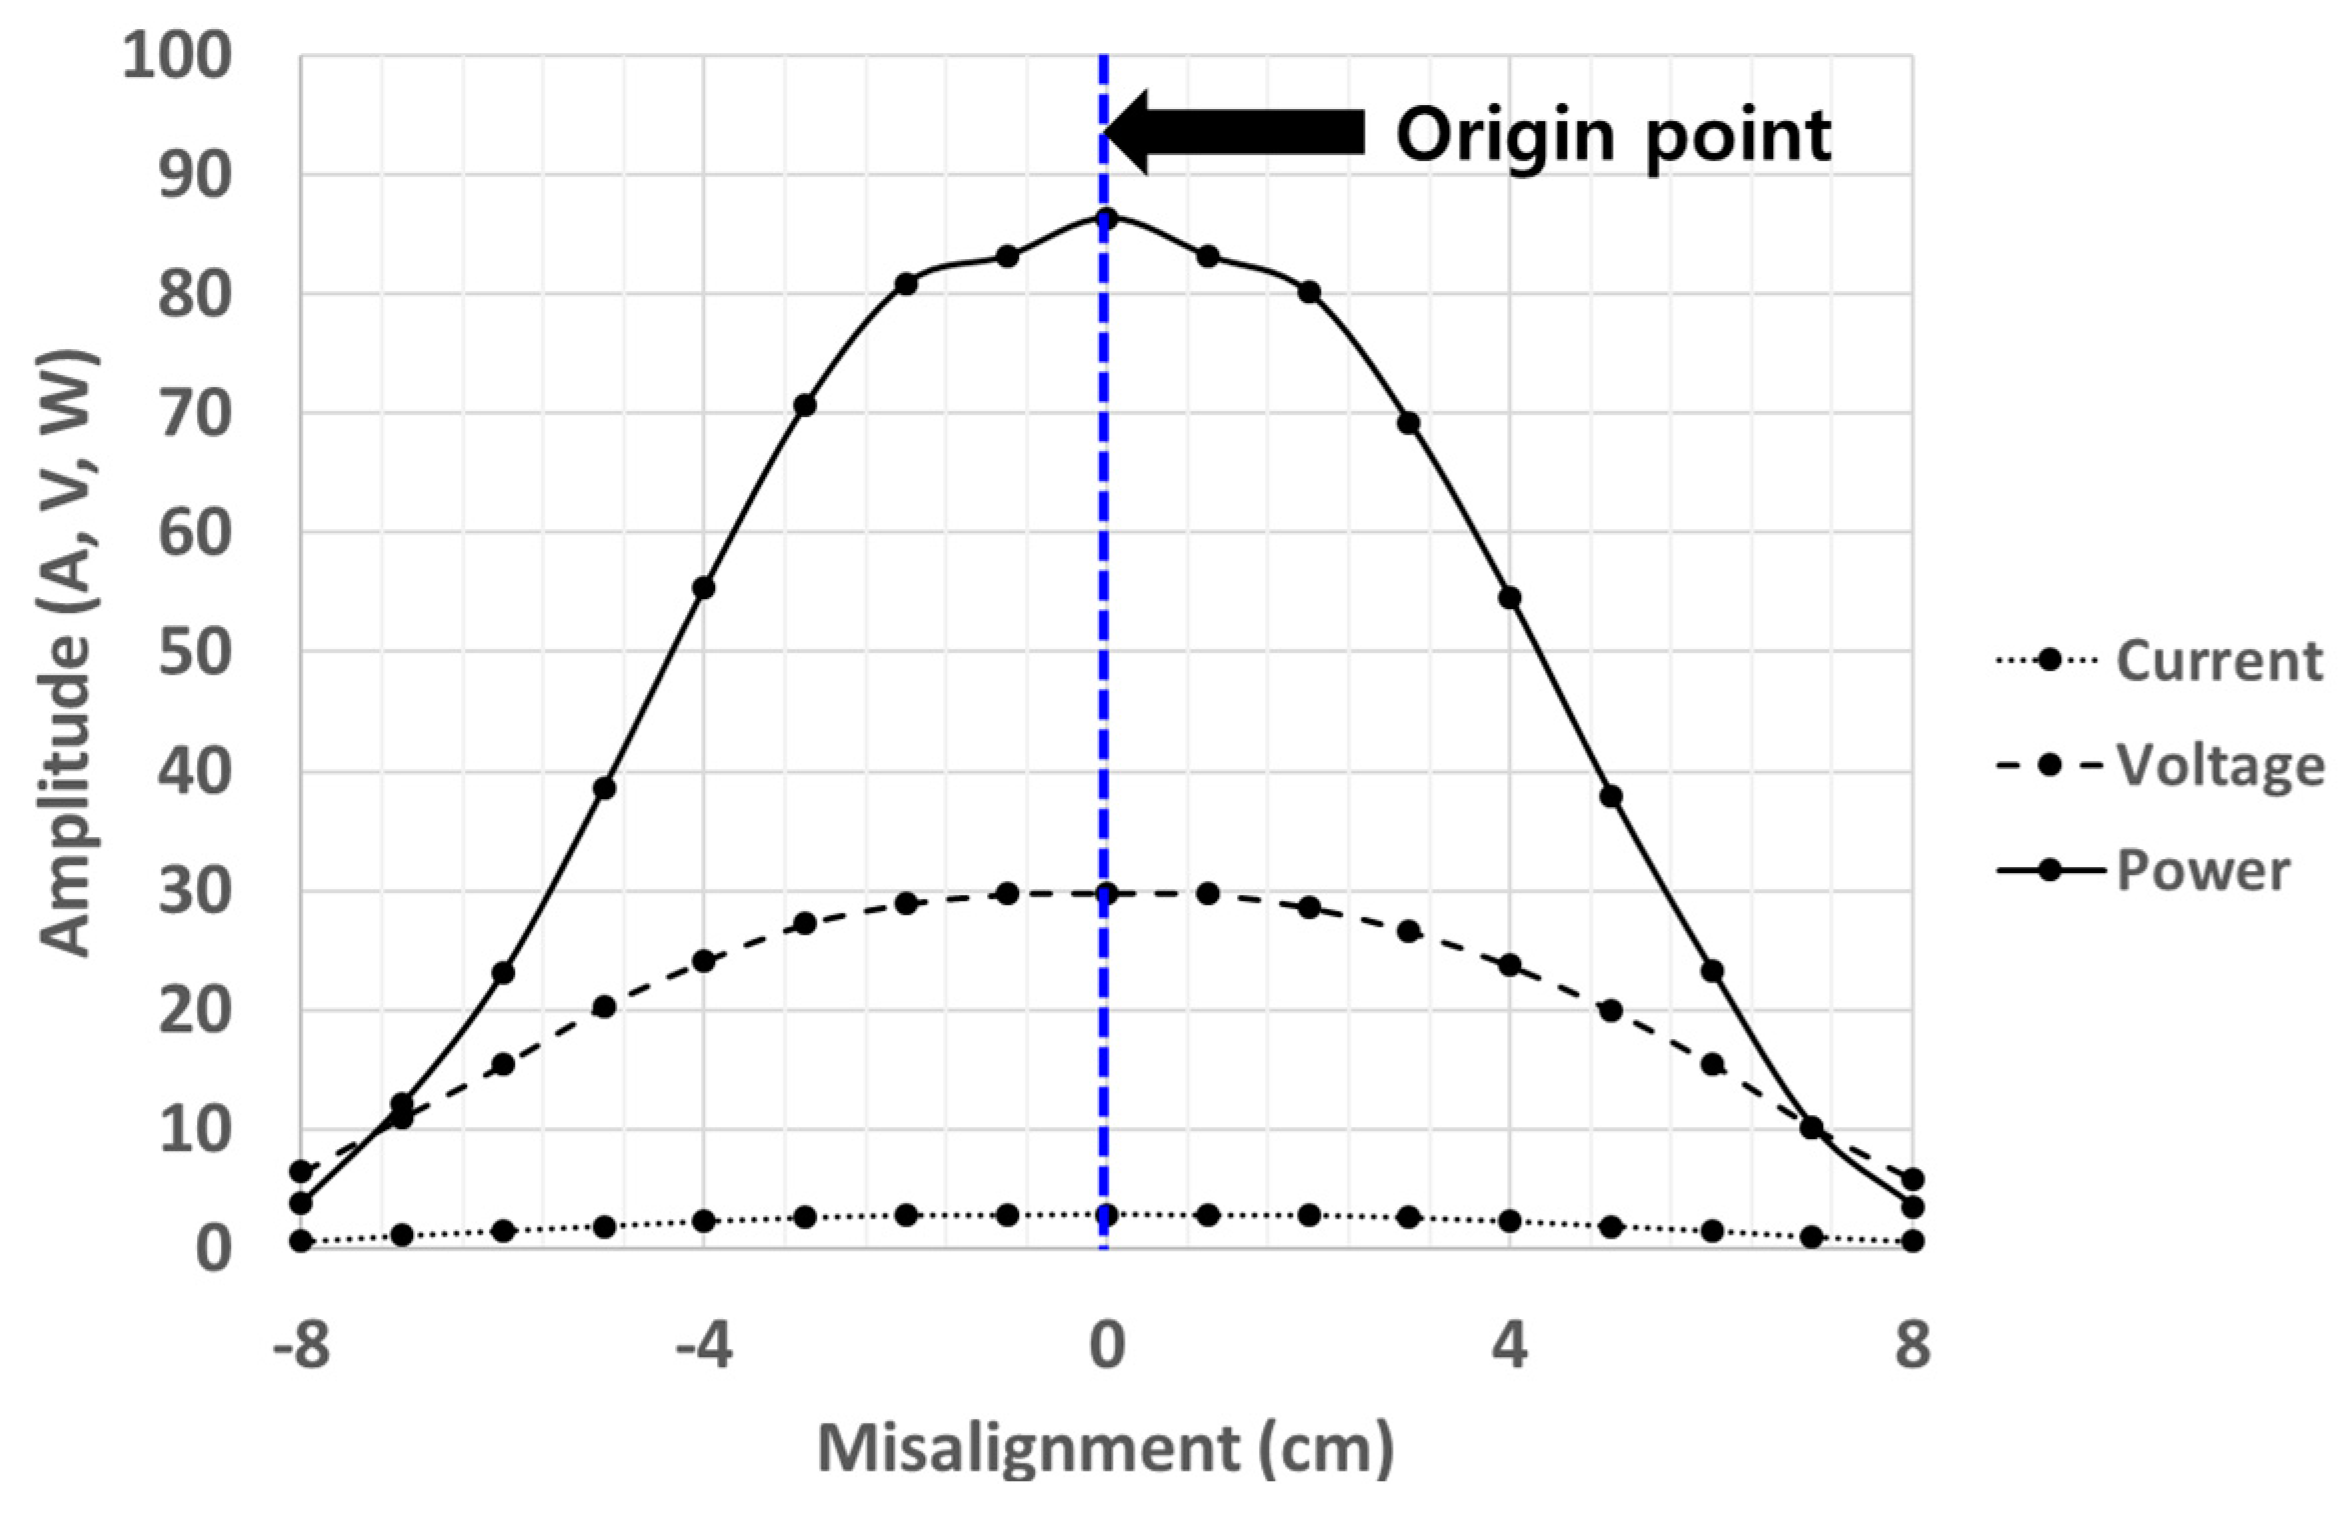
Verification of the ACAS Sensor Coil Unit through Simulation
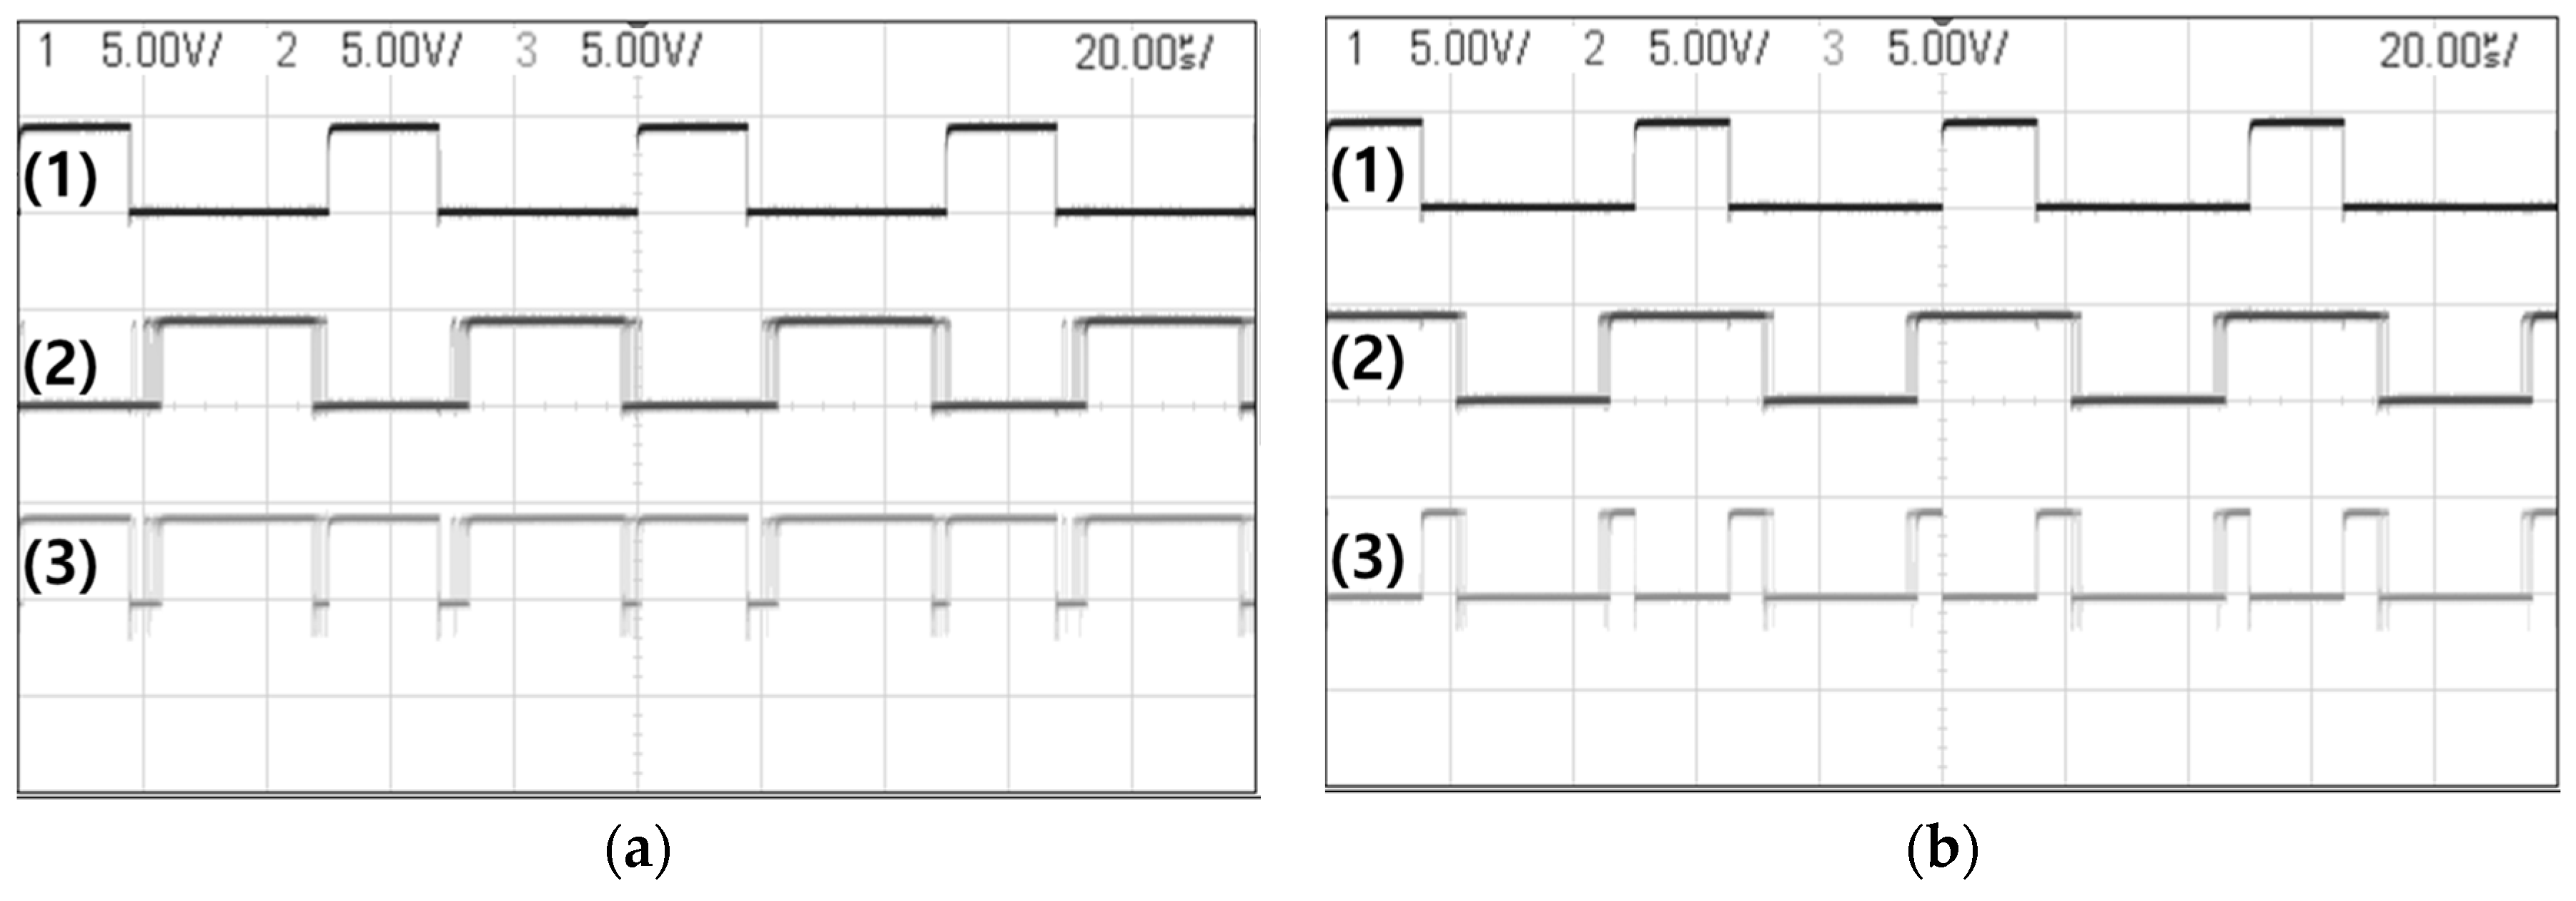
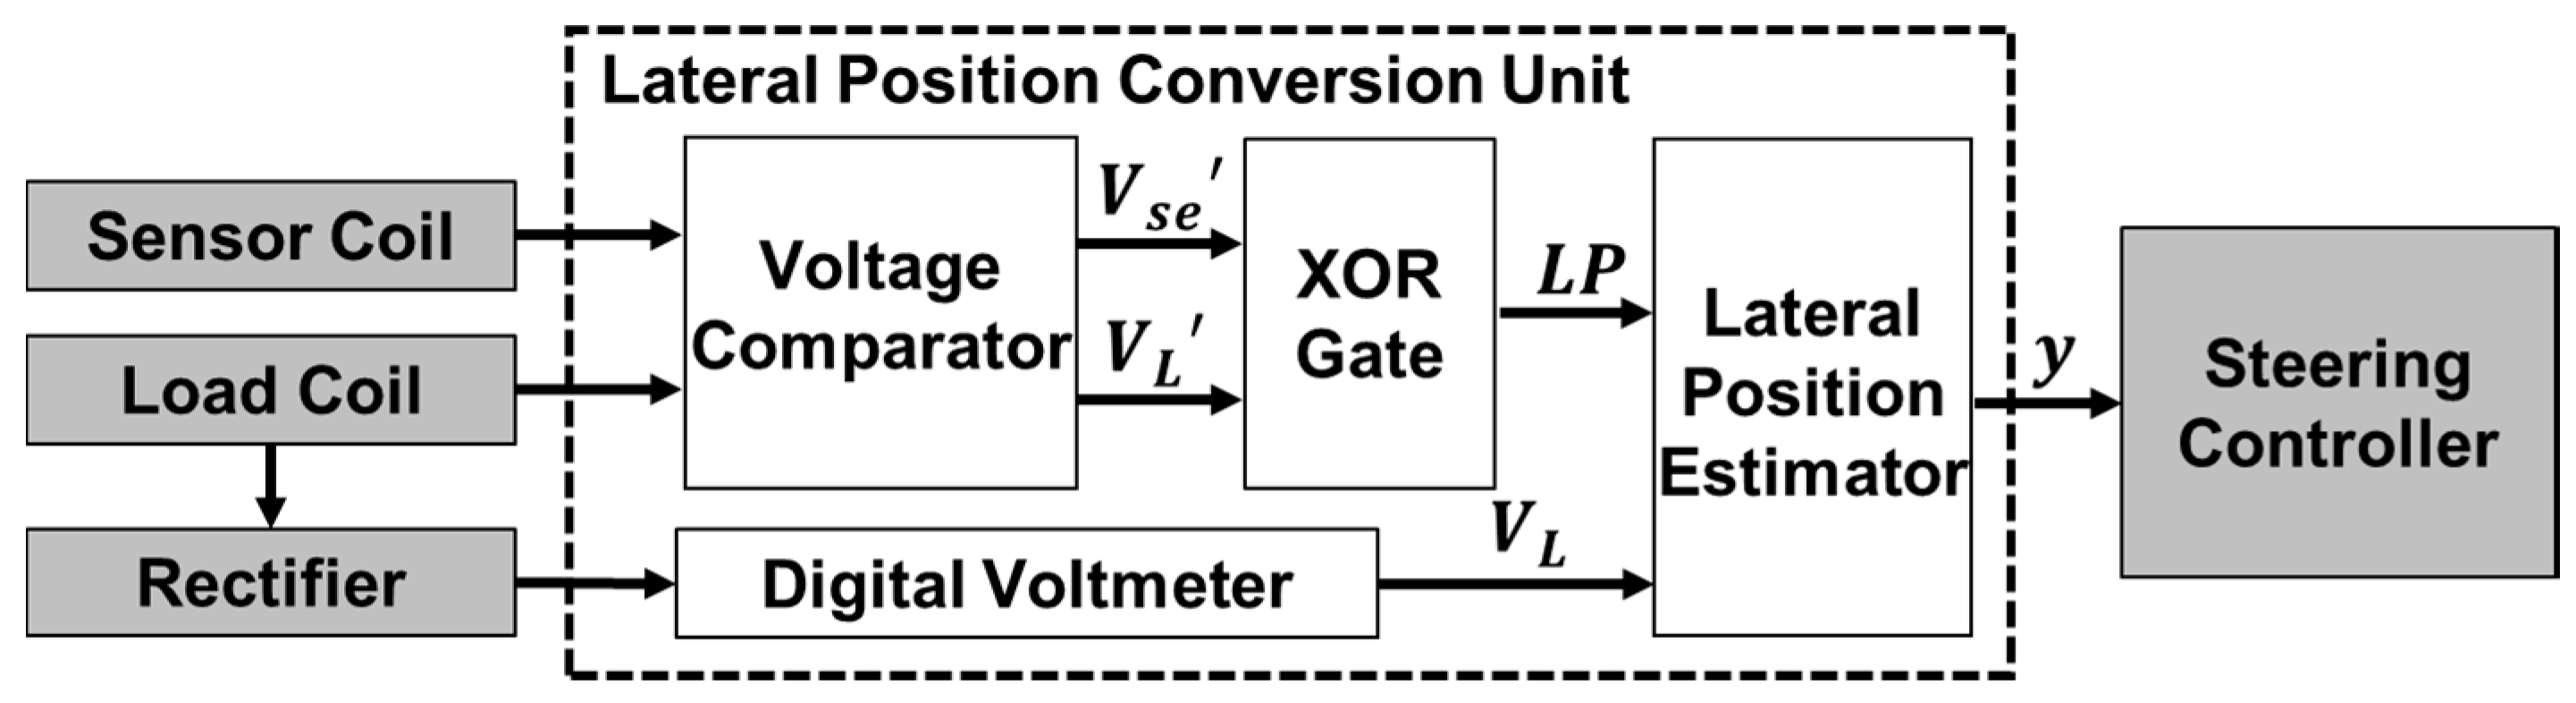
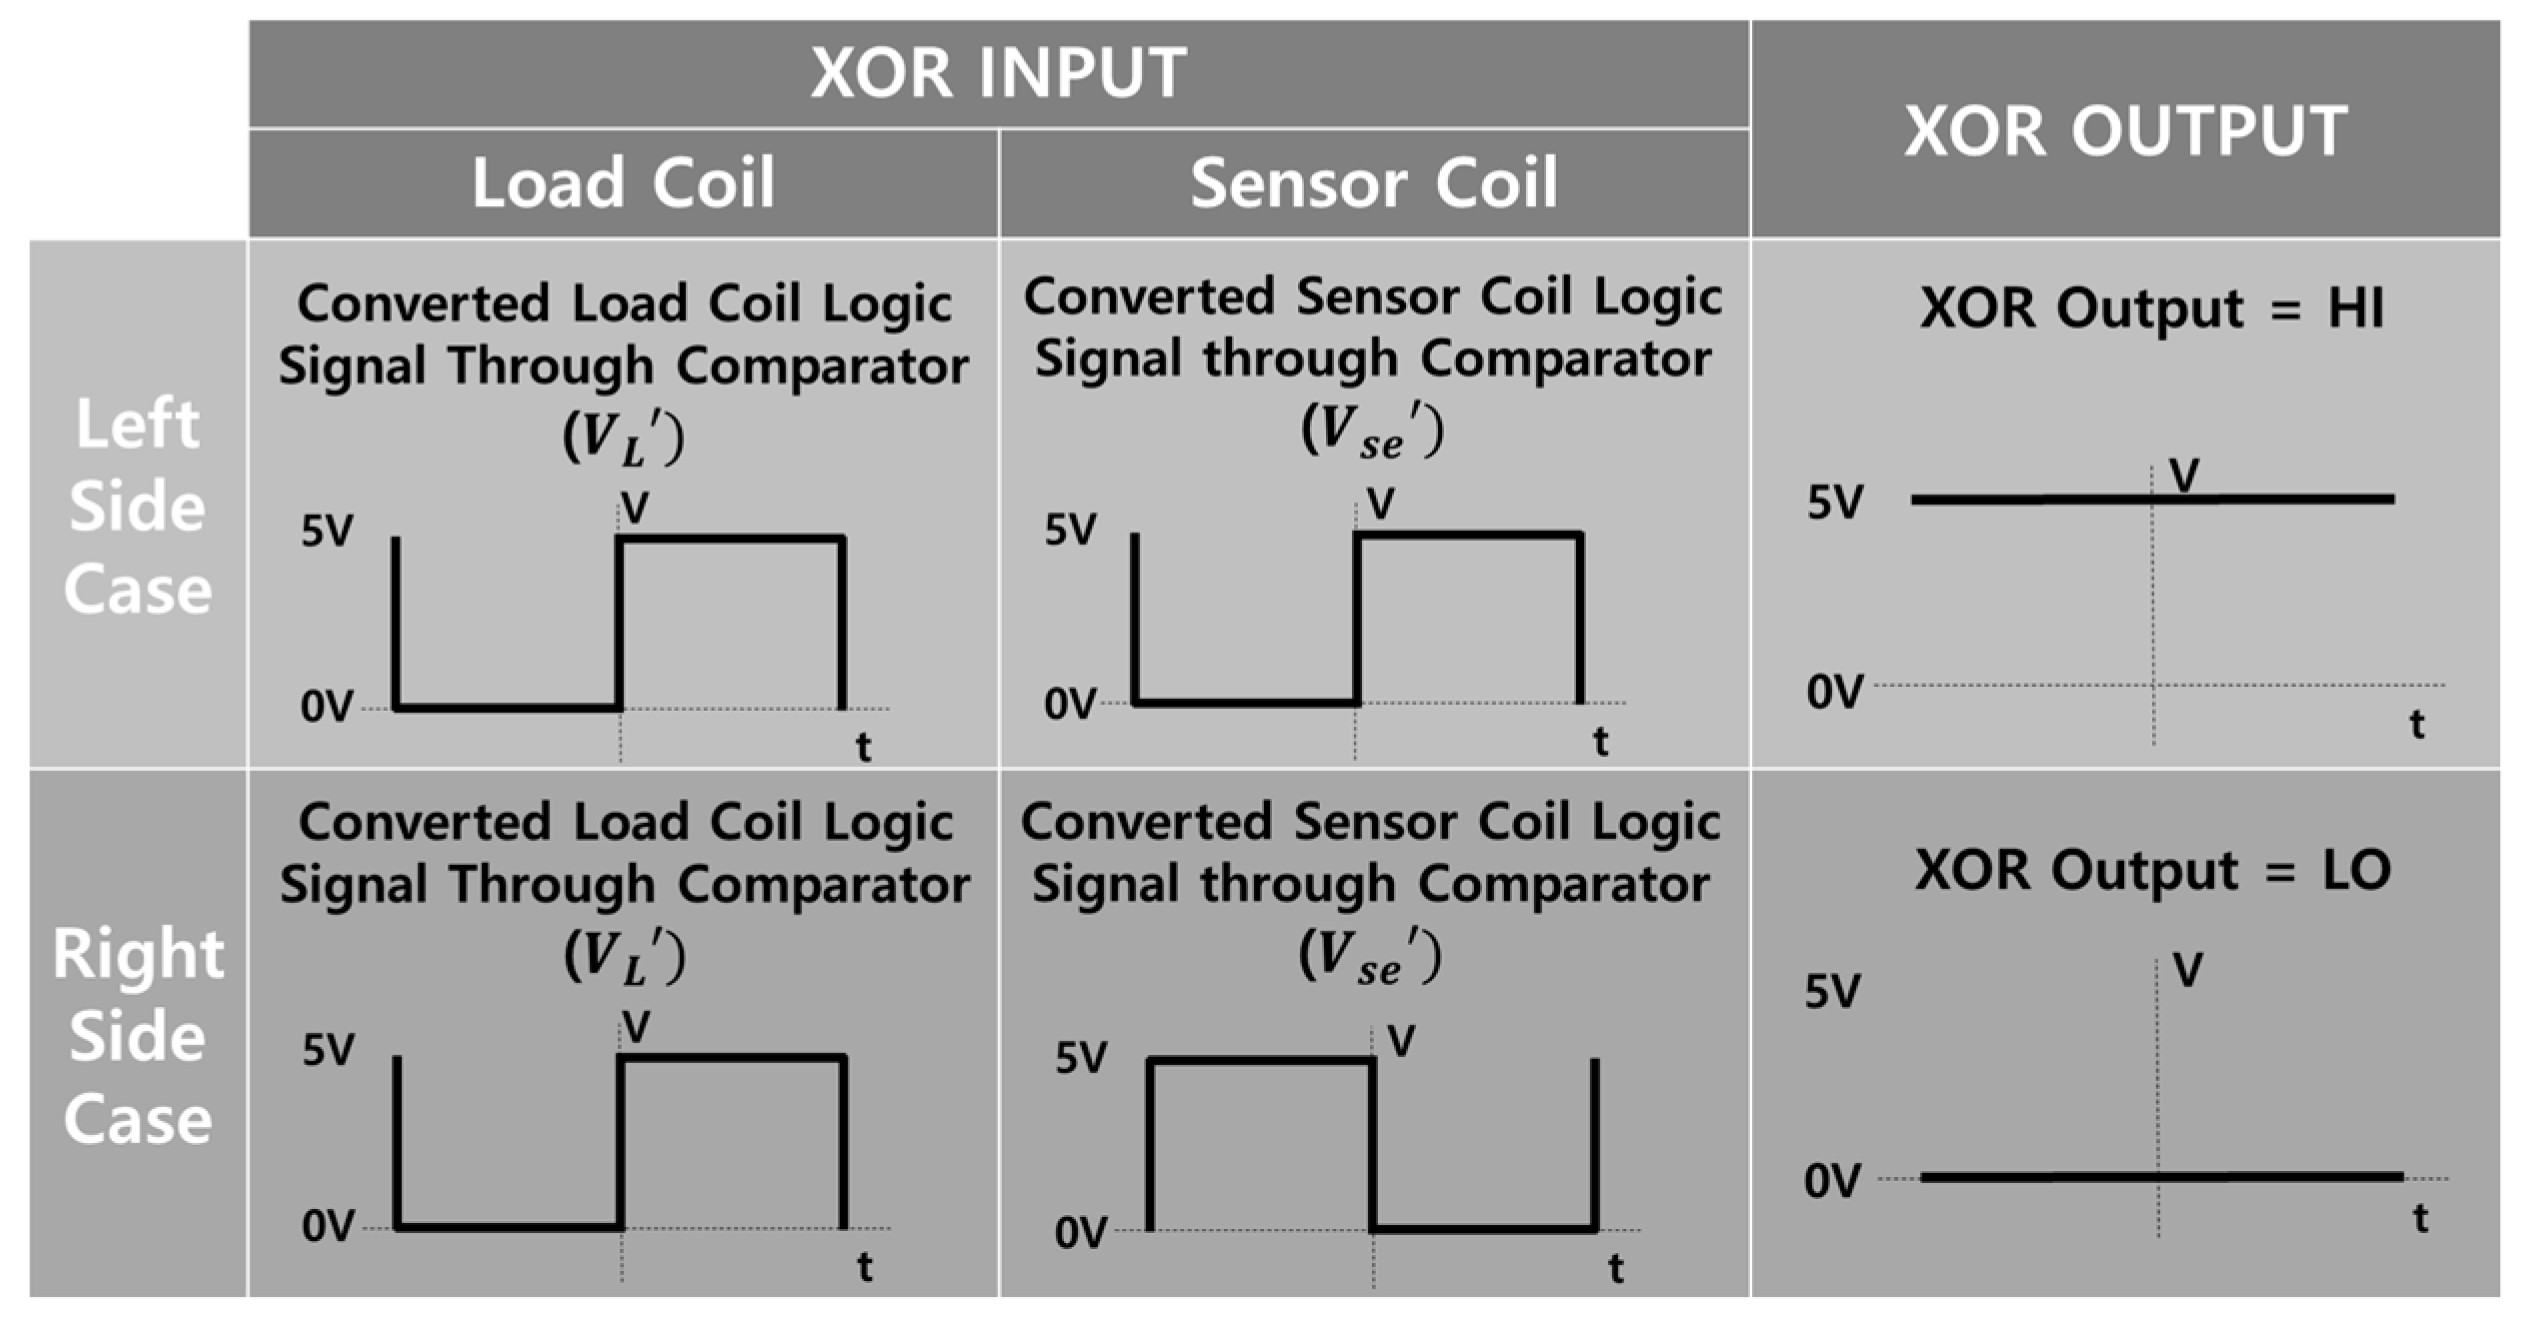
3.2. ACAS Lateral Position Detection Unit
3.3. ACAS Fuzzy Steering Controller
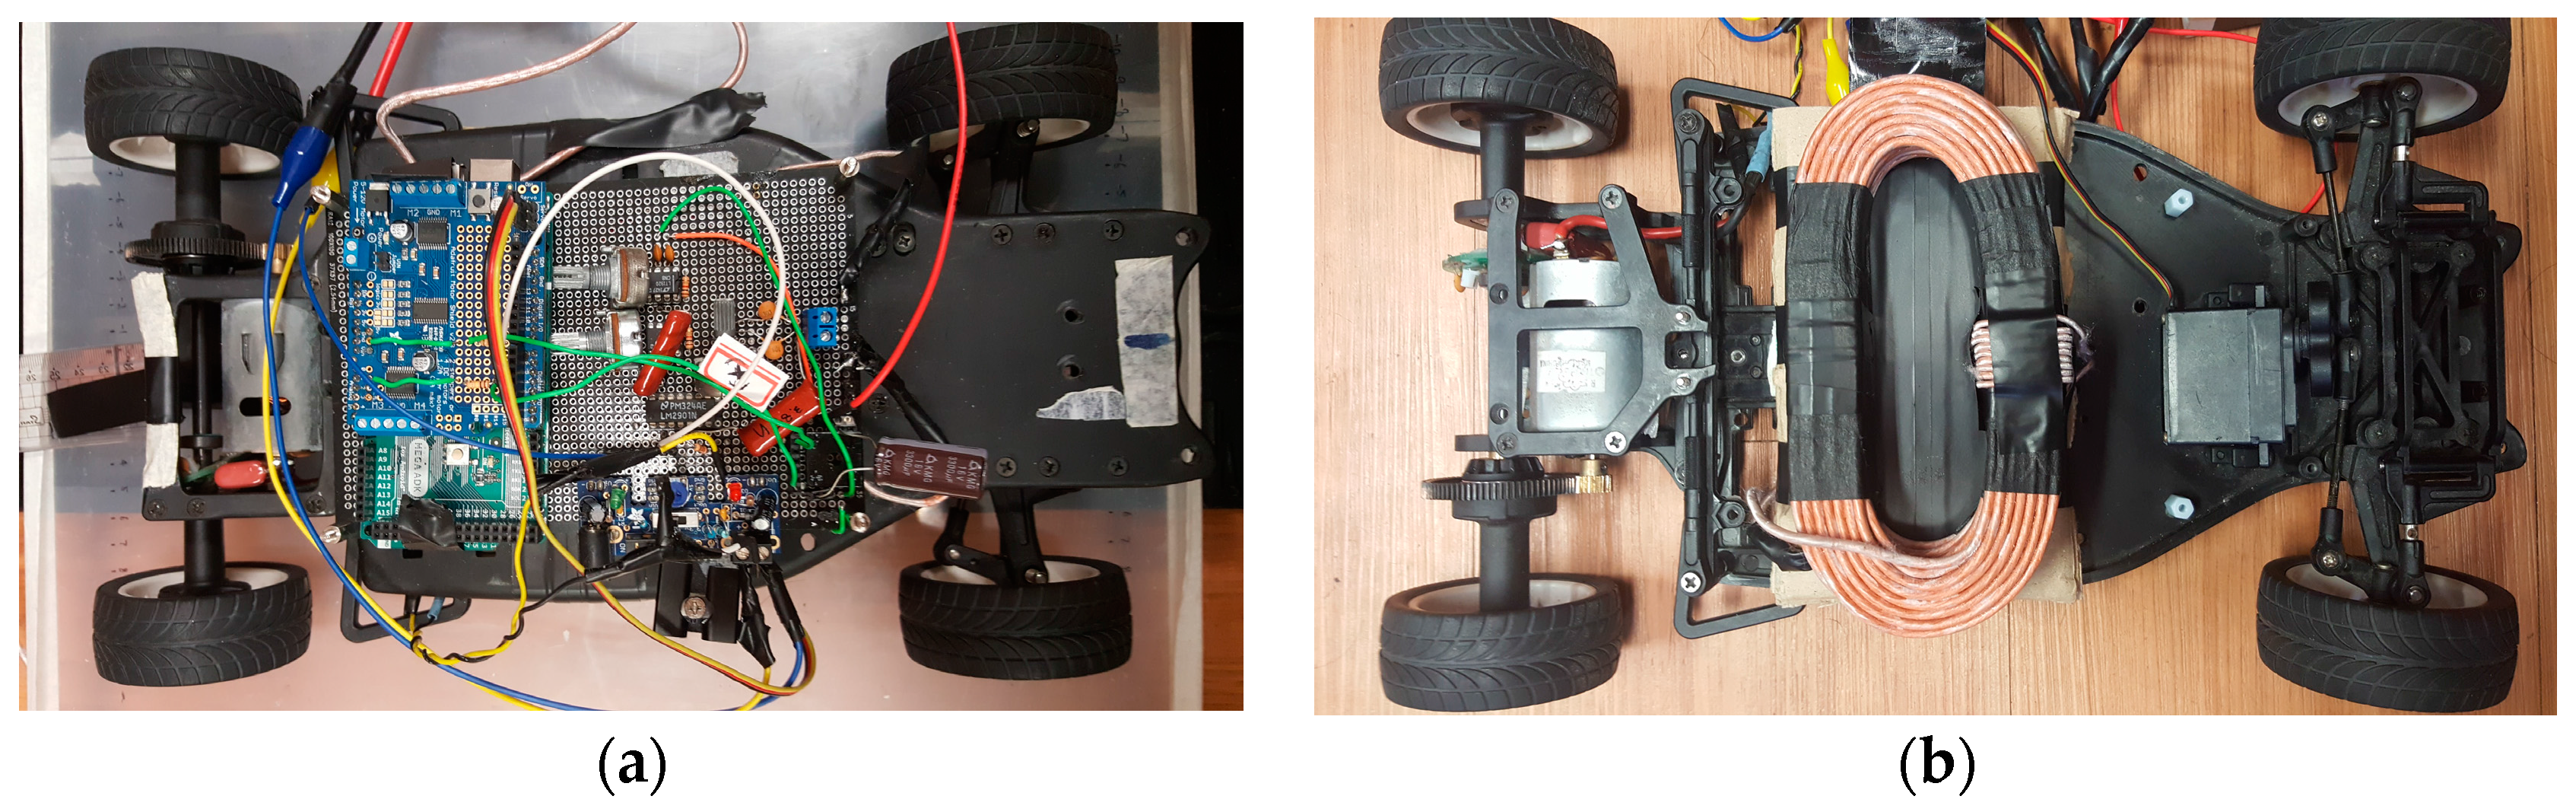
4. Experimental Validation
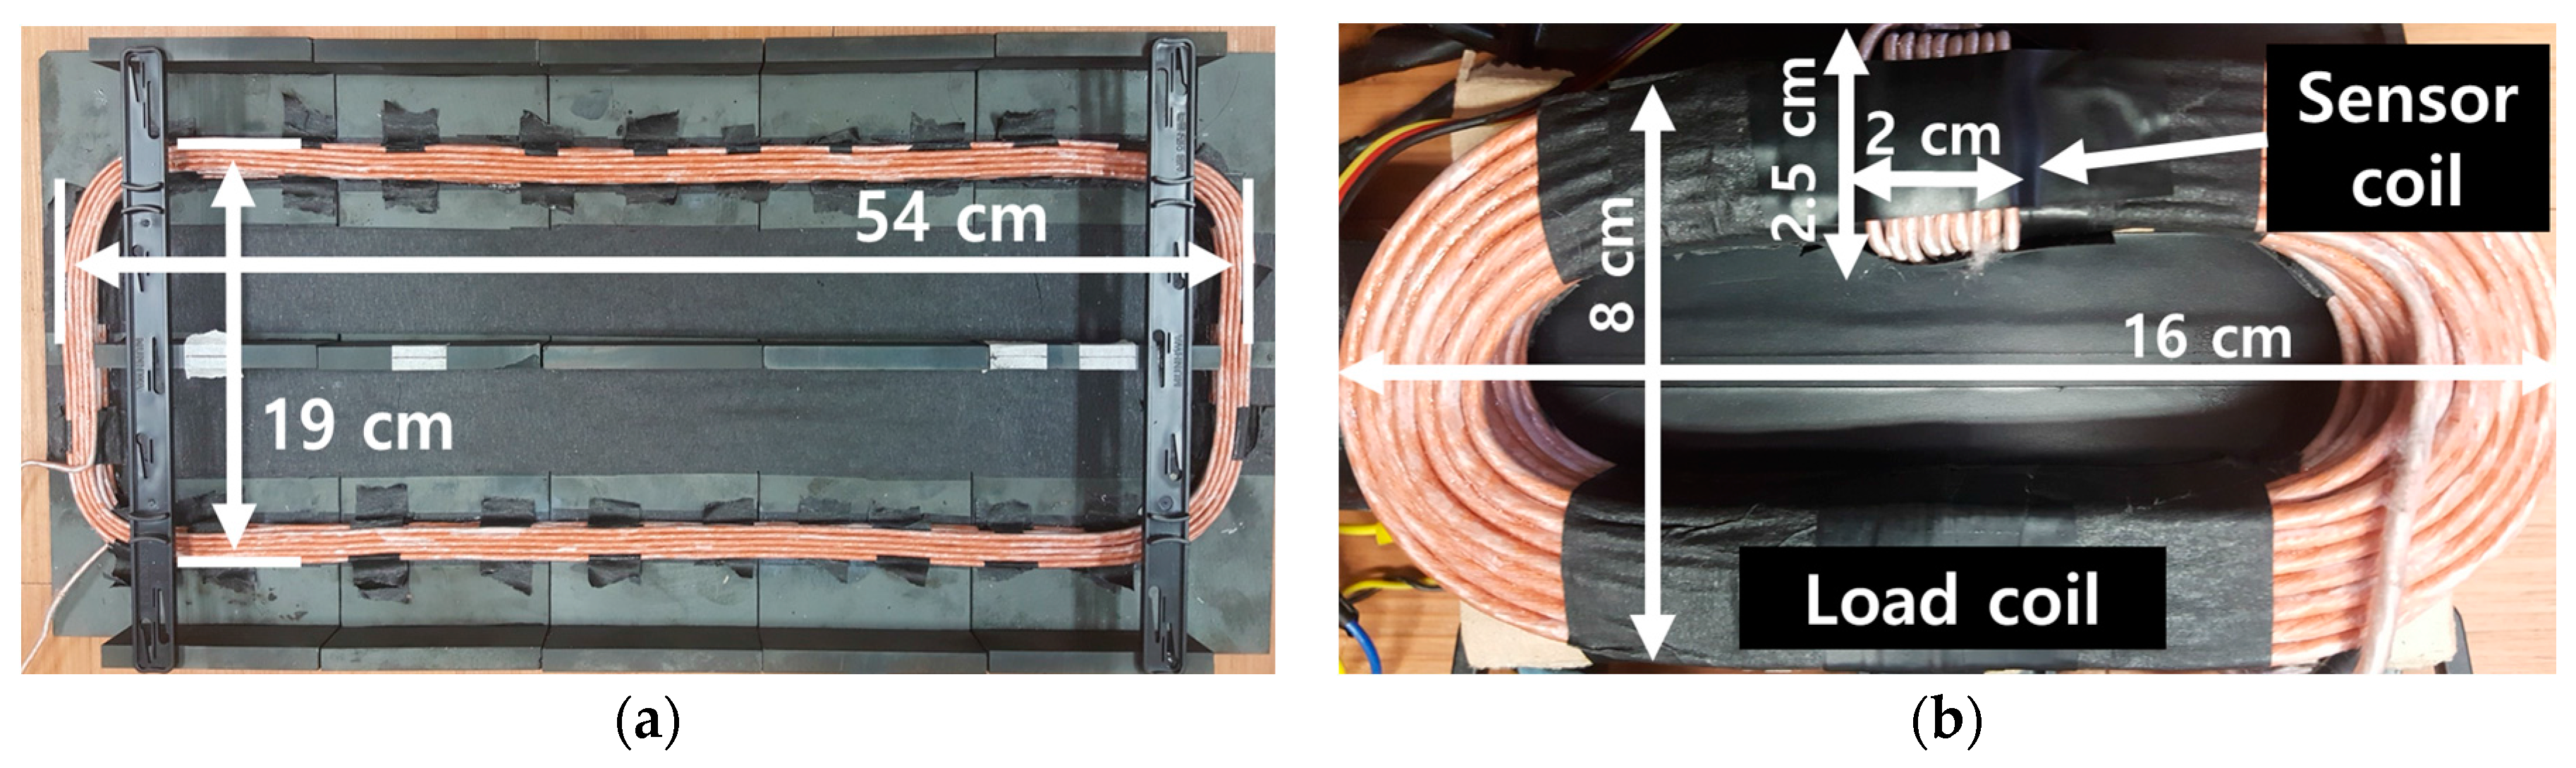
4.1. Experimental Setup
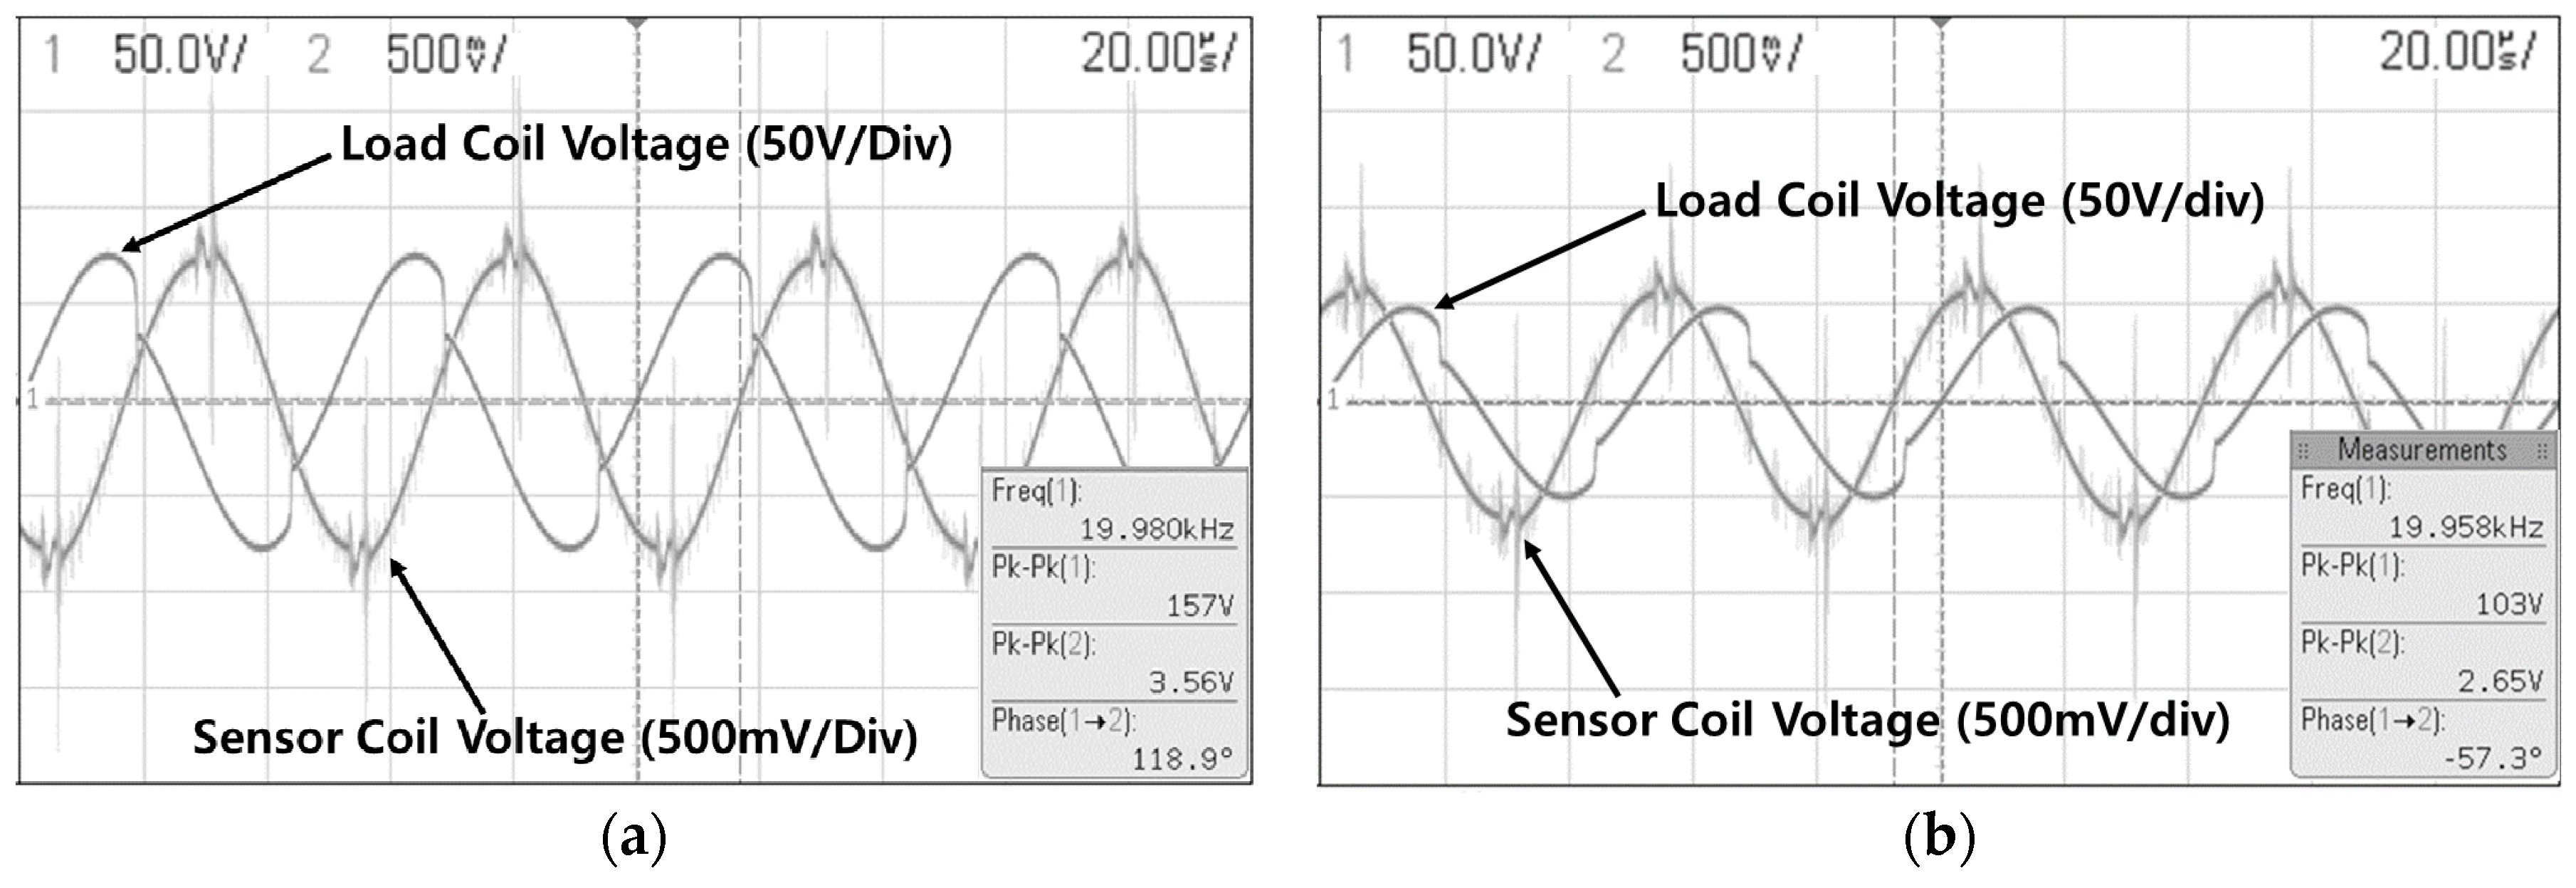
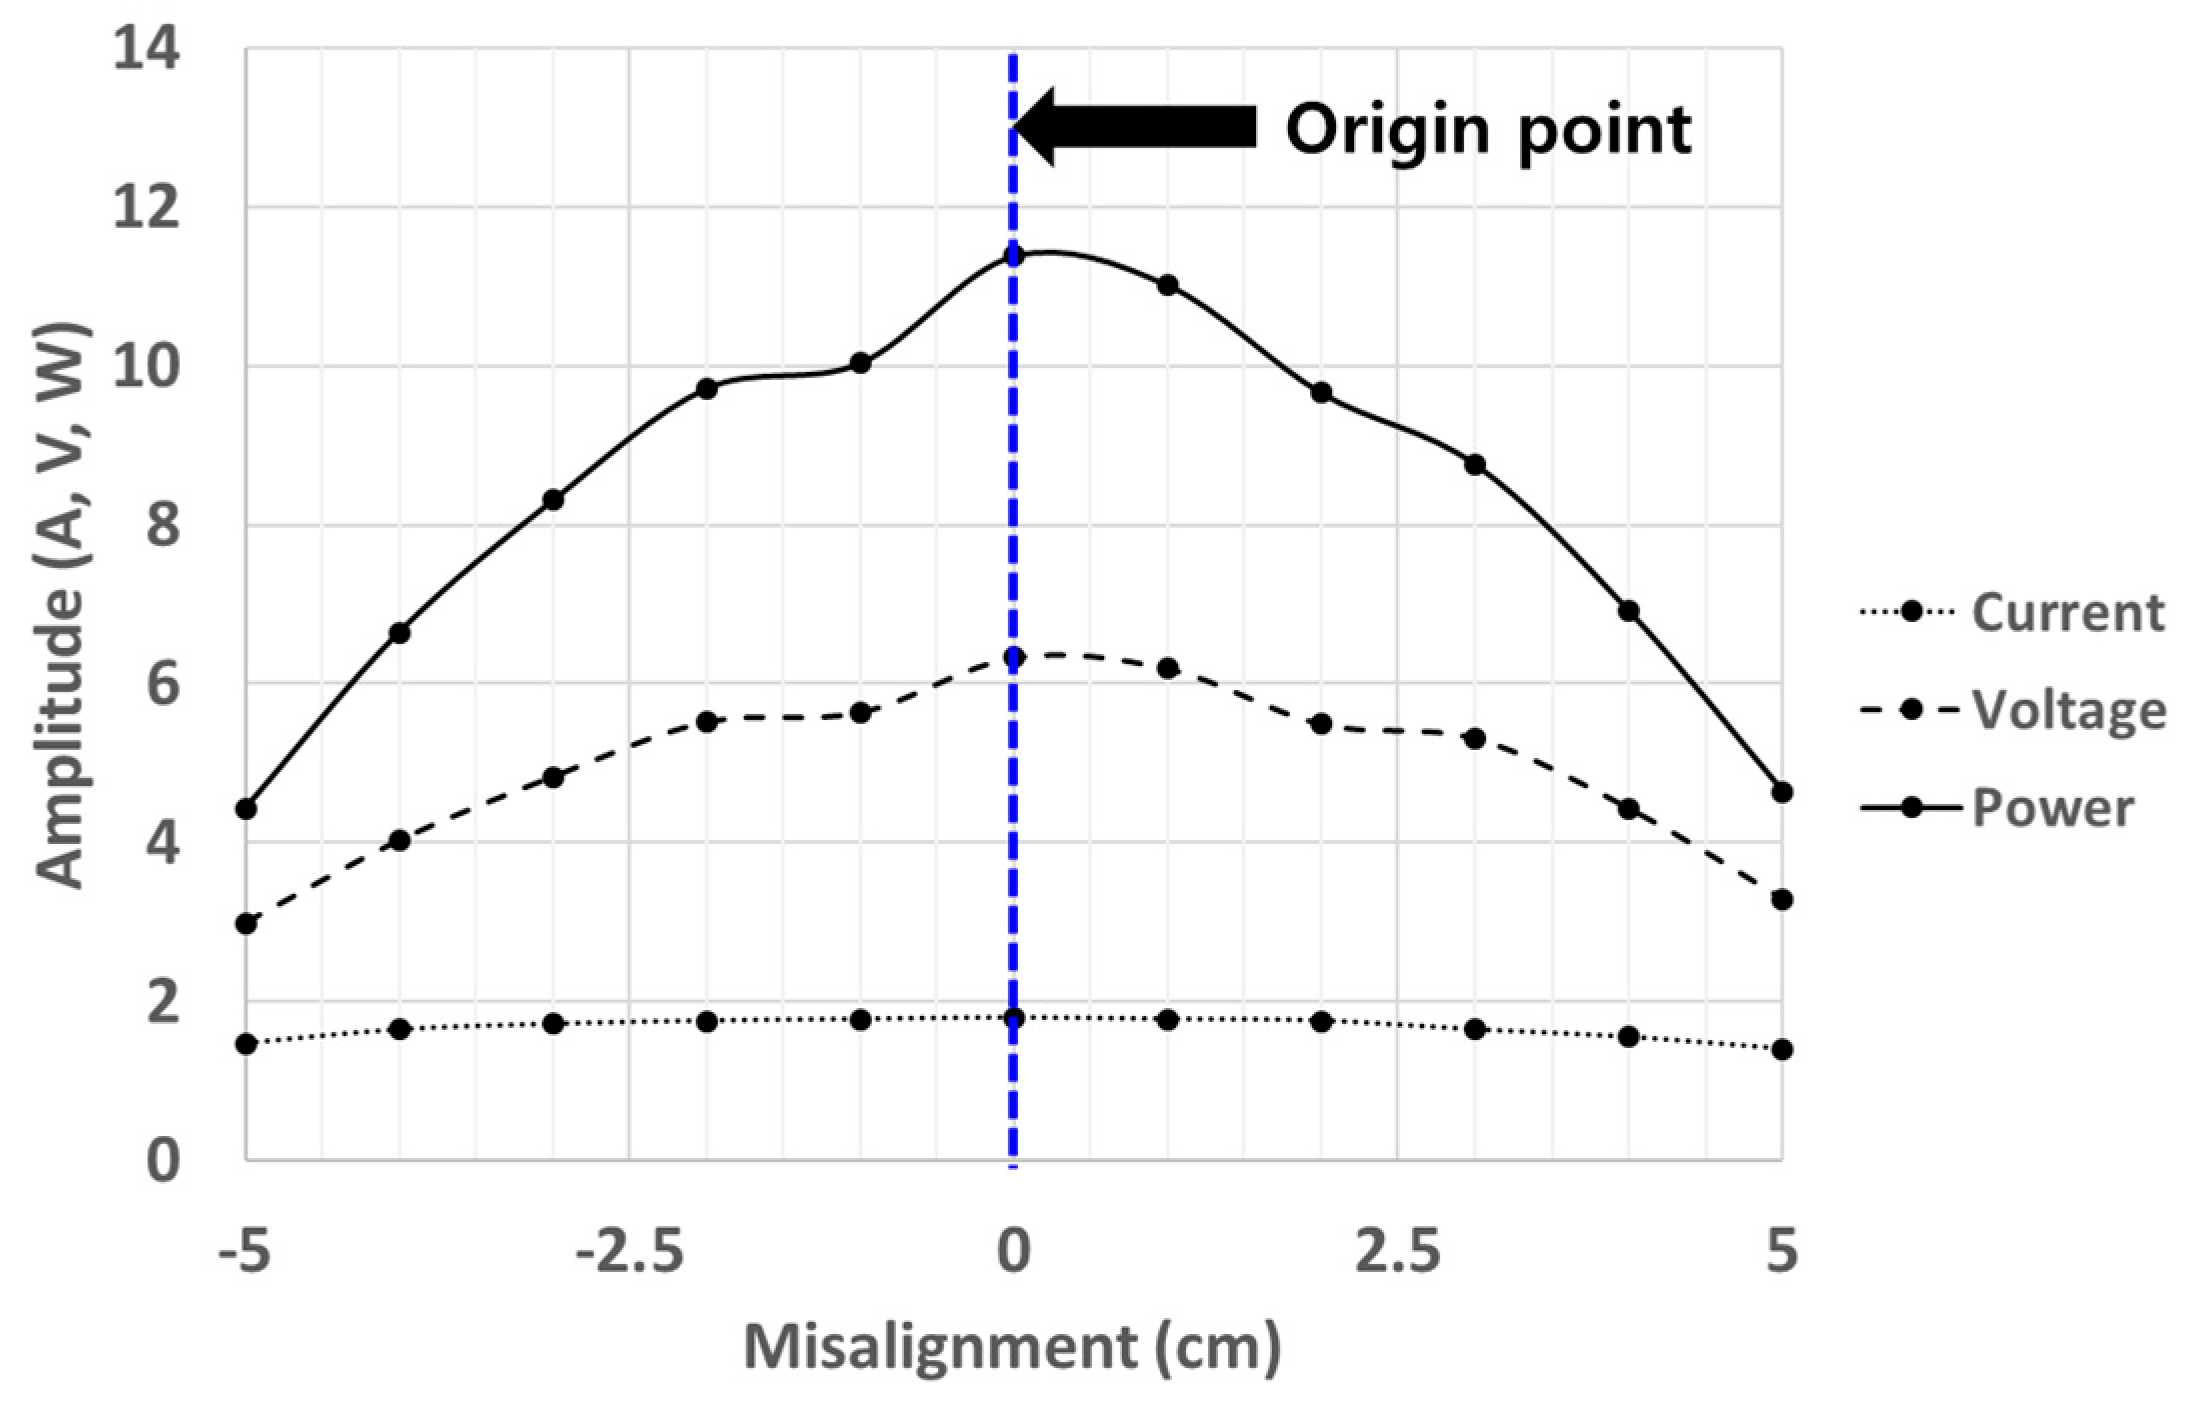
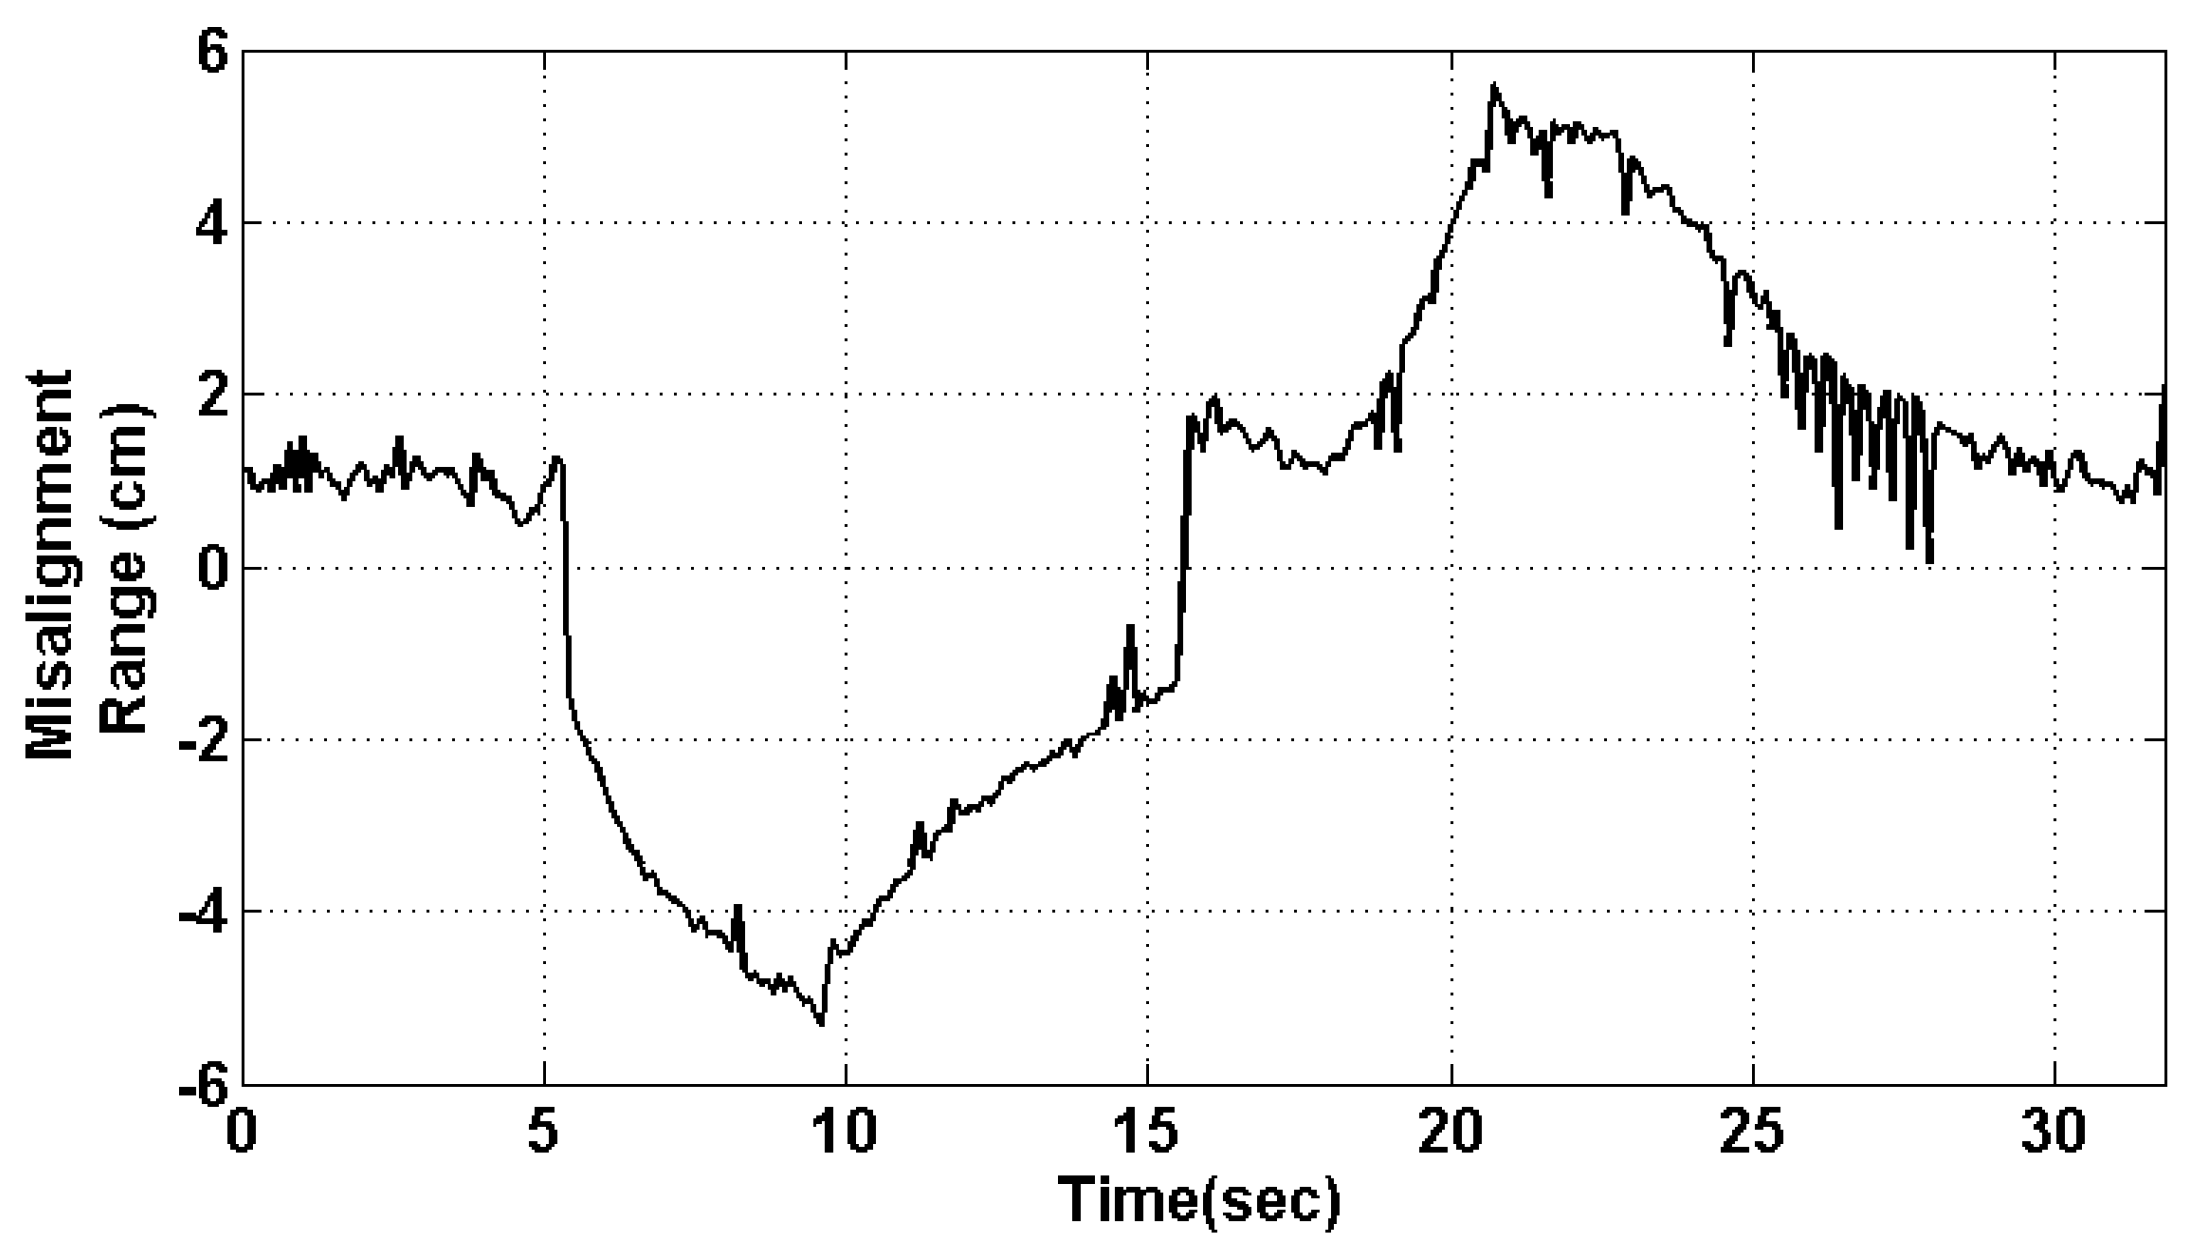
4.2. Experimental Results from the First Experiment (Static Load: 10 Ohm Resistor)
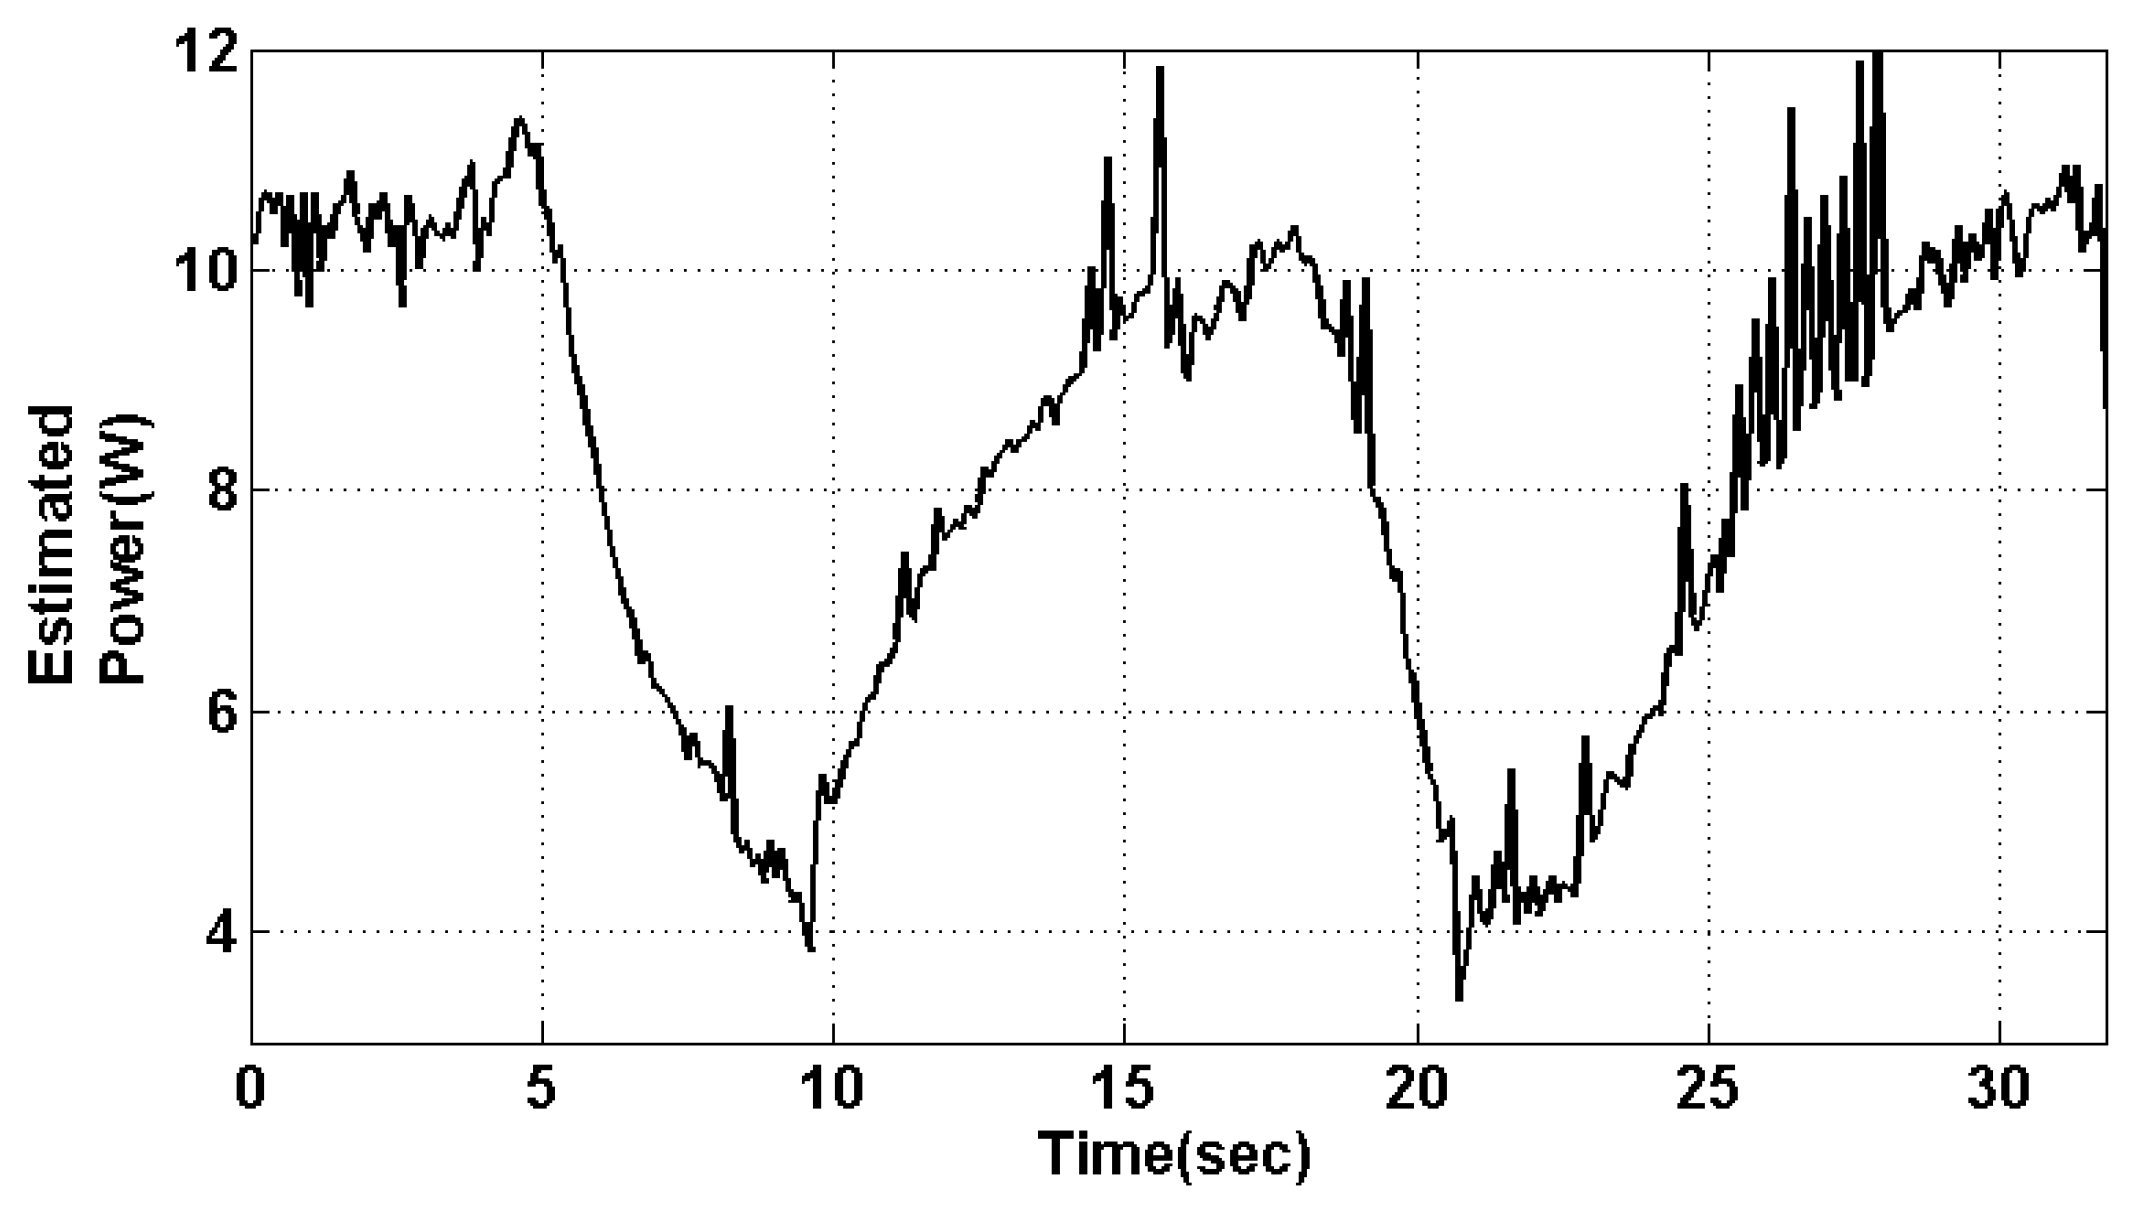
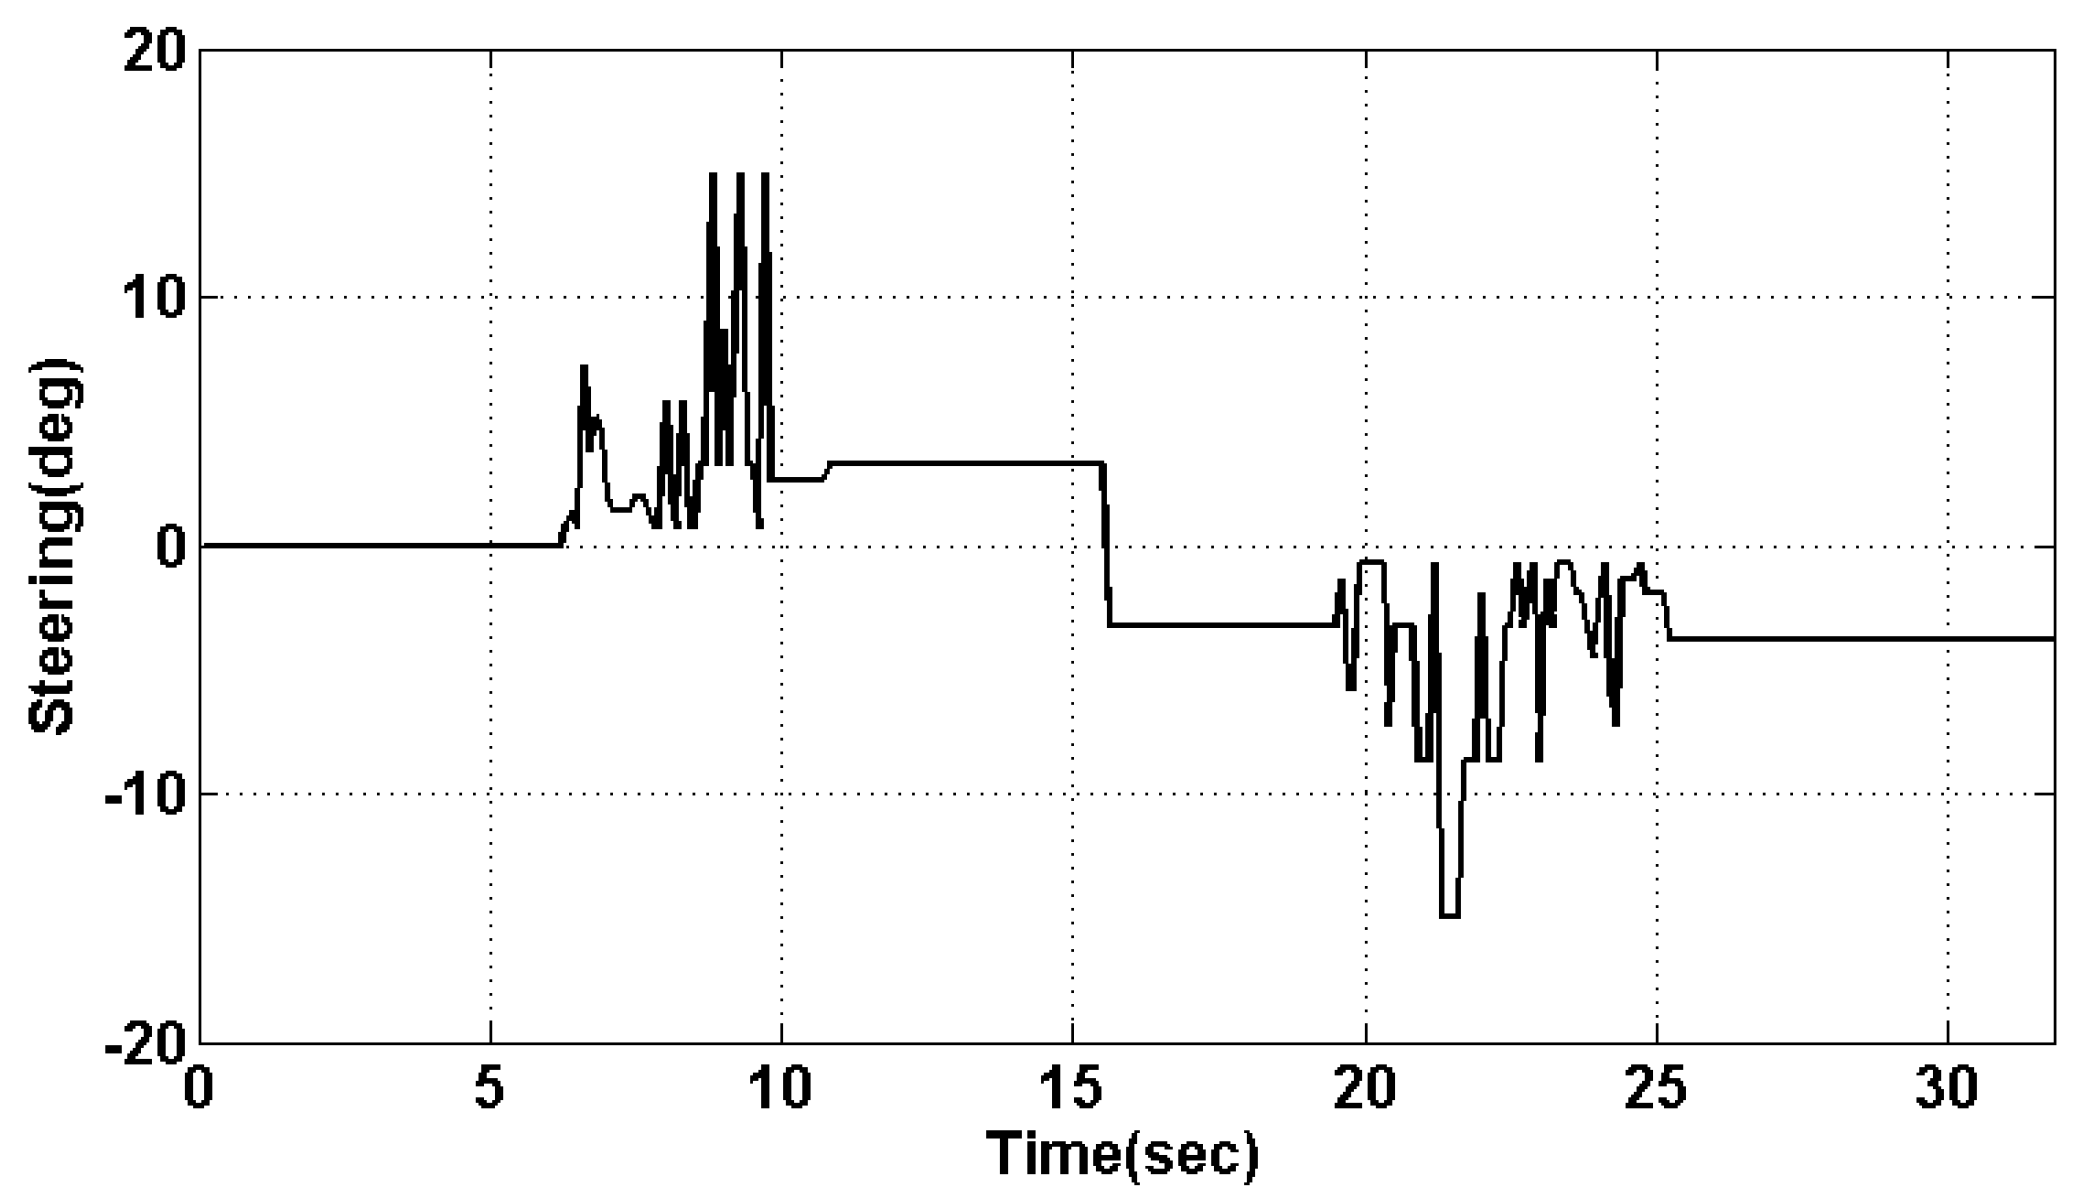
4.3. Experimental Results from the Second Experiment (Load: Experimental Vehicle)
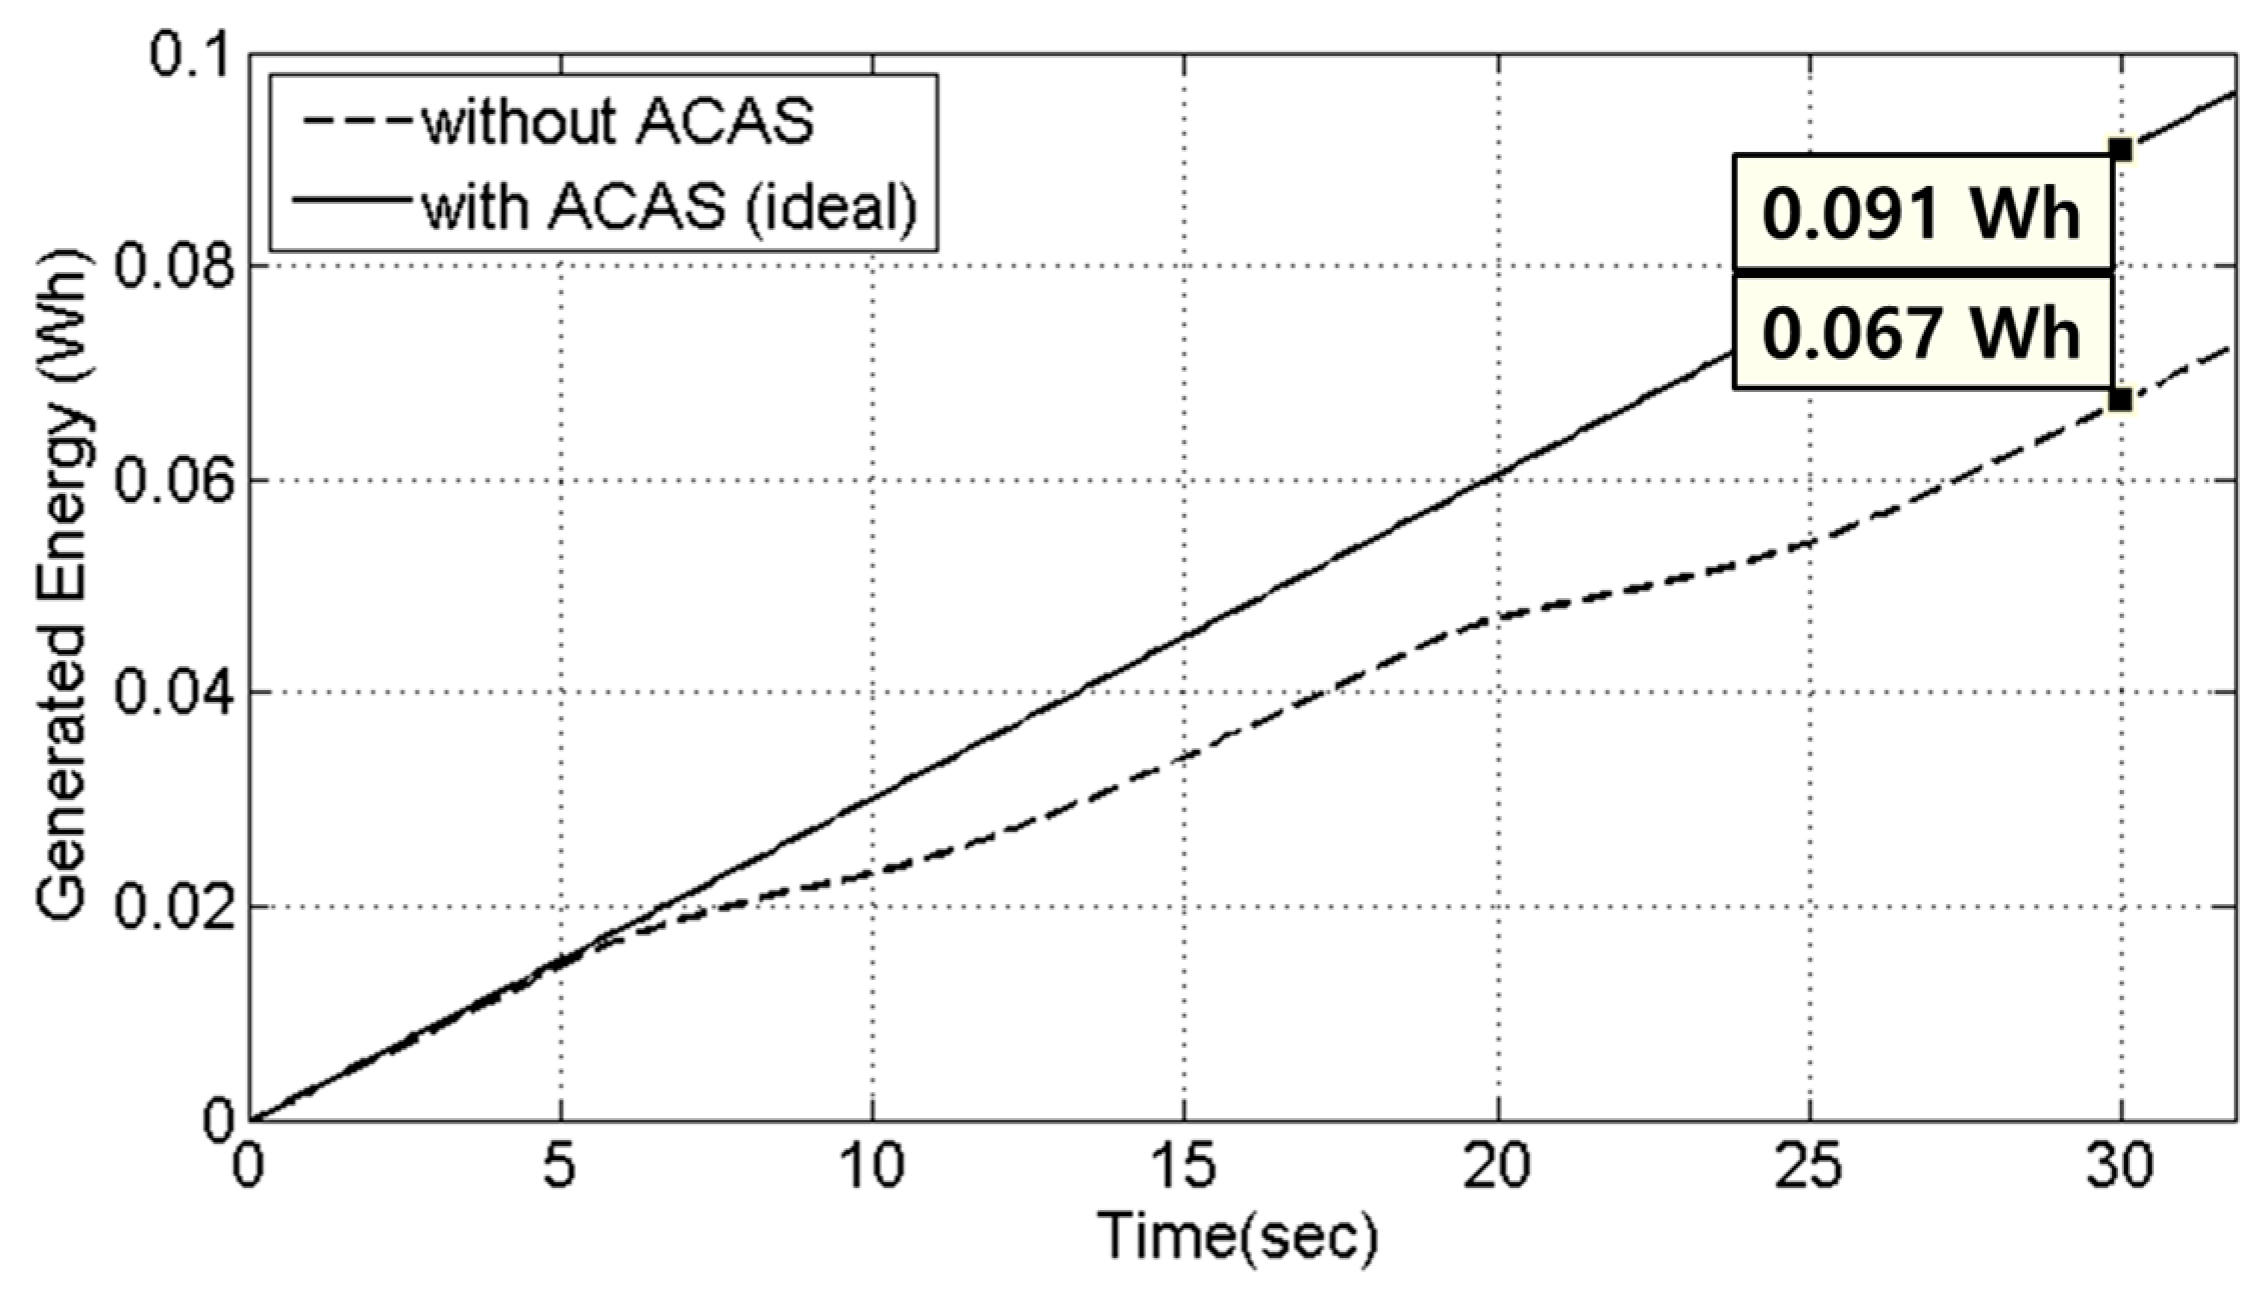
- For the vehicle without ACAS, the estimated power shown in Figure 27 was assumed to be the level of power that would actually be received by the DWC vehicle while in operation.
- For the vehicle with ACAS, it was assumed that a constant 11W of power is generated, as the vehicle’s load coil is kept in constant alignment with the source coil on the road.
5. Conclusions
Supplementary Materials
Acknowledgments
Author Contributions
Conflicts of Interest
References
- Aziz, M.; Oda, T.; Mitani, T.; Watanabe, Y.; Kashiwagi, T. Utilization of Electric Vehicles and Their Used Batteries for Peak-Load Shifting. Energies 2015, 8, 3720–3738. [Google Scholar] [CrossRef]
- Cao, C.; Wang, L.; Chen, B. Mitigation of the Impact of High Plug-in Electric Vehicle Penetration on Residential Distribution Grid Using Smart Charging Strategies. Energies 2016, 9, 1024. [Google Scholar] [CrossRef]
- Tan, L.; Liu, H.; Liu, Z.; Guo, J.; Yan, C.; Wang, W.; Huang, X. Power Stabilization Strategy of Random Access Loads in Electric Vehicles Wireless Charging System at Traffic Lights. Energies 2016, 9, 811. [Google Scholar] [CrossRef]
- Choi, S.Y.; Gu, B.W.; Jeong, S.Y.; Rim, C.T. Advances in wireless power transfer systems for roadway-powered electric vehicles. IEEE J. Sel. Top. Power Electron. 2015, 3, 18–36. [Google Scholar] [CrossRef]
- Shekhar, A.; Prasanth, V.; Bauer, P.; Bolech, M. Economic Viability Study of an On-Road Wireless Charging System with a Generic Driving Range Estimation Method. Energies 2016, 9, 76. [Google Scholar] [CrossRef]
- Nagendra, G.R.; Chen, L.; Covic, G.A.; Boys, J.T. Detection of EVs on IPT highways. IEEE J. Sel. Top. Power Electron. 2014, 2, 584–597. [Google Scholar] [CrossRef]
- Jang, Y.J.; Jeong, S.; Lee, M.S. Initial Energy Logistics Cost Analysis for Stationary, Quasi-Dynamic, and Dynamic Wireless Charging Public Transportation Systems. Energies 2016, 9, 483. [Google Scholar] [CrossRef]
- Chen, Z.; Jing, W.; Huang, X.; Tan, L.; Chen, C.; Wang, W. A Promoted Design for Primary Coil in Roadway-Powered System. IEEE Trans. Magn. 2015, 51, 8402004. [Google Scholar] [CrossRef]
- Chen, W.; Liu, C.; Lee, C.H.; Shan, Z. Cost-Effectiveness Comparison of Coupler Designs of Wireless Power Transfer for Electric Vehicle Dynamic Charging. Energies 2016, 9, 906. [Google Scholar] [CrossRef]
- Chow, J.P.; Chen, N.; Chung, S.H.; Chan, L.L. An investigation into the use of orthogonal winding in loosely coupled link for improving power transfer efficiency under coil misalignment. IEEE Trans. Power Electron. 2015, 30, 5632–5649. [Google Scholar] [CrossRef]
- Choi, S.Y.; Jeong, S.Y.; Lee, E.S.; Gu, B.W.; Lee, S.W.; Rim, C.T. Generalized models on self-decoupled dual pick-up coils for large lateral tolerance. IEEE Trans. Power Electron. 2015, 30, 6434–6445. [Google Scholar] [CrossRef]
- Kalwar, K.A.; Mekhilef, S.; Seyedmahmoudian, M.; Horan, B. Coil Design for High Misalignment Tolerant Inductive Power Transfer System for EV Charging. Energies 2016, 9, 937. [Google Scholar] [CrossRef]
- Shin, J.; Shin, S.; Kim, Y.; Ahn, S.; Lee, S.; Jung, G.; Jeon, S.; Cho, D. Design and implementation of shaped magnetic-resonance-based wireless power transfer system for roadway-powered moving electric vehicles. IEEE Trans. Ind. Electron. 2014, 61, 1179–1192. [Google Scholar] [CrossRef]
- Kim, J.; Kim, J.; Kong, S.; Kim, H.; Suh, I.; Suh, N.; Cho, D.; Kim, J.; Ahn, S. Coil design and shielding methods for a magnetic resonant wireless power transfer system. Proc. IEEE 2013, 101, 1332–1342. [Google Scholar] [CrossRef]
- Gao, Y.; Farley, K.B.; Tse, Z.T.H. A Uniform Voltage Gain Control for Alignment Robustness in Wireless EV Charging. Energies 2015, 8, 8355–8370. [Google Scholar] [CrossRef]
- Hu, P.; Ren, J.; Li, W. Frequency-Splitting-Free Synchronous Tuning of Close-Coupling Self-Oscillating Wireless Power Transfer. Energies 2016, 9, 491. [Google Scholar] [CrossRef]
- Federal Highway Administration. Available online: http://safety.fhwa.dot.gov/geometric/pubs/mitigationstrategies/chapter3/3_lanewidth.cfm (accessed on 15 October 2014).
- Hernandez, J.I.; Kuo, C. Steering control of automated vehicles using absolute positioning GPS and magnetic markers. IEEE Trans. Veh. Technol. 2003, 52, 150–161. [Google Scholar] [CrossRef]
- Ryu, H.; Har, D. Wireless power transfer for high-precision position detection of railroad. In Proceedings of the IEEE Power, Communication and Information Technology Conference (PCITC), Bhubaneswar, India, 15–17 October 2015; pp. 605–608.
- Chen, S.; Liao, C.; Wang, L. Research on positioning technique of wireless power transfer system for electric vehicles. In Proceedings of the IEEE Conference and Expo Transportation Electrification Asia-Pacific (ITEC Asia-Pacific), Beijing, China, 31 August–3 September 2014; pp. 1–4.
- Choi, Y.; Kang, D.; Lee, S.; Kim, Y. The autonomous platoon driving system of the on line electric vehicle. In Proceedings of the ICROS-SICE International Joint Conference, Fukuoka, Japan, 18–21 August 2009; pp. 3423–3426.
- Xu, H.; Yang, M.; Wang, C.; Yang, R. Magnetic sensing system design for intelligent vehicle guidance. IEEE/ASME Trans. Mechatron. 2010, 15, 652–656. [Google Scholar]
- Byun, Y.-S.; Jeong, R.-G.; Kang, S.-W. Vehicle Position Estimation Based on Magnetic Markers: Enhanced Accuracy by Compensation of Time Delays. Sensors 2015, 15, 28807–28825. [Google Scholar] [CrossRef] [PubMed]
- Hwang, K.; Park, J.; Kim, D.; Park, H.H.; Kwon, J.H.; Kwak, S.I.; Ahn, S. Autonomous Coil Alignment System Using Fuzzy Steering Control for Electric Vehicles with Dynamic Wireless Charging. Math. Probl. Eng. 2015, 2015, 205285. [Google Scholar] [CrossRef]
- Kim, J.; Lee, B.; Lee, S.; Park, C.; Jung, S.; Lee, S.; Yi, K.; Baek, J. Development of 1-MW inductive power transfer system for a high-speed train. IEEE Trans. Power Electron. 2015, 62, 6242–6249. [Google Scholar] [CrossRef]
- Ko, Y.; Jang, Y. The optimal system design of the online electric vehicle utilizing wireless power transmission technology. IEEE Trans. Intell. Transp. Syst. 2013, 14, 1255–1265. [Google Scholar] [CrossRef]
- Cheng, C.-H. Implementation of a Small Type DC Microgrid Based on Fuzzy Control and Dynamic Programming. Energies 2016, 9, 781. [Google Scholar] [CrossRef]
- Sayed, K.; Gabbar, H.A. Electric Vehicle to Power Grid Integration Using Three-Phase Three-Level AC/DC Converter and PI-Fuzzy Controller. Energies 2016, 9, 532. [Google Scholar] [CrossRef]


| Parameter | Source Coil | Load Coil | Sensor Coil |
|---|---|---|---|
| # of turns | 8 | 50 | 10 |
| Inductance | 116 μH | 2.35 mH | 732 nH |
| Operating frequency | 20 kHz | ||
| Current through source coil | 200 A | ||
| Parameter | Source Coil | Load Coil | Sensor Coil |
|---|---|---|---|
| Dimensions (W × L × H) | 19.0 cm × 54.0 cm × 1.5 cm | 8.0 cm × 16.0 cm × 2.0 cm | 2.0 cm × 2.5 cm × 2.5 cm |
| # of turns | 20 | 42 | 10 |
| inductance | 590.00 μH | 186.15 μH | 2.45 μH |
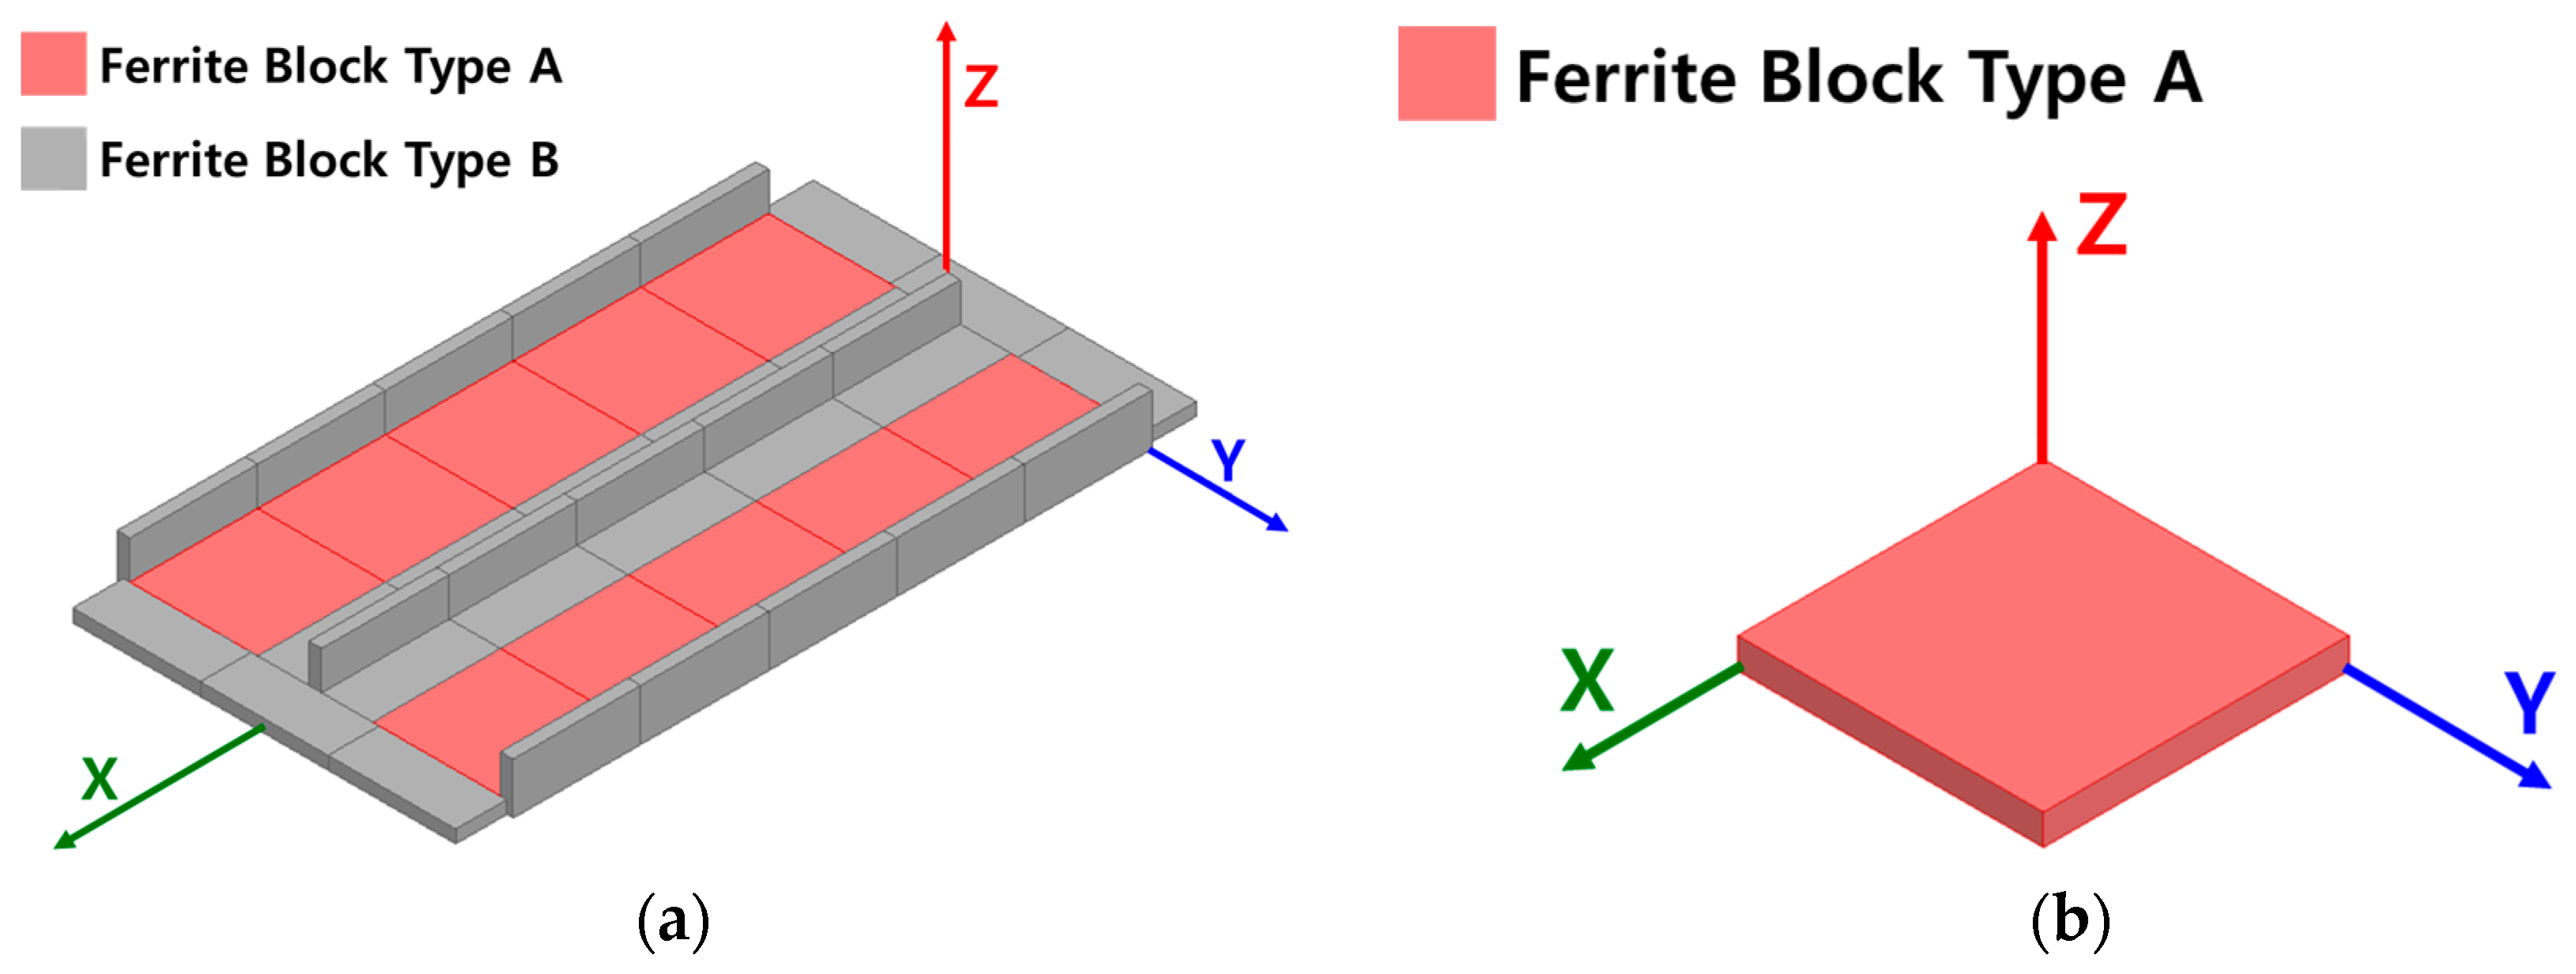
| Parameter | Ferrite Block Type A | Ferrite Block Type B |
|---|---|---|
| Dimensions (W × L × H) | 10.0 cm × 10.0 cm × 1.0 cm | 10.0 cm × 4.0 cm × 1.0 cm |
| Material | Manganese-Zinc (Mn-Zn) | |
| Permeability () | 3200 | |
| Saturation flux density () | 520 mT | |
| Component | Symbol | Value |
|---|---|---|
| Source/load coil components to match resonance @ 20 kHz | 590.00 μH | |
| 170 | ||
| 107.33 nF | ||
| 186.15 μH | ||
| 103 | ||
| 328.11 nF | ||
| Rectifier smoothing capacitor | 3200 μF | |
| Low-pass filter (LPF) components | 919 | |
| 9.8 nF | ||
| Load resistance for first experiment (static load) | 10 | |
| Load resistance for second experiment (experimental vehicle load) | 2~3 |
© 2017 by the authors. Licensee MDPI, Basel, Switzerland. This article is an open access article distributed under the terms and conditions of the Creative Commons Attribution (CC BY) license ( http://creativecommons.org/licenses/by/4.0/).
Share and Cite
Hwang, K.; Cho, J.; Kim, D.; Park, J.; Kwon, J.H.; Kwak, S.I.; Park, H.H.; Ahn, S. An Autonomous Coil Alignment System for the Dynamic Wireless Charging of Electric Vehicles to Minimize Lateral Misalignment. Energies 2017, 10, 315. https://doi.org/10.3390/en10030315
Hwang K, Cho J, Kim D, Park J, Kwon JH, Kwak SI, Park HH, Ahn S. An Autonomous Coil Alignment System for the Dynamic Wireless Charging of Electric Vehicles to Minimize Lateral Misalignment. Energies. 2017; 10(3):315. https://doi.org/10.3390/en10030315
Chicago/Turabian StyleHwang, Karam, Jaeyong Cho, Dongwook Kim, Jaehyoung Park, Jong Hwa Kwon, Sang Il Kwak, Hyun Ho Park, and Seungyoung Ahn. 2017. "An Autonomous Coil Alignment System for the Dynamic Wireless Charging of Electric Vehicles to Minimize Lateral Misalignment" Energies 10, no. 3: 315. https://doi.org/10.3390/en10030315