
Simulation of Steam Gasification in a Fluidized Bed Reactor with Energy Self-Sufficient Condition


Abstract
:1. Introduction
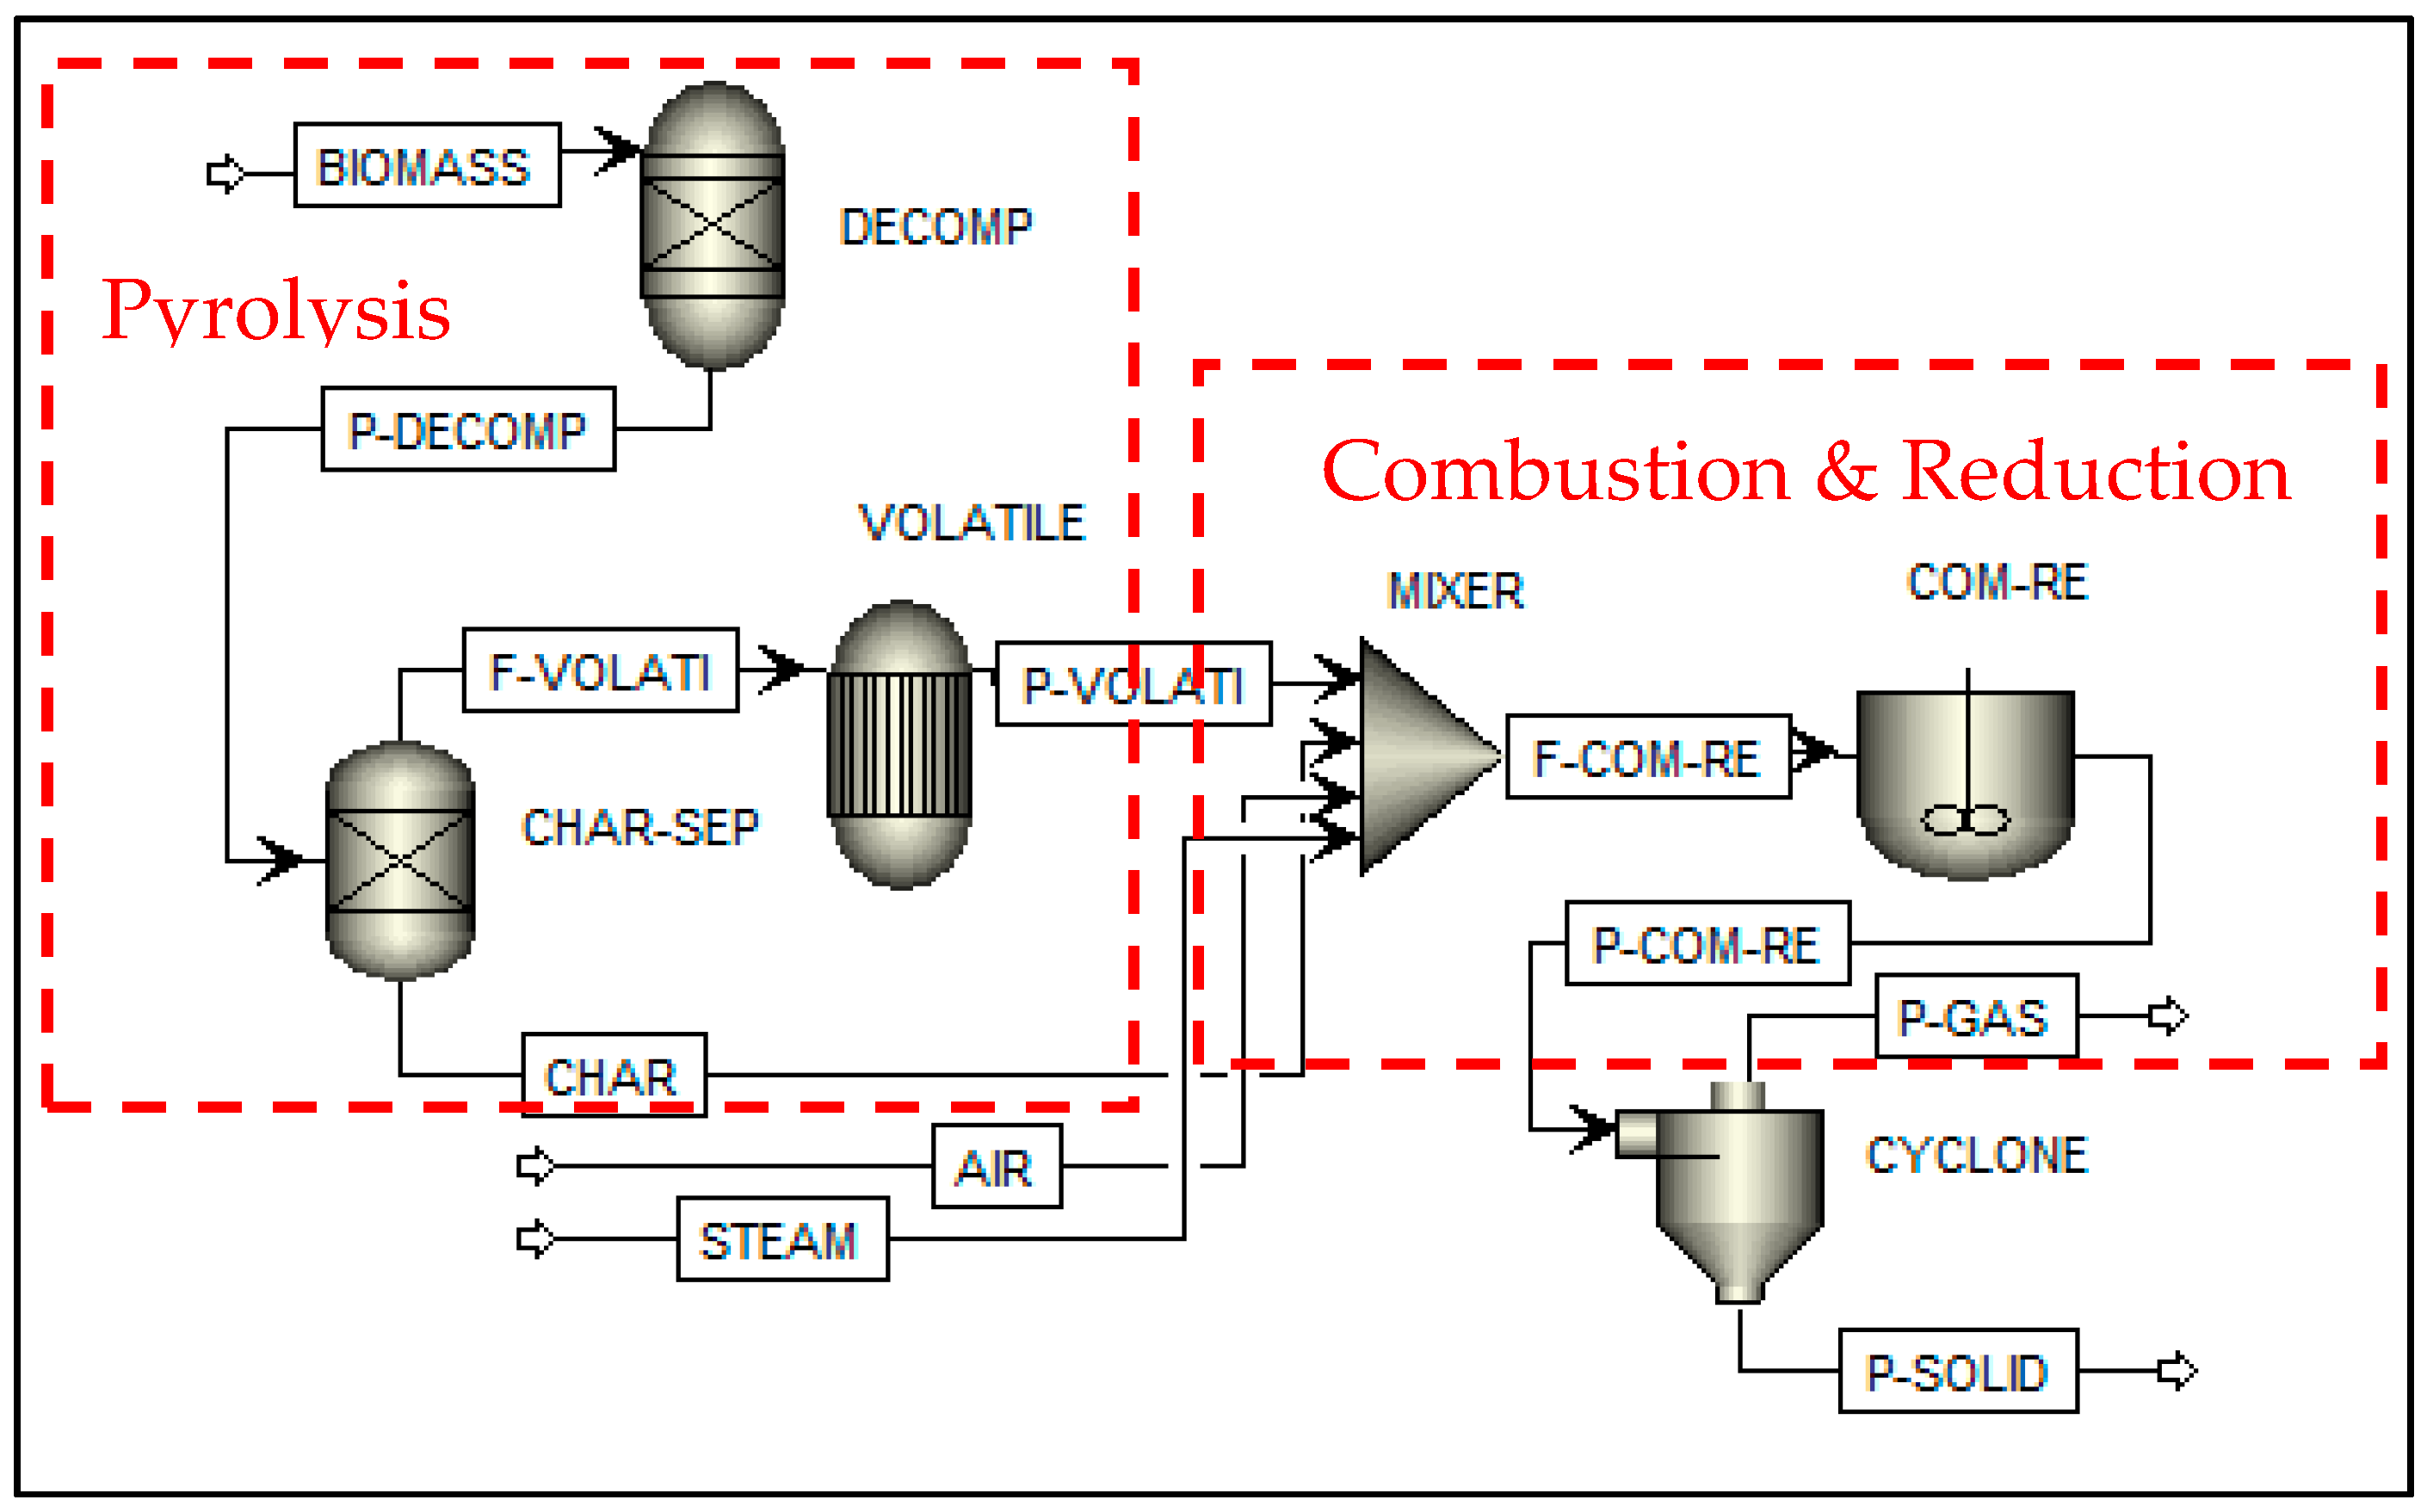
2. ASPEN Plus Model
2.1. Assumptions
- The simulation process is run under a steady state condition.
- The operation zone inside the gasifier is an isothermal condition.
- The residence time for reactants is sufficiently high to reach the equilibrium of Gibbs free energy during pyrolysis reaction.
- The volatile products of biomass are mainly comprised of H2, CO, CO2, CH4, and H2O.
- Char only contains carbon black and ash.
- The simulation is carried out with power-law kinetics.
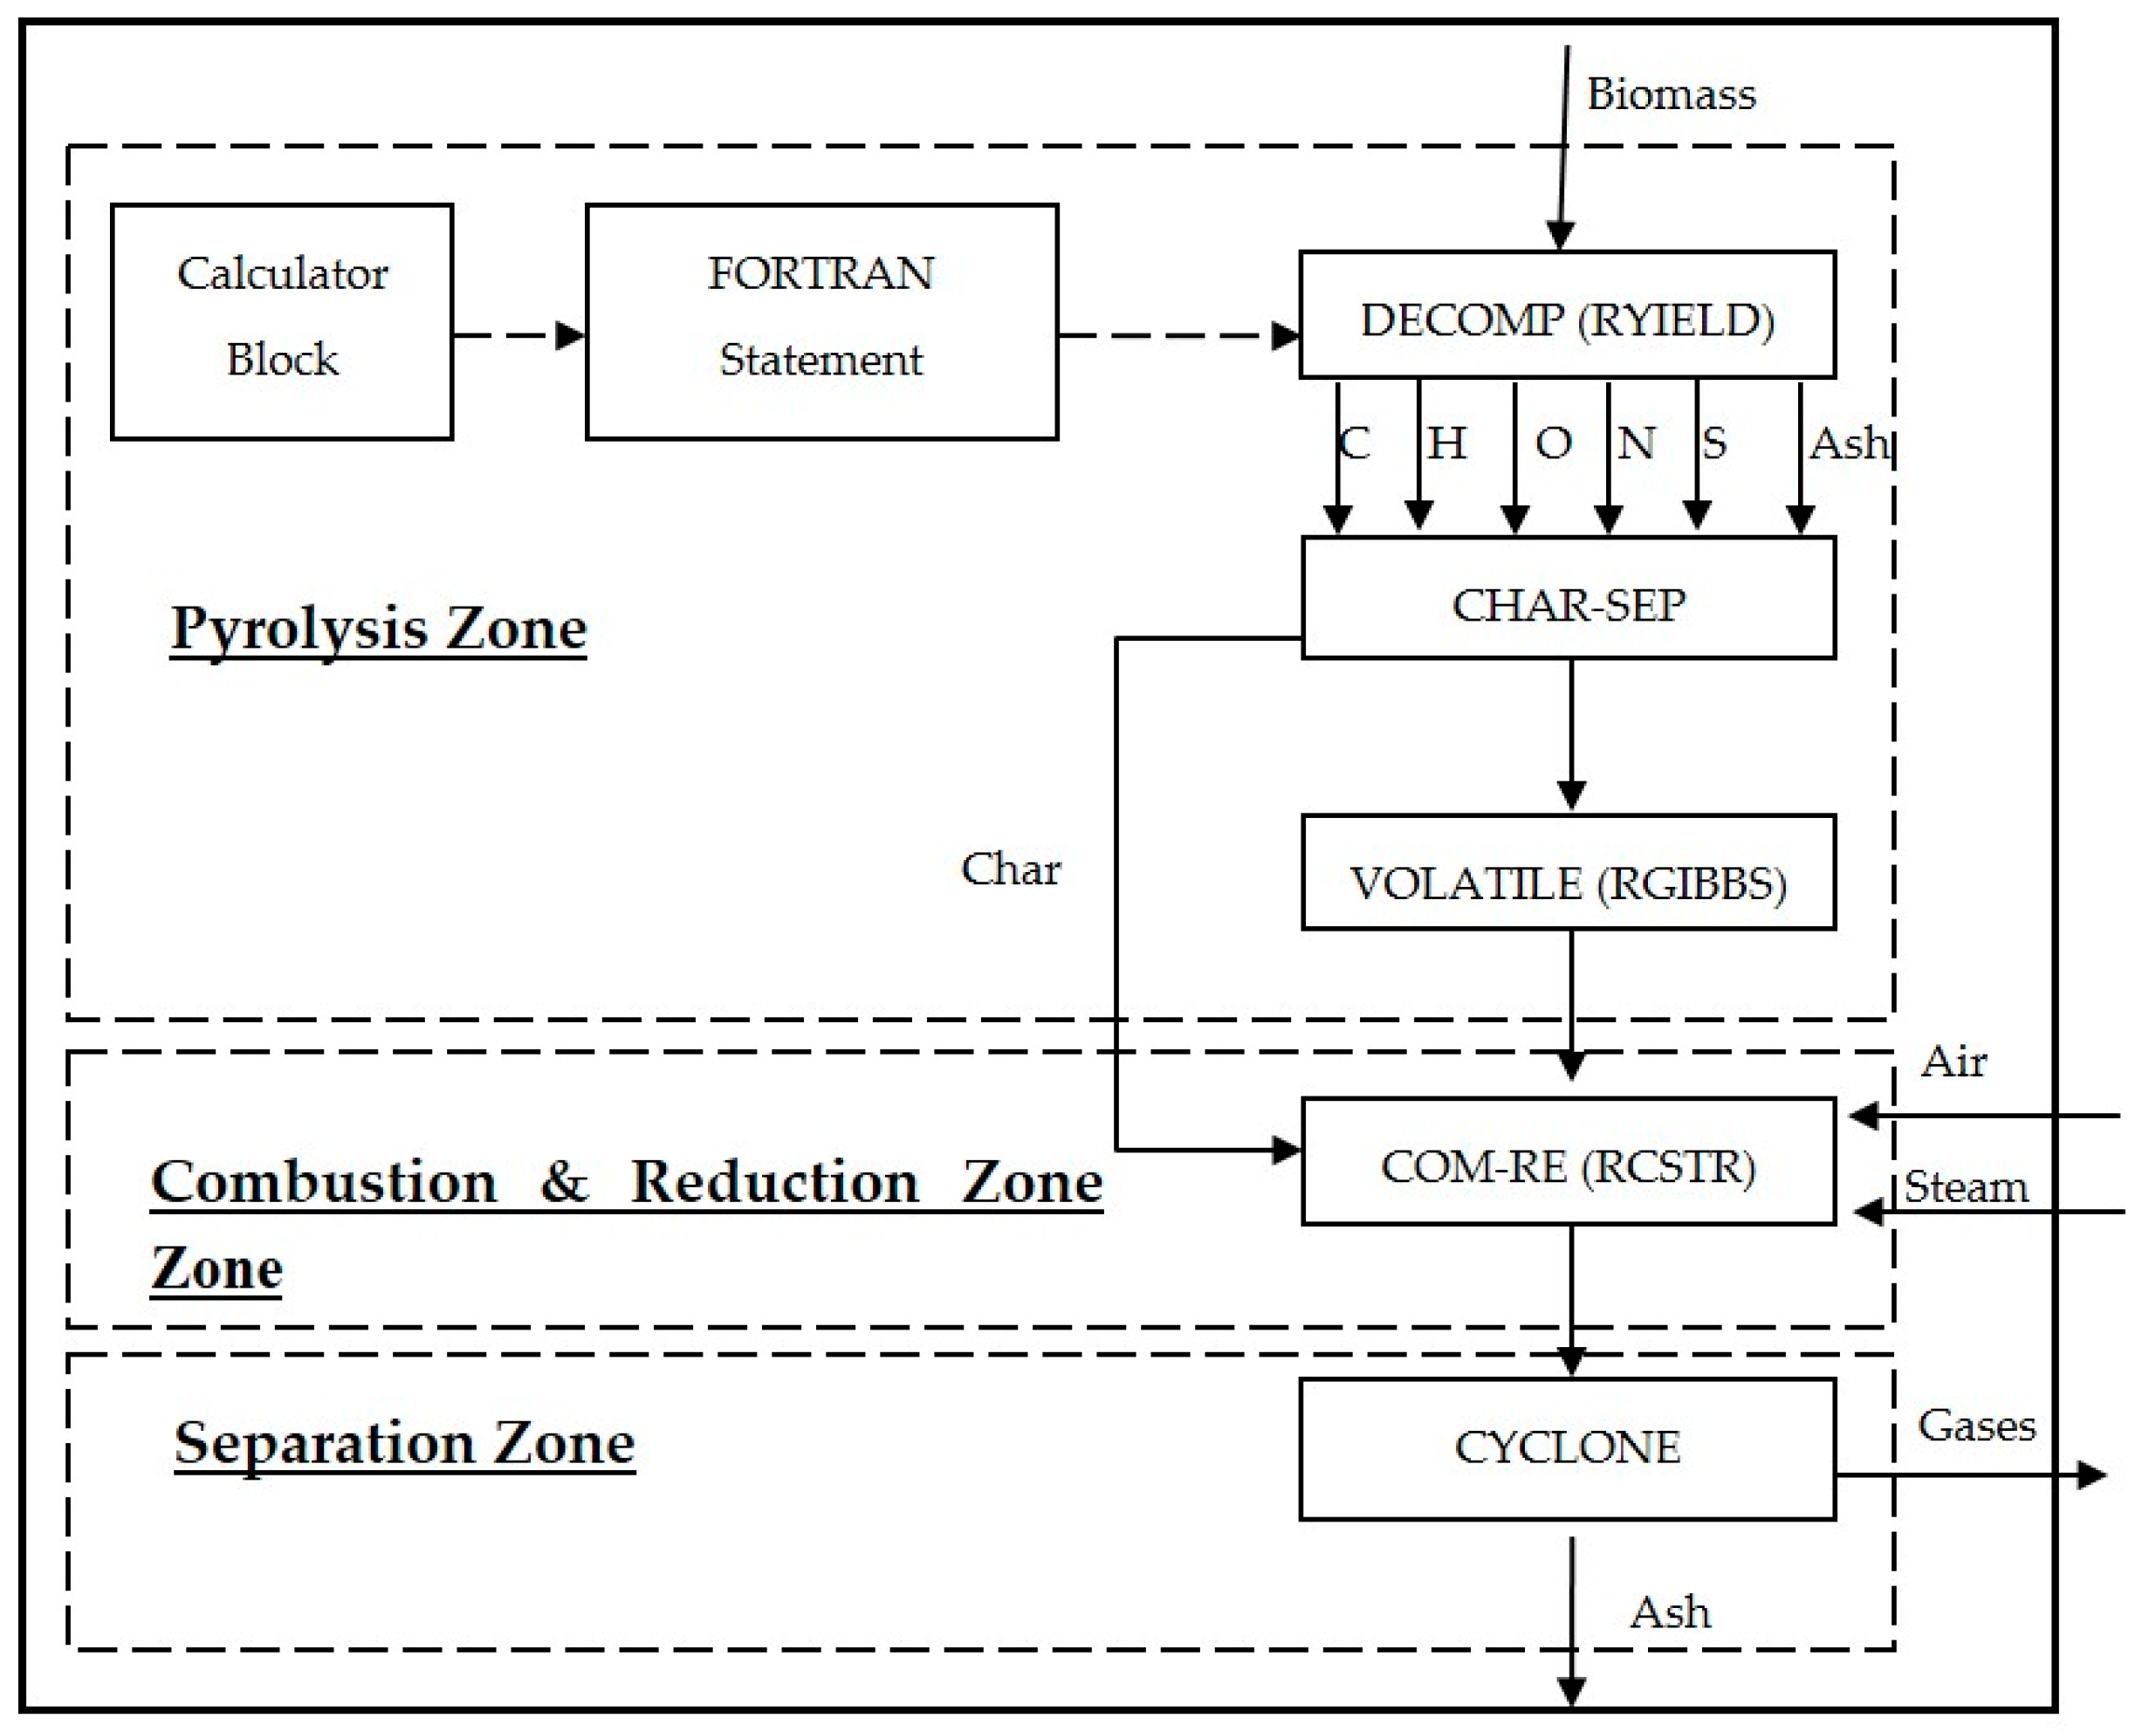
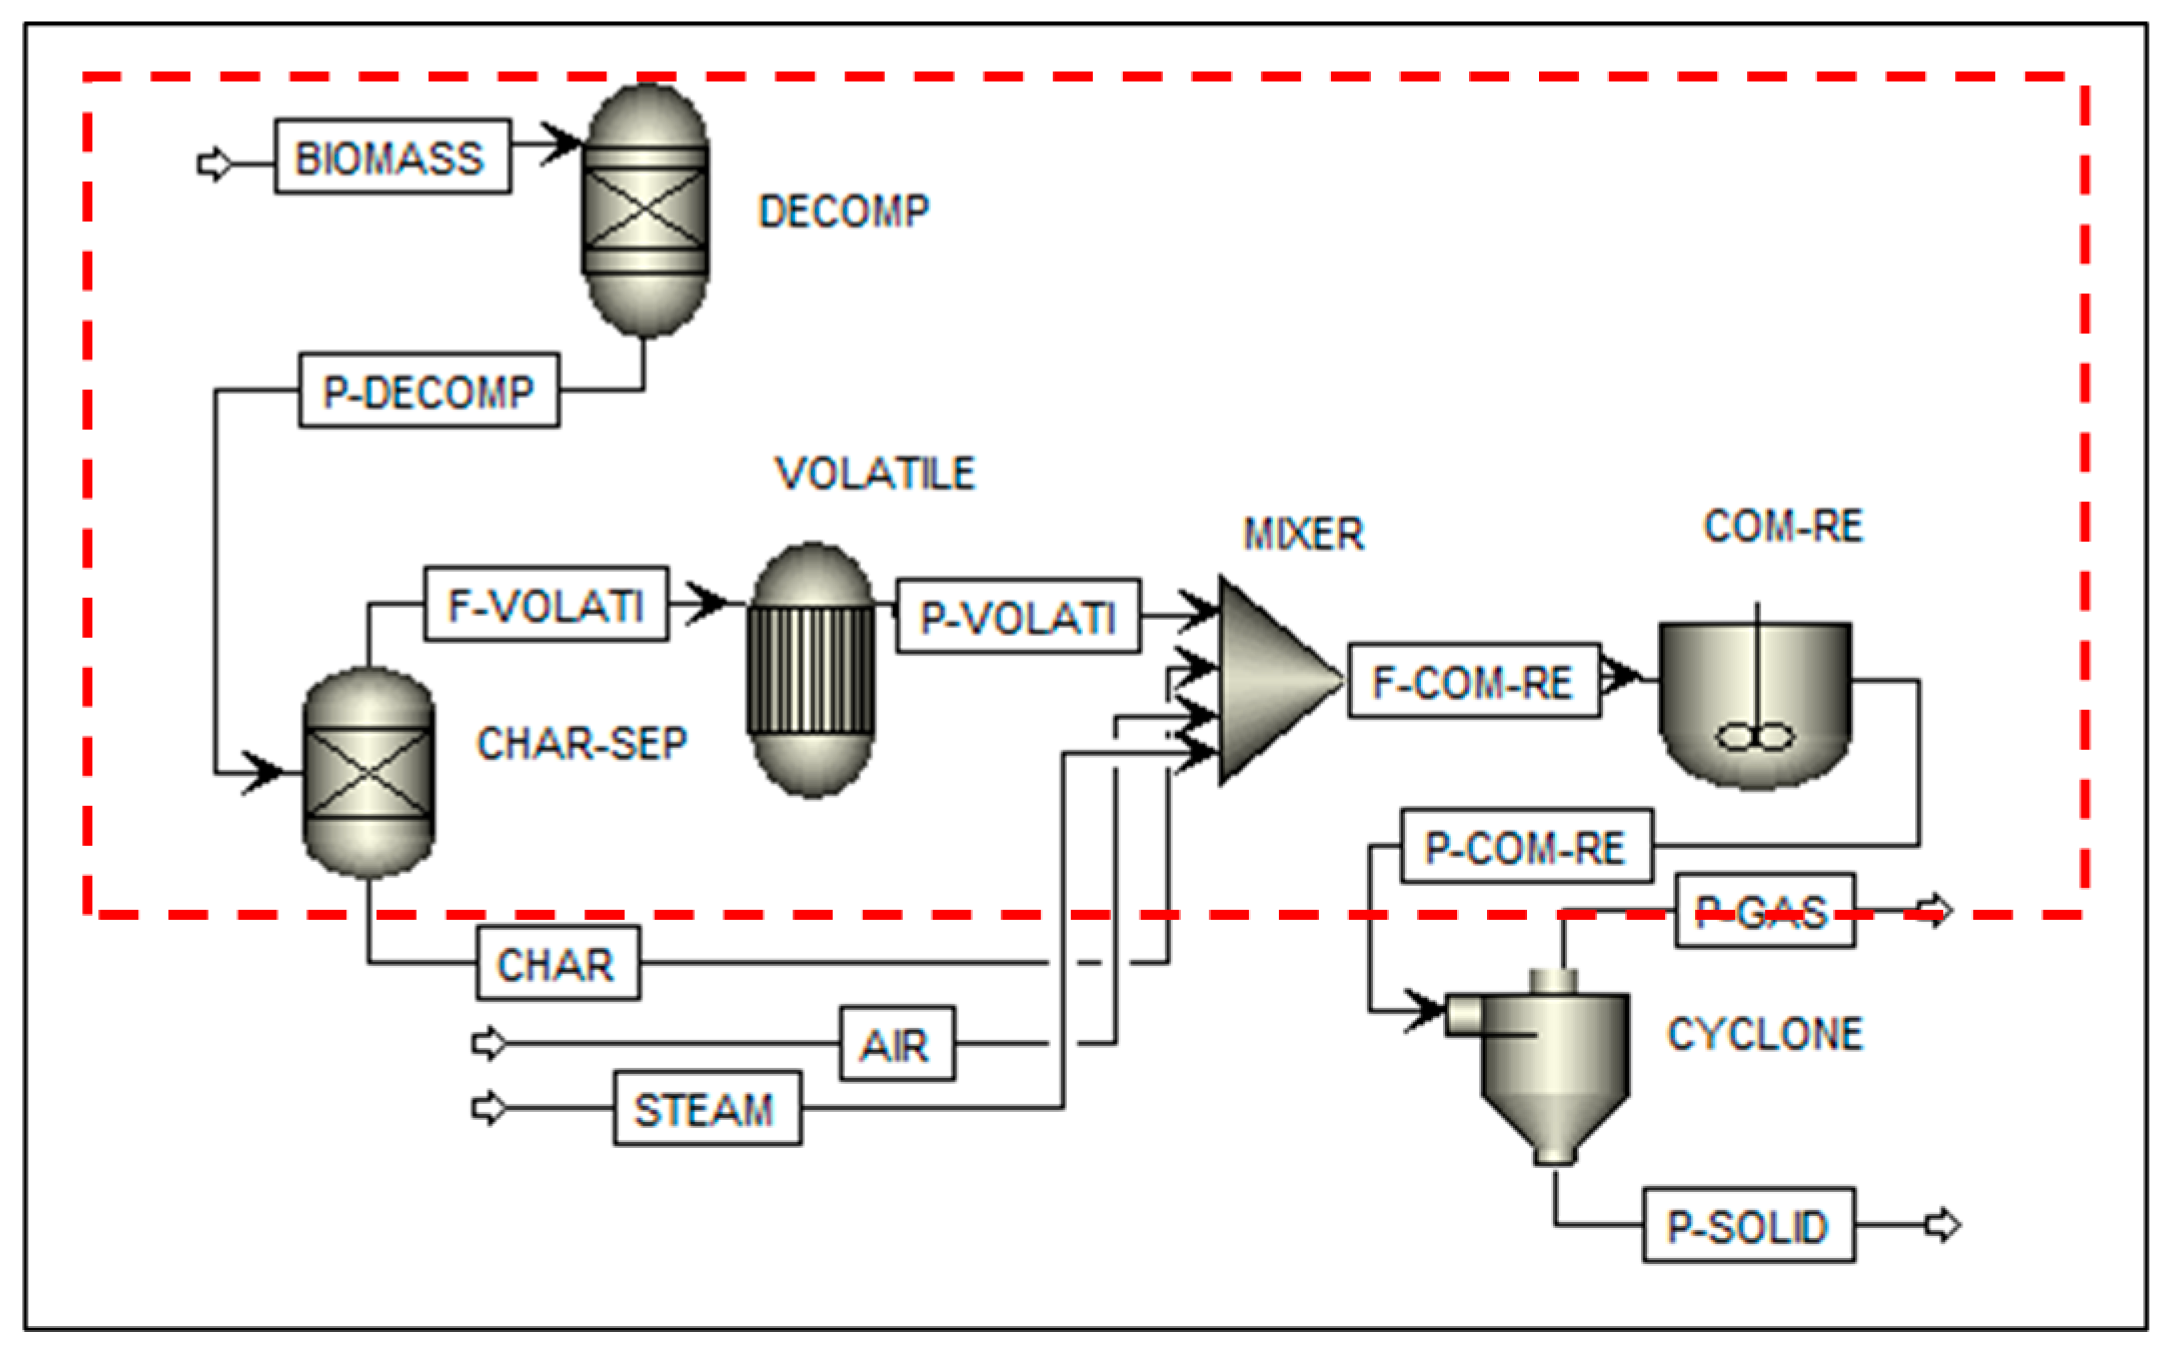
2.2. Model Description
2.3. Model Validation
3. Results and Discussion
3.1. Validation of the ASPEN Plus Model
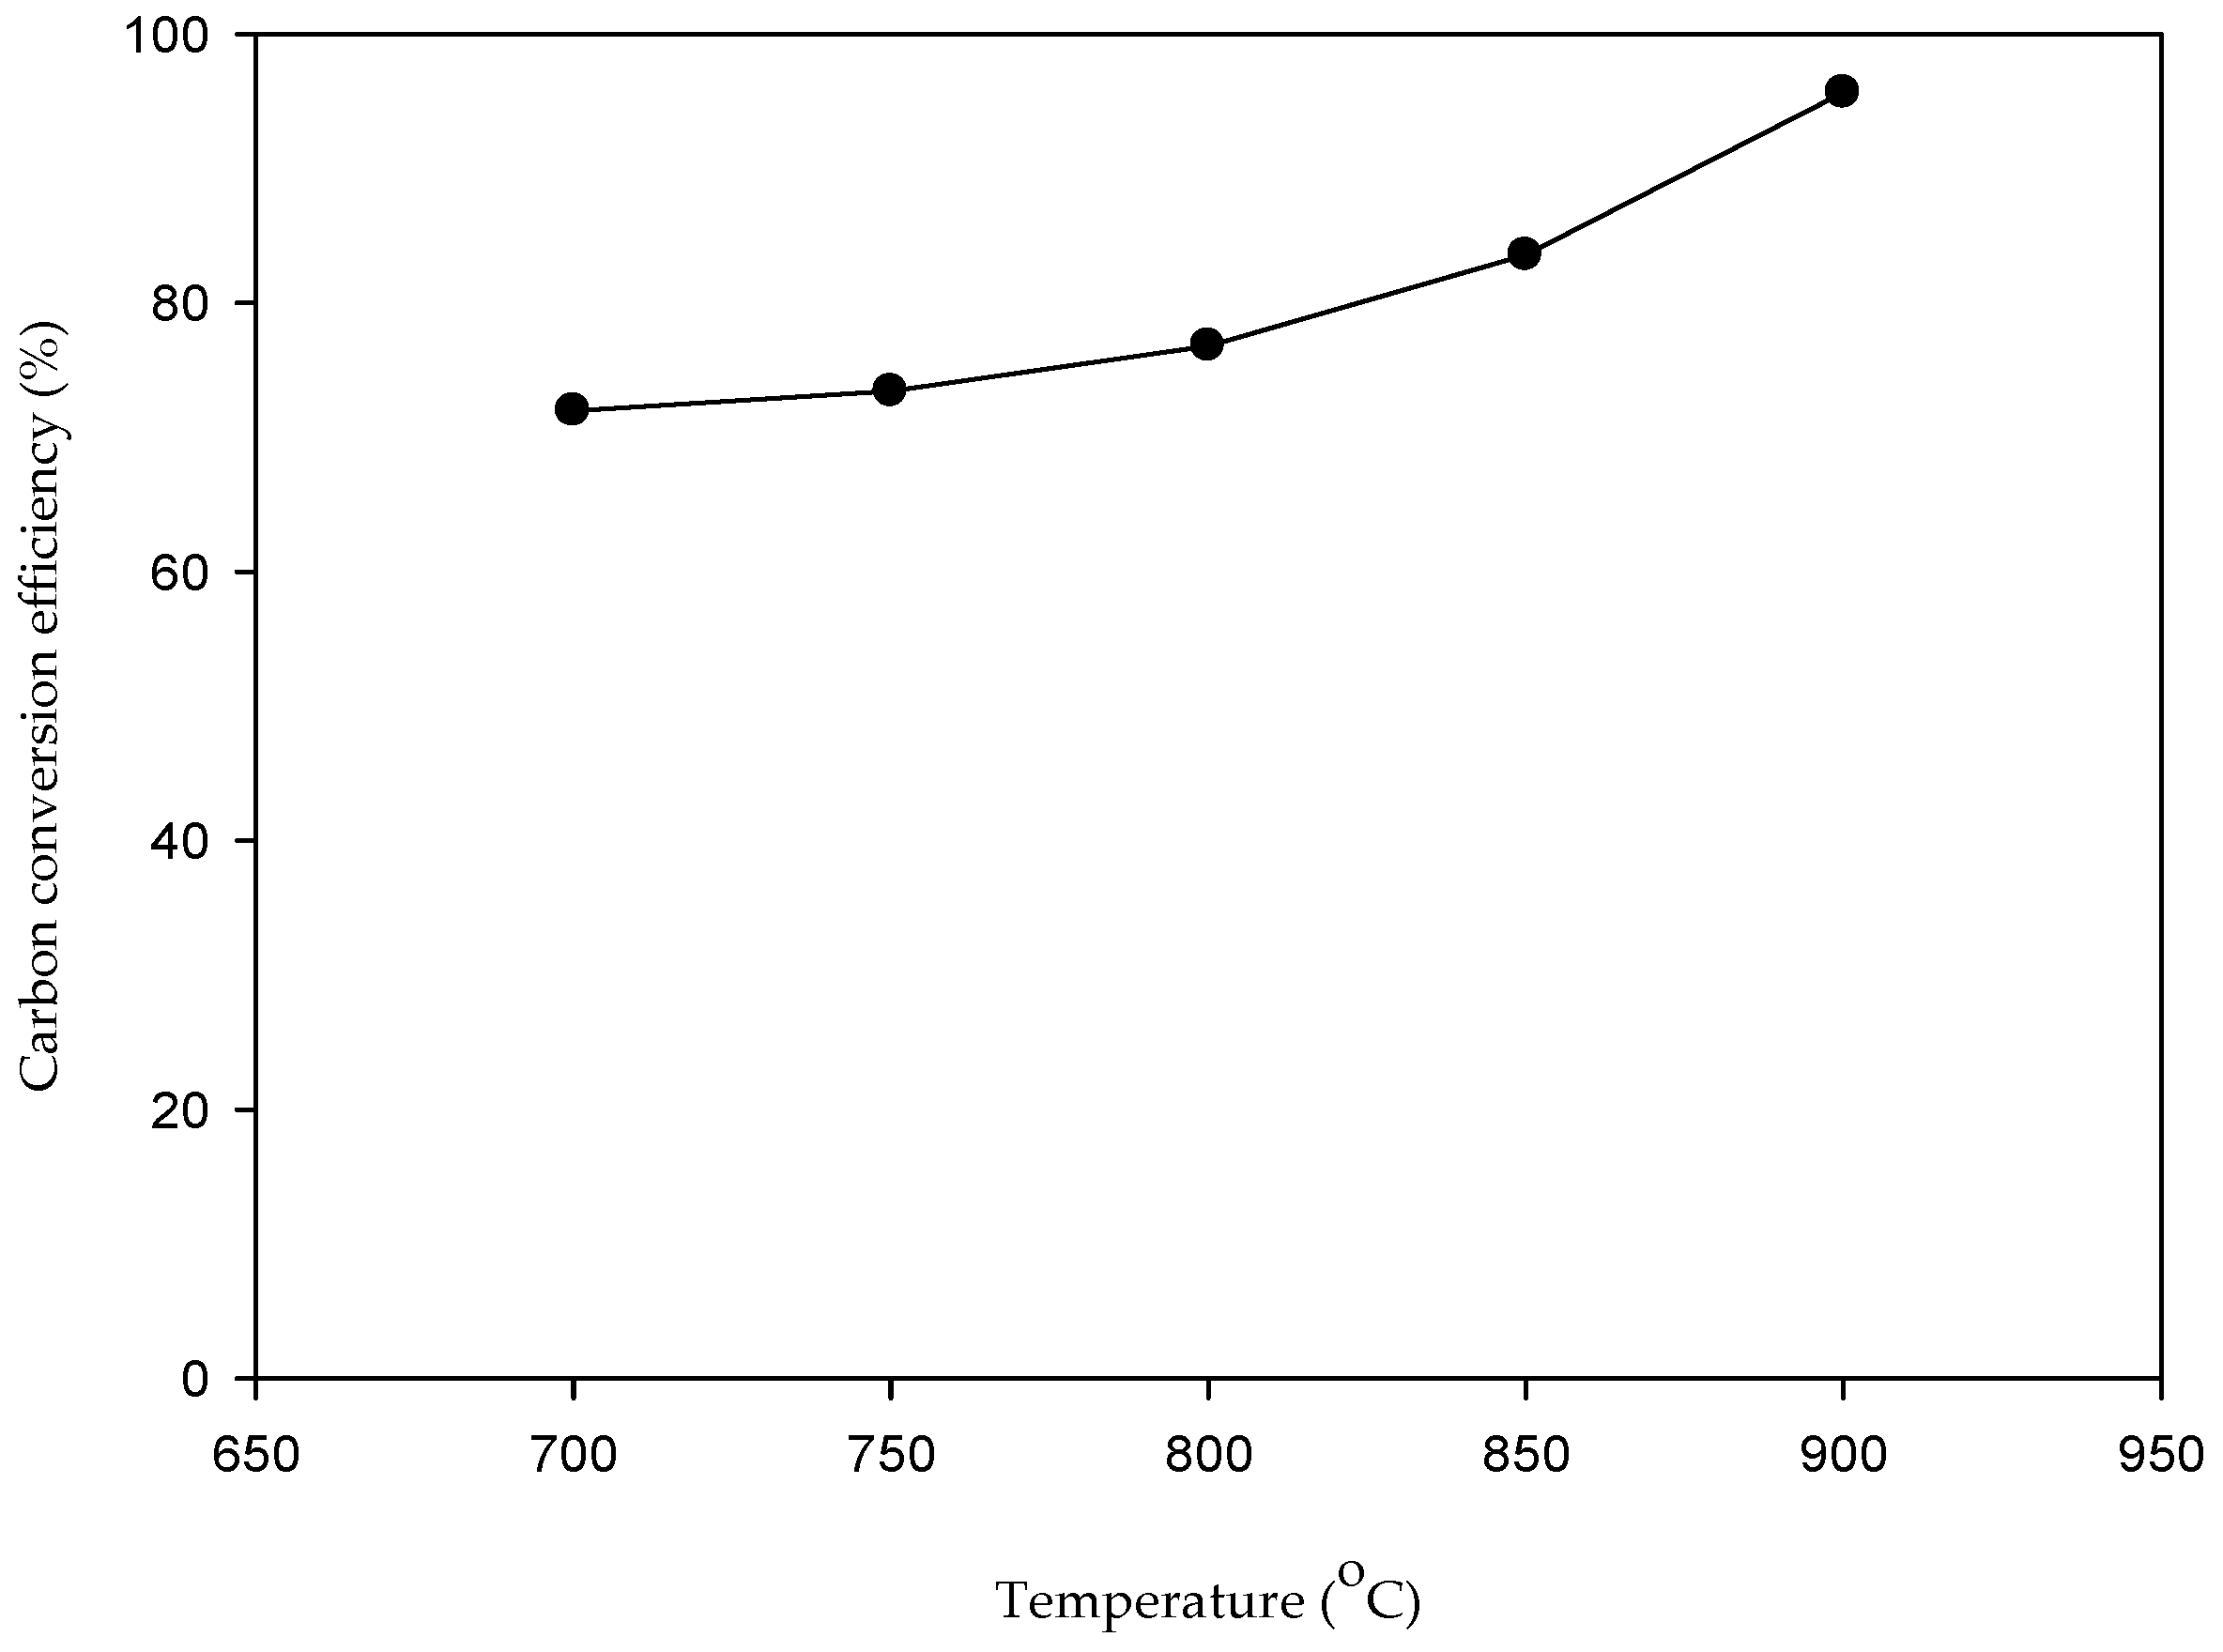
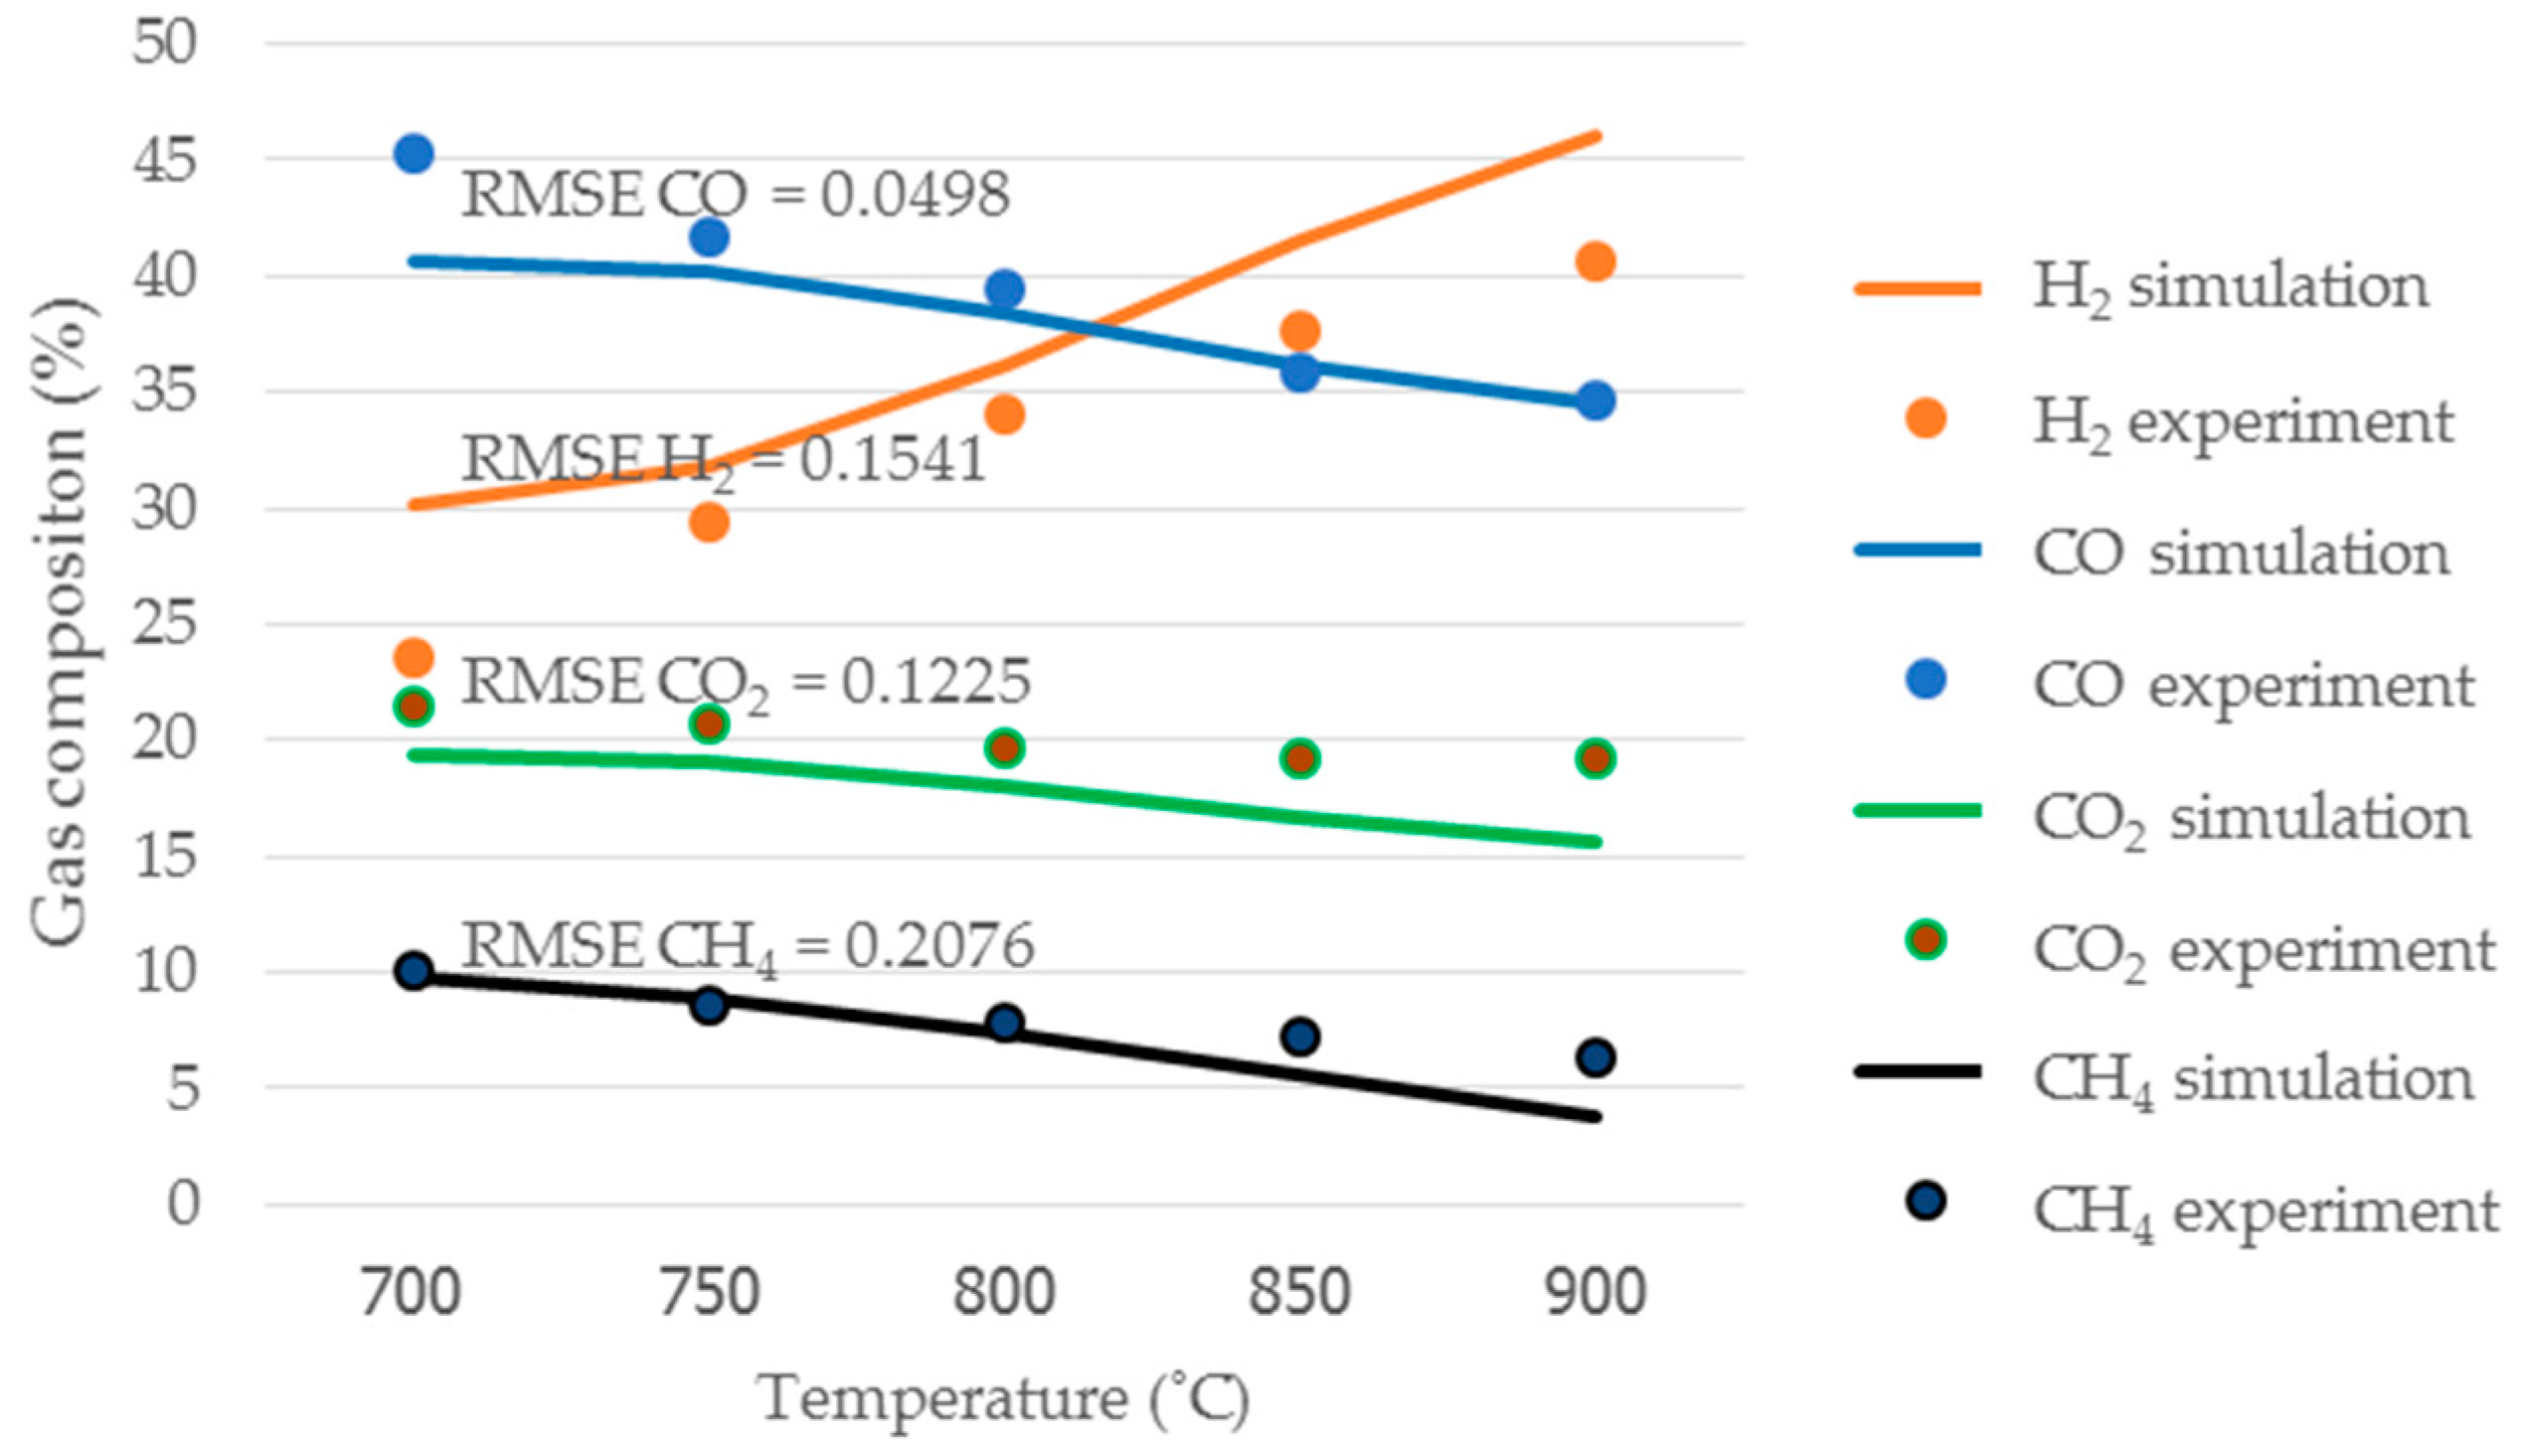
3.1.1. Validation of the ASPEN Plus model with Respect to Gasification Temperature
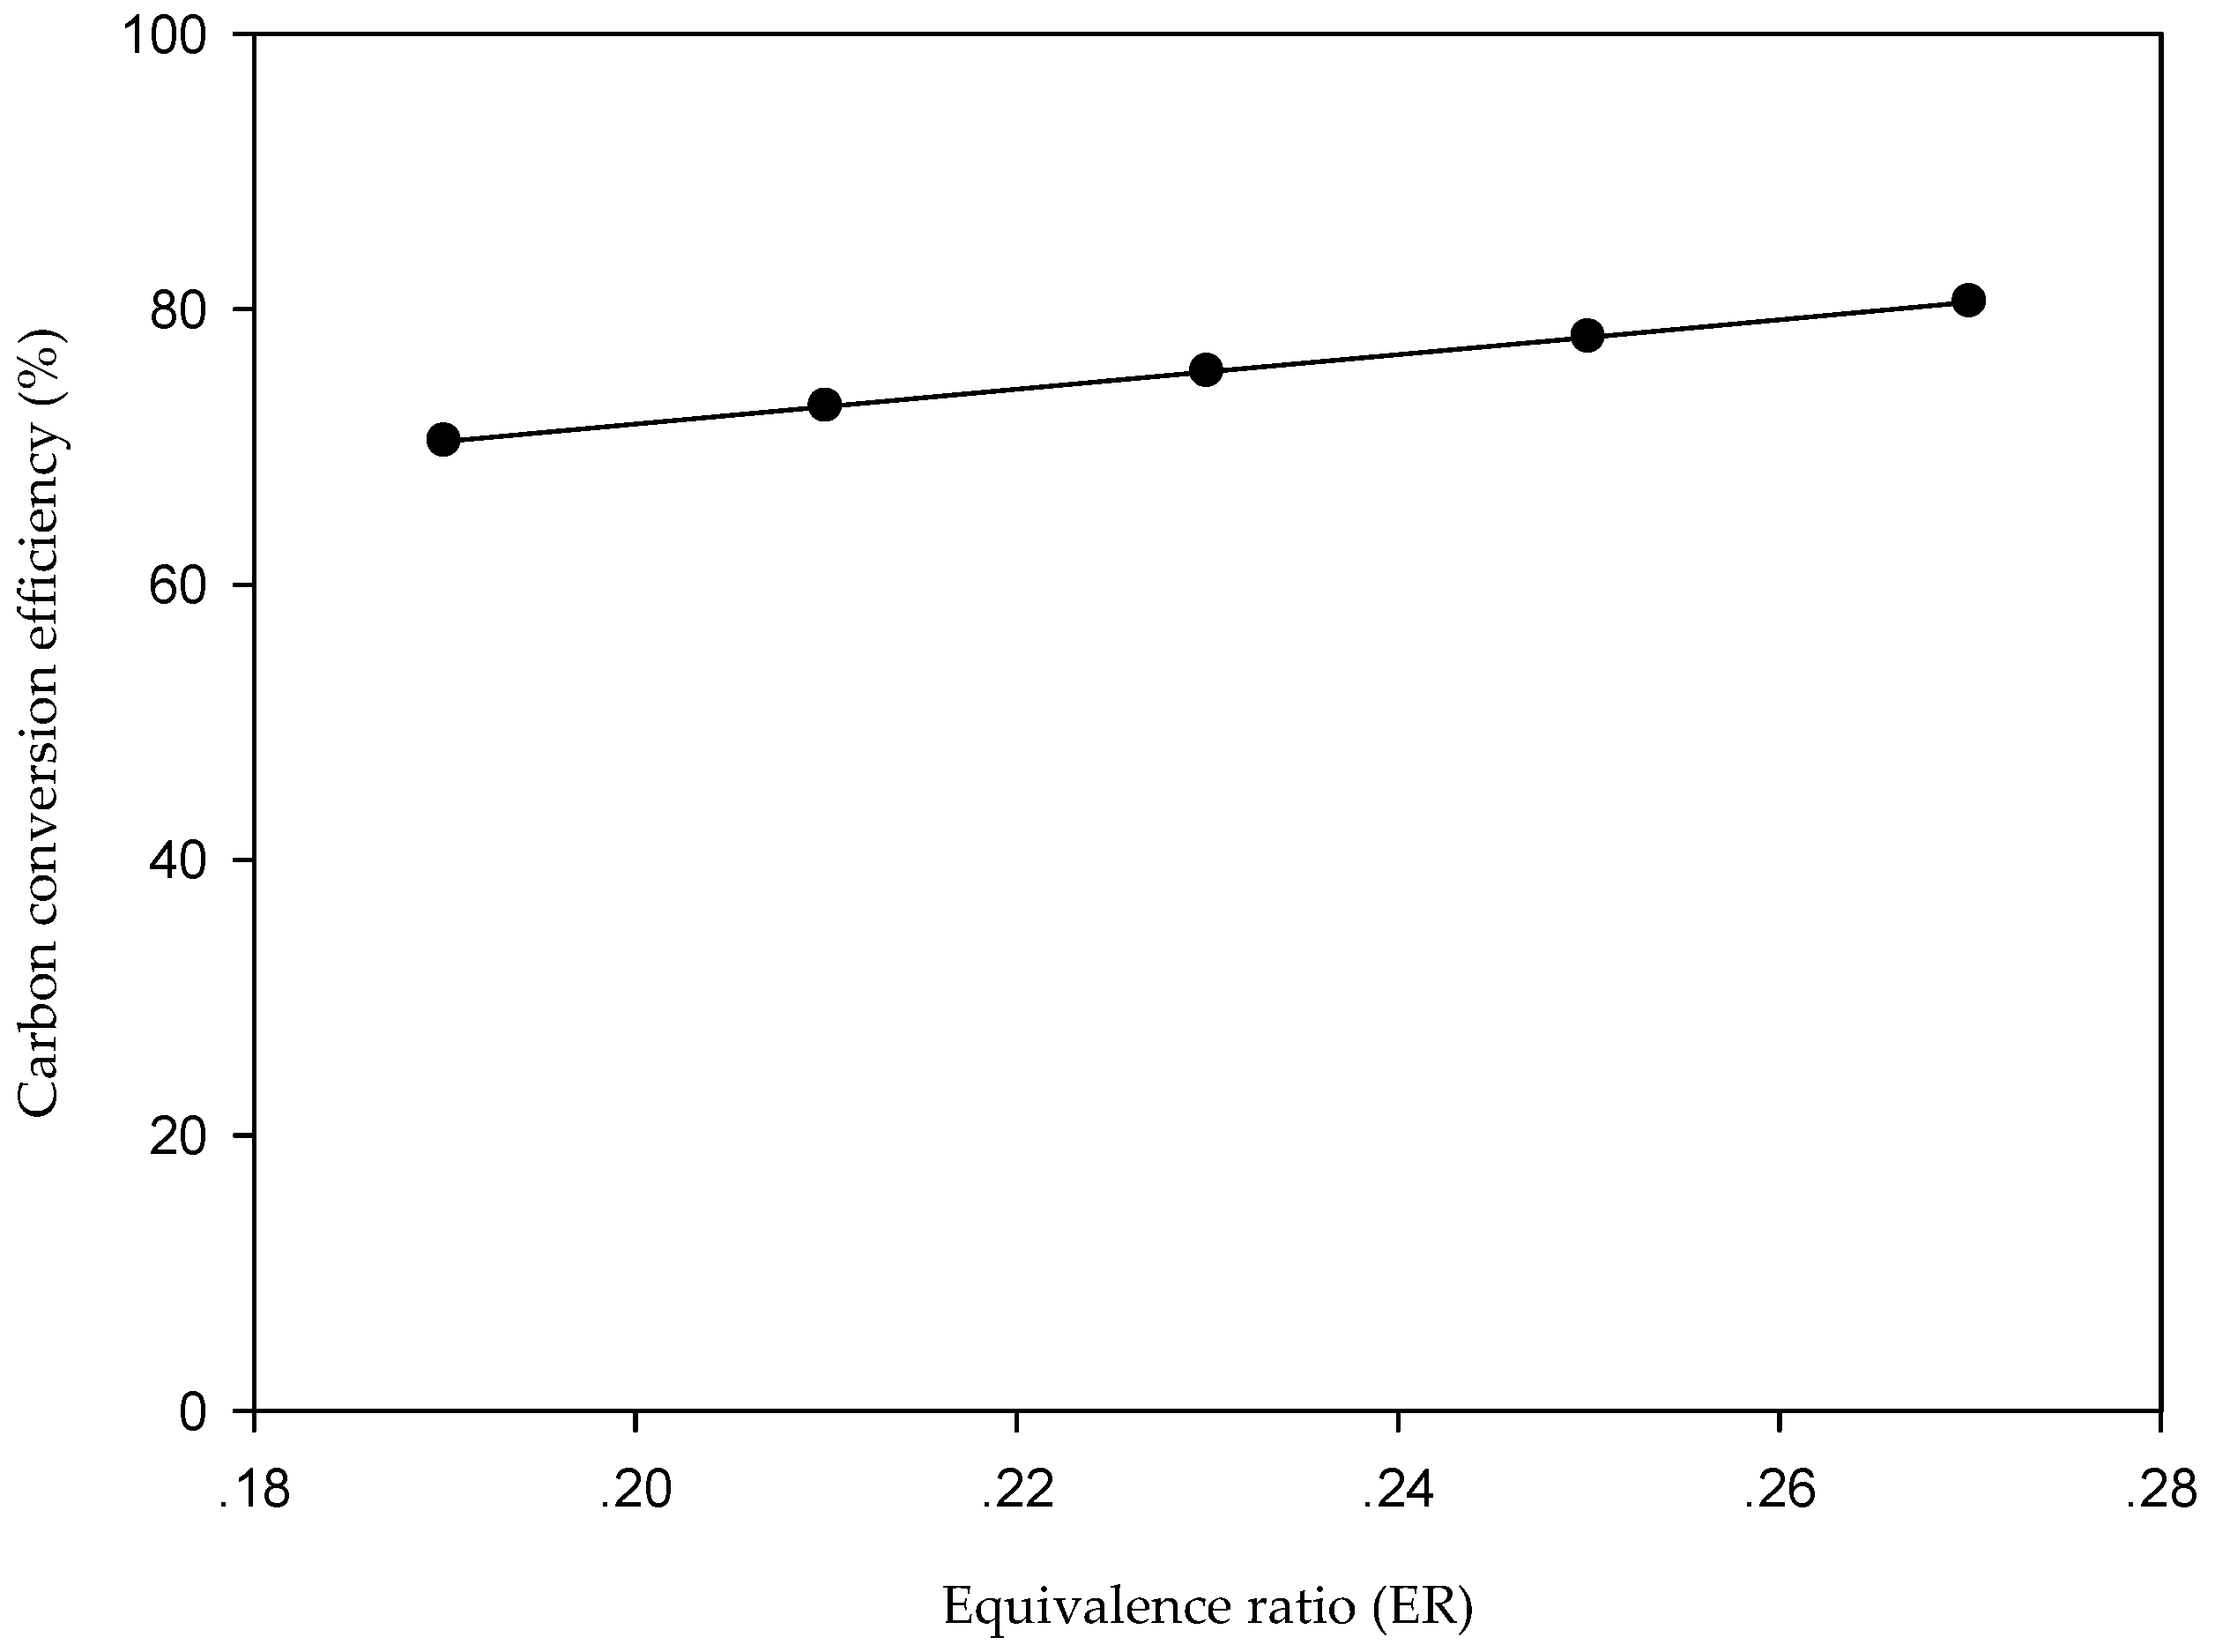
3.1.2. Validation of ASPEN Plus Model with Respect to Equivalence Ratio (ER)
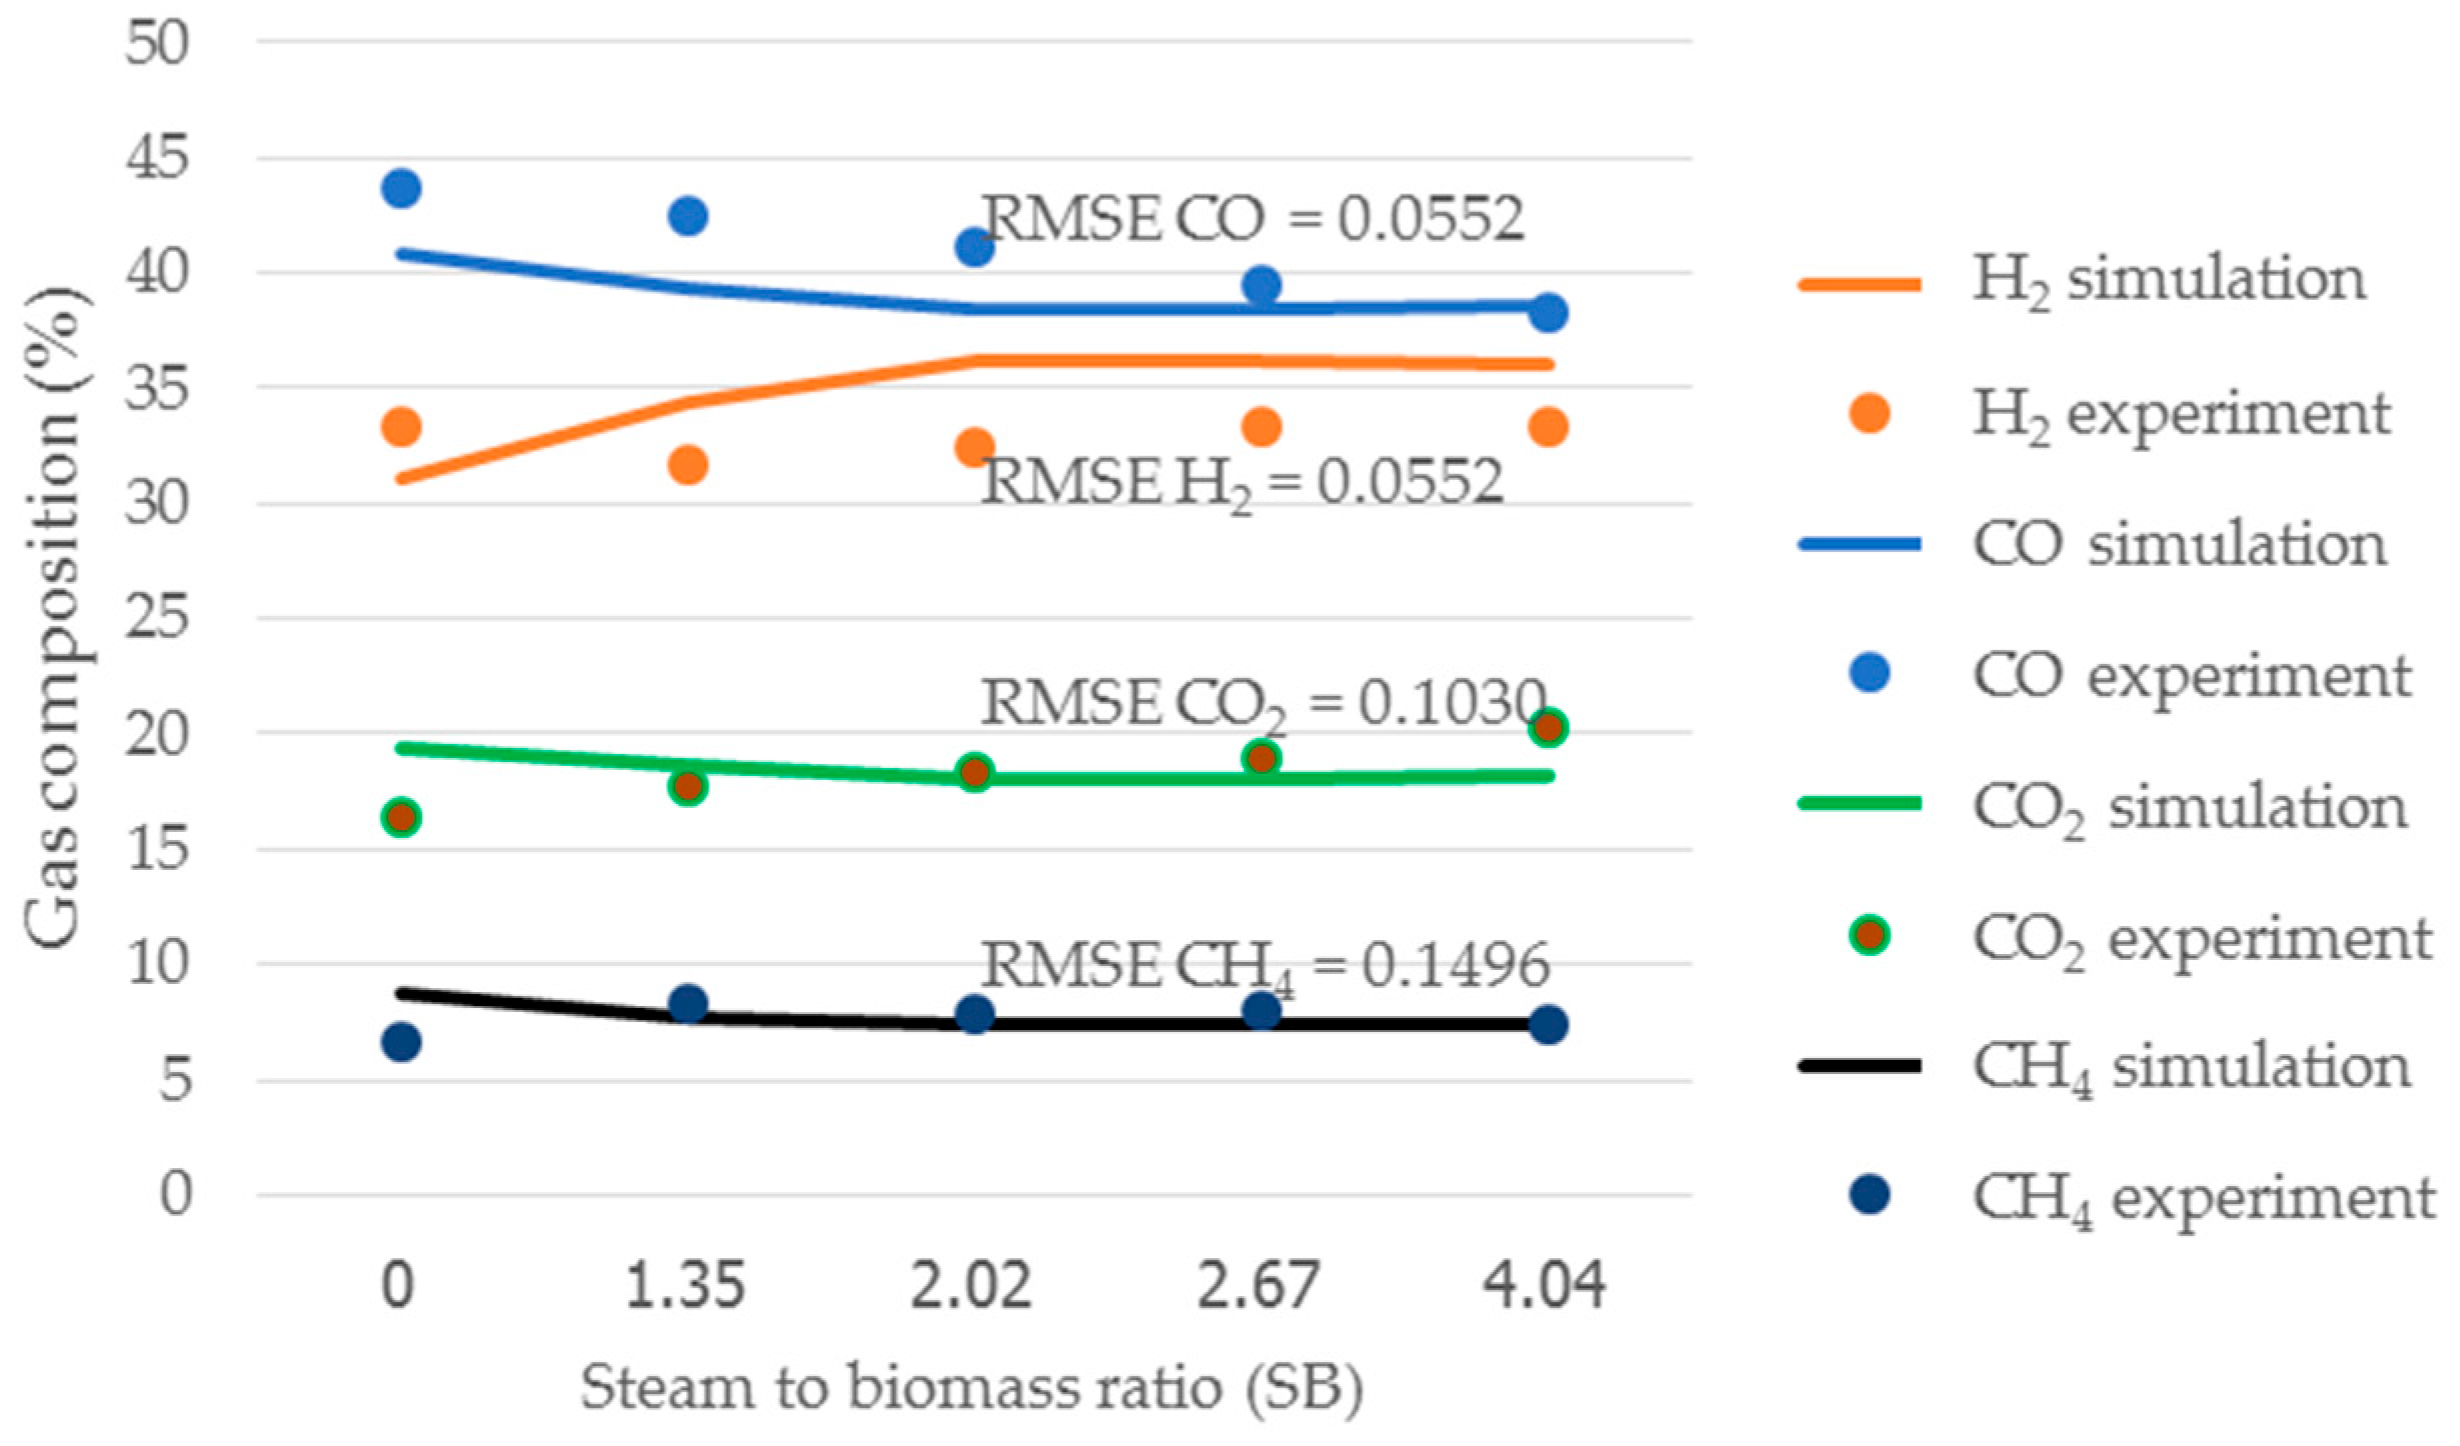
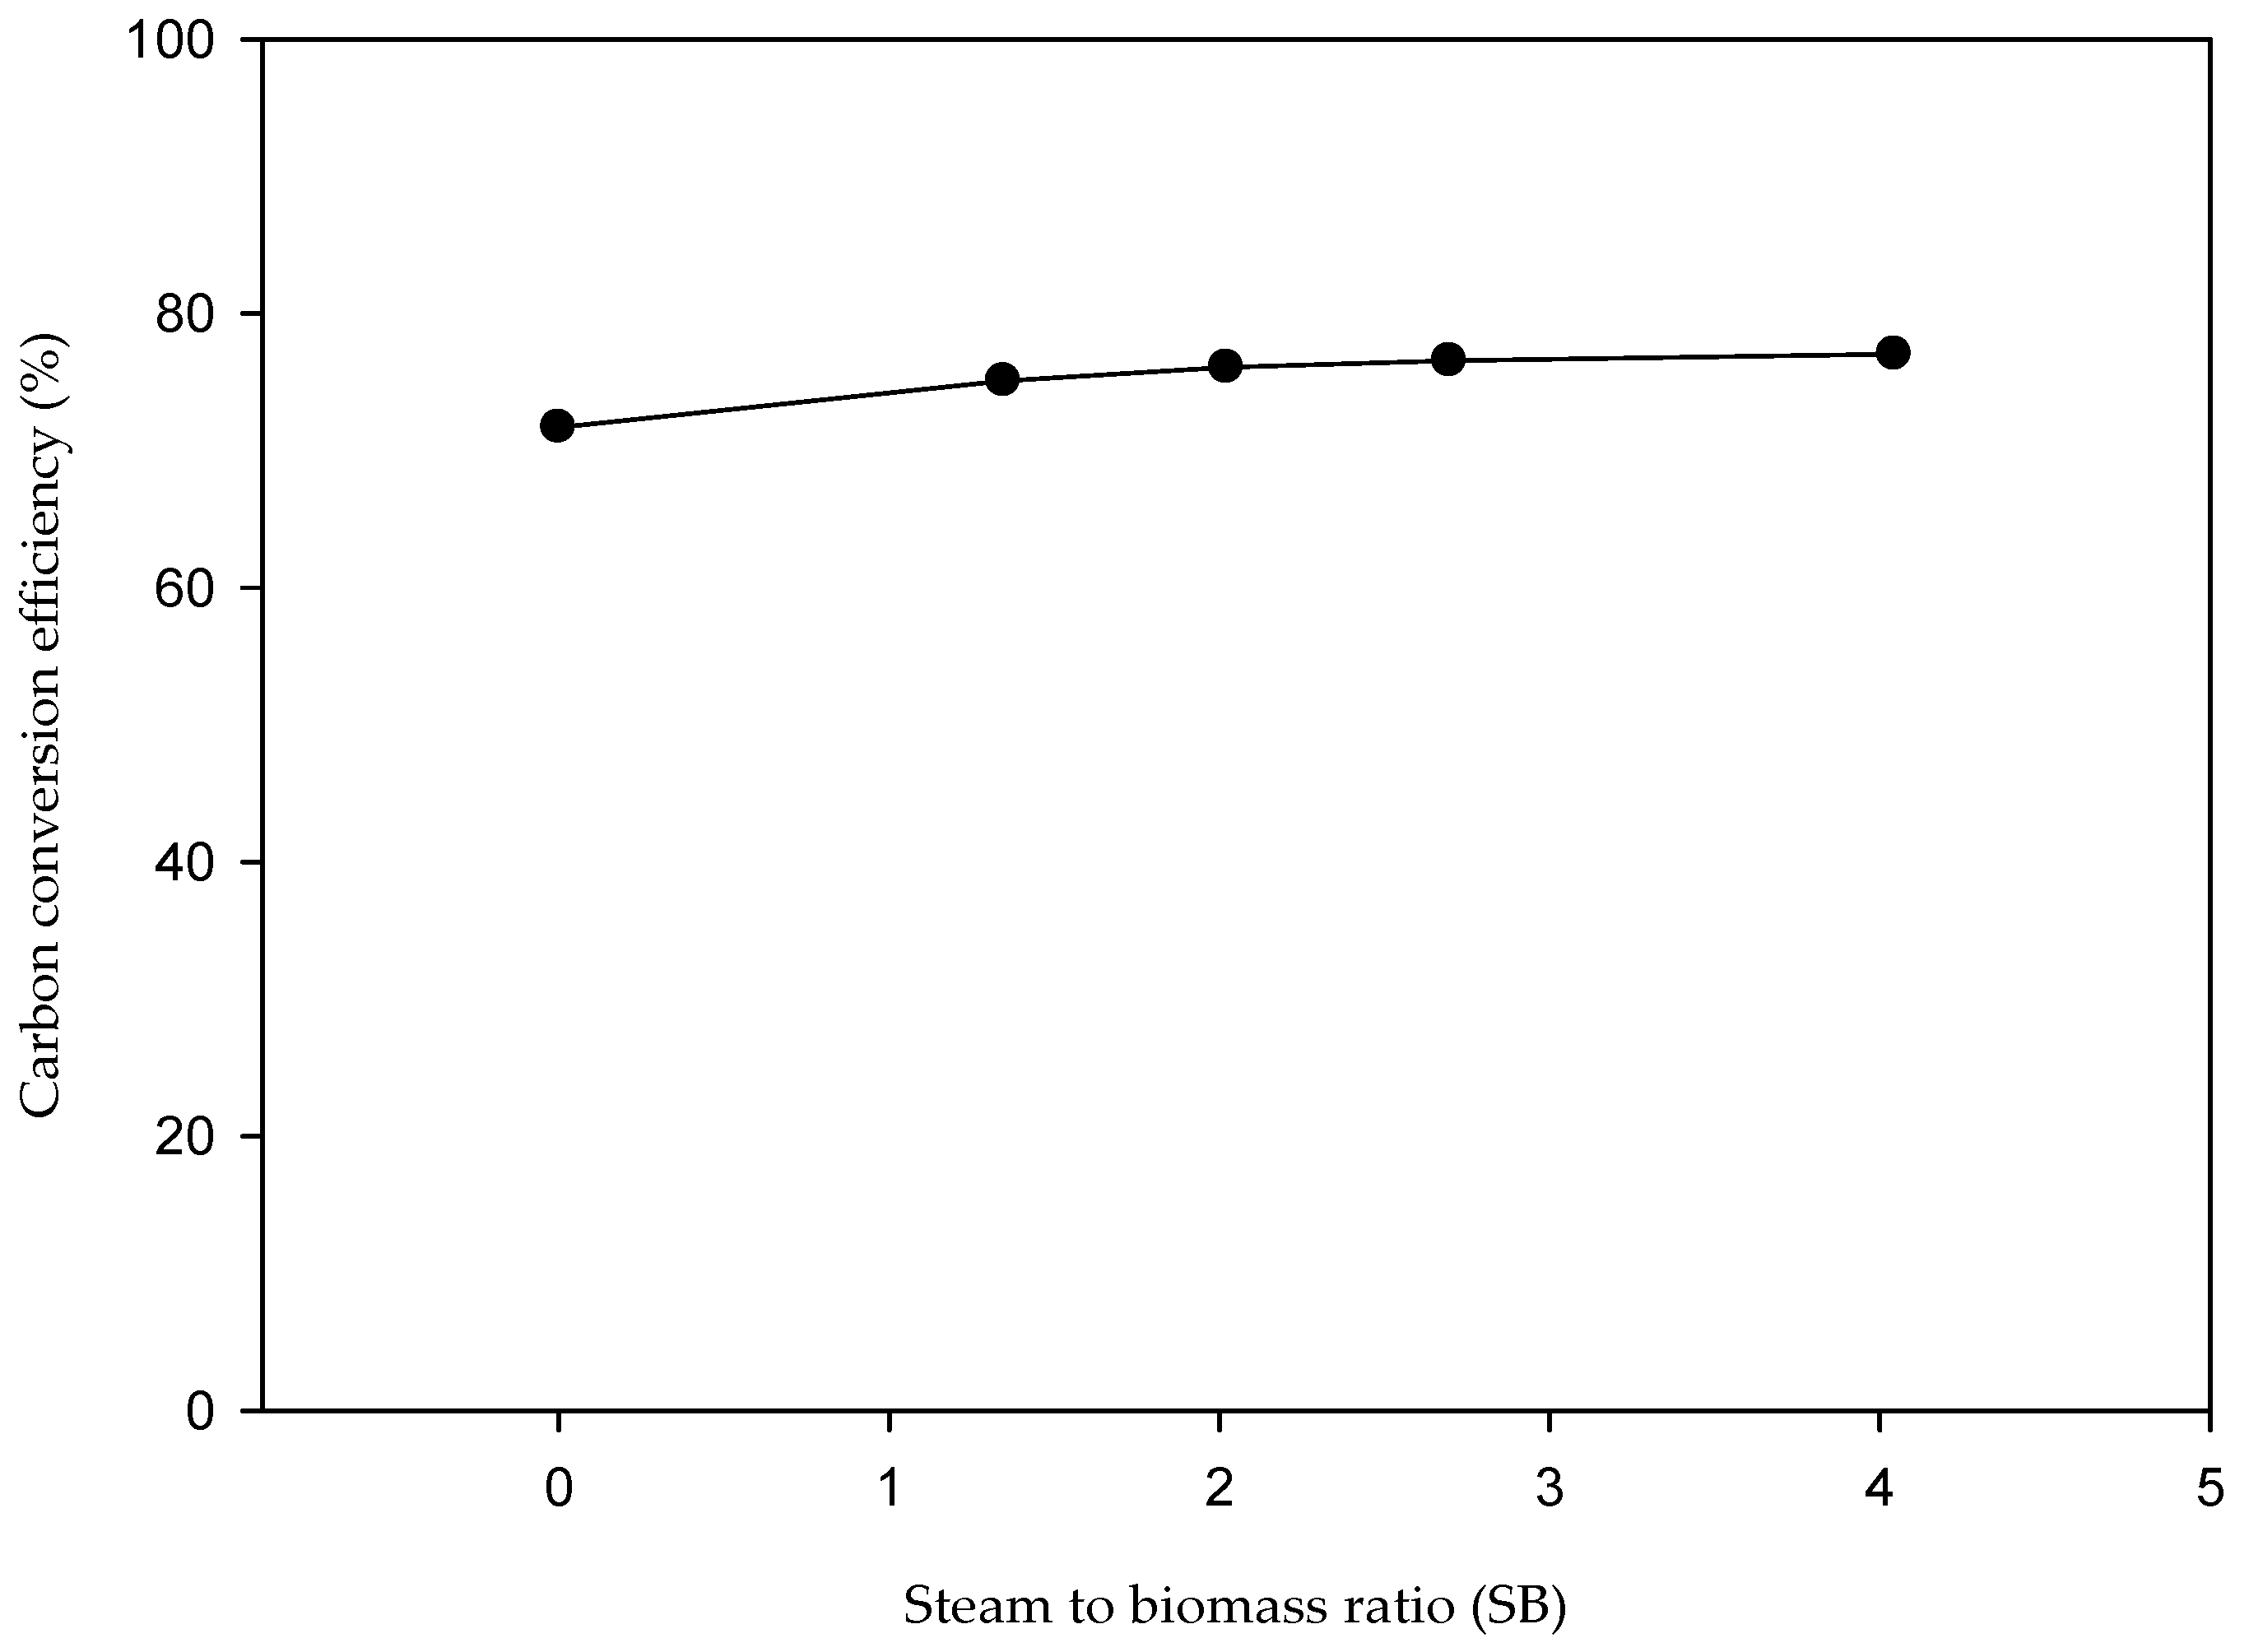
3.1.3. Validation of ASPEN Plus Model with Respect to Steam-to-Biomass Ratio (SB)
3.1.4. Conclusion of ASPEN Plus Model Validation
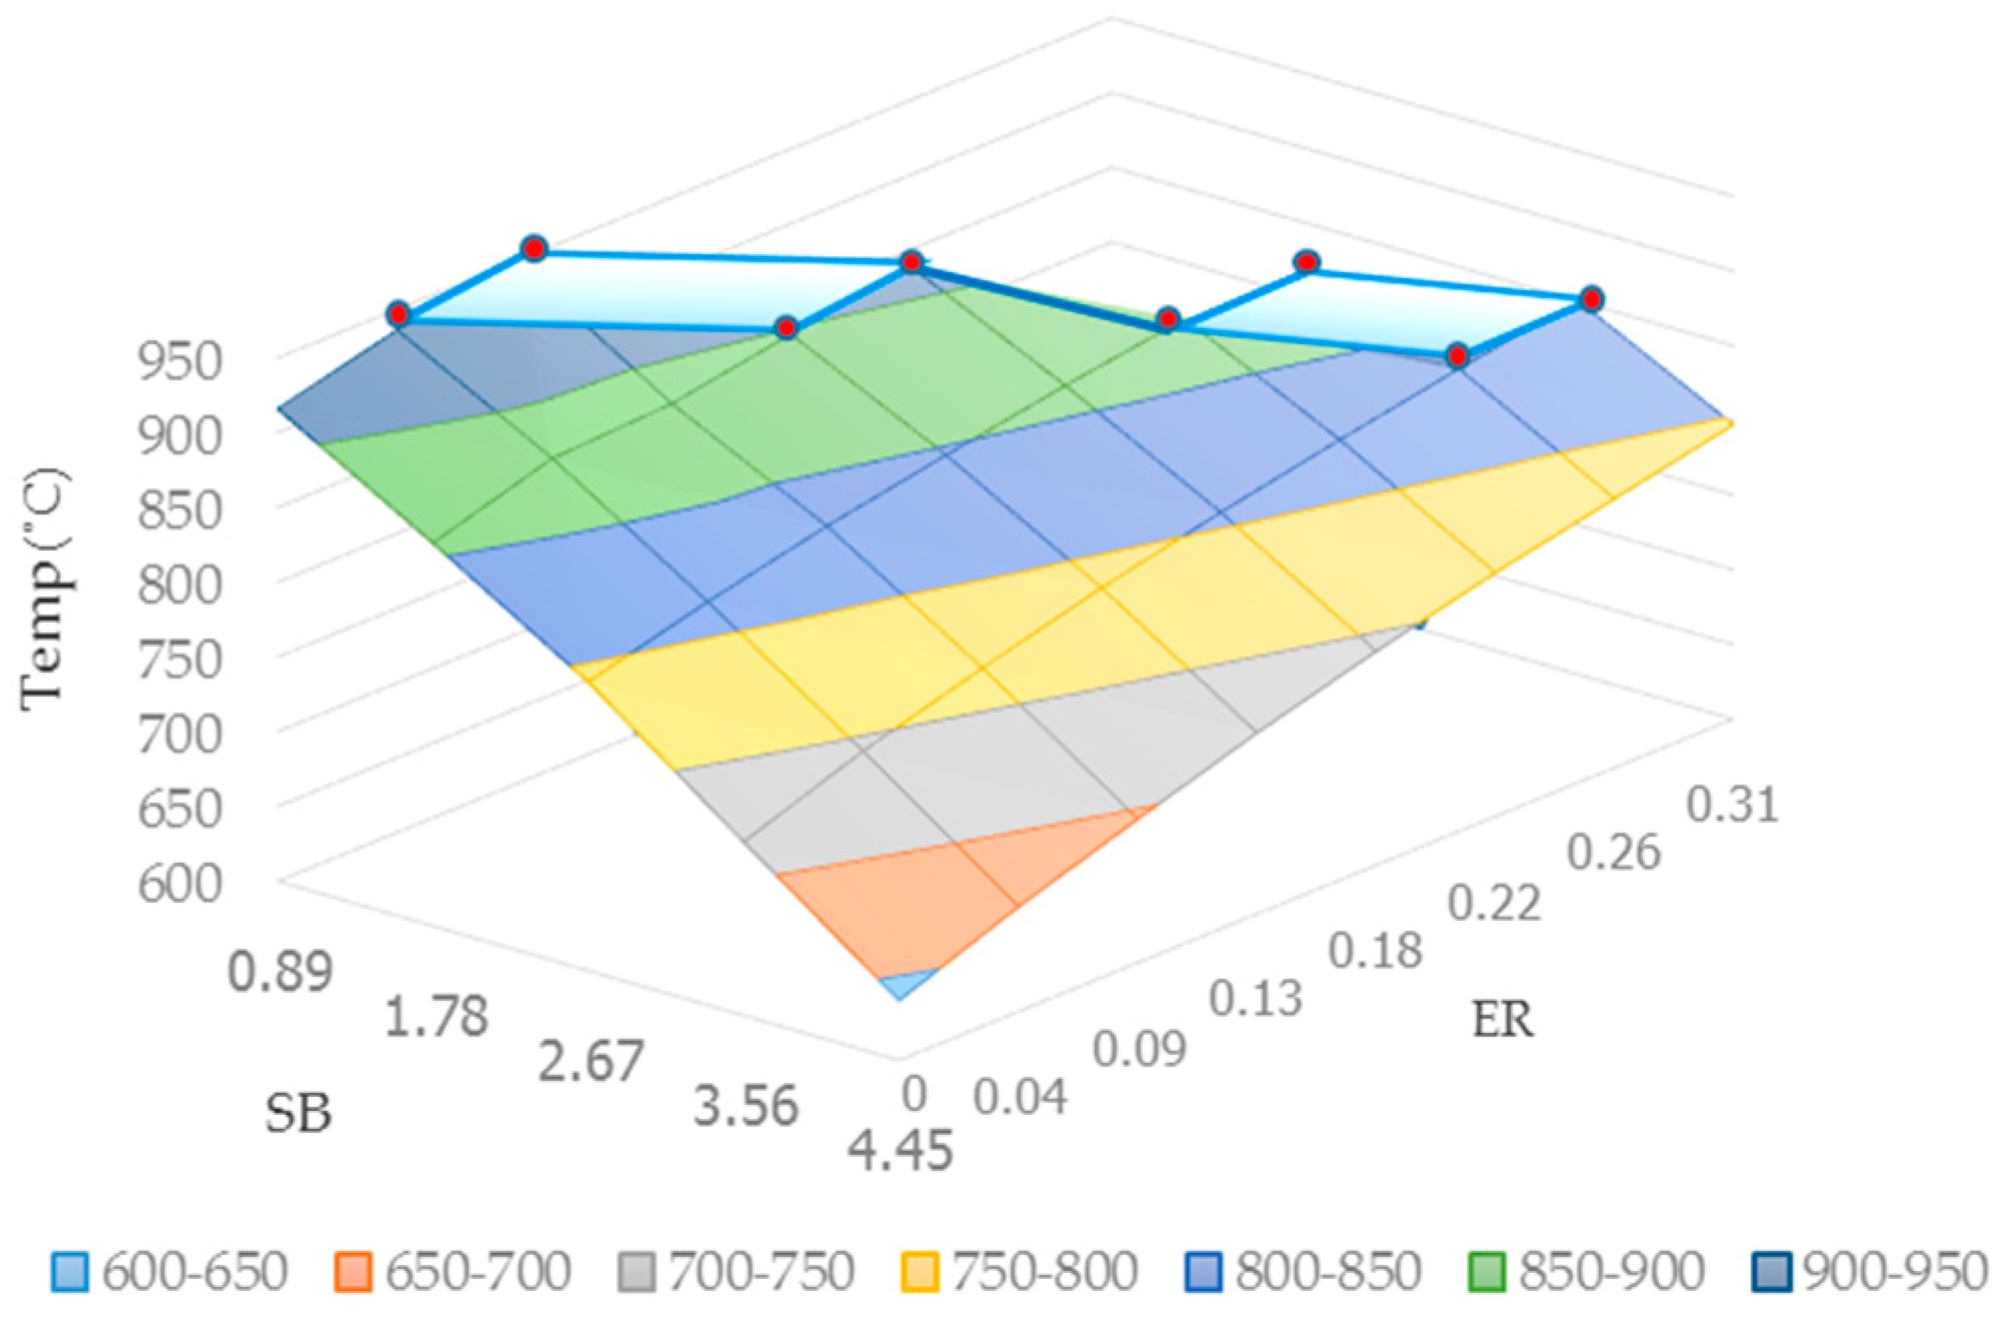
3.2. Energy Self-Sufficient Condition
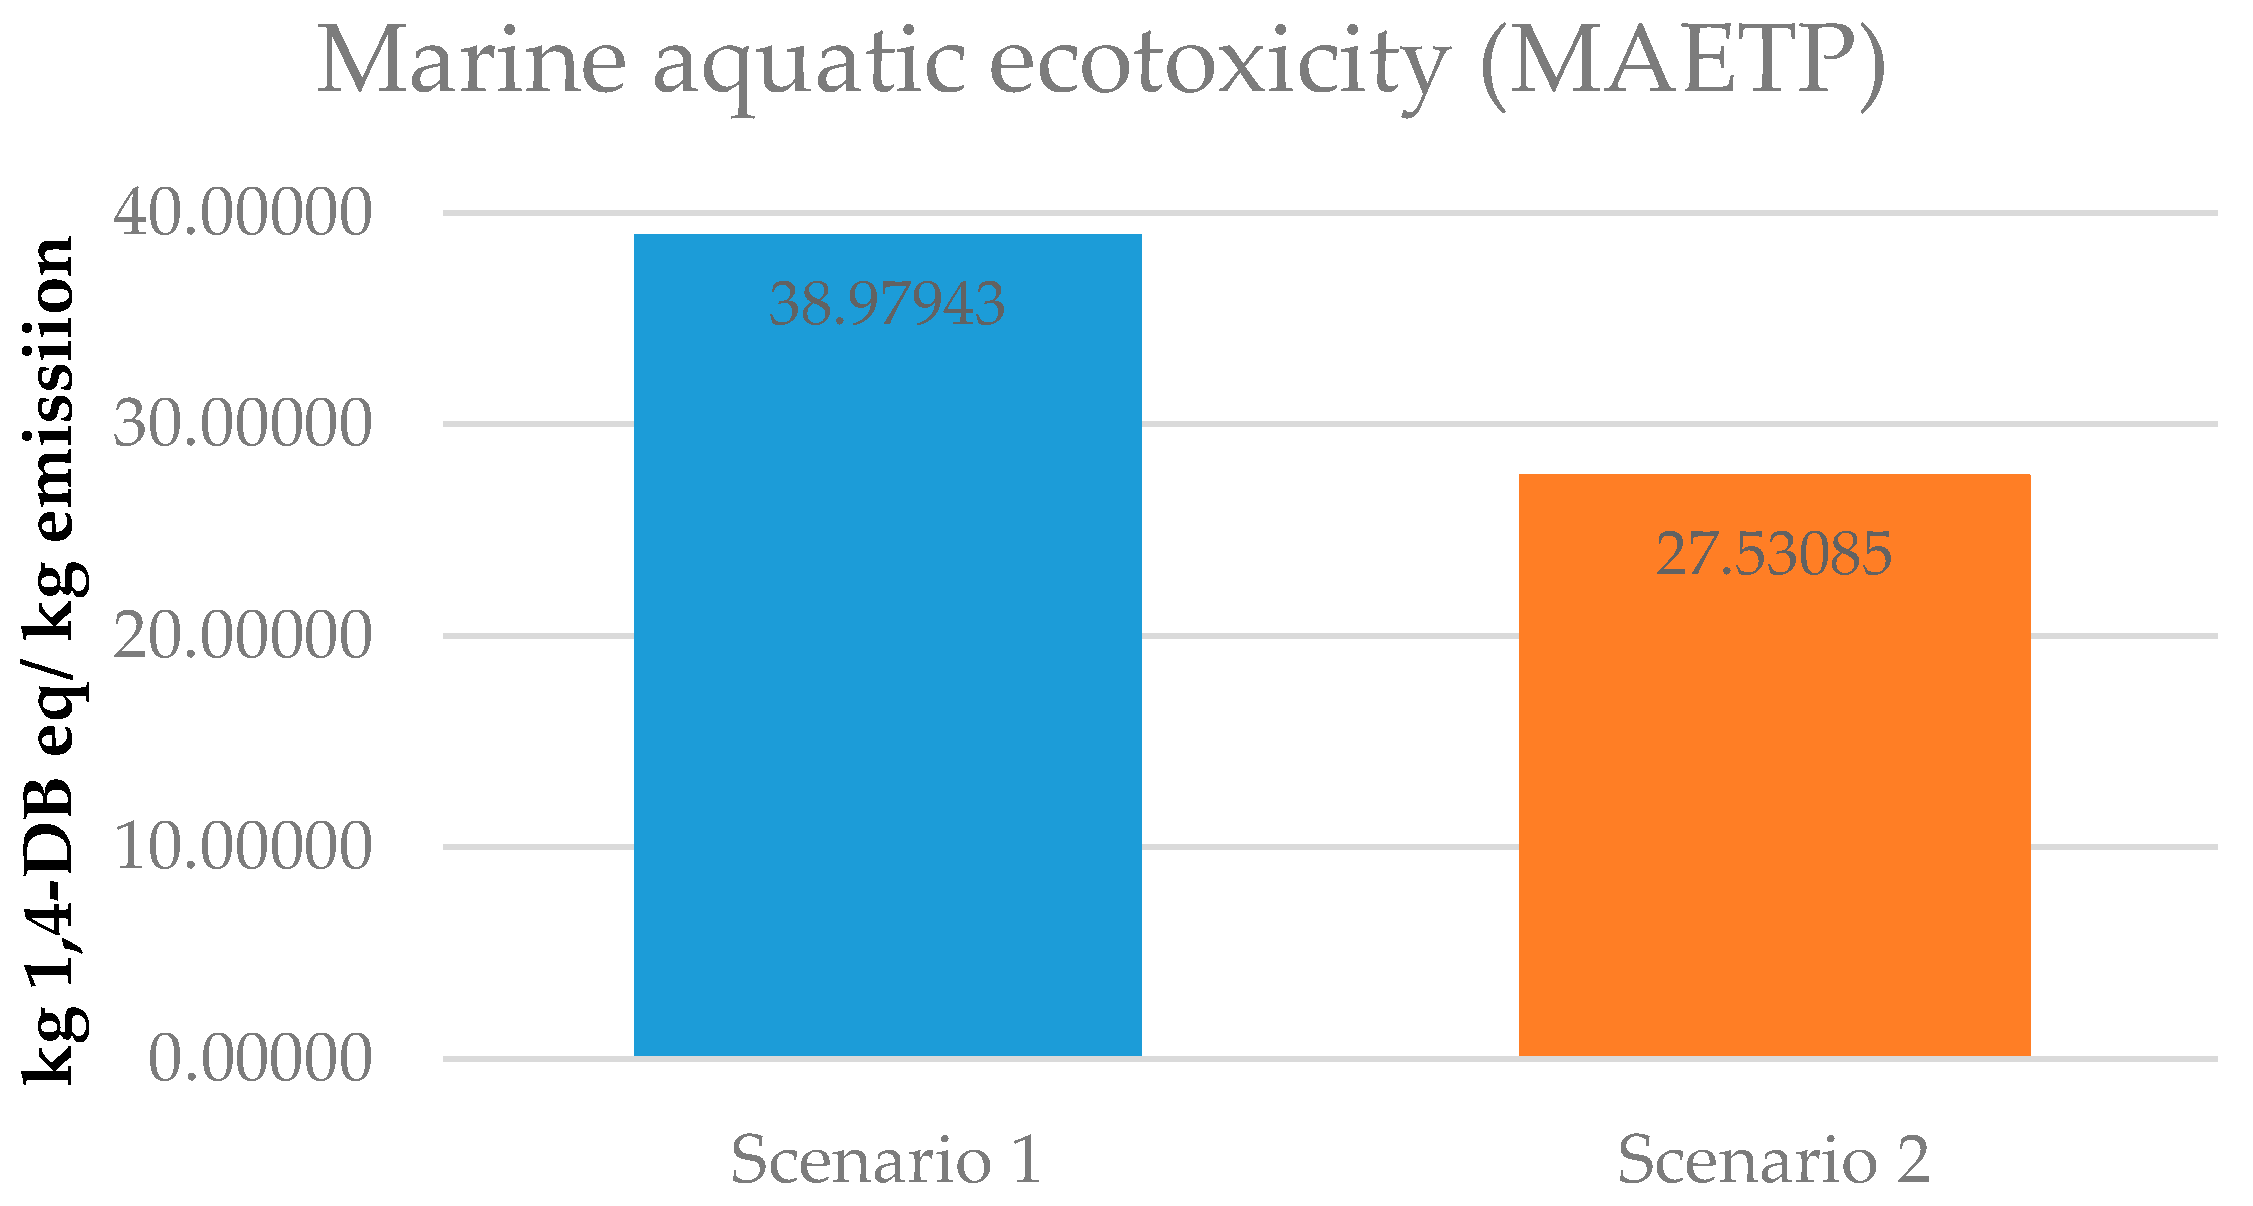
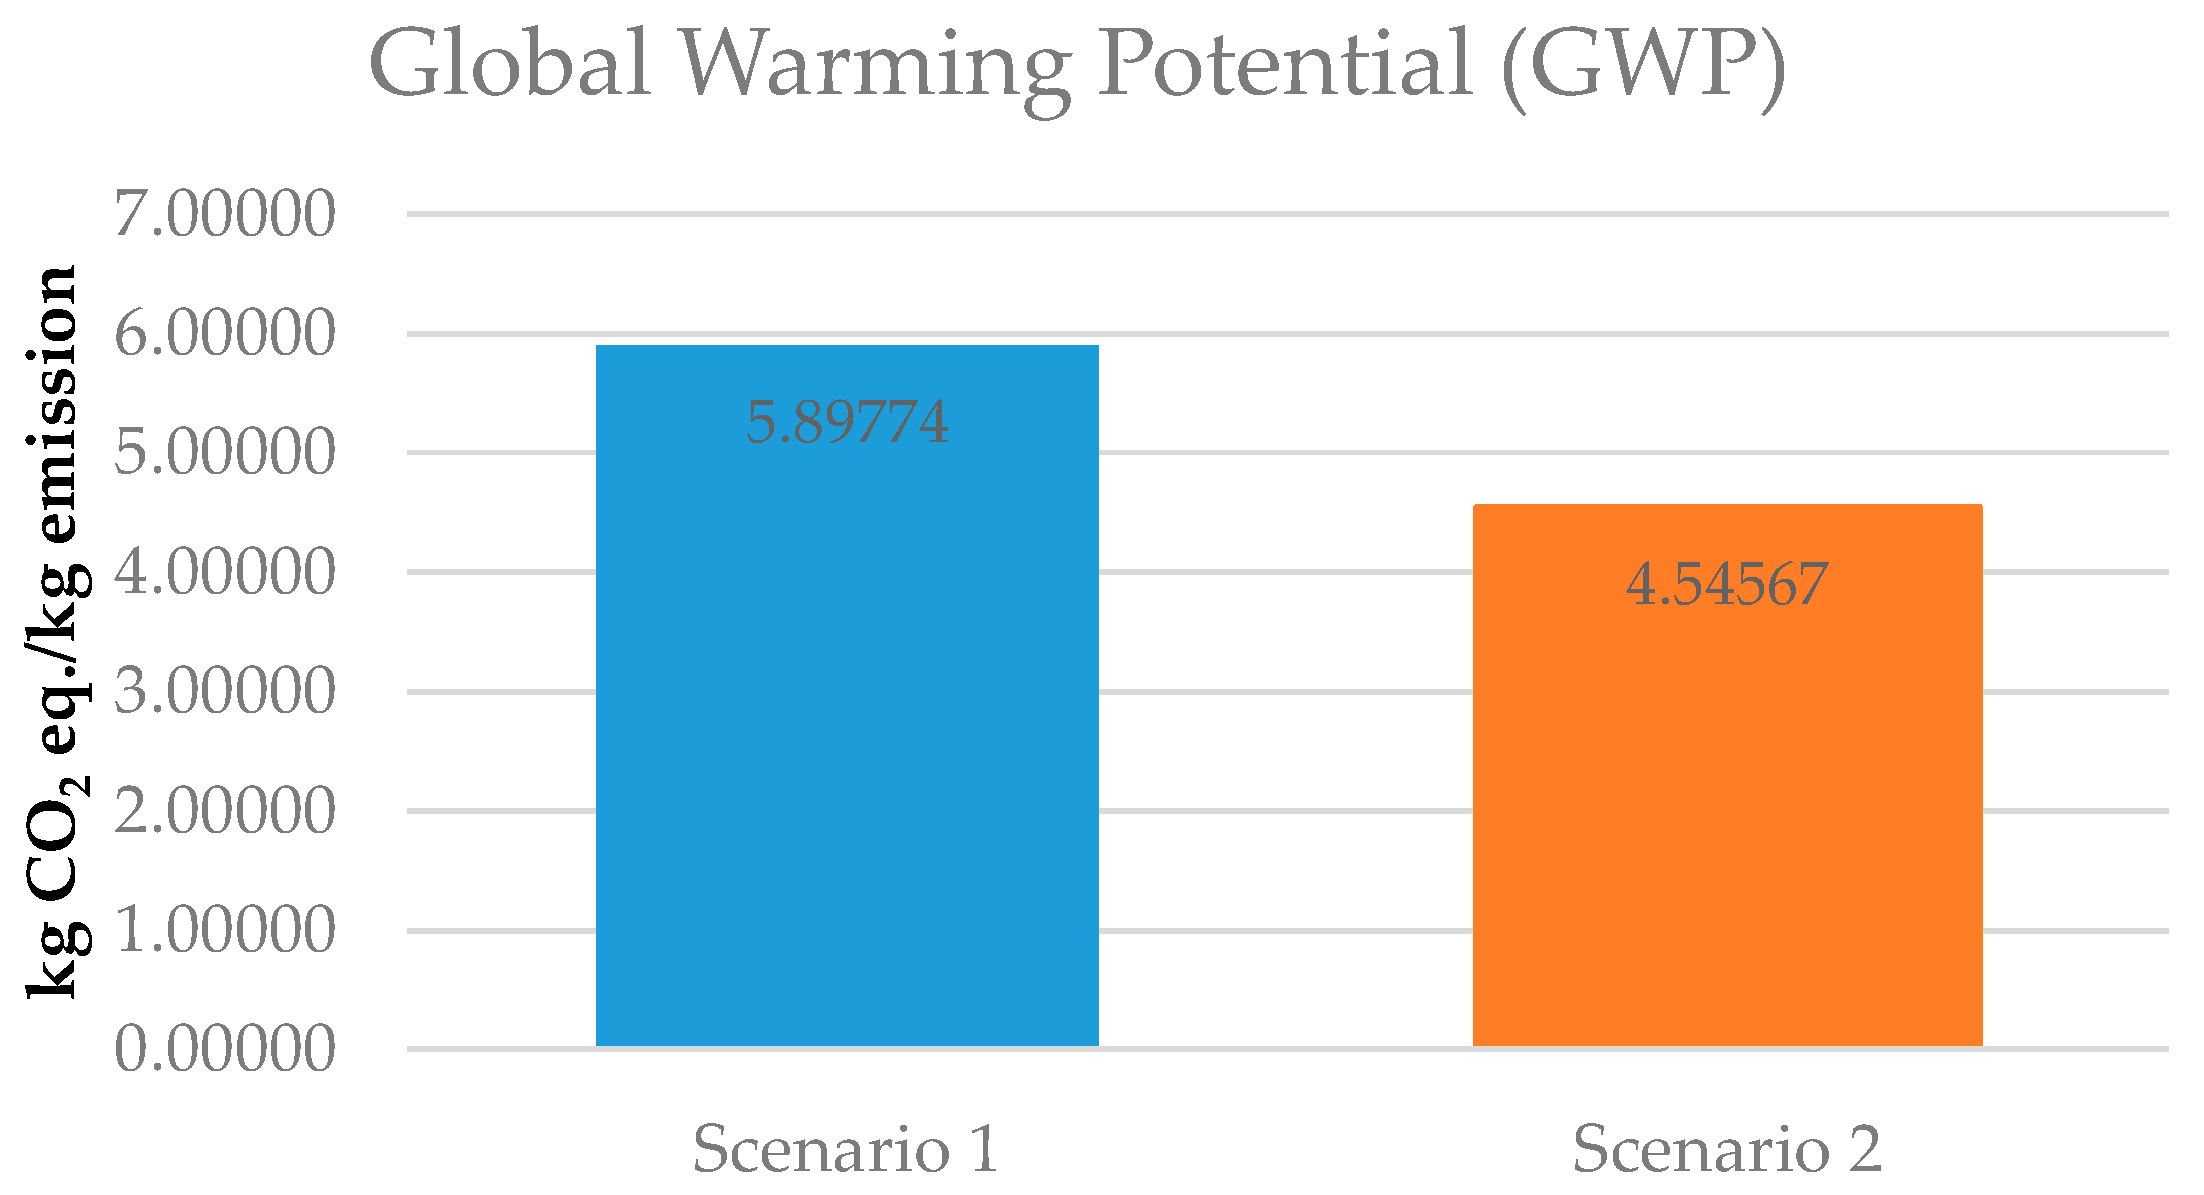
3.3. Environmental Assessment
4. Conclusions
Acknowledgments
Author Contributions
Conflicts of Interest
Appendix A

| ER | SB | Temperature (°C) | Gas Composition (vol. %) | Carbon Conversion (%) | |||
|---|---|---|---|---|---|---|---|
| H2 | CO | CO2 | CH4 | ||||
| 0 | 0.89 | 916 | 56.34 | 28.89 | 10.24 | 4.53 | 62.80 |
| 0.04 | 0.89 | 936 | 53.82 | 30.51 | 11.76 | 3.91 | 76.81 |
| 0.09 | 0.89 | 949 | 51.36 | 31.91 | 13.23 | 3.50 | 90.34 |
| 0 | 1.78 | 856 | 55.68 | 28.50 | 8.86 | 6.96 | 41.55 |
| 0.04 | 1.78 | 880 | 52.68 | 30.61 | 11.32 | 5.39 | 57.49 |
| 0.09 | 1.78 | 884 | 48.92 | 32.66 | 13.63 | 4.79 | 69.57 |
| 0.13 | 1.78 | 898 | 48.72 | 32.99 | 13.91 | 4.38 | 76.33 |
| 0.18 | 1.78 | 911 | 46.99 | 34.05 | 15.18 | 3.78 | 91.30 |
| 0 | 2.67 | 793 | 56.12 | 26.60 | 5.80 | 11.48 | 25.12 |
| 0.04 | 2.67 | 814 | 51.58 | 29.76 | 9.74 | 8.93 | 35.27 |
| 0.09 | 2.67 | 832 | 48.58 | 31.92 | 12.22 | 7.29 | 45.89 |
| 0.13 | 2.67 | 847 | 43.92 | 34.88 | 15.38 | 5.81 | 62.80 |
| 0.18 | 2.67 | 861 | 44.87 | 34.58 | 15.24 | 5.31 | 67.63 |
| 0.22 | 2.67 | 873 | 43.73 | 35.40 | 16.19 | 4.69 | 78.26 |
| 0.26 | 2.67 | 832 | 42.74 | 36.10 | 16.98 | 4.18 | 89.37 |
| 0 | 3.56 | 716 | 54.96 | 25.24 | 2.14 | 17.67 | 16.43 |
| 0.04 | 3.56 | 744 | 48.15 | 30.10 | 8.21 | 13.54 | 24.64 |
| 0.09 | 3.56 | 767 | 43.77 | 33.35 | 11.94 | 10.94 | 33.33 |
| 0.13 | 3.56 | 788 | 44.63 | 33.15 | 12.17 | 10.04 | 35.75 |
| 0.18 | 3.56 | 806 | 40.20 | 36.13 | 16.14 | 7.54 | 51.69 |
| 0.22 | 3.56 | 822 | 37.91 | 37.91 | 17.63 | 6.56 | 61.84 |
| 0.26 | 3.56 | 837 | 37.75 | 38.29 | 18.30 | 5.66 | 71.50 |
| 0.31 | 3.56 | 850 | 37.59 | 38.54 | 18.90 | 4.98 | 81.64 |
| 0 | 4.45 | 640 | 54.85 | 24.16 | 0.42 | 20.57 | 14.49 |
| 0.04 | 4.45 | 670 | 45.04 | 30.56 | 7.51 | 16.89 | 21.26 |
| 0.09 | 4.45 | 696 | 41.84 | 33.30 | 11.41 | 13.45 | 28.02 |
| 0.13 | 4.45 | 721 | 36.27 | 37.01 | 15.07 | 11.66 | 35.27 |
| 0.18 | 4.45 | 743 | 34.98 | 38.10 | 17.09 | 9.84 | 43.00 |
| 0.22 | 4.45 | 763 | 33.79 | 39.16 | 18.60 | 8.45 | 51.21 |
| 0.26 | 4.45 | 780 | 32.83 | 40.09 | 19.70 | 7.39 | 59.42 |
| 0.31 | 4.45 | 797 | 31.90 | 41.01 | 20.56 | 6.52 | 68.12 |
References
- Ramzan, N.; Ashraf, A.; Naveed, S.; Malik, A. Simulation of hybrid biomass gasification using ASPEN Plus: A comparative performance analysis for food, municipal solid and poultry waste. Biomass Bioenergy 2011, 35, 3962–3969. [Google Scholar] [CrossRef]
- Kuo, P.C.; Wu, W.; Chen, W.H. Gasification performances of raw and torrefied biomass in a downdraft fixed bed gasifier using thermodynamic analysis. Fuel 2014, 117, 1231–1241. [Google Scholar] [CrossRef]
- Megwai, G.U.; Richards, T. A techno-economic analysis of biomass power systems using ASPEN Plus. Int. J. Power Renew. Energy Syst. 2016, 3, 25–36. [Google Scholar]
- Sinha, S.; Jhalani, A.; Ravi, M.R.; Ray, A. Modelling of pyrolysis in wood and sawdust: A review. J. Sol. Energy Soc. India 2000, 10, 41–62. [Google Scholar]
- Kaushal, P.; Tyagi, R. Advanced simulation of biomass gasification in a fluidized bed reactor using ASPEN PLUS. Renewa. Energy 2017, 101, 629–636. [Google Scholar] [CrossRef]
- Latif, A. A Study of the Design of Fluidized Bed Reactors for Biomass Gasification; University of London: London, UK, 1999. [Google Scholar]
- Puig-Arnavat, M.; Bruno, J.C.; Coronas, A. Review and analysis of biomass gasification models. Renew. Sustain. Energy Rev. 2010, 14, 2841–2851. [Google Scholar] [CrossRef]
- Peters, J.F.; Banks, S.W.; Bridgwater, A.V.; Dufour, J. A kinetic reaction model for biomass pyrolysis processes in ASPEN Plus. Appl. Energy 2017, 188, 595–603. [Google Scholar] [CrossRef]
- Parvez, A.M.; Mujtaba, I.M.; Wu, T. Energy, exergy and environmental analyses of conventional, steam and CO2-enhanced rice straw gasification. Energy 2016, 94, 579–588. [Google Scholar] [CrossRef]
- Im-Orb, K.; Simasatitkul, L.; Arpornwichanop, A. Analysis of synthesis gas production with a flexible H2/CO ratio from rice straw gasification. Fuel 2016, 164, 361–373. [Google Scholar] [CrossRef]
- Pfeifer, C.; Puchner, B.; Hofbauer, H. Comparison of dual fluidized bed steam gasification of biomass with and without selective transport of CO2. Chem. Eng. Sci. 2009, 64, 5073–5083. [Google Scholar] [CrossRef]
- Kheawhom, S.; Bumroongsri, P. Modeling of a small-scale biomass updraft gasifier. Chem. Eng. Trans. 2014, 37, 217–222. [Google Scholar]
- Douglas, P.Y.; Young, B.E. Modelling and simulation of an AFBC steam heating plant using ASPEN/SP. Fuel 1991, 70, 145–154. [Google Scholar] [CrossRef]
- Nikoo, M.B.; Mahinpey, N. Simulation of biomass gasification in fluidized bed reactor using ASPEN PLUS. Biomass Bioenergy 2008, 32, 1245–1254. [Google Scholar] [CrossRef]
- Begum, S.; Rasul, M.G.; Akbar, D.; Cork, D. An experimental and numerical investigation of fluidized bed gasification of solid waste. Energies 2014, 7, 43–61. [Google Scholar] [CrossRef]
- Doherty, W.; Reynolds, A.; Kennedy, D. ASPEN PLUS Simulation of Biomass Gasification in A Steam Blown Dual Fluidized Bed; Formatex Research Center: Madrid, Spain, 2013. [Google Scholar]
- Beheshti, S.M.; Ghassemi, H.; Shahsavan-Markadeh, R. Process simulation of biomass gasification in a bubbling fluidized bed reactor. Energy Convers. Manag. 2015, 94, 345–352. [Google Scholar] [CrossRef]
- Shehzad, A.; Bashir, M.J.K.; Sethupathi, S. System analysis for synthesis gas (syngas) production in Pakistan from municipal solid waste gasification using a circulating fluidized bed gasifier. Renew. Sustain. Energy Rev. 2016, 60, 1302–1311. [Google Scholar] [CrossRef]
- Kraussler, M.; Binder, M.; Hofbauer, H. 2250-h long term operation of a water gas shift pilot plant processing tar-rich product gas from an industrial scale dual fluidized bed biomass steam gasification plant. Int. J. Hydrogen Energy 2016, 41, 6247–6258. [Google Scholar] [CrossRef]
- Ahmad, A.A.; Zawawi, N.A.; Kasim, F.H.; Inayat, A.; Khasri, A. Assessing the gasification performance of biomass: A review on biomass gasification process conditions, optimization and economic evaluation. Renew. Sustain. Energy Rev. 2016, 53, 1333–1347. [Google Scholar] [CrossRef]
- Mansaray, K.G.; Al-Taweel, A.M.; Ghaly, A.E.; Hamdullahpur, F.; Ugursal, V.I. Mathematical modeling of a fluidized bed rice husk gasifier: Part I—Model development. Energy Sources 2000, 22, 83–98. [Google Scholar]
- Liu, L.; Huang, Y.; Liu, C. Prediction of rice husk gasification on fluidized bed gasifier based on ASPEN Plus. Bioresources 2016, 11, 2744–2755. [Google Scholar] [CrossRef]
- Begum, S.; Rasul, M.G.; Akbar, D.; Ramzan, N. Performance analysis of an integrated fixed bed gasifier model for different biomass feedstocks. Energies 2013, 6, 6508–6524. [Google Scholar] [CrossRef]
- Lee, J.; Kim, Y.; Lee, W.; Kim, S. Coal-gasification kinetics derived from pyrolysis in a fluidized-bed reactor. Energy 1998, 23, 475–488. [Google Scholar] [CrossRef]
- Matsui, I.; Kunii, D.; Furusawa, T. Study of fluidized bed steam gasification of char by thermogravimetrically obtained kinetics. Chem. Eng. Japan 1985, 18, 105–113. [Google Scholar] [CrossRef]
- Kasaoka, S.; Sakata, Y.; Tong, C. Kinetic evaluation of the reactivity of various coal chars for gasification with carbon dioxide in comparison with steam. Int. Chem. Eng. 1985, 25, 160–175. [Google Scholar] [CrossRef]
- Boerrigter, H.; Rauch, R. Review of Applications of Gases from Biomass Gasification. In The Handbook Biomass Gasification; Knoef, H.A.M., Ed.; The Biomass Technology Group, Energy Research Centre of the Netherlands: Patten, The Netherlands, 2006. [Google Scholar]
- Patel, M.; Zhang, X.; Kumar, A. Techno-economic and life cycle assessment on lignocellulosic biomass thermochemical conversion technologies: A review. Renew. Sustain. Energy Rev. 2016, 53, 1486–1489. [Google Scholar] [CrossRef]


| Reaction | Reaction Name | (kJ/mol) |
|---|---|---|
| Pyrolysis | ||
| Biomass → Char + Tar + Volatiles | Pyrolysis reaction | |
| Combustion | ||
| C + 0.5O2 → CO | Partial combustion reaction | −111 |
| C + O2 → CO2 | Total combustion reaction | −394 |
| CO + 0.5O2 → CO2 | Carbon monoxide combustion reaction | −283 |
| Reduction | ||
| C + CO2 → 2CO | Boudouard reaction | +172 |
| C + H2O → H2 + CO | Steam-carbon reaction | +131 |
| C + 2H2 → CH4 | Hydrogasification | −74.8 |
| CO + H2O → H2 + CO2 | Water-gas-shift reaction | −41.2 |
| CO + 3H2 → CH4 + H2O | Methanation reaction | −206 |
| Biomass Feedstock | ||
| Proximate analysis | ||
| - Moisture | wt. % | 8 |
| - Volatile matter | wt. % dry basis | 82.29 |
| - Fixed carbon | wt. % dry basis | 17.16 |
| - Ash | wt. % dry basis | 0.55 |
| Ultimate analysis | ||
| - C | wt. % dry basis | 50.54 |
| - H | wt. % dry basis | 7.08 |
| - O | wt. % dry basis | 41.11 |
| - N | wt. % dry basis | 0.15 |
| - S | wt. % dry basis | 0.55 |
| - Ash | wt. % dry basis | 0.57 |
| Flow rate | kg/h | 0.445–0.512 |
| Air Feedstock | ||
| Temperature | °C | 65 |
| Flow rate | Nm3/h | 0.5–0.7 |
| Steam Feedstock | ||
| Temperature | °C | 145 |
| Flow rate | kg/h | 0–1.8 |
| Operating Condition | ||
| Temperature | °C | 700–900 |
| Pressure | atm | 1 |
| Set of Operating Condition | Result Source | Root Mean Square Error (RMSE) | |||
|---|---|---|---|---|---|
| H2 | CO2 | CO | CH4 | ||
| Gas composition versus temperature | Nikoo & Mahinpey | 0.3606 | 0.3009 | 0.1044 | 0.2152 |
| This work | 0.1541 | 0.1225 | 0.0498 | 0.2076 | |
| % Reduction | 57.26 | 58.48 | 52.30 | 3.53 | |
| Gas composition versus ER | Nikoo & Mahinpey | 0.1981 | 0.2308 | 0.0939 | 0.1997 |
| This work | 0.0357 | 0.0496 | 0.0357 | 0.0567 | |
| % Reduction | 81.99 | 78.51 | 61.98 | 71.61 | |
| Gas composition versus SB ratio | Nikoo & Mahinpey | 0.2045 | 0.2382 | 0.1143 | 0.2712 |
| This work | 0.0552 | 0.1030 | 0.0552 | 0.1496 | |
| % Reduction | 73.01 | 56.76 | 51.71 | 44.84 | |
© 2017 by the authors. Licensee MDPI, Basel, Switzerland. This article is an open access article distributed under the terms and conditions of the Creative Commons Attribution (CC BY) license ( http://creativecommons.org/licenses/by/4.0/).
Share and Cite
Suwatthikul, A.; Limprachaya, S.; Kittisupakorn, P.; Mujtaba, I.M. Simulation of Steam Gasification in a Fluidized Bed Reactor with Energy Self-Sufficient Condition. Energies 2017, 10, 314. https://doi.org/10.3390/en10030314
Suwatthikul A, Limprachaya S, Kittisupakorn P, Mujtaba IM. Simulation of Steam Gasification in a Fluidized Bed Reactor with Energy Self-Sufficient Condition. Energies. 2017; 10(3):314. https://doi.org/10.3390/en10030314
Chicago/Turabian StyleSuwatthikul, Ajaree, Siripong Limprachaya, Paisan Kittisupakorn, and Iqbal Mohammed Mujtaba. 2017. "Simulation of Steam Gasification in a Fluidized Bed Reactor with Energy Self-Sufficient Condition" Energies 10, no. 3: 314. https://doi.org/10.3390/en10030314