Article

Implementation and Assessment of a Decentralized Load Frequency Control: Application to Power Systems with High Wind Energy Penetration

by
Irene Muñoz-Benavente
1,†,
Emilio Gómez-Lázaro
2,†,
Tania García-Sánchez
2,†,
Antonio Vigueras-Rodríguez
3,† and
Angel Molina-García
1,*,†
1
Department of Electrical Engineering, Universidad Politécnica de Cartagena, 30202 Cartagena, Spain
2
Renewable Energy Research Institute and DIEEAC/EDII-AB, Universidad de Castilla-La Mancha, 02071 Albacete, Spain
3
Department of Civil Engineering, Universidad Politécnica de Cartagena, 30202 Cartagena, Spain
*
Author to whom correspondence should be addressed.
These authors contributed equally to this work.
Energies 2017, 10(2), 151; https://doi.org/10.3390/en10020151
Submission received: 12 October 2016 / Revised: 29 November 2016 / Accepted: 13 December 2016 / Published: 24 January 2017
(This article belongs to the Collection Smart Grid)

Abstract

:
This paper describes and assesses a decentralized solution based on a wireless sensor-actuator network to provide primary frequency control from demand response in power systems with high wind energy penetration and, subsequently, with relevant frequency excursions. The proposed system is able to modify the electrical power demand of a variety of thermostatically-controlled loads, maintaining minimum comfort levels and minimizing both infrastructure requirements and primary reserves from the supply side. This low-cost hardware solution avoids any additional wiring, extending the wireless sensor-actuator network technology towards small customers, which account for over a 30% share of the current power demand. Frequency excursions are collected by each individual load controller, considering not only the magnitude of the frequency deviation, but also their evolution over time. Based on these time-frequency excursion characteristics, controllers are capable of modifying the power consumption of thermostatically-controlled loads by switching them off and on, thus contributing to primary frequency control in power systems with higher generation unit oscillations as a consequence of relevant wind power integration. Field tests have been carried out in a laboratory environment to assess the load controller performance, as well as to evaluate the electrical and thermal response of individual loads under frequency deviations. These frequency deviations are estimated from power systems with a high penetration of wind energy, which are more sensitive to frequency oscillations and where demand response can significantly contribute to mitigate these frequency excursions. The results, also included in the paper, evaluate the suitability of the proposed load controllers and their suitability to decrease frequency excursions from the demand side in a decentralized manner.

1. Introduction

Maintaining the balance between power generation and demand is a key issue in power system operation. Frequency deviations are a remarkable indicator of this imbalance and might threaten the stability and reliability of power systems. Ideally, the supply side and demand side can equally participate in the frequency control. However, the automatic governors of conventional generators have traditionally performed a real-time power balance to deal with any frequency deviation, using the demand side response to restore this balance only under severe instability conditions. Some authors suggest that controlling the load may be the single largest untapped resource currently available to the electricity industry [1]. Having many small loads participating as suppliers, as well as consumers, of electricity services improves resource utilization, thus releasing generating capacity. Actually, some authors affirm that the modern power system is becoming a typical cyber physical system, which is a hybrid autonomous heterogeneous system with deep integration of information with the physical world [2]. Nevertheless, this demand side resource presents several drawbacks, such as the complexity of the real-time monitoring of a great amount of small distributed loads, the concern for customers’ comfort and the high cost involved. In this framework, it is thus necessary to study how a relevant proportion of customer loads can assume a more active role in Primary Frequency Control (PFC) to maintain power system stability under suitable conditions. Any load that inherently has some thermal storage during its process is a good candidate (e.g., water pumping, building temperature control, hot water heaters and air compressors). In fact, some authors consider that approximately 40% of residential appliances are compatible with the proposed load control contribution [3].
Solutions of customer load control to provide primary frequency response have been discussed during the last few decades. Schweppe et al. originally suggested this idea in 1980 [4], proposing a faster supply-demand balancing by employing “governor-type” action on certain types of loads. A Frequency Adaptive Power Energy Rescheduler (FAPER) is used to assist conventional turbine-governed systems and spinning reserve by switching off, and back on, significant energy consuming loads as a function of its ability to provide energy. An example of such loads would be an electric melt pot in a processing plant or, on a residential scale, an electric heating or hot water system. Oak Ridge National Laboratory (ORNL) conducted research for the U.S. Department of Energy based on the use of controllable loads to increase system security. The proposal is supported by a pager-controlled switch, attached to the consumer appliances, which could be used to provide a load reduction response within a 10-min interval [5]. In the UK, the National Grid company (NG) introduced a methodology for Frequency Response by Demand Management (FCDM), consisting of a commercial frequency response service through the automatic disconnection of agreed large customer loads via low frequency-sensitive relays [6]. The Pacific Northwest National Laboratory (PNNL) developed a device called the “Grid Friendly Controller” that helps the power system be secure and reliable by monitoring extremely low-frequency signatures and turning off certain appliances, such as refrigerators, air-conditioners and heaters [7,8]. Another similar prototype was commercially promoted by Responsive Load Ltd (London, UK). In this case, a frequency-dependent load controller similar to the FAPER is developed by using multiple frequency limits to affect the probability of switching off the controlled loads [9]. Both Comverge (Norcross, GA, USA) and Econnect Ltd (London, UK) proposed intelligent load controllers respectively. Comverge’s “Intelligent Demand” solutions provide cost-effective and efficient means of decreasing the power demand during grid peak periods. Econnect’s devices monitor frequency variations in small power grids with high wind energy penetration using fuzzy logic to switch off (on) resistive loads (such as water heating) in order to maintain the frequency stability [10]. This approach was tested on an island power system with a small number of water heating loads [11,12]. Trudnowski et al. proposed a much more active role for intelligent loads, specifically related to frequency control and dynamic stability. A simple and optimal control strategy is discussed to modulate the customer load as a linear function of the frequency excursions [13]. Short et al. analyzed in [14] how a certain degree of frequency stability could be provided by incorporating dynamic demand controllers into fridges/freezers. These devices monitor the grid frequency and switch off (on) appliances accordingly, while achieving a trade-off between appliance requirements and the grid. The utility of increasing the proportion of such loads in power systems with high wind energy penetration is also discussed. Kondoh et al. also studied the possibility of providing aggregated frequency regulation services with small and deferrable loads, such as electric water heaters and storage systems in [15] and water heaters or air conditioners in [16]. In [17], the Lawrence Berkeley National Laboratory (LBNL) reported the results of a pilot project called “Demand Response Spinning Reserve”. A signal from the central control system is sent by radio signals to the demand side in order to trigger load shedding in real time. This solution provided a high system reliability, a significant rolling blackout prevention and low operating costs. The use of Demand as Frequency Controlled Reserve (DFCR) has been studied in detail, revealing a reliable performance for frequency control purposes. Indeed, this concept of DFCR, which means utilizing electric loads to shift their power consumption in time, is discussed in [18]. Two different types of control logics are proposed, tested on the island of Bornholm (Denmark). Results and conclusions are summarized in [19]. Samarakoon et al. describe a load blocking scheme based on smart meters [20], to provide primary frequency response using local frequency measurements. In [21,22], an experimental rig is developed, using commercially available smart meters and remotely-controlled smart sockets, with the aim of testing and evaluating this load control scheme. Finally, there is widespread interest discovering whether these power loads can actively participate in handling the emergency situations of a power system, such as the frequency stability issue at the second or millisecond level [23].
In line with [24], the participation of a large number of individual decentralized load controllers mitigates the primary reserve problem from the supply side. In addition, the aggregated behavior in frequency control is close to that of conventional synchronous generators, guarantying the stability of the power system. Nevertheless, the fact that the demand side response will always remain uncertain, in magnitude and rate of response, requires the system operator to use caution when replacing generation-based primary reserve with active demand side primary reserve. From these previous contributions, this paper is focused on describing and assessing an innovative decentralized system to provide primary frequency response on thermostatically-controlled residential loads. The novel contribution of this paper is based on the load controller performance, which considers not only the magnitude of the frequency deviation, but also its evolution over time. As can be seen from Figure 1, the time variable is included in the proposed load controller with the aim of emulating the “governor-type” responses from the demand side under frequency excursions. The load controllers are able to autonomously manage the power demand in a decentralized manner. Additionally, load controllers can also be considered as nodes capable of gathering and processing surrounding information with low power consumption and cost through a Wireless Sensor-Actuator Network (WSAN). The proposed solution is implemented by using low-cost hardware requirements, avoiding any additional wiring and offering a flexible and reliable network configuration. The controllers have been tested in a laboratory environment and the results for thermostatically-controlled loads are also included in this paper.
The paper is organized as follows: Section 2 provides a discussion in detail about the proposed solution, from both the hardware and software points of view. The test laboratory environment and results considering frequency excursions from power systems with high wind power penetration are given in Section 3, including thermal and electrical data collected from thermostatically-controlled loads. Finally, the conclusion is given in Section 4.

2. Proposed System

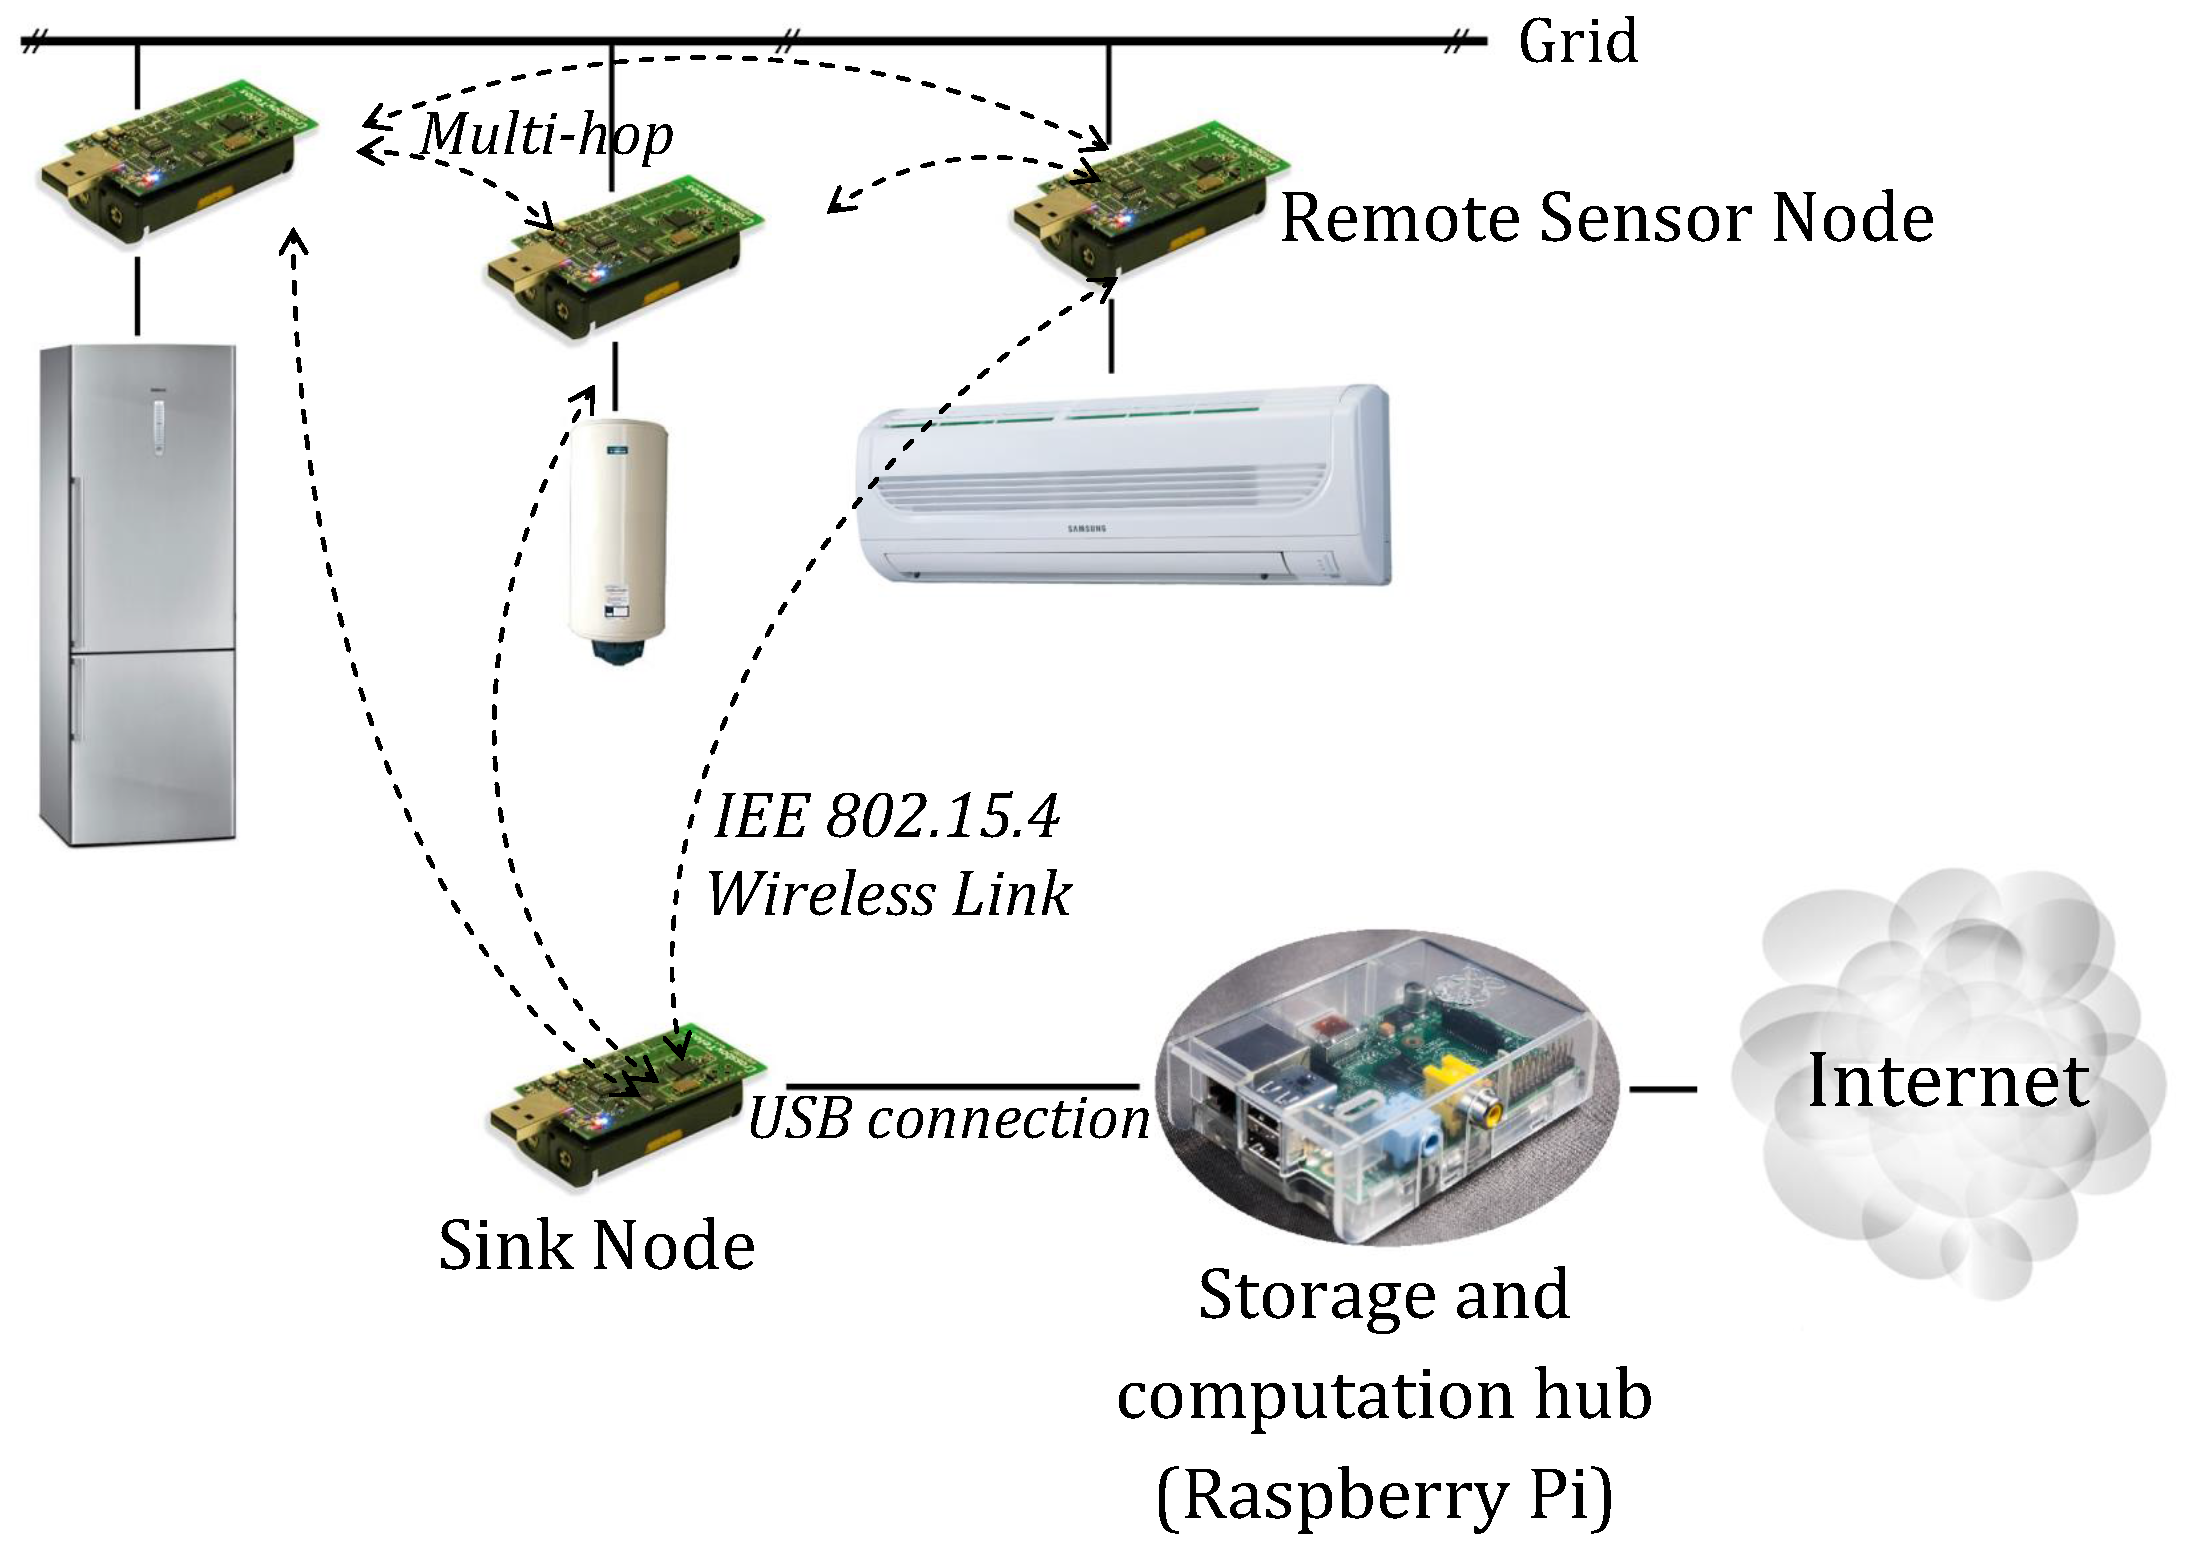
2.1. General Description

The proposed system is based on a decentralized set of sensor/actuator nodes connected to thermostatically-controlled residential loads. These nodes are able to switch off (on) the individual loads by means of a solid-state relay included in the load controller and according to the corresponding Δ f -time relation shown in Figure 1. This decentralized solution removes the need for any type of communication infrastructure. In fact, the disconnection and connection decisions are made autonomously, and thus, the interruption of data transmission will affect the gathering process, but not the performance of the decentralized control scheme. For the sake of supplementary issues, such as parameters setting, the sensor nodes are all linked to the same wireless network and, in turn, to a central system, responsible for collecting all of the information they gather. In this manner, a wireless communication infrastructure based on a multi-hop, self-configuring and self-healing mesh protocol, which monitors the whole system, is at our disposal, if needed; see the dotted lines in Figure 2. Communication networks, especially wireless networks, are unreliable because of time delays, packet losses and random communication failures. Recent contributions can be found in the specific literature to mitigate this problem. In [25], both packet losses and communication failures are modeled as communication topology changes, proposing an alternative closed-loop power system model to integrate the communication topology changes into the physical dynamics in smart grids. From the supply side, [26] investigates the modeling and stability analysis of the automatic generation control of smart grids for which cognitive radio networks are used as the infrastructure for the aggregation and communication of both system-wide information and local measurement data. A general scheme of the proposed wireless network configuration is shown in Figure 2. As can be seen, the configuration of this WSAN can involve one or more sink nodes (also called base stations), a set of sensor/actuator nodes, a wireless link and an end-user, to interact with the loads and the system in case it is required. Sensor/actuator nodes basically consist of an RF transceiver, an internal memory, a sensor-actuator component and a power supply. Electrical and thermal data can be sent from these nodes to the sink node (or gateway) for data collection, analysis and logging purposes. Sink nodes are based on a common PC or embedded system, without critical constraints of size or power consumption. The wireless network protocol is based on the well-known standard 802.15.4-ZigBee [27].

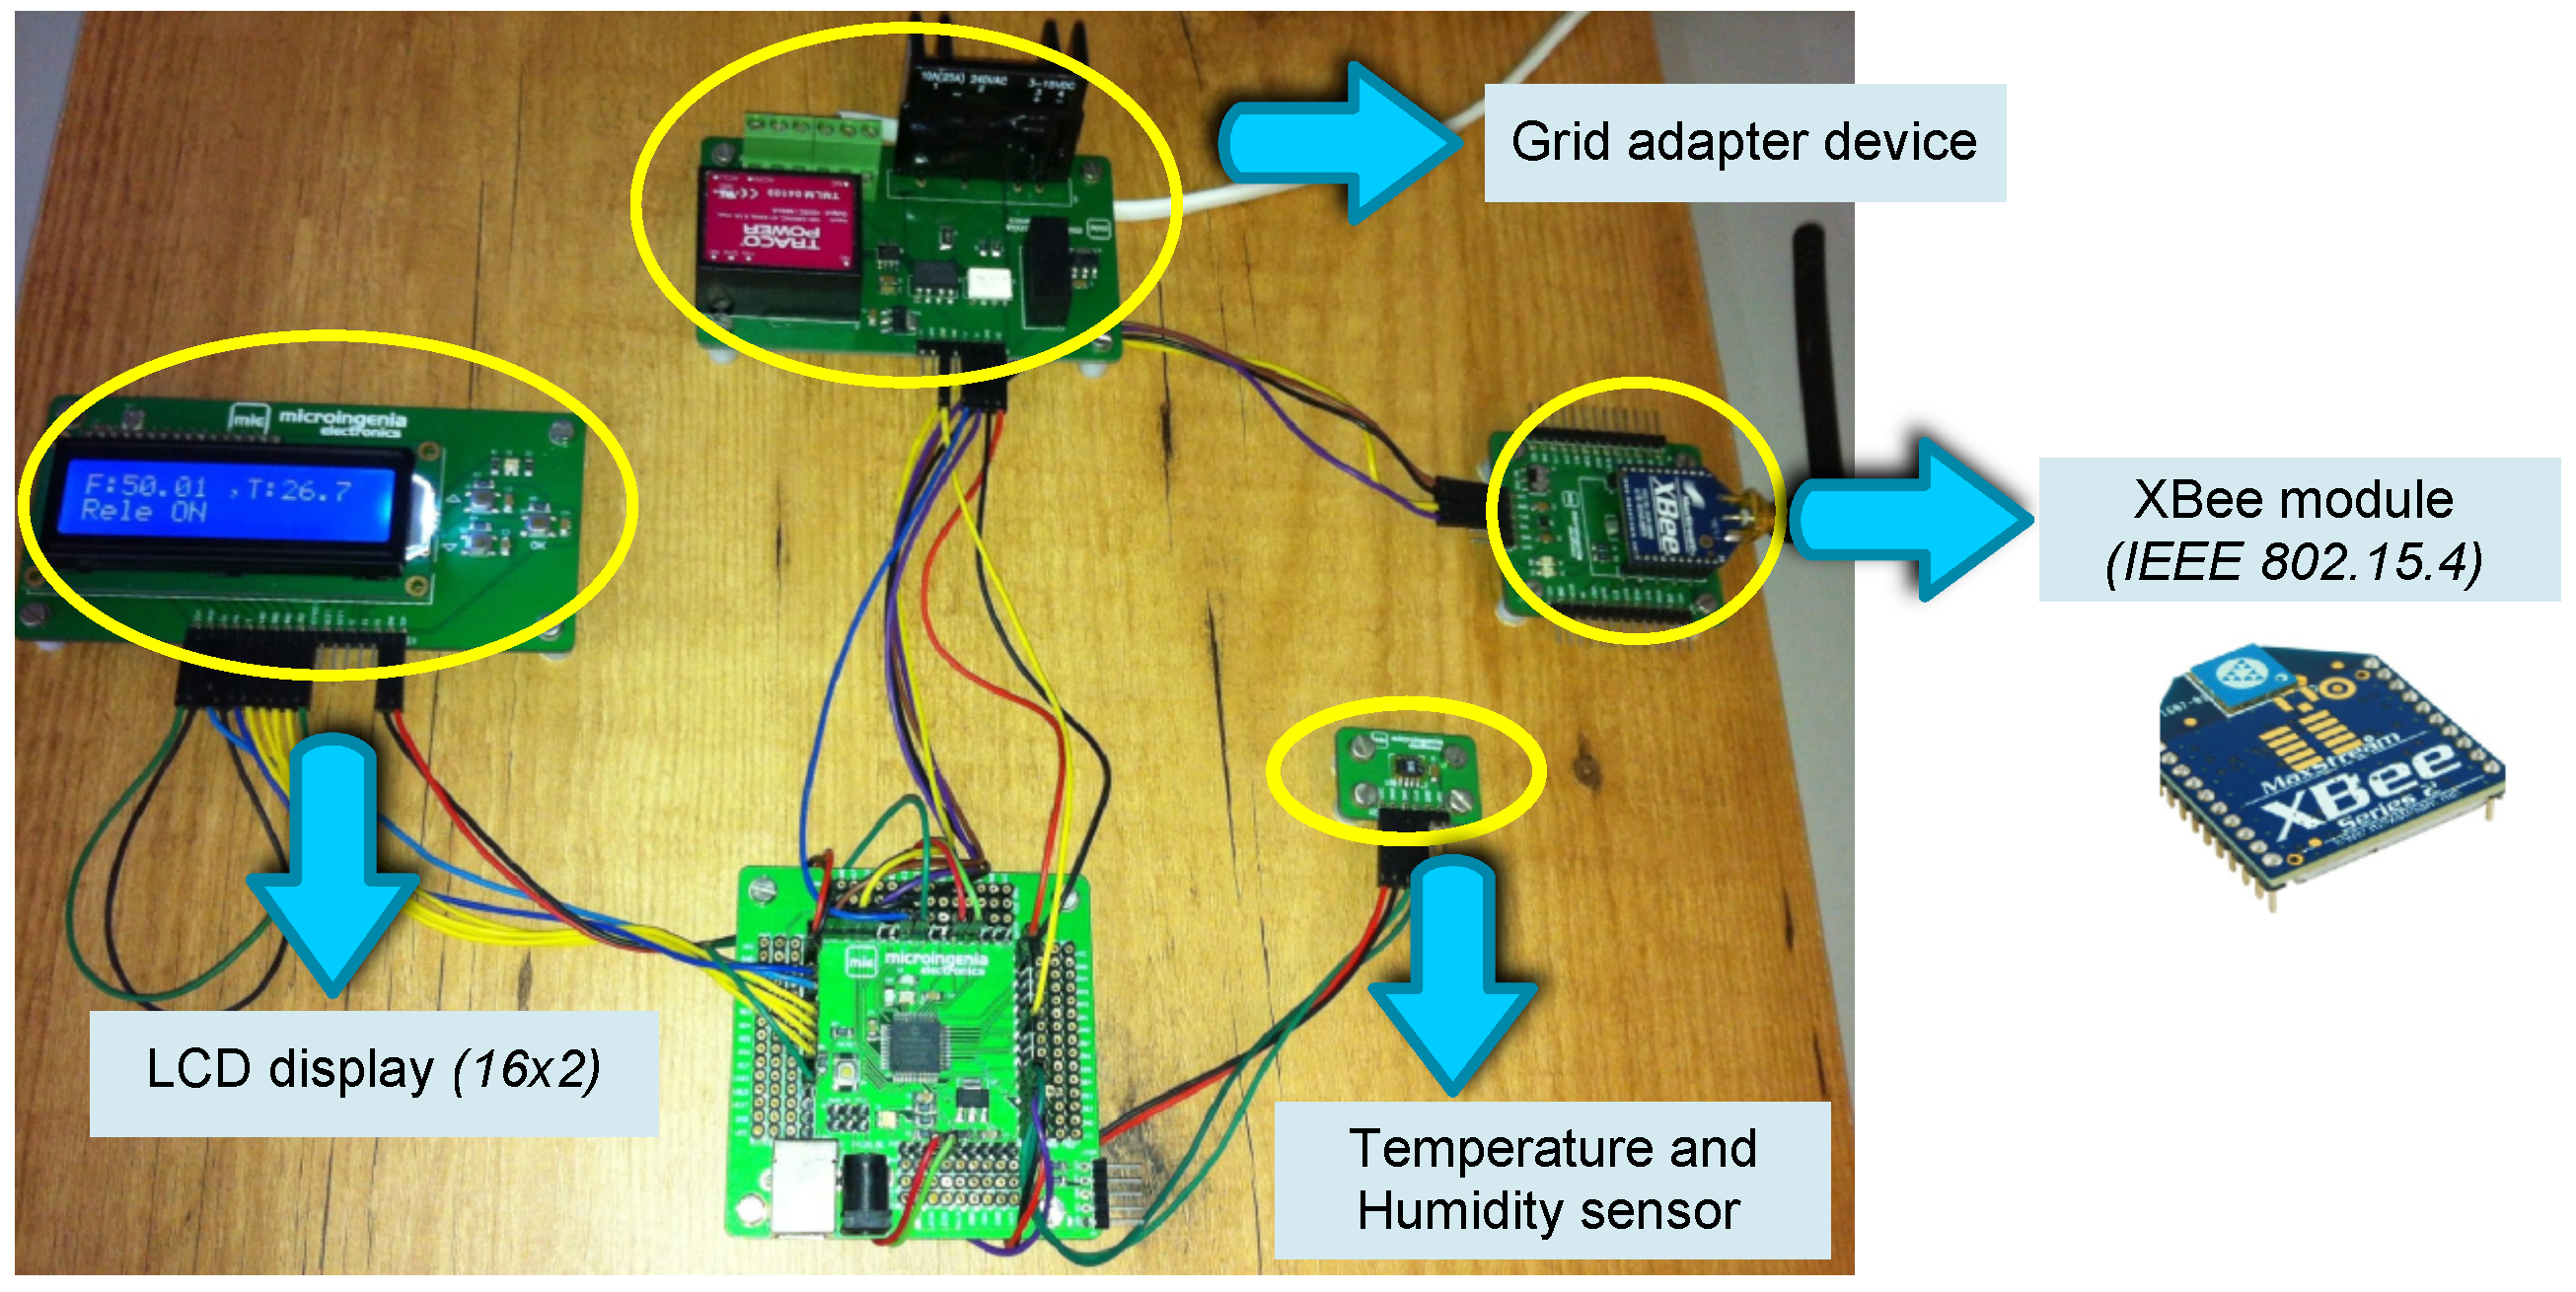
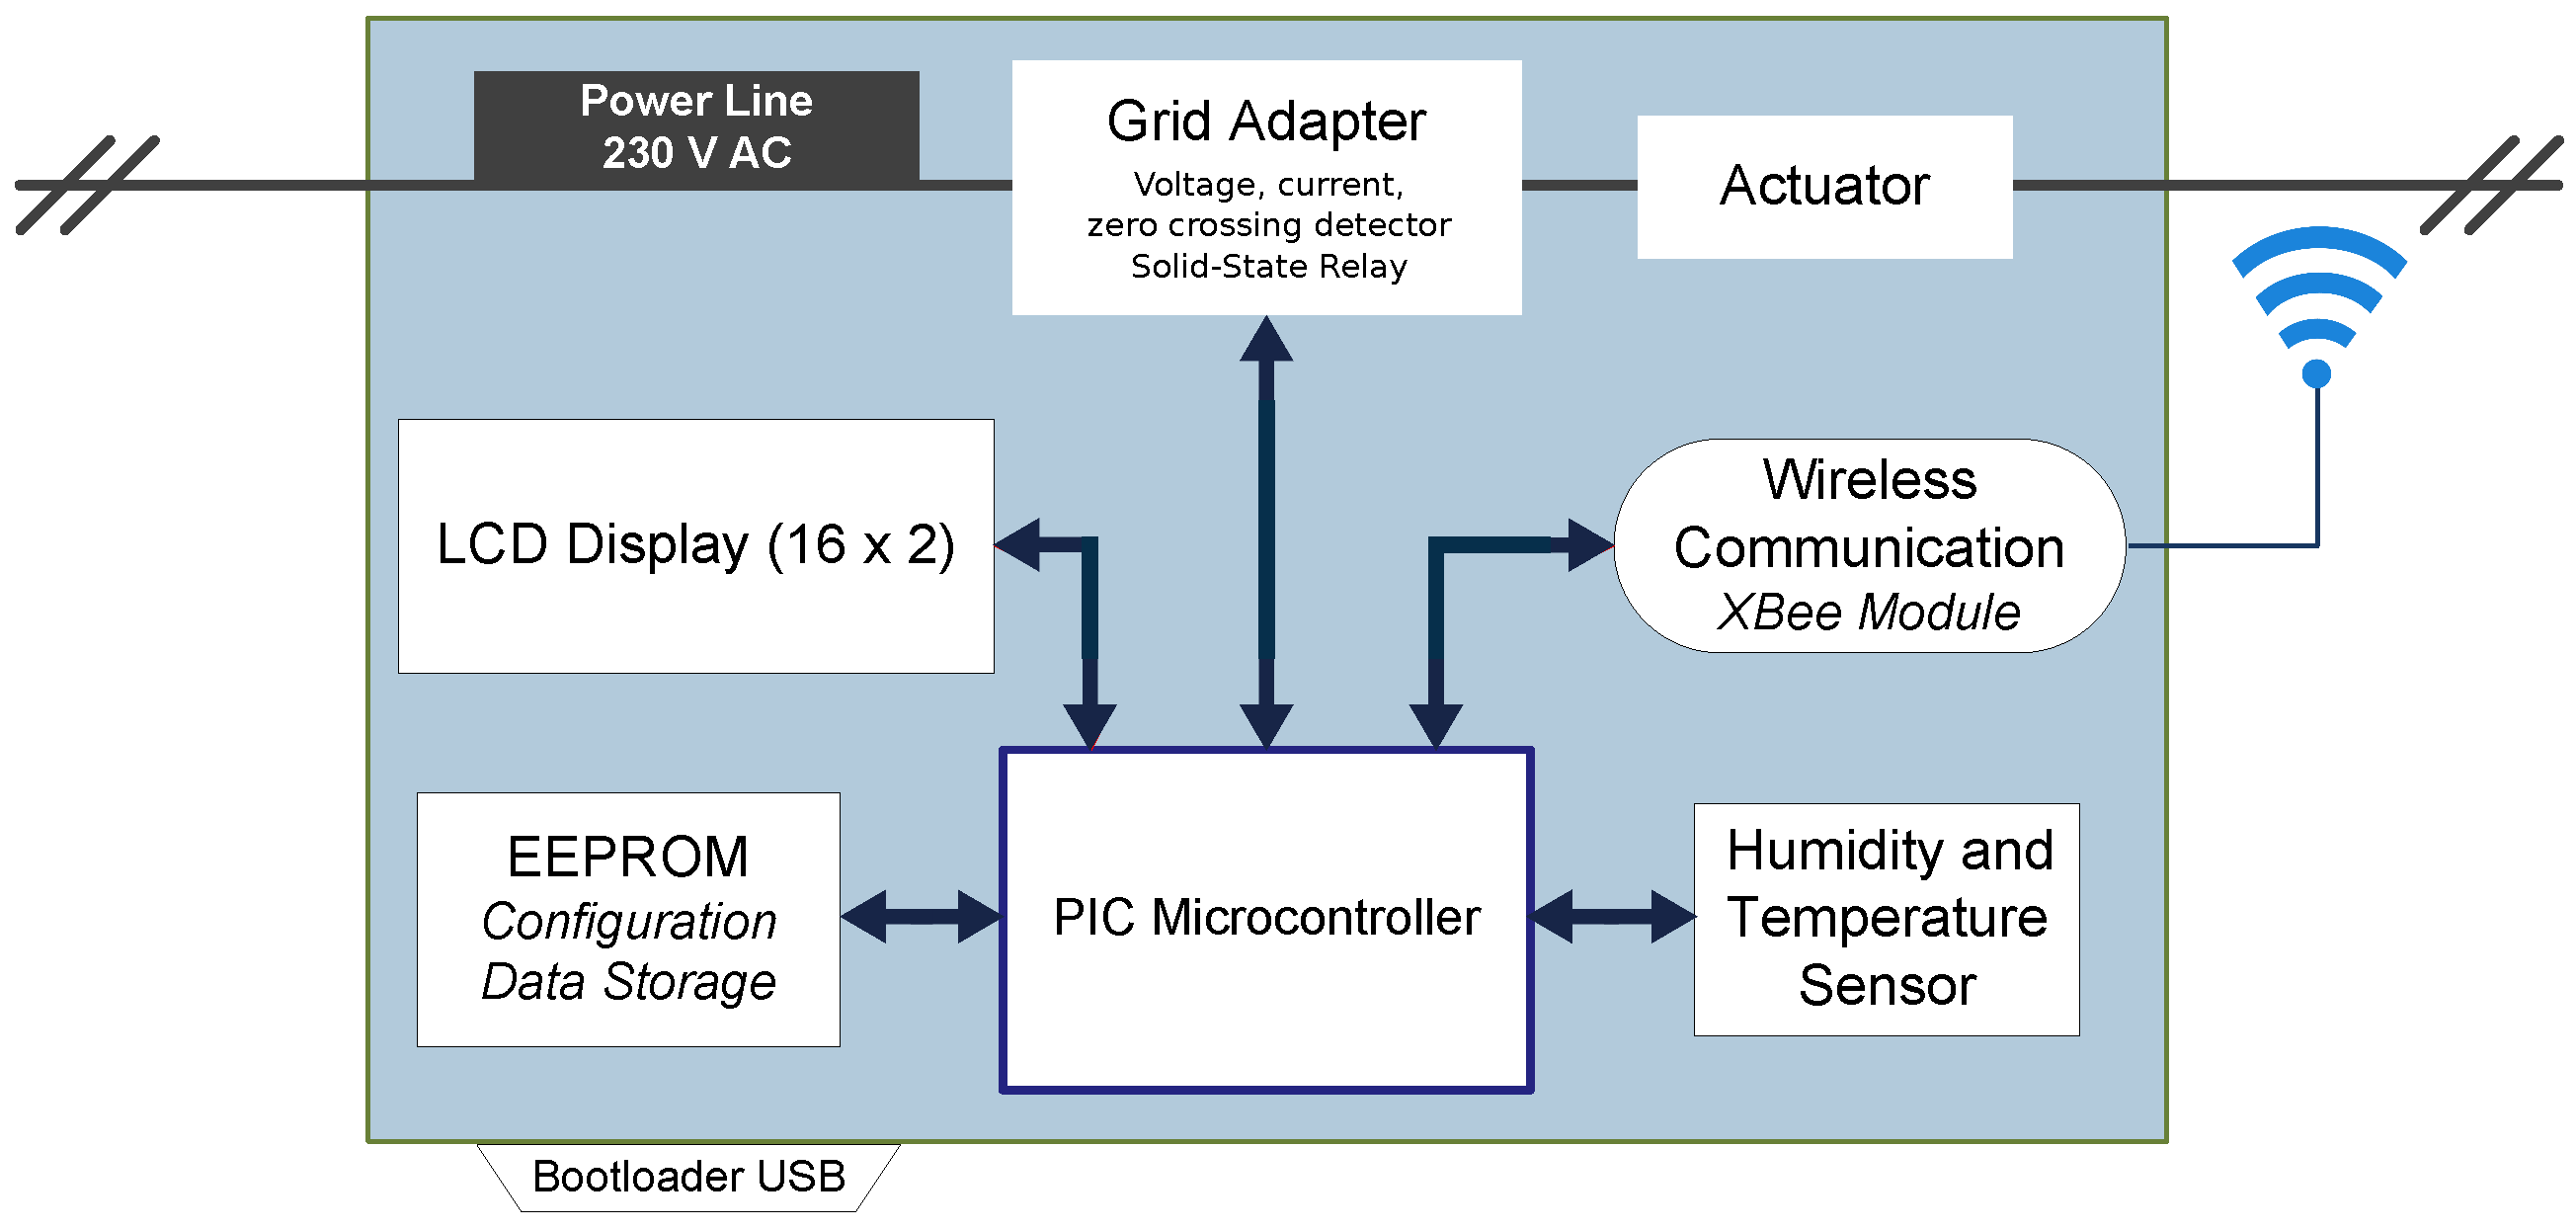
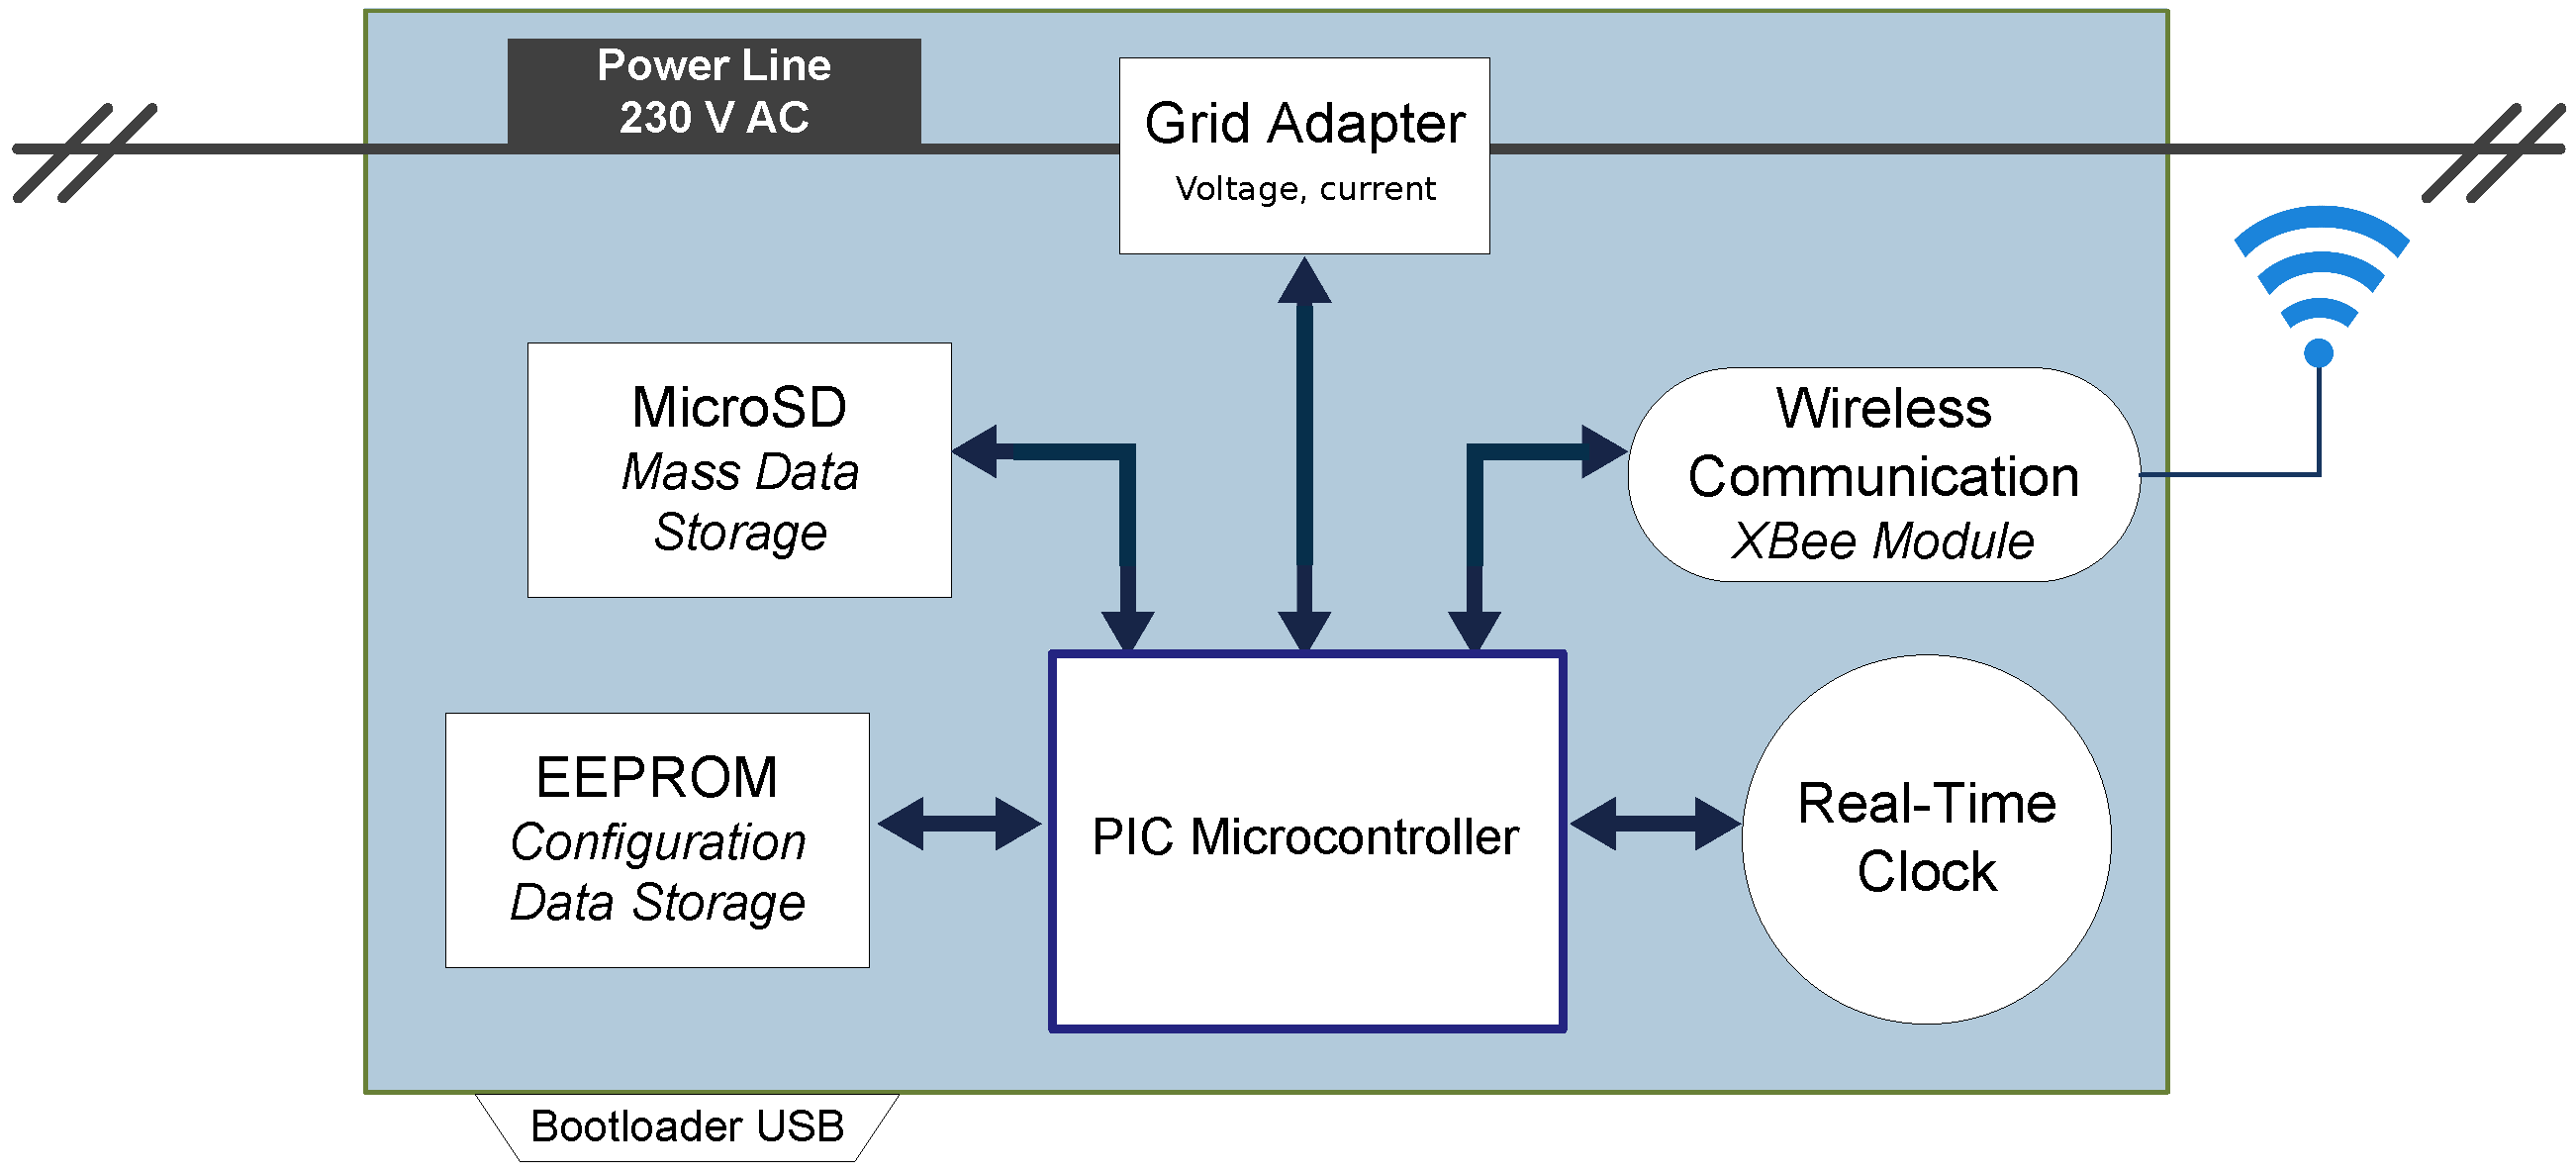
2.2. Load Controller Hardware Description

For our purposes, an innovative prototype of sensor/actuator nodes has been developed, based on commercially available Telos-B motes; for the schematic depiction, see Figure 3. A voltage transformer, toroidal MCFM32/12 from Multicomp, is required to obtain conditioned AC signals as suitable Telos-B inputs. Additionally, a Sensirion SHT15 [28] is included to collect environmental variables, such as temperature and humidity data. An actuator consisting of a solid-state relay is able to switch off (on) the individual controlled loads according to the Δ f -time characteristic, previously programmed, and the evolution of the estimated grid frequency excursions over time. Sensor/actuator nodes also offer communication via the XBee module, EEPROM for configuration data storage, analog-to-digital converter and PC communication via USB. An LCD display is also available in the prototype, offering data related to the estimated grid frequency, environmental temperature measurements, as well as the relay status. With regard to the sink nodes, they also incorporate MicroSD mass data storage and a real-time clock; see Figure 4. The aforesaid wireless network infrastructure is based on the IEEE 802.15.4 standard for low-rate, Wireless Personal Area Networks (WPANs), operating at 2.4 GHz with a basic bit rate of 250 kbps. Figure 5 shows a general overview of the proposed solution, including sensor nodes and the sink node. To enable configuration and interaction with nodes, two Graphical User Interfaces (GUIs) are provided: the sink node console and the meter node console. Setting up nodes, modifying and verifying configuration data and reading the collected electrical and environmental data stored on the MicroSD are some of the tasks that can be carried out through these interfaces.

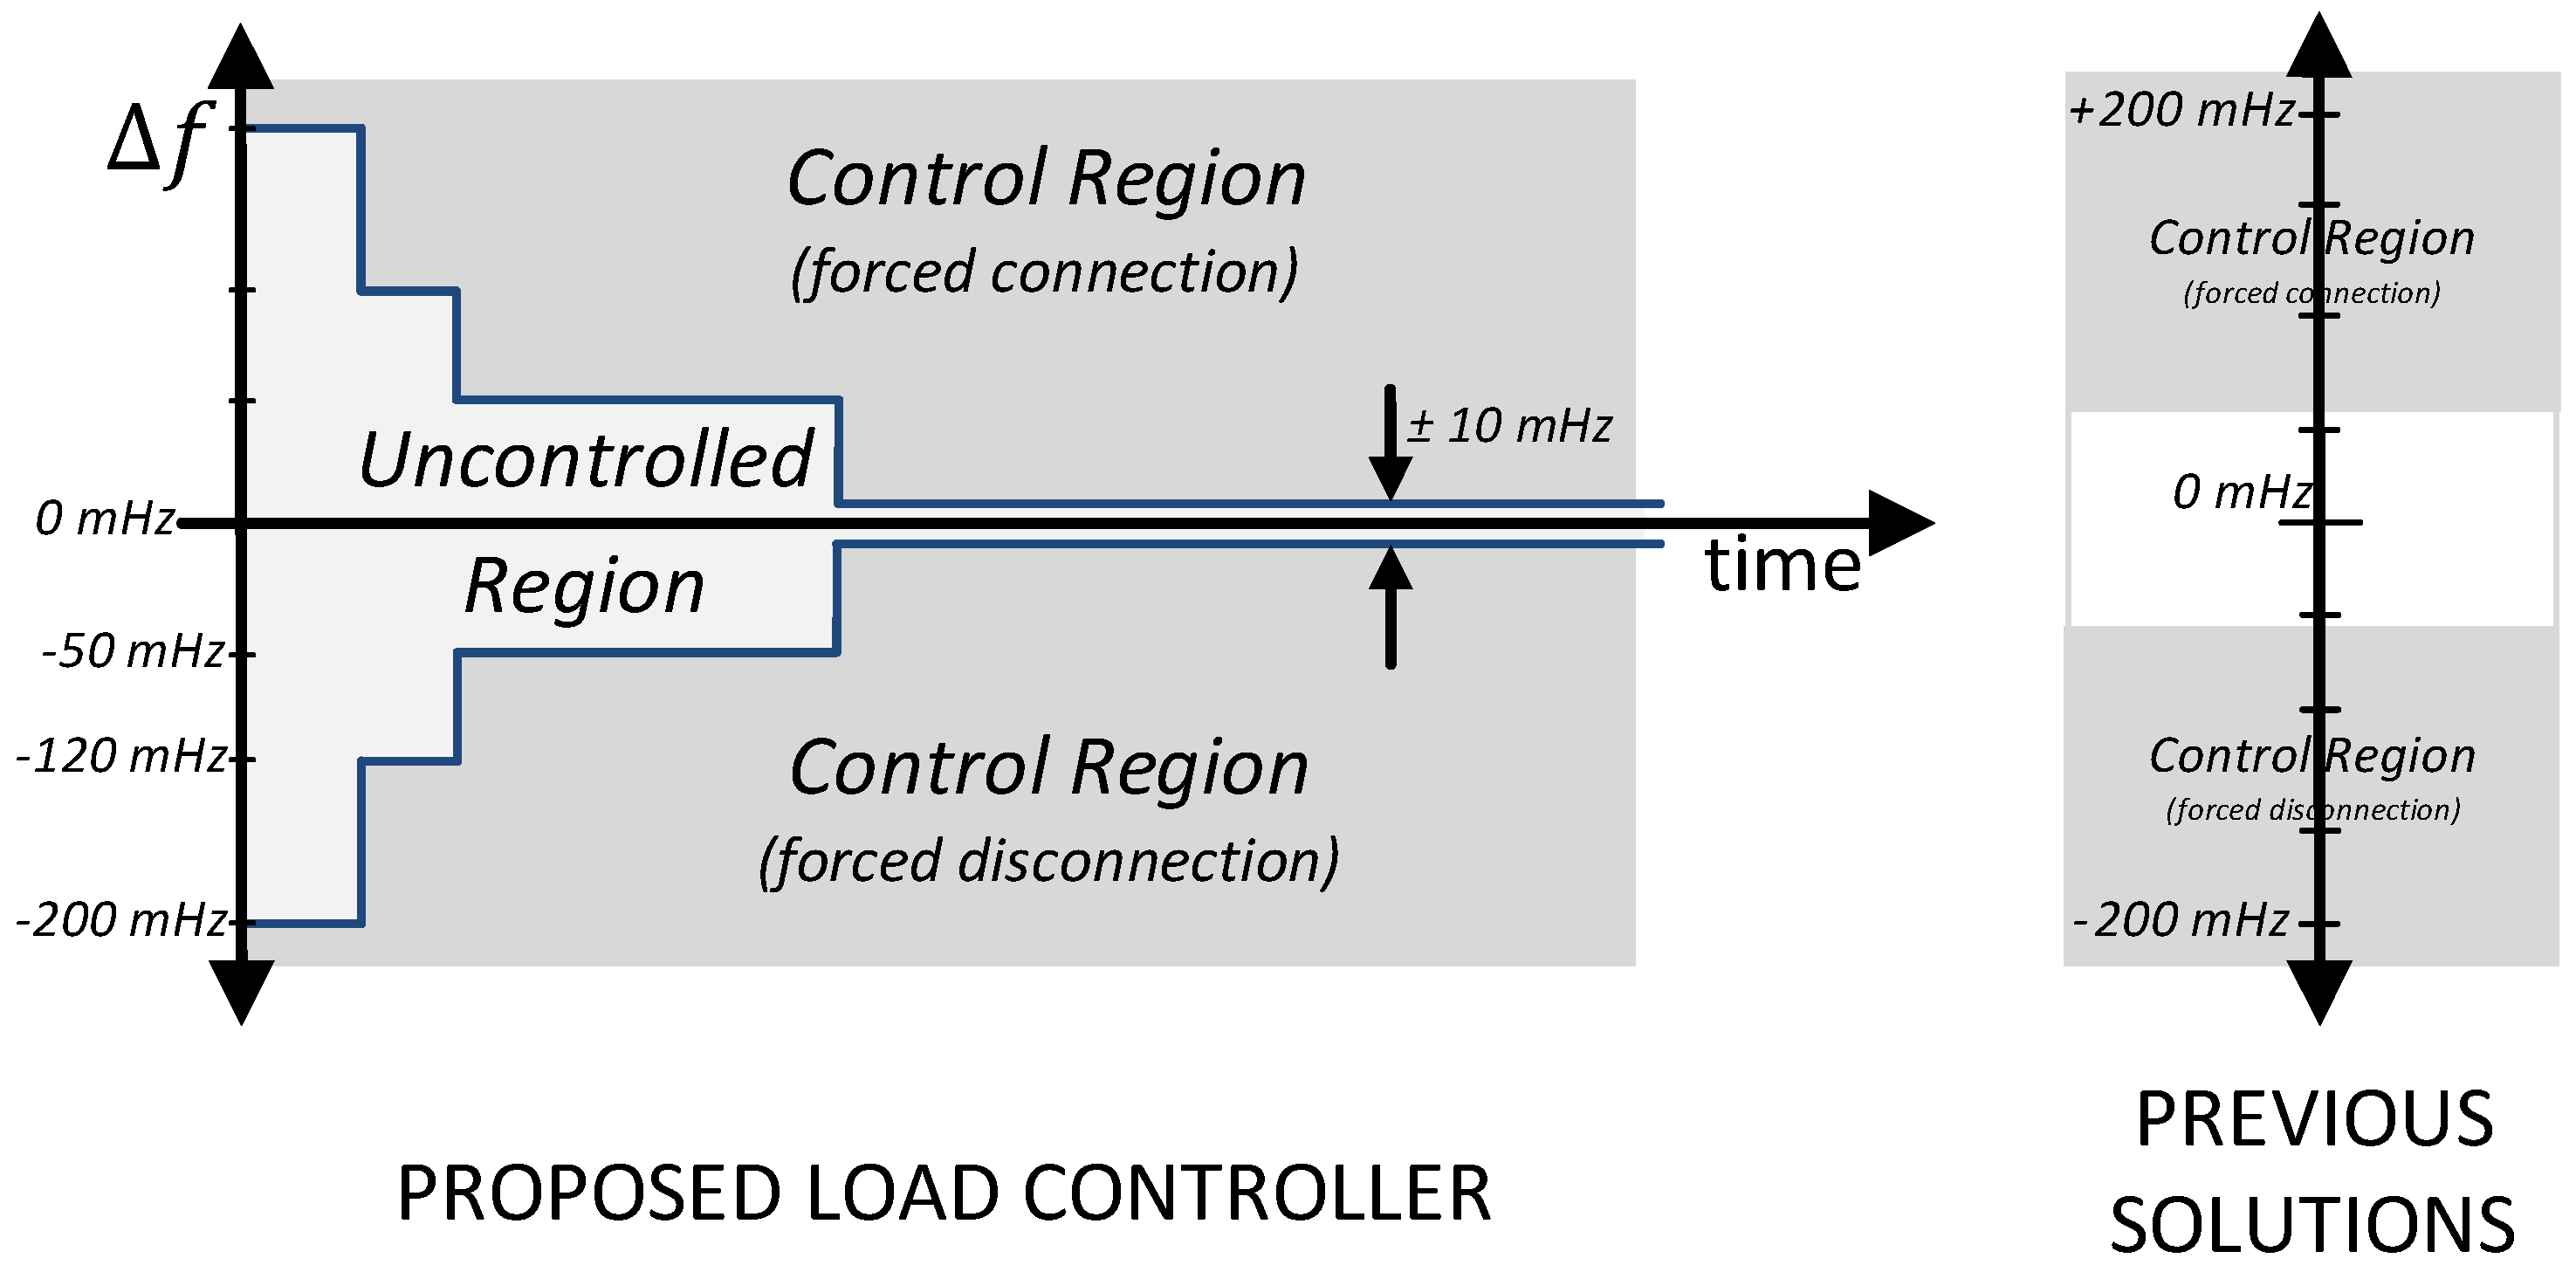
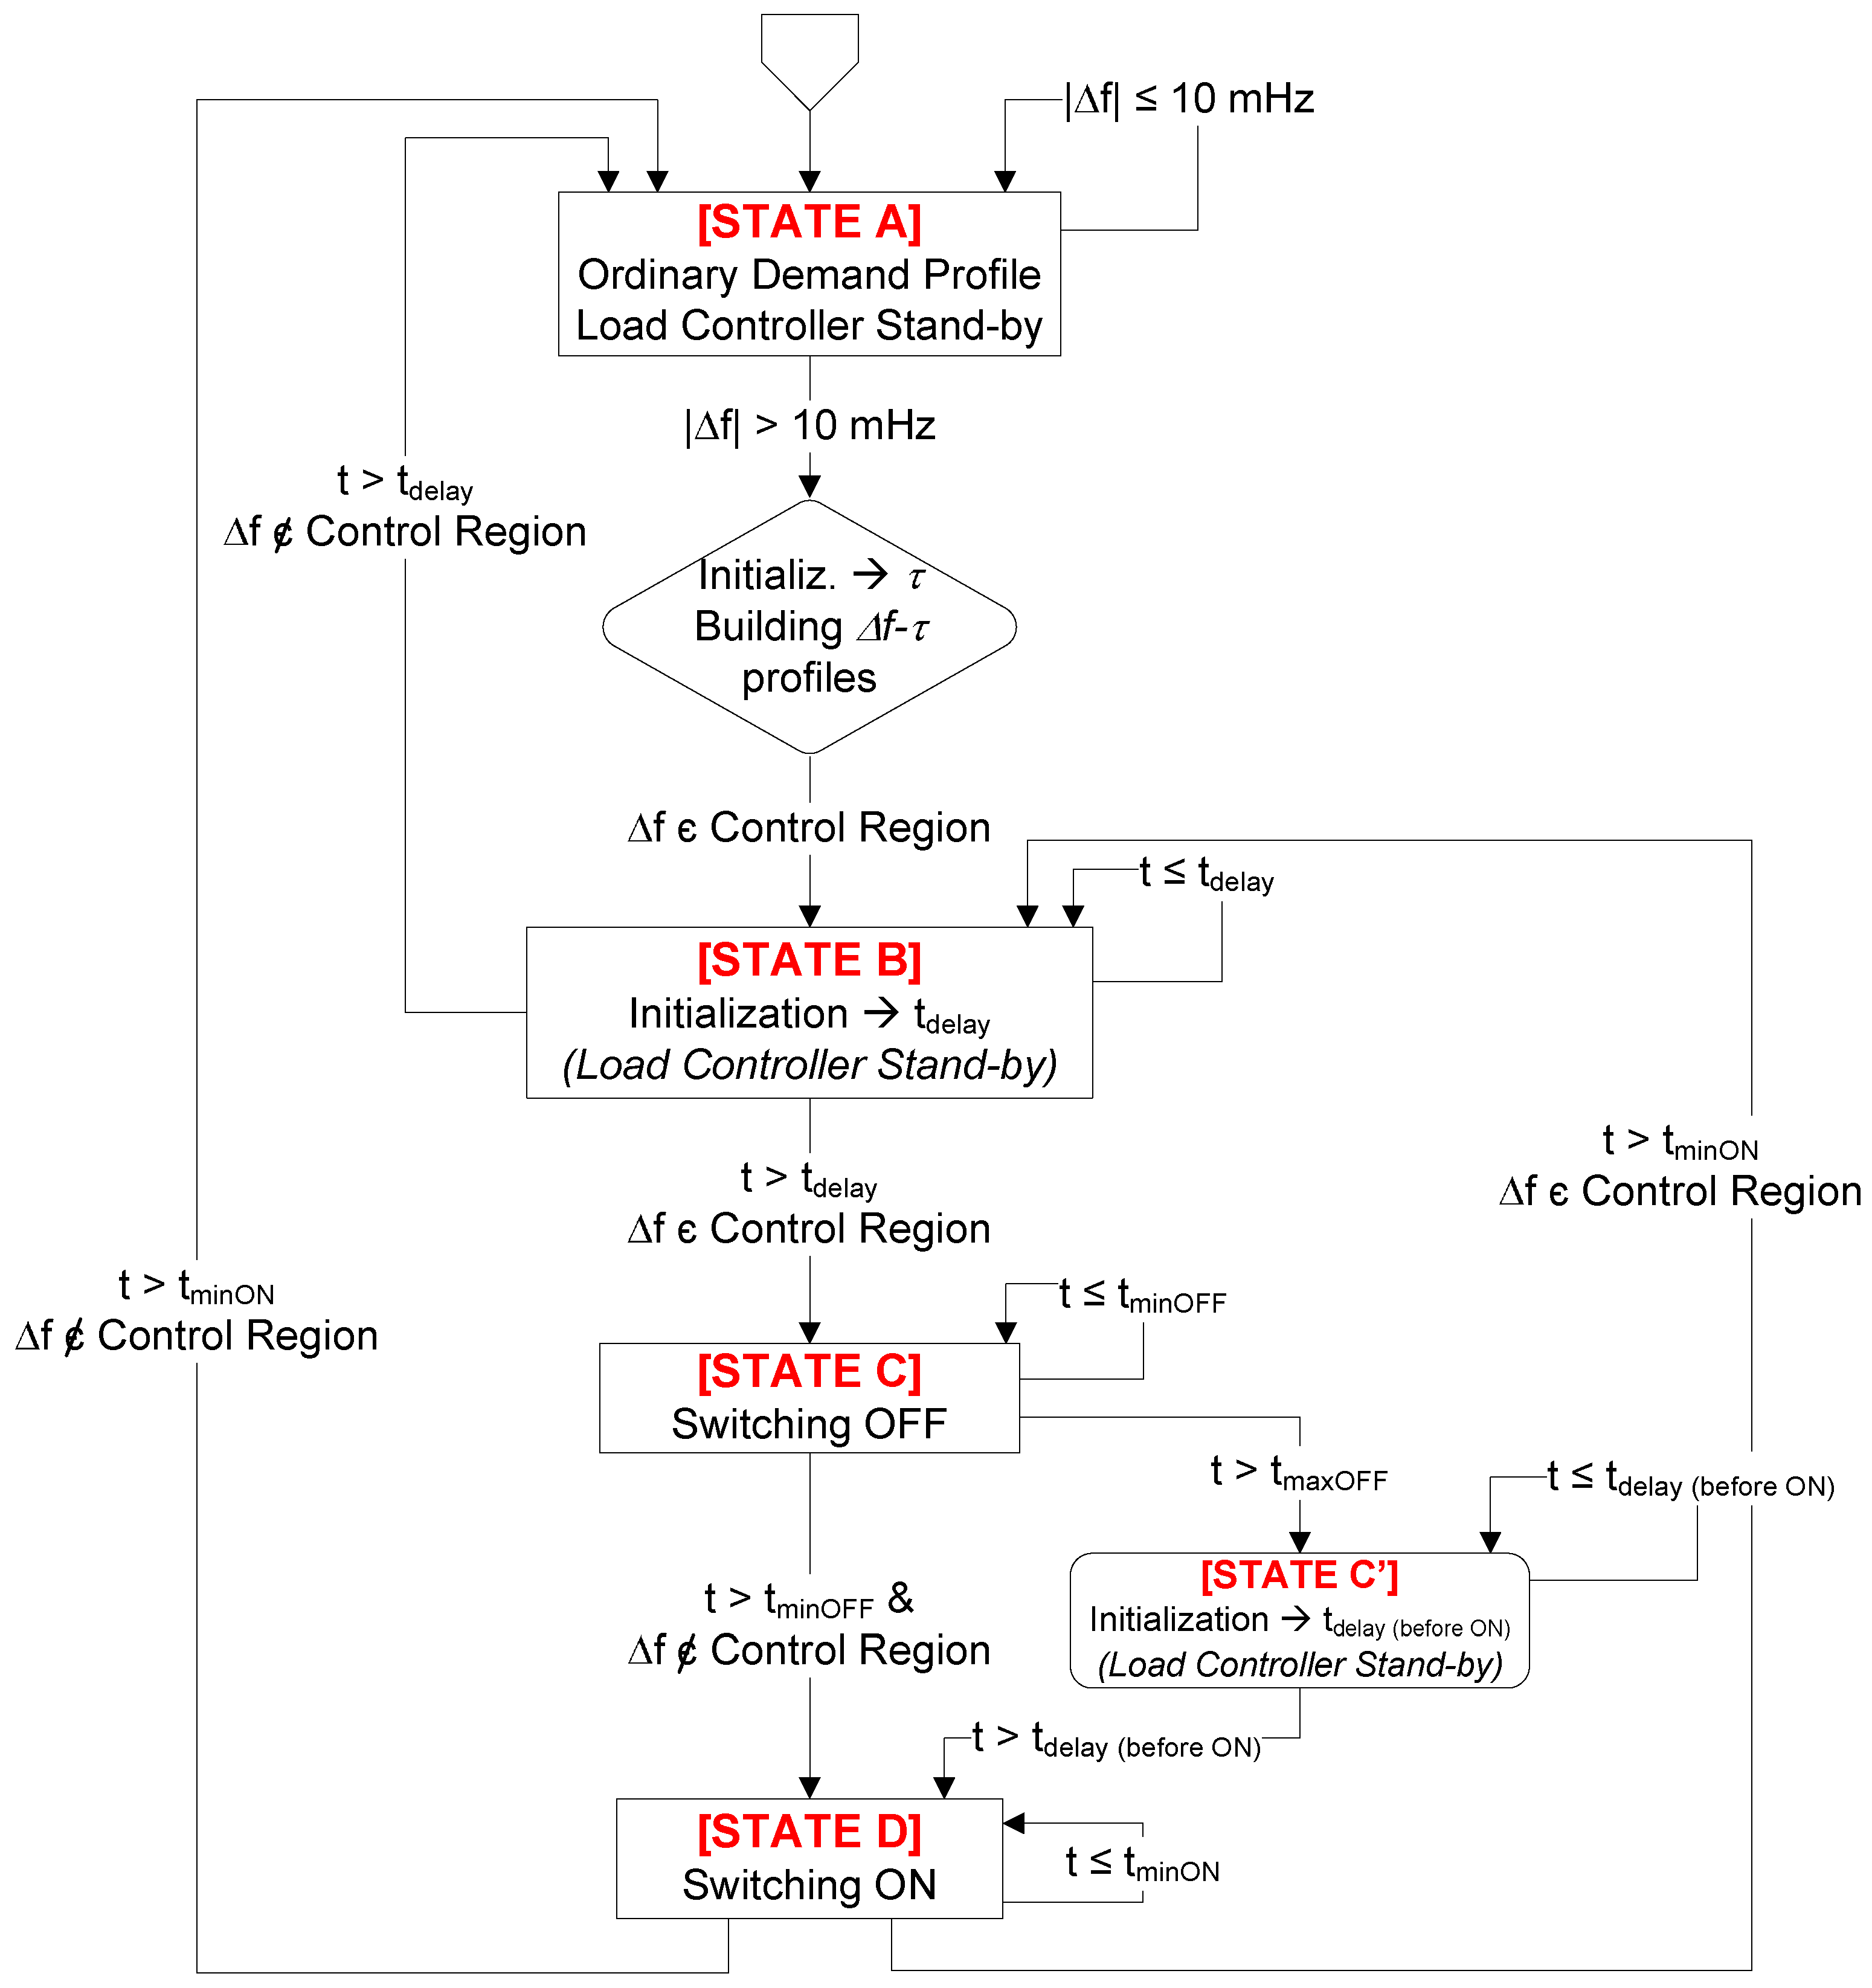
2.3. Load Controller Software Description: Frequency-Responsive Load Controller

A frequency-responsive load controller based on [24] is used in the present paper. This load controller is able to switch off (on) the individual load through the power relay when the grid frequency presents excursions below or above certain threshold values [29]. Furthermore, not only is the frequency deviation, Δ f considered, but also its evolution over time. Each individual load controller has an associated Δ f -time characteristic, defining the corresponding load contribution to the PFC response. Figure 1 shows an example of this Δ f -time relation for an individual load controller, where both controlled and uncontrolled Δ f -time regions are clearly identified.
If the frequency deviation remains within a certain threshold for a time interval, the load controller does not provide any forced switching off (on) signal, and the individual load follows its normal operating power demand profile. When the frequency deviation corresponds to the control region (see Figure 1), the node will switch off (on) the individual load through the solid-state relay, thus reducing (increasing) the power demand, respectively. As can be seen from Figure 1, the larger the frequency deviation, the sooner the load controller provides a forced switching off (on) signal. On the contrary, small frequency deviations are allowed for a longer period of time, thus delaying the controller actuation. For a better understanding of the load controller behavior, Figure 6 shows the control scheme for under-frequency events. The scheme comprises four stages: State-A (ordinary demand profile), State-B (waiting time before switching off), State-C (disconnection) and State-D (reconnection).
Figure 7 depicts two examples of under-frequency trajectories for a specific load controller. In both examples, the individual Δ f -time characteristic (red-line), the emulated frequency excursion (blue-line) and the load controller state, according to Figure 6, are included to clarify the performance of the proposed load controller. Specifically, Figure 7a illustrates a linear under-frequency excursion remaining in time, and Figure 7b shows an under-frequency oscillation falling until it vanishes. The main difference between these two examples lies in the controller load performance after the on-forced time interval (State-D) is finished ( t > t m i n O N ):
(i)
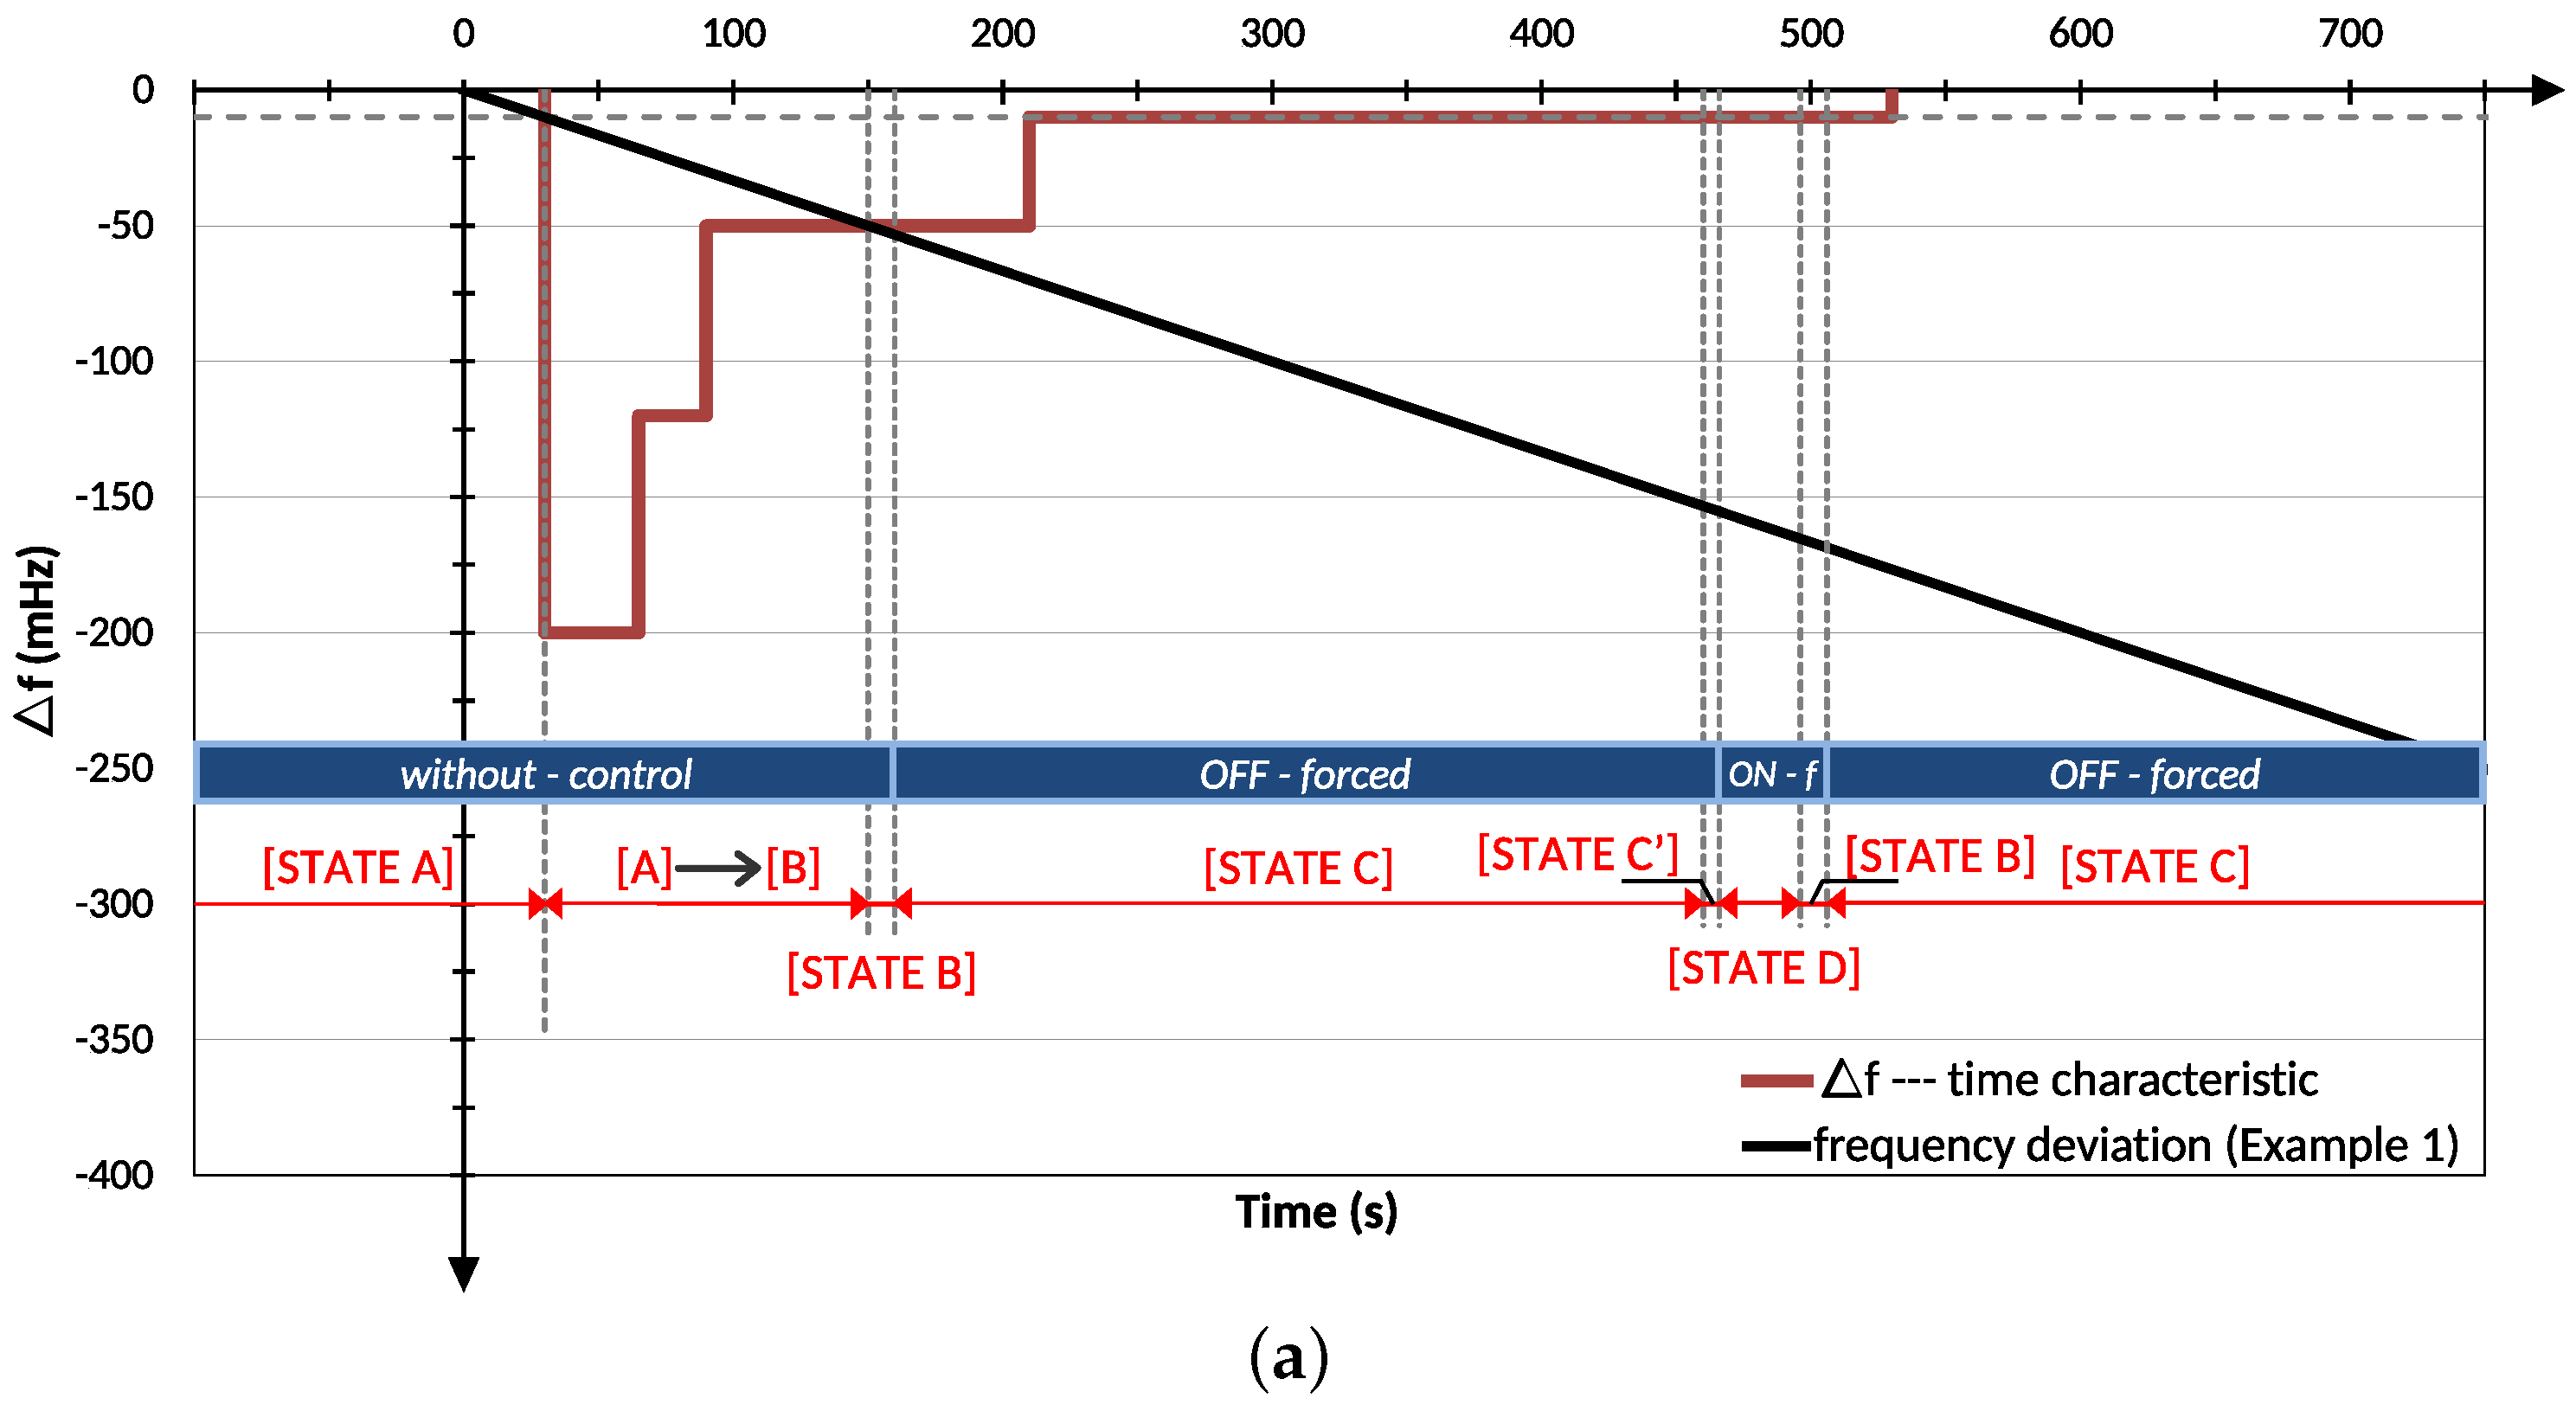
In Figure 7a, a second off-forced time period is started (State-D → State-B), since the frequency value continues within the control region and does not recover its nominal value. In this case and after the on-forced time interval (State-D) is finished, the load controller changes the status to State-B and back to the beginning of a new off-forced time period process.
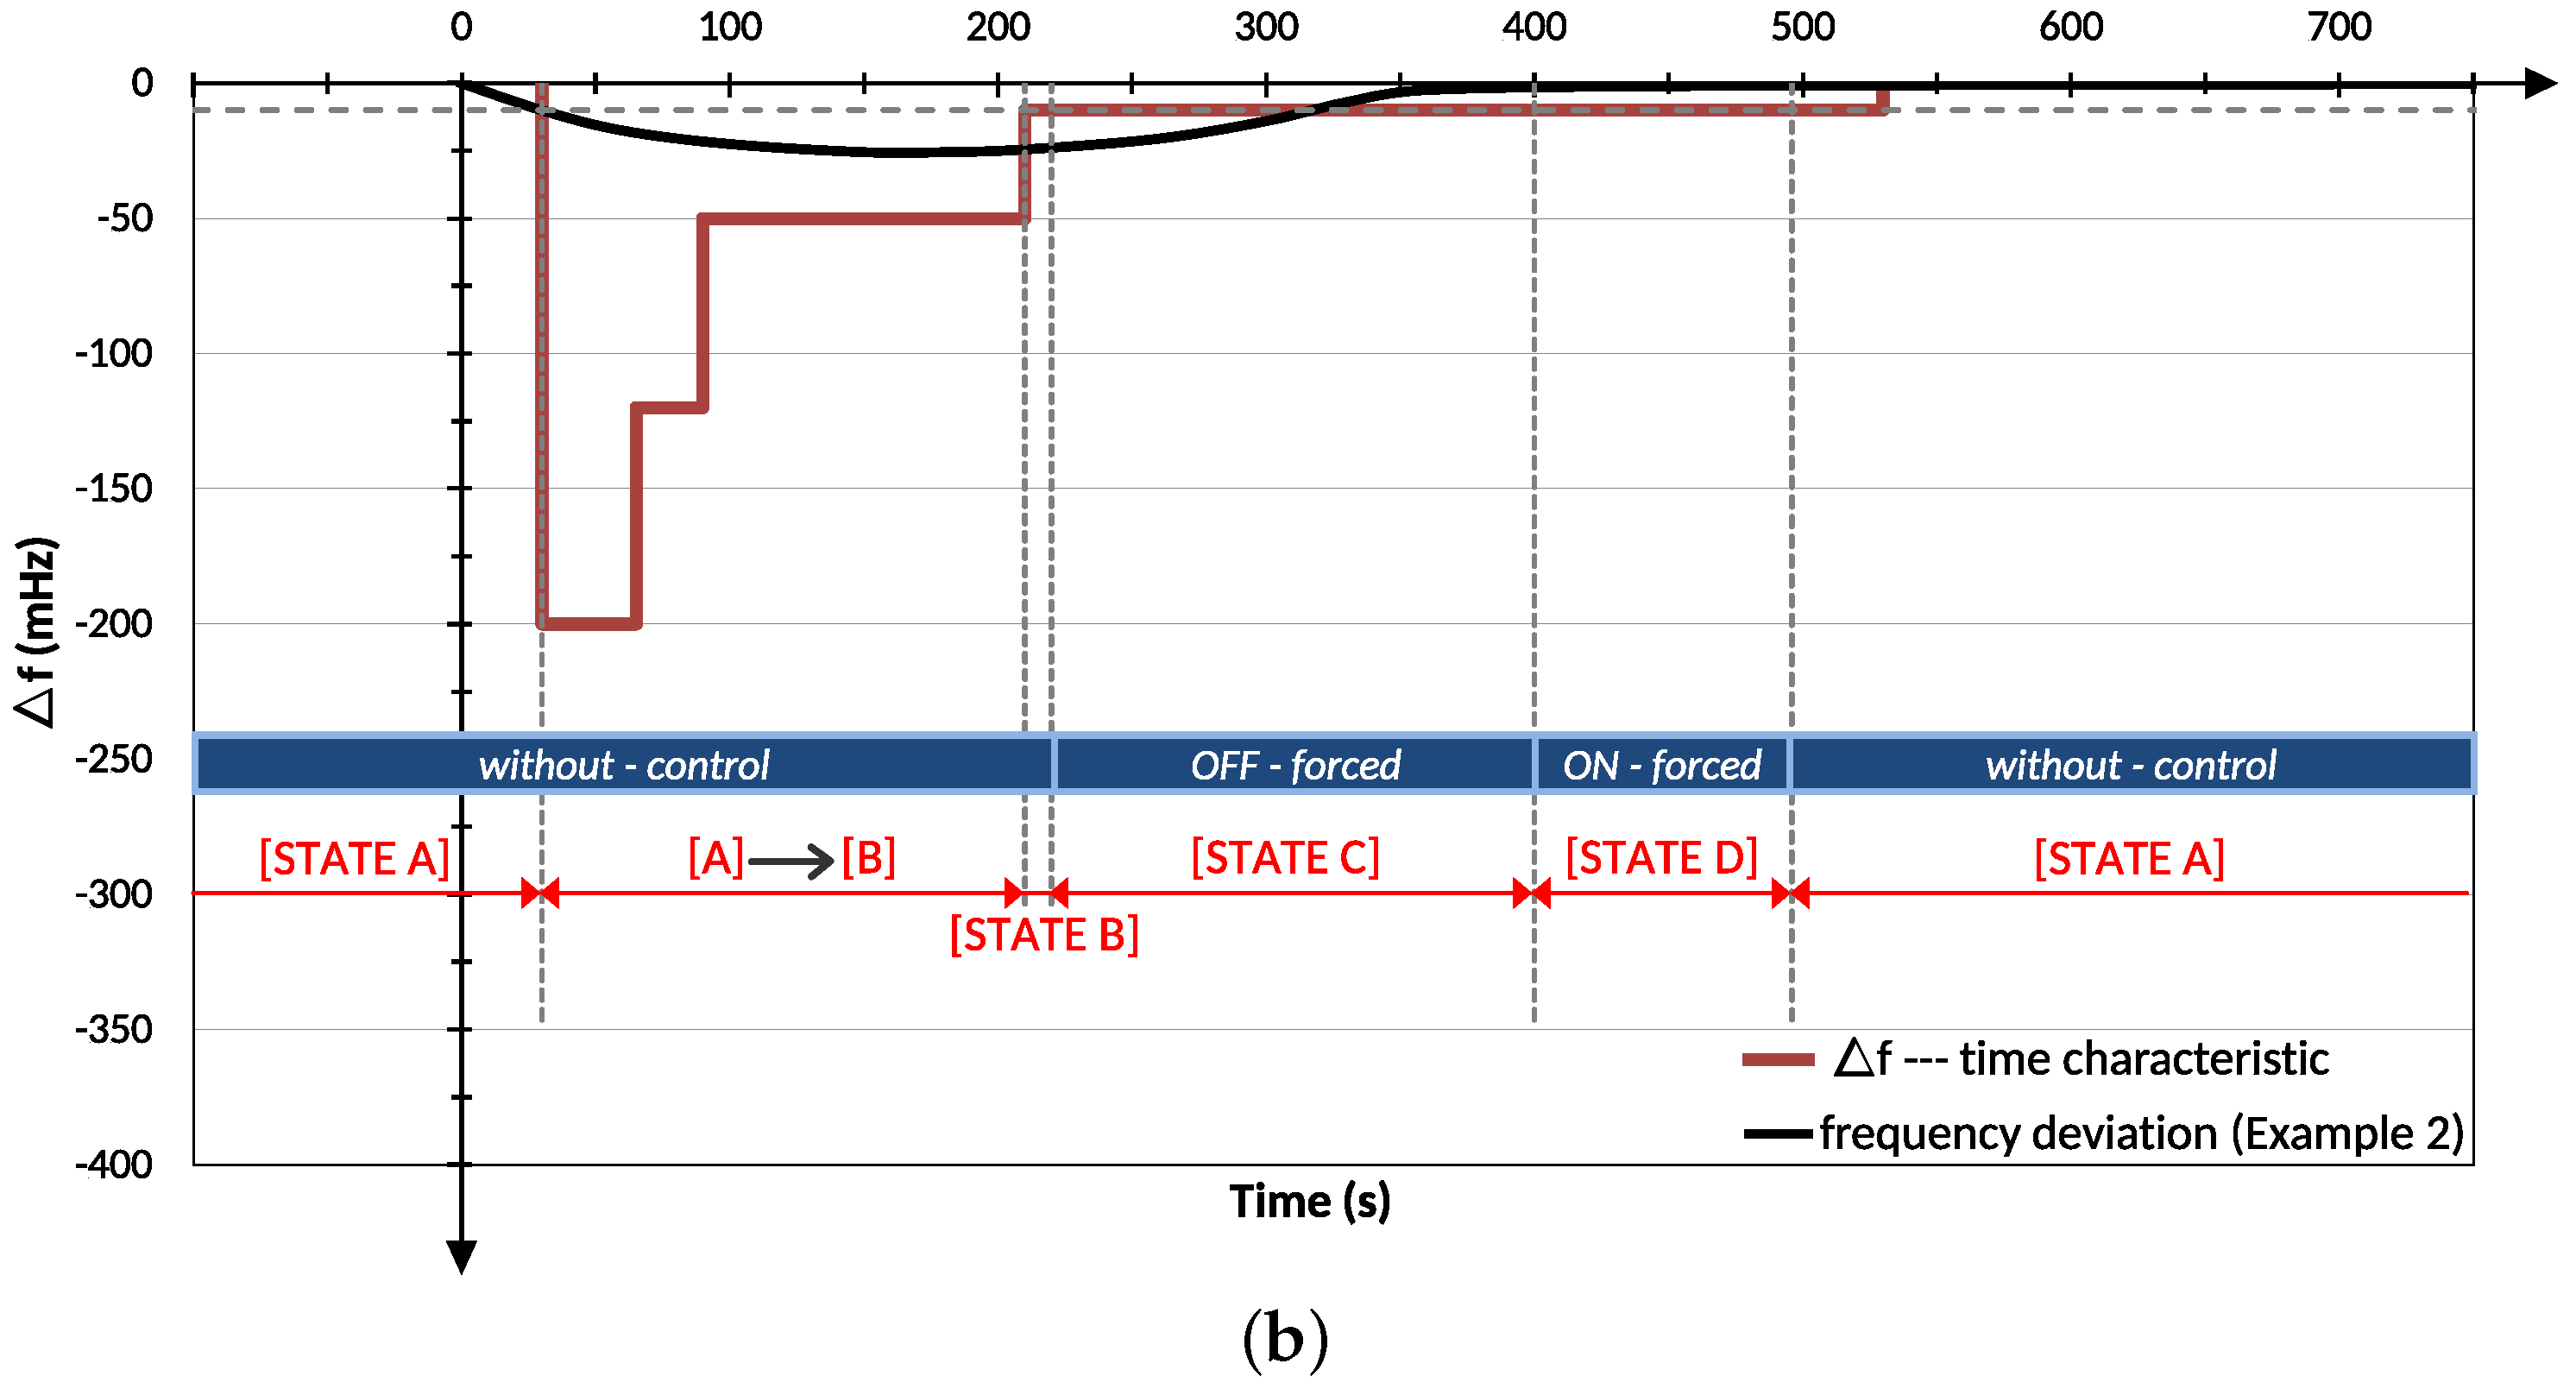
(ii)
In Figure 7b, by contrast, the frequency excursion has already disappeared before finishing the off-forced time interval (State-C). Subsequently, the load controller reaches its stand-by mode after the on-forced time interval (State-D), with the load following its normal operating power demand profile (State-D → State-A).
To avoid instantaneous and massive disconnections and, consequently, undesired frequency oscillations, another characteristic (not included in the scheme of Figure 6) is considered in the proposed load controller. Specifically, a Probability Density Function (PDF) has been implemented on each load controller to decide if the individual load will participate (or not) in the demand side response. Therefore, depending on the depth of the frequency excursion, a proportional amount of loads will be called upon to switch off, thus emulating the linear and proportional response of classical turbine-generator governors submitted to under-frequency excursions. On 1 July 2005, the Union for the Coordination of the Transmission of Electricity (UCTE) standards became mandatory through a binding agreement called the Inter-TSOMultilateral Agreement (MLA). According to these UCTE requirements, in case of a quasi-steady-state deviation of the system frequency of ±200 MHz from the nominal frequency, all available primary control reserves are expected to be full [30]. Consequently, the PDF is linearly distributed from the minimum activation control ( Δ f = 10 mHz) up to this maximum frequency deviation ( Δ f = 200 mHz). According to Figure 6, if the time delay before disconnection is exceeded ( t > t d e l a y ), each load controller might (or not) reach State-C, depending on the magnitude of the frequency excursion. Loads are then called upon to participate in the frequency control progressively, as shown in Figure 8. For the frequency excursion shown in Figure 7a and according to the percentage of load participation described in Figure 8, around 5% of the controlled load will be called upon to participate in the frequency response. For the second example of under-frequency excursion (see Figure 7b), approximately 20% of the controlled load will be submitted to off-forced time intervals.
A set of parameters can be selected for each node, mainly related with frequency set-points and maximum and minimum power demand time intervals. These constraints are included in order to preserve the minimum standards of customers’ comfort and consider mechanical and electrical load requirements. In fact, a suitable configuration of these parameters enables the temperature to be maintained within certain limits. For example, when the maximum allowed disconnection time period is reached ( t m a x O F F ), a minimum period of forced connection ( t m i n O N ) is required before a new off-forced time interval. The thermostatically-controlled load partially recovers its temperature set-point, avoiding future payback effects and unacceptable working conditions.
An example of how to set one of these parameters is shown in Figure 9. As can be seen, Figure 9a depicts the temperature profile obtained when a refrigerator is submitted to an off-forced time interval. Thermal processes of objects are often described by Newton’s law of cooling, which states that the rate of temperature of a cooling body with respect to the surroundings decreases exponentially with time [31,32,33]. This statement leads to the classic equation of exponential decline over time, i.e., f ( t ) a + b e t / τ , which can be applied to the aforementioned refrigerator’s disconnection. Thus, temperature data are presumably best interpolated using an exponential fit, with a R-square of 0.9716. As shown in this figure, in a 36-h interval, the temperature reaches room temperature. For our purposes, only the first 30-min interval of the entire period is needed; see Figure 9b. Within this time interval, a linearization is suitable to adjust the temperature data to a linear polynomial fit, i.e., f ( t ) a t + b . By observing the evolution of the temperature in Figure 9b, the maximum disconnection time ( t m a x O F F ) as a function of the maximum allowable temperature rise can be easily determined. For example, an off-forced time interval of 5 min implies a maximum expected temperature increase of around 0.2 °C.
Considering operating characteristics, as well as demand response under the presence of contingencies, thermostatically-controlled loads can be grouped into different categories, mainly fridges/freezers, air-conditioners/heat pumps and water heaters. In this paper, our study has been focused on fridges/freezers as an example of a real application of the proposed load controller. Within this load category, the Δ f -time characteristic associated with each individual fridge/freezer would be theoretically similar. However, uncertainty bands around connection and disconnection boundaries are included to enhance the heterogeneous behavior of controlled loads and spread the performance of the load controllers over time. Indeed, this distribution of responses considerably mitigates the synchronization of the switching off (on) actions and consequently reduces the frequency oscillation problem. As a result, different load groups are considered (up to 10), grouping fridges/freezers by their respective Δ f -time characteristic and operating characteristics.

3. Results

3.1. Laboratory Test Environment

A set of tests in a laboratory environment has been carried out to evaluate the suitability of the proposed WSAN solution under the presence of frequency deviations. This laboratory system comprises a three-phase waveform generator, sensor/actuator nodes, thermostatically-controlled loads, a sink node and a common PC. An Elgar SW5250A power source is used as an arbitrary waveform generator, allowing us to emulate real power grid disturbances, including frequency excursions or voltage dips. This equipment is thus in charge of emulating frequency deviations to evaluate the suitability of the load controller responses under such kinds of disturbances. Note that these frequency excursions are programmed in advance in the Elgar software interface. Consequently, this equipment does not emulate the real evolution of a power grid submitted to unbalanced situations. Nevertheless, the emulated frequency deviations are determined from the implementation of an isolated power system under the MATLAB-Simulink environment. This power system consists of a variety of conventional generation sources and up to 20% penetration of wind power generation.

3.2. Case Studies and Results

Initially and with the aim of characterizing temperature and power demand profiles under normal operating conditions, a preliminary study has been carried out using current domestic fridge/freezer appliances. Detailed measurements of internal temperature, voltage and current data have been collected using the corresponding sensors and a data-logging software. In this study, four cycles at 50 Hz with a sampling frequency of 6.4 kHz were gathered every 30 s (512 sets of data every 30 s). The collected data under normal conditions for a 12-h time period are summarized in Figure 10. As can be seen, the fridge/freezer remains switched on around 1 h and 40 min every 3 h. Subsequently, the duty cycle, the percentage of time that an entity takes in an active state as a fraction of the total time under consideration [34], can be initially estimated around 55%, although this value can be modified according to the selected temperature set-point. Operating characteristics for the different fridge/freezer groups are summarized in Table 1.
The performance of the proposed load controller under frequency deviations is assessed using the Elgar SW5250A unit power supply. For this purpose, two scenarios have been considered to emulate frequency oscillations:
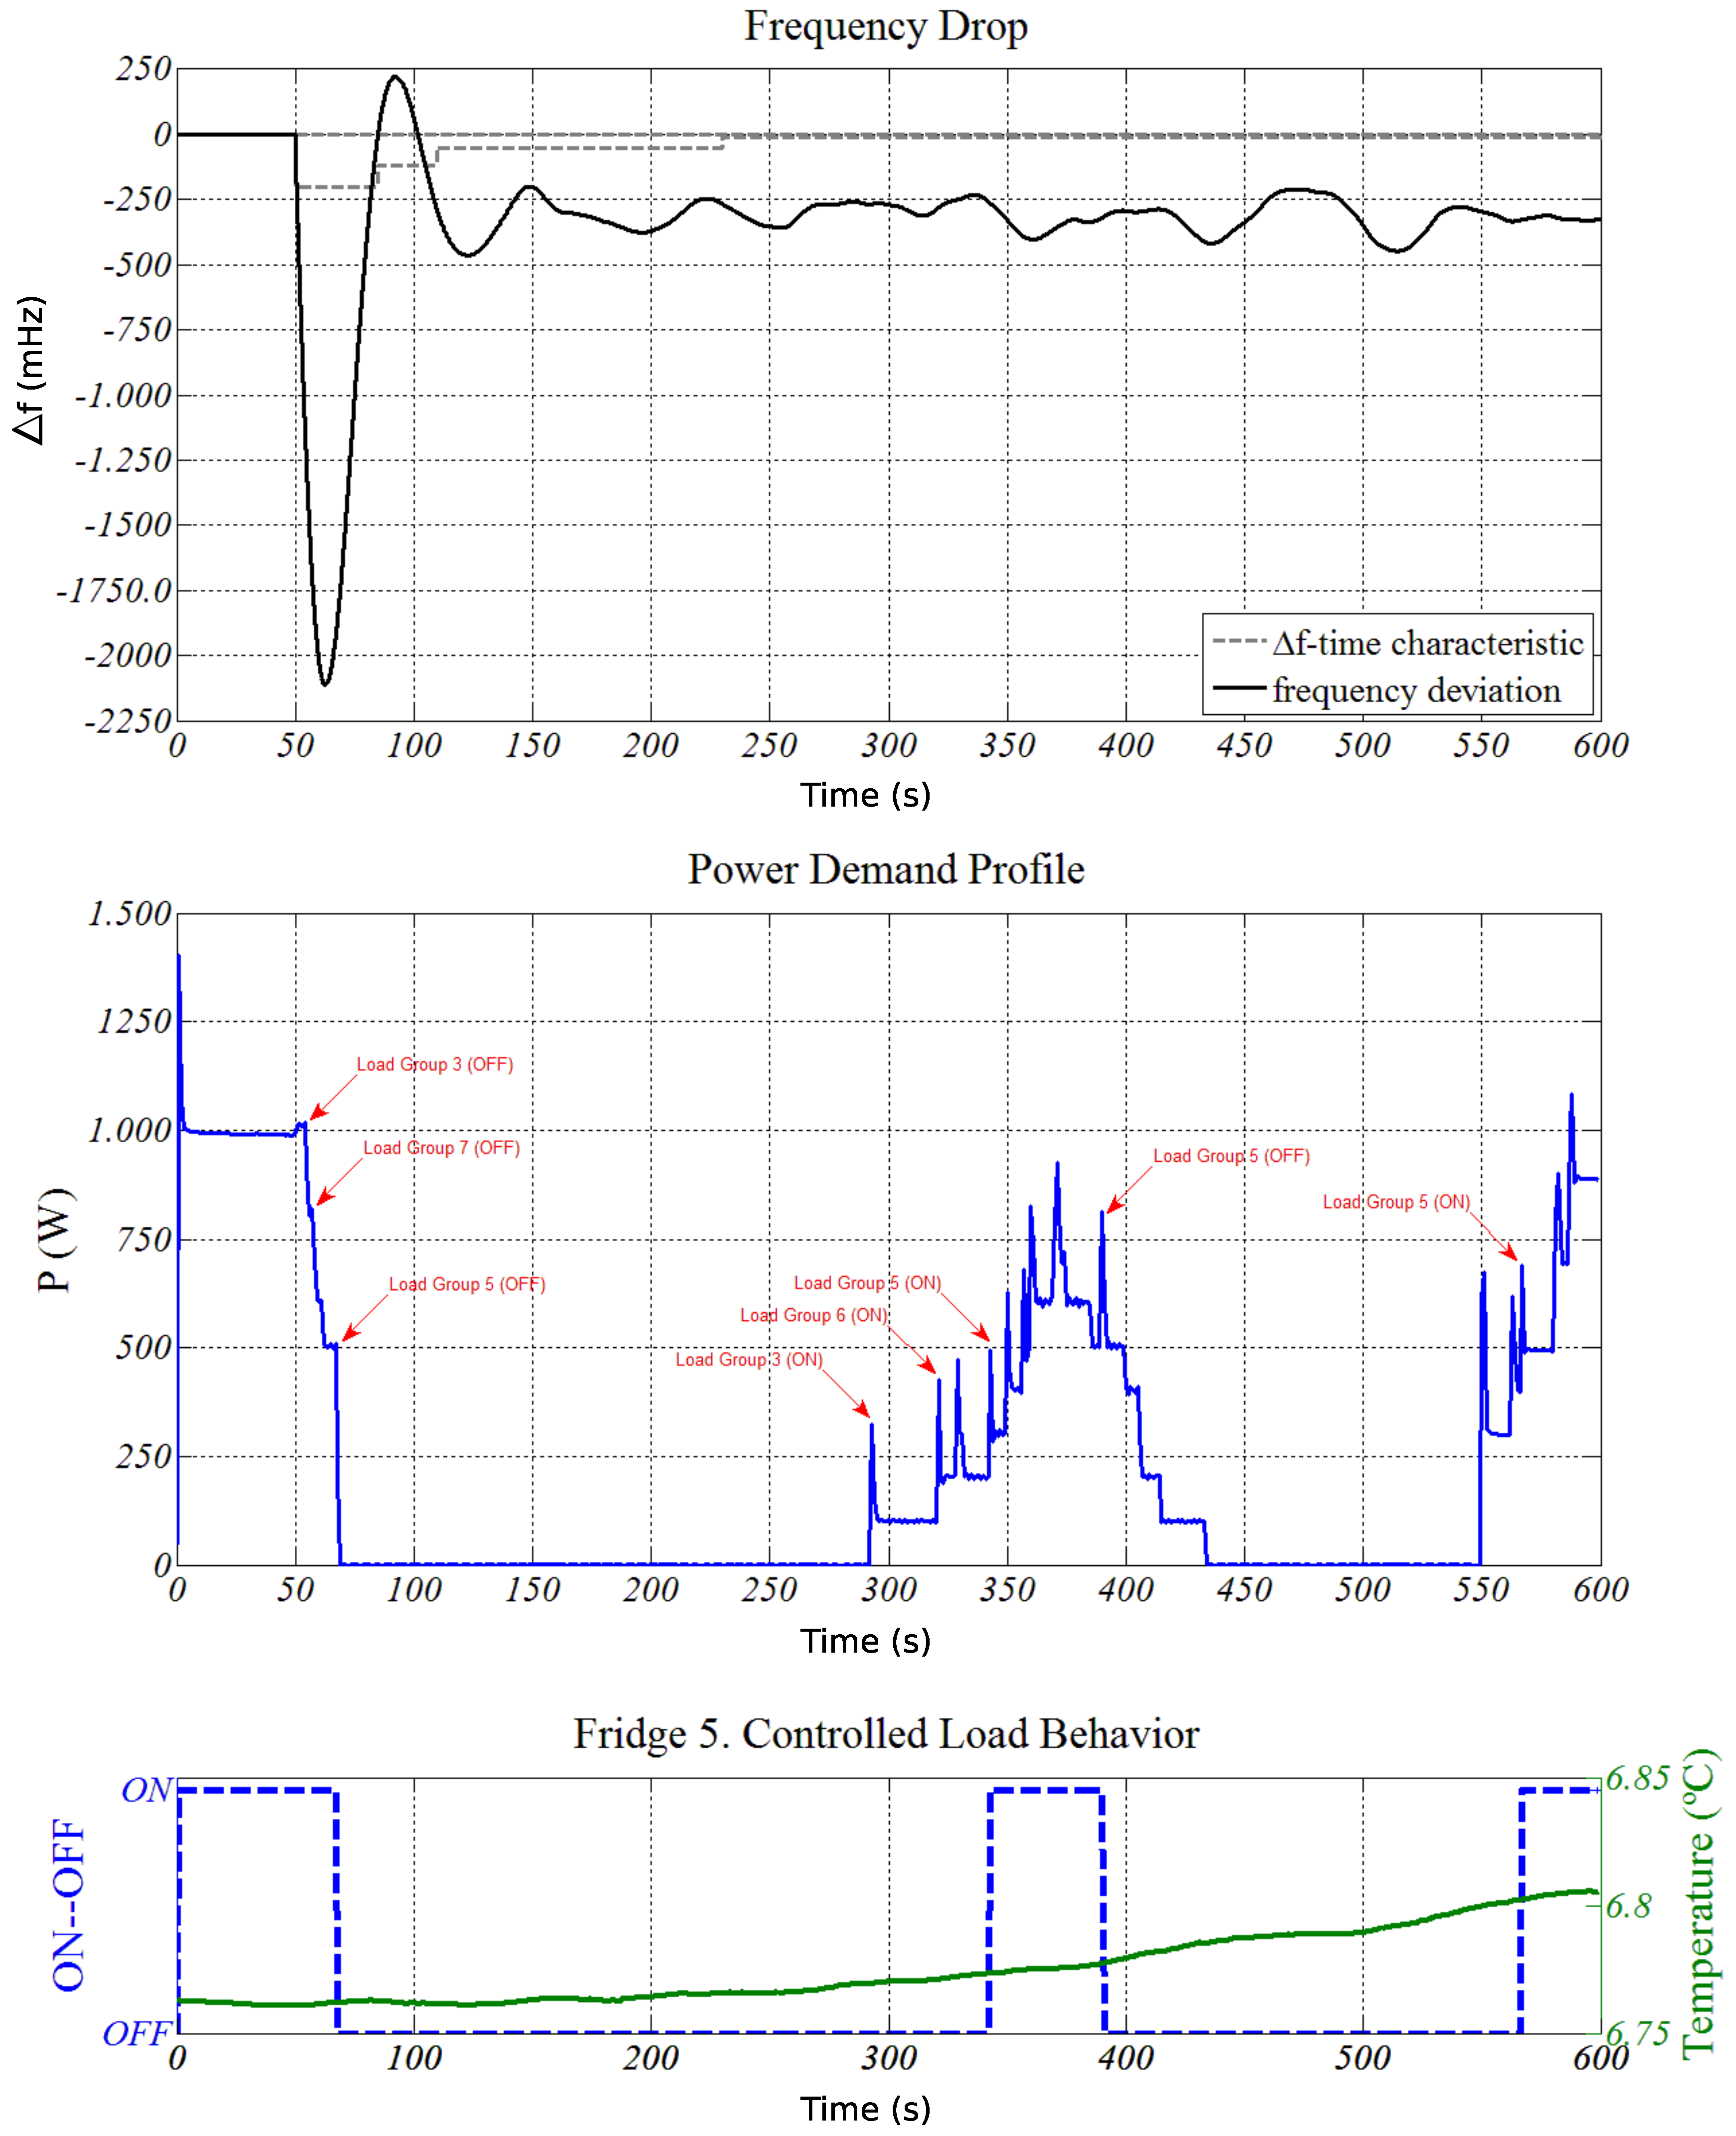
  • Case Study (I): Frequency excursion due to wind power fluctuations.
  • Case Study (II): Frequency excursion due to wind power fluctuations together with a sudden loss of a hydrothermal generation unit (200 MW of power).
In both cases, wind power fluctuations have been determined by a wind speed profile algorithm based on the power spectral density [35]. The power system is modeled according to the general scheme proposed in [36] for the analysis of power system dynamic performance. Frequency excursions have been then obtained by studying a power system with high wind energy penetration, frequency deviation being used as a feedback signal to provide frequency control. This study is focused solely on primary frequency control, and secondary control has not been considered for simulation purposes. Further information regarding the power system model and frequency analysis can be found in [37].
In reference to Case Study (I) (see Figure 11), a frequency drop of such magnitude, if not corrected, could trigger the system-wide load shedding [20]. Electrical and thermal variables for this frequency excursion were collected, and the laboratory test results are shown in Figure 11. The UCTE sets that the entire primary control reserve must be automatically and fully activated in response to quasi-steady-state frequency deviations of ±200 MHz [38]. Consequently, all load controllers must switch off the individual loads when the grid frequency excursion ( Δ f ) is −2115 MHz. A delay time interval randomly assigned on each individual load controller is included to avoid synchronous responses ( t d e l a y ), and thus, loads must theoretically remain off until the grid frequency is reestablished. According to the minimum comfort levels and/or temperature constraints required by the customers, the disconnection time period is limited by a predefined maximum time period ( t m a x O F F = 5 min). For this reason, and even under frequency drop situations, loads are forced to switch on in order to avoid temperature excursions higher than the allowed limits. As an example, Load Group 5 is switched-on at 350 s, in spite of the frequency excursion remains within. A random time delay is also considered on each node to mitigate the simultaneous load re-connection process. If a relevant number of individual loads is submitted to off-forced time intervals under grid frequency excursions, these delay time intervals for connection and disconnection processes are randomly distributed to avoid significant power demand oscillations with their corresponding impact on the grid frequency evolution.
With the aim of evaluating the correct performance of the load controller, considering not only the magnitude of the deviation ( Δ f ), but also its evolution over time, an additional frequency deviation has been considered, i.e., Case Study (II). The results are shown in Figure 12. According to the Δ f -time characteristic of the load controller, small frequency deviations are allowed for a longer period of time, shifting in time the forced switching off (on) actions. This load controller performance avoids an excessive demand response under temporary frequency deviations and provides a progressive grid frequency recovery. From the Δ f -time characteristic implemented in the proposed load controller (see Figure 1), for a frequency deviation of 180 MHz, loads must be switched off after approximately 35 s (45 s considering the corresponding t d e l a y , which avoids instantaneous and massive disconnections). In addition, not all controlled load groups are involved in the frequency control (for example, Load Groups 7 and 8 remain passive). The smaller the depth of the frequency excursion, the lower the percentage of load participation; see Figure 8.
The maximum disconnection time period is in line with the controlled temperature and the comfort levels fixed by customers. For the case studies, internal temperature modifications are limited to 0.2 °C ( t m a x O F F = 5 min). Consequently, the maximum temperature increases caused by the implementation of the load control scheme proposed in this paper are 0.21 and 0.12 °C for Case Studies (I) and (II), respectively. This maximum time interval depends on the thermal inertia of the controlled loads and its current duty-cycles. A minimum connection time period t m i n O N to ensure a suitable temperature recovery process is later required by the individual load. During this on-forced time interval, the load controller is temporarily disabled, and the individual load does not participate in the demand response. Nevertheless, the great amount of thermostatically-controlled loads and the large scattering of electrical and thermal performances present in current power grids allow us to conclude that these loads offer a suitable solution to properly emulate the supply side governor response under frequency disturbances. Finally, it is necessary to point out that simulations lasting for several minutes imply the activation of secondary frequency control. For the sake of simplicity, only the primary frequency response has been considered in our proposals, which will be extended in future works.

4. Conclusions

A decentralized solution based on a wireless sensor-actuator network to provide primary frequency control through the demand side response of thermostatically-controlled loads is discussed and evaluated in this paper. This solution is able to modify the electrical power demand of thermostatically-controlled loads, maintaining minimum comfort levels and minimizing infrastructure requirements. The proposed load controller involves not only the magnitude of the frequency deviation, but also its evolution over time. Random delay time intervals are included to avoid synchronous load responses and excessive demand side oscillations. This approach enables us to properly emulate classical governor responses under frequency deviations, thus relieving the primary control reserves from the supply side. Therefore, this solution can be integrated into power systems that are more sensitive to frequency excursions, such as those systems with high wind power penetration.
Laboratory tests have been carried out on typical thermostatically-controlled loads to evaluate the performance of the load controller under frequency deviations and its ability to disconnect the individual loads according to a time-frequency excursion characteristic. Under frequency deviations, individual load controllers applied to real domestic fridges/freezers allow a maximum temperature increase during the off-forced time intervals of below 0.21 °C. This limit is in line with customers’ comfort, as well as with both mechanical and electrical load requirements; maintaining the controlled temperature within proper previously established limits. From the results, the suitability of the proposed frequency-responsive and decentralized load controller with respect to frequency deviations and maximum and minimum allowed time intervals has thus been demonstrated.

Acknowledgments

This work is financially supported by the Regional Seneca Foundation of Spain through the research projects 08747/PI/08 and 19379/PI/14.

Author Contributions

Antonio Vigueras-Rodríguez and Angel Molina-García conceived of and designed the simulations and the paper scope. Irene Muñoz-Benavente performed the simulations. Emilio Gómez-Lázaro and Tania García-Sánchez analyzed the results. All of the authors wrote sections of the paper.

Conflicts of Interest

The authors declare no conflict of interest.

References

  1. Hirst, E.; Kirby, B. Load as a Resource in Providing Ancillary Services; Technical Report; Oak Ridge National Laboratory: Oak Ridge, TN, USA, 1999.
  2. Liu, X.; Liu, X.; Li, Z. Cyber risk assessment of transmission lines in smart grids. Energies 2015, 8, 13796–13810. [Google Scholar] [CrossRef]
  3. International Energy Agency. Cool Appliances—Policy Strategies for Energy Efficient Homes; International Energy Agency: Paris, France, 2003. [Google Scholar]
  4. Schweppe, F.C.; Tabors, R.D.; Kirtley, J.L.; Outhred, H.R.; Pickel, F.H.; Cox, A.J. Homeostatic utility control. IEEE Trans. Power Appar. Syst. 1980, PAS-99, 1151–1163. [Google Scholar] [CrossRef]
  5. Kirby, B.; Ally, M. Spinning Reserve from Supervisory Thermostat Control; Technical Report; Transmission Reliability Research Review; US Department of Energy: Washington DC, USA, December 2002.
  6. Malins, A. Demand Side Developments; Technical Report; National Grid Transco: Warwick, UK, March 2003. [Google Scholar]
  7. Pacific Northwest National Laboratory. Grid Friendly™ Controller Helps Balance Energy Supply and Demand; Technical Report; Pacific Northwest National Laboratory: Richland, WA, USA, 2002.
  8. Palensky, P.; Dietrich, D. Demand side management: Demand response, intelligent energy systems, and smart loads. IEEE Trans. Ind. Inform. 2011, 7, 381–388. [Google Scholar] [CrossRef]
  9. Hirst, D. Responsive Load System. UK Patent GB2361118, 2001. [Google Scholar]
  10. Short, F.C.; Infield, D.G.; Freris, L.L. Stabilization of Grid Frequency Through Dynamic Demand Control. IEEE Trans. Power Syst. 2007, 22, 1284–1293. [Google Scholar] [CrossRef] [Green Version]
  11. Autonomous Renewable Energy Systems Application of Distributed Intelligent Load Control. Available online: http://ieeexplore.ieee.org/document/828160/ (accessed on 22 January 2017).
  12. Pandiaraj, K.; Taylor, P.; Jenkins, N.; Robb, C. Distributed load control of autonomous renewable energy systems. IEEE Trans. Energy Convers. 2001, 16, 14–19. [Google Scholar] [CrossRef] [Green Version]
  13. Trudnowski, D.; Donnelly, M.; Lightner, E. Power-system frequency and stability control using decentralized intelligent loads. In Proceedings of the 2006 IEEE PES Transmission and Distribution Conference and Exhibition, Dallas, TX, USA, 21–24 May 2006; pp. 1453–1459.
  14. Short, J.A.; Infield, D.G.; Freris, L.L. Stabilization of grid frequency through dynamic demand control. IEEE Trans. Power Syst. 2007, 22, 1284–1293. [Google Scholar] [CrossRef] [Green Version]
  15. Kondoh, J.; Aki, H.; Yamaguchi, H.; Murata, A.; Ishii, I. Consumed power control of time deferrable loads for frequency regulation. In Proceedings of the IEEE PES Power Systems Conference and Exposition, New York, NY, USA, 10–13 October 2004; pp. 1013–1018.
  16. Kondoh, J.; Lu, N.; Hammerstrom, D. An evaluation of the water heater load potential for providing regulation service. In Proceedings of the 2011 IEEE Power and Energy Society General Meeting, Detroit, MI, USA, 24–29 July 2011; pp. 1–8.
  17. Eto, J. Demand Response Spinning Reserve Demonstration; Technical Report; Lawrence Berkeley National Laboratory (LBNL): Berkeley, CA, USA, 2007.
  18. Xu, Z.; Ostergaard, J.; Togeby, M. Demand as Frequency Controlled Reserve. IEEE Trans. Power Syst. 2011, 26, 1062–1071. [Google Scholar] [CrossRef] [Green Version]
  19. Douglass, P.J.; Garcia-Valle, R.; Nyeng, P.; Ostergaard, J.; Togeby, M. Demand as frequency controlled reserve: Implementation and practical demonstration. In Proceedings of the 2nd IEEE PES Int Innovative Smart Grid Technologies (ISGT Europe) Conference and Exhibition, Manchester, UK, 5–7 December 2011; pp. 1–7.
  20. Samarakoon, K.; Ekanayake, J. Demand side primary frequency response support through smart meter control. In Proceedings of the 2009 44th International Universities Power Engineering Conference (UPEC), Glasgow, UK, 1–4 September 2009; pp. 1–5.
  21. Vijayananda, W.M.T.; Samarakoon, K.; Ekanayake, J. Development of a demonstration rig for providing primary frequency response through smart meters. In Proceedings of the 45th International Universities Power Engineering Conference (UPEC), Cardiff, UK, 31 August–3 September 2010; pp. 1–6.
  22. Samarakoon, K.; Ekanayake, J.; Jenkins, N. Investigation of domestic load control to provide primary frequency response using smart meters. IEEE Trans. Smart Grid 2012, 3, 282–292. [Google Scholar] [CrossRef]
  23. Wang, Q.; Tang, Y.; Li, F.; Li, M.; Li, Y.; Ni, M. Coordinated scheme of under-frequency load shedding with intelligent appliances in a cyber physical power system. Energies 2016, 9, 630. [Google Scholar] [CrossRef]
  24. Molina-García, A.; Bouffard, F.; Kirschen, D. Decentralized demand side contribution to primary frequency control. IEEE Trans. Power Syst. 2011, 26, 411–419. [Google Scholar] [CrossRef]
  25. Liu, S.; Liu, X.P.; Saddik, A.E. Modeling and distributed gain scheduling strategy for load frequency control in smart grids with communication topology changes. ISA Trans. 2014, 53, 454–461. [Google Scholar] [CrossRef] [PubMed]
  26. Liu, S.; Liu, P.X.; Saddik, A.E. Modeling and stability analysis of automatic generation control over cognitive radio networks in smart grids. IEEE Trans. Syst. Man. Cybern. Syst. 2015, 45, 223–234. [Google Scholar]
  27. IEEE Standard Association. 802.15.4e-2012—IEEE Standard for Local and Metropolitan Area Networks—Part 15.4: Low-Rate Wireless Personal Area Networks (LR-WPANs); IEEE Standard Association: Piscataway, NJ, USA, 2012. [Google Scholar]
  28. Sensirion. Sht1x/sht7x. Sensirion Humidity and Temperature Sensors. Available online: http://www.sensirion.com (accessed on 22 January 2017).
  29. Hirst, D. Grid Stabilising System. U.S. Patent 20,070,198,133, 23 August 2007. [Google Scholar]
  30. Union for the Coordination of the Transmission of Electricity. P1–Policy 1: Load-Frequency Control and Performance. Technical Report. 2002. Available online: https://www.entsoe.eu/news-events/former-associations/ ucte/Pages/default.aspx (accessed on 22 January 2017).
  31. O’Sullivan, C.T. Newton’s law of cooling—A critical assessment. Am. J. Phys. 1990, 58, 956–960. [Google Scholar] [CrossRef]
  32. Bohren, C.F. Comment on “Newton’s law of cooling—A critical assessment”, by Colm T. O’Sullivan [Am. J. Phys. 58, 956–960 (1990)]. Am. J. Phys. AMER 1991, 59, 1044–1046. [Google Scholar] [CrossRef]
  33. Vollmer, M. Newton’s law of cooling revisited. Eur. J. Phys. 2009, 30, 1063. [Google Scholar] [CrossRef]
  34. Telecommunications: Glossary of Telecommunication Terms; Federal Standard 1037C; Prepared by National Communications System Technology and Standards Division; Institute for Telecommunication Sciences: Boulder, CO, USA, 1996.
  35. Sørensen, P.; Cutululis, N.; Vigueras-Rodríguez, A.; Madsen, H.; Pinson, P.; Jensen, L.; Hjerrild, J.; Donovan, M. Modelling of power fluctuations from large offshore wind farms. Wind Energy 2008, 11, 29–43. [Google Scholar] [CrossRef]
  36. Kundur, P. Power System Stability and Control; McGraw-Hill Professional Publishing: New York, NY, USA, 1994. [Google Scholar]
  37. Molina-García, A.; Muñoz Benavente, I.; Hansen, A.; Gomez-Lazaro, E. Demand-side contribution to primary frequency control with wind farm auxiliary control. IEEE Trans. Power Syst. 2014, 29, 2391–2399. [Google Scholar] [CrossRef]
  38. UCTE Operation Handbook, Version 2.5. Available online: https://www.scribd.com/document/175808629/UCTE-Operation-Handbook (accessed on 22 January 2017).
Figure 1. Individual load controller Δ f -time characteristic.
Energies 10 00151 g001
Figure 2. General wireless network scheme.
Energies 10 00151 g002
Figure 3. Sensor node: general scheme.
Energies 10 00151 g003
Figure 4. Sink node: general scheme.
Energies 10 00151 g004
Figure 5. Example of real implementation (laboratory environment).
Energies 10 00151 g005
Figure 6. Overview of the load control scheme for under-frequency events.
Energies 10 00151 g006
Figure 7. Load control scheme examples for two representative cases. (a) Example 1: growing frequency deviation; (b) Example 2: disappearing frequency deviation.
Energies 10 00151 g007aEnergies 10 00151 g007b
Figure 8. Percentage of load participation.
Energies 10 00151 g008
Figure 9. Setting of the maximum allowed disconnection time period ( t m a x O F F ). (a) Temperature profile in a 36-h disconnection time interval; (b) linearization: Δ T compared to t m a x O F F .
Energies 10 00151 g009
Figure 10. Fridge temperature and power demand profile under normal operation.
Energies 10 00151 g010
Figure 11. Case Study (I). Aggregate power demand profile and example of fridge temperature evolution.
Energies 10 00151 g011
Figure 12. Case Study (II). Aggregate power demand profile and example of fridge temperature evolution.
Energies 10 00151 g012
Table 1. Fridges/freezers’ operating characteristics.
Load Group No. t delay t minOFF t maxOFF t minON Case Study (I) ON/OFFCase Study (II) ON/OFF
1720029228ONON
21918632124ONON
3517523833ONON
41718028932ONON
51717527530ONON
61814825330ONON
7617531528ONOFF
81116530833ONOFF
9916230130ONON
101715926028ONON

