Article

Influence of Tip Clearance on Pressure Fluctuation in Low Specific Speed Mixed-Flow Pump Passage

1
School of Mechanical Engineering, Beijing Institute of Technology, Beijing 100081, China
2
State Key Laboratory of Hydroscience and Engineering, Department of Thermal Engineering, Tsinghua University, Beijing 100084, China
*
Author to whom correspondence should be addressed.
Energies 2017, 10(2), 148; https://doi.org/10.3390/en10020148
Submission received: 17 November 2016 / Revised: 16 January 2017 / Accepted: 18 January 2017 / Published: 24 January 2017

Abstract

:
To explore the influence of tip clearance on pressure fluctuation in a low specific speed mixed-flow pump, tip clearances δ of 0.25 mm, 0.75 mm and 1.00 mm, along with no tip clearance, were selected. The reliability of the simulation was verified by comparison with the experimental data of external characteristics and fluctuation in the guide vane passage. Through ANSYS-CFX, MATLAB code and fast Fourier transform (FFT) algorithm, pressure fluctuation characteristics in this pump were obtained. The results show that pressure fluctuation exists in all conditions due to the rotor-stator interaction. Under the no tip clearance and tip clearance conditions, the maximum fluctuation value was located near the guide inlet and impeller outlet, respectively. Clearance leakage had less influence on pressure fluctuation at the impeller inlet and central regions within a certain range of the clearance; beyond this range, fluctuations in the whole flow passage increased significantly, while the clearance variation had less effect on fluctuation in the guide vane. When the tip clearance value was 1.00 mm, pressure fluctuation of the shroud at the impeller inlet section suddenly increases, which was closely related to the obvious leakage vortexes and a larger low pressure area.

1. Introduction

Mixed-flow pumps are a compromise between centrifugal and axial flow pumps. The features of compact structure, easy starting, and high efficiency make them suitable for use in farmland irrigation, waterlogging drainage, sewage treatment, power plant cooling, and similar activities [1,2,3]. Due to the clearance between blade and shroud, some fluid will flow through the clearance from the working surface due to higher pressure than at the back surface, the tip loss caused by disturbance in the mainstream; meanwhile, leakage fluid through the clearance will cause volumetric loss [4].
In recent years, research has been conducted on the influence of tip clearance on performance [5,6], pressure fluctuation [7,8,9] and internal flow of pumps [10,11], but the subjects have mainly been centrifugal pumps and axial pumps. For mixed-flow pumps, related research has mainly concentrated on the influence of clearance size on performance parameters and tip-leakage. In the first aspect, Bing et al. [12] determined by experiment that when clearance variation is static, the efficiency of a mixed-flow pump will increase suddenly with flow rate increases. Kim et al. [13] explored the effect of tip clearance on head and hydraulic efficiency of a mixed-flow pump and found that the existence of tip clearance could improve the “saddle” phenomenon of head-flow characteristic. For tip-leakage flow, a study on the dynamic characteristics of rotating stall by Li et al. [14] showed that vortexes were generated between the tip-leakage through clearance from the pressure surface to the suction surface and the mainstream, and flow separation occurs in the suction surface if flow rate decreases. In an analysis of a shrouded mixed-flow pump with different tip clearances by Goto [15], tip-leakage flow displaced wake flow and increased the stall margin, however, the strong tip-leakage reverse flow thickened the casing of the boundary layer and developed a passage vortex. In Li et al.’s analysis [16] of the influence of tip clearance on pressure fluctuation in a mixed-flow pump, a large eddy simulation of pressure fluctuation at the shroud of the pump under small flow rate condition was performed, finding that the pressure fluctuation average near the wall region of the impeller decreases gradually as tip clearance gradually increases.
The specific speed of a traditional mixed-flow pump is between 300 and 700, due to the limitations of design methods, and the efficiency-head characteristic curve is prone to the saddle phenomenon [13]; meanwhile, less research or experiments have been conducted on mixed-flow pumps with specific speed less than 300; these specific speed centrifugal pumps are commonly used (the specific speed of a traditional centrifugal pump is between 30 and 300). However, a traditional centrifugal pump has some shortcomings, i.e., it is prone to the hump phenomenon and its high efficiency area is narrow [17]. In this study, unsteady flow simulation and test experiments were conducted on the internal flow of a mixed-flow pump with a specific speed of 149, where it was determined that the pump not only has the advantage of a high efficiency area, but also avoids the saddle phenomenon of a traditional mixed-flow pump. The results were processed with FFT and MATLAB 2012 (MathWorks Inc., Natick, MA, USA), and the characteristics of pressure fluctuation and internal flow in the impeller and guide vane were explored at different tip clearances and different flow rate conditions to obtain a more comprehensive understanding of tip clearance influence on pressure fluctuation in such pumps.

2. Research Object

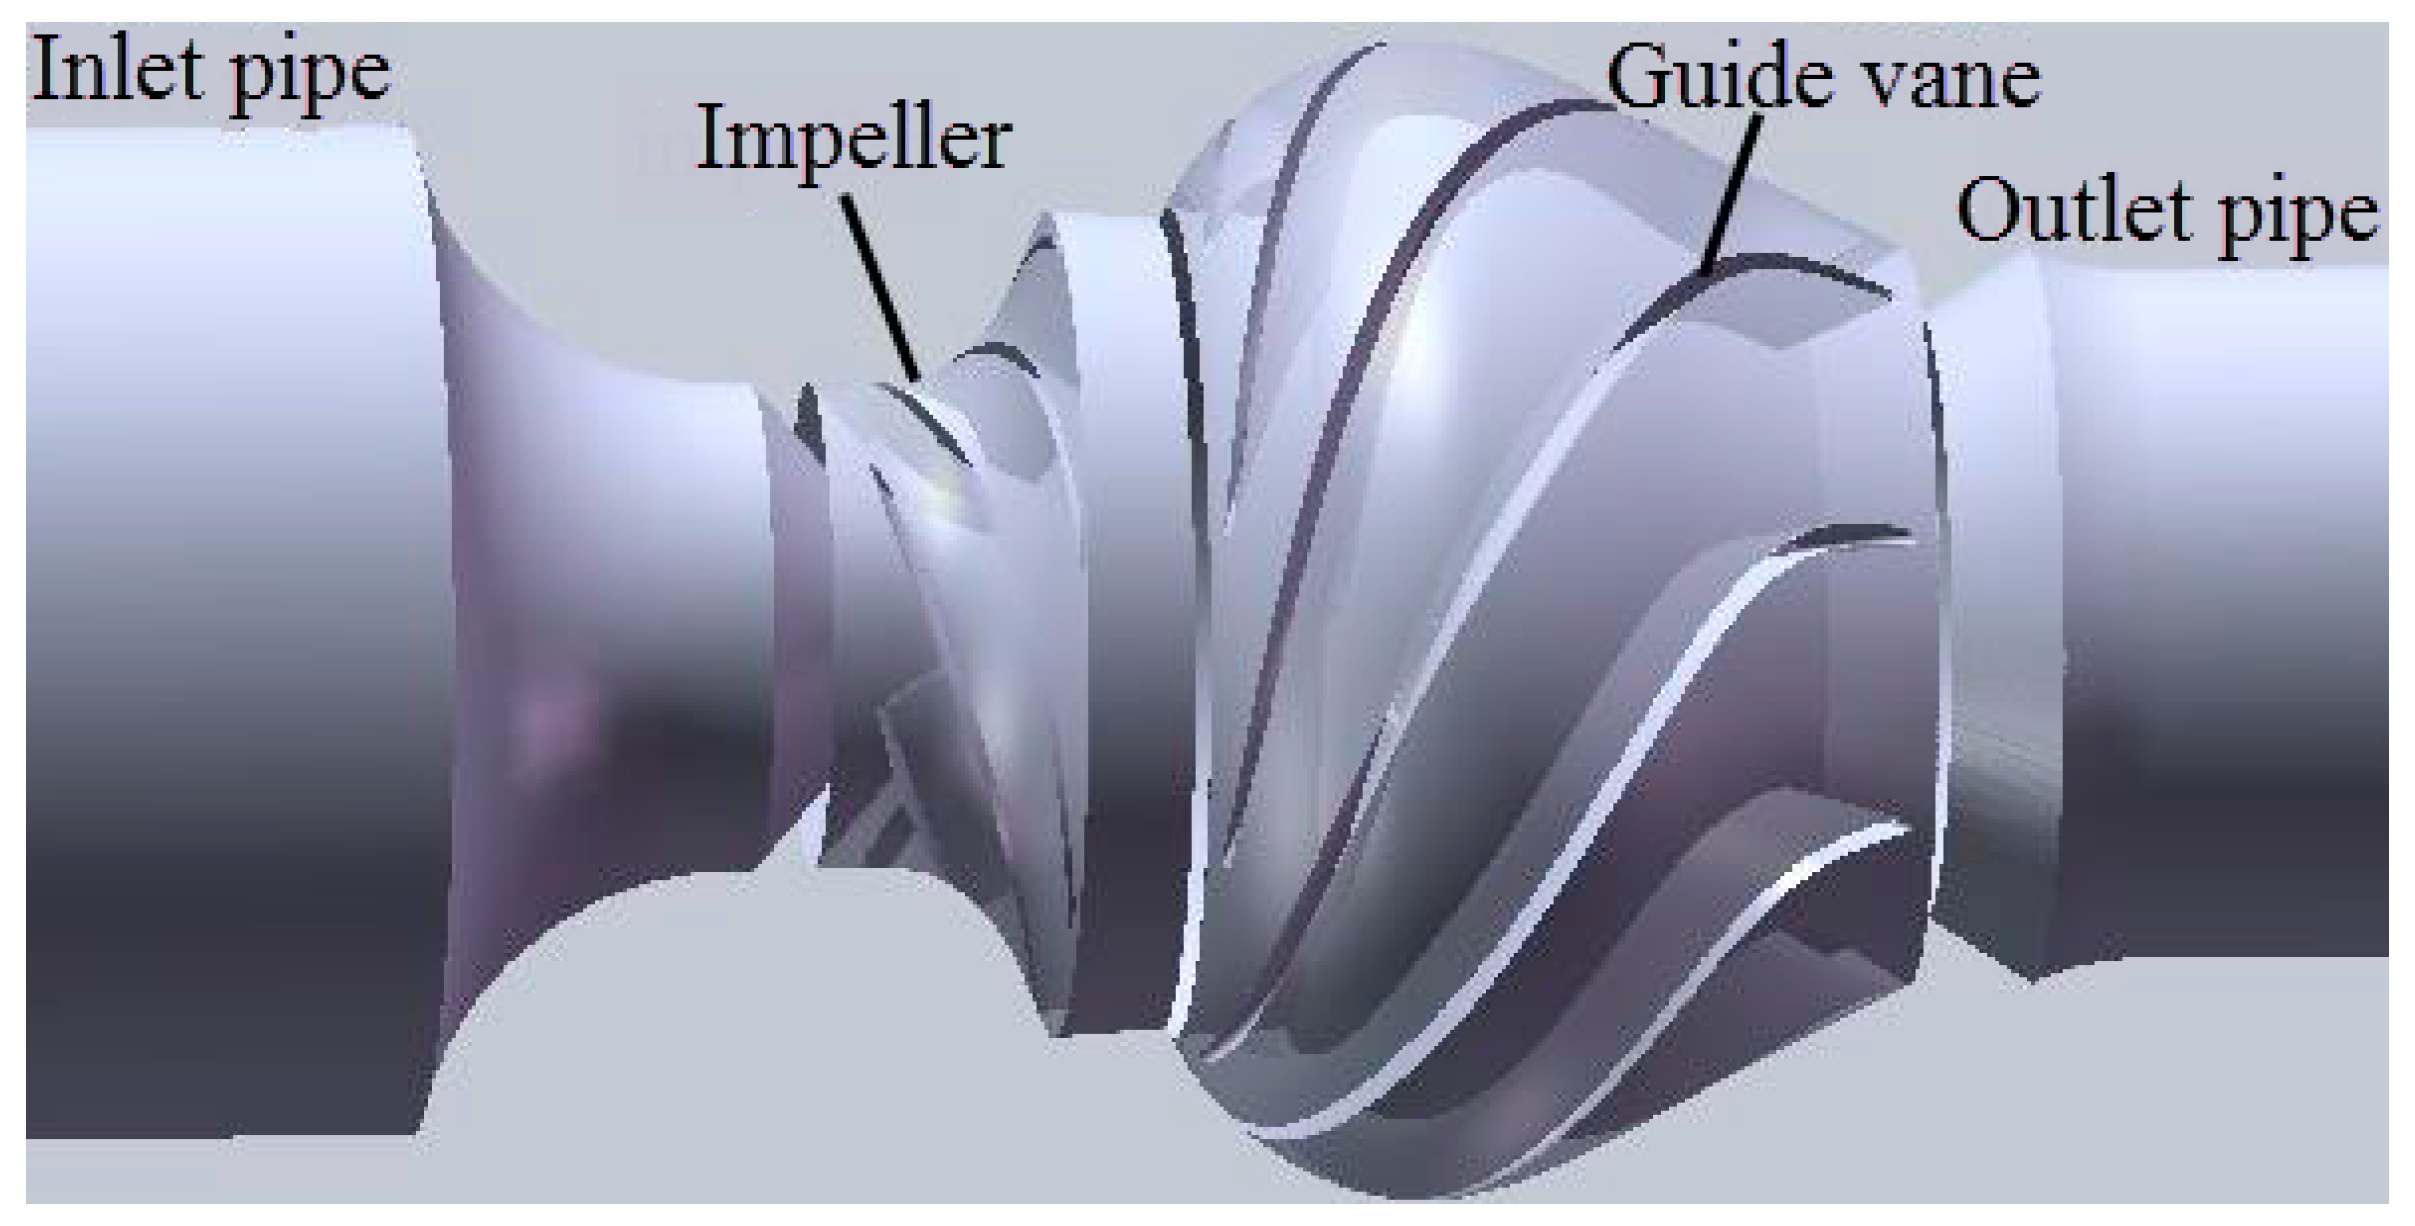
2.1. Numerical Model
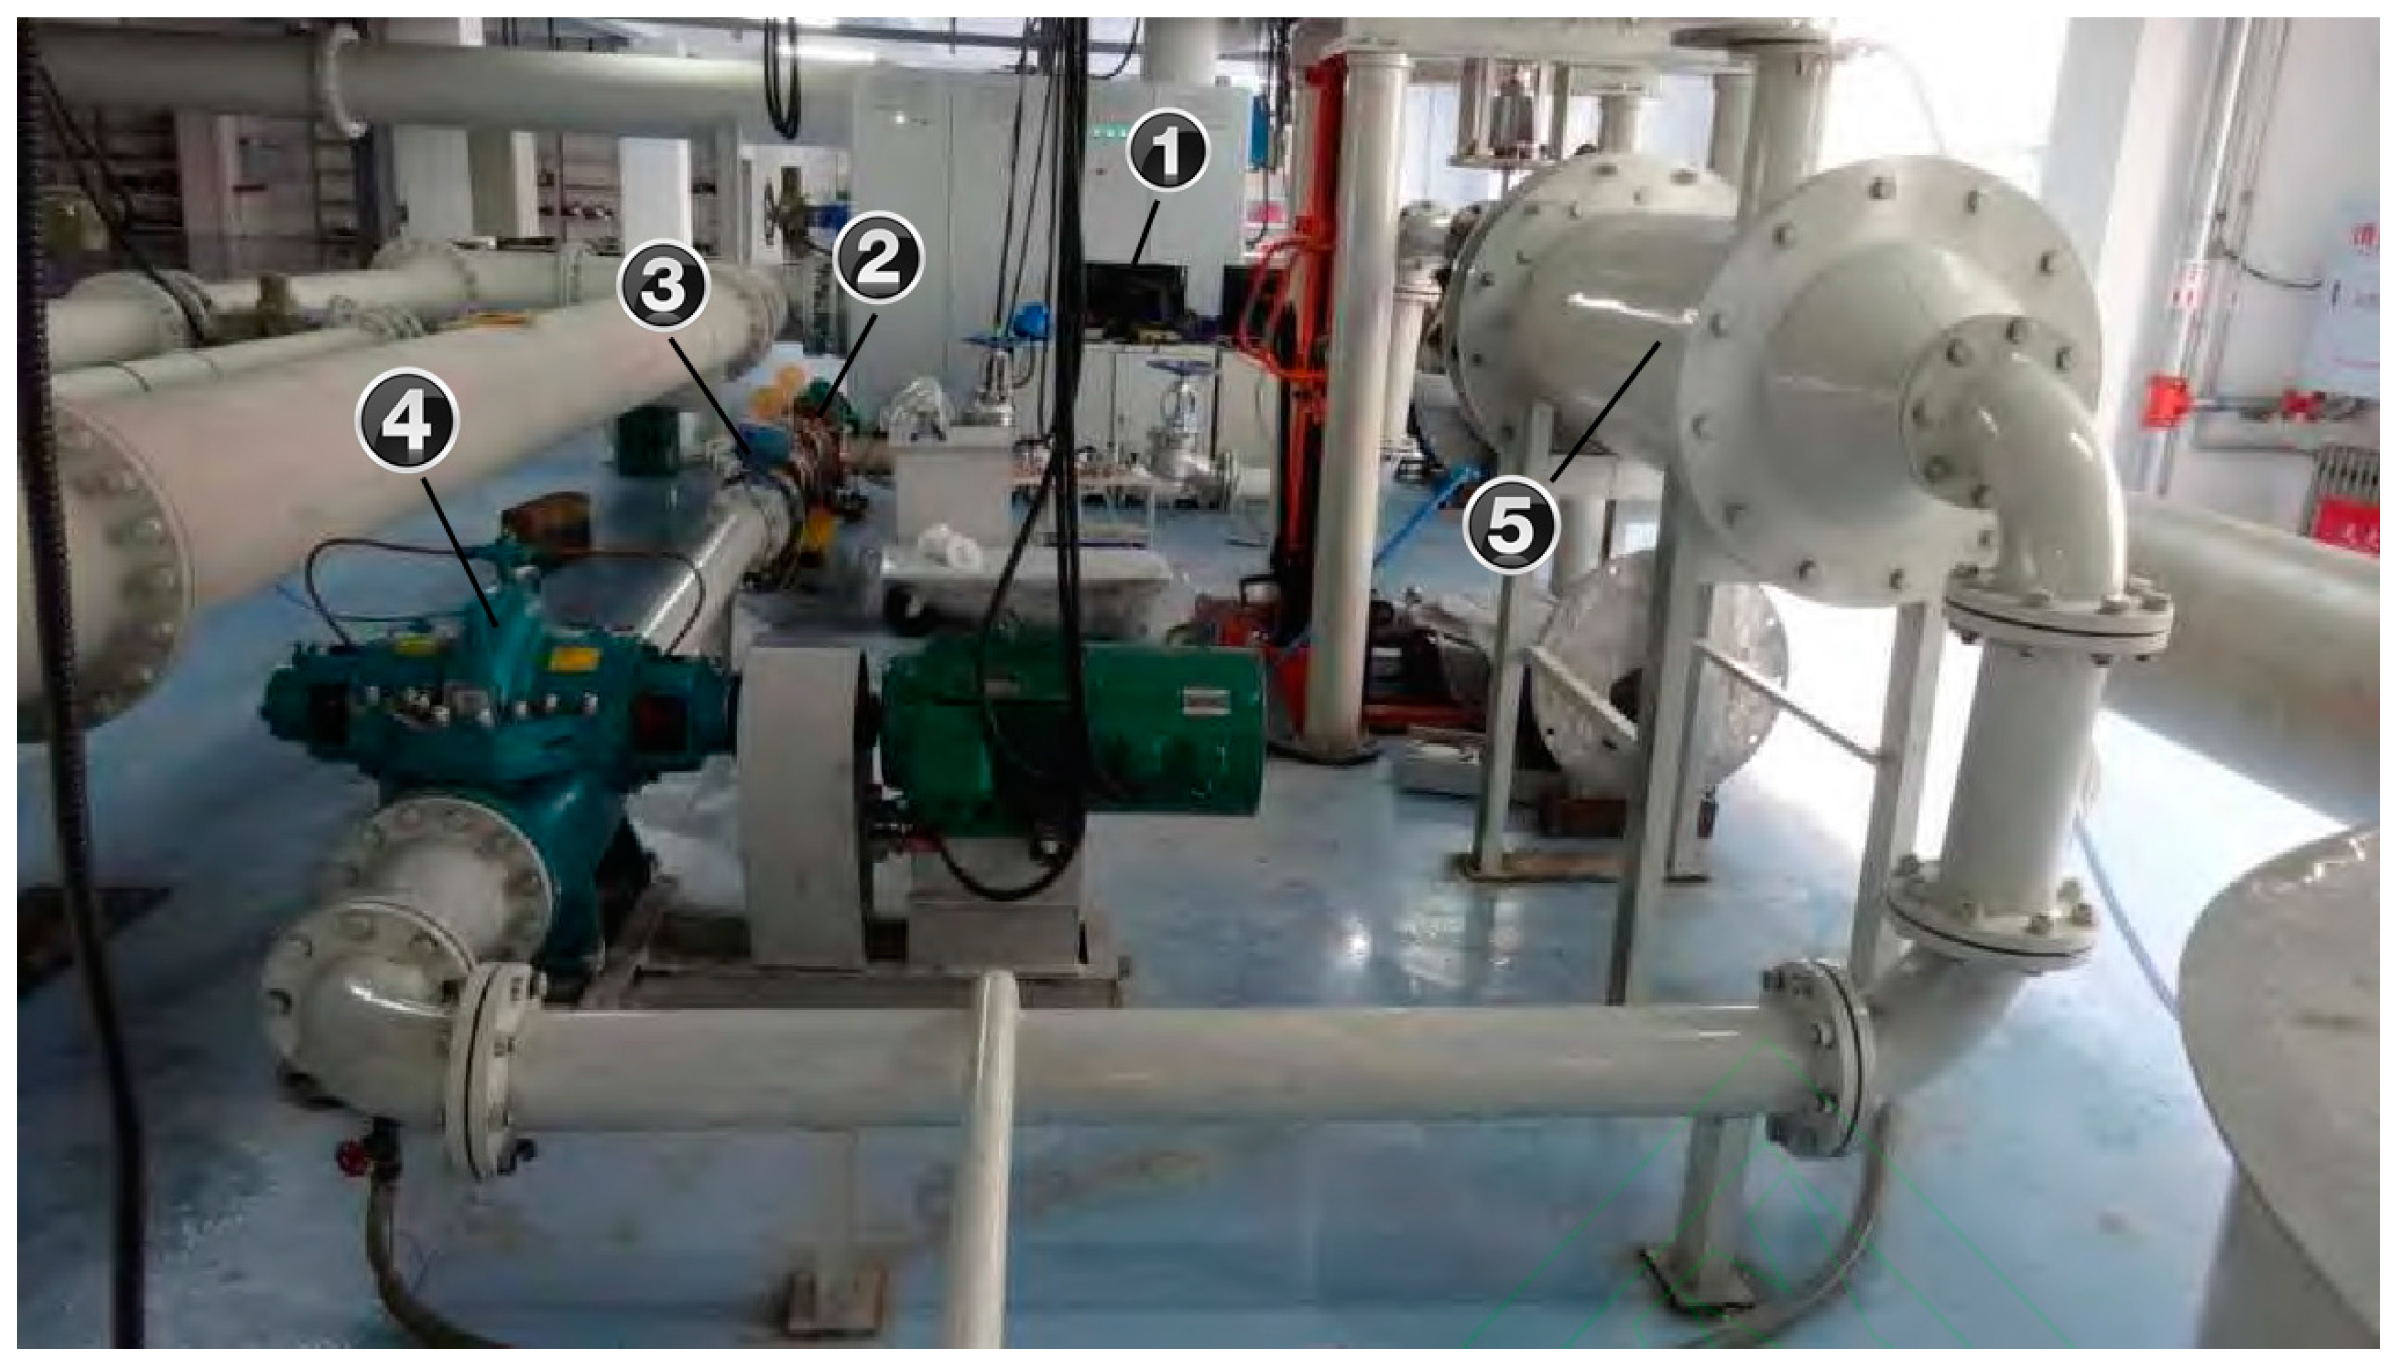
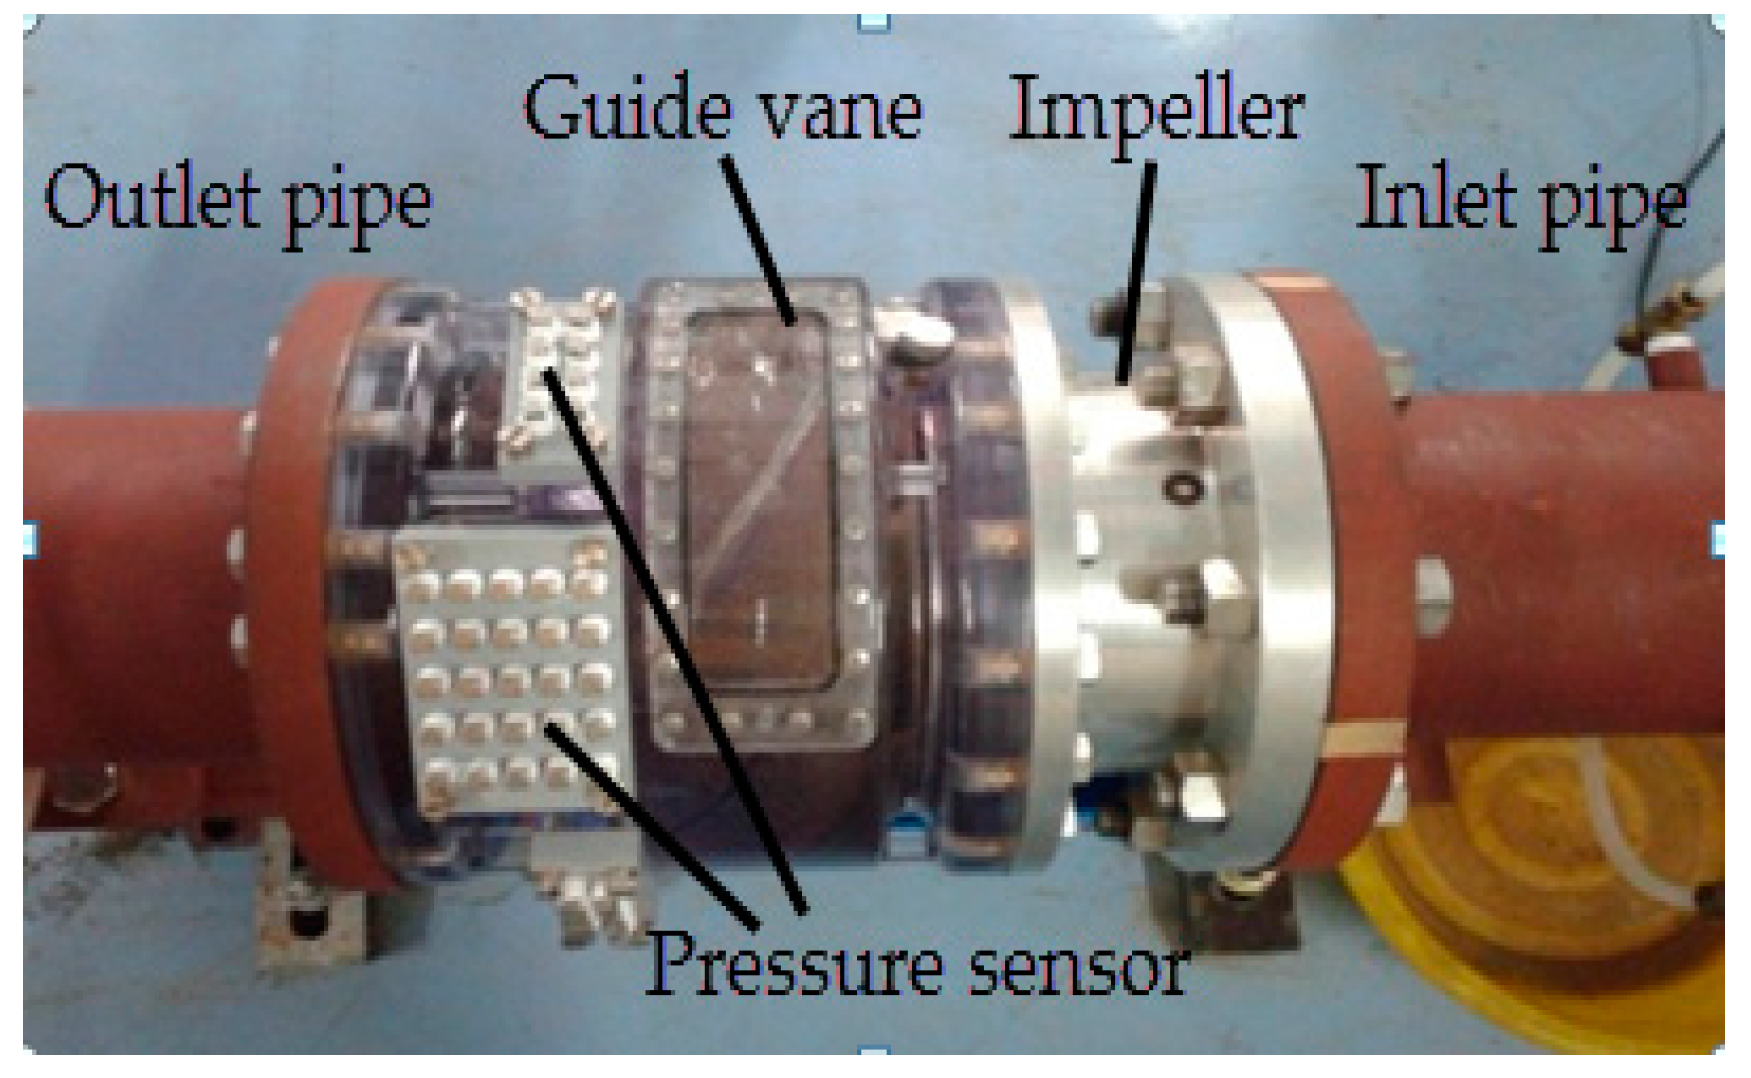
The three dimensional geometric model of the whole flow passage constructed with UG NX6.0 (Siemens PLM Inc., Nuremberg, Germany) is shown in Figure 1. It includes four parts: inlet pipe, outlet pipe, impeller, and guide vane. The main parameters of the mixed-flow pump are as follows: impeller diameter D is 150 mm, impeller blade number Z1 is 6, guide vane number Z2 is 8, design flow rate Qd is 1.39 m3/min, design speed n is 2000 r/min, design head H is 14.59 m, and power P is 5.5 kW. Then, according to Formula (1) [4], we can determine that the specific speed of this pump is 149:
n s = 3.65 n q v H 3 / 4
where n is rotational speed (r/min); qv is flow rates, qv = Qd/60 (m3/s); H is design head (m).

2.2. Test System

The pump was designed and tested by Kubota and the Harbin Institute of Large Electrical Machinery, respectively. Figure 2 and Figure 3 are the test system and test model, respectively. Here, clear water was used as the working medium so as to observe the flow states in the passage. Due to the technical limitations, it is impossible to know the pressure frequency characteristic by arranging sensors in rotating impellers. Therefore, the sensors in this study were only deployed on stationary parts and the trail points in the guide vane, as shown in Figure 4, where ps, ss and hs denote pressure surface, suction surface, and hub surface, respectively. The pressure information was collected with different rotational speeds and different flow rate conditions, and according to Formula (2), the sensor converted electric signal to pressure signal.
P = α Δ e × 10 6
where α is the correction coefficient and α = 0.188 × 10⁻⁶, Δe is the signal output value of the sensor. Table 1 lists the test results of hub central points Hi (i = 5–8) with different rotational speeds and different flow rate conditions in five stable periods. It can be seen that the pressure average value at the guide vane hub gradually increases along with the flow direction, while the standard deviation and relative standard deviation gradually decrease. The pressure standard deviation and relative standard deviation are calculated as:
S = 1 N i = 1 N [ P i ( t ) P i ¯ ] 2
R S = S P i ¯
where P i ( t ) is the pressure at time t, while P i ¯ is the time pressure average.

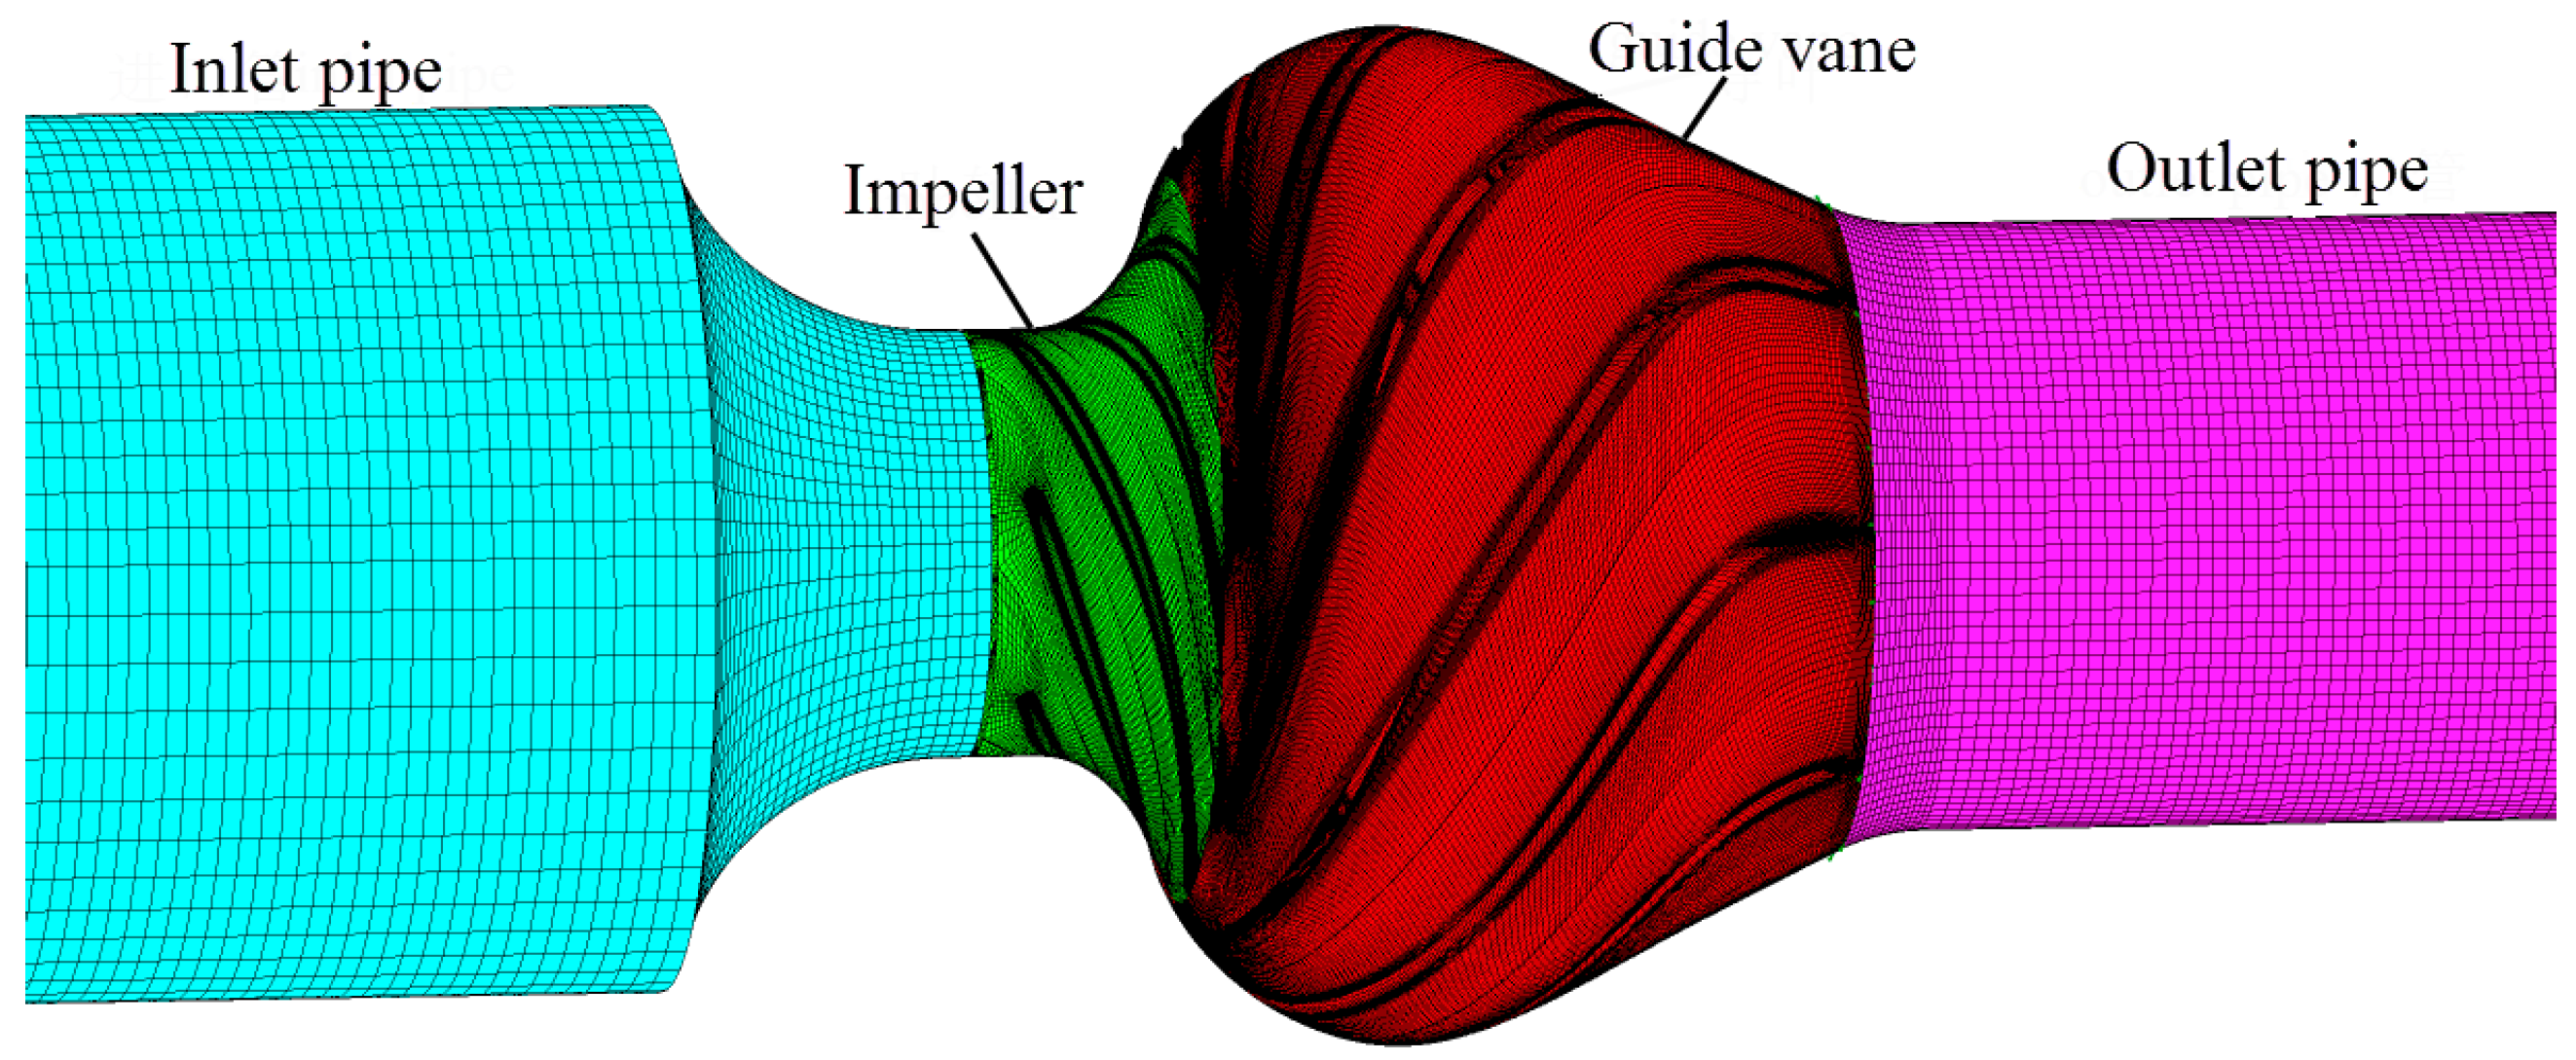
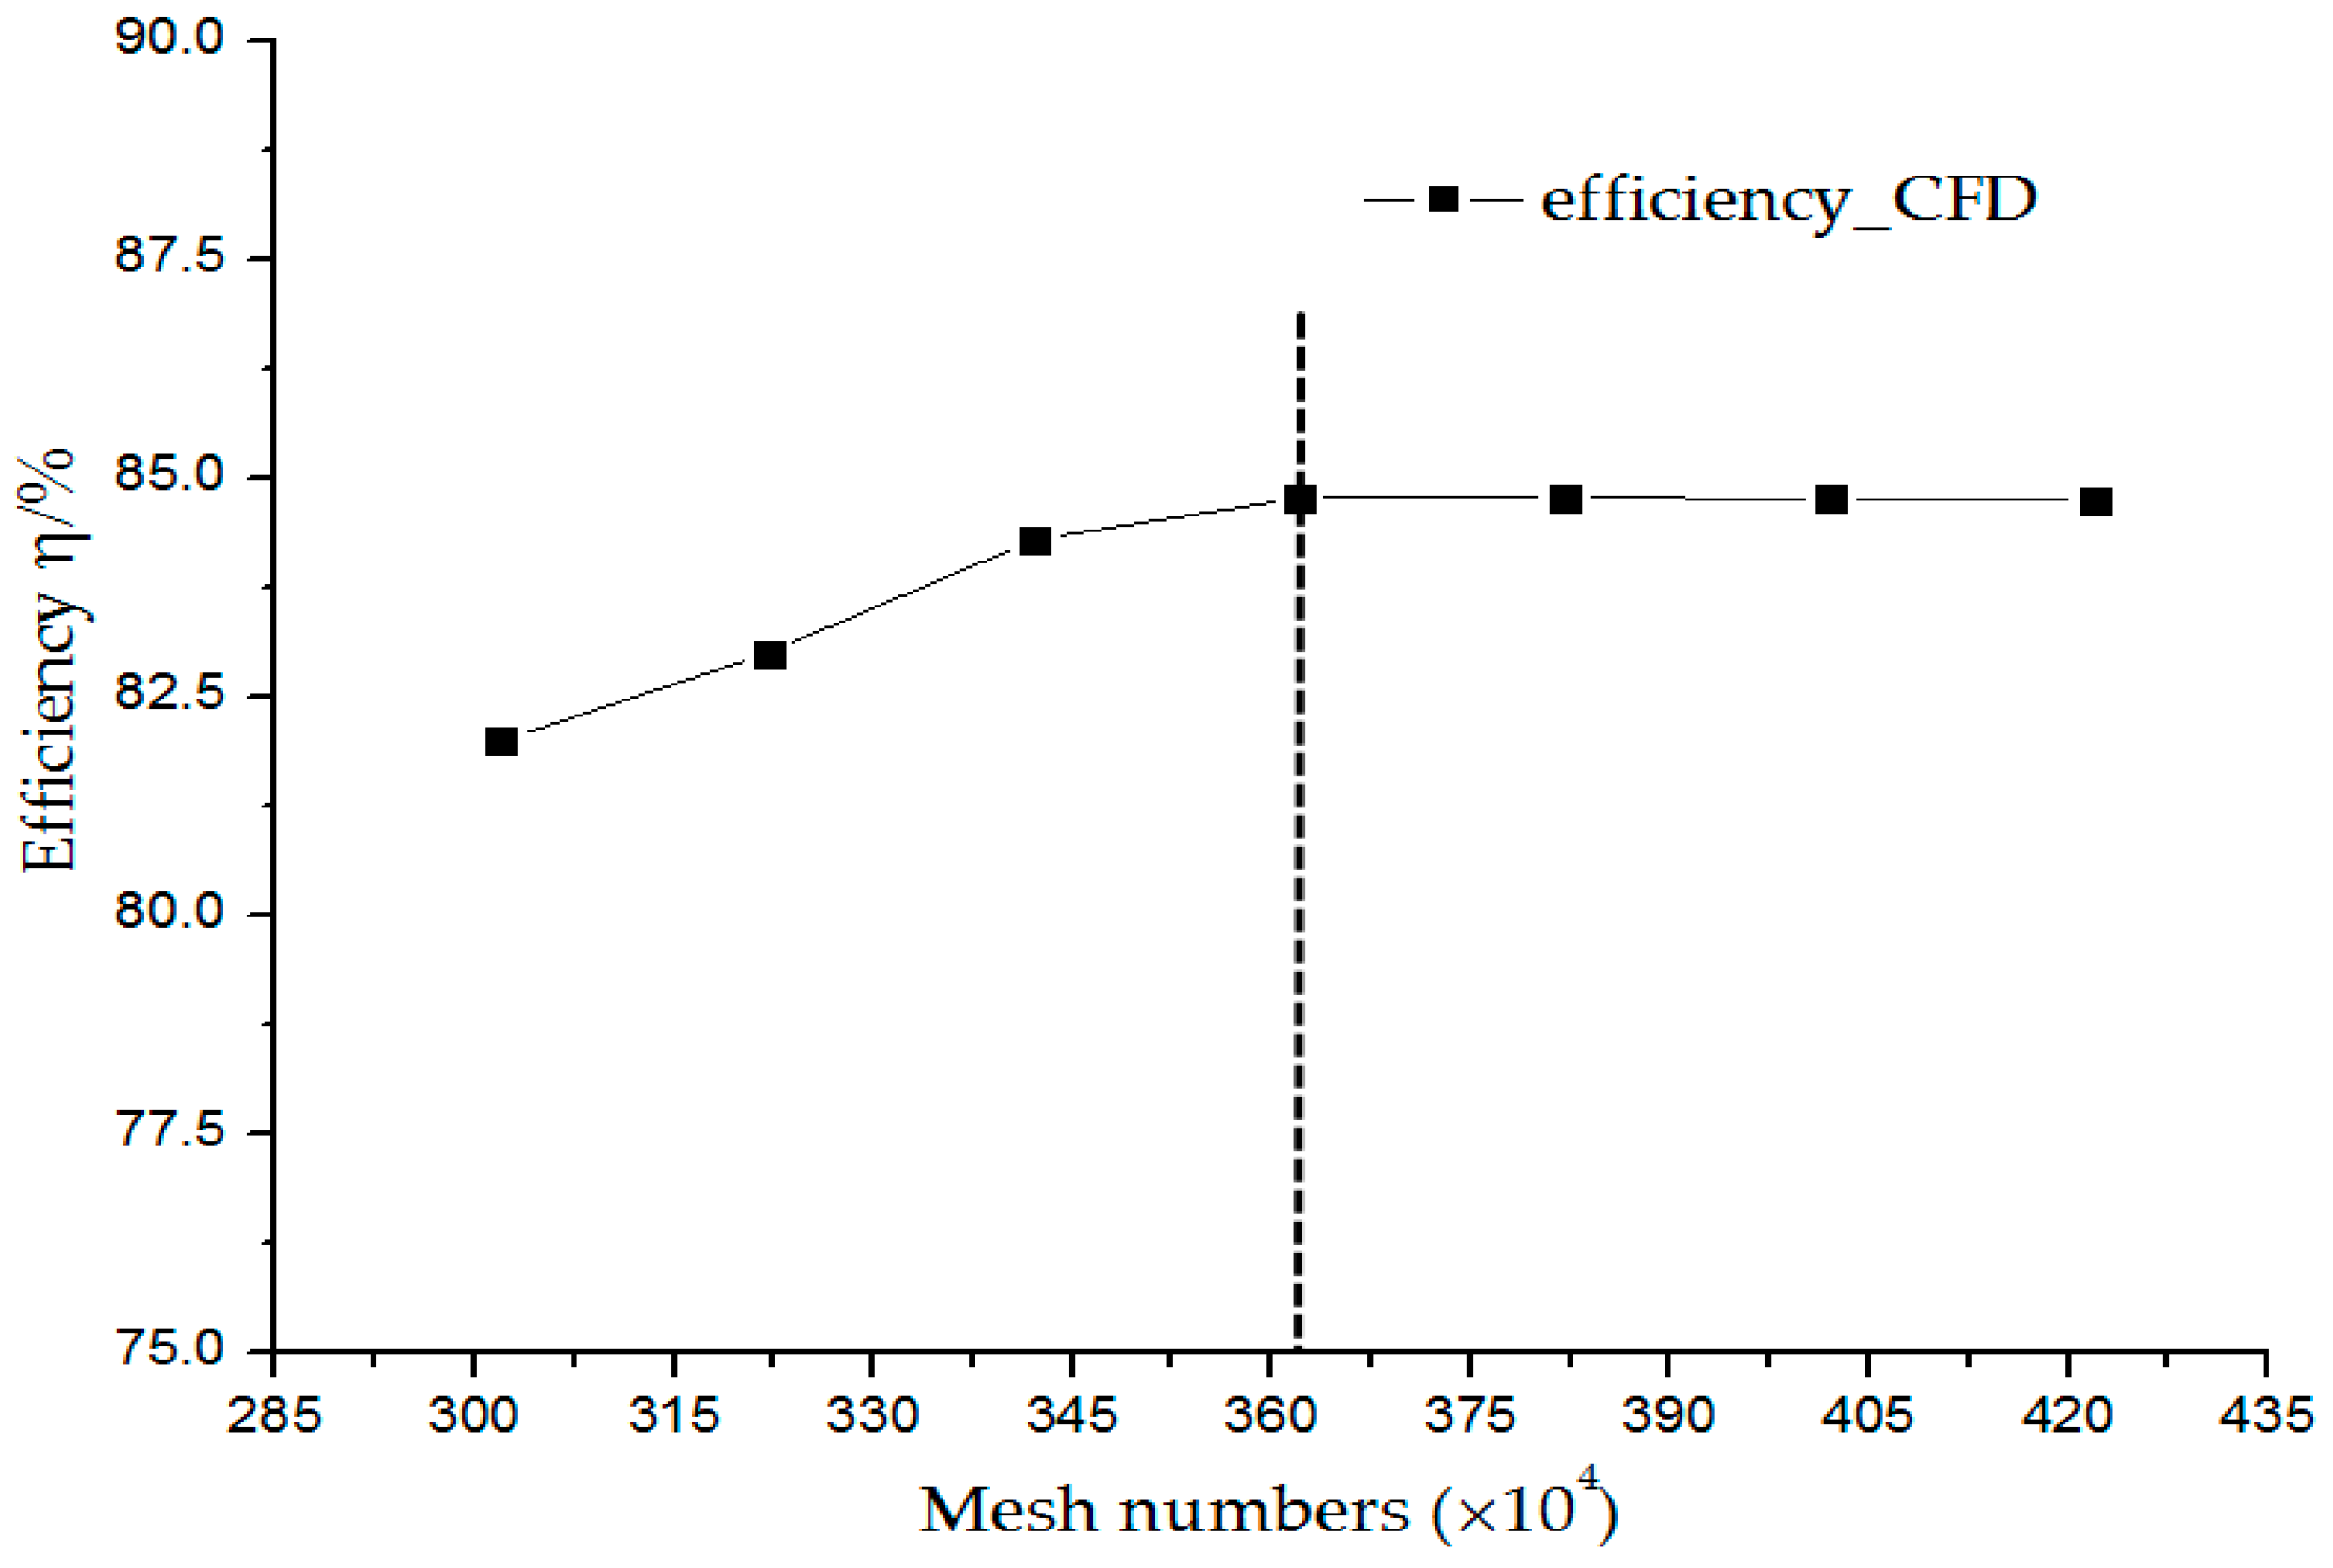
2.3. Computational Domain and Mesh

Separate meshes were generated for the inlet pipe, outlet pipe, impeller, and guide vane. The first two parts were generated by ICEM_CFD 14.0 (SAS IP, Inc., Pittsburgh, PA, USA), while the latter two parts were created with TurboGrid 14.0 (SAS IP, Inc., Pittsburgh, PA, USA). Further, H and J topology structures were adopted for the impeller and the guide vane, and an O-grid was generated around the blades [18]. The y+ values of the wall mesh of the impeller and guide vane are between 20 and 30, which satisfies the requirements of the shear stress transport (SST) turbulence model for y+ values [19]; meanwhile, by controlling the mesh ratio in the software of Turbogrid, we can make the mesh density increase gradually from the shroud region to the clearance region. The mesh for the whole computation domain is shown in Figure 5 and Figure 6, which also show the mesh independence of the mesh system at the design condition. The selected mesh number for the whole domain is determined as 3,624,513, and the element numbers and node numbers of each part of the computation domain are shown in Table 2.

3. Numerical Methods

3.1. Governing Equations

The conservation equations of mass and momentum for incompressible flow are written in Cartesian coordinates and can be written as:
u i x i = 0
u i t + ( u i u j ) x j = 1 ρ p x i + [ ( μ + μ t ) ( u i x j + u j x i ) ] x j + f i
where f i is Coriolis force (N); ρ is fluid density (kg/m3); u is relative velocity (m/s); p is pressure (Pa); μ is viscosity of the fluid (Pa·s); μ t is turbulent viscosity (Pa·s). The turbulence is modeled by a SST model which combines k-ε and k-ω models, where the k-ω model is adopted near the wall, while the k-ε model is adopted between the mainstream and outside of the boundary layer; this not only has high accuracy in predicting flow separation under an adverse pressure gradient [7], but also has certain applicability in the numerical description for the trajectory of the leakage vortex [20]. Here, the eddy viscosity is computed by:
μ t = ρ a 1 k max ( a 1 ω , S F 2 )
also:
F 2 = tan h ( a r g 2 2 )
a r g 2 = max ( 2 k β ω y , 500 ν y 2 ω )
where a 1 and β were model constants and a 1 = 5 / 9 , β = 0.09 ; S is the invariant measure of the strain rate; and k and ω are the turbulence kinetic energy and turbulence frequency, respectively.

3.2. Boundary Conditions and Numerical Solution

At the inlet of the computation domain, velocity was specified according to experimental values and the turbulence intensity was set as 5%; at the outlet, free outflow conditions were adopted; at all wall boundaries, a non-slip condition of viscous fluid was used, and the logarithmic wall function approach was applied in the near wall region. A transient rotor-stator approach was adopted for data exchange in the rotor-stator interaction region (namely the impeller/inlet pipe interface and the impeller/guide vane interface). The unsteady simulation begins with the initial field of steady simulation results, and the unsteady solution settings are listed in Table 3.

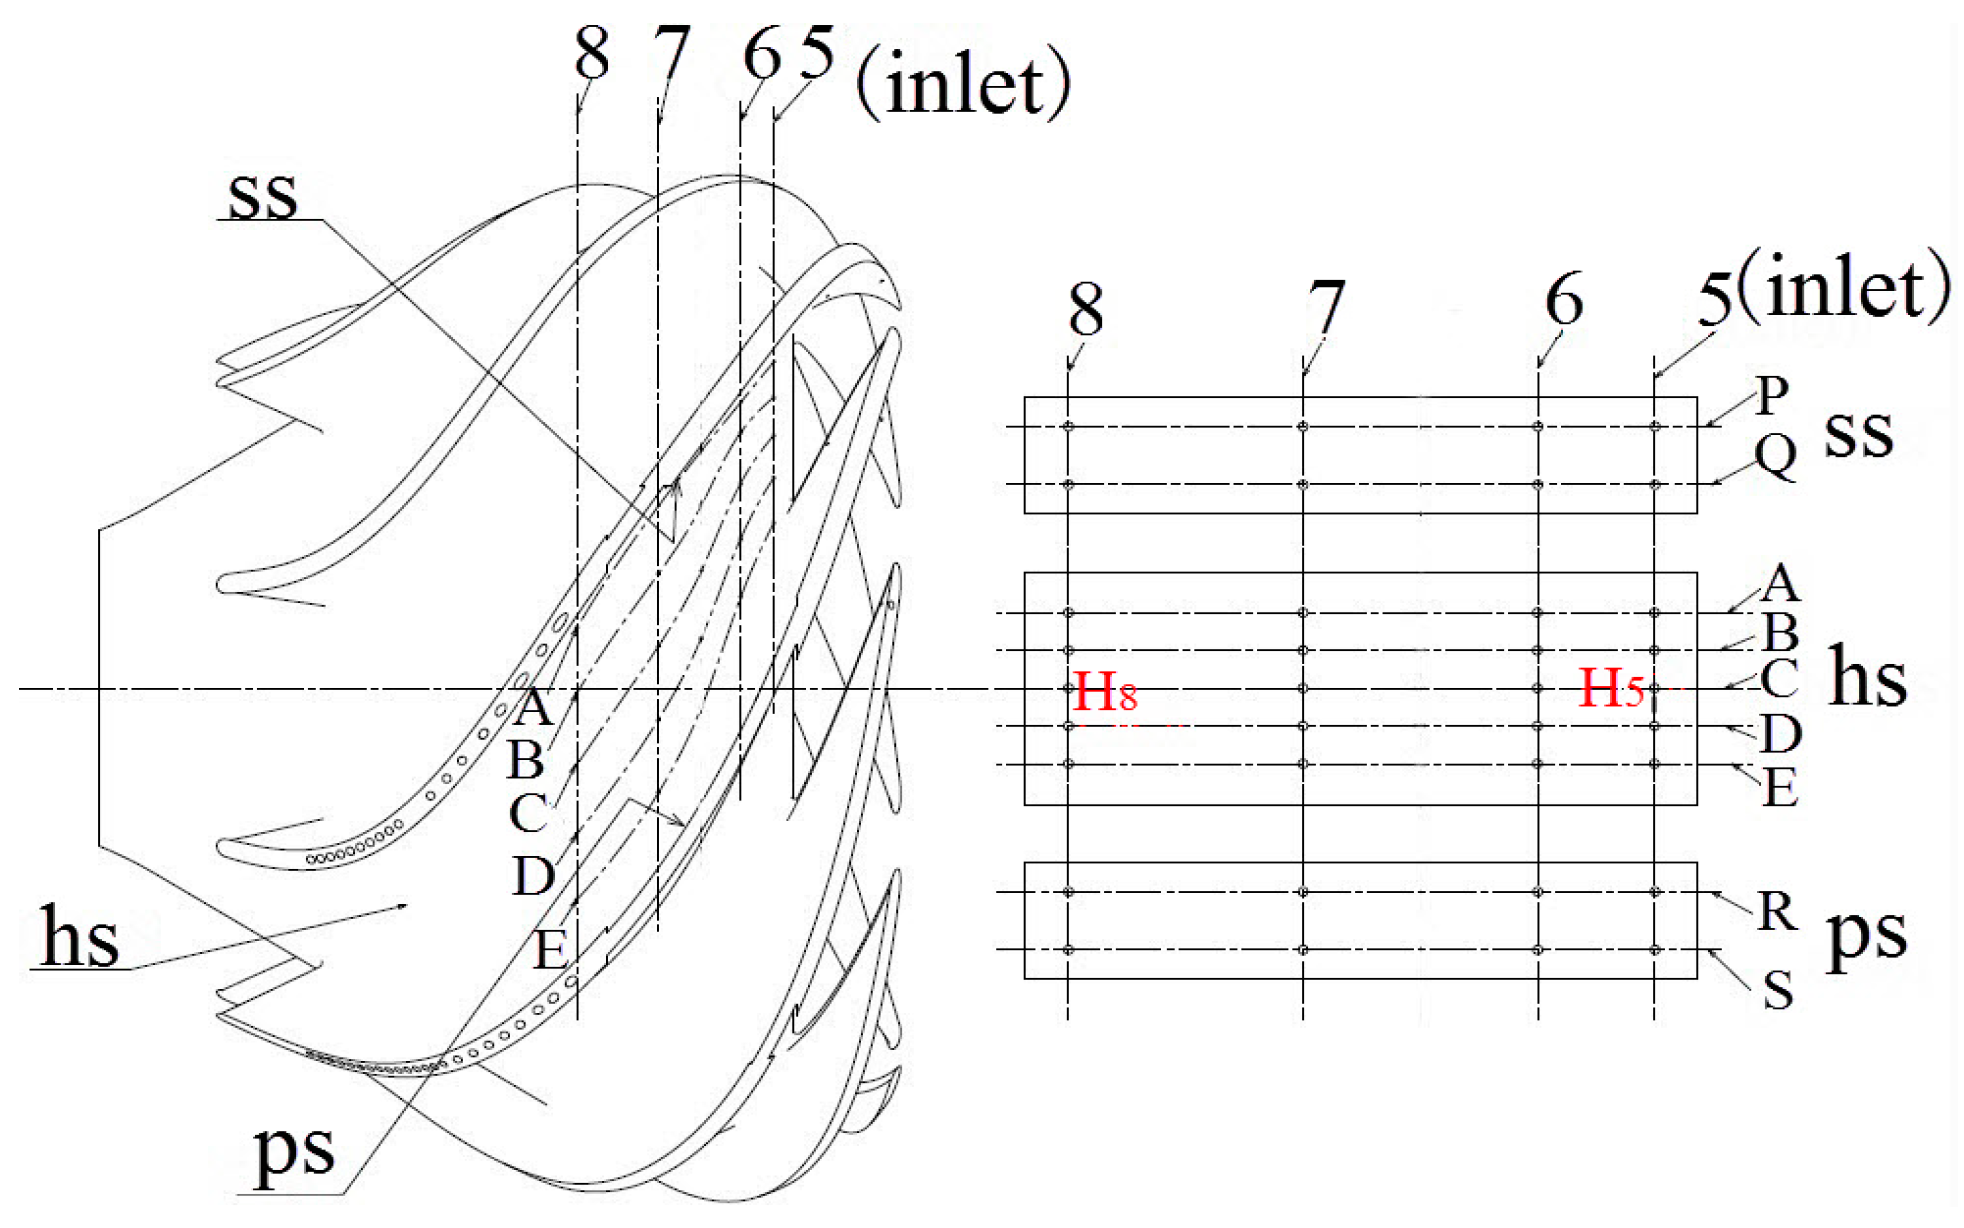
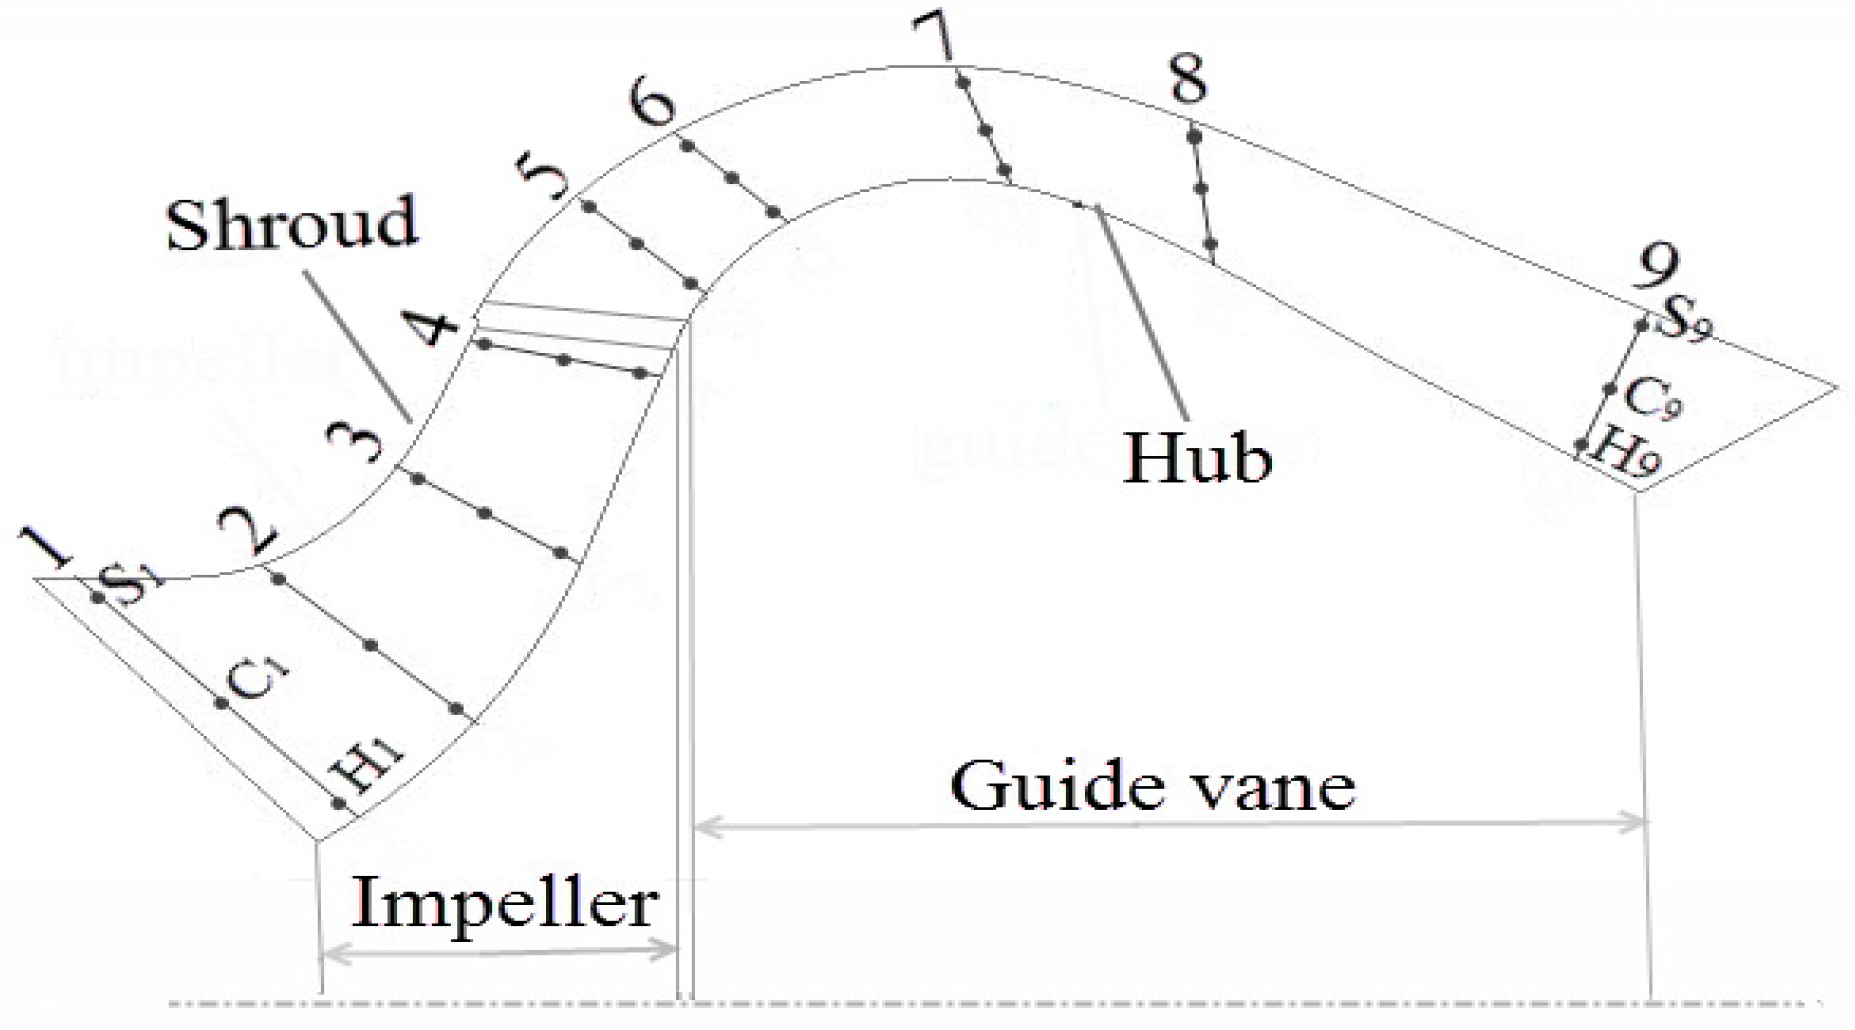
3.3. Monitoring Points Setting

To obtain the characteristics of pressure fluctuation in the mixed-flow pump, four and five monitoring sections were set in the impeller and guide vane from inlet to outlet, respectively, and denoted as i (where i = 1–9). Where Si, Ci, and Hi (where i = 1–9) denote the central points on the section from the shroud to hub, as shown in Figure 7.

4. Results and Discussion

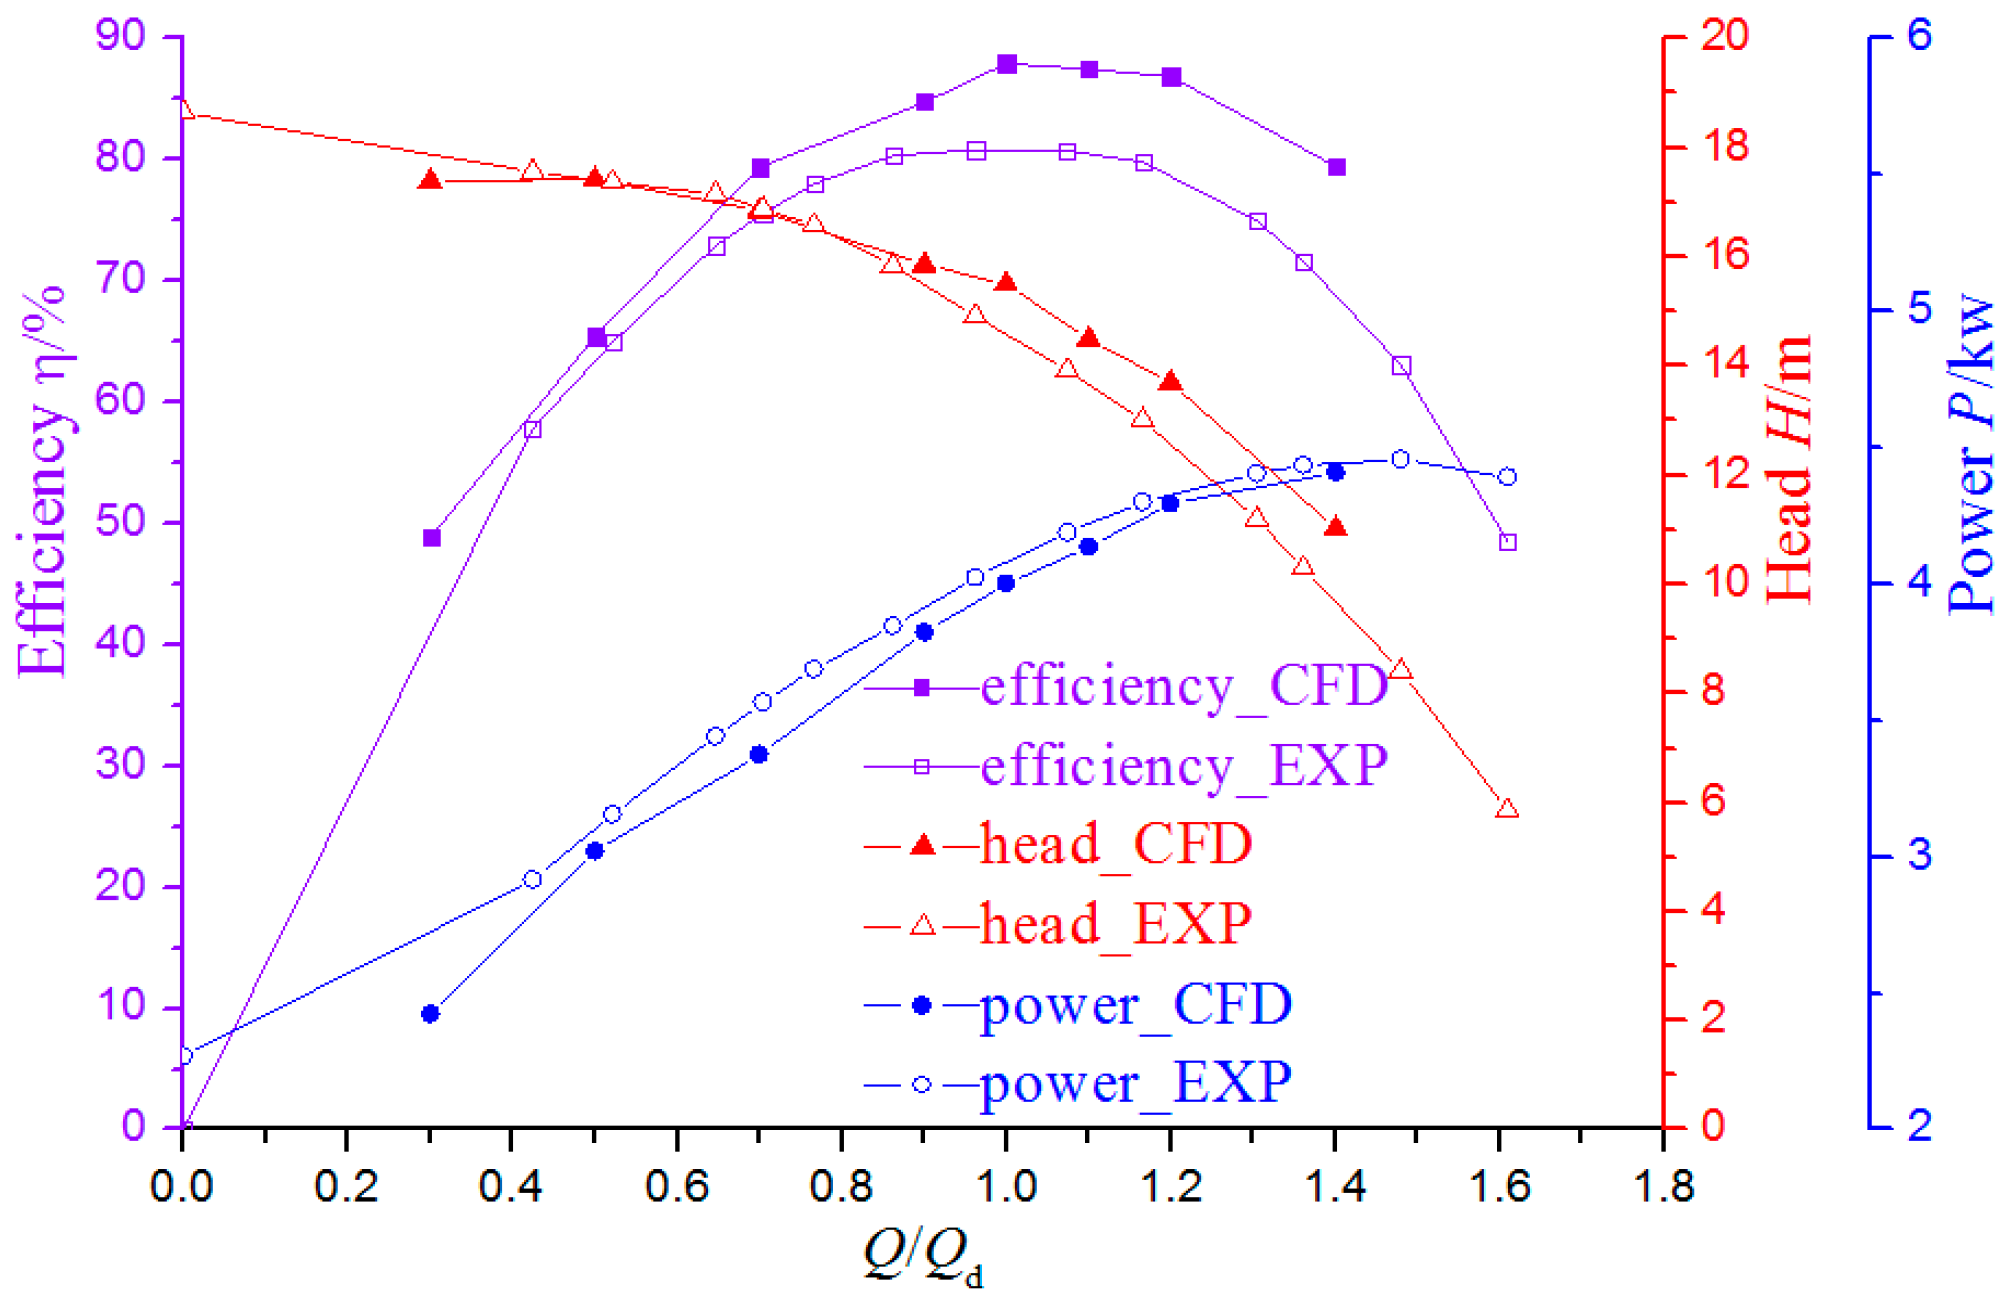
4.1. Performance Prediction and Validation

To verify the reliability of the numerical model, the unsteady internal flow of the pump was simulated at eight flow rate conditions. The comparison of numerical results (δ = 0.25 mm is design tip clearance) and experimental results are listed in Figure 8. The efficiency, head and power curves from the simulation agree well with the experimental results, which demonstrates that the numerical approach is reliable. Meanwhile, the pump not only has the advantage of a high efficiency area, but also avoids the saddle phenomenon of a traditional mixed-flow pump, which illustrates that the design method of the mixed-flow pump is reasonable.
Table 4 lists the values of efficiency and head in different flow rate and clearance conditions. It shows that the efficiency at design flow rate is the highest, regardless of the clearance value. Meanwhile, the efficiency and head decrease with the increase of tip clearance, which demonstrates that 0.25 mm is the best size herein to get lowest energy loss. For the cases with the clearance size smaller than 0.25 mm, we can estimate that the energy loss will be reduced because of the attenuated tip-leakage. However, the velocity gradient in the clearance region will also increase with a smaller clearance size, which might enhance the rotor-stator interaction as well as the pressure fluctuation. On this issue, detailed investigation will be made in our future study.

4.2. Influence of Tip Clearance on Pressure Fluctuation in the Impeller

The pressure fluctuation coefficient of points S1–S4 in the middle of the shroud of the section from the impeller inlet to outlet at different tip clearances in design condition is presented in Table 5. Here, the pressure fluctuation coefficient is defined as:
C p = S ρ g H d × 100 %
where ρ is fluid density; H d is design head; S is standard deviation of pressure fluctuation, as shown in Formula (3).
As shown in Table 5, on the whole, the pressure fluctuation coefficients of the points in the middle of the section shroud increase gradually from inlet to outlet of the impeller passage at different tip clearances, while pressure fluctuation of the center points of the shroud near the impeller outlet increases significantly. The pressure fluctuation coefficient of point S4 at δ = 0.25 mm, 0.75 mm and 1.00 mm conditions are 7.70, 8.26 and 8.64 times the values of the no clearance condition, respectively. On the one hand, this is caused by the rotor-stator interaction between the rotor impeller and stator guide vane, on the other hand, because of tip-leakage, the flow near the shroud of the impeller outlet becomes more disordered. Meanwhile, pressure fluctuation at corresponding points in the middle of the section shroud increase as the tip clearance increases, while pressure fluctuation of corresponding points suddenly increases when the clearance exceeds 0.75 mm, which results from the existence of clearance between the impeller blades and the shroud (which leads to fluid leakage), while the structure of the tip-leakage vortex—which is formed by the mix between the separation vortex caused by leakage flow and the mainstream near the blade suction surface—may seriously affect the flow state in mainstream [21], and hence generate larger pressure fluctuation.
The pressure fluctuation of point S4 at all four clearances in one period is presented in Figure 9. The pressure average of point S4 decreases as the tip clearance increases, and eight peaks and valleys occur in one circle at the no clearance condition, while six occur with tip clearance, which accords with the blade numbers of the guide vane and impeller, respectively. Through fast Fourier transform (FFT), the corresponding frequency domain diagram is shown in Figure 10. The domain frequency of pressure fluctuation of point S4 is 8 fn and 6 fn at no clearance and clearance conditions, respectively (corresponding to Figure 10), and the fluctuation amplitude for dominant frequency at δ = 0.25 mm, 0.75 mm and 1.00 mm conditions is 6.95, 7.89 and 8.44 times the no clearance condition, respectively. There are also N × 6 fn frequencies (where N a is positive integer) at the tip clearance condition, which results from the action of periodic rotating of the impeller blades (Z1 = 6); moreover, when the tip clearance increases to a certain value, i.e., 1.00 mm, there are other frequencies with smaller amplitudes, which is closely related to the more disordered flow state caused by larger tip-leakage near the shroud.
In order to further study the influence of clearance on flow state near the shroud, streamlines distribution near the shroud at δ = 0.25 mm and 1.00 mm at the design condition is presented in Figure 11. Here, when δ = 0.25 mm, since the clearance is smaller, the leakage loss is smaller which leads to less disturbance to the mainstream of the impeller passage and the leakage vortex is not obvious. When clearance increases to 1.00 mm, the leakage vortex is obviously caused by tip-leakage, and almost disappears at about three-quarters of the chord length of the impeller passage after the interaction between the leakage vortex and mainstream.
The velocity vector and pressure distributions of the central hub-to-shroud surface of the impeller passage when δ = 0.25 mm and 1.00 mm are shown in Figure 12 and Figure 13. From Figure 12a and Figure 13a, when clearance δ = 0.25 mm, flow separation happens near the tip clearance, the disturbance of the tip-leakage leads to an imbalance between the fluid inertia force within the boundary layer and the inverse pressure gradient, with corresponding pressure distribution of the axial surface as shown in Figure 13a. In addition, the clearance effect on the flow state of the mainstream on the central hub-to-shroud surface of the impeller passage is smaller. When clearance increases to 1.00 mm, flow separation near the shroud further intensifies, and a larger vortex and a larger range high speed zone appear at the impeller inlet (Figure 12b). As shown in Figure 13b, a larger range low pressure zone appears in the corresponding region, which leads to the degradation of cavitation performance.
From the above analysis, the existence of clearance between the impeller blades and the shroud leads to fluid leakage, and then flow separation occurs near the shroud. As clearance increases, flow separation is stronger and the leakage vortex is more obvious, resulting in stronger pressure fluctuation therein. Meanwhile, when clearance is 1.00 mm, pressure fluctuation of point S1 (the central monitoring point on the shroud of the impeller inlet section) suddenly increases, which is closely related to obvious leakage vortexes and a larger low pressure area (Figure 12b and Figure 13b).

4.3. Influence of Tip Clearance on Pressure Fluctuation in the Guide Vane

Due to the rotor-stator interaction, impeller rotation will have an effect on the flow field of the guide vane. Figure 14 shows the frequency domain of pressure fluctuation of points H5–H8 (Figure 4) located in the middle of the guide vane section hub at the design condition when tip clearance δ = 0.25 mm. Overall, the frequency domain of pressure fluctuation from the simulation agrees well with experimental results, with dominant frequency 6 fn and second dominant frequency 12 fn occurring in both conditions, while more low frequencies appear in the experiment, which may result from the vibration of the motor and test environment. The fluctuation amplitude for dominant frequency of points H5–H8 gradually decreases in both conditions, which illustrates that pressure fluctuation and rotor-stator interaction influence at the hub region of the guide vane are decreased along the flow direction.
The pressure fluctuation coefficient of points S5–S9 in the middle of the section shroud, from the inlet to the outlet of the guide vane passage with different clearances at the design condition, is presented in Table 6. Pressure fluctuation coefficients of points S5–S9 decrease gradually from inlet to outlet of the guide vane at all conditions, which illustrates that rotor-stator influence is weak; meanwhile, pressure fluctuation variation at corresponding points at the shroud region is small at different clearance conditions, which illustrates that clearance variation has less effect on fluctuation at the shroud region of the guide vane.
Through MATLAB post processing, the distribution of Cp in the guide vane passage was obtained according to Equation (10). Figure 15 shows the distribution of Cp on the central hub-to-shroud surface of the guide vane at the design condition. On the whole, pressure fluctuation intensity at these four clearance conditions decreases from the inlet to outlet of the guide vane passage. The pressure fluctuation gradient in the inlet region is also larger than for the central and outlet regions, which illustrates that the influence of rotor-stator interaction on pressure fluctuation in the guide vane passage is attenuated along the flow direction. Meanwhile, the pressure fluctuation coefficient in the guide vane is similar with clearance increases, which illustrates that the clearance variation of an impeller has less effect on pressure fluctuation in the guide vane for a low specific speed mixed-flow pump.

4.4. Comparison of Pressure Fluctuation between Impeller and Guide Vane

To obtain a clearer comparison of pressure fluctuation between the impeller and guide vane at different clearances (Q = Qd) and different flow rates (δ = 1.00 mm) conditions, the pressure fluctuation distribution of points in the middle of the section is shown in Figure 16 and Figure 17. As shown in Figure 16, the fluctuation of points C1–C9 is firstly enhanced and then weakened from the impeller inlet to the guide vane outlet at the first condition; also, fluctuation variation of points C1–C3 decreases when δ ≤ 0.75 mm, while it increases significantly when δ = 1.00 mm. Then, combined with Table 5 (pressure fluctuation coefficients of points S1–S4 in the impeller), it can be deduced that clearance leakage has less influence on fluctuations in the inlet and central regions of the impeller within a certain range of clearances. Beyond this range, fluctuations in the whole passage will increase significantly. At the design condition, pressure fluctuation of points C3–C4 is greater than for points C1–C3 with clearance increases, which results from tip-leakage and rotor-stator interaction. From Figure 14, it can be seen that clearance variation has less influence on the central points of the guide vane section. Combined with Table 6 (pressure fluctuation coefficients of points in the middle of the guide vane section shroud), it can be deduced that clearance variation has less effect on fluctuation in the guide vane. According to Figure 16, Table 5 and Table 6, in both the no tip clearance and tip clearance conditions, the maximum value of fluctuation locates near the guide inlet (points S5 and C5) and impeller outlet (points S4 and C4), respectively.
As shown in Figure 17, the fluctuation at points C1–C9 is firstly enhanced and then weakened from the impeller inlet to guide the vane outlet at the second condition, which demonstrates the effect of rotor-stator interaction, also firstly enhanced and then weakened. In the impeller, the pressure fluctuation intensity of points C1–C3 at small flow rate conditions (0.5Qd, 0.75Qd) will be lower than the design and large flow rate conditions (1.25Qd), while the pressure fluctuation of point C4 increased significantly at the 0.5Qd condition, which is 1.56, 1.67 and 1.51 times 0.75Qd, Qd and 1.25Qd conditions; meanwhile, pressure fluctuation of points C5–C9 is similar at 0.5Qd and 0.75Qd conditions, Qd and 1.25Qd conditions, whilst the pressure fluctuation of point C5 at 0.5Qd and 0.75Qd conditions are higher than Qd and 1.25Qd conditions, which may be caused by the complex flow state in the rotor-stator region at small flow rate conditions. According to Reference [14], a more serious rotating stall phenomenon occurs in the pump, leading to stronger pressure fluctuation (at the impeller outlet) and larger impact loss (at the guide vane inlet). From Figure 17, the fluctuation order of corresponding points C1–C9 is not obvious at four conditions, i.e., sometimes, fluctuation at Qd and 1.25Qd conditions is greater than at 0.5Qd and 0.75Qd conditions, which results from the analysis of Figure 17 at δ = 1.00 mm that is significantly larger than the design clearance 0.25 mm, which leads to larger tip-leakage and energy loss, thereby, the flow state of the fluid becomes more disordered.
According to Figure 17, the fluctuation at points C4 (impeller outlet) and C5 (guide vane inlet) at different flow rate conditions (δ = 1.00 mm) is obviously larger than for other points, so frequency domain diagrams of points C4 and C5 at different flow rate conditions are presented in Figure 18. The dominant frequencies of these two points are all 6 fn at different flow rates, resulting from the actions of clearance existence and the impeller on the guide vane, as the impeller blade number is 6. Meanwhile, for point C4, compared with point C5, there are also N × 6 fn frequencies (where N is a positive integer), which is related to impeller periodic rotation. Moreover, there are more frequencies at small flow rate conditions (0.5Qd, 0.75Qd) than in design and large flow rate conditions, which are closely related to the flow separation of small flow rate conditions.

5. Conclusions

Through numerical calculation, the characteristics of pressure fluctuation in a low specific speed mixed-flow pump were analyzed at different clearance and flow rate conditions. The results can be summarized as follows:
(1)
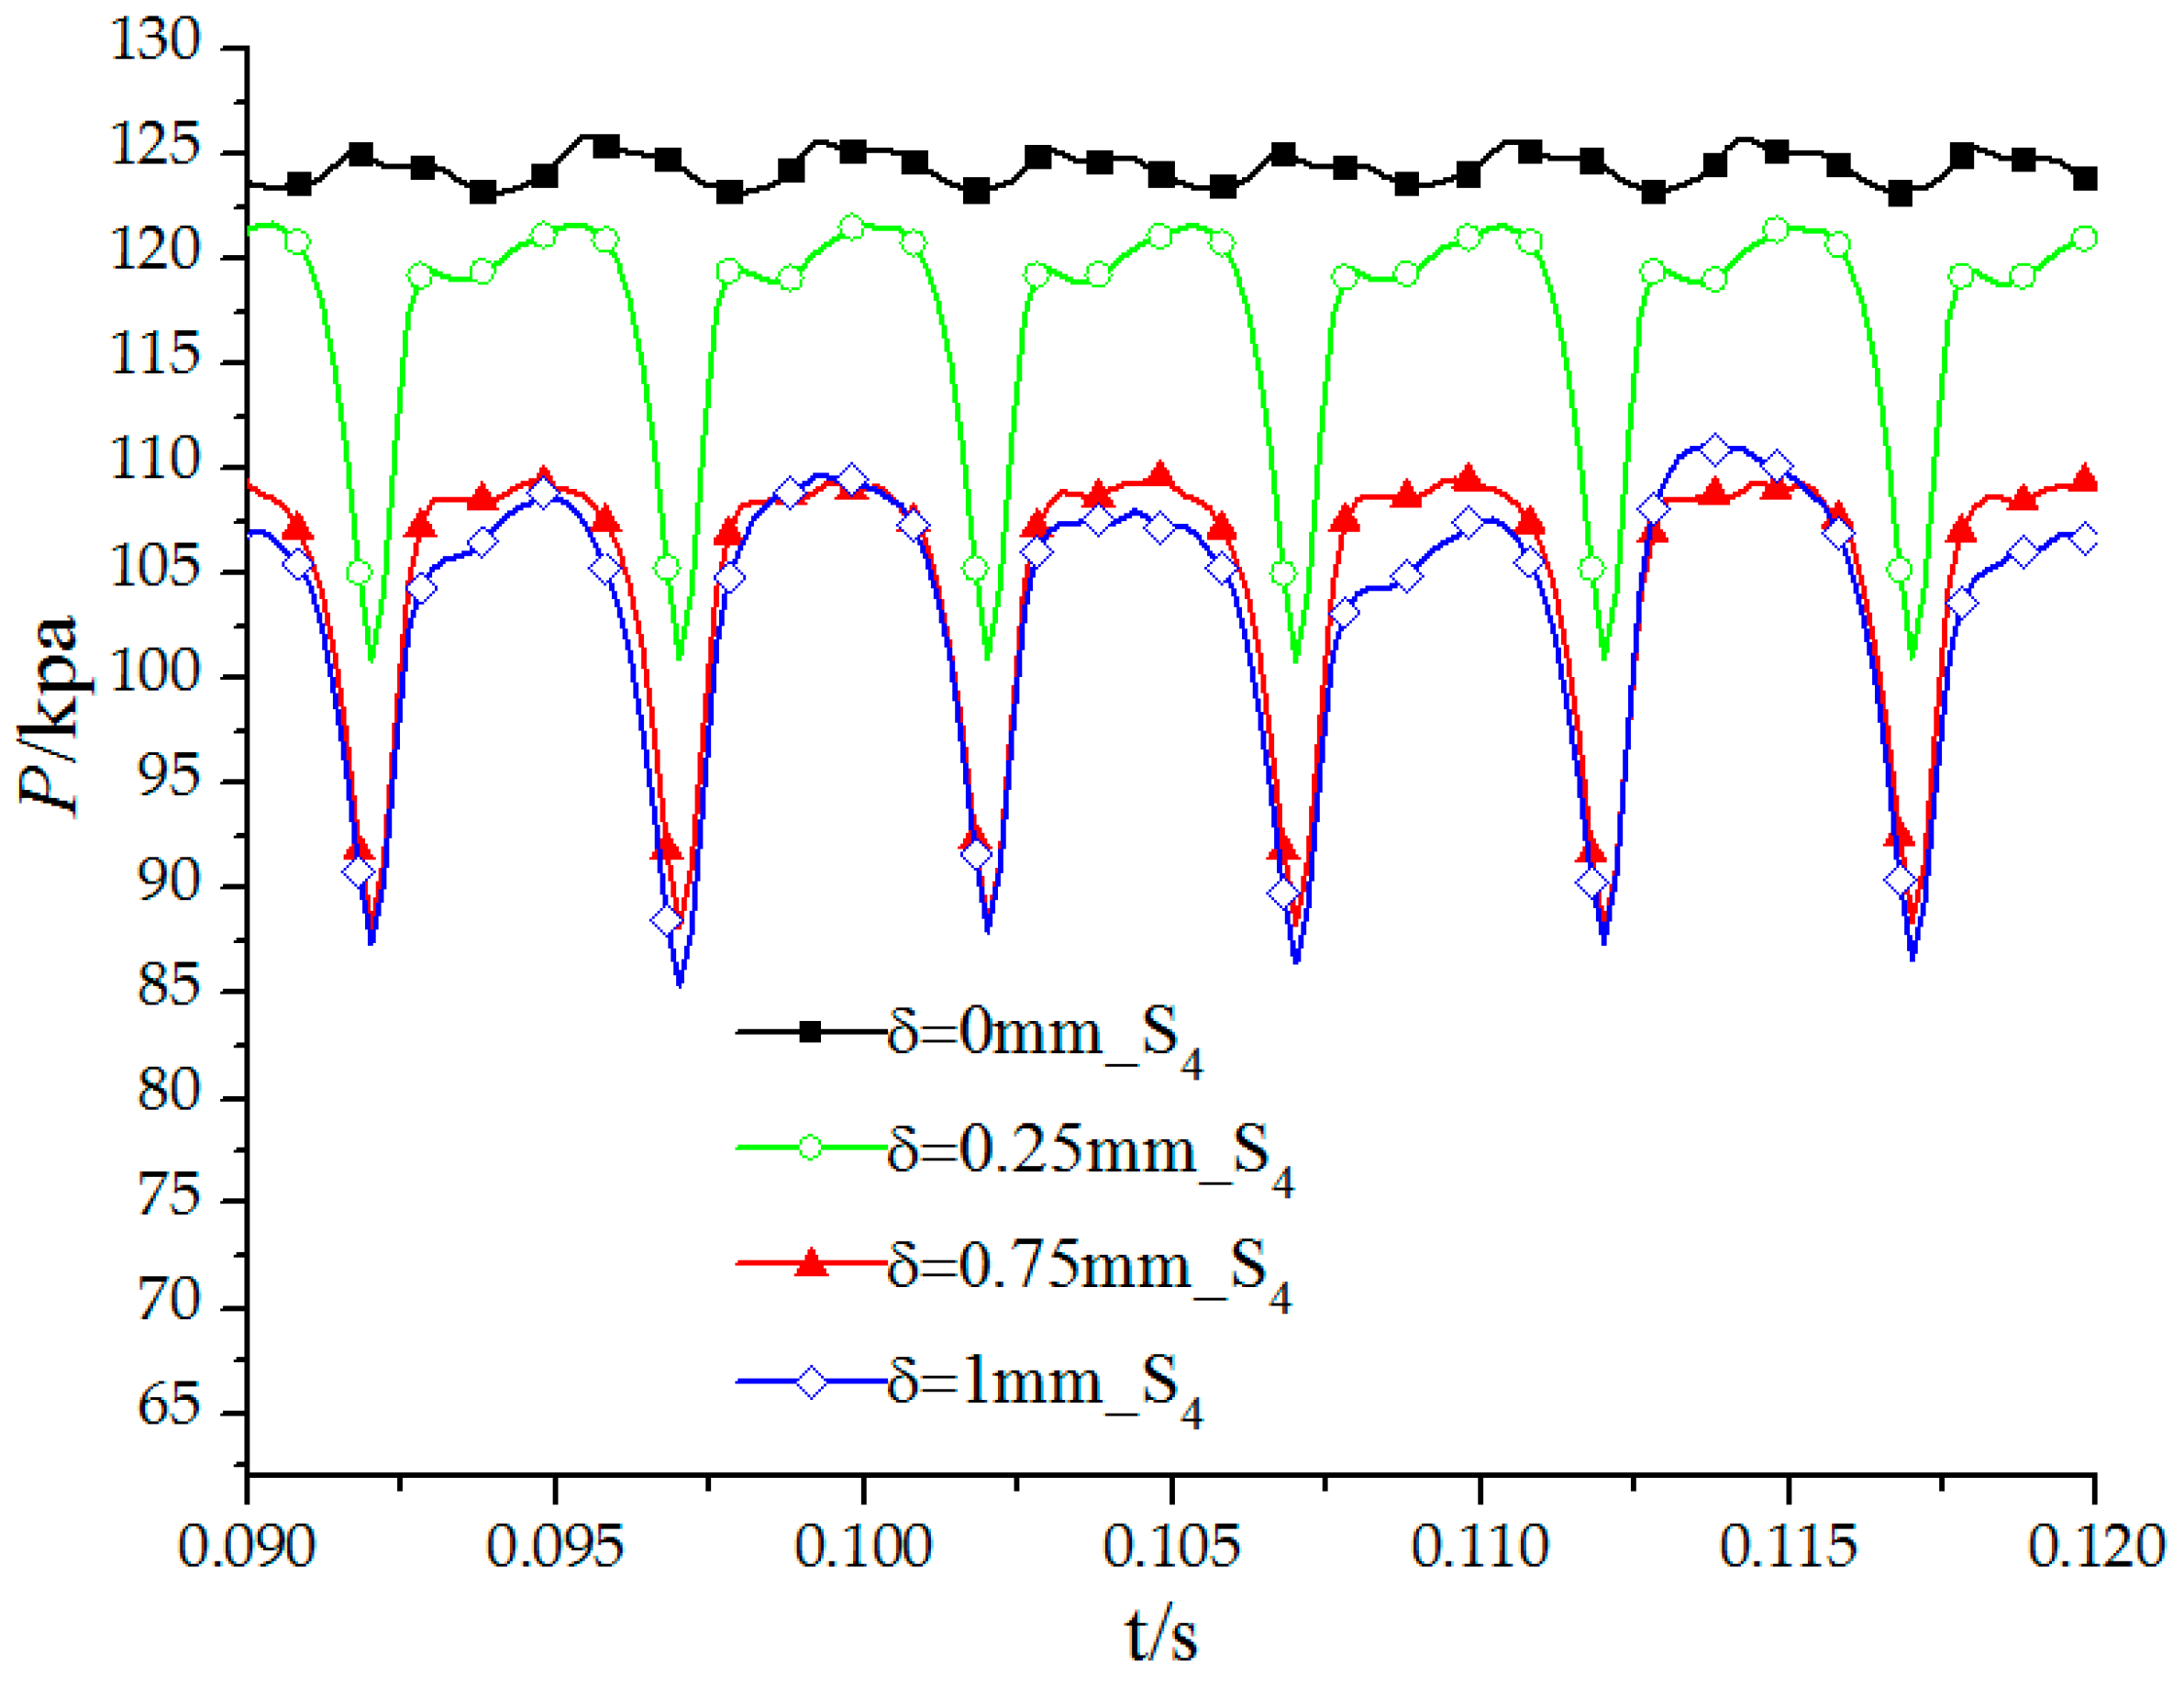
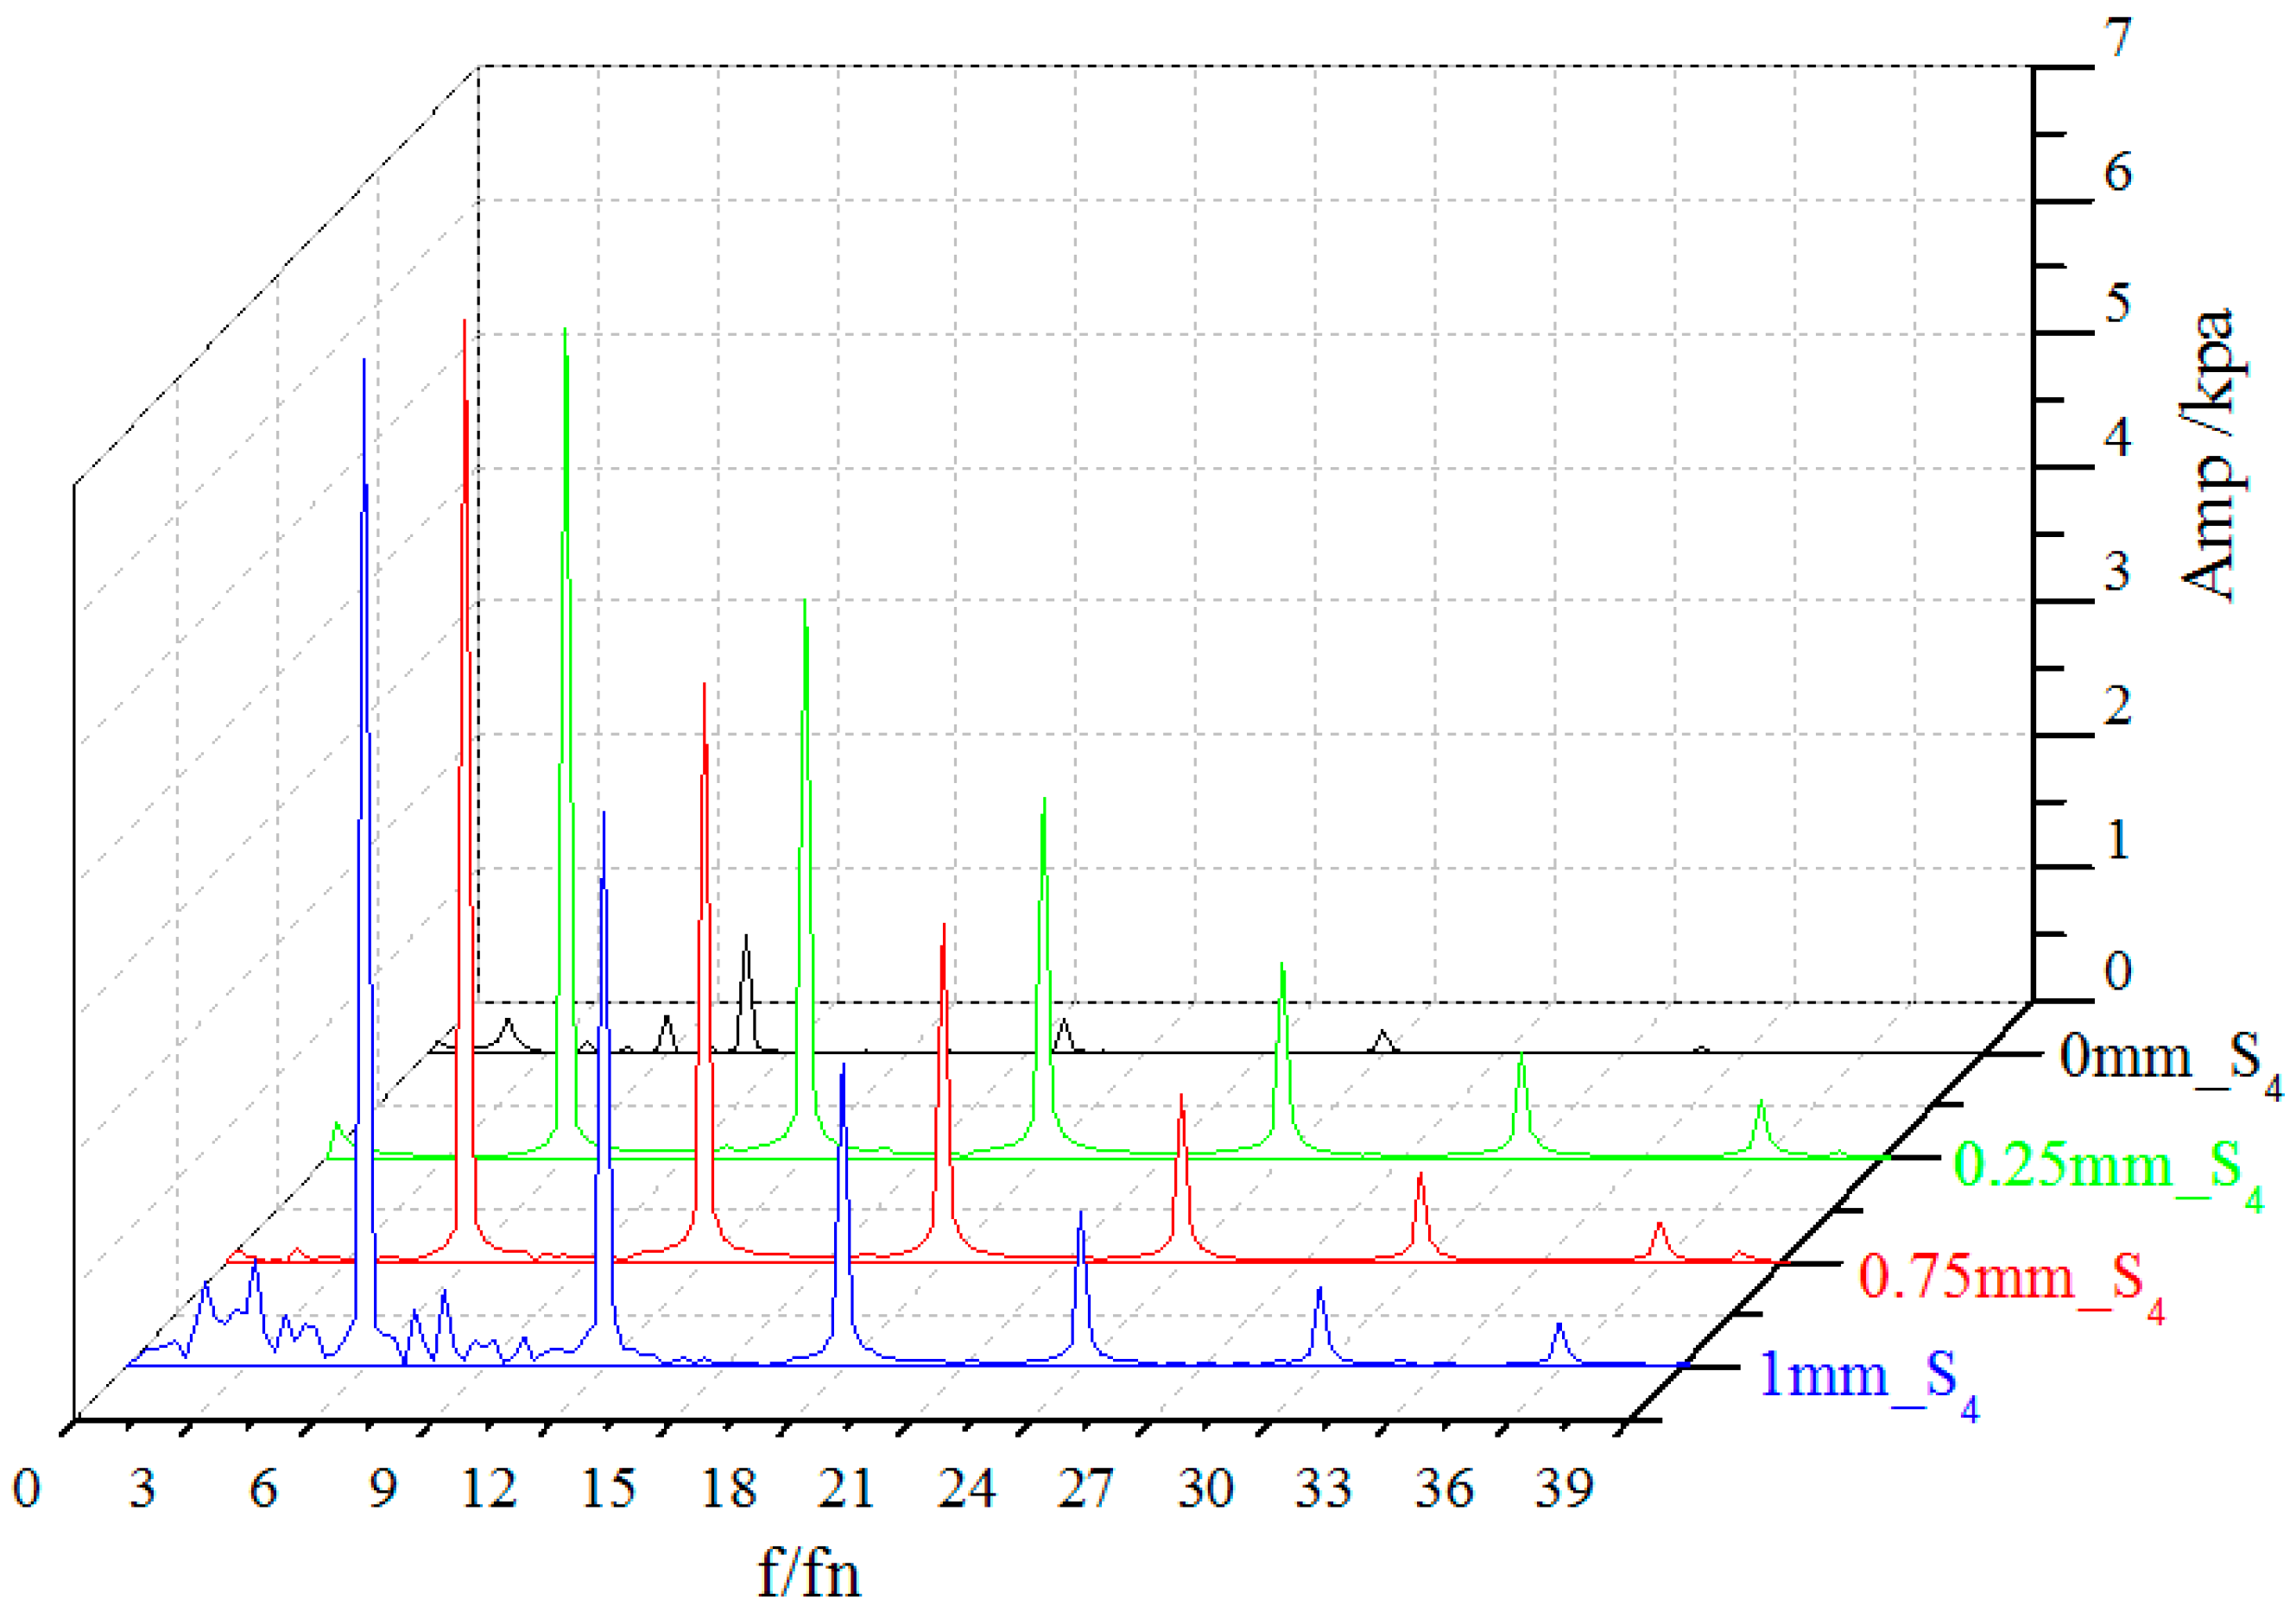
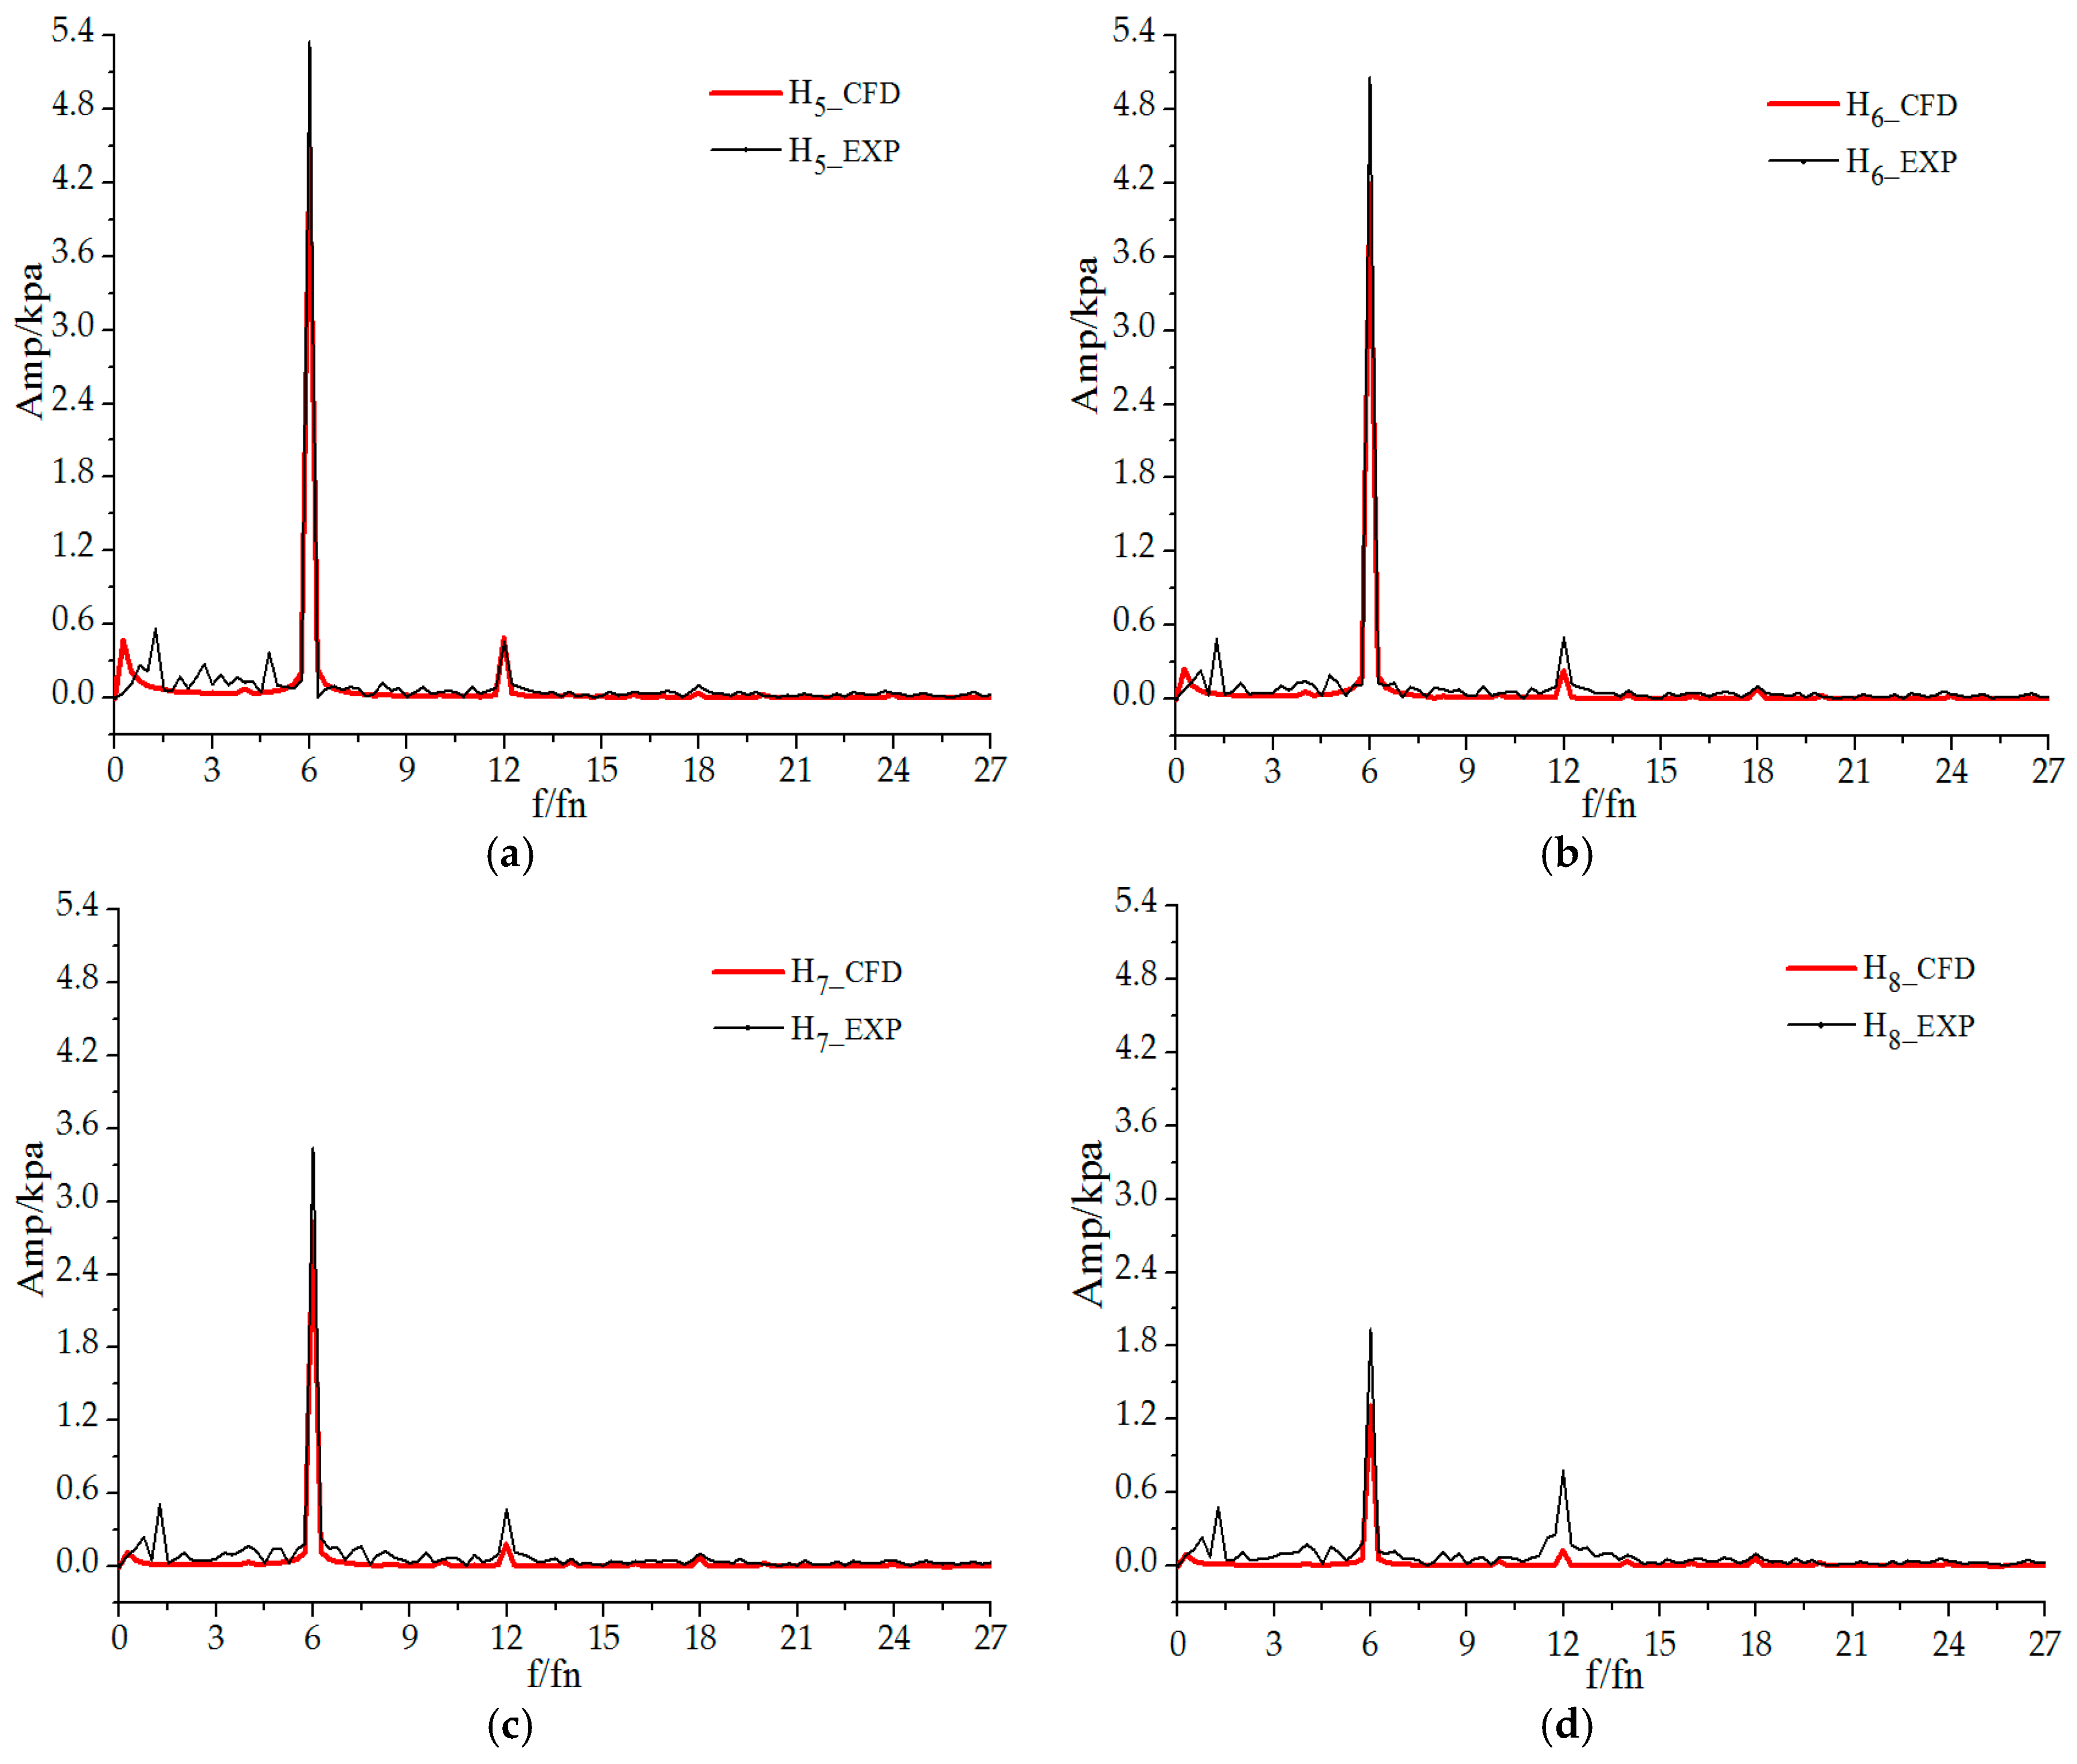
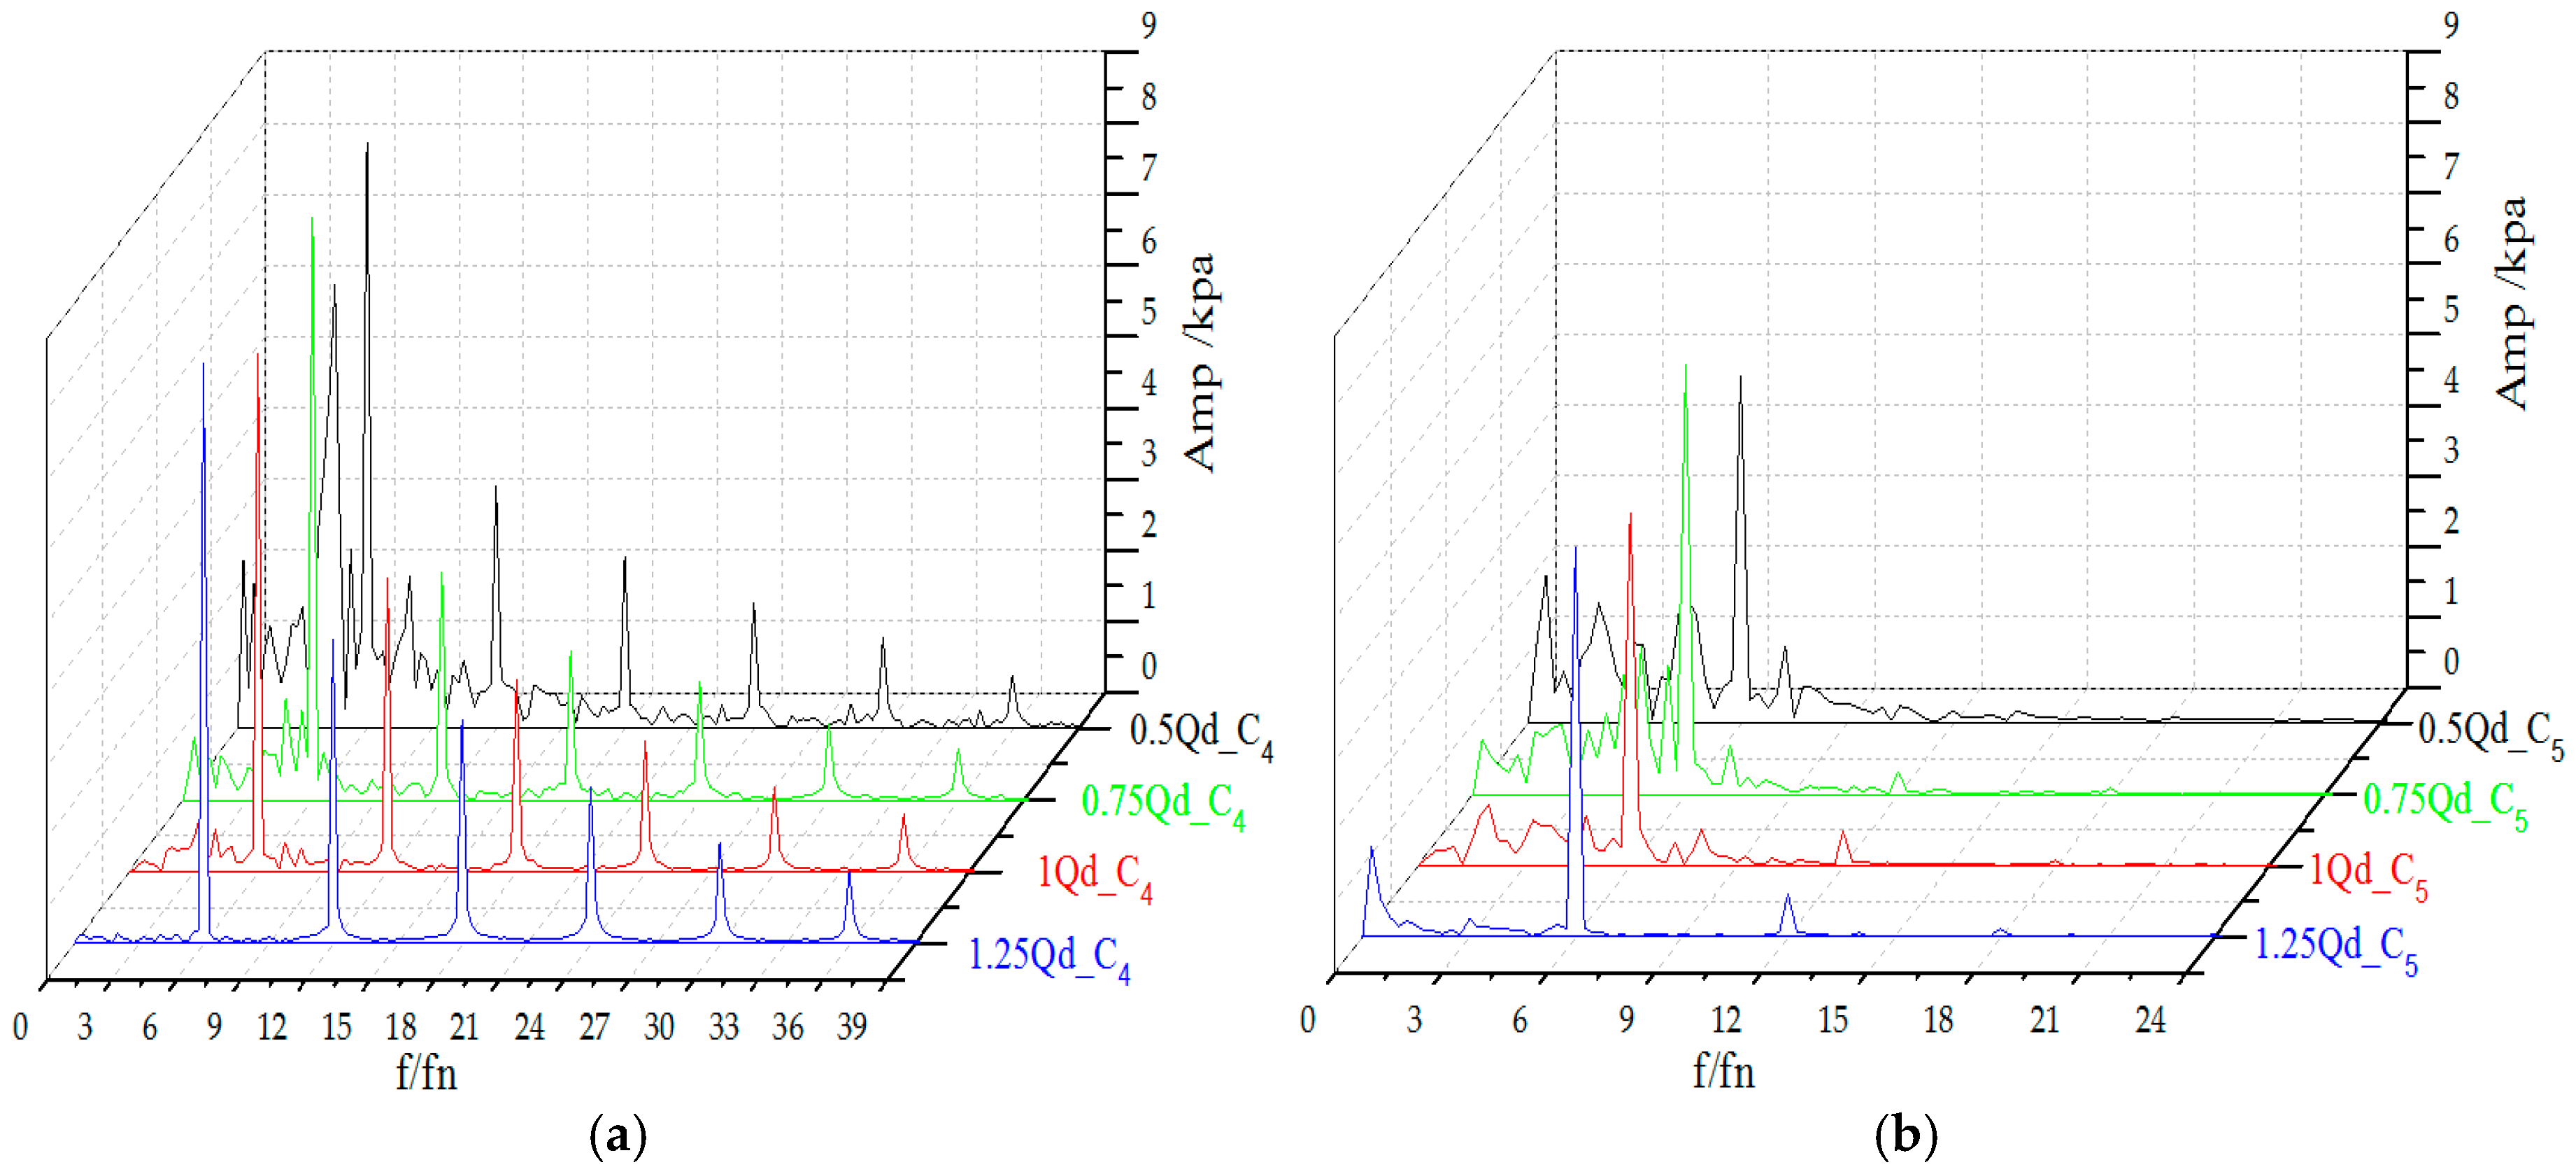
Influenced by rotor-stator interaction and tip-leakage, pressure fluctuation occurs in the impeller passage at different clearance and flow rate conditions. The domain frequency of pressure fluctuation of point S4 is 8 fn at the no clearance condition, which is in accordance with the guide vane blade number, while it is 6 fn at the clearance condition, which is in accordance with the impeller blade number. Moreover, there are also N × 6 fn frequencies (where N is a positive integer) at clearance conditions.
(2)
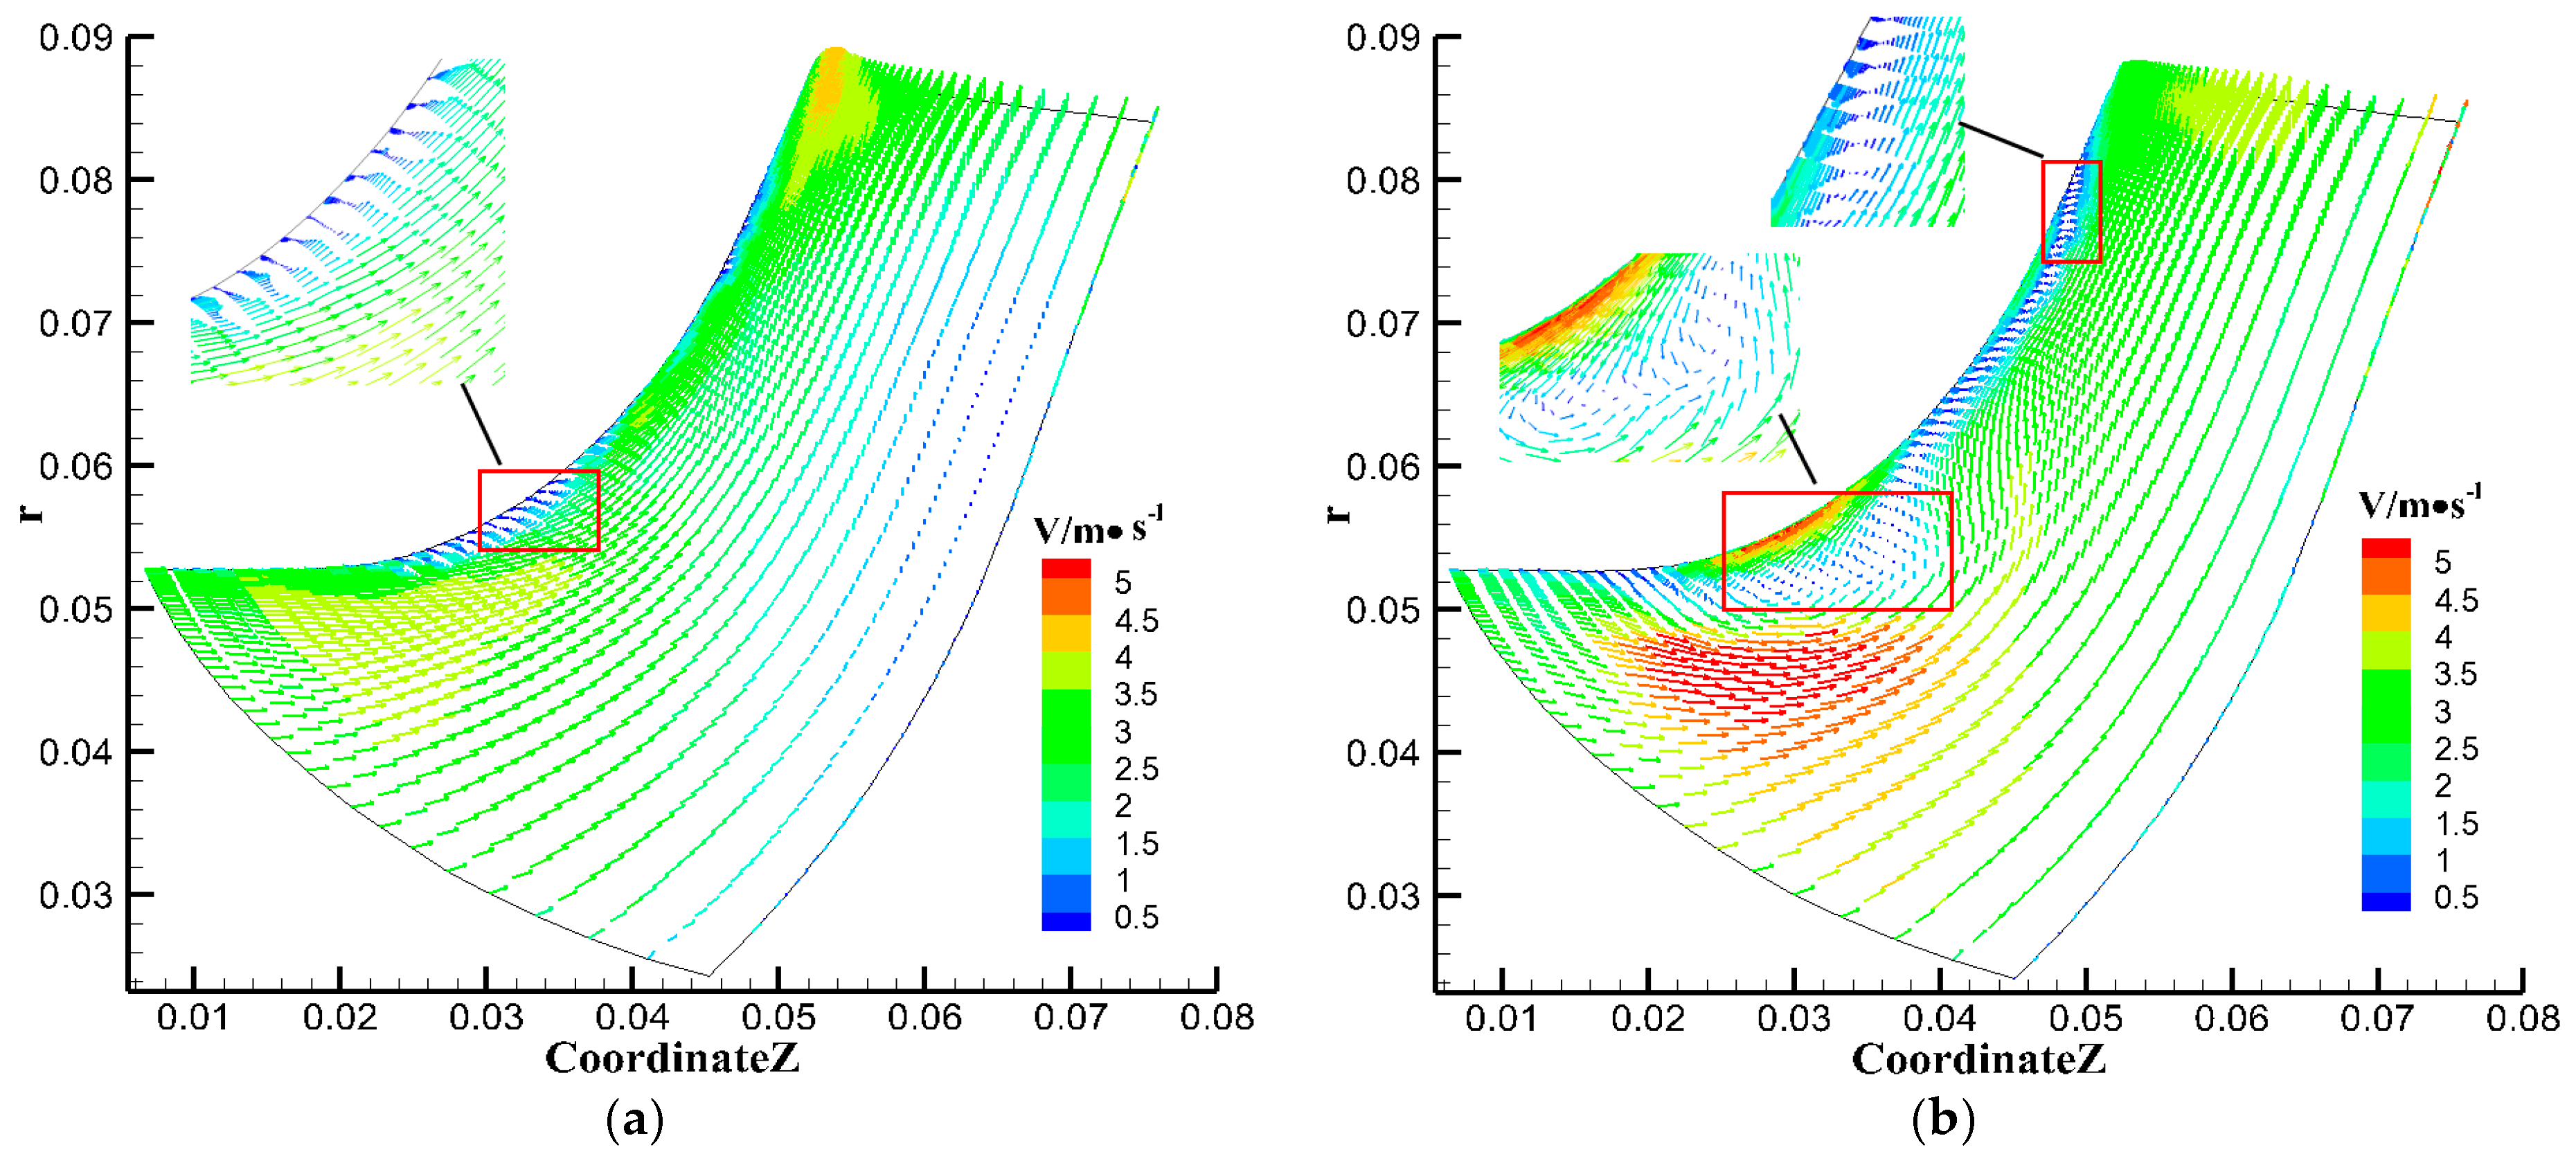
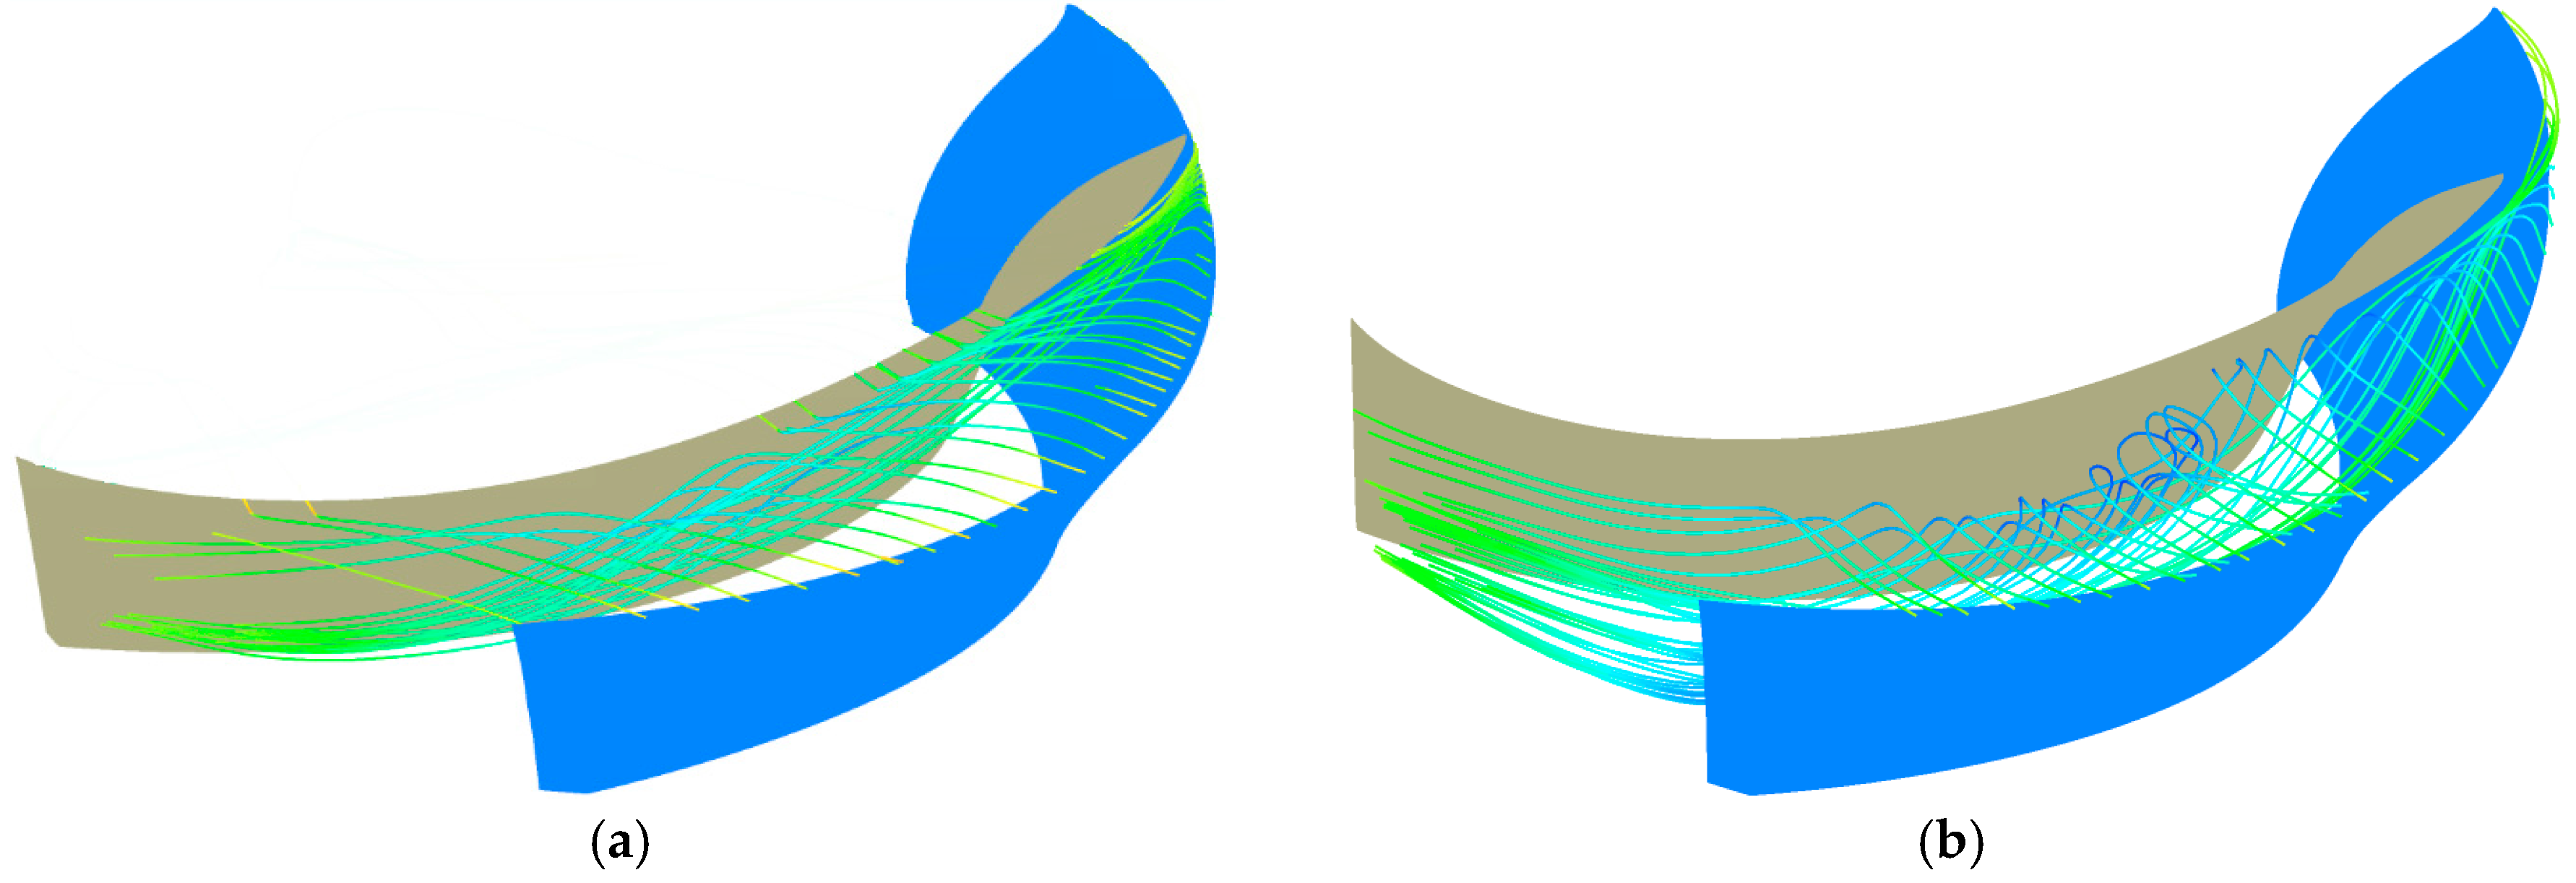
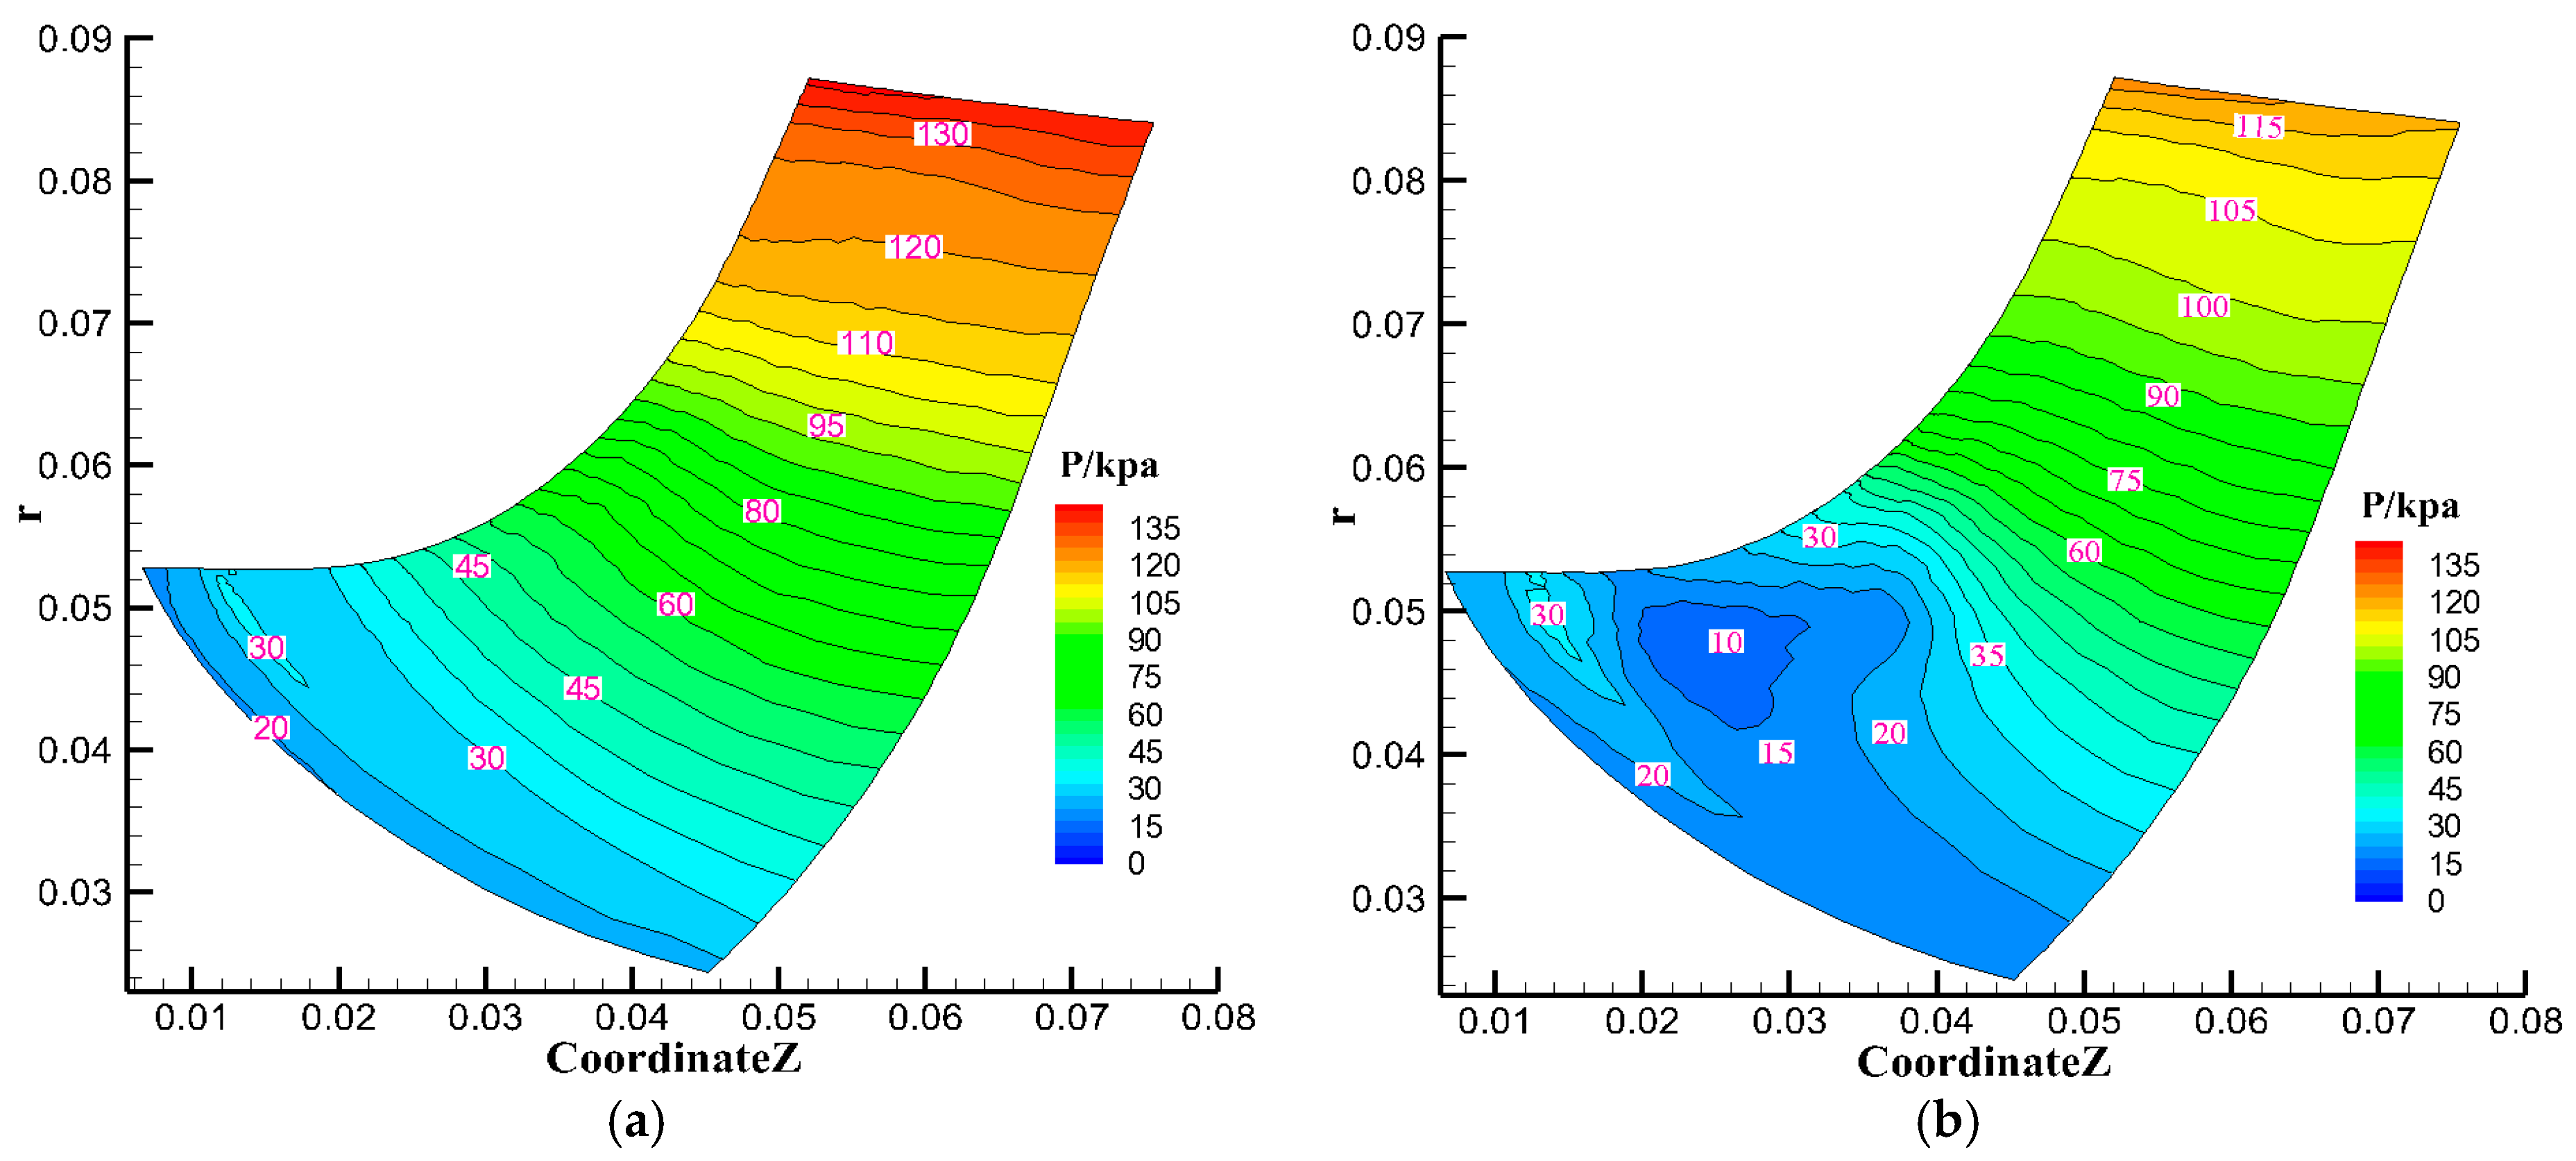
Due to tip-leakage, flow separation occurs near the shroud, flow separation is stronger and more obvious leakage vortexes form as clearance increases, resulting in stronger pressure fluctuation therein. Meanwhile, when clearance δ = 1.00 mm, pressure fluctuation of point S1 (the central monitoring point on the shroud of the impeller inlet section) suddenly increases, which is closely related to obvious leakage vortexes and a larger low pressure area.
(3)
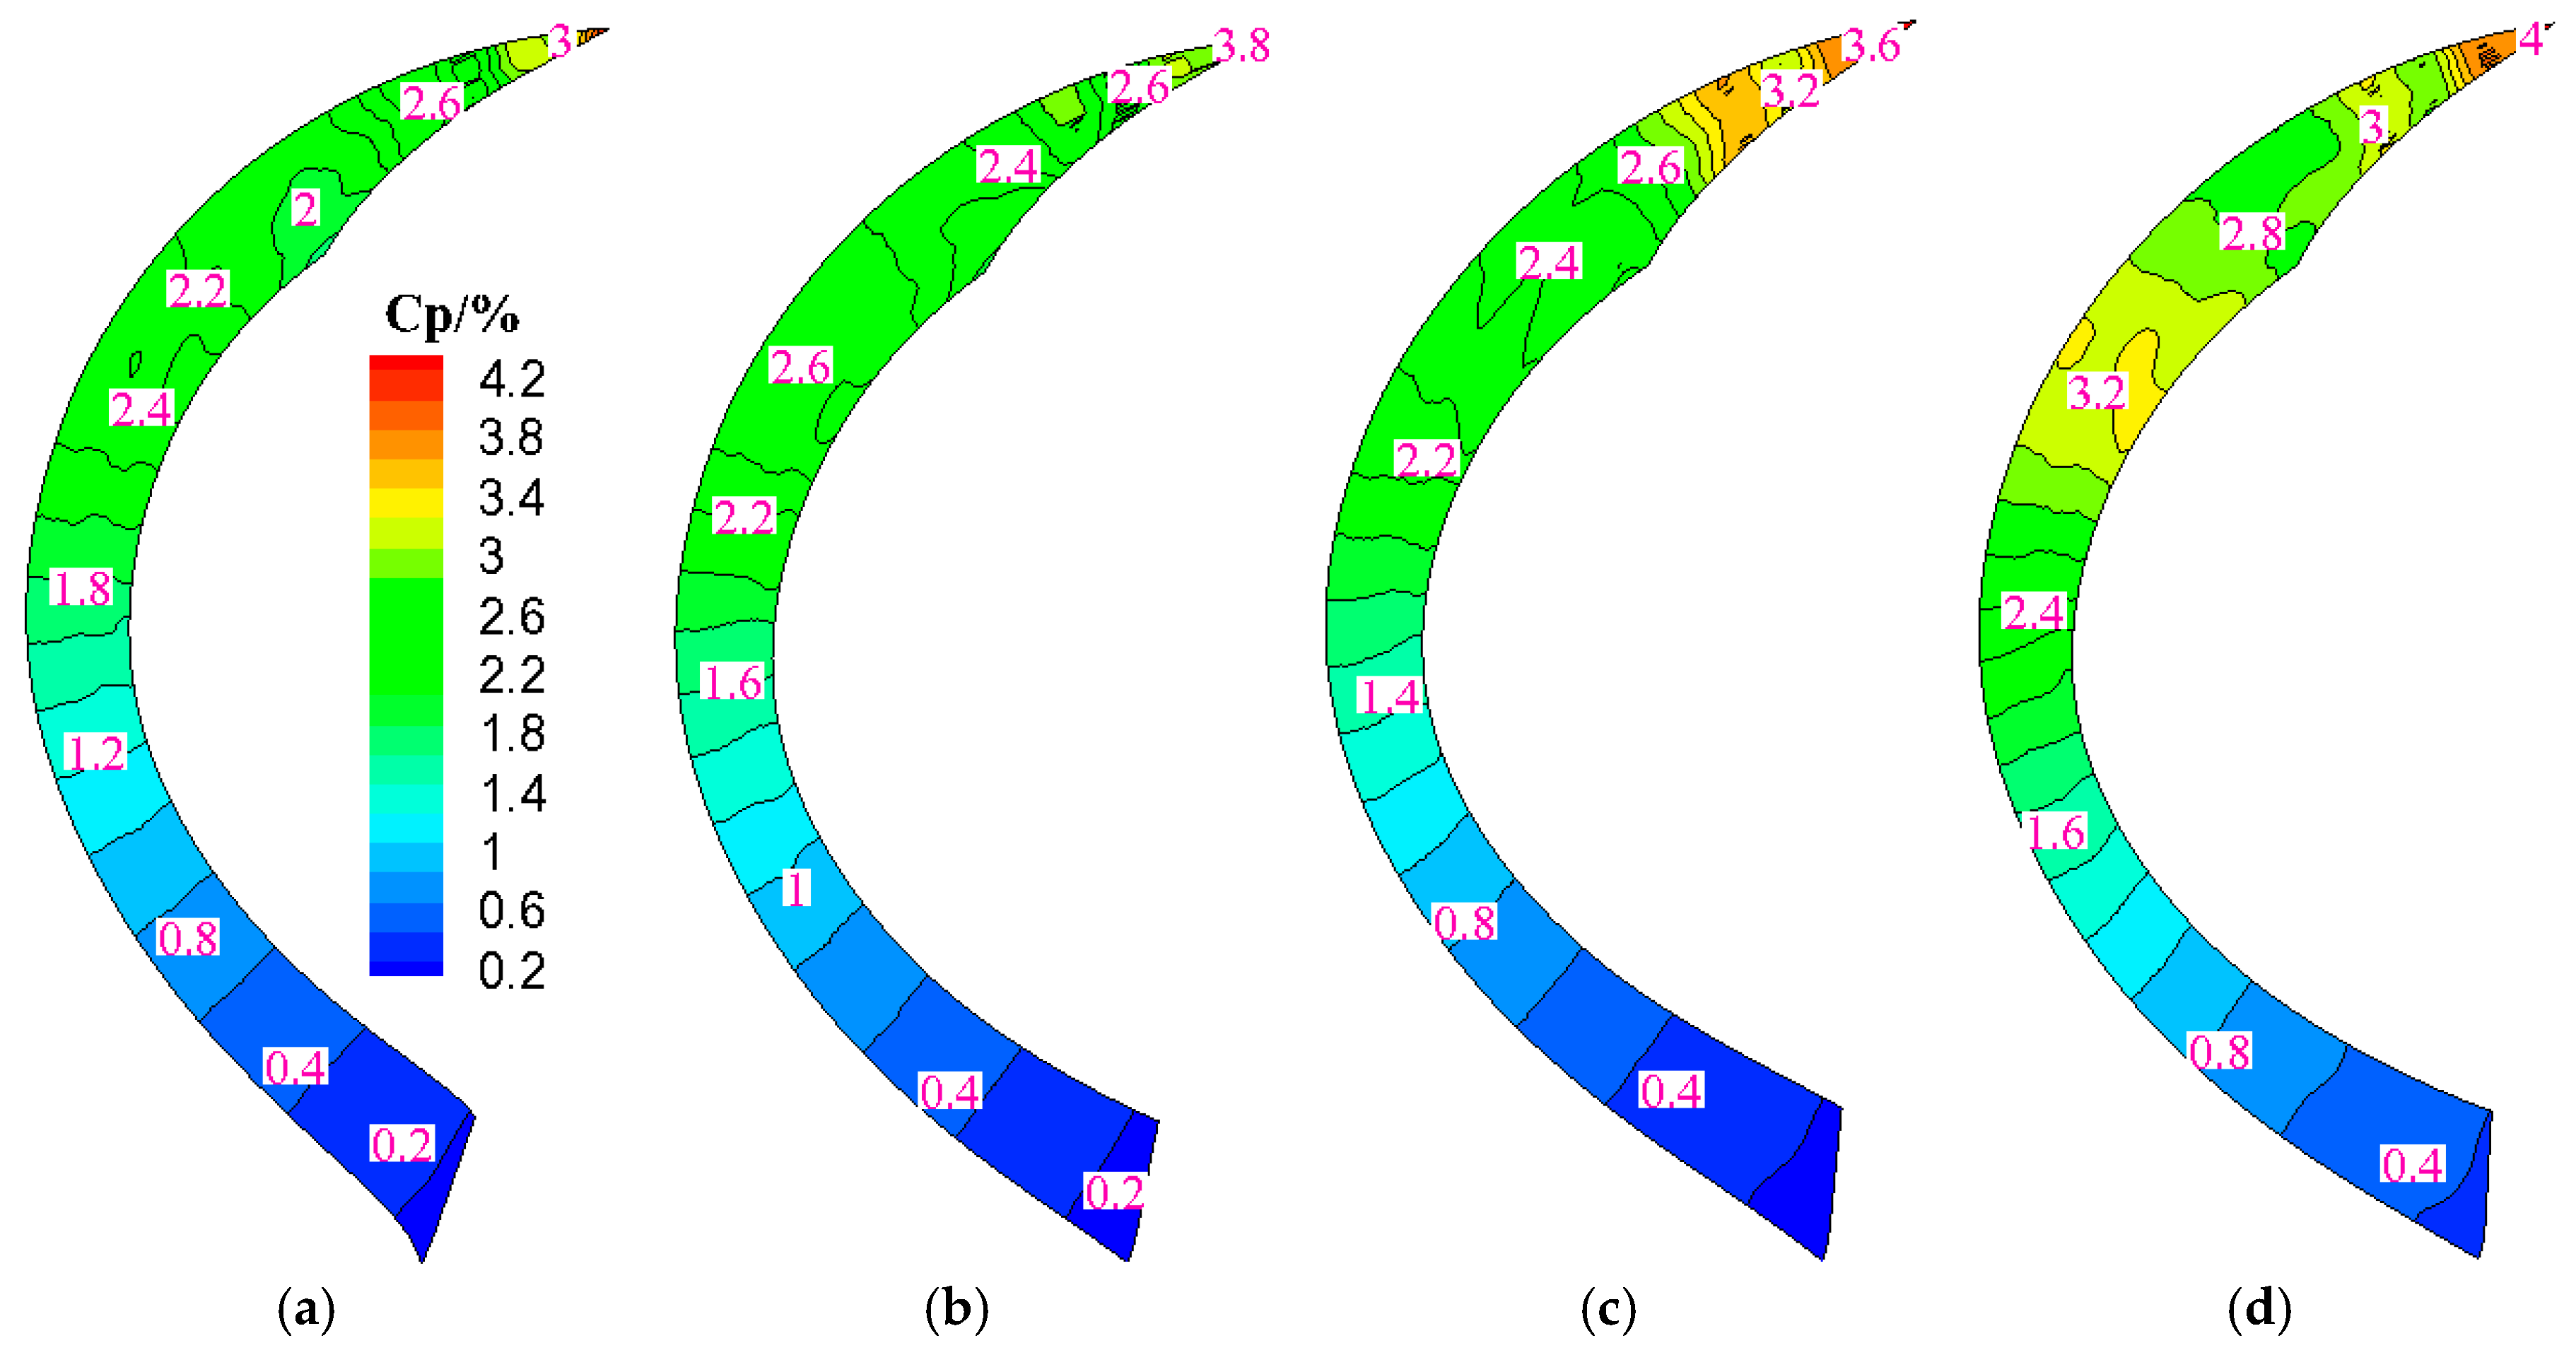
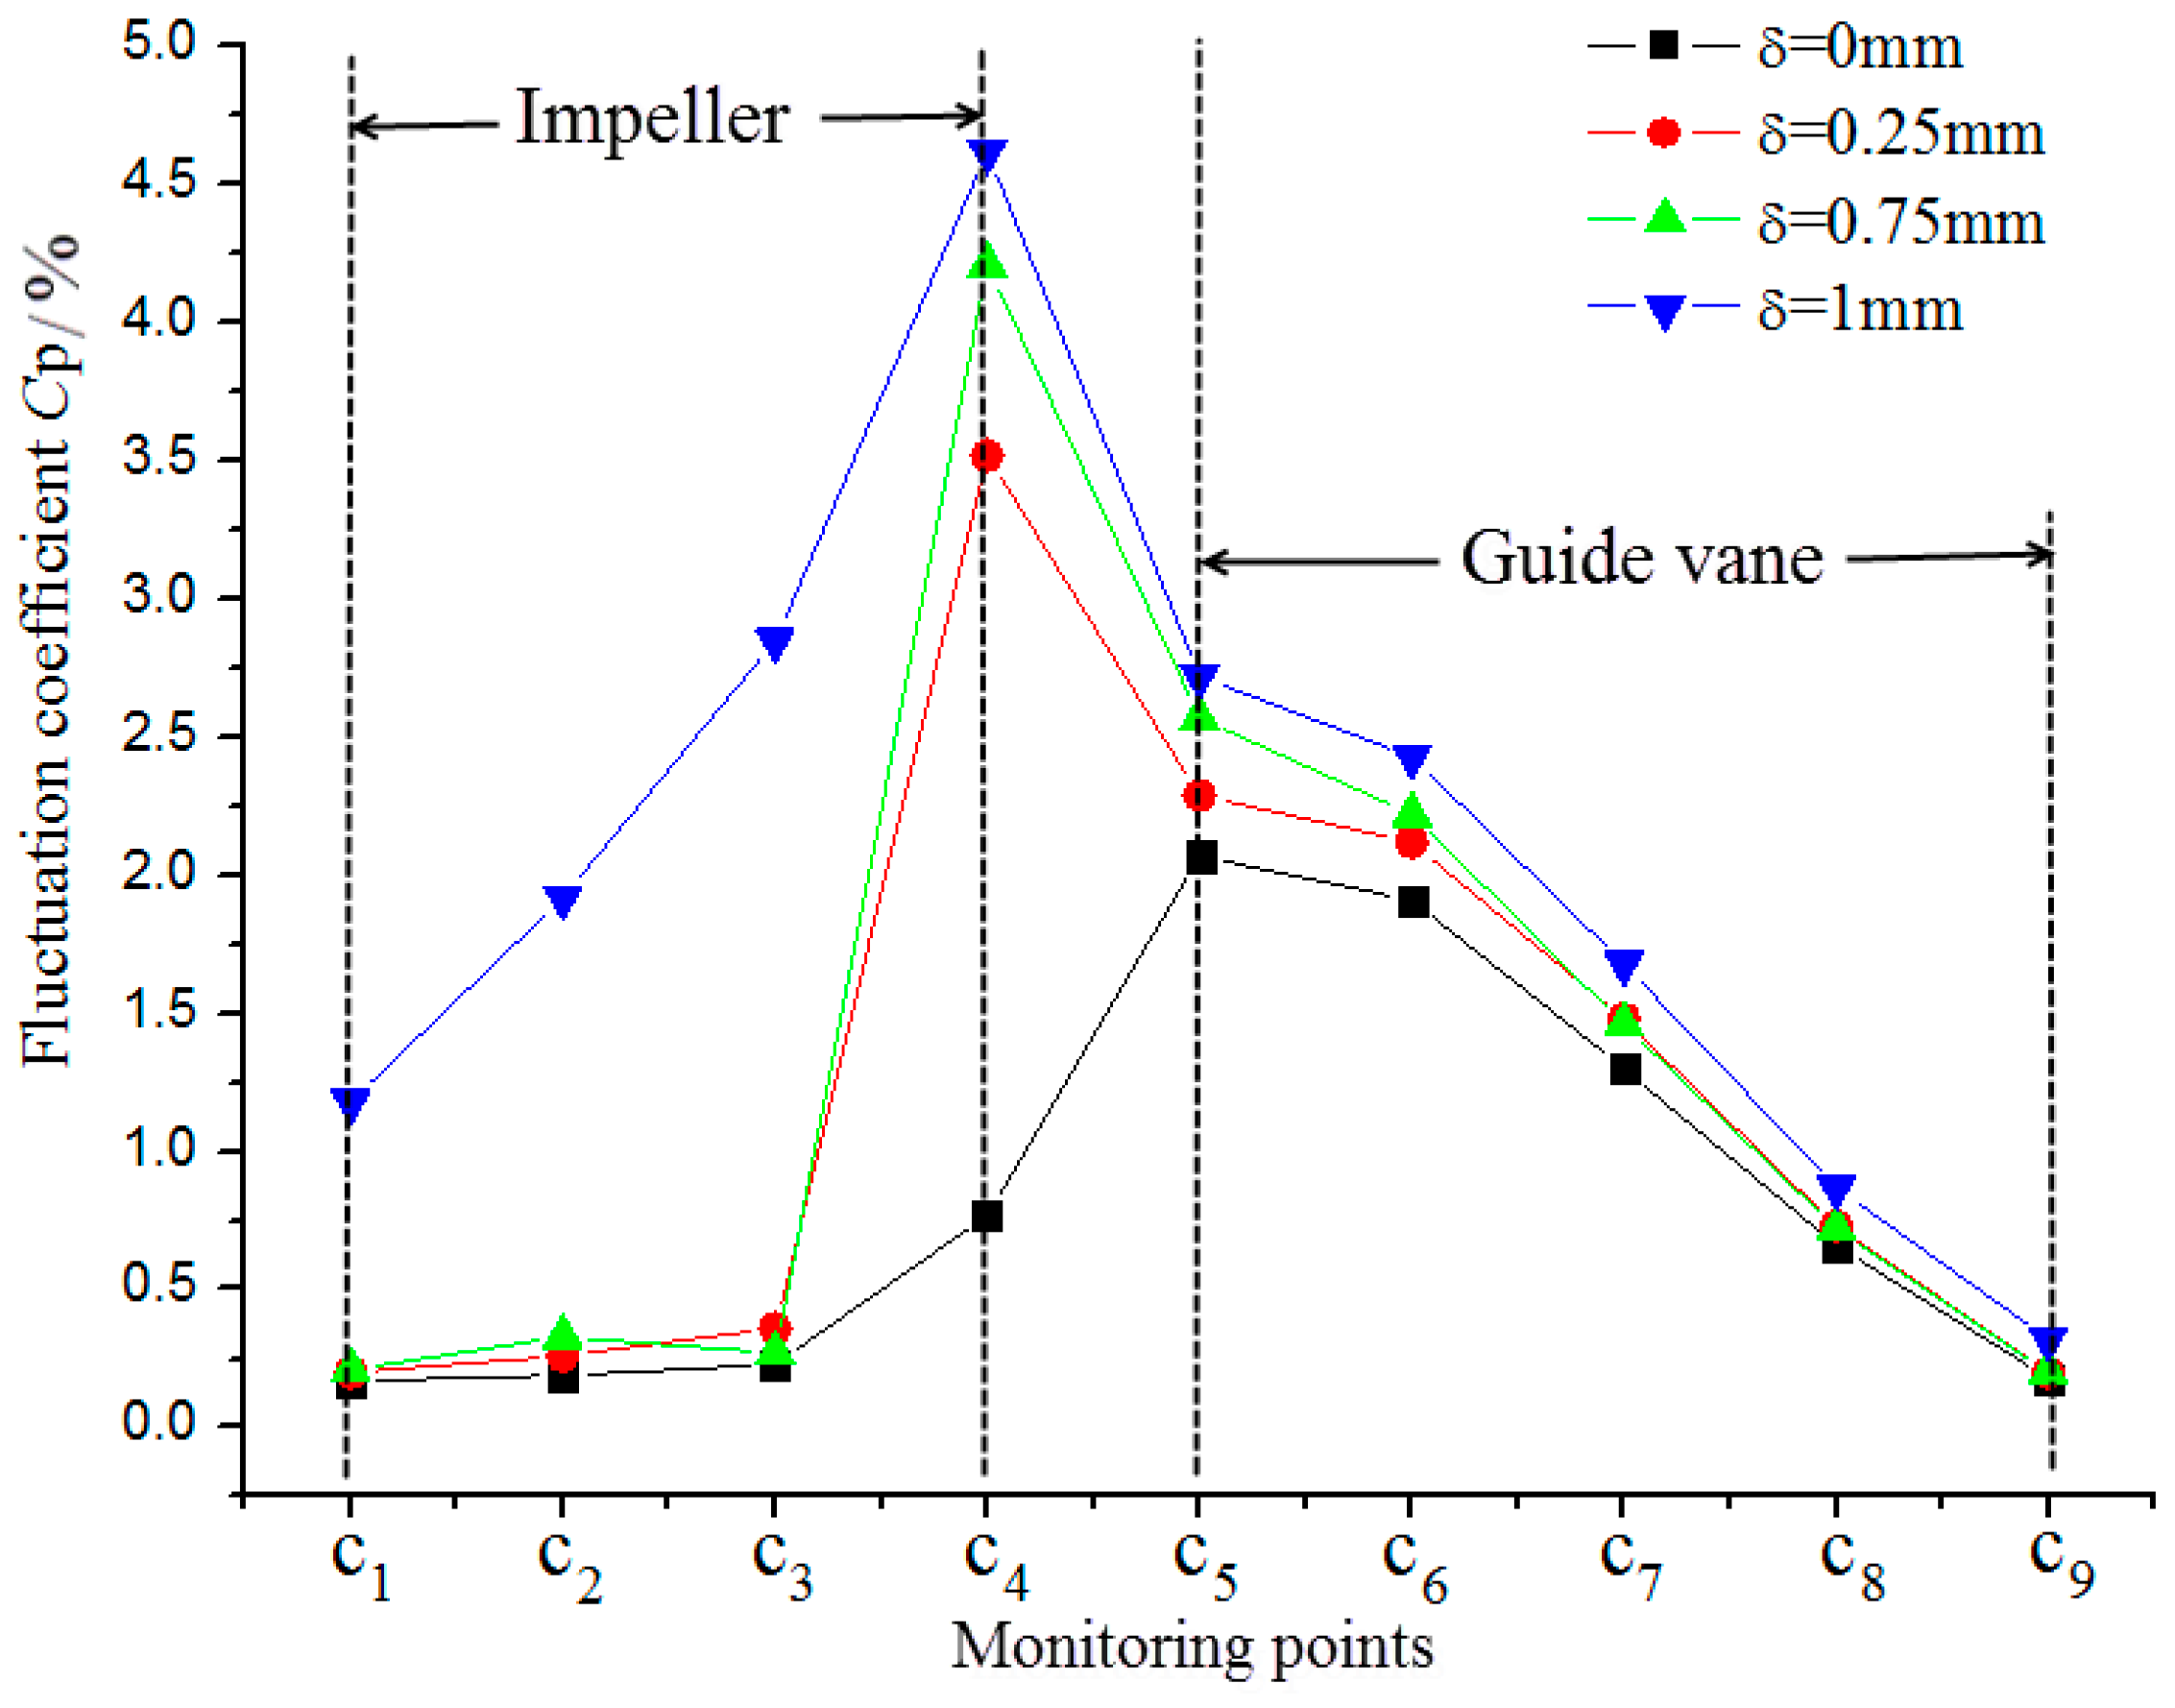
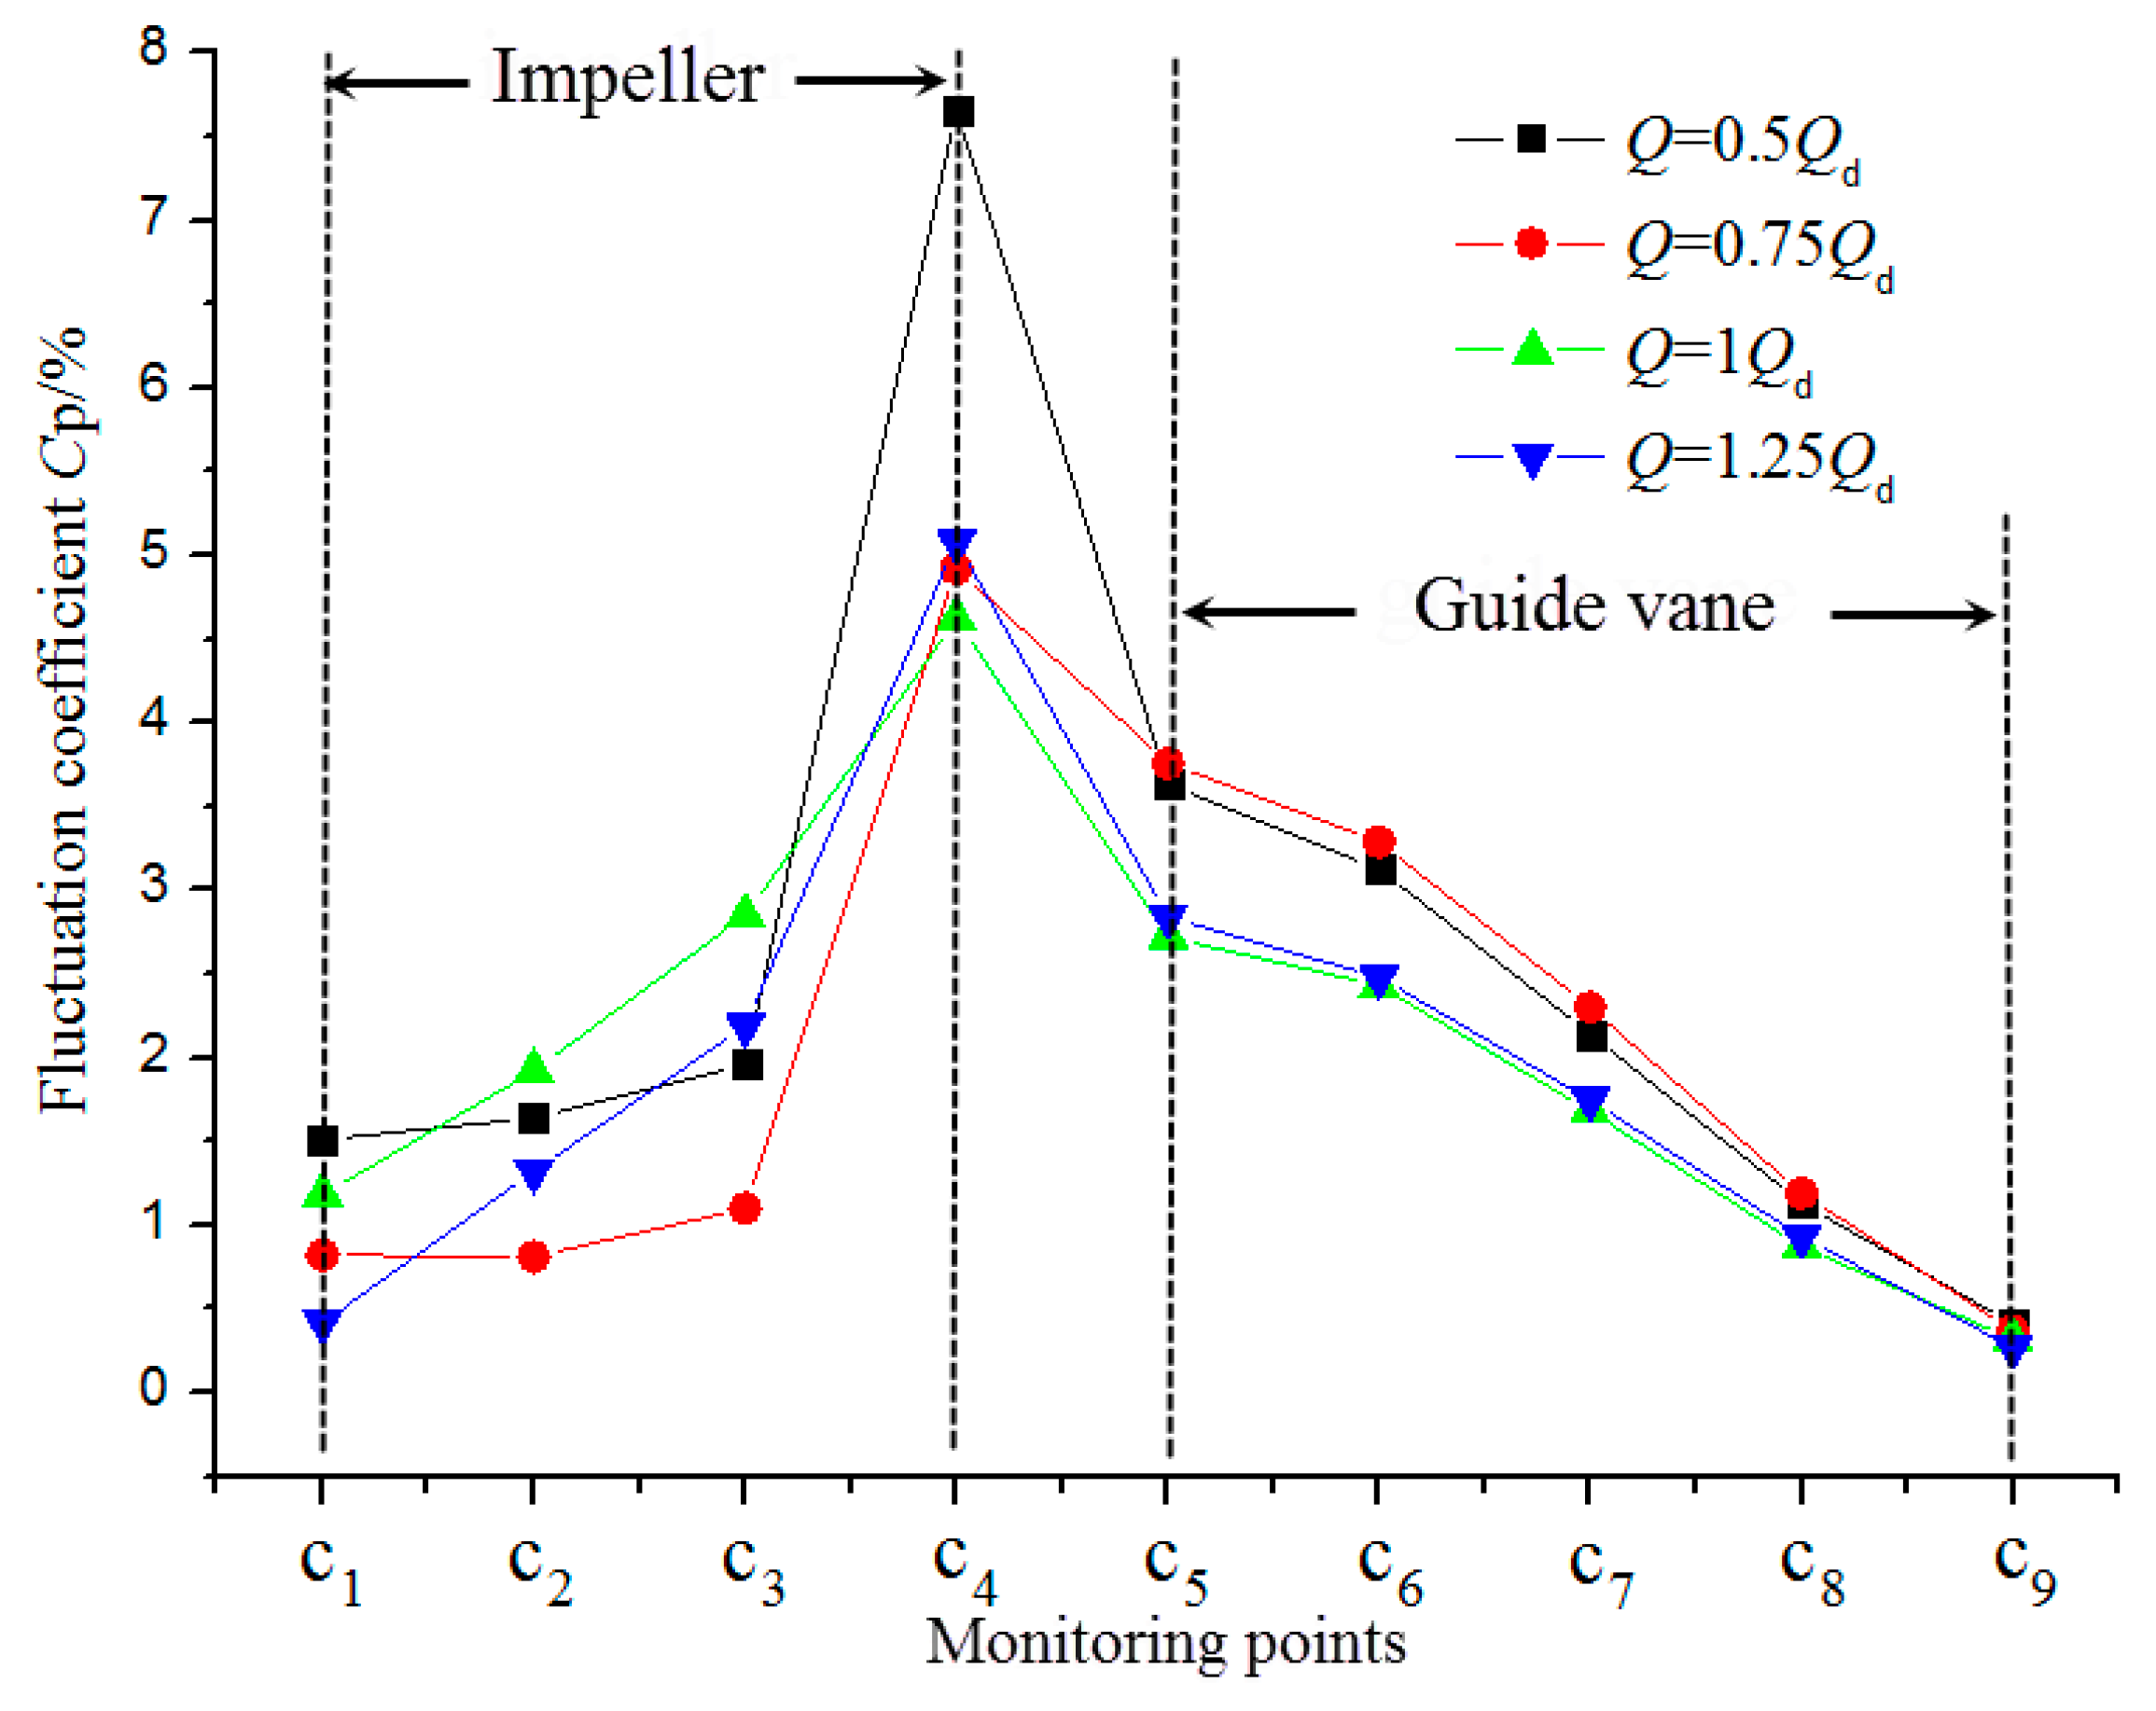
Tip-leakage has little influence on pressure fluctuation in the impeller inlet and central regions within a certain range of clearance. Beyond this range, fluctuation in the whole passage will increase significantly, while clearance variation has less effect on fluctuation in the guide vane. In both the no tip clearance and tip clearance conditions, the maximum fluctuation values are located near the guide inlet (points S5 and C5) and impeller outlet (points S4 and C4), respectively.

Acknowledgments

This work was supported by National Natural Science Foundation of China (51579006, 51679122).

Author Contributions

Baoshan Zhu conceived, designed and performed the experiments; Wenwu Zhang and Zhiyi Yu analyzed the data and wrote the paper.

Conflicts of Interest

The authors declare no conflict of interest.

Nomenclature

DImpeller diameterSStandard deviation of the fluctuation
ZBlade numberfiCoriolis force
QdDesign conditionρFluid density
nImpeller speeduRelative velocity
HHeadμDynamic viscosity
PShaft powerμtTurbulent viscosity
nsSpecific speedα1Model constant
PStatic pressureβModel constant
αCorrection coefficientSInvariant measure of strain rat
ΔeElectric signal of the sensorκTurbulence kinetic energy
psPressure surfaceωTurbulence frequency
ssSuction surfaceCpPressure coefficient
hsHub surfaceF2Blending function
gGravitational accelerationfnFrequency ratio of the fluctuation to impeller rotation
AmpAmplitude of the fluctuation

References

  1. Murugesan, C.; Rudramoorthy, R. Experiment and numerical study of efficiency improvement by surface coating on the impellers and diffusers of mixed flow submersible bore well pumps. J. Sci. Ind. Res. 2016, 75, 300–305. [Google Scholar]
  2. Heo, M.W.; Kim, K.Y.; Kim, J.H.; Choi, Y.S. High-efficiency design of a mixed-flow pump using a surrogate model. J. Mech. Sci. Technol. 2016, 30, 541–547. [Google Scholar] [CrossRef]
  3. Zhang, W.W.; Yu, Z.Y.; Zhu, B.S. Characteristic analysis on the pressure fluctuation in the impeller of a low specific speed mixed flow pump. IOP Conf. Ser. Mater. Sci. Eng. 2016, 129, 012035. [Google Scholar] [CrossRef]
  4. Zhang, K.W. Theory of Fluid Machinery; China Machine Press: Beijing, China, 2000; Volume 1, pp. 76–80. [Google Scholar]
  5. Engin, T.; Gu, M.; Scholz, R. Effects of tip clearance and impeller geometry on the performance of semi-open ceramic centrifugal fan impellers at elevated temperatures. Exp. Therm. Fluid Sci. 2006, 30, 565–577. [Google Scholar] [CrossRef]
  6. Zhang, D.S.; Wang, H.Y.; Shi, W.D.; Zhang, P.P.; Pan, D.Z. Tip clearance cavitation characteristics in axial flow pump under different cavitation numbers. Trans. Chin. Soc. Agric. Mach. 2014, 45, 115–121. (In Chinese) [Google Scholar]
  7. Feng, J.J.; Luo, X.Q.; Guo, P.C.; Wu, G.K. Influence of tip clearance on pressure fluctuations in an axial flow pump. J. Mech. Sci. Technol. 2016, 30, 1603–1610. [Google Scholar] [CrossRef]
  8. Li, Y.J.; Shen, J.F.; Hong, Y.P.; Liu, Z.Q. Numerical investigation of pressure fluctuations on axial-flow pump blades affected by tip-gap size. Trans. Chin. Soc. Agric. Mach. 2014, 45, 59–64. [Google Scholar]
  9. Zhu, B.; Chen, H.X.; Wei, Q.; Zhang, R. The analysis of unsteady characteristics in the low specific speed centrifugal pump with drainage gaps. IOP Conf. Ser. Mater. Sci. Eng. 2012, 15, 032049. [Google Scholar] [CrossRef]
  10. Miorini, R.; Wu, H.; Katz, J. The internal structure of the tip leakage vortex within the rotor of an axial water-jet pump. J. Turbomach. 2012, 134, 222–225. [Google Scholar] [CrossRef]
  11. Qu, L.X.; Wang, F.J.; Cong, G.H.; Gao, J.Y. Effect of volute tongue-impeller gaps on the unsteady flow in double-suction centrifugal pump. Trans. Chin. Soc. Agric. Mach. 2011, 42, 50–55. [Google Scholar]
  12. Bing, H.; Cao, S.L.; He, C.L.; Lu, L. Experimental study of the effect of blade tip clearance and blade angle error on the performance of mixed-flow pump. Sci. China Technol. Sci. 2013, 56, 293–298. [Google Scholar] [CrossRef]
  13. Kim, D.J.; Min, Y.U.; Kim, J.Y.; Chung, K.N. A study of tip clearance effect for a mixed-flow pump on performance. In Proceedings of the ASME 2013 Fluids Engineering Division Summer Meeting, Incline Village, NV, USA, 7–11 July 2013.
  14. Li, X.J.; Yuan, S.Q.; Pan, Z.Y.; Li, Y.; Liu, W. Dynamic characteristics of rotating stall in mixed flow pump. J. Appl. Math. 2013, 2013, 104629. [Google Scholar] [CrossRef]
  15. Goto, A. Effect of leakage flow on part-load performance of a mixed flow pump impeller. J. Turbomach. 1992, 114, 383–391. [Google Scholar] [CrossRef]
  16. Li, Y.B.; Bi, Z.; Li, R.N.; Hu, P.P.; Zhou, D. Numerical analysis of pressure pulsation characteristics of diagonal flow pump in adjacent area of tip clearance. J. Hydrol. Eng. 2015, 46, 496–503. [Google Scholar]
  17. Quan, H.; Li, R.N.; Su, Q.M.; Han, W.; Cheng, X.R. Energy performance prediction and numerical simulation analysis for screw centrifugal pump. Appl. Mech. Mater. 2014, 444–445, 1007–1014. [Google Scholar] [CrossRef]
  18. ANSYS, Inc. ANSYS TurboGrid Users Guide, Release 15.0; SAS IP, Inc.: Pittsburgh, PA, USA, 2013; pp. 105–110. [Google Scholar]
  19. Menter, F.R. Review of the shear-stress transport turbulence model experience from an industrial perspective. Int. J. Comput. Fluid Dyn. 2009, 23, 305–316. [Google Scholar] [CrossRef]
  20. Zhang, D.S.; Wu, S.Q.; Shi, W.D. Application and experiment of different turbulence models for simulating tip leakage vortex in axial flow pump. Trans. CSAE 2013, 29, 46–53. [Google Scholar]
  21. Li, Y.B.; Hu, P.L.; Li, R.N. Numerical analysis for effects of different blade tip clearance on performance in mixed-flow pump. Trans. CSAE 2014, 30, 86–93. [Google Scholar]
Figure 1. Configuration of the mixed-flow pump.
Energies 10 00148 g001
Figure 2. Test system. 1—Data acquisition system; 2—Test section; 3—Flowmeter; 4—Pipeline pump; 5—Water tank.
Energies 10 00148 g002
Figure 3. Test model.
Energies 10 00148 g003
Figure 4. Trail points of the guide vane. 5–8: monitoring sections; A–E: monitoring lines on the hub surface; P, Q: monitoring lines on the suction surface; R, S: monitoring lines on the pressure surface.
Energies 10 00148 g004
Figure 5. Structured mesh for analysis.
Energies 10 00148 g005
Figure 6. Analysis of mesh independence. CFD: Computational fluid dynamics.
Energies 10 00148 g006
Figure 7. Location of monitoring points.
Energies 10 00148 g007
Figure 8. Performance curves from the numerical simulation and experiment. EXP: Experiment.
Energies 10 00148 g008
Figure 9. Time domain frequency of point S4 at different clearance conditions (Q = Qd).
Energies 10 00148 g009
Figure 10. Frequency domain diagrams of point S4 at different clearance conditions (Q = Qd).
Energies 10 00148 g010
Figure 11. Streamlines distribution at the design condition. (a) δ = 0.25 mm; (b) δ = 1.00 mm.
Energies 10 00148 g011
Figure 12. Velocity vector distribution of the central hub-to-shroud surface at the design condition. (a) δ = 0.25 mm; (b) δ = 1.00 mm.
Energies 10 00148 g012
Figure 13. Pressure distribution of the central hub-to-shroud surface at the design condition. (a) δ = 0.25 mm; (b) δ = 1.00 mm.
Energies 10 00148 g013
Figure 14. Frequency domain diagrams of points H5–H8. “Amp” is the amplitude of pressure fluctuation, while “f/fn” denotes the frequency ratio of pressure fluctuation to impeller rotation: (a) Point H5; (b) Point H6; (c) Point H7; and (d) Point H8.
Energies 10 00148 g014
Figure 15. Distribution of Cp on the central hub-to-shroud surface of the guide vane (Q = Qd). (a) δ = 0; (b) δ = 0.25 mm; (c) δ = 0.75 mm; and (d) δ = 1.00 mm.
Energies 10 00148 g015
Figure 16. Pressure fluctuation of central points on sections between the impeller and guide vane at different clearances conditions (Q = Qd).
Energies 10 00148 g016
Figure 17. Pressure fluctuation of central points on the section between the impeller and guide vane at different flow rates (δ = 1.00 mm).
Energies 10 00148 g017
Figure 18. Frequency domain diagrams of points C4 and C5 at different flow rates (δ = 1.00 mm). (a) Point C4; (b) Point C5.
Energies 10 00148 g018
Table 1. Parts of the pressure test results in the guide vane.
ConditionsH5H6H7H8
nQ P i ¯ SRS P i ¯ SRS P i ¯ SRS P i ¯ SRS
r/minm3/minkPakPa%kPakPa%kPakPa%kPakPa%
12000.4489.273.894.36141.642.411.70148.191.891.28152.431.020.67
0.8778.852.943.73138.691.911.38141.711.210.85147.230.810.55
15000.55108.734.654.28149.912.541.69154.402.021.31160.311.781.11
1.1392.574.244.58144.42.021.40148.071.531.03155.221.390.90
18000.61129.716.555.05159.713.212.01164.032.251.37170.681.751.03
1.2112.984.594.06154.552.111.37159.191.881.18162.81.661.02
20000.73144.129.626.67167.185.073.03172.312.831.64173.632.421.39
1.48124.036.305.08157.974.132.61163.791.971.20167.411.91.13
Table 2. Mesh numbers in each part of the computation domain.
Mesh InformationInlet PipeImpellerGuide VaneOutlet PipeTotal
Element293,930202,720 × 6200,124 × 8513,2713,624,513
Node303,5521,311,7861,731,312529,1603,875,810
Table 3. Unsteady solution setting. RMS: Root Mean Square.
ParametersValue
Time step0.0002 s
Total time0.3 s
Maximum iteration number per time step20
Convergence criteriaRMS residual < 1 × 10⁻⁴
Advection schemeHigh resolution
Turbulence numericsHigh resolution
Transient schemeSecond-order backward Euler
Table 4. Performance prediction from numerical simulation.
Conditions0.75Qd1Qd1.25Qd
Clearance
δ/mm
Efficiency
η/%
Head
H/m
Efficiency
η/%
Head
H/m
Efficiency
η/%
Head
H/m
0.2577.7016.2584.7814.4782.0011.93
0.7573.4415.2879.4312.9273.509.90
1.0071.6414.6576.5412.0469.709.03
Table 5. Pressure fluctuation coefficients of points S1–S4 in the impeller(%).
PointsS1S2S3S4
δ
0 mm0.170.190.230.53
0.25 mm0.210.260.354.08
0.75 mm0.850.490.334.38
1.00 mm3.092.612.304.58
Table 6. Pressure fluctuation coefficients of points in the middle of the guide vane section shroud (%).
PointsS5S6S7S8S9
δ
0 mm2.101.931.360.730.20
0.25 mm2.342.131.540.820.21
0.75 mm2.532.221.540.750.22
1.00 mm2.722.421.760.800.34

