Battery Storage Systems as Grid-Balancing Measure in Low-Voltage Distribution Grids with Distributed Generation


1
Josef Ressel Center for Applied Scientific Computing in Energy, Finance, and Logistics, Vorarlberg University of Applied Sciences, Hochschulstrasse 1, 6850 Dornbirn, Austria
2
Illwerke vkw Endowed Professorship for Energy Efficiency, Energy Research Center, Vorarlberg University of Applied Sciences, Hochschulstrasse 1, 6850 Dornbirn, Austria
3
Faculty of Engineering and Science, University of Agder, Jon Lilletuns vei 9, 4879 Grimstad, Norway
*
Author to whom correspondence should be addressed.
Energies 2017, 10(12), 2161; https://doi.org/10.3390/en10122161
Submission received: 21 November 2017
/
Revised: 14 December 2017
/
Accepted: 15 December 2017
/
Published: 18 December 2017
(This article belongs to the Section D: Energy Storage and Application)
Abstract
:Due to the promoted integration of renewable sources, a further growth of strongly transient, distributed generation is expected. Thus, the existing electrical grid may reach its physical limits. To counteract this, and to fully exploit the viable potential of renewables, grid-balancing measures are crucial. In this work, battery storage systems are embedded in a grid simulation to evaluate their potential for grid balancing. The overall setup is based on a real, low-voltage distribution grid topology, real smart meter household load profiles, and real photovoltaics load data. An autonomous optimization routine, driven by a one-way communicated incentive, determines the prospective battery operation mode. Different battery positions and incentives are compared to evaluate their impact. The configurations incorporate a baseline simulation without storage, a single, central battery storage or multiple, distributed battery storages which together have the same power and capacity. The incentives address either market conditions, grid balancing, optimal photovoltaic utilization, load shifting, or self-consumption. Simulations show that grid-balancing incentives result in lowest peak-to-average power ratios, while maintaining negligible voltage changes in comparison to a reference case. Incentives reflecting market conditions for electricity generation, such as real-time pricing, negatively influence the power quality, especially with respect to the peak-to-average power ratio. A central, feed-in-tied storage performs better in terms of minimizing the voltage drop/rise and shows lower distribution losses, while distributed storages attached at nodes with electricity generation by photovoltaics achieve lower peak-to-average power ratios.
1. Introduction
Transition from traditional, large-scale and centralized electricity generation by fossil fuels to more distributed renewable generation by photovoltaics (PV) and wind power is being pushed forward by many countries [1]. The strong volatility of renewables means that generation does not always coincide with electricity demand. Hence, balancing measures need to be deployed in the power system to counteract the strong effect of renewables on grid operation [2,3] and, thereby, exploit their full potential.
In particular, low-voltage distribution grids face three technical challenges due to the penetration by small-scale distributed generation (DG) like PV: (1) voltage rise during feed-in (which also limits the amount of DG capacity introduced); (2) possible harmonic distortion caused by feed-in controllers [4]; (3) creation of new power peaks [5]. Researchers already have investigated the impacts of DG on the distribution grid [6,7,8,9,10]. Besides feed-in control strategies for DG [11], grid-balancing measures have also been investigated. Demand side management (DSM) is being discussed as a promising approach for grid balancing [12,13], as it changes electricity demand of consumers with respect to the time pattern of consumption and/or load magnitude [14]. In this context, many publications consider the special case of electric vehicles as usable buffer capacities [15,16,17].
The integration of additional stationary storage into the distribution grid has been considered [18]. In particular, battery energy storage systems (BESSs) have been proposed [19,20,21,22,23,24], different sizes and battery technologies have been discussed and their corresponding suitability demonstrated. BESSs are able to react practically instantaneously, and, based on their flexibility in capacity and location, last longer. Therefore, they can serve different purposes such as [25,26]: (1) matching peak power demand; (2) improving power quality and reliability of the grid by providing balancing energy; (3) reducing supply interruption by bridging power; (4) load following to increase generation utilization.
Currently, BESSs for grid balancing face the obstacles of high lifecycle costs [27] and high energy and material requirements [28]. Used electric vehicle batteries have been proposed for a second use in stationary applications. As less active bulk material is wasted [29], costs are reduced [30], and the ecological footprint is improved [31].
In our previous work [30,32], we proposed BESSs based on repurposed electric vehicle batteries for grid balancing. The prospective operation mode (charge, discharge, or idle) is determined based on an autonomous optimization routine driven by a one-way communicated incentive. The incentive represents the intention of the operator to achieve a certain goal [33], e.g., grid balancing, and can thus vary significantly. To the best of our knowledge, impacts of incentive-driven BESSs on low-voltage distributing grids have not been investigated so far. Therefore, the present work compares a single, central BESS and multiple, distributed BESSs driven by different incentives to evaluate their impact on grid load and power quality. With this, we want to discuss the following question: Which incentives facilitate the integration of volatile, distributed electricity generation? To this end, we investigate incentives that reflect different purposes, like real-time pricing, grid balancing, optimal PV utilization, DSM, or self-consumption.
In Section 2, the detailed approach is discussed. First, the battery model, the incentive-driven optimization, and different incentives are presented. Then, the simulation setup is described in detail. Section 3 shows the achieved results based on our approach, followed by a brief discussion in Section 4 and a conclusion in Section 5.
2. Approach
Influences of integrated BESS on a low-voltage distribution grid with high PV penetration are investigated. A real, low-voltage distribution grid topology, real smart meter household load profiles, and real PV data are used. Additionally, simulated batteries are attached either to the feed-in node (central) or to the nodes comprising distributed PV penetration. Operation of the batteries relies on an autonomous optimization approach, which is driven by an incentive.
First, we discuss the battery model and optimization routine, followed by a detailed description of the different incentives used for battery operation. Then, we describe the simulation setup in detail, regarding the applied grid topology, load and PV data, as well as the simulated battery configurations and parameters. Finally, we define criteria to evaluate the impact on load, voltage levels and distribution losses.
2.1. Autonomously Optimized Storages
A BESS is operated autonomously by minimizing a unidirectionally communicated incentive. This autonomous, on-site optimization approach allows for indirect load control. Different incentives enable the operator to pursue different measures. These measures reflect different intentions: (1) increase self-consumption; (2) facilitate grid balancing; (3) react to the electricity market.
2.1.1. Battery Model and Optimization
As shown in a previous study [32], linear models describe the battery behavior with accuracy comparable to nonlinear formulations in long-term simulations. Since only the long-term behavior of BESSs is of interest in this study, the simulations and optimizations are based on the linear battery model,
where describes the electrical energy content, the DC charging or discharging power rate, and all battery related losses. The operation mode of the battery is controlled via the decision function , reflecting charging (>0), discharging (<0), and idle (=0) modes, i.e., . The decision function is calculated by optimizing with respect to minimum costs for charging based on the incentive . Constraints guarantee that the battery’s state of charge (SOC) remains within the operational bounds, and . For a given time span , the optimization problem is then formulated as:
such that:
We assume continuous operation states () and introduce two decision variables, and for each time step specifying charging and discharging separately. The battery is connected to the electrical grid via an AC/DC converter. The conversion of AC to DC power and vice versa is assumed to exhibit a constant efficiency, i.e., . By including the converter efficiency linearly in the objective, the optimization can be formulated as a linear program:
Here, four boundary conditions must be fulfilled:
denotes the initial electrical energy content of the battery. The final operation state is calculated by .
2.1.2. Incentives
Reflecting alternative operation strategies for BESSs, we propose different incentives to drive the optimization routine, cf. Section 2.1.1. The operation strategy addresses either market conditions, grid balancing, optimal PV utilization, load shifting, or self-consumption (see Table 1).
Real-time pricing (RTP) is often discussed to control loads and storage systems [34,35,36,37], reflecting the real cost of electricity generation [37]. The Austrian Energy Stock Market (EXAA) offers daily block-based, hour-based and 15-min-based day-ahead stock market prices for electricity [38]. They are available on working days at 12 noon for the next 36 h. We use 15-min-based data as it was shown that balancing measures are improved by RTP based on shorter time intervals [32]. To compensate for peak loads, the future total load at the feed-in node defines another incentive, assuming perfect a priori knowledge of the total grid load. To support self-consumption of households with an integrated BESS through an incentive-driven approach, the incentive should reflect the future PV generation as well as the household load. However, to investigate the effects of consumption and generation separately, PV generation and total household consumption are used to define additional incentives. Again, we assume perfect prior knowledge of the loads and feed-in powers. We classify GRID central/distributed and PV central as grid-motivated incentives and PV distributed, LOAD distributed, and SELF distributed as consumer-motivated incentives.
2.2. Simulation Setup
Most studies in literature are based on artificial grid topologies [39], characteristic household loads [40], and simulated PV generation [41]. Instead, we apply real data for the low-voltage distribution grid topology, the household loads, and the distributed generation from photovoltaics to allow for results close to reality. Commercially available Li-ion BESSs are chosen as buffers for grid balancing to keep simulations practical. The grid simulation is based on a direct numerical method, as proposed by Ghatak and Mukherjee [42], which allows us to calculate the load flow for both, line grids as well as weakly meshed grids. The method has already been applied successfully in various forms [42,43,44,45], and used to setup a simulation tool in MATLAB [46]. The tool provides interfaces to include loads reacting on incentives for the purpose of testing load management strategies [47]. The grid is simulated at a temporal resolution of 15 min.
2.2.1. Grid Topology
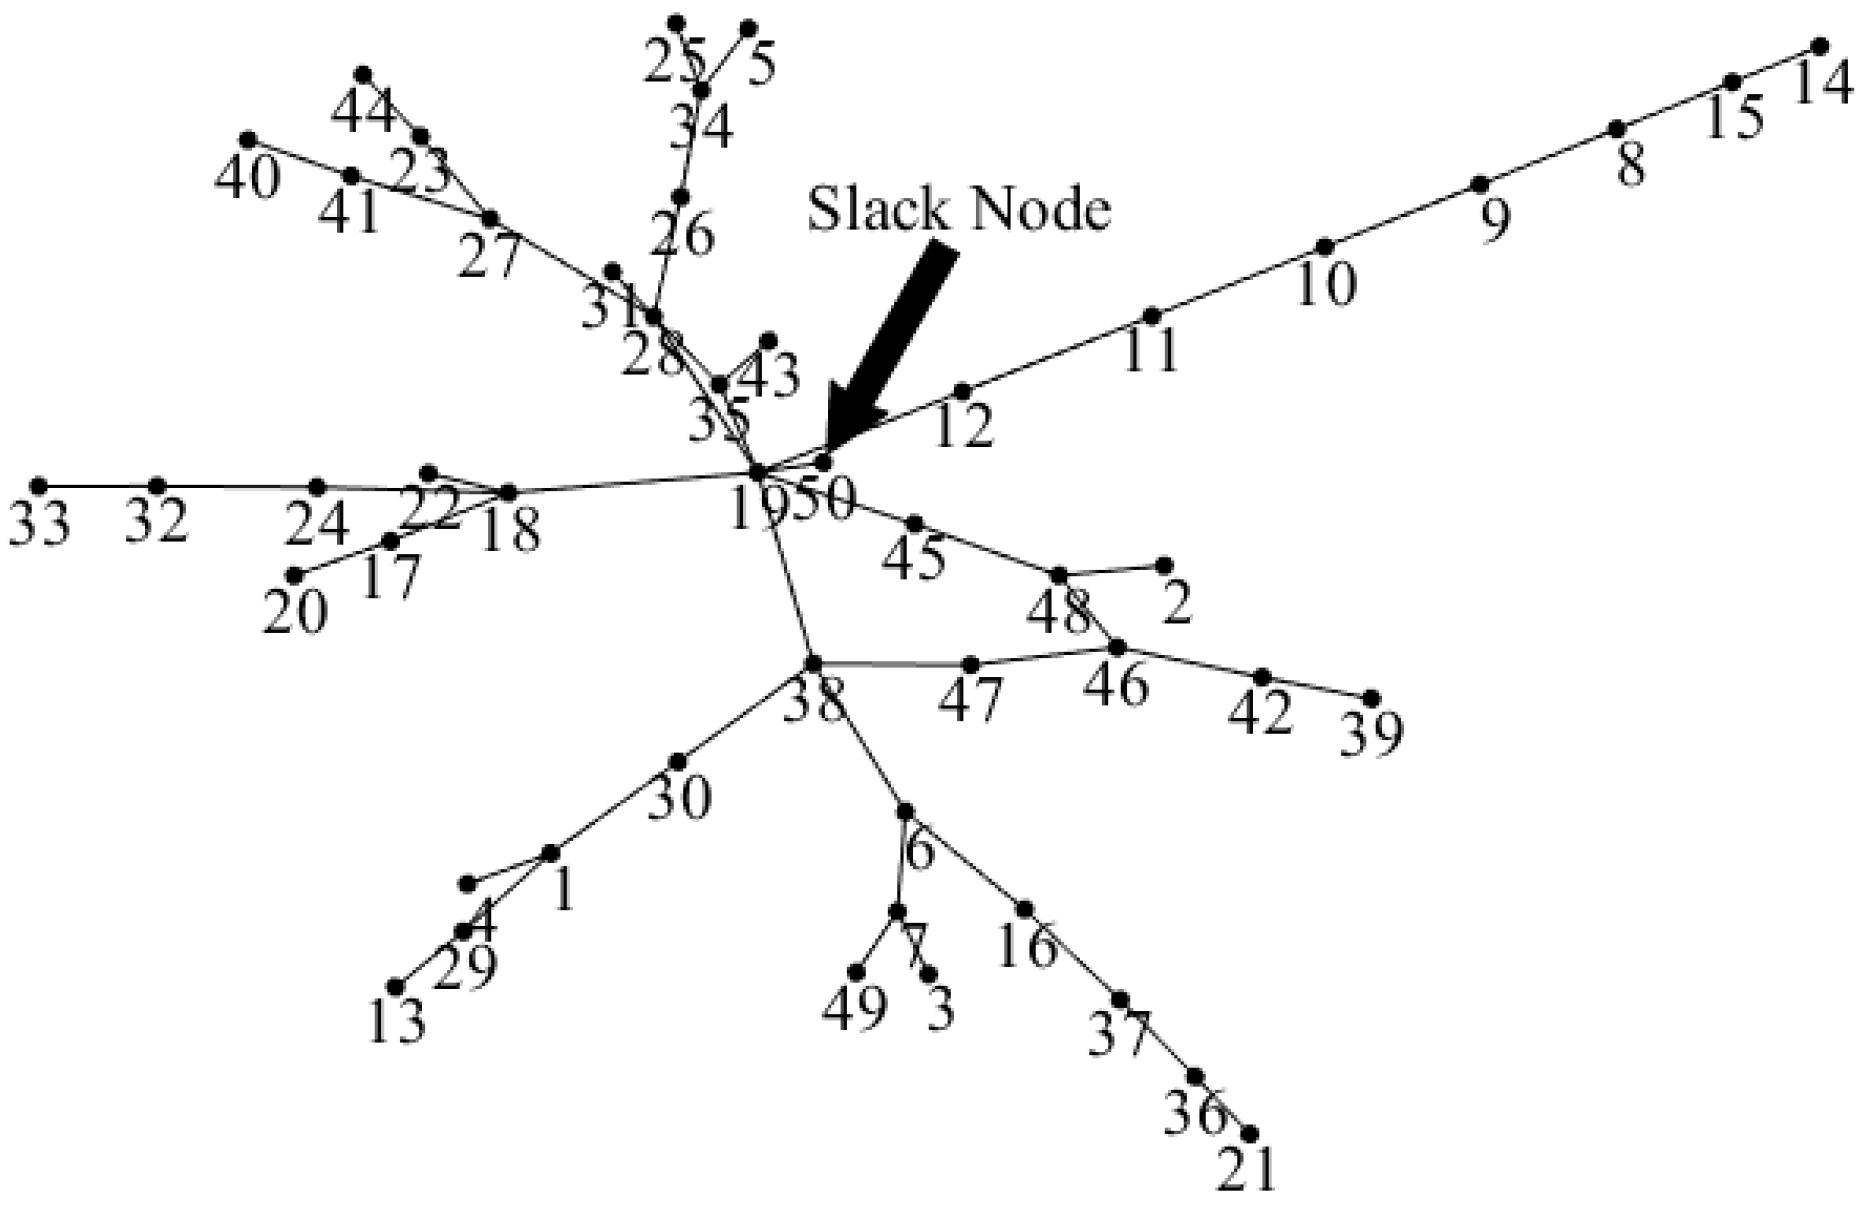
We investigate a rural distribution grid, for which all information is available from the local system operator, Vorarlberger Energienetze GmbH, Bregenz, Austria [48]. The weakly meshed low-voltage distribution grid (Figure 1) comprises of 50 nodes, with the slack node, i.e., central feed-in node (50), and an additional node (19) as placeholder for a central BESS. At the slack node, the voltage is set to 230 V and no phase shift is assumed. The termination condition for the iterative calculation procedure in the grid simulation is set to < 1 mV at all nodes.
2.2.2. Load and Photovoltaics Data
Smart meter household loads provided by Vorarlberger Kraftwerke AG (VKW), Bregenz, Austria [49], are assigned to the 48 load nodes. The temporal resolution of the load data is 15 min. In addition, electrical energy supply data of solar panels are required in the same resolution, the same period, and the same geographic area as the household load data. The data has been recorded at a photovoltaic power plant owned by VKW [49]. It consists of 270 modules with a total module surface area of about 460 m2 and a nominal output power of 62.1 kWp [50]. For the simulations, the PV systems at the load nodes are scaled to typically residential dimensions of 3, 5, and 6 kWp [51]. The location in the grid is chosen randomly, attaching a PV system of 3 kWp at node 37, of 5 kWp at node 21, and of 6 kWp at node 24. The total photovoltaic peak power accounts for 14 kWp. This corresponds to approximately one quarter of the maximum load noted at the slack node over the course of the simulation period, and in the absence of photovoltaics, which is a feasible penetration rate for low-voltage distribution grids [5,52].
2.2.3. Battery Parameters
Different BESSs with capacities ranging from 4 to 16 kWh and maximum charging and discharging power ranging from 2.5 to 8.5 kW are chosen to evaluate their impact on the grid. As distributed storages, two types of a top-rated Li-ion battery [53], the sonnenBatterie system [54], have been selected according to the manufacturer’s recommendation for an annual household consumption. At node 21 and 24, the type “eco 8/6” [55] is used since the annual household consumption is about 4000 kWh. For the household at node 37, an “eco 8/4” [55] is used since the annual consumption is less than 3300 kWh.
If a single, central storage is used at node 19 as grid-balancing measure, it is assumed that its capacity and maximum charging and discharging power equals the sum of all selected distributed BESSs. The possible depth of discharge (DOD), the charging and discharging efficiency as well as the battery efficiency for all batteries are taken from the original system and assumed to be constant. The round-trip efficiencies (converter–battery–converter) for the presented systems are about 90%. Detailed battery parameters used for the battery model and the optimization (cf. Section 2.1.1) are listed in Table 2.
Using the nominal AC power, the constant battery loss can be estimated by calculating the average value between losses for charging, , and discharging, :
Note that (1 − ) has to be divided by two in Equation (9) since describes the round-trip efficiency of the battery. When executing the simulation, the battery is assumed to be fully charged at . Results for the optimization are achieved using MATLAB’s linprog routine [56].
2.2.4. Evaluation Criteria
Three evaluation criteria are used as quality measure: the peak-to-average power ratio (PAPR) and the maximum voltage drop/rise and the distribution losses. PAPR is a measure for the maximum occurring power at the slack node. Voltage drop/rise is analyzed at each individual node as its deviation has to be in a certain range based on standards for electrical grids [57]. The distribution losses are the cumulative losses of the investigated grid section.
By improving the PAPR, it is possible to achieve a more uniform energy transmission reducing the need for expensive operating reserves. The voltage drop/rise is of interest for the grid operator to ensure that the voltage is kept within defined limits [57]. In addition to saving resources, both the utility company and the grid operator, are interested in reducing the distribution losses.
PAPR defines the maximum occurring apparent power in relation to the average apparent power at the slack node during the observed period of discrete time steps and is defined as:
The maximum voltage drop/rise can be determined by the relation of the maximum or minimum occurring voltage of all nodes during the observed period in relation to the constant slack node voltage . It is given by:
The cumulative distribution losses are determined by the sum of all occurring distribution losses of the investigated grid section during the whole simulation period,
where represents the total set of nodes and the set of all neighboring nodes to node . and are the current and impedance, respectively, at the branch connecting node and . Only effective losses are taken into account. Since by permutation of and , every branch would be accounted for twice, the total sum has to be divided in half.
3. Results
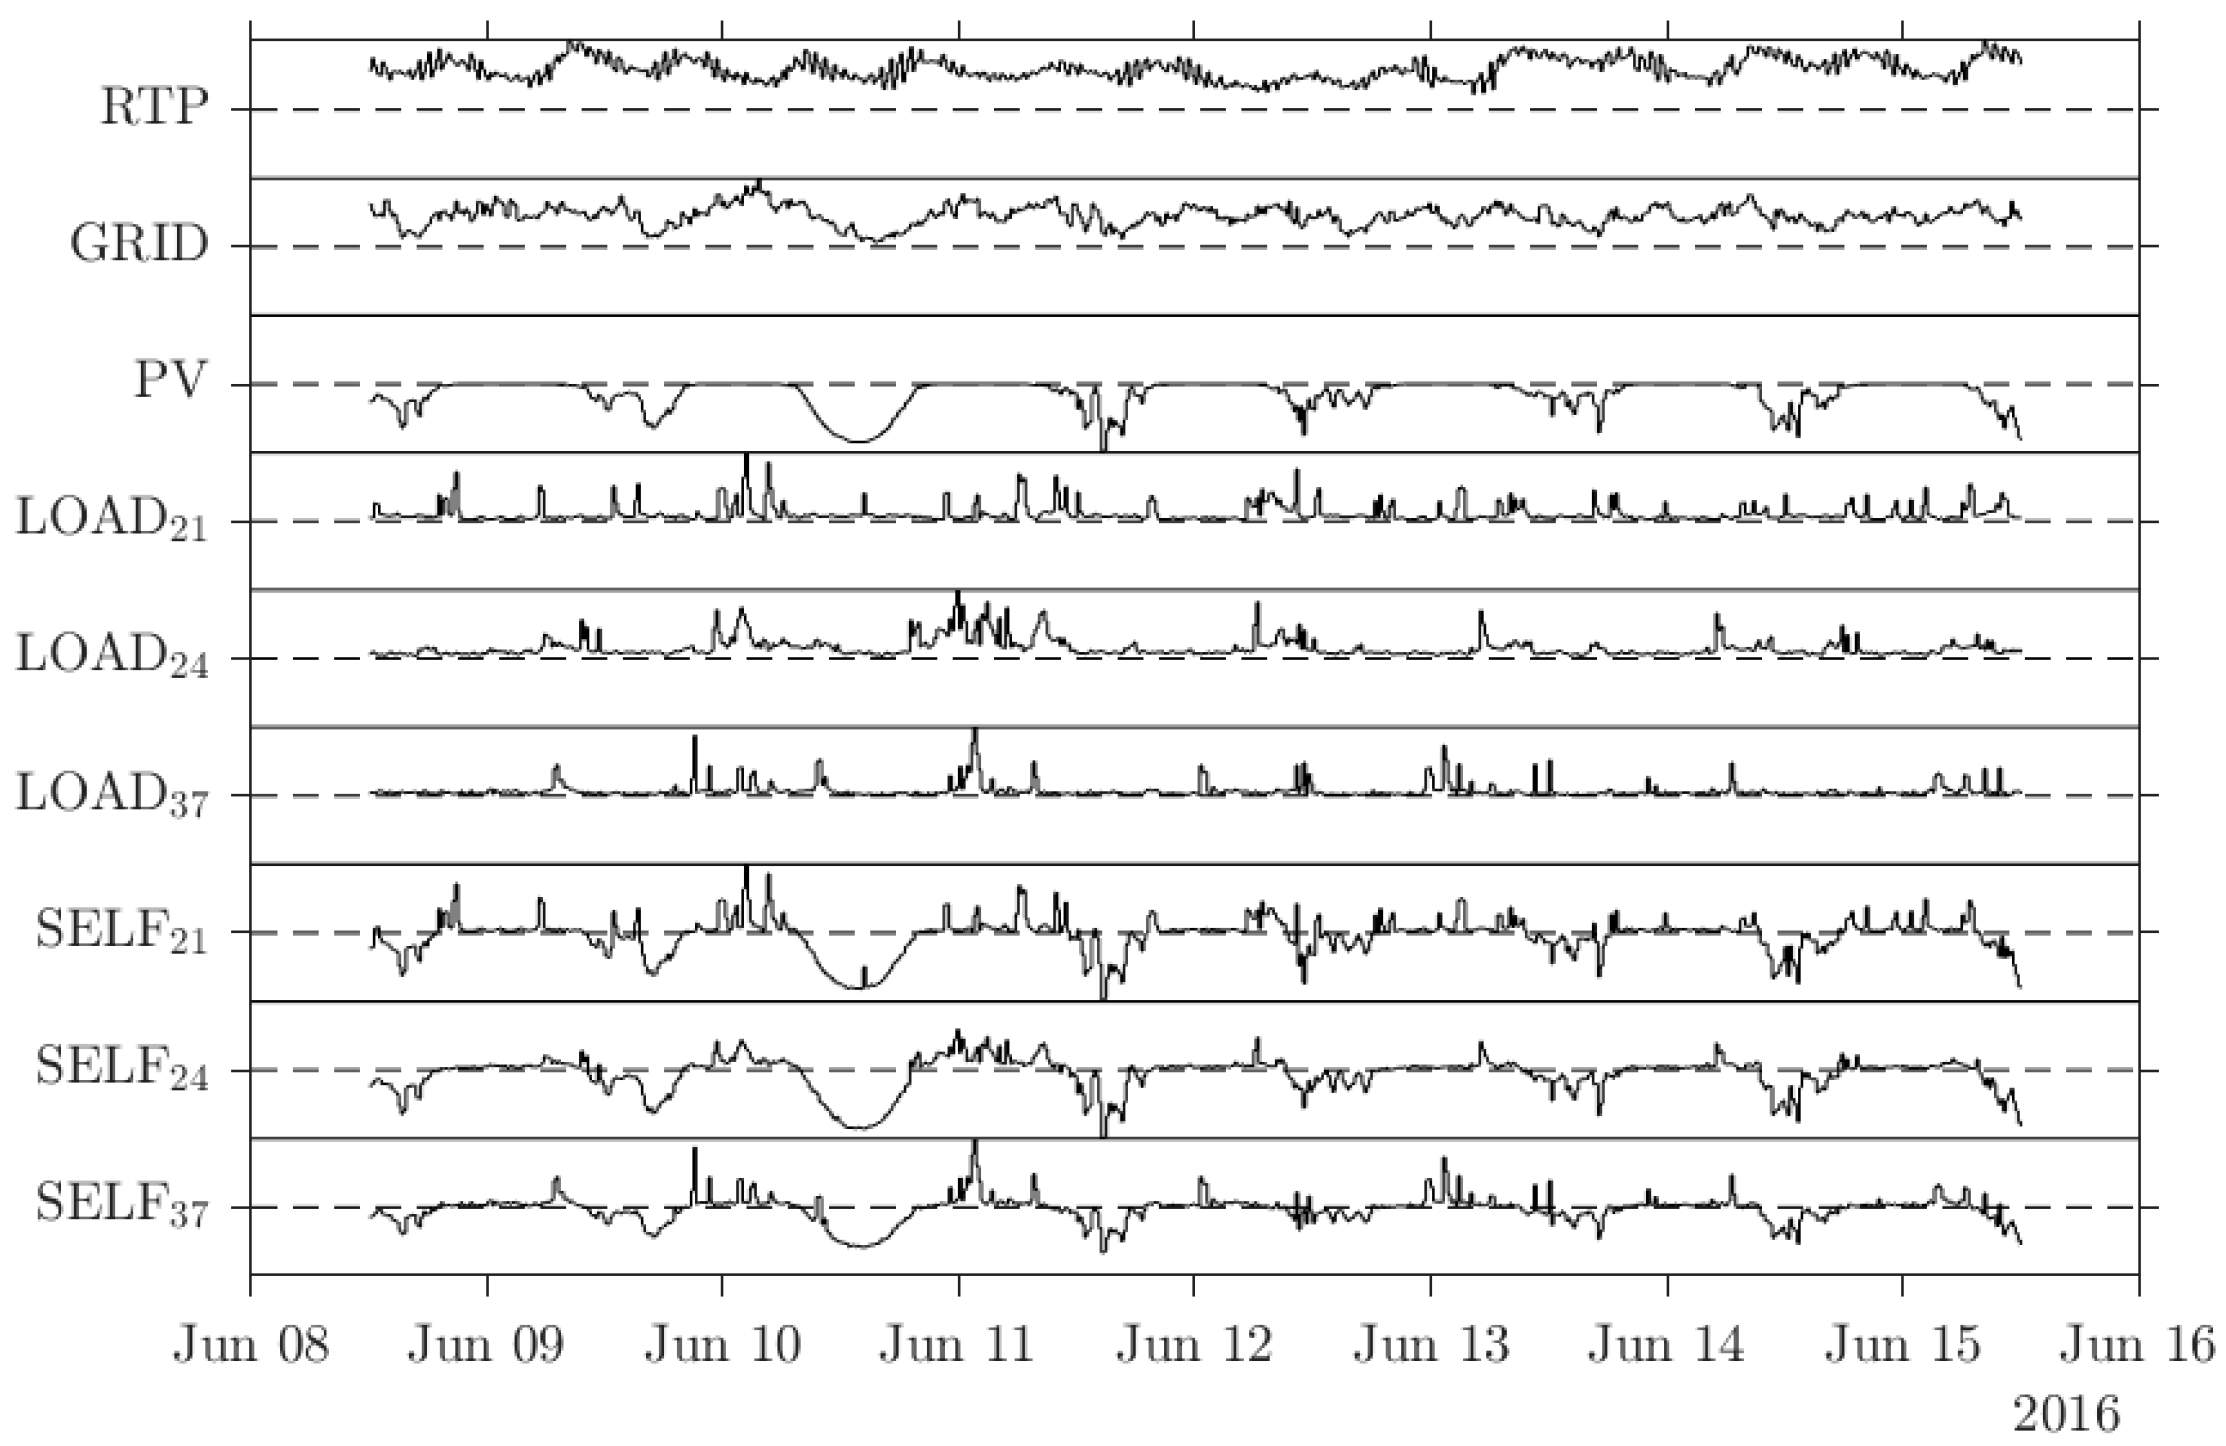
The grid simulation is conducted for the reference case without a BESS, as well as for a central BESS and multiple, distributed BESSs at load nodes with PV systems. The assignments of loads, as well as PV and battery parameters are unmodified throughout the simulations. This allows comparable results regarding load, distribution losses, and voltage levels. Detailed numerical results achieved can be found in Appendix A. Investigated configurations (incentives, BESS position) are listed in Table 1. Figure 2 depicts all incentives. All incentives are shown normalized to one, while the dashed line represents the zero line. The autonomous optimization attempts to charge the battery at the valleys and discharge it at spikes. Hence, the more valleys and spikes the incentive has, the more often the battery is in an active state. The timing of the incentives influences the battery’s reaction rate; therefore, short resolutions are important for a fast response. The time resolution of the conducted simulation is 15 min.
Figure 3 shows the PAPR, the voltage drop/rise as well as the corresponding distribution losses for all incentives and battery configurations. The PAPR is reduced in all operation modes with respect to the reference case except for RTP driven operation. In all modes other than RTP driven operation, while the maximum apparent power at the slack node reduces, the mean value remains nearly the same since the required household load has to be transferred and the storages work as buffer capacities. Conversely, using RTP as incentive results in additional peak loads with respect to the reference case. In general, the cumulative distribution losses are nearly unaffected by introducing a central storage, whereas distributed storages lead to higher distribution losses for all incentives. RTP-driven operation of distributed storages exhibits the highest distribution losses. The voltage drop/rise as well as the maximum and minimum voltages indicate that regardless of the incentive, central storages do not deteriorate or significantly improve the power quality in terms of voltage deviation.
Figure 4 illustrates the power duration curves and Figure 5 the voltage duration curves for all incentives and configurations. It shows the number of hours in which the feed-in apparent power is above a certain level. Better utilization of the grid is reflected by a straight curve. For both graphs, it can be seen that local, grid-motivated incentives (GRID, PV central) perform best, followed by consumer-motivated incentives (PV distributed, LOAD, SELF), the reference case, and RTP incentives. Simulations of a central storage, except in the RTP-driven case, have a positive impact on the voltage level and lead to a more uniform voltage distribution.
4. Discussion
Results in Section 3 show that local, grid-motivated incentives (GRID, PV central) help to improve the power quality in terms of the PAPR in the case of a single, central storage as well as in case of multiple, distributed storages. The distributed storages perform slightly better (15.0% reduction in PAPR for GRID distributed) than a central storage (14.5% reduction in PAPR for GRID central and 11.9% for PV central). This can be attributed to a higher probability that one of the distributed storages is close to a peak load at any given time as compared to a single, central storage. Hence, lower distribution losses occur for the transferred balancing energy. In addition, the cumulative distribution losses for distributed storages are higher than those for a central storage during the subsequent battery charging. In turn, the average slack node power is increased, which also leads to a further reduction of the PAPR. The voltage drop/rise is marginally better for central storages, however, for distributed storages, no significant change in the voltage quality is observed.
Consumer-motivated incentives (PV distributed, LOAD, SELF) for distributed storages lead to an improvement of the PAPR. This is because these incentives at least partially incorporate loads contributing to the total grid load. Combining household loads and photovoltaic generation reduces the PAPR most significantly (12.2% for SELF). This can be attributed to the fact that the incentive represents more features of the total grid load than the individual photovoltaic or household loads. By applying photovoltaic generation as an incentive (PV), PAPR is improved by 11.4%; with individual household loads as the incentive (LOAD), the improvement is 7.0%. The voltage quality in terms of voltage drop/rise deteriorates only insignificantly compared to the reference.
Furthermore, we have proven that RTP incentives, as often used in literature, worsen the PAPR by 14.6% for a single, central storage and by 15.1% for multiple, distributed storages. This happens since supraregional markets do not reflect the local grid load situation. The voltage drop/rise for a single, central storage remains almost the same; for multiple, distributed storages, a deterioration of 1.8% of the minimum voltage compared to the minimum reference voltage is observed.
For distributed storages, the distribution losses of the investigated grid section increased. This can be attributed to the transmission of energy to the distributed storage resulting in higher losses compared to a feed-in tied storage. This energy transfer also accounts for the greater deviation in voltage drop/rise of distributed storages compared to a central storage.
The round-trip efficiency used for the models was about 90%, which can only be achieved by very well-tuned systems. Lower round-trip efficiencies would increase the impact on the grid quality during discharging, due to the lower power output compared to systems that are more efficient.
5. Conclusions
In this work, the grid-balancing ability of a central battery storage was compared to distributed battery storage systems in a simulation study. Based on different incentives, the battery mode (charge, discharge, or idle) was determined by optimization. The simulation is based on a real grid topology in combination with smart meter household load data and distributed photovoltaics generation data. Evaluation criteria are the peak-to-average power ratio at the feed-in node, the maximum voltage drop/rise at all nodes of the grid, and the cumulative distribution losses of the investigated grid section.
The investigated cases show that incentives that reflect more general conditions, such as supraregional markets, may even deteriorate power quality. Thus, we proved that it is crucial to assess the impact of grid-balancing measures on all voltage levels of the electrical grid. Hence, to improve the power quality of low-voltage distribution grids by the use of autonomously optimized devices, local, grid-motivated and consumer-motivated incentives are preferable. In these cases, both a single, central storage as well as multiple, distributed storages have power quality related advantages in low-voltage distribution grids; the former configuration performs better in terms of the voltage drop/rise and shows lower distribution losses, the latter in terms of the reduction of the peak-to-average power ratio. Therefore, efforts should be made for grid and household load assessment, which account for contributions from distributed generation, in order to ensure grid reliability in the future.
Acknowledgments
The financial support by the Austrian Federal Ministry of Science, Research and Economy and the National Foundation for Research, Technology and Development is gratefully acknowledged. The simulation study was conducted based on anonymized smart meter load data and PV generation data provided by Vorarlberger Kraftwerke AG and real, rural grid topology data provided by Vorarlberger Energienetze GmbH. We thank Jörg Petrasch, the former illwerke vkw Professor of Energy Efficiency and the former head of the Josef Ressel Center for Applied Scientific Computing in Energy, Finance, and Logistics at the Vorarlberg University of Applied Sciences, for his insightful contributions.
Author Contributions
Bernhard Faessler developed and implemented the battery optimization routines, evaluated the results and wrote the paper. Michael Schuler implemented and parameterized the grid simulation framework and conducted the simulations. Markus Preißinger structured and substantially revised the paper. Peter Kepplinger developed the concept of the simulation method, analyzed the literature, and revised the paper.
Conflicts of Interest
The authors declare no conflicts of interest.
Nomenclature
| Set of neighboring nodes (–) | |
| Incentive (–) | |
| Depth of discharge (%) | |
| Electrical energy content (J) | |
| Cumulative distribution losses (Wh) | |
| Alternating current (A) | |
| Alternating current at the slack node (A) | |
| Total set of nodes (–) | |
| Total number of data points (–) | |
| Peak-to-average power ratio (–) | |
| Alternating power (W) | |
| Direct power (W) | |
| Household power (W) | |
| Linearized battery losses (W) | |
| Power at the slack node (VA) | |
| Photovoltaic power (W) | |
| State of charge (%) | |
| Time (s) | |
| Alternating voltage (V) | |
| Alternating voltage drop/rise (V) | |
| Alternating voltage at the individual grid nodes (V) | |
| Alternating voltage at the slack node (V) | |
| Decision variable on DC power side (–) | |
| Impedance matrix (Ω) | |
| Battery efficiency (–) | |
| Amount of loads (–) |
Appendix A

Table A1.
PAPR, power, and loss results achieved for a single, central storage (c) and multiple, distributed storages (d) driven by different incentives. The superscript * refers to normed quantities with respect to the reference case, i.e., and analogously for PAPR.
Table A1.
PAPR, power, and loss results achieved for a single, central storage (c) and multiple, distributed storages (d) driven by different incentives. The superscript * refers to normed quantities with respect to the reference case, i.e., and analogously for PAPR.
| Abbreviation | Configuration | (kVA) | (kVA) | (kVA) | (–) | (–) | (kWh) | (–) |
|---|---|---|---|---|---|---|---|---|
| REF | - | 26.21 | 4.06 | 57.88 | 2.21 | 1.00 | 38.76 | 1.00 |
| RTP | c | 26.24 | −3.84 | 66.41 | 2.53 | 1.15 | 38.97 | 1.01 |
| d | 26.31 | −3.62 | 66.85 | 2.54 | 1.15 | 50.38 | 1.30 | |
| GRID | c | 26.14 | 12.56 | 49.35 | 1.89 | 0.85 | 38.50 | 0.99 |
| d | 26.16 | 12.51 | 49.12 | 1.88 | 0.85 | 41.29 | 1.07 | |
| PV | c | 26.38 | 2.80 | 51.32 | 1.95 | 0.88 | 38.83 | 1.00 |
| d | 26.42 | 2.88 | 51.68 | 1.96 | 0.89 | 45.03 | 1.16 | |
| CONS | d | 26.42 | 0.37 | 54.26 | 2.05 | 0.93 | 44.72 | 1.15 |
| SELF | d | 26.63 | 3.10 | 51.68 | 1.94 | 0.88 | 43.35 | 1.12 |
Table A2.
Voltage results achieved for a single, central storage (c) and multiple, distributed storages (d) driven by different incentives. The superscript * refers to normed quantities with respect to the reference case, i.e., .
Table A2.
Voltage results achieved for a single, central storage (c) and multiple, distributed storages (d) driven by different incentives. The superscript * refers to normed quantities with respect to the reference case, i.e., .
| Abbreviation | Configuration | (V) | (V) | (V) | (–) |
|---|---|---|---|---|---|
| REF | - | 228.67 | 222.35 | 233.87 | 1.00 |
| RTP | c | 228.67 | 222.29 | 233.87 | 1.01 |
| d | 228.66 | 218.44 | 236.39 | 1.51 | |
| GRID | c | 228.67 | 222.40 | 233.82 | 0.99 |
| d | 228.67 | 222.35 | 234.68 | 1.00 | |
| PV | c | 228.67 | 222.40 | 233.82 | 0.99 |
| d | 228.65 | 220.77 | 233.72 | 1.21 | |
| LAOD | d | 228.65 | 221.99 | 235.87 | 1.05 |
| SELF | d | 228.64 | 221.86 | 233.53 | 1.06 |
References
- Biegel, B.; Hansen, L.H.; Stoustrup, J.; Andersen, P.; Harbo, S. Value of flexible consumption in the electricity markets. Energy 2014, 66, 354–362. [Google Scholar] [CrossRef]
- Beaudin, M.; Zareipour, H.; Schellenberglabe, A.; Rosehart, W. Energy storage for mitigating the variability of renewable electricity sources: An updated review. Energy Sustain. Dev. 2010, 14, 302–314. [Google Scholar] [CrossRef]
- Pina, A.; Silva, C.; Ferrão, P. The impact of demand side management strategies in the penetration of renewable electricity. Energy 2012, 41, 128–137. [Google Scholar] [CrossRef]
- Lopes, J.A.P.; Hatziargyriou, N.; Mutale, J.; Djapic, P.; Jenkins, N. Integrating distributed generation into electric power systems: A review of drivers, challenges and opportunities. Electr. Power Syst. Res. 2007, 77, 1189–1203. [Google Scholar] [CrossRef]
- Bucher, C. Analysis and Simulation of Distribution Grids with Photovoltaics; ETH Zurich: Zurich, Switzerland, 2014. [Google Scholar]
- Paatero, J.V.; Lund, P.D. Effects of large-scale photovoltaic power integration on electricity distribution networks. Renew. Energy 2007, 32, 216–234. [Google Scholar] [CrossRef]
- Ochoa, L.F.; Padilha-Feltrin, A.; Harrison, G.P. Evaluating distributed generation impacts with a multiobjective index. IEEE Trans. Power Deliv. 2006, 21, 1452–1458. [Google Scholar] [CrossRef]
- Woyte, A.; Thong, V.V.; Belmans, R.; Nijs, J. Voltage fluctuations on distribution level introduced by photovoltaic systems. IEEE Trans. Energy Convers. 2006, 21, 202–209. [Google Scholar] [CrossRef]
- Ackermann, T.; Knyazkin, V. Interaction between distributed generation and the distribution network: Operation aspects. In Proceedings of the IEEE/PES Transmission and Distribution Conference and Exhibition 2002: Asia Pacific, Yokohama, Japan, 6–10 October 2002; Volume 2, pp. 1357–1362. [Google Scholar]
- Barker, P.P.; De Mello, R.W. Determining the impact of distributed generation on power systems. I. Radial distribution systems. In Proceedings of the IEEE Power Engineering Society Summer Meeting, Seattle, WA, USA, 16–20 July 2000; Volume 3, pp. 1645–1656. [Google Scholar]
- Stetz, T.; Marten, F.; Braun, M. Improved Low Voltage Grid-Integration of Photovoltaic Systems in Germany. IEEE Trans. Sustain. Energy 2013, 4, 534–542. [Google Scholar] [CrossRef]
- Siano, P. Demand response and smart grids—A survey. Renew. Sustain. Energy Rev. 2014, 30, 461–478. [Google Scholar] [CrossRef]
- Palensky, P.; Dietrich, D. Demand Side Management: Demand Response, Intelligent Energy Systems, and Smart Loads. IEEE Trans. Ind. Inform. 2011, 7, 381–388. [Google Scholar] [CrossRef]
- Gelazanskas, L.; Gamage, K.A.A. Demand side management in smart grid: A review and proposals for future direction. Sustain. Cities Soc. 2014, 11, 22–30. [Google Scholar] [CrossRef]
- Richardson, P.; Flynn, D.; Keane, A. Optimal Charging of Electric Vehicles in Low-Voltage Distribution Systems. IEEE Trans. Power Syst. 2012, 27, 268–279. [Google Scholar] [CrossRef]
- Pang, C.; Dutta, P.; Kezunovic, M. BEVs/PHEVs as Dispersed Energy Storage for V2B Uses in the Smart Grid. IEEE Trans. Smart Grid 2012, 3, 473–482. [Google Scholar] [CrossRef]
- Zhang, W.; Zhang, D.; Mu, B.; Wang, L.; Bao, Y.; Jiang, J.; Morais, H. Decentralized Electric Vehicle Charging Strategies for Reduced Load Variation and Guaranteed Charge Completion in Regional Distribution Grids. Energies 2017, 10, 147. [Google Scholar] [CrossRef]
- Roberts, B.P.; Sandberg, C. The Role of Energy Storage in Development of Smart Grids. Proc. IEEE 2011, 99, 1139–1144. [Google Scholar] [CrossRef]
- Bragard, M.; Soltau, N.; Thomas, S.; De Doncker, R.W. The Balance of Renewable Sources and User Demands in Grids: Power Electronics for Modular Battery Energy Storage Systems. IEEE Trans. Power Electron. 2010, 25, 3049–3056. [Google Scholar] [CrossRef]
- Qian, H.; Zhang, J.; Lai, J.-S.; Yu, W. A high-efficiency grid-tie battery energy storage system. IEEE Trans. Power Electron. 2011, 26, 886–896. [Google Scholar] [CrossRef]
- Joerissen, L.; Garche, J.; Fabjan, C.; Tomazic, G. Possible use of vanadium redox-flow batteries for energy storage in small grids and stand-alone photovoltaic systems. J. Power Sources 2004, 127, 98–104. [Google Scholar] [CrossRef]
- Toledo, O.M.; Oliveira Filho, D.; Diniz, A.S.A.C. Distributed photovoltaic generation and energy storage systems: A review. Renew. Sustain. Energy Rev. 2010, 14, 506–511. [Google Scholar] [CrossRef]
- Bhatia, R.S.; Jain, S.P.; Jain, D.K.; Singh, B. Battery Energy Storage System for Power Conditioning of Renewable Energy Sources. In Proceedings of the IEEE International Conference on Power Electronics and Drives Systems, Kuala Lumpur, Malaysia, 28 November–1 December 2005; Volume 1, pp. 501–506. [Google Scholar]
- Borsche, T.; Ulbig, A.; Koller, M.; Andersson, G. Power and energy capacity requirements of storages providing frequency control reserves. In Proceedings of the 2013 IEEE Power and Energy Society General Meeting (PES), Vancouver, BC, Canada, 21–25 July 2013; pp. 1–5. [Google Scholar]
- Lawder, M.T.; Suthar, B.; Northrop, P.W.C.; De, S.; Hoff, C.M.; Leitermann, O.; Crow, M.L.; Santhanagopalan, S.; Subramanian, V.R. Battery Energy Storage System (BESS) and Battery Management System (BMS) for Grid-Scale Applications. Proc. IEEE 2014, 102, 1014–1030. [Google Scholar] [CrossRef]
- Chen, H.; Cong, T.N.; Yang, W.; Tan, C.; Li, Y.; Ding, Y. Progress in electrical energy storage system: A critical review. Prog. Nat. Sci. 2009, 19, 291–312. [Google Scholar] [CrossRef]
- Ma, T.; Yang, H.; Lu, L. Feasibility study and economic analysis of pumped hydro storage and battery storage for a renewable energy powered island. Energy Convers. Manag. 2014, 79, 387–397. [Google Scholar] [CrossRef]
- Barnhart, C.J.; Benson, S.M. On the importance of reducing the energetic and material demands of electrical energy storage. Energy Environ. Sci. 2013, 6, 1083–1092. [Google Scholar] [CrossRef]
- Ramoni, M.O.; Zhang, H.-C. End-of-life (EOL) issues and options for electric vehicle batteries. Clean Technol. Environ. Policy 2013, 15, 881–891. [Google Scholar] [CrossRef]
- Fäßler, B.; Kepplinger, P.; Kolhe, M.L.; Petrasch, J. Decentralized on-Site Optimization of a Battery Storage System Using One-Way Communication; Institution of Engineering and Technology: Stevenage, UK, 2015; pp. 1–7. [Google Scholar]
- Heymans, C.; Walker, S.B.; Young, S.B.; Fowler, M. Economic analysis of second use electric vehicle batteries for residential energy storage and load-levelling. Energy Policy 2014, 71, 22–30. [Google Scholar] [CrossRef]
- Faessler, B.; Kepplinger, P.; Petrasch, J. Decentralized price-driven grid balancing via repurposed electric vehicle batteries. Energy 2017, 118, 446–455. [Google Scholar] [CrossRef]
- Kepplinger, P.; Huber, G.; Petrasch, J. Demand Side Management via Autonomous Control-Optimization and Unidirectional Communication with Application to Resistive Hot Water Heaters; ENOVA: Eisenstadt, Austria, 2014; Volume 8. [Google Scholar]
- Finn, P.; Fitzpatrick, C. Demand side management of industrial electricity consumption: Promoting the use of renewable energy through real-time pricing. Appl. Energy 2014, 113, 11–21. [Google Scholar] [CrossRef]
- Gottwalt, S.; Ketter, W.; Block, C.; Collins, J.; Weinhardt, C. Demand side management—A simulation of household behavior under variable prices. Energy Policy 2011, 39, 8163–8174. [Google Scholar] [CrossRef]
- Logenthiran, T.; Srinivasan, D.; Khambadkone, A.M.; Aung, H.N. Multiagent System for Real-Time Operation of a Microgrid in Real-Time Digital Simulator. IEEE Trans. Smart Grid 2012, 3, 925–933. [Google Scholar] [CrossRef]
- Roos, J.G.; Lane, I.E. Industrial power demand response analysis for one-part real-time pricing. IEEE Trans. Power Syst. 1998, 13, 159–164. [Google Scholar] [CrossRef]
- Energy Exchange Austria (EXAA). Abwicklungsstelle für Energieprodukte AG EXAA Energy Exchange Austria. Available online: http://www.exaa.at/de (accessed on 18 December 2015).
- Xu, G.; Wu, S.; Tan, Y. Island Partition of Distribution System with Distributed Generators Considering Protection of Vulnerable Nodes. Appl. Sci. 2017, 7, 1057. [Google Scholar] [CrossRef]
- Pötzinger, C.; Preißinger, M.; Brüggemann, D. Influence of Hydrogen-Based Storage Systems on Self-Consumption and Self-Sufficiency of Residential Photovoltaic Systems. Energies 2015, 8, 8887–8907. [Google Scholar] [CrossRef]
- Ul-Haq, A.; Cecati, C.; Al-Ammar, E. Modeling of a Photovoltaic-Powered Electric Vehicle Charging Station with Vehicle-to-Grid Implementation. Energies 2016, 10, 4. [Google Scholar] [CrossRef]
- Ghatak, U.; Mukherjee, V. An improved load flow technique based on load current injection for modern distribution system. Int. J. Electr. Power Energy Syst. 2017, 84, 168–181. [Google Scholar] [CrossRef]
- Li, H.; Zhang, A.; Shen, X.; Xu, J. A load flow method for weakly meshed distribution networks using powers as flow variables. Int. J. Electr. Power Energy Syst. 2014, 58, 291–299. [Google Scholar] [CrossRef]
- Ghatak, U.; Mukherjee, V. A fast and efficient load flow technique for unbalanced distribution system. Int. J. Electr. Power Energy Syst. 2017, 84, 99–110. [Google Scholar] [CrossRef]
- Teng, J.-H. A direct approach for distribution system load flow solutions. IEEE Trans. Power Deliv. 2003, 18, 882–887. [Google Scholar] [CrossRef]
- MATLAB. MATLAB 2017a; The MathWorks Inc.: Natick, MA, USA, 2017. [Google Scholar]
- Schuler, M. Simulation Elektrischer Netze zur Beurteilung von Verbraucherseitiger Laststeuerung; Vorarlberg University of Applied Sciences: Dornbirn, Austria, 2017; p. 107. [Google Scholar]
- Vorarlberger Energienetze GmbH. Available online: https://www.vorarlbergnetz.at (accessed on 1 June 2017).
- Vorarlberger Kraftwerke AG VKW (Vorarlberger Kraftwerke AG). Available online: https://www.vkw.at/ (accessed on 1 June 2017).
- Gawlik, W.; Groiß, C.; Litzlbauer, M.; Maier, C.; Schuster, A.; Zeilinger, F.; Kann, A.; Meirold-Mautner, I.; Günther, G.; Eugster, C.; et al. aDSM—Aktives Demand-Side-Management durch Einspeiseprognose; Vienna University of Technology—Institute of Energy Systems and Electrical Drives: Vienna, Austria, 2014; p. 208. [Google Scholar]
- Erge, T.; Hoffmann, V.U.; Kiefer, K. The German experience with grid-connected PV-systems. Sol. Energy 2001, 70, 479–487. [Google Scholar] [CrossRef]
- Bucher, C. Bulletin Electrosuisse. March 2014, pp. 37–40. Available online: http://www.bulletin.ch/ (accessed on 25 October 2017).
- Vollmer, P. WirtschaftsWoche. 20 June 2016. Available online: http://www.wiwo.de/ (accessed on 31 May 2017).
- Sonnen GmbH. Sonnen GmbH—Energy Is Yours. Available online: https://sonnenbatterie.de (accessed on 31 May 2017).
- Sonnen GmbH. Technische Daten Sonnenbatterie Eco; Sonnen GmbH: Wildpoldsried, Germany, 2017. [Google Scholar]
- MATLAB. Optimization Toolbox; The MathWorks Inc.: Natick, MA, USA, 2017. [Google Scholar]
- EN Standard DIN EN 50160:2011-02. Merkmale der Spannung in öffentlichen Elektrizitätsversorgungsnetzen. 2011. Available online: https://www.beuth.de/ (accessed on 15 November 2017).
Figure 1.
Low-voltage distribution grid from local system operator.
Figure 2.
Used and normalized incentives to drive the optimization of the BESS for a one-week period: EXAA day-ahead spot-market price for electricity (RTP); total grid load at the slack node (GRID); photovoltaic generation (PV); individual household loads (LOAD) for household at node 21, 24, and 37 comprising a distributed storage system; individual total household consumption including load and photovoltaic generation (SELF) for household at node 21, 24, and 37 comprising a distributed storage system.

Figure 3.
Peak-to-average power ratio, voltages and cumulative distribution losses for all configurations for a single, central storage (c) and multiple, distributed storages (d). The superscript * refers to normed quantities with respect to the reference case, i.e., , analogously for and PAPR.
Figure 3.
Peak-to-average power ratio, voltages and cumulative distribution losses for all configurations for a single, central storage (c) and multiple, distributed storages (d). The superscript * refers to normed quantities with respect to the reference case, i.e., , analogously for and PAPR.
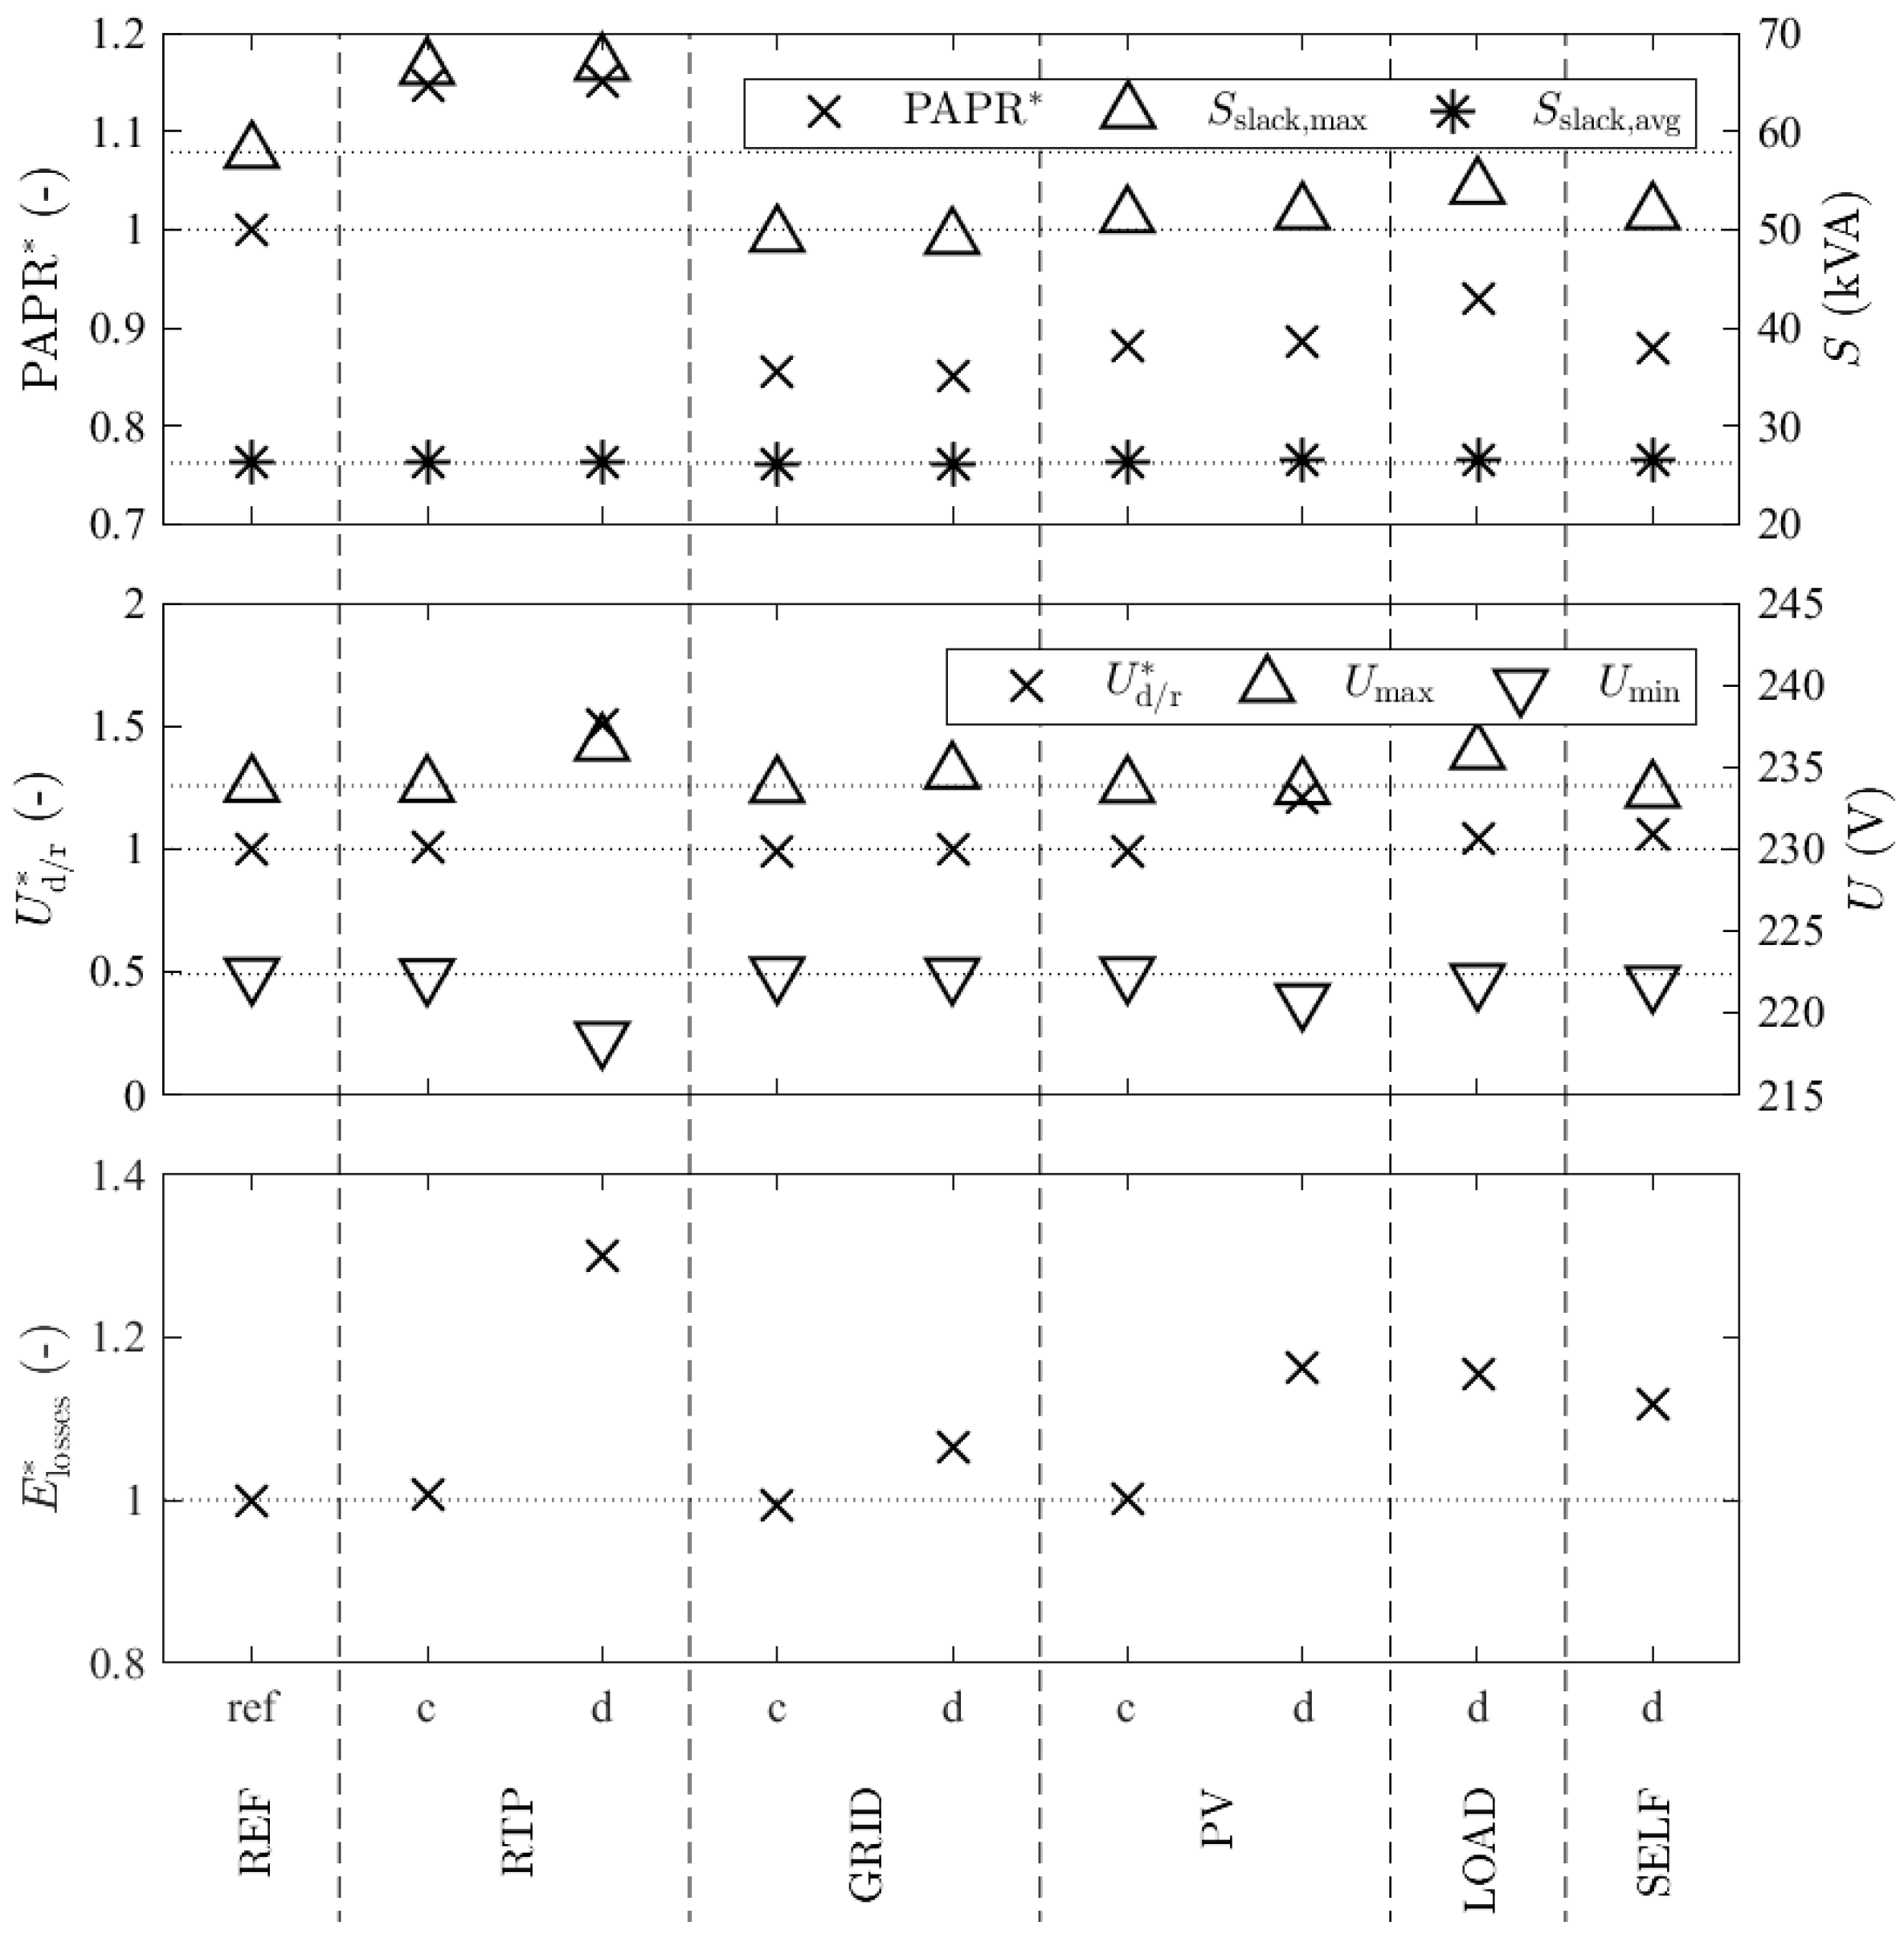
Figure 4.
Power duration curve for a single, central storage (c) and multiple, distributed storages (d) driven by different incentives.
Figure 4.
Power duration curve for a single, central storage (c) and multiple, distributed storages (d) driven by different incentives.
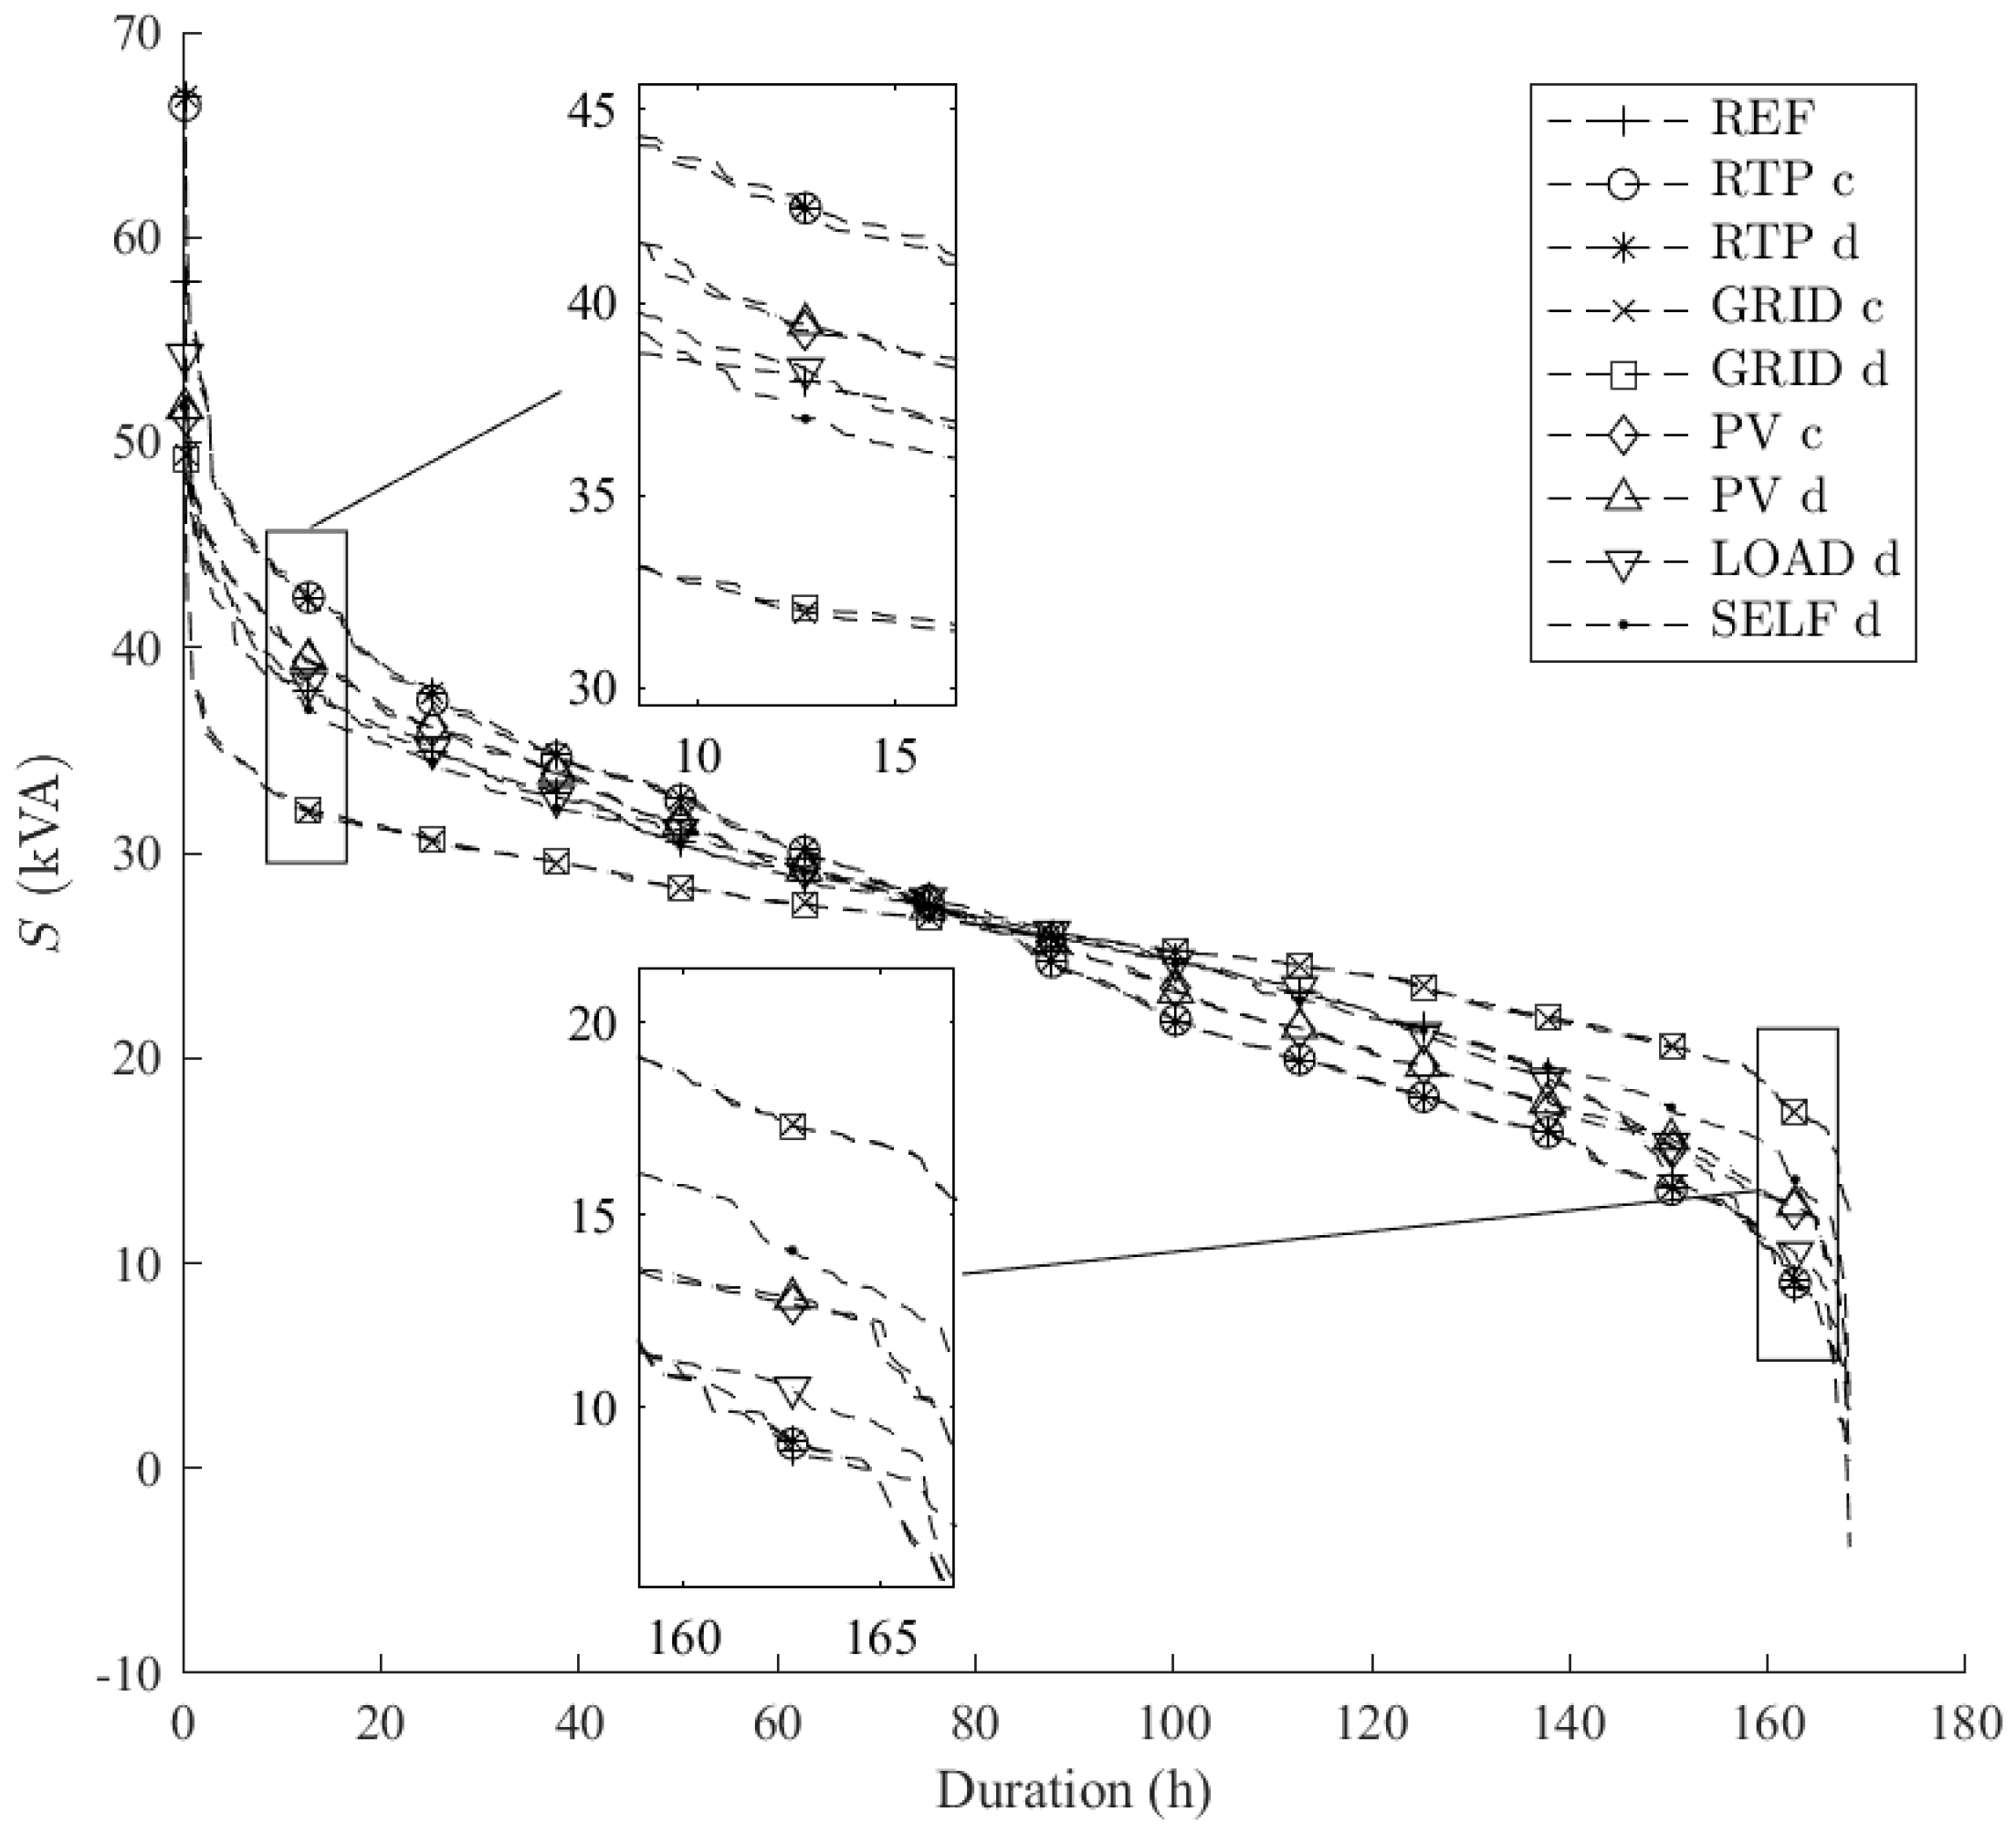
Figure 5.
Voltage duration curve for a single, central storage (c) and multiple, distributed storages (d) driven by different incentives.
Figure 5.
Voltage duration curve for a single, central storage (c) and multiple, distributed storages (d) driven by different incentives.
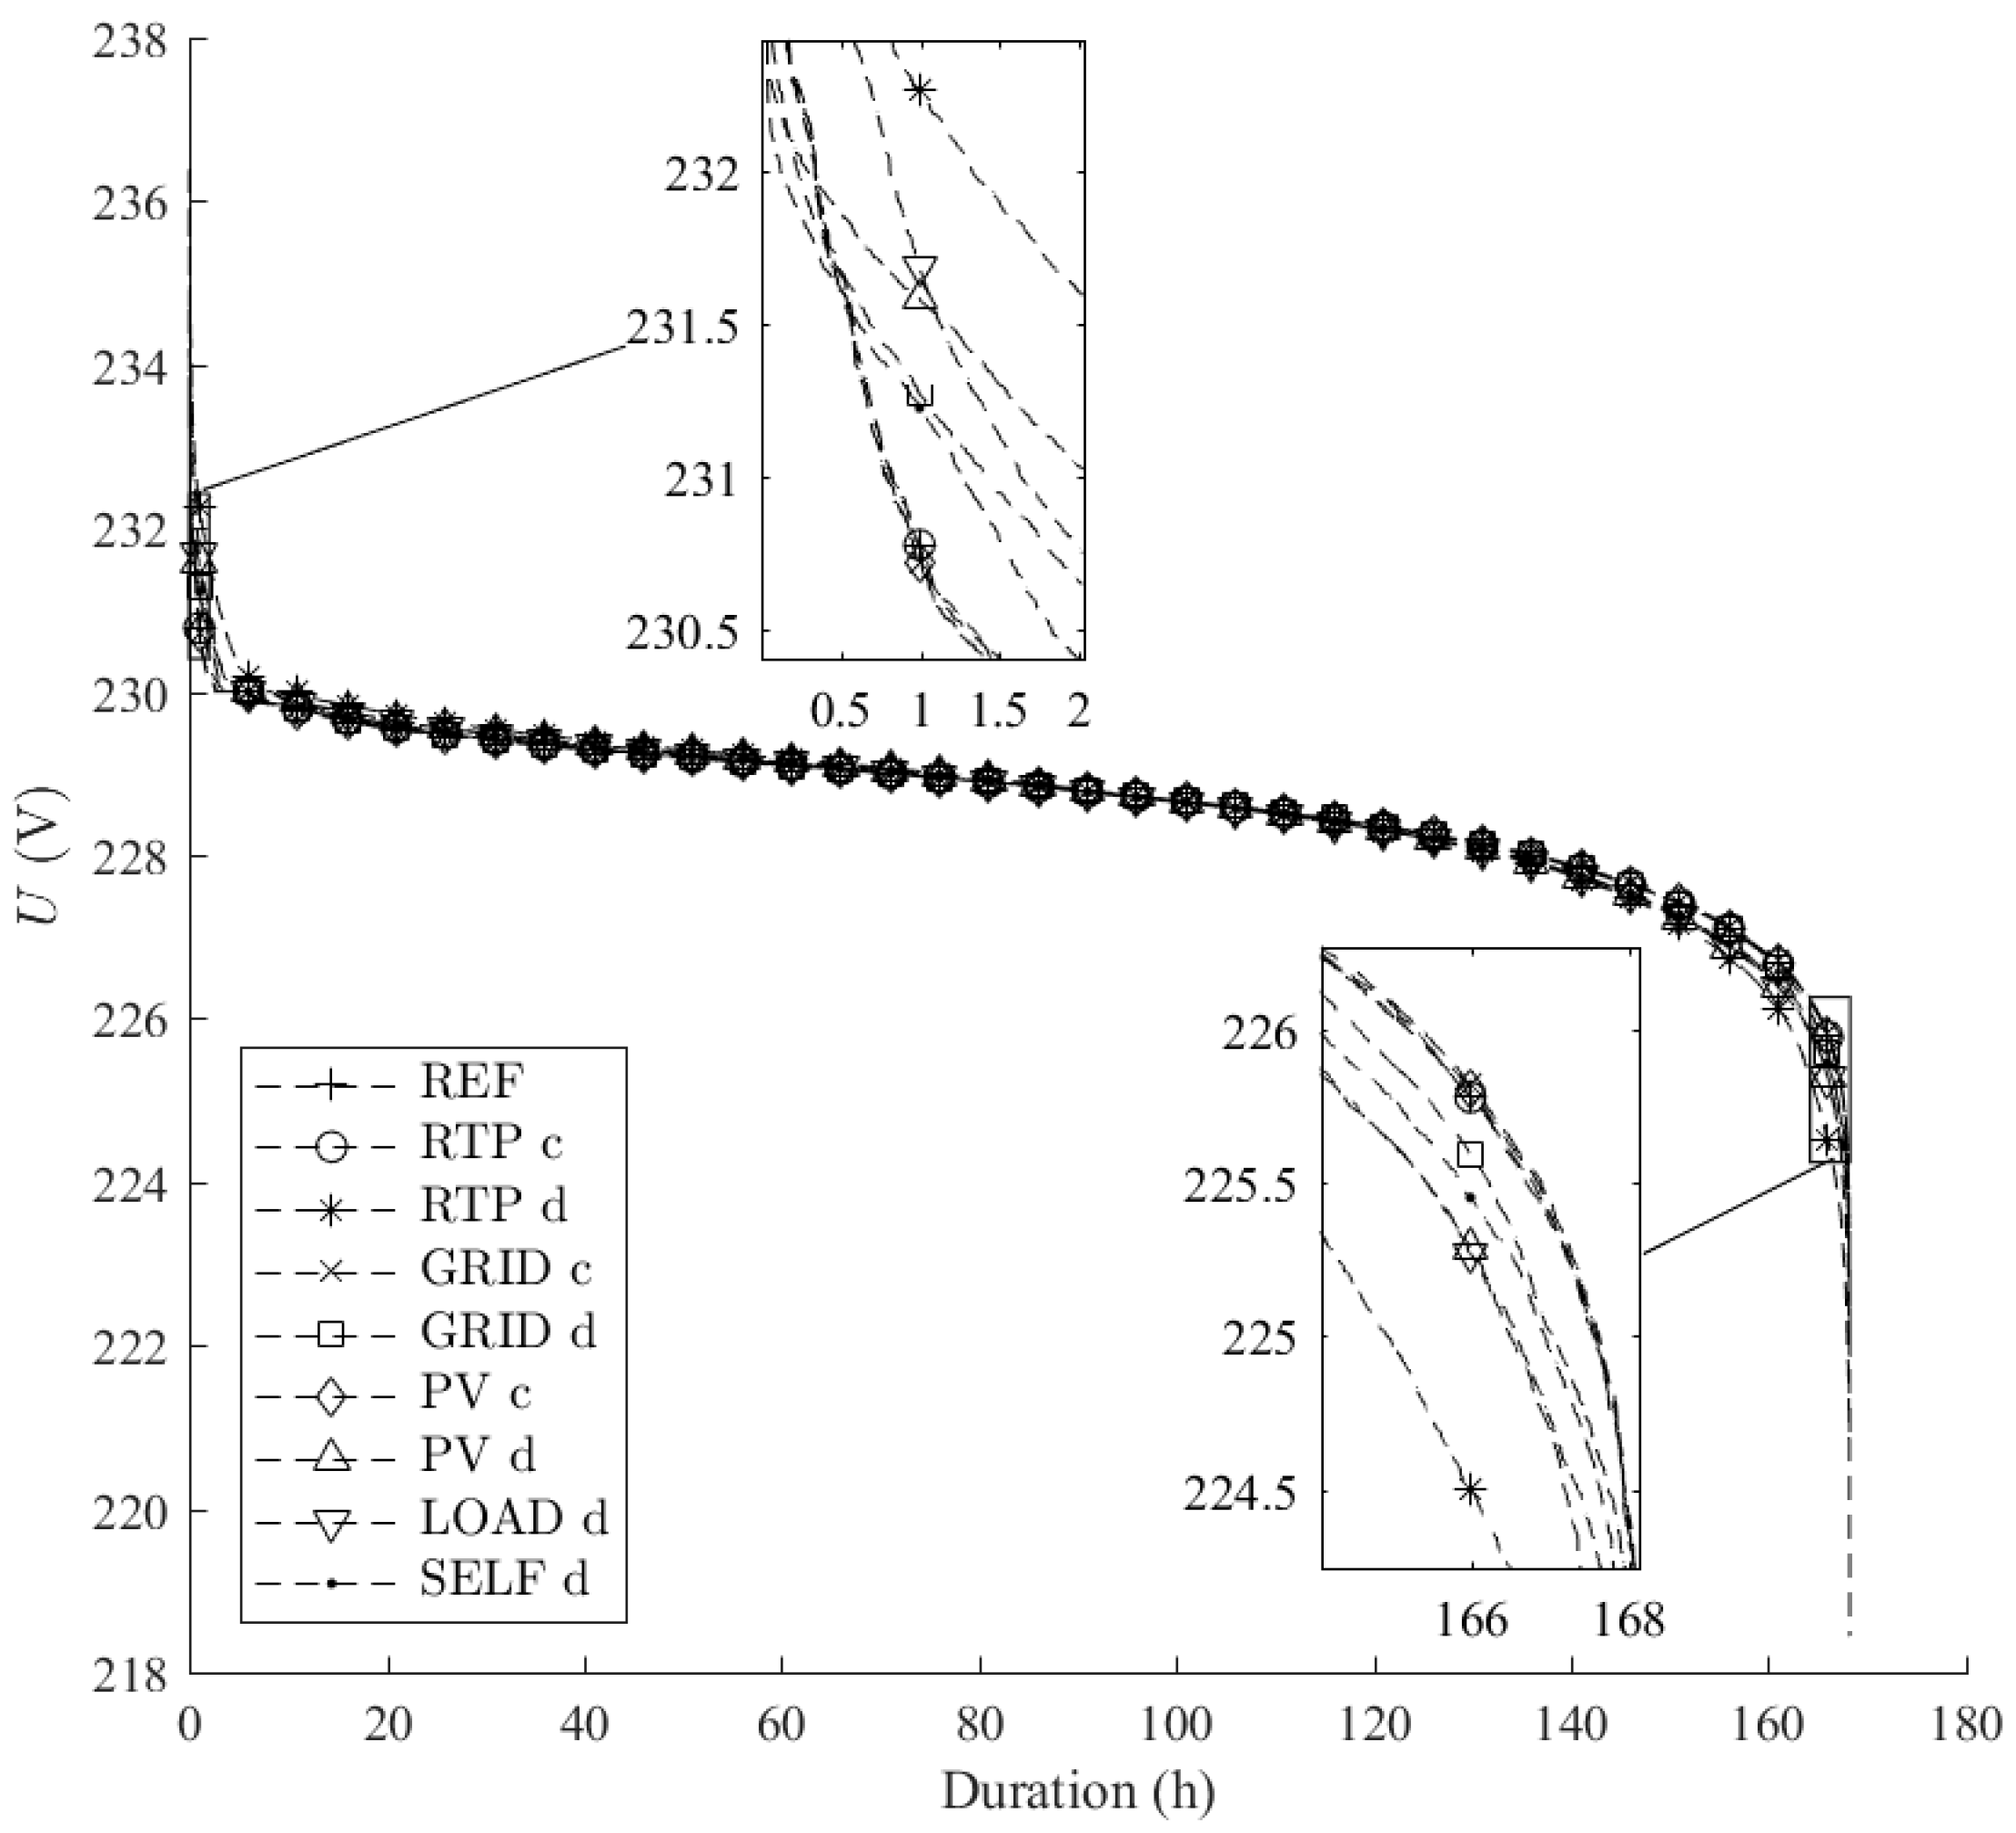
Table 1.
Incentives used to drive battery energy storage system (BESS) optimization. The considered configurations for BESS are abbreviated by c for a single, central storage and d for multiple, distributed storages.
Table 1.
Incentives used to drive battery energy storage system (BESS) optimization. The considered configurations for BESS are abbreviated by c for a single, central storage and d for multiple, distributed storages.
| Abbreviation | Description | Incentive | Configuration |
|---|---|---|---|
| REF | Reference case | - | - |
| RTP | Real-time pricing | EXAA day-ahead market price | c/d |
| GRID | Grid balancing | Total future grid load | c/d |
| PV | Optimal PV utilization | Future PV generation | c/d |
| LOAD | Load shifting | Future household consumption | d |
| SELF | Self-consumption | Future household load (incl. PV) | d |
Table 2.
Node position and corresponding specification (type, capacity, depth of discharge (DOD), battery efficiency, nominal power and converter efficiency) for the integrated BESSs in the simulation study.
Table 2.
Node position and corresponding specification (type, capacity, depth of discharge (DOD), battery efficiency, nominal power and converter efficiency) for the integrated BESSs in the simulation study.
| Node | Model | Battery Characteristic | Converter Characteristic | |||
|---|---|---|---|---|---|---|
| Capacity (kWh) | DOD (%) | Efficiency (%) | Power (kW) | Efficiency (%) | ||
| 37 | eco 8/4 | 4 | 100 | 98 | 2.5 | 96 |
| 21, 24 | eco 8/6 | 6 | 100 | 98 | 3.0 | 96 |
| 19 | - | 16 | 100 | 98 | 8.5 | 96 |
© 2017 by the authors. Licensee MDPI, Basel, Switzerland. This article is an open access article distributed under the terms and conditions of the Creative Commons Attribution (CC BY) license (http://creativecommons.org/licenses/by/4.0/).
Share and Cite
MDPI and ACS Style
Faessler, B.; Schuler, M.; Preißinger, M.; Kepplinger, P. Battery Storage Systems as Grid-Balancing Measure in Low-Voltage Distribution Grids with Distributed Generation. Energies 2017, 10, 2161. https://doi.org/10.3390/en10122161
AMA Style
Faessler B, Schuler M, Preißinger M, Kepplinger P. Battery Storage Systems as Grid-Balancing Measure in Low-Voltage Distribution Grids with Distributed Generation. Energies. 2017; 10(12):2161. https://doi.org/10.3390/en10122161
Chicago/Turabian StyleFaessler, Bernhard, Michael Schuler, Markus Preißinger, and Peter Kepplinger. 2017. "Battery Storage Systems as Grid-Balancing Measure in Low-Voltage Distribution Grids with Distributed Generation" Energies 10, no. 12: 2161. https://doi.org/10.3390/en10122161
Note that from the first issue of 2016, this journal uses article numbers instead of page numbers. See further details here.