Article

Lightning Surge Analysis on a Large Scale Grid-Connected Solar Photovoltaic System

by
Nur Hazirah Zaini
1,*,
Mohd Zainal Abidin Ab. Kadir
1,*,
Mohd Amran Mohd Radzi
2,
Mahdi Izadi
1,
Norhafiz Azis
1,
Nor Izzati Ahmad
1 and
Mohd Solehin Mohd Nasir
3
1
Centre for Advanced Power and Energy Research (CAPER), Faculty of Engineering, Universiti Putra Malaysia, 43400 Serdang, Selangor, Malaysia
2
Centre for Advanced Power and Energy Research (CAPER), Faculty of Engineering, Universiti Putra Malaysia, 43400 Serdang, Selangor, Malaysia
3
Department of Electrical & Elecronics Engineering, Faculty of Engineering, Universiti Pertahanan Nasional Malaysia (UPNM), Kem Sg. Besi, 57000 Kuala Lumpur, Malaysia
*
Authors to whom correspondence should be addressed.
Energies 2017, 10(12), 2149; https://doi.org/10.3390/en10122149
Submission received: 31 October 2017 / Revised: 22 November 2017 / Accepted: 23 November 2017 / Published: 15 December 2017

Abstract

:
Solar photovoltaic (PV) farms currently play a vital role in the generation of electrical power in different countries, such as Malaysia, which is moving toward the use of renewable energy. Malaysia is one of the countries with abundant sunlight and thus can use solar PV farms as alternative sources for electricity generation. However, lightning strikes frequently occur in the country. Being installed in open and flat areas, solar PV farms, especially their electronic components, are at great risk of damage caused by lightning. In this paper, the effects of lightning currents with different peak currents and waveshapes on grid-connected solar PV farms were determined to approximate the level of transient effect that can damage solar PV modules, inverters and transformers. Depending on the location of the solar PV farm, engineer can obtain information on the peak current and median current of the site from the lightning location system (LLS) and utilise the results obtained in this study to appropriately assign an SPD to protect the solar panel, inverter and the main panel that connected to the grid. Therefore, the simulation results serve as the basis for controlling the effects of lightning strikes on electrical equipment and power grids where it provides proper justification on the ‘where to be installed’ and ‘what is the rating’ of the SPD. This judgment and decision will surely reduce the expensive cost of repair and replacement of electrical equipment damages due to the lightning.

1. Introduction

Solar photovoltaic (PV) systems have moved to the forefront of public and industry awareness on sustainable and renewable energy sources, which are alternatives to fossil fuels for electricity generation. Malaysia is fortunate to be one of the countries that have massive potentials for the development of solar PV power systems. The country is subjected daily to high levels of radiation and has a high number of sunny days [1]. It also has an average daily solar radiation of approximately 4.5 kWh/m2 and 4–8 h of sunshine daily [2]. On average, the outside temperature in Malaysia is 33 °C at day time and 23 °C at night [3]. However, on the other perspective, Malaysia is also experiencing and highly exposed to lightning events and thunderstorms, having an average thunder level of 180–260 days per year [4] and also known as the ‘Crown of lightning’. Thus, it causes a lot of problems when it comes to the needs for lightning protection system due to the nature of installation for such systems, which are outdoor locations/sites where it gives high probability of getting struck by the lightning, especially those in the lightning-prone areas.
Solar PV systems are typically installed in a wide open area to maximise their surface areas and prevent shading effects, which can reduce their performance. Often encountered near towers, buildings, telephone and electric poles, and trees, shading can result in multiple peaks in P-V characteristics [5]. Open areas are vulnerable to high solar radiation and air humidity, which promote lightning events; notably, solar radiation, air humidity and frequency of lightning discharge are associated with one another [6].
A solar PV farm hit by lightning sustains damage and meltdown or fracture in its electronic components. Moreover, lightning-induced surges lead to short-circuit failures in the system (permanent damage) as the energy of a lightning strike far exceeds the maximum energy that can be tolerated by the equipment (meltdown or fracture) [7]. The extremely high transient current and transient voltage caused by the lightning strike render solar PV systems and other electronic components, such as inverters, vulnerable to serious damage. Repair or replacement of damaged electronic components is highly expensive. Therefore, the purpose of this research is to characterise transient current and voltage to provide an overview of the consequences that might occur when lightning strikes a solar PV system. It is a fact that many PV systems, at least in Malaysia, are not properly protected against lightning. Due to this exposure, the PV systems may be liable to suffer a crucial impact in a way that can lead towards severe damage; for instance, failure of the electrical and electronic parts in the building or PV installation and disruption of their normal operation. Furthermore, the biggest issue appeared when the systems are integrated and fed to the grid (also known as grid-connected installation) where there is no specific international standard available for reference, except the German DIN EN 62305-3 (Supplement 5) and Malaysia’s brief MS 1837-2010 documents. However, due to the fact that it is too brief, many confusions raised from many aspects such as the protection level to be considered, placement of the surge protective devices (SPD) and its rating and the connection or bonding between the panels.
Therefore, this study provides crucial information on the effect of lightning on large scale installation. In this study, a solar PV system was modelled using Power System Computer Aided Diagram/Electromagnetic Transient Direct Current (PSCAD/EMTDC) software. The performance of the solar PV system against the lightning effect was observed using different peak currents with different lightning current waveshapes. Our aim is to provide references and guidelines for the installation of lightning protection systems (LPSs) in solar PV farms. It is not the proposal for determining the rating of Surge Protective Device (SPD) to be used. Instead, it is meant to provide a feasibility study prior to the commissioning of the system by the authority.

2. Background of Solar PV System in Malaysia

A solar PV system is an electrically integrated assembly of a PV array, inverter and other components, which constitute a power generation unit. Solar PV modules (also known as solar PV panels) contain several PV cells that convert sunlight energy into electricity. The solar PV modules are wired using a series connection to form PV strings, which are then connected to one another through parallel connection to form a PV array. PV cells are made from light-sensitive semiconductor materials either in crystalline-silicon or thin-film form. Figure 1 illustrates the PV cell family tree.
Crystalline silicon PV cells were the first developed solar panel components [8] and have continued to be mainly used in solar PV modules [9]. Approximately 90% of current installations of solar PV modules uses crystalline silicon, although thin films are starting to gain widespread acceptance [10]. The crystalline silicon PV cells can be subdivided into monocrystalline (also known as single-crystalline) and polycrystalline (also known as multi-crystalline) silicon [11].
Monocrystalline silicon has a solid crystalline structure with continuous crystal lattice and without any grain boundary from the entire bulk area to the edges [12]. In contrast, poly-crystalline silicon contains many small crystalline grains with random orientations. The cell efficiencies of monocrystalline silicon are considerably higher than that of polycrystalline silicon [13]. Owing to the current price decline in wafer-based solar cells, thin-film solar cells, which are expected to be cheap, become uneconomical. Moreover, thin-film cells have lower efficiency than crystalline silicon solar cells [12].
Polycrystalline, monocrystalline and amorphous solar PV modules, which exhibit different characteristics and efficiencies, are commonly installed in Malaysia. Monocrystalline solar PV modules are the most installed (48%), followed by polycrystalline solar PV modules (38%) and lastly by thin-film solar PV modules (14%) [14]. However, according to [15], where the performance ratio of each type of PV module, polycrystalline solar PV modules are the most suitable to the climate conditions in Malaysia.
Solar PV systems can be classified into off-grid connected (standalone), grid-connected and hybrid systems. The standalone systems consist of solar PV modules, loads and batteries for storage and are usually installed in buildings with power consumption of less than 4 kW. Grid-connected systems are connected to a grid system and require no battery and typically used when power consumption is more than 100 kW. Hybrid systems are a combination of solar PV modules and diesel, gas or wind generator. Meanwhile, a solar PV system is composed of few components when not connected to a grid system. All the components are described in Table 1.

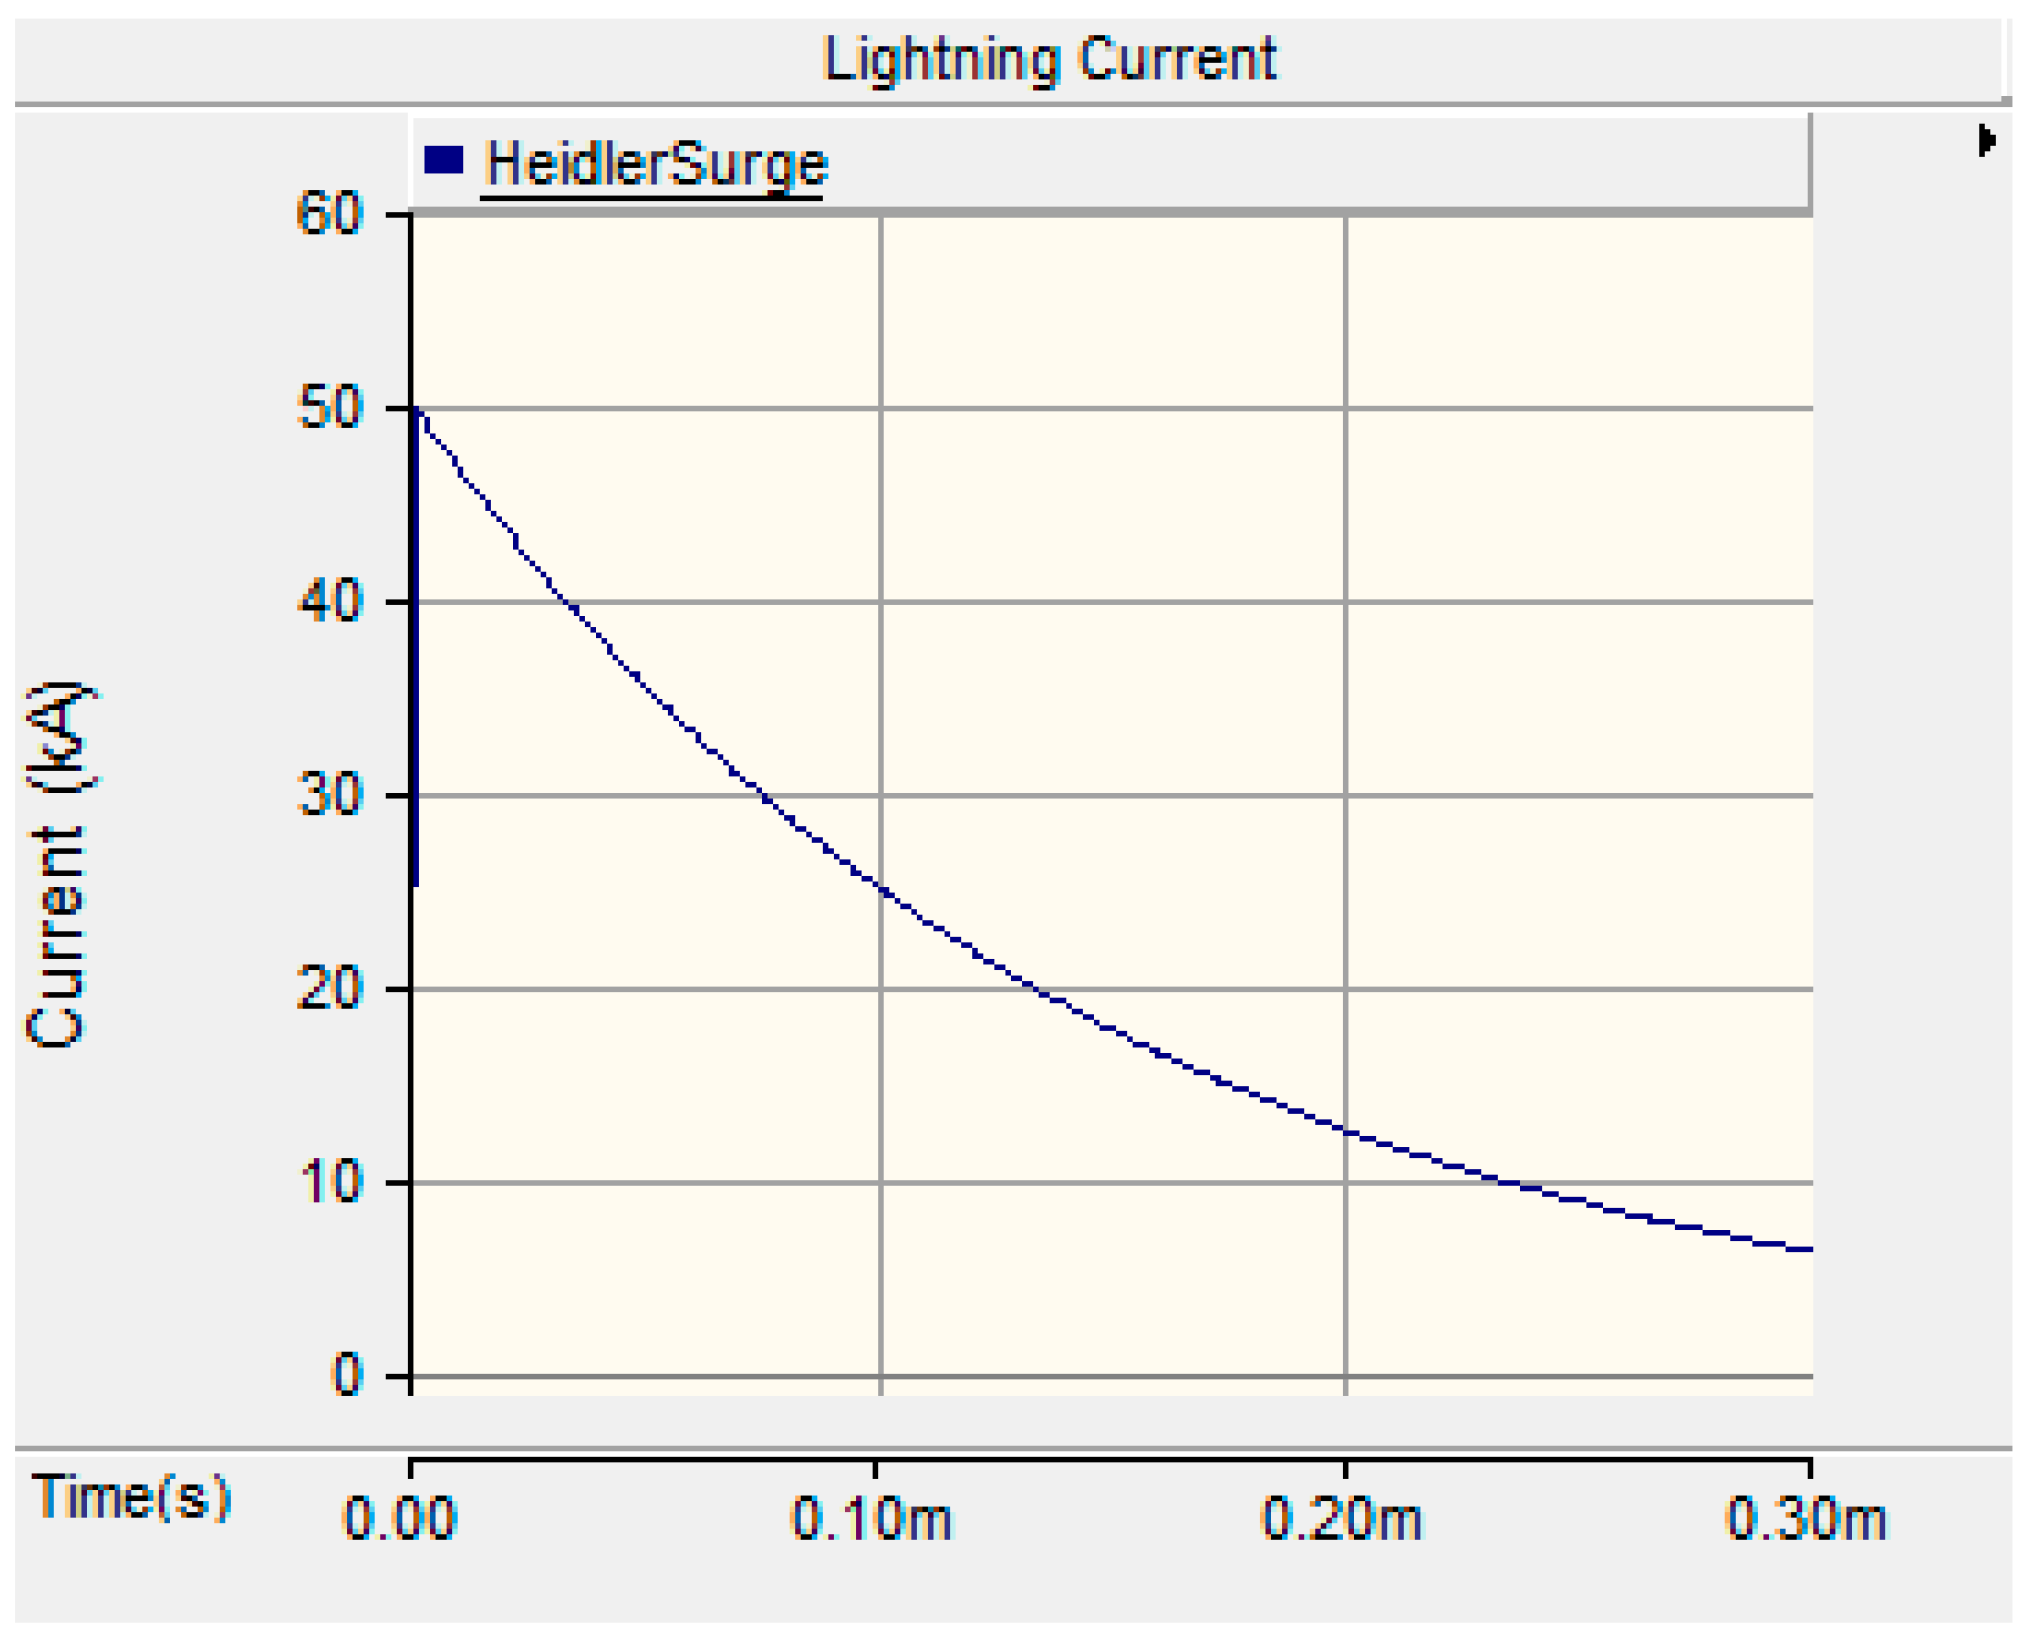
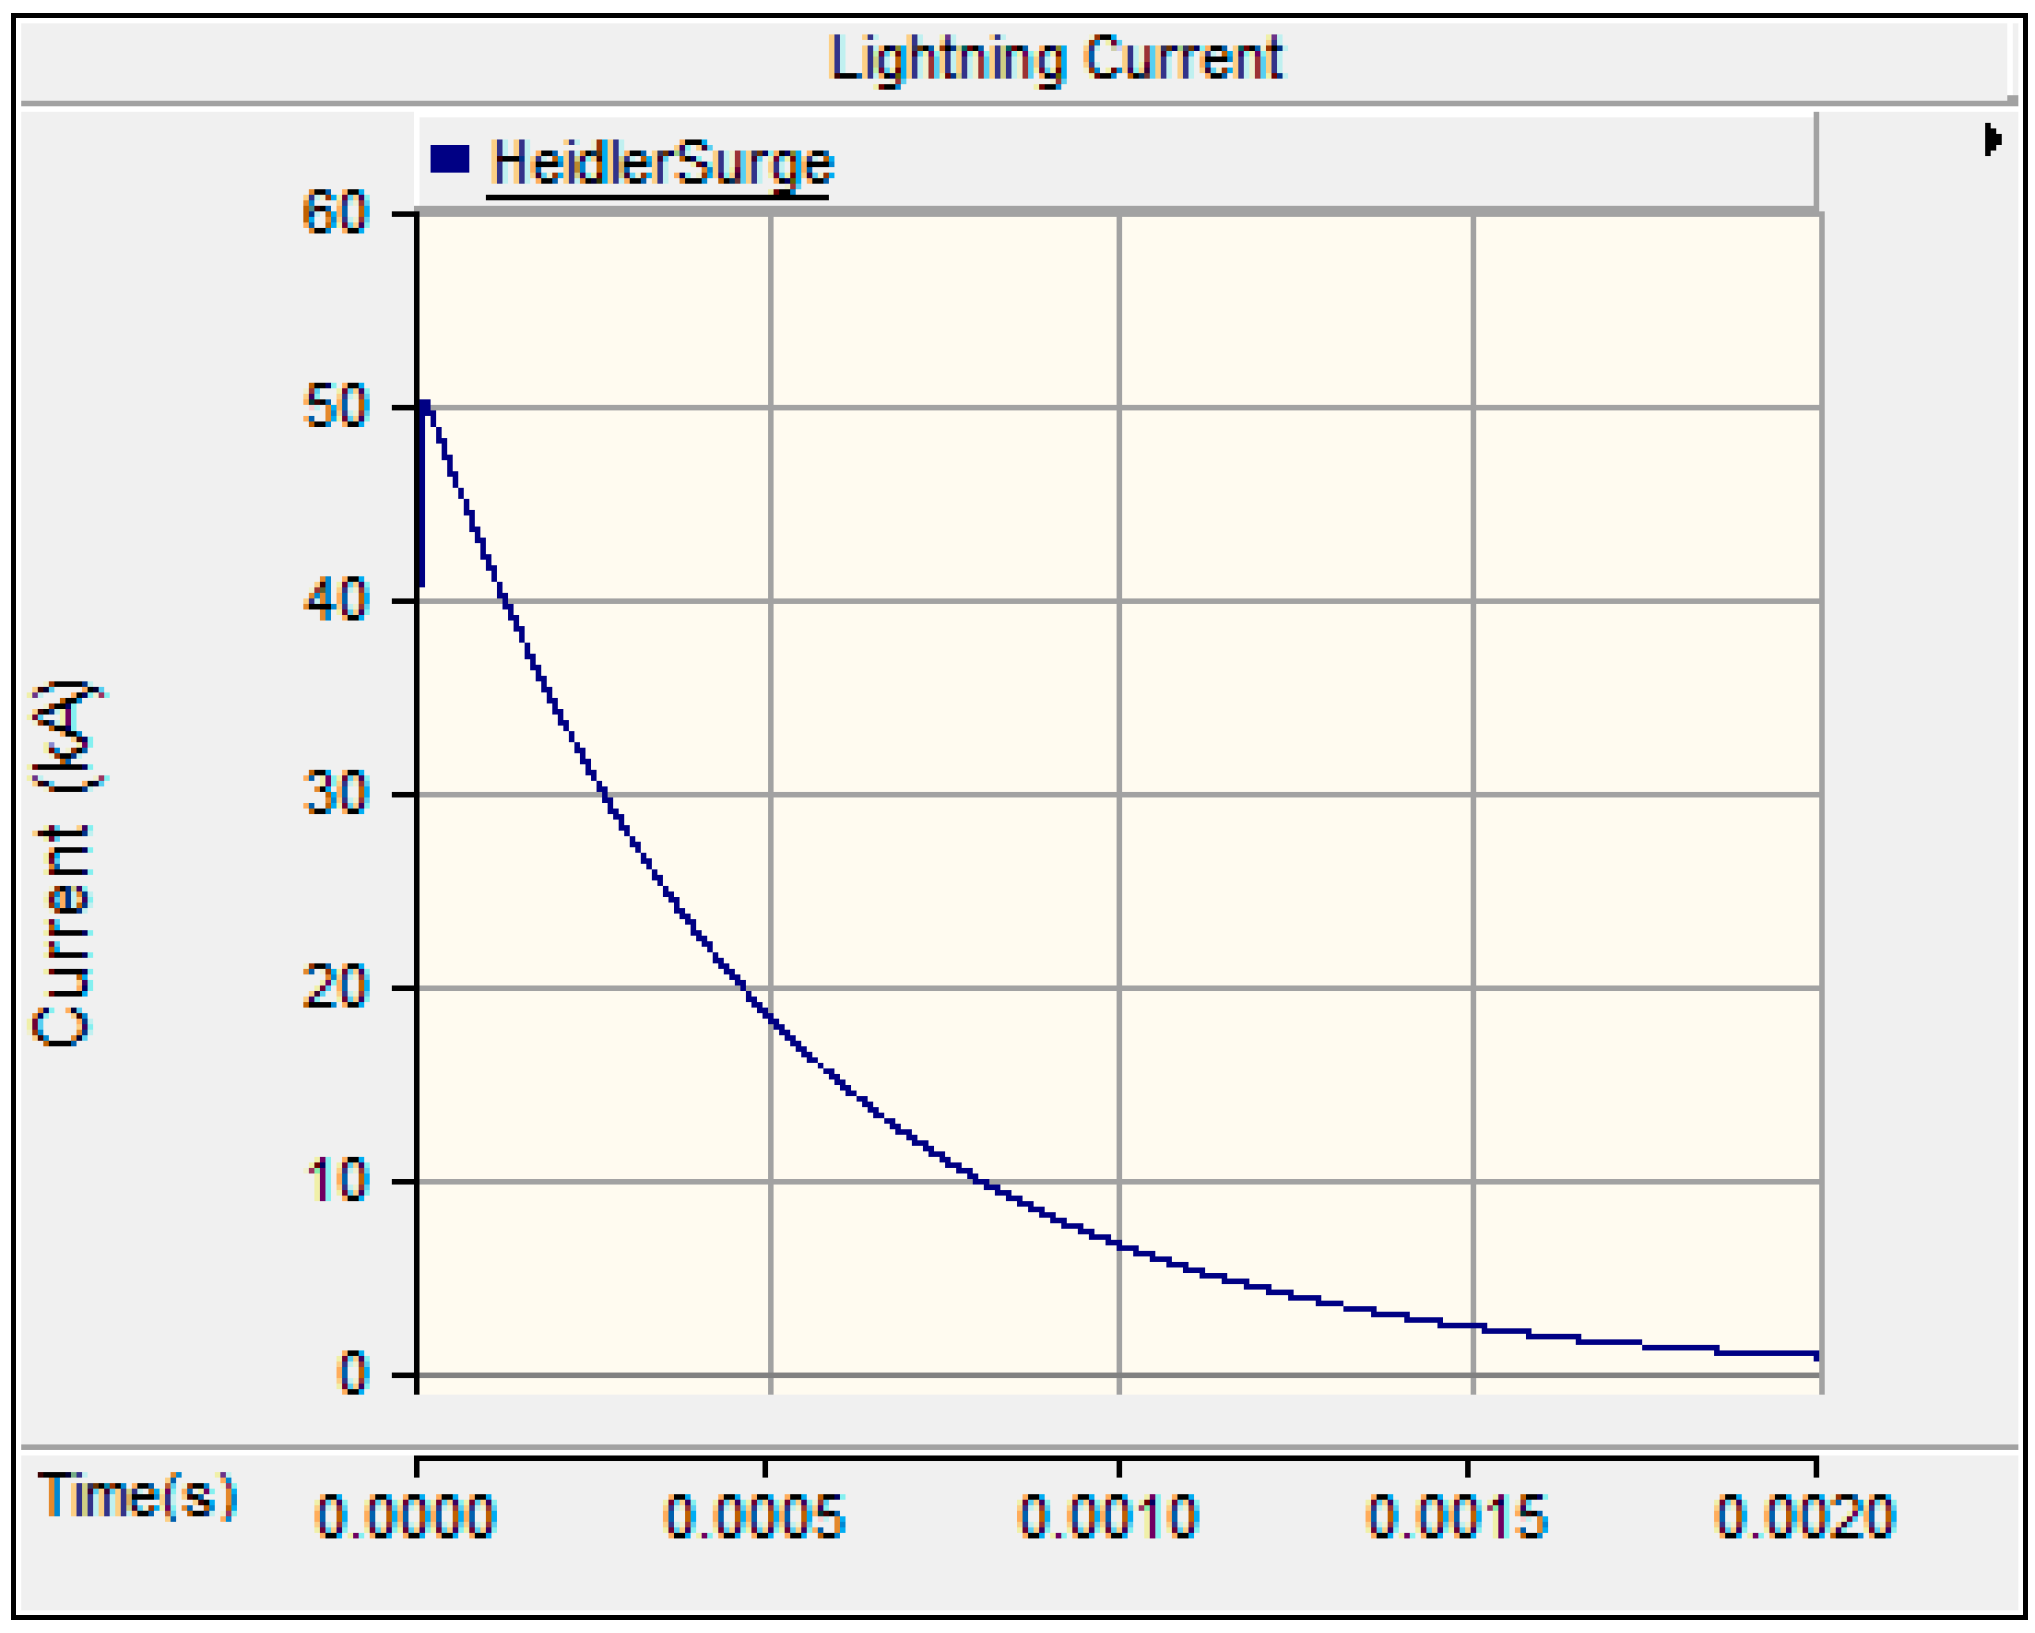
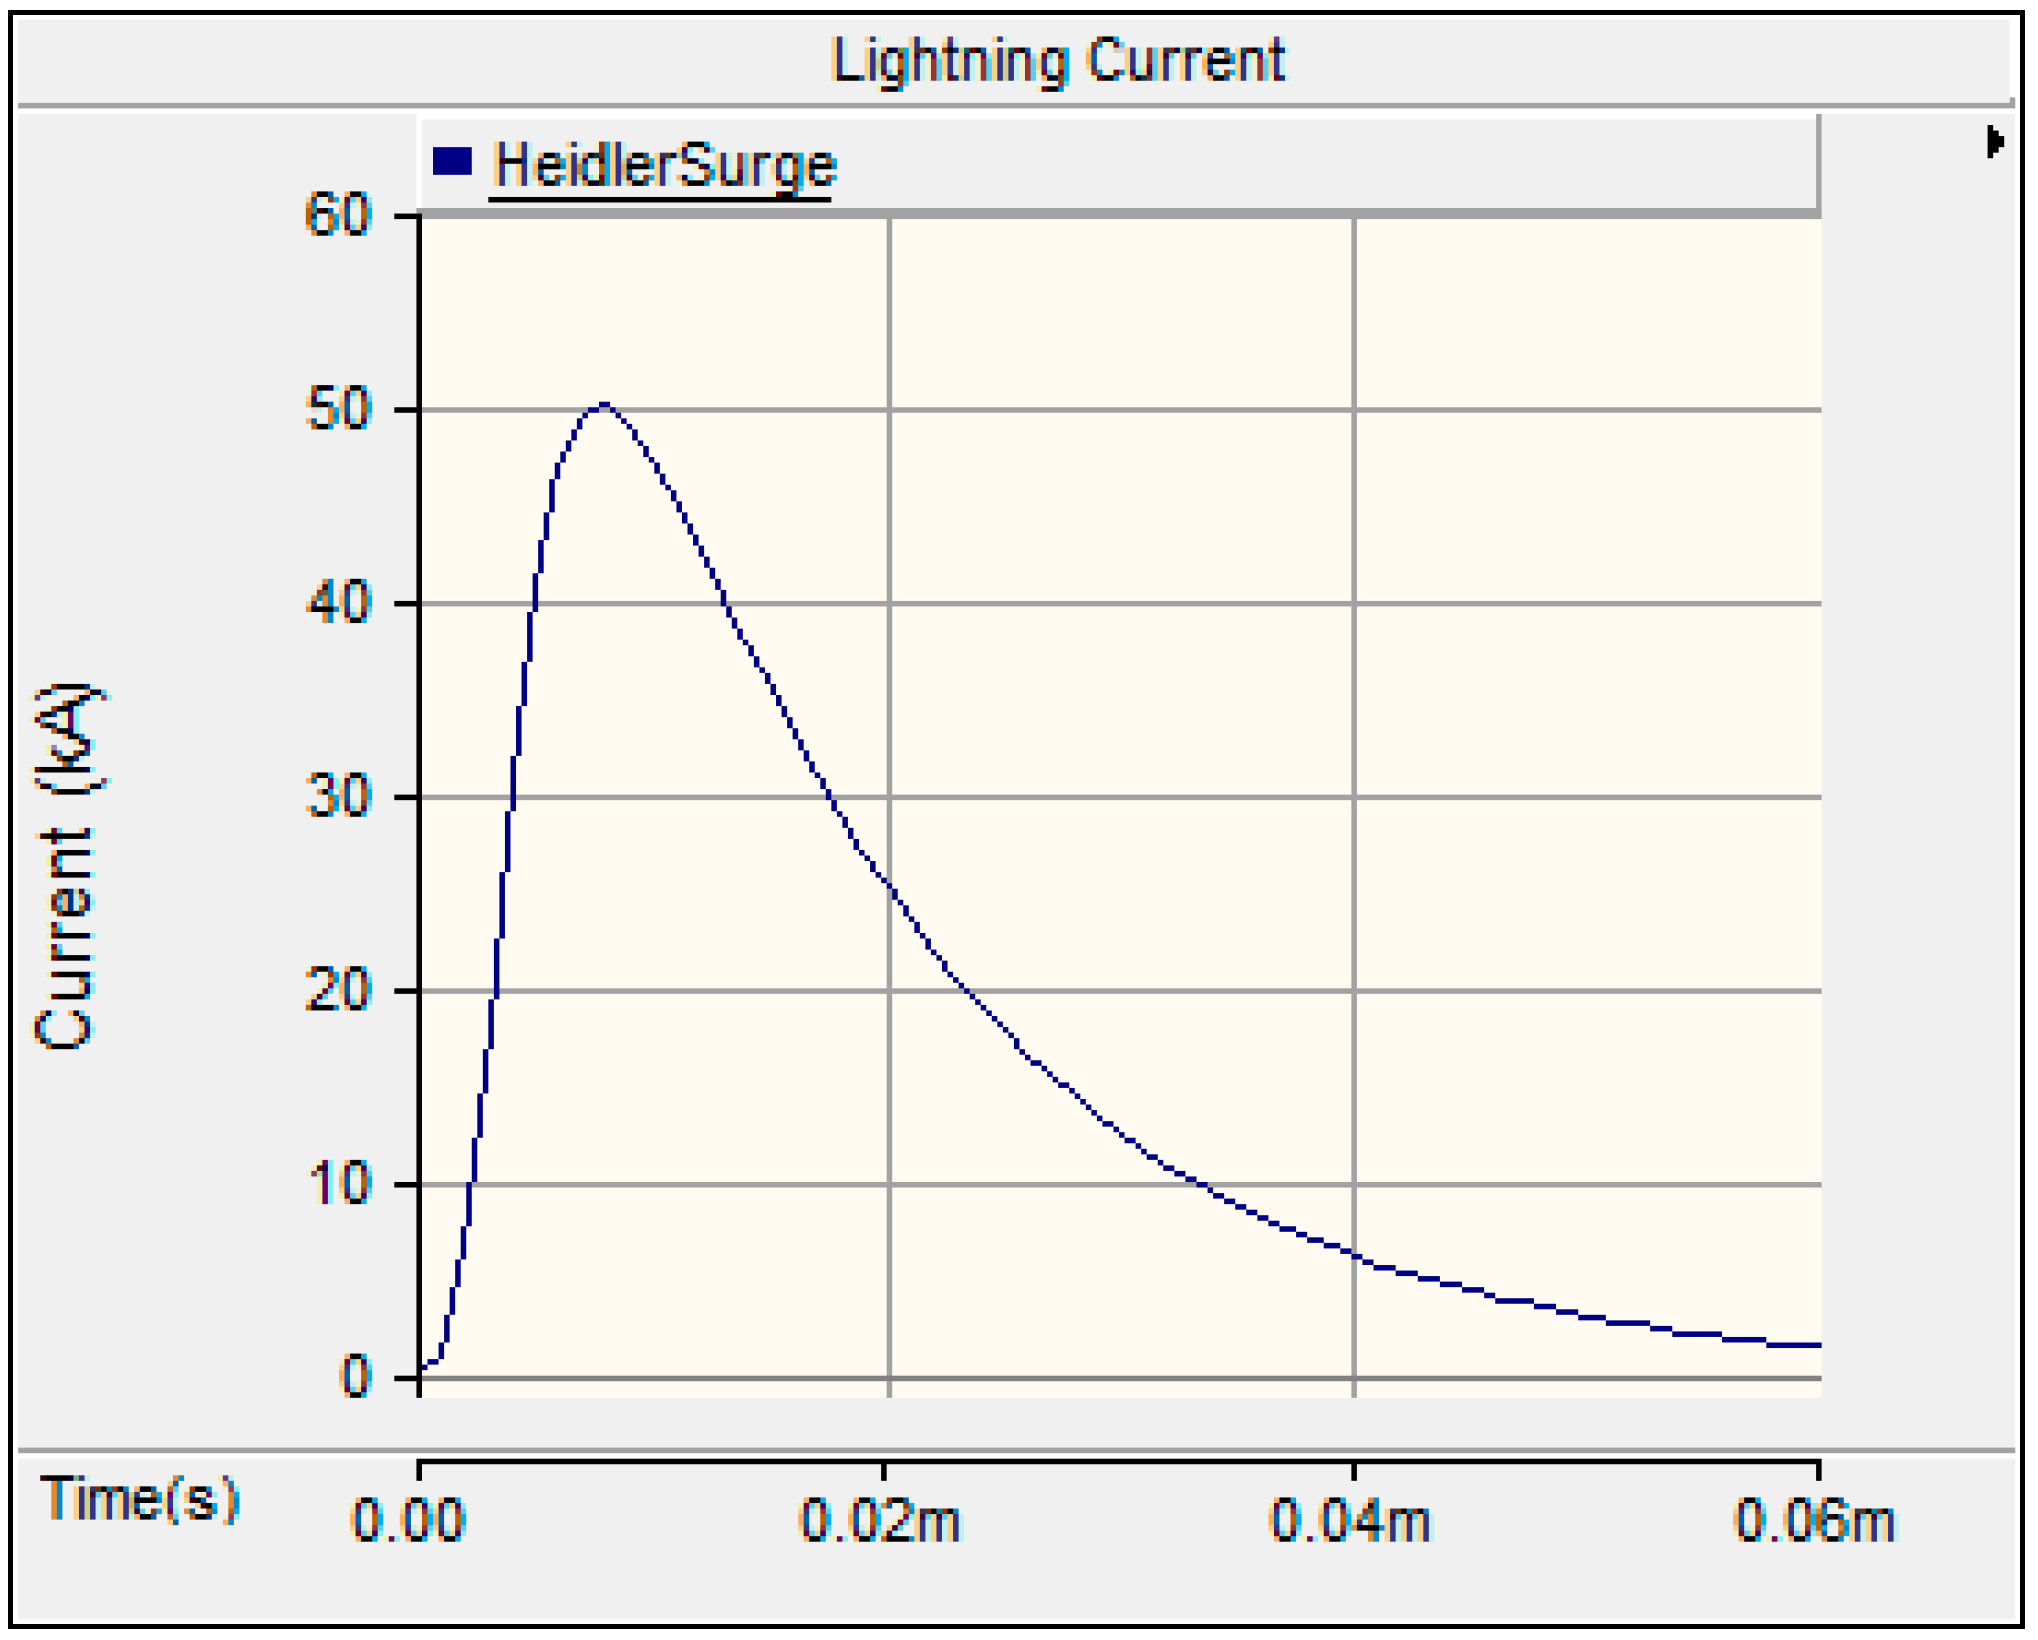
3. Lightning Overview and Differences in Modelling Lightning Current Waveshape

Lightning is an electrical discharge in the atmosphere and typically occurs during thunderstorms. Lightning can be categorised as intracloud lightning (sheet lightning), cloud-to-cloud lightning (heat lightning), cloud-to-air lightning and cloud-to-ground lightning. Intracloud lightning is the most common type of lightning and appears completely within a cloud. Cloud-to-cloud lightning occurs between two or more separate clouds without contact to the ground. Cloud-to-air lightning refers to a discharge jumping from cloud to clear air. Lastly, cloud-to-ground lightning occurs between a cloud and the ground and is initiated by a downward-moving leader stroke and upward-moving leader stroke.
Nearly 75% of lightning discharges are intracloud, cloud-to-cloud and cloud-to-air lightning, while 25% are cloud-to-ground. Although constituting only a quarter of all lightning occurrences, cloud-to-ground lightning is the most destructive of the lightning types and hazardous to human life [17]. Approximately 90% of the cloud-to-ground lightning occurrences have downward negative lightning flashes, while 10% or less have downward positive lightning flashes [18]. The upward discharge occurs only from tall objects that are 100 m or higher or a moderate height structure located on the top of a mountain.
Lightning current waveshapes can be characterised through different mathematical expressions. Double exponential and Heidler function are the two mathematical expressions for lightning current waveshapes and widely used in studying the effects of lightning. The double exponential [19] is shown in Equation (1).
i ( t ) = I m [ e α t e β t ]
where I m is the peak current while α and β are constants and used to determine the lightning current waveshape. These two important parameters are used to derive the tail time t t and front time t f respectively.
The was proposed by Heidler [20] and defined in Equation (2) as follows:
i   ( t ) =   I m η ( t / τ 1 ) n 1 + ( t / τ 1 ) n exp ( t τ 2 )
where
η = exp [ τ 1 τ 2 ( n τ 2 τ 1 ) ( 1 n + 1 ) ]
The double exponential function is the simplest equation for the representation of lightning current waveshapes, although the Heidler function provide more realistic results. The reason is that the Heidler function starts when t = 0 , whereas the double exponential starts when t = 1 µs. Therefore, the Heidler function was used in this study to model the lightning current waveshape.

4. Lightning Standard and Nonstandard Current Waveshapes with Different Amplitudes

According to the IEC and IEEE standards, a lightning impulse current should be at 8/20 µs and 10/350 µs [21] for the surge withstand capability test. The lightning stroke peak current ranges from 2 kA to 200 kA, where the first stroke peak current are typically two to three times as large as the subsequent stroke peak current [22]. In addition, 98% of the peak lightning currents exceed 4 kA, 80% exceed 20 kA, and only 5% exceed 90 kA.
Peak current, I m front time, t1 and tail time, t2 are three important parameters that indicate lightning current waveshape characteristics. The I m value is the maximum value of the lightning current in the waveshape, t 1 is the time interval when current increases from zero to the peak current, and t 2 is the time starting from zero to the time where current starts falling off from 50% of the peak current.
Three lightning current waveshapes were modelled in the PSCAD based on the standard (8/20 and 10/350 µs) and a nonstandard values (0.25/100 µs) as depicted in Figure 2, Figure 3 and Figure 4.

5. Lightning Effect on Solar PV Farm and Applicable Standards

Lightning is a major issue in solar PV farms because it can cause damage that often requires high replacement and repair costs and power interruption. Lightning impulses also cause the premature ageing of bypass diodes, power semiconductors and input and output circuits of data systems, which require high repair costs when damaged. Direct or indirect lightning strikes can both seriously damage solar PV panels and components [23].
A direct lightning strike is the ignition of lightning current and generates energy, heat and flash. When direct lightning hits a solar PV module, an extremely strong current flows through the module, resulting in overcurrent and surge overvoltage. Meanwhile, an indirect lightning strike produces induced overvoltage, which is influenced by lightning current characteristics, distance of the solar PV from the lightning, soil resistivity, PV grounding resistance and distance of the lightning protection system [24].
Solar PV farms installed in an open area without high buildings or trees are subjected to high solar radiation and air humidity, and thus have an increased risk of being hit by lightning. The increased risk is mainly attributed to the associations among solar radiation, air humidity and frequency during lightning discharges [6]. The severity of damage in solar PV systems hit by lightning depends on the characteristics of the lightning current waveshape, amplitude of the lightning current, lightning striking point and installed lightning protection system. Moreover, the lightning striking point is inversely proportional to the distance of the point impact strike by the lightning [25].
In a solar PV farm, the DC cables are used to interconnect individual modules to form a PV generation device where each module cable is coupled to a string that leads to the generator junction box. A main DC cable connects the generator junction box to the inverter. The long cable loops formed from the DC cables can lead to high-induced surge during a lightning event [26]. Thus, many studies investigated the effects of long cable loops on solar PV systems and the difference between air terminal lightning poles and early streamer emitter lightning poles [27].
The degradation of solar PV can be affected by temperature, UV, humidity, and mechanical or chemical erosions and electrical stress. Lightning strikes can also degrade solar PV modules. The research in [28] revealed that a small amplitude of the lightning impulse current can degrade PV modules, especially in the absence of LPS. In particular, the metal frame of a solar PV attracts lightning and results in surface discharge when grounded [29].
The risk of the lightning strikes in solar PV systems is a critical issue that must be prevented and addressed because these systems involve high cost investment, profit, and energy stabilities. So far, no proper standard and guideline for LPS design and installation are available. The current LPS guidelines for solar PV farms contain only a few standards and are nonspecific. Therefore, LPS systems in solar PV systems must be improved and comprehensively studied. Table 2 tabulates all the requirements and currently available standards for the installation and protection of solar PV farms.

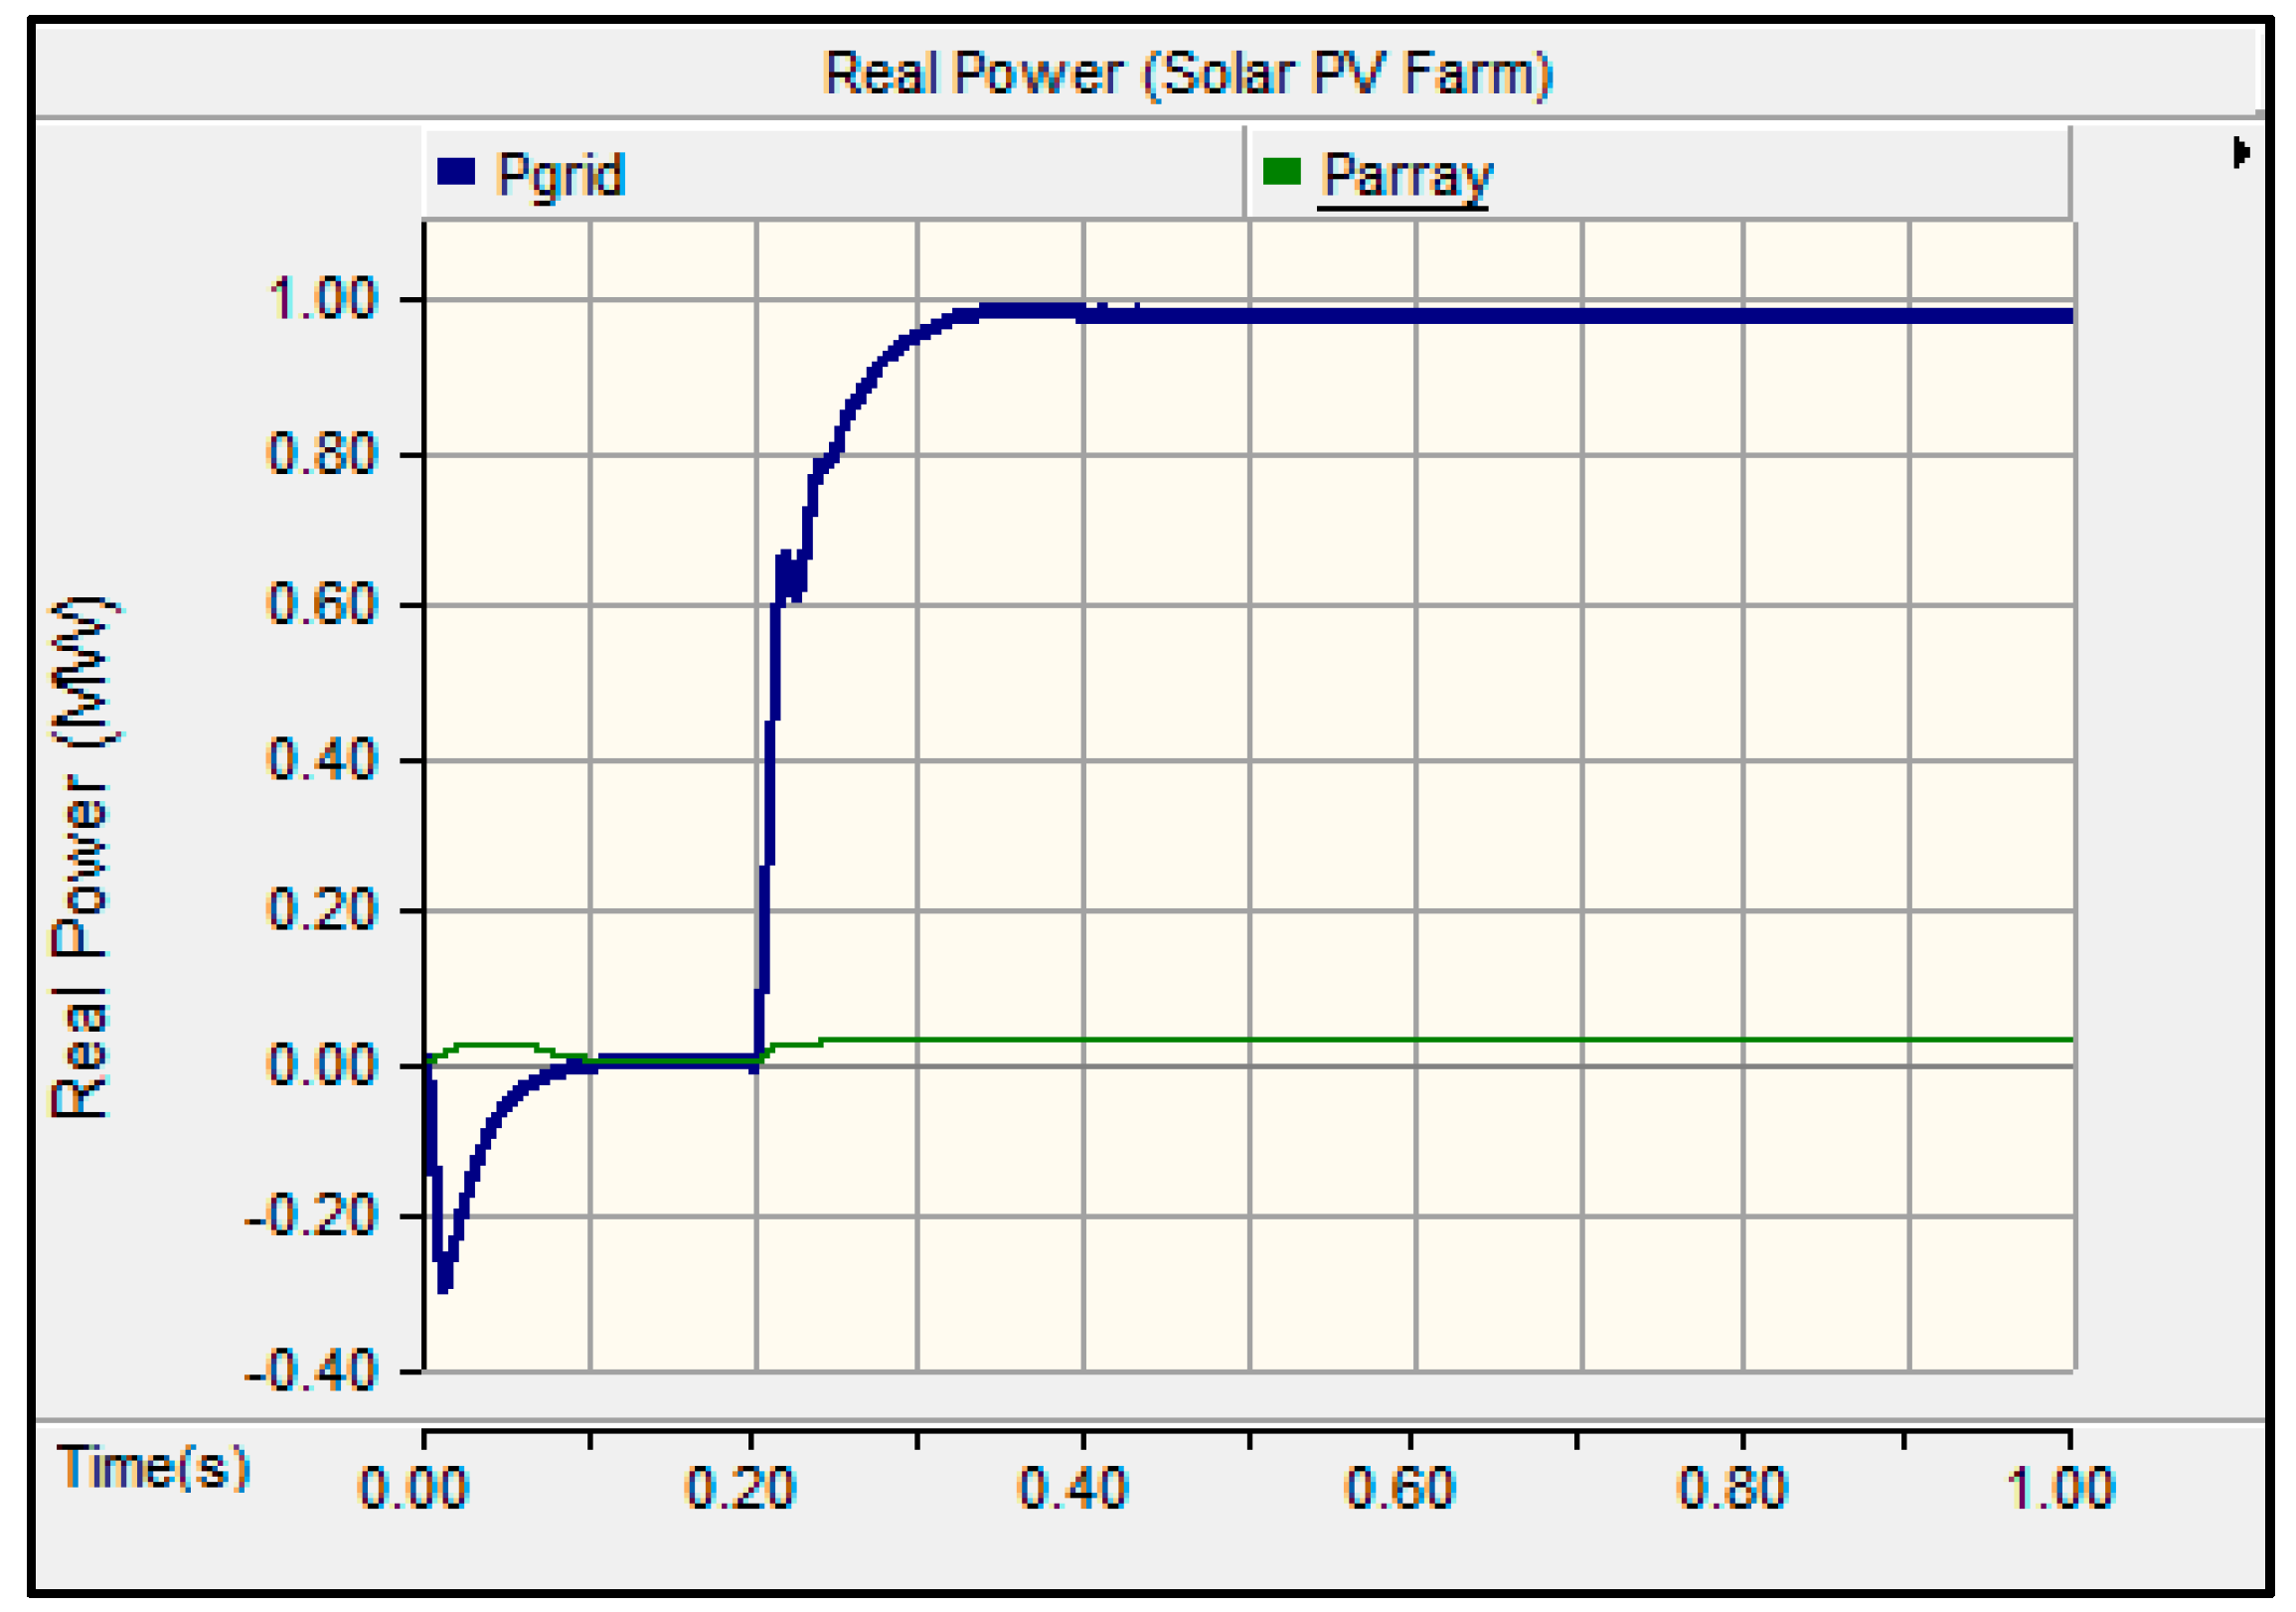
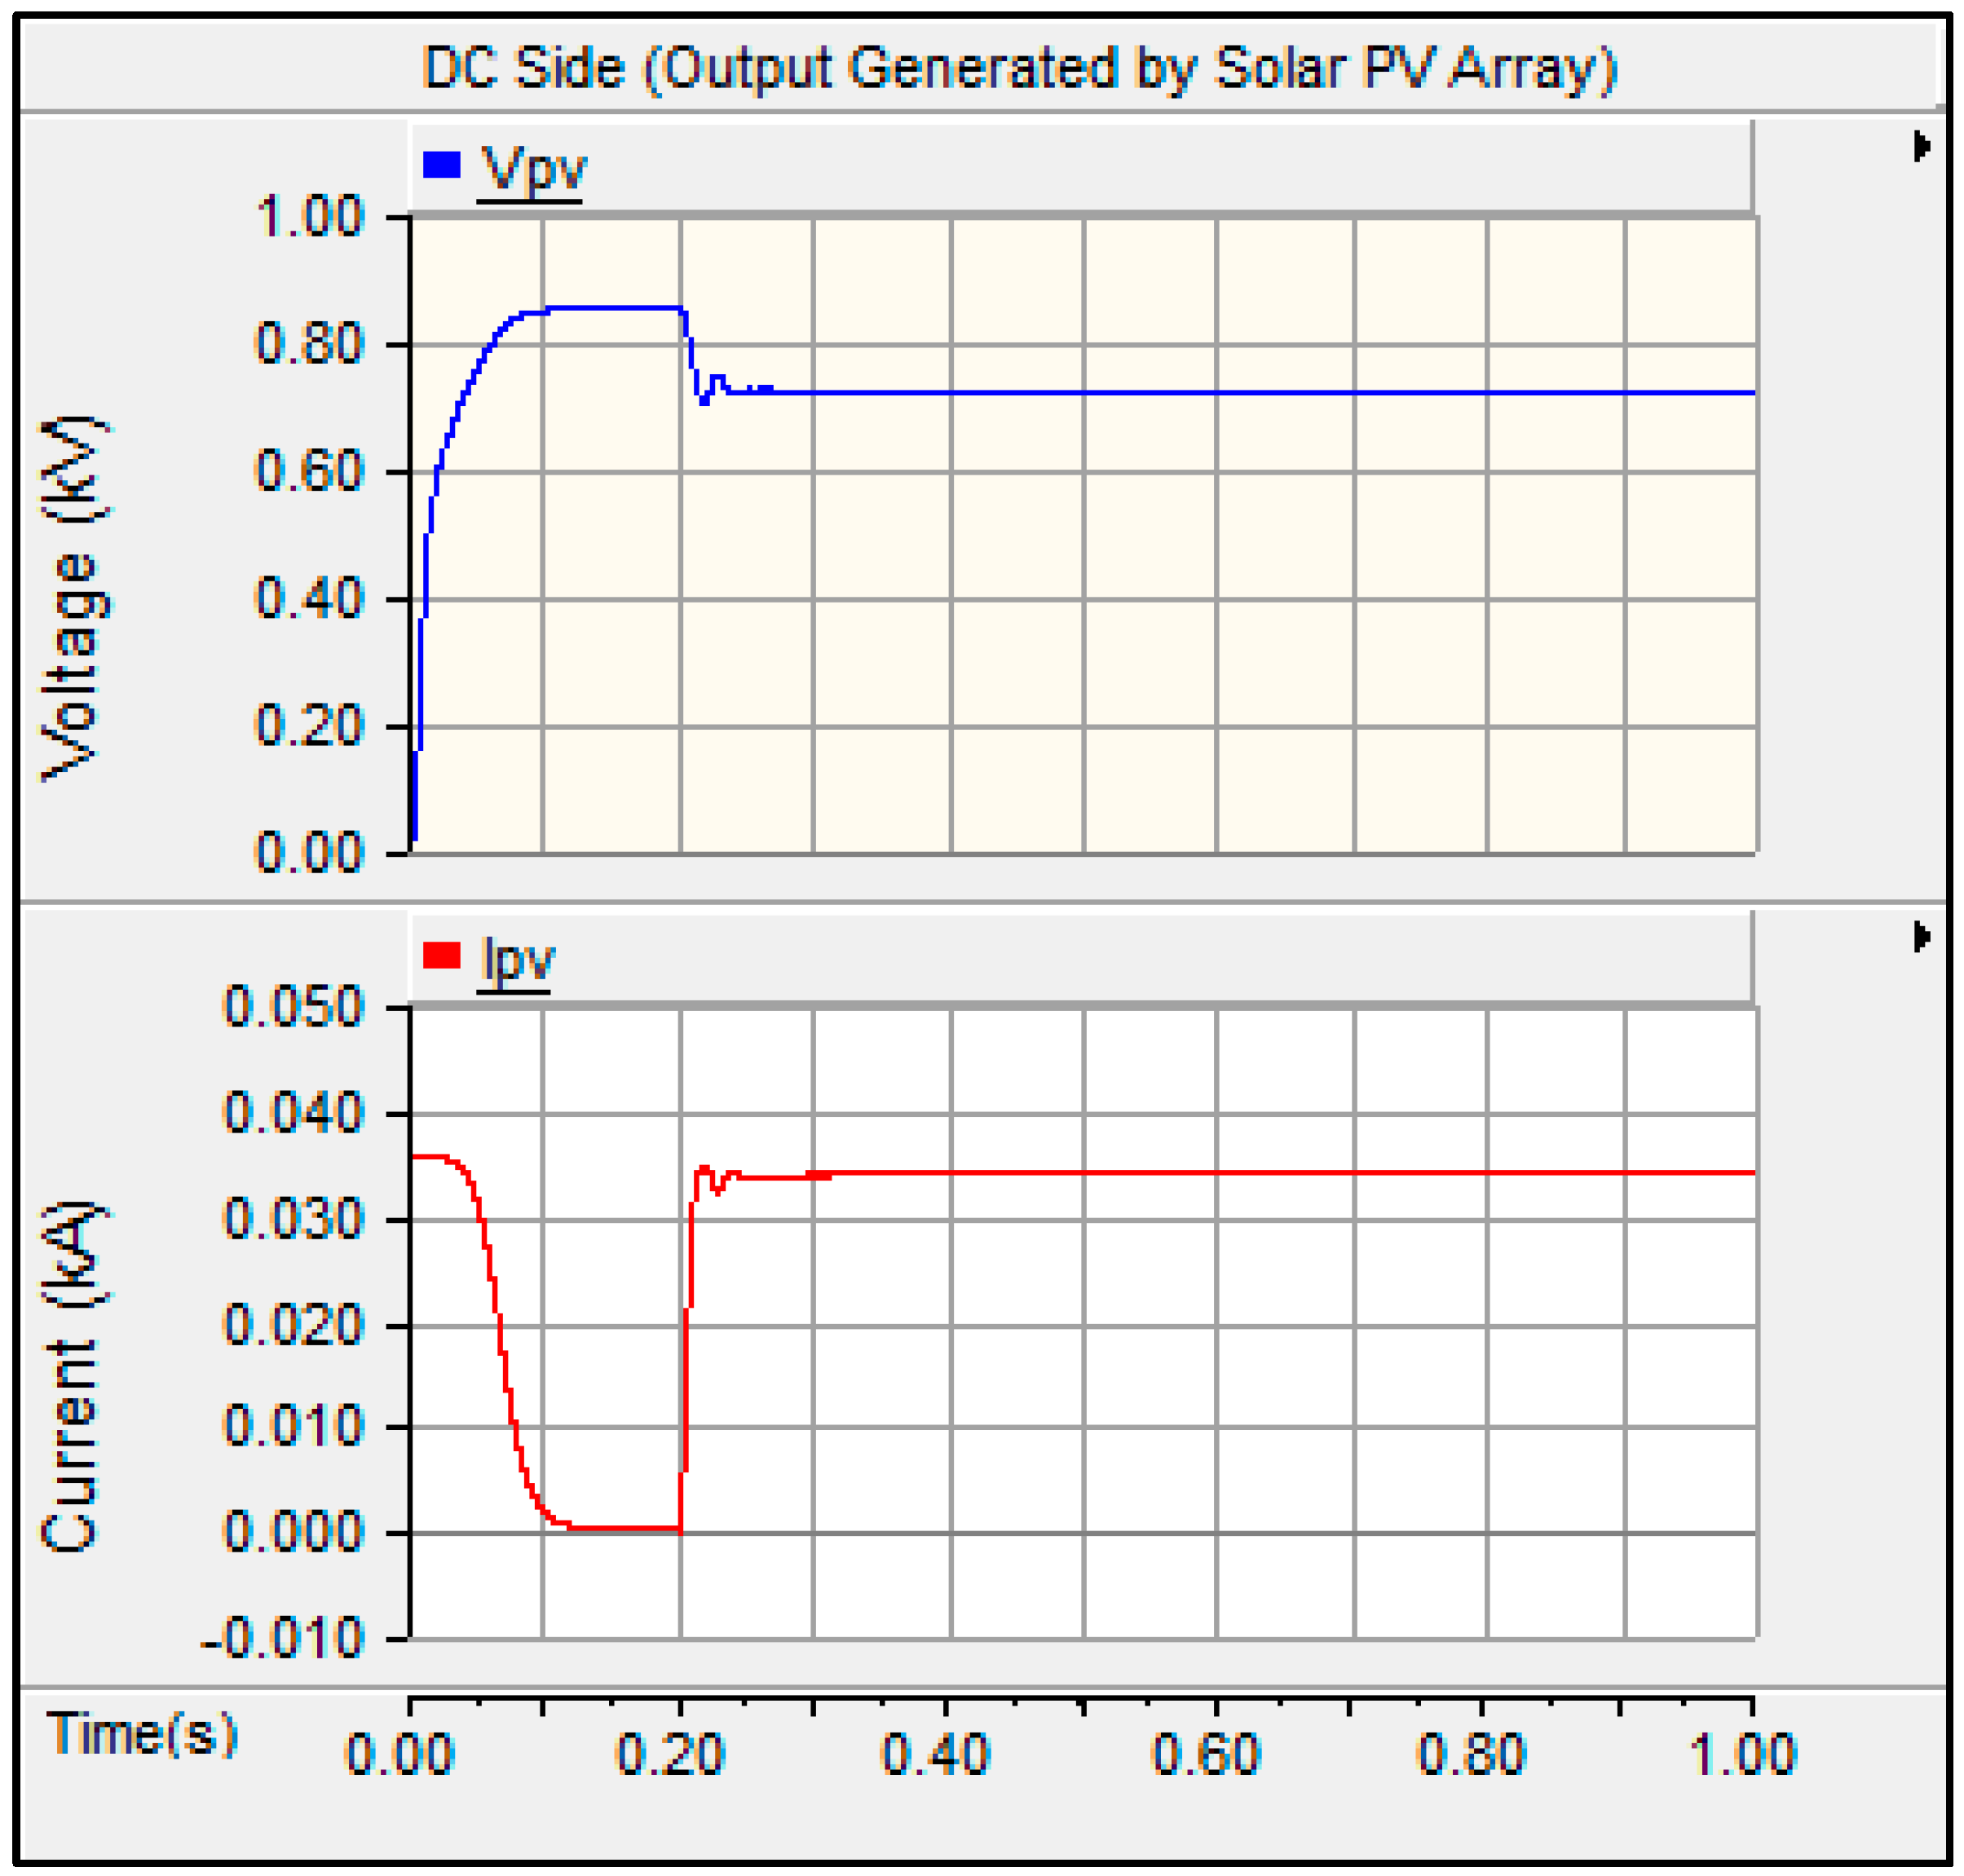
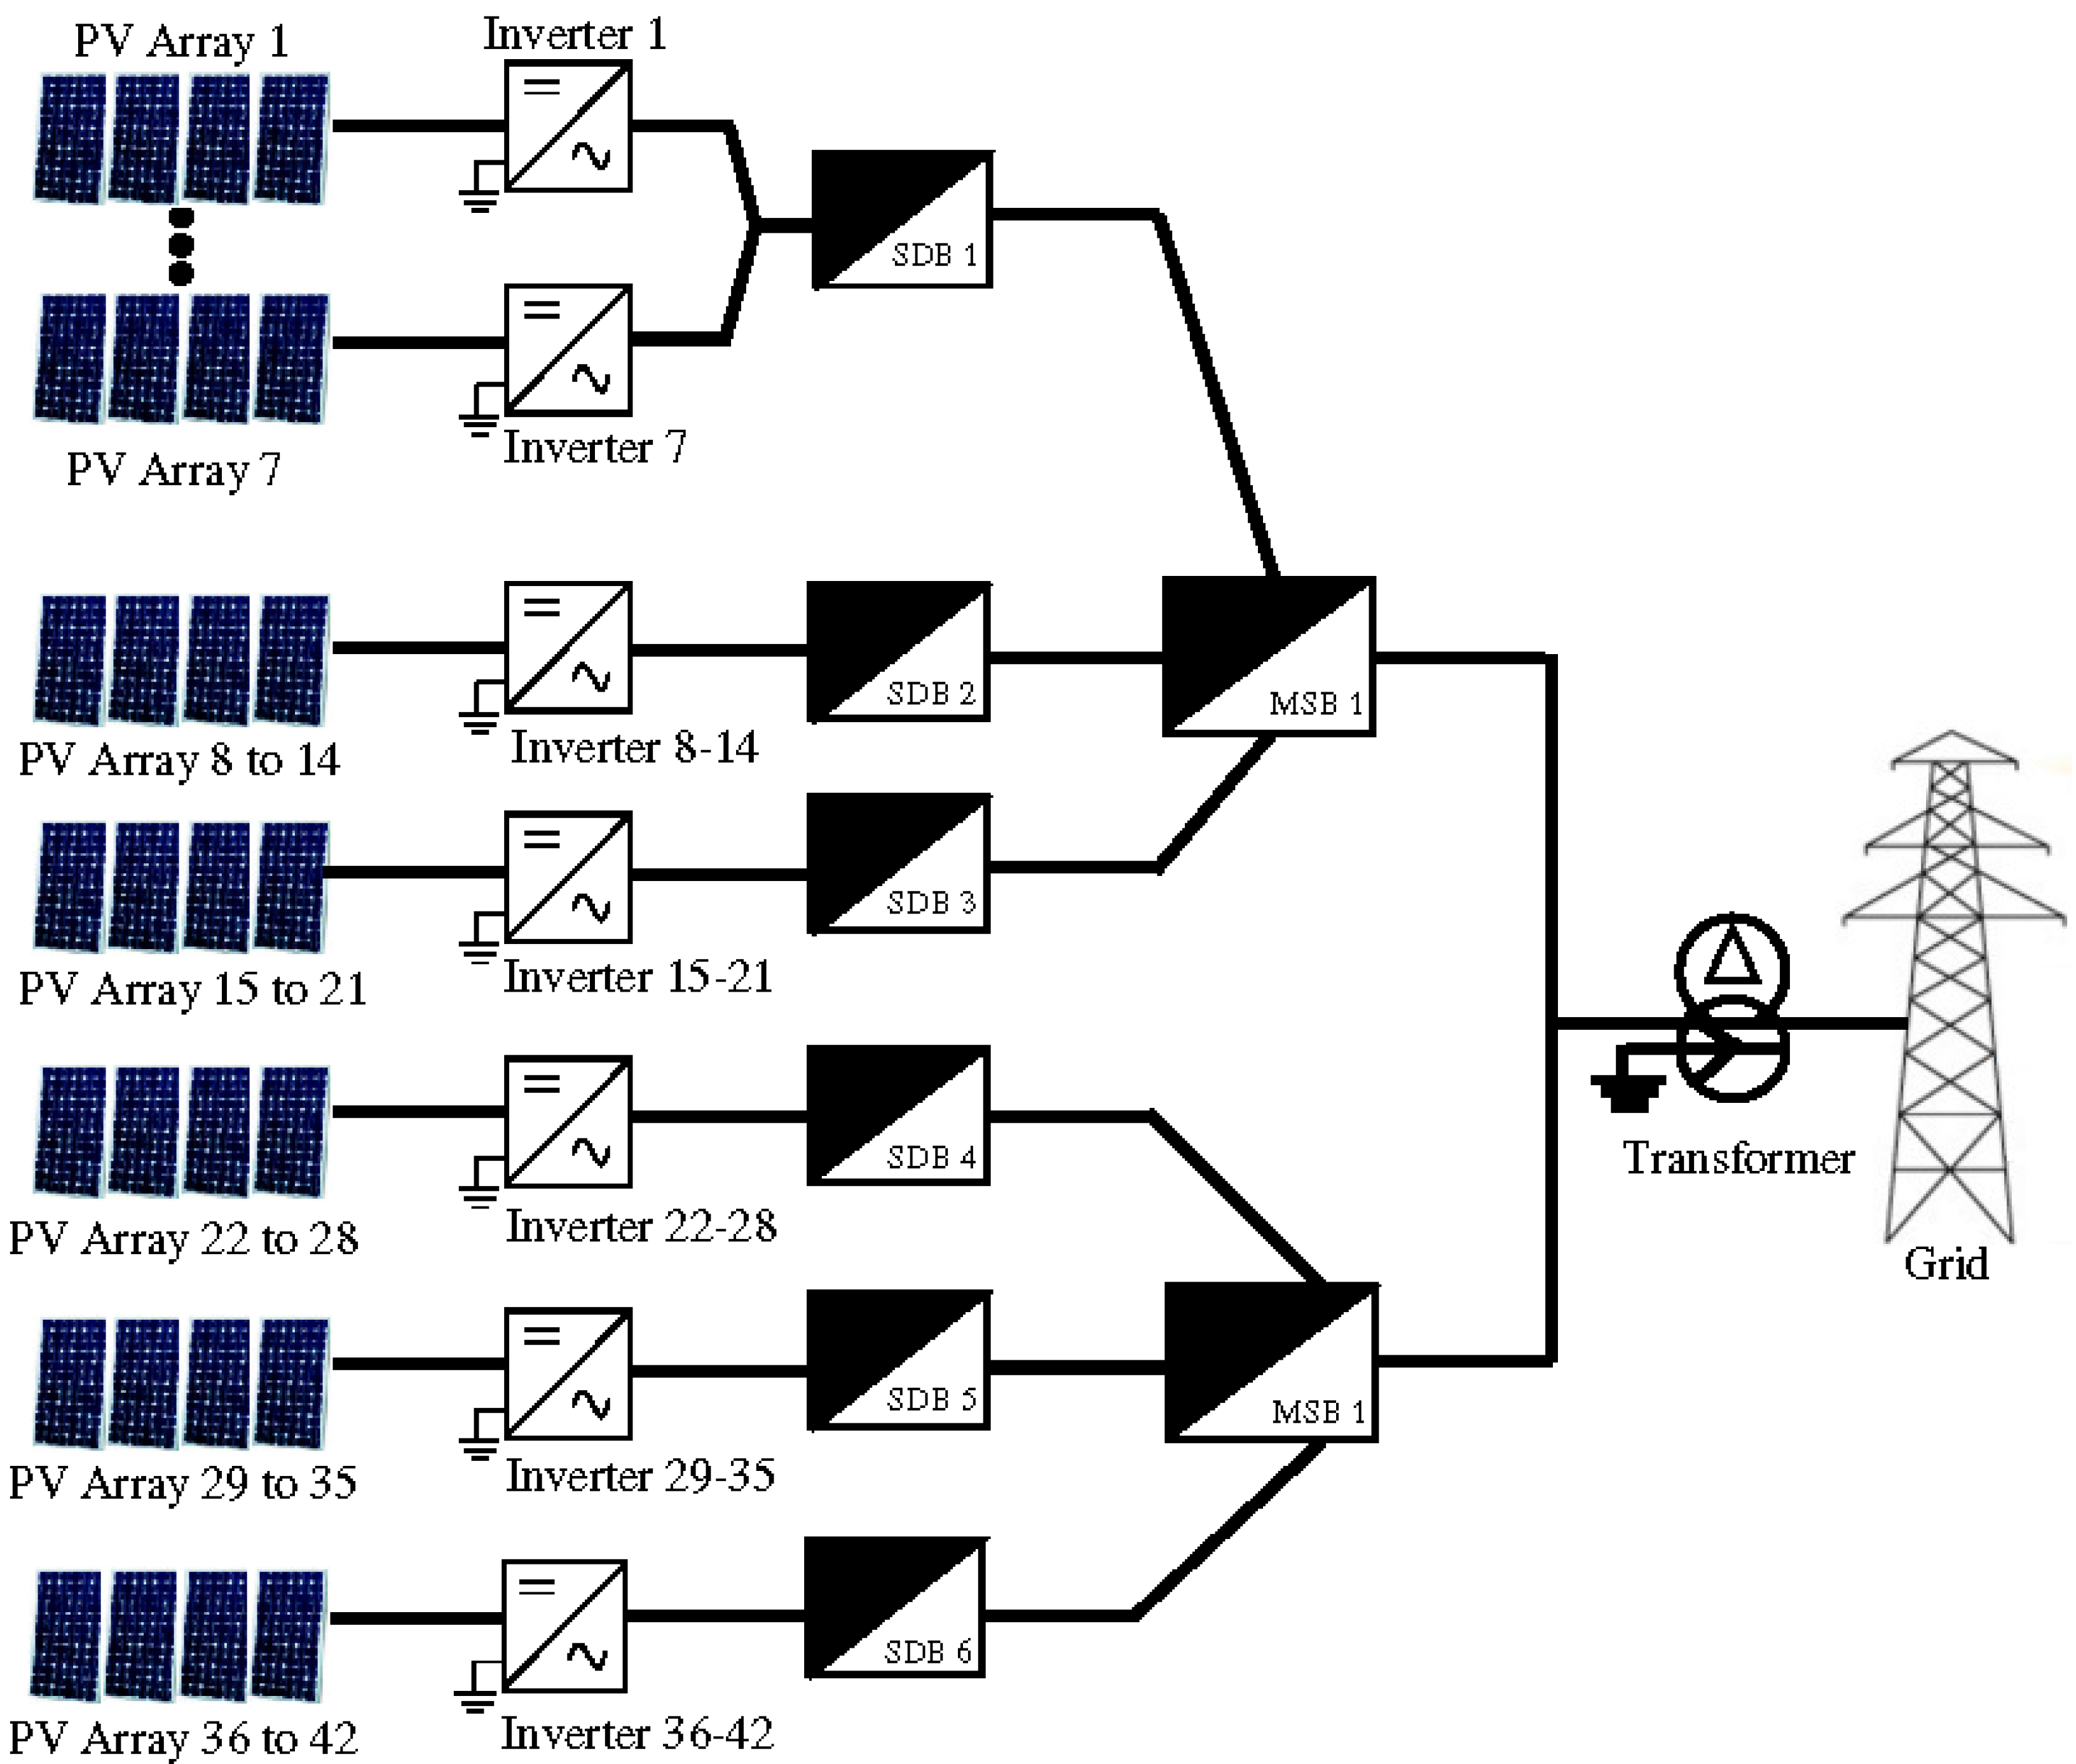
6. Modelling of a Grid-Connected Solar PV Farm System (Case Studies)

A solar PV farm grid-connected system (1 MW) was modelled in the PSCAD/EMTDC transient software. The model mainly consisted of a solar PV array, inverter (to convert DC to AC), transformer and grid, as shown in Figure 5.
The details of all of the components in the solar PV farm modelled in the PSCAD/EMTDC are tabulated in Table 3.
The solar PV farm was formed from 42 PV arrays, each of which delivers a maximum of 24 kW at 1000 W/m2 irradiance and 25 °C temperature at standard test conditions (STCs) [30]. Each solar PV array was built from 96 solar PV modules (250 W each) to form a 1 MW solar PV farm grid-connected system. In the simulation, the solar PV farm system generated 0.992 MW, which was equivalent to 99.2% efficiency (Figure 6) and the corresponding time to the steady state is 0.5 s. The remaining percentage (0.8%) was due to losses, which might have been originated from the inverters and cables.
Theoretically, the inverter converted 715.2 V DC from the solar PV array to 353.54 V AC and maintained a unity power factor. The 353.54 V AC was connected to the grid by a 1.5 MVA 433 V/11 kV three-phase coupling transformer. In this simulation, the DC voltage and current output of the solar PV array is shown in Figure 7, while the AC voltage and current output can be seen in Figure 8. The output of the solar PV system is at steady state after 0.4 s.
Table 4 summarises the output of the solar PV farm grid-connected system simulated in the PSCAD/EMTDC. The inverter converted the DC voltage to AC voltage using a 120° conductance inverter operation.
In the solar PV farm, the main parts are the solar PV and inverter. Therefore, the lightning strike was applied at the point between these parts for the investigation of the effect of lightning. The striking point of the lightning and measured point location are illustrated in Figure 9.
The lightning strike was initially applied to the solar PV farm grid-connected system without SPD installation to determine the maximum level of transient voltage and current that can cause damage to the solar PV panel and inverter. The effect of lightning was observed throughout the solar PV system even when the striking point was between the solar PV array and inverter. Different amplitudes and waveshapes of lightning impulse current were applied, and all the results were measured and discussed accordingly. In this research, three different lightning current waveshapes were applied (8/20 and 10/350 µs for standard waveshapes test and 0.25/100 µs for nonstandard waveshape).

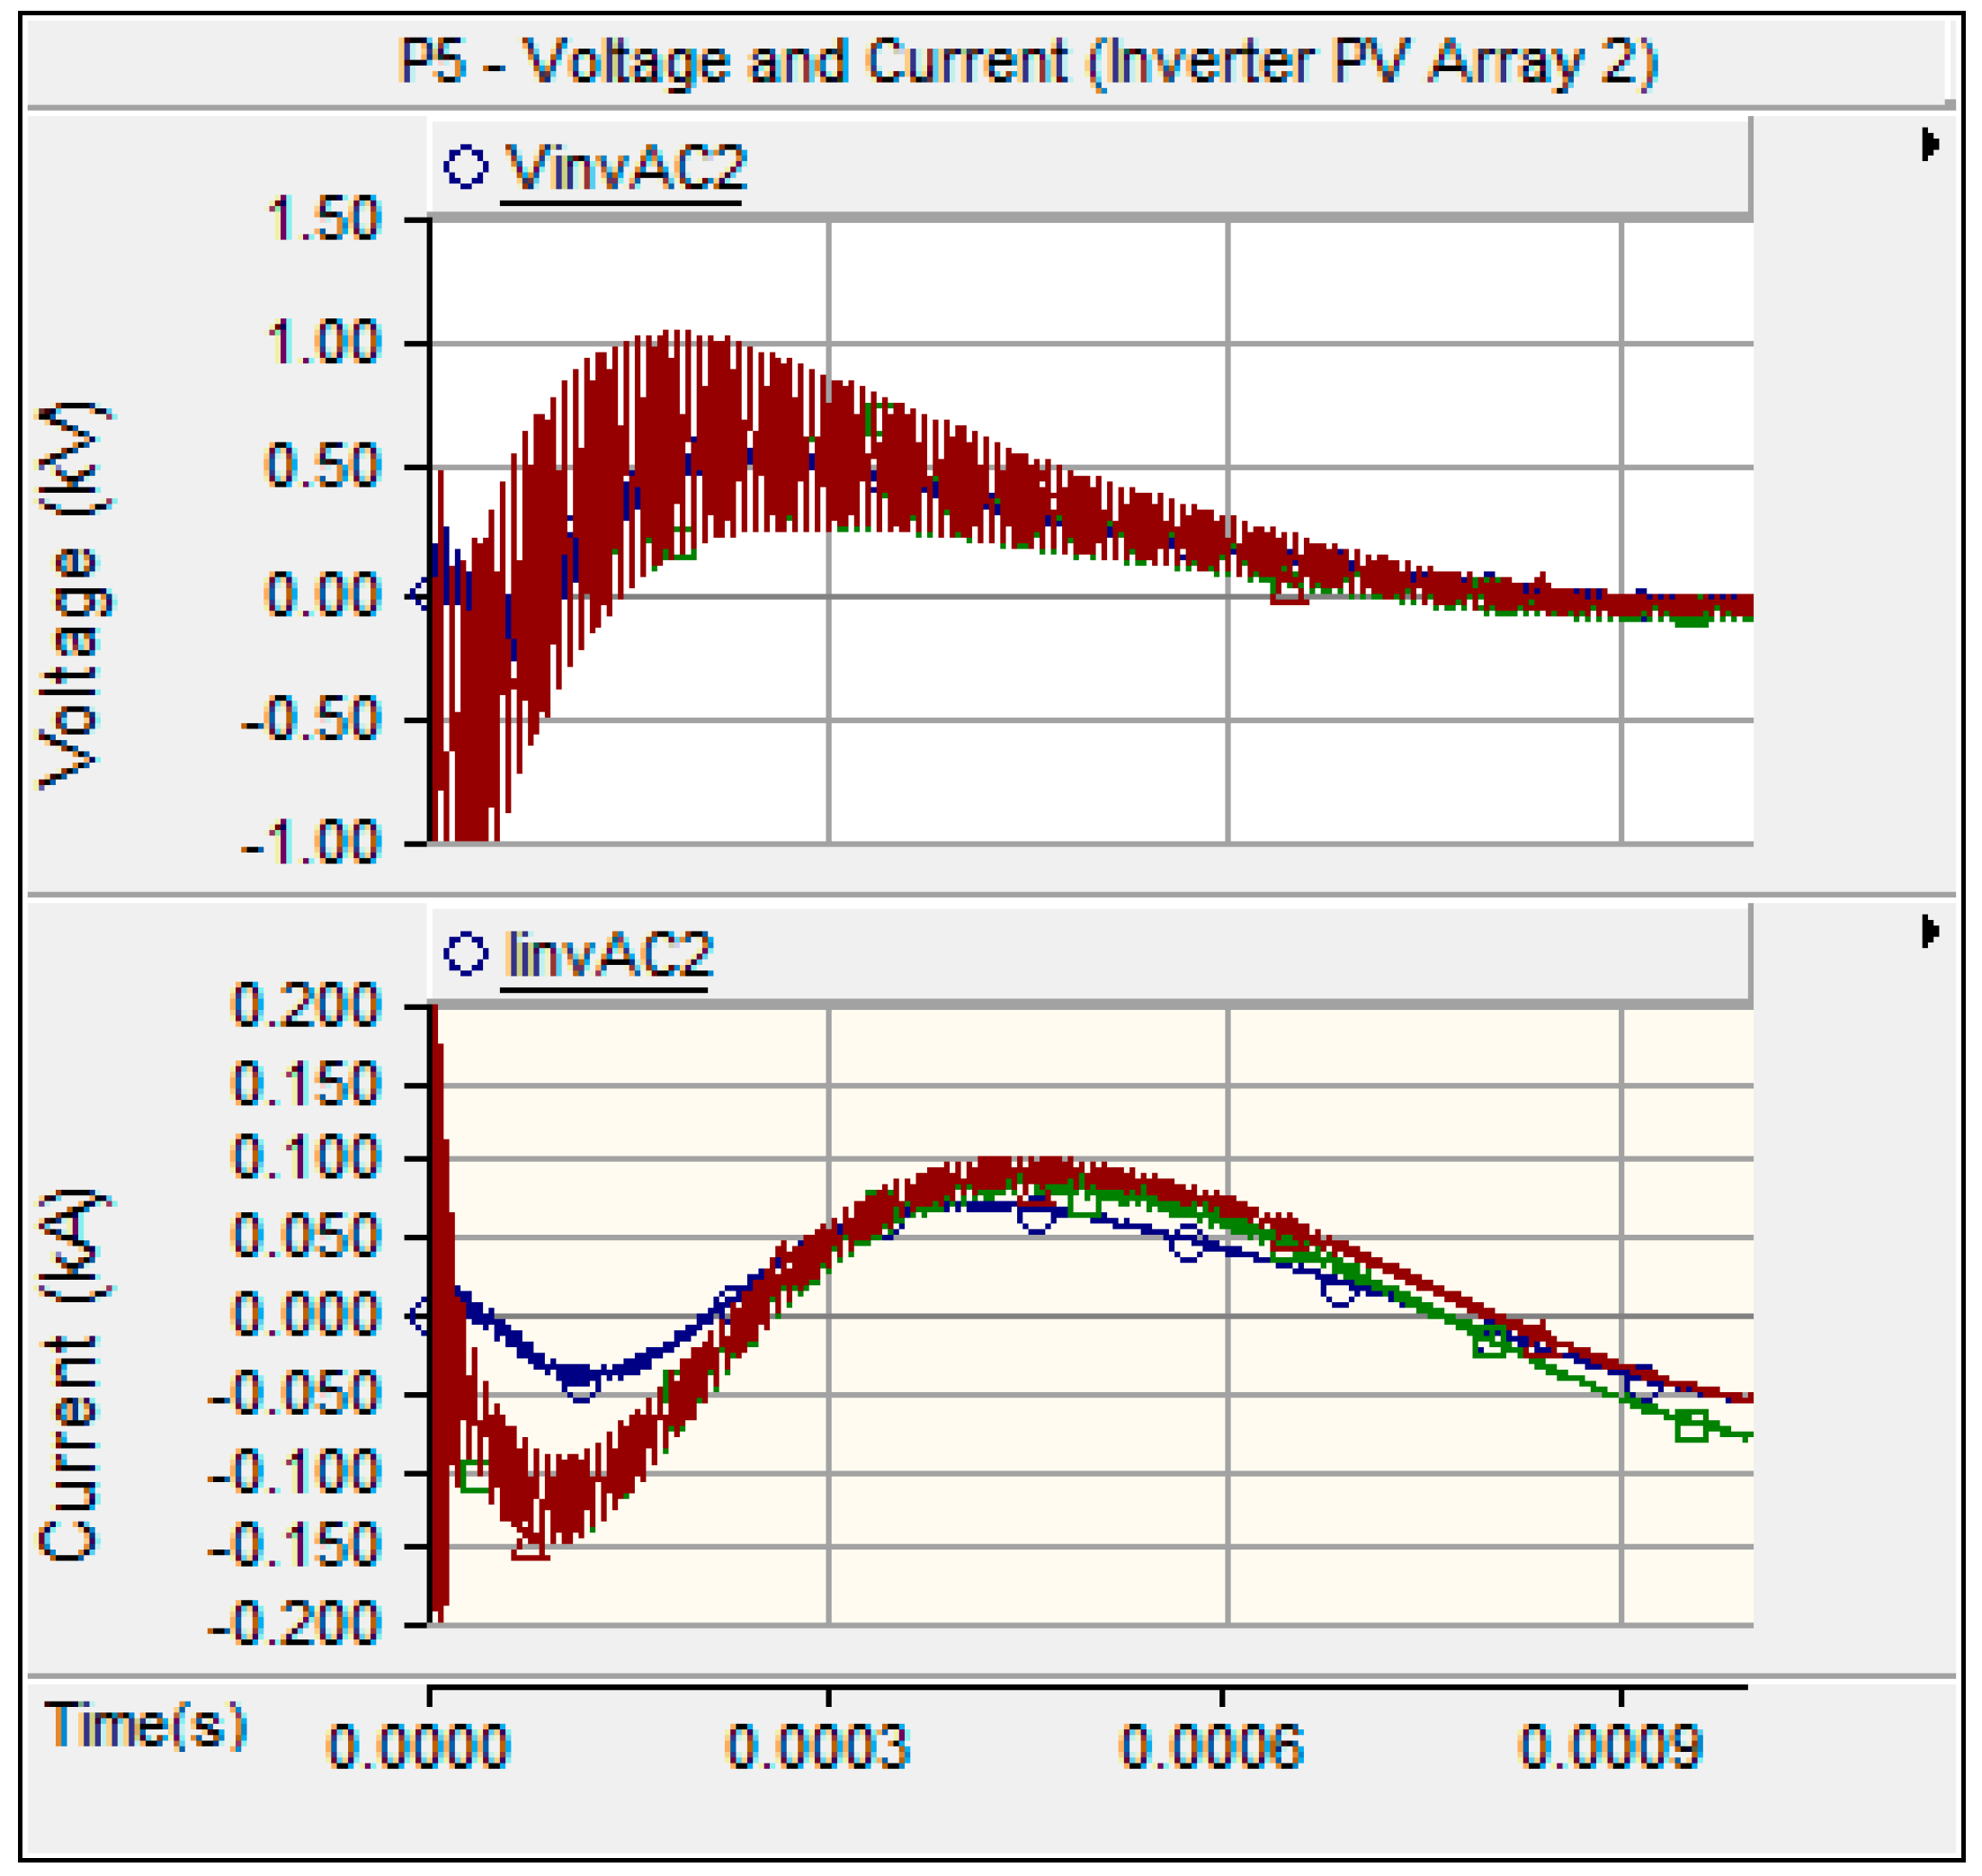
7. Result and Discussion

When lightning hits a conductor, it produces a travelling wave of voltage and current related to surge impedance at the speed of light. Therefore, five different points of measurement were used after the lightning strike to identify the travelling waves of the transient voltage and current that can cause damage to the components of the solar PV farm grid-connected system. The five points were the following: P1, which was used to determine the transient at solar PV modules; P2 and P3, the transient at the inverter; P4, the transient at the transformer; and P5, the transient at the second inverter. Table 5 shows the results after the lightning waveshape of 8/20 µs was applied at the point between the solar PV array and inverter at an amplitude range of 2–200 kA.
The results showed that the solar PV modules can be damaged by 5 kA lightning amplitude because the travelling current of 401 A, which greatly exceeded the overcurrent protection level of 71.36 A. The overcurrent protection I T R I P   can be calculated using Equation (2), which refers to MS 1837.
1.5   × I S C   S T C   M O D I T R I P 2 × I S C   S T C   M O D
1.5   × 35.68   A I T R I P 2 × 35.68   A
53.52   A I T R I P 2 × 71.36   A
High transient voltage (in kilovolts) and transient current (in kiloamperes) were observed at the transformer and inverter PV Array 2. In other words, when a lightning strikes the point between the solar PV array and inverter, the inverter PV Array 2 and transformer might be damaged. Table 6 illustrates the results for the lightning waveshape of 10/350 µs.
The solar PV modules sustained damage when a 5 kA lightning strike with 10/350 µs waveshape was applied. The lightning strike contributed to the 500 A current detected near the solar PV array. The transformer and inverter of the PV Array 2 were damaged because of the high transient voltage and current. Table 7 tabulates the results for the lightning strike with 0.25/100 µs waveshape.
The lightning strike with 0.25/100 µs waveshape also damaged the solar PV modules, inverter PV Array 1, inverter PV Array 2 and transformer. The consequences of damage were the same as those observed after the application of lightning strike with 10/350 µs waveshape. The only difference between them is that the transient current and voltage measured at lightning strike with 0.25/100 µs waveshape were much higher than those at lightning strike with 10/350 µs waveshape.
Travelling voltage and current were generated along the conductor line after the lightning struck the solar PV farm. Each measured point was illustrated in a graph based on the lightning strike at 200 kA peak current with 0.25/100 µs lightning waveform. Figure 10 shows the transient voltage (51.24 MV) and current (64.88 kA) that appears at the solar PV Array 1.
Figure 11a shows the transient voltage and current detected before entering the inverter (DC output). Figure 11b shows the transient voltage and current after leaving the inverter (AC output). The transient peak current at P2 is 205.96 kA; 1.03% over the peak current of the lightning strike, while at P3 was 5.86 kA. The AC output shows at least one phase will be affected by the lightning stroke.
Figure 12 and Figure 13 illustrate the transient voltage and current at the transformer and inverter PV Array 2. Although the lightning strike was at the point between the solar PV Array 1 and inverter, the transient voltage and current might have damaged the transformer and inverter PV Array 2 due to generated travelling waves throughout the system.
Based on these results, one can clearly see how the lightning surge can cause damage to the solar PV array and inverter that obviously lead to the high cost of replacement. Different behaviours can be seen from the perspectives of voltage and current measured at the solar panel, before and after inverter and at the main panel that connected to the grid. Those tables provide information and quick justification on where to install the SPD and what are the ratings of the SPD to be considered which duly fit the purpose of this study.

8. Conclusions

A lightning strike produces high transient voltage and current that can severely damage solar PV modules and components, such as inverters. A lightning current with short tail time and high peak contributes to a considerable increase in transient current and voltage. Furthermore, although lightning was injected between the solar PV and inverter, the transient voltage and current were able to travel along the conductor and caused damage to other components, particularly the solar PV modules and inverters. Therefore, depending on the location of the solar PV farm, engineers can obtain information on the peak current and median current of the site from the lightning location system (LLS) and utilise the results obtained in this study to appropriately assign an SPD to protect the solar panel, inverter and the main panel that connects to the grid. This paper does not propose the exact rating of the SPD to be used, due to the fact that there are different requirements of each side, but rather to provide a feasibility study prior to the commissioning of the system. Therefore, it is our aim for this lightning surge analysis to be adopted and carried out by the authority, as part of the compulsory task, before the system can be energised.

Acknowledgments

This work was supported by the Centre for Electromagnetic and Lightning Protection Research (CELP) and the Department of Electrical and Electronic Engineering, Universiti Putra Malaysia.

Author Contributions

All authors contribute in their roles differently. Nur Hazirah Zaini and Mohd Zainal Abidin Ab. Kadir wrote the most parts of this manuscript. Mohd Amran Mohd Radzi focused on the solar PV farm grid-connected system modelling confirmation. Mahdi Izadi, Norhafiz Azis, Nor Izzati Ahmad and Mohd Solehin Mohd Nasir dedicated their time in reviewing and commenting to finalize this manuscript.

Conflicts of Interest

The authors declare no conflict of interest.

References

  1. Mun, W.K.; Razali, H.M.; Almsafir, M.K.; Hamid, F.A. Prospects of Solar Energy for Domestic Area in Malaysia. In Proceedings of the 3rd National Graduate Conference (NatGrad2015), Kajang, Malaysia, 8–9 April 2015; pp. 332–337. [Google Scholar]
  2. Hussin, M.; Yaacob, A.; Zain, Z.; Shaari, S.; Omar, A. Status of a Grid-connected MBIPV Project in Malaysia. In Proceedings of the 3rd International Symposium & Exhibition in Sustainable Energy & Environment, Melaka, Malaysia, 1–3 June 2011; pp. 4–11. [Google Scholar]
  3. Hussin, M.; Yaacob, A.; Rahman, R.; Zain, Z.; Shaari, S.; Omar, A. Monitoring results of Malaysian building integrated PV Project in Grid-connected photovoltaic system in Malaysia. Energy Power 2012, 2, 39–45. [Google Scholar] [CrossRef]
  4. National Lightning Safety Institute. Available online: www.lightningsafety.com/nlsi_info/world-lightning-activity.html (accessed on 15 October 2017).
  5. Chowdhury, S.R.; Saha, H. Maximum power point tracking of partially shaded solar photovoltaic arrays. Sol. Energy Mater. Sol. Cells 2010, 94, 1441–1447. [Google Scholar] [CrossRef]
  6. DEHN. Lightning and Surge Protection for Free Field PV Power Plants; DEHN: Neumarkt, Germany, 2014; p. 15. [Google Scholar]
  7. Chowdhuri, P. Parameters of lightning strokes and their effects on power systems. In Proceedings of the 2001 IEEE/PES Transmission and Distribution Conference and Exposition, Atlanta, GA, USA, 2 November 2001; pp. 1047–1051. [Google Scholar]
  8. Treble, F. Milestones in the development of crystalline silicon solar cells. Renew. Energy 1998, 15, 473–478. [Google Scholar] [CrossRef]
  9. Jol, J.; Mandoc, M.; Molenbroek, E. Solar Electricity 2008—A Technical and Economic Overview; Ecofys BV: Kanaalweg, The Netherlands, 2008. [Google Scholar]
  10. Van Sark, W.; Korte, L.; Roca, F. Physics and Technology of Amorphous-Crystalline Heterostructure Silicon Solar Cells; Springer: New York, NY, USA, 2012. [Google Scholar]
  11. Dobrzański, L.; Drygała, A.; Giedroć, M.; Macek, M. Monocrystalline silicon solar cells applied in photovoltaic system. J. Achiev. Mater. Manuf. Eng. 2012, 53, 7–13. [Google Scholar]
  12. Jäger, K.; Isabella, O.; Smets, A.H.; Van Swaaij, R.A.C.M.M.; Zeman, M. Solar Energy-Fundamentals, Technology, and Systems; Delft University of Technology: Delft, The Netherlands, 2014. [Google Scholar]
  13. Glunz, S.; Preu, R.; Biro, D. Chapter 1.16: Crystalline Silicon Solar Cells—State-of-the-Art and Future Developments. In Comprehensive Renewable Energy; Elsevier: Amsterdam, The Netherlands, 2012; pp. 353–387. [Google Scholar]
  14. Hussin, M.; Hasliza, N.; Yaacob, A.; Zain, Z.; Omar, A.; Shaari, S. A development and challenges of grid-connected photovoltaic system in Malaysia. In Proceedings of the Control and System Graduate Research Colloquium (ICSGRC), Shah Alam, Malaysia, 16–17 July 2012. [Google Scholar]
  15. Ghazali, A.M.; Rahman, A.M.A. The performance of three different solar panels for solar electricity applying solar tracking device under the Malaysian climate condition. Energy Environ. Res. 2012, 2, 235. [Google Scholar] [CrossRef]
  16. Installation of Grid-Connected Photovoltaic (PV) System; MS 1837; Department of Standards Malaysia: Cyberjaya, Malaysia, 2010.
  17. Rakov, V.A. Fundamentals of Lightning. In Proceedings of the International Symposium on Lightning Protection, Kathmandu, Nepal, 12–14 October 2011. [Google Scholar]
  18. Lightning and Insulator Subcommittee of T&D Committee. Parameters of lightning strokes: A review. IEEE Trans. Power Deliv. 2005, 20, 346–358. [Google Scholar]
  19. Wang, J.; Zhang, X. Double-exponential expression of lightning current waveforms. In Proceedings of the 2006 4th Asia-Pacific Conference on Environmental Electromagnetics, Dalian, China, 1–4 August 2006. [Google Scholar]
  20. Heidler, F.; Cvetic, J.; Stanic, B. Calculation of lightning current parameters. IEEE Trans. Power Deliv. 1999, 14, 399–404. [Google Scholar] [CrossRef]
  21. Electromagnetic Compatibility (EMC)—Part 4-5: Testing and Measurement Techniques–Surge Immunity Test; MS IEC 61000; Department of Standards Malaysia: Cyberjaya, Malaysia, 2007.
  22. Rakov, V. Lightning phenomenology and parameters important for lightning protection. In Proceedings of the IX International Symposium on Lightning Protection (IX SIPDA), Foz do Iguaçu, Brazil, 26–30 November 2007. [Google Scholar]
  23. Belik, M. PV panels under lightning conditions. In Proceedings of the 2014 15th International Scientific Conference on Electric Power Engineering (EPE), Brno, Czech Republic, 12–14 May 2014. [Google Scholar]
  24. Zhang, C.; Tu, Y.; Hu, J.; Sun, W.; Li, H.J.; Wang, S. Study of induced overvoltage on solar arrays in Lightning (APL). In Proceedings of the 2011 7th Asia-Pacific International Conference, Chengdu, China, 1–4 November 2011; pp. 852–857. [Google Scholar]
  25. Hernandez, J.C.; Vidal, P.G.; Jurado, F. Lightning and surge protection in photovoltaic installations. IEEE Trans. Power Deliv. 2008, 23, 1961–1971. [Google Scholar] [CrossRef]
  26. Charalambous, C.A.; Kokkinos, N.; Christofides, N.; Ab Kadir, M.Z.A.; Gomes, C. A simulation tool to assess the lightning induced over-voltages on dc cables of photovoltaic installations. In Proceedings of the 2014 International Conference on Lightning Protection (ICLP), Shanghai, China, 11–18 October 2014. [Google Scholar]
  27. Tan, P.H.; Gan, C.K. Methods of lightning protection for the PV power plant. In Proceedings of the 2013 IEEE Student Conference on Research and Development (SCOReD), Putrajaya, Malaysia, 16–17 December 2013; pp. 221–226. [Google Scholar]
  28. Jiang, T.; Grzybowski, S. Electrical degradation of Photovoltaic modules caused by lightning induced voltage. In Proceedings of the 2014 IEEE Electrical Insulation Conference (EIC), Philadelphia, PA, USA, 8–11 June 2014; pp. 107–110. [Google Scholar]
  29. Sekioka, S. An experimental study of sparkover between a rod and a photovoltaic panel. In Proceedings of the 2012 International Conference on Lightning Protection (ICLP), Vienna, Austria, 2–7 September 2012; pp. 1–5. [Google Scholar]
  30. Photovoltaic Devices—Part 3: Measurement Principles for Terrestrial Photovoltaic (PV) Solar Devices with Reference Spectral Irradiance Data; Malaysian Standard MS 60904; Department of Standards Malaysia: Cyberjaya, Malaysia, 2013.
Figure 1. Photovoltaic (PV) cell types.
Energies 10 02149 g001
Figure 2. Lightning impulse current wave shape at 0.25/100 µs.
Energies 10 02149 g002
Figure 3. Lightning impulse current wave shape at 8/20 µs.
Energies 10 02149 g003
Figure 4. Lightning impulse current wave shape at 10/350 µs.
Energies 10 02149 g004
Figure 5. Solar PV farm.
Energies 10 02149 g005
Figure 6. 1 MW Real Power.
Energies 10 02149 g006
Figure 7. DC voltage and DC current.
Energies 10 02149 g007
Figure 8. AC voltage and AC current.
Energies 10 02149 g008
Figure 9. Strike points at Solar PV farm.
Energies 10 02149 g009
Figure 10. Transient voltage and current at P1 (solar PV Array 1).
Energies 10 02149 g010
Figure 11. (a) Transient voltage and current at P2 (before inverter PV Array 1); (b) Transient voltage and current at P3 (after inverter PV Array 1).
Energies 10 02149 g011
Figure 12. Transient voltage and current at P4 (transformer).
Energies 10 02149 g012
Figure 13. Transient voltage and current at P5 (inverter PV Array 2).
Energies 10 02149 g013
Table 1. Components of a solar PV system [16].
ComponentDescription
Solar PV
  • Crystalline silicon PV module type must comply with MS IEC 61215.
  • Thin film PV module type must comply with MS IEC 61646.
Inverter
  • Component that converts DC output from solar PV to AC output, which can be delivered to the load and grid
  • The inverter must comply in accordance with MS IEC 61000-3-2, MS IEC 61000-6-3, MS IEC 61000-6-4, MS IEC 60364-7-712 and MS 1992 or IEEE 1547 and IEEE 1547.1.
Switching device (circuit breaker)
  • Used for protection and/or disconnecting when fault occurs
  • Voltage rating greater than V O C   S T C   A R R A Y   =   V O C   S T C   M O D   × N s  
  • Current rating of 1.5   × I S C   S T C   M O D I T R I P 2 × I S C   S T C   M O D
Fuse
  • Safety device to protect against overcurrent
  • Used for rated DC to DC and rated AC to AC
  • Voltage rating equal or greater than V O C   S T C   A R R A Y   =   V O C   S T C   M O D × N s
  • Current rating of 1.5   and   2   time   I S C   S T C   S t r i n g  
PV kWh meter
  • Records AC electricity (in kilowatt per hour) generated by solar PV
  • Connected between the AC breaker and AC grid isolator main switch
Batteries
  • Store power generated during the day to be used at night
  • Usually for off-grid connected systems
Description: V O C   S T C   A R R A Y   = Open circuit voltage at standard test condition of a PV array. V O C   S T C   M O D   = Open circuit voltage of a PV at standard test condition. I S C   S T C   M O D   = Short circuit current of a PV module or PV string at standard test. I S C   S T C   S t r i n g = Short circuit current of a solar PV string at standard test condition. N s   = The number of series-connected PV modules in any PV string of the PV array.
Table 2. Standards related to solar PV.
StandardsTitle
MS 1837-2010Installation of Grid-connected Photovoltaic (PV) System
MS IEC 62305 1-4:2007Protection against lightning
Part 1: General Principles
Part 2: Risk Management
Part 3: Physical damage to structures and life hazard
Part 4: Electrical and electronic systems within structures
MS IEC 60364-7-712:2007Electrical Installations of Building—Part 7-712: Requirements for special installations or locations—Solar Photovoltaic (PV) power supply systems
MS IEC 61836:2010Solar Photovoltaic Energy System—Terms, Definitions, and Symbols
MS IEC 62446:12Grid connected photovoltaic systems—Minimum requirements for system documentation, commissioning tests and inspection
MS IEC 61727:2010Photovoltaic (PV) systems—Characteristics of the utility interface
MS IEC 61730 1-2:2010Photovoltaic (PV) module safety qualification
Part 1: Requirements for construction
Part 2: Requirements for testing
MS IEC 60904 1-3:2013Photovoltaic devices
Part 1: Measurement of photovoltaic current-voltage characteristics
Part 2: Requirements for reference solar devices
Part 3: Measurement principles for terrestrial photovoltaic (PV) solar devices with reference spectral irradiance data
MS IEC 61215:2006Crystalline silicon terrestrial photovoltaic (PV) modules—design qualification and type approval
MS IEC 61646:2010Thin-Film terrestrial photovoltaic (PV) modules—Design qualification and type approval
MS IEC 62109-1:2011Safety of power converters for use in photovoltaic power systems—Part 1: General requirements
IEC 60269-1:2010Low-voltage fuses—Part 6: Supplementary requirements for fuse-links for the protection of solar photovoltaic energy systems
EN 50380:2003Datasheet and nameplate information for photovoltaic modules
EN 50539 : 2011Low-voltage surge protective devices. Surge protective devices for specific application including D.C. Requirements and tests for SPDs in photovoltaic applications
EN 50521:2009-10Connectors for photovoltaic systems—security requirements and approval (German version EN 50521:2008)
EN 50530:2010Overall efficiency of grid connected photovoltaic inverters
EN 50548:2009-10Junction boxes for PV modules
Table 3. Details of components in the solar PV farm.
ComponentsQuantitiesSpecifications
Solar Modules4032 modules60 multicrystalline solar cells
Power solar PV modules = 250 W
Voltage of solar PV modules = 29.8 V
Current of solar PV modules = 8.39 A
Inverter42Nominal AC Power per inverter = 20 kW
Sub Distribution Board (SDB)6Maximum output aggregated at SDB is 140 kW
Main Distribution Board (MSB)2Maximum output aggregated at MSB is 500 kW
Transformer11500 kVA step-up transformer, 433 V/11 kV
Grid-11 kV
Table 4. Output of Solar PV Farm Grid-connected System simulated in PSCAD/EMTDC.
DC Output (PV Array)AC Output
(PV Array)(Transformer)
Vmax (V)Imax (A)Vmax (V)Imax (kA)Vmax (V)Imax (kA)
714.9733.42353.390.040353.451.96
Table 5. Lightning strike (8/20 µs).
Lightning Amplitude (kA)P1 (PV Array)P2 (before Inverter)P3 (after Inverter)P4 (before Transformer)P5 (before Inverter 2)
Vpv (MV)Ipv (kA)Vinv
DC (MV)
Iinv
DC (kA)
Vinv
AC (kV)
Iinv
AC (kA)
Vtrans (kV)Itrans (kA)Vinv2 (kV)Iinv2 (kA)
20.0090.0240.0022.040.130.0210.0070.1880.0070.004
50.0220.4010.0074.810.320.0350.0150.2030.0150.003
100.0441.340.0138.910.640.0610.0300.230.0300.003
200.0883.310.02617.021.270.1140.0600.290.0600.005
300.1315.310.04025.111.910.170.0890.340.0890.006
400.1747.320.05433.202.550.220.120.390.120.008
500.2199.330.06741.283.180.270.150.440.150.010
1000.43719.420.13481.686.370.540.300.670.300.019
1500.65629.520.202122.609.550.800.460.890.450.027
2000.87639.630.269162.4212.731.050.591.100.590.036
Table 6. Lightning strike (10/350 µs).
Lightning Amplitude (kA)P1 (PV Array)P2 (before Inverter)P3 (after Inverter)P4 (before Transformer)P5 (before Inverter 2)
Vpv (MV)Ipv (kA)Vinv
DC (MV)
Iinv
DC (kA)
Vinv
AC (kV)
Iinv
AC (kA)
Vtrans (kV)Itrans (kA)Vinv2 (kV)Iinv2 (kA)
20.01350.0240.00452.040.180.110.0500.280.0110.005
50.0330.500.01135.040.440.240.0270.470.0270.007
100.0661.420.0239.970.890.470.0550.800.0550.008
200.1333.350.04519.421.780.940.111.480.110.010
300.1975.290.06828.402.671.400.172.160.170.012
400.2647.580.09137.323.551.870.222.830.220.016
500.3299.220.11346.224.442.330.283.510.280.020
1000.65619.080.22790.698.894.670.566.840.560.039
1500.98428.940.340135.1313.327.010.8410.130.840.059
2001.31238.810.454179.5517.779.351.1213.421.120.078
Table 7. Lightning strike (0.25/100 µs).
Lightning Amplitude (kA)P1 (PV Array)P2 (before Inverter)P3 (after Inverter)P4 (before Transformer)P5 (before Inverter 2)
Vpv (MV)Ipv (kA)Vinv
DC (MV)
Iinv
DC (kA)
Vinv
AC (kV)
Iinv
AC (kA)
Vtrans (kV)Itrans (kA)Vinv2 (kV)Iinv2 (kA)
20.510.620.0222.170.170.0720.0110.240.0190.009
51.281.590.0545.270.410.160.0260.340.0260.010
102.563.220.10810.420.830.320.0510.510.0510.010
205.126.460.21720.711.660.620.100.840.100.022
307.699.710.32531.002.490.920.151.150.150.033
4010.2512.920.43441.293.311.210.201.440.200.044
5012.8116.190.54251.594.141.510.251.720.250.055
10025.6232.431.085103.048.282.960.513.170.510.111
15038.4348.651.627154.5012.434.410.774.650.770.17
20051.2464.882.170205.9616.575.861.026.131.020.22

