Chip Temperature-Based Workload Allocation for Holistic Power Minimization in Air-Cooled Data Center


School of Control and Computer Engineering, North China Electric Power University, Beijing 102206, China
*
Author to whom correspondence should be addressed.
Energies 2017, 10(12), 2123; https://doi.org/10.3390/en10122123
Submission received: 20 October 2017
/
Revised: 22 November 2017
/
Accepted: 11 December 2017
/
Published: 13 December 2017
Abstract
:Minimizing the energy consumption is a dominant problem in data center design and operation. To cope with this issue, the common approach is to optimize the data center layout and the workload distribution among servers. Previous works have mainly adopted the temperature at the server inlet as the optimization constraint. However, the inlet temperature does not properly characterize the server’s thermal state. In this paper, a chip temperature-based workload allocation strategy (CTWA-MTP) is proposed to reduce the holistic power consumption in data centers. Our method adopts an abstract heat-flow model to describe the thermal environment in data centers and uses a thermal resistance model to describe the convective heat transfer of the server. The core optimizes the workload allocation with respect to the chip temperature threshold. In addition, the temperature-dependent leakage power of the server has been considered in our model. The proposed method is described as a constrained nonlinear optimization problem to find the optimal solution by a genetic algorithm (GA). We applied the method to a sample data center constructed with computational fluid dynamics (CFD) software. By comparing the simulation results with other different workload allocation strategies, the proposed method prevents the servers from overcooling and achieves a substantial energy saving by optimizing the workload allocation in an air-cooled data center.
1. Introduction
Numerous trends in the information technology (IT) industry show an increasing energy consumption of data centers’ operation during the past decade [1]. Recently studies have shown that the energy consumed by data centers has accounted for nearly 2% of the world’s power consumption and that this number will continue to rapidly increase in the future [2]. For an air-cooling data center, cooling infrastructure consumes 30–50% of the operating power to maintain stable operation of the IT equipment [3,4].The operating cost of the cooling system in data centers is close to that of the IT equipment and attracts more and more attention [5]. Therefore, enhancing the energy efficiency by optimizing thermal management has become one of the main foci in data center design and operation.
Currently, air-cooled data centers usually adopt a raised-floor configuration to maintain an appropriate temperature and humidity condition, as illustrated in Figure 1. The racks placed on the plenum are usually arranged in a cold aisle–hot aisle layout. Supply air from a computer room air conditioner (CRAC) enters the plenum and is then distributed into the cold aisle through perforated tiles. The racks extract air from the cold aisle and exhaust it into the hot aisle. The cold air flows through the server rack and removes the heat generated by the IT equipment. Finally, the exhaust air of the racks returns to the intake of the CRAC to complete a cycle. The cold aisle–hot aisle structure separates the flow paths of hot air and cold air. However, the recirculated air from the hot aisle and the escaped air from the cold aisle are still present. Hot-air recirculation causes an elevated temperature at the server inlet and forms some localized hot spots around the server racks. In order to cool these localized hot spots, the CRAC has to blow excessive cold air into the whole room. The high utilization of the CRAC not only leads to more energy consumption but also affects the efficiency through reducing its coefficient of performance (COP).
In order to enhance the energy efficiency in data centers, many existing works focus on optimizing the layout of the data center or minimizing the effect of heat recirculation by placing the workload intelligently. These methods have adopted the inlet temperature to describe the thermal environment of the server and have achieved some effects in terms of energy saving. However, the inlet temperature does not properly characterize the server’s thermal state. The server’s thermal state depends on its heat load and inlet temperature. For the same inlet temperature, a low server utilization causes the chip temperature to drop below the threshold, which means the cooling capacity of the supply of cold air is not effectively utilized. In the present study, we use the chip temperature to characterize the server’s thermal state directly, and the workload allocation scheme is optimized with the chip temperature constraint to reduce the holistic power consumption of the data center. The proposed method adopts an abstract heat-flow model to describe the thermal environment in data centers and uses a thermal resistance model to describe the convective heat transfer of the server. Furthermore, the temperature-dependent leakage power is considered in our model. By comparing with other workload assignment strategies, our method achieved an optimal workload allocation scheme that prevented the servers from overheating or overcooling, and a significant amount of cooling energy was saved without degrading the server’s thermal reliability.
The article is organized as follows: Section 2 gives a brief overview of the related works. Section 3 presents the models used in our study and the proposed strategy for minimizing the total power through allocating the workload intelligently. Section 4 gives the results of a case study and evaluates the proposed method by comparing with different workload allocation strategies. Lastly, Section 5 concludes the paper with a brief summary and a discussion about future work.
2. Related Works
Recently, many researchers have focused their attention on optimizing the thermal environment of data centers. In this section, we briefly summarize the related works that have made efforts to enhance energy efficiency by thermal management in air-cooled data centers.
Computational fluid dynamics (CFD) is one of the major options for evaluating the thermal environment of data centers. Nada et al. [6] performed an in-depth analysis of the temperature and airflow distribution in a data center under different operational and geometric conditions, and they evaluated the cooling performance with several metrics. Nagarathinam and Srinarayana et al. [7,8] used CFD simulation to study the thermal performance of different room and ceiling layout strategies in air-cooled data centers. The optimization of the room layout for a raised-floor data center was performed with respect to the arrangement of racks and the CRAC, the geometric structure of the room, and the opening ratio of the perforated floor. Their results give some appropriate guidelines to help designers achieve a more efficient cooling system. However, CFD simulation consumes a huge amount of computational resources and is not suited for optimization techniques based on iteration. To cope with this issue, Tang et al. [9,10] proposed a low-complexity linear heat recirculation model that adopts cross-interference coefficients to express air recirculation among the servers; thus the server inlet temperatures can be predicted for different workload distributions and supply air temperatures. By allocating the workload among servers intelligently, they saved a substantial amount of cooling energy through maximizing the supply temperature of the cooling system. Many researchers have adopted this heat recirculation model in their studies. Banerjee et al. [11] integrated the workload assignment approach with cooling system management to achieve energy saving in data centers. Siriwardana et al. [12] presented an optimization approach based on Tang’s model to find the best equipment upgrading strategy to minimize the impact of new equipment on the existing thermal environment. Meng et al. [13] adopted the heat recirculation model to study the cooling consumption with respect to communication cost. Fang et al. [14] combined a two-time-scale control algorithm with Tang’s model to optimize the workload allocation, the cooling supply and the IT equipment operating state; thus the total power of the cooling system and IT equipment was minimized. In addition to this, Khalaj et al. [15] proposed another reduced-order model to predict the temperature distribution in data centers. On the basis of the prediction, a particle swarm algorithm was employed to find the best load allocation strategy for a given total workload. Machine learning algorithms are also fast temperature-prediction methods that can be used for iterative optimization. Lorenzi et al. [16] developed an artificial neural network-based model to obtain the server inlet temperatures; they coupled this neural network model with the control algorithm to determine the optimal cooling of data centers in real time. Song et al. [17] developed an artificial neural network to predict the thermal operating conditions in data centers with respect to a specified set of control variables. On the basis of the artificial neural network model, a genetic algorithm (GA) was employed to optimize the thermal condition around the racks. Besides this, proper orthogonal decomposition (POD) is an effective prediction approach adopted by many researchers to obtain airflow and temperature profiles in data centers, and this observation-based method is much faster than CFD simulation [18,19,20]. Ghosh and Joshi [21,22] developed a POD-based model to predict the temperature distribution. They assumed the power consumption of a server is linearly mapped to its utilization rate. Their model can be used in iterative calculations to optimize the operating parameters of air-conditioning systems and the workload distribution among servers. Demetriou et al. [23,24] studied several thermal-aware workload assignment strategies in open-aisle data centers using the POD approach. Their results showed a significant energy saving can be achieved by optimizing the workload allocation. Fouladi et al. [25] proposed a hybrid model based on the POD method; the model was applied to a sample data center to improve the efficiency of the cooling system. All these researchers have adopted the server inlet temperature to characterize the server thermal state in their studies.
Although the aforementioned studies have optimized the power consumption of air-cooled data centers with respect to the server inlet temperature constraint, these thermal-aware workload allocation strategies cannot avoid the overcooling of the server, which decreases the energy efficiency of the data center. Moreover, the simplified server model adopted by these studies does not take into account the increase in leakage power when the chip temperature increases, which affects the energy efficiency of the data center.
3. Strategy for Minimizing Holistic Power Consumption of Data Centers
In the present study, we propose a chip temperature-based workload allocation approach to reduce the total power consumption of the IT equipment and cooling system. Our method can be described as an optimization problem that adopts Tang’s abstract model [10] and a thermal resistance model to quickly predict the thermal state of the server equipment. For simplicity, we assume that all servers in the data center have the same power consumption and computing capacity. In order to accurately describe the server’s thermal state, the chip temperature is used as the constraint of the optimization problem (the properly formulated problem is named the “chip temperature-based workload allocation strategy” or CTWA-MTP), rather than the server inlet temperature. Moreover, the temperature-dependent leakage power of the IT equipment is considered in our study, which affects the load allocation strategy in the data center.
3.1. Server Power Model
The power consumption of a typical server contains two main components: computing power and leakage power [26]. For simplicity, we adopt a linear model to map the computing power to the server utilization rate [27]. Thus, the computing power of a server i can be modeled as
where denotes the server utilization, is the server’s idle power, and is the gain factor that maps the computing power to the server utilization.
In order to further model the server consumption with the effect of leakage power, the computing power consumption is multiplied by a temperature-dependent factor , which is used to characterize the relationship between the server temperature and the leakage power [28]. Then, the power consumption of server i is expressed as
Because the exact form of is quite complex, researchers have proposed several approximate models of , such as linear functions [29], quadratic functions [30], and piecewise linear functions [31]. In the present study, we adopt a linear function to estimate the leakage power. This simple model is capable of accurately modeling the temperature-dependent leakage power of a typical server [29]. Thus, the power consumption of server i is rewritten as
which is a function of the server utilization rate and the server temperature.
3.2. Abstract Heat-Flow Model
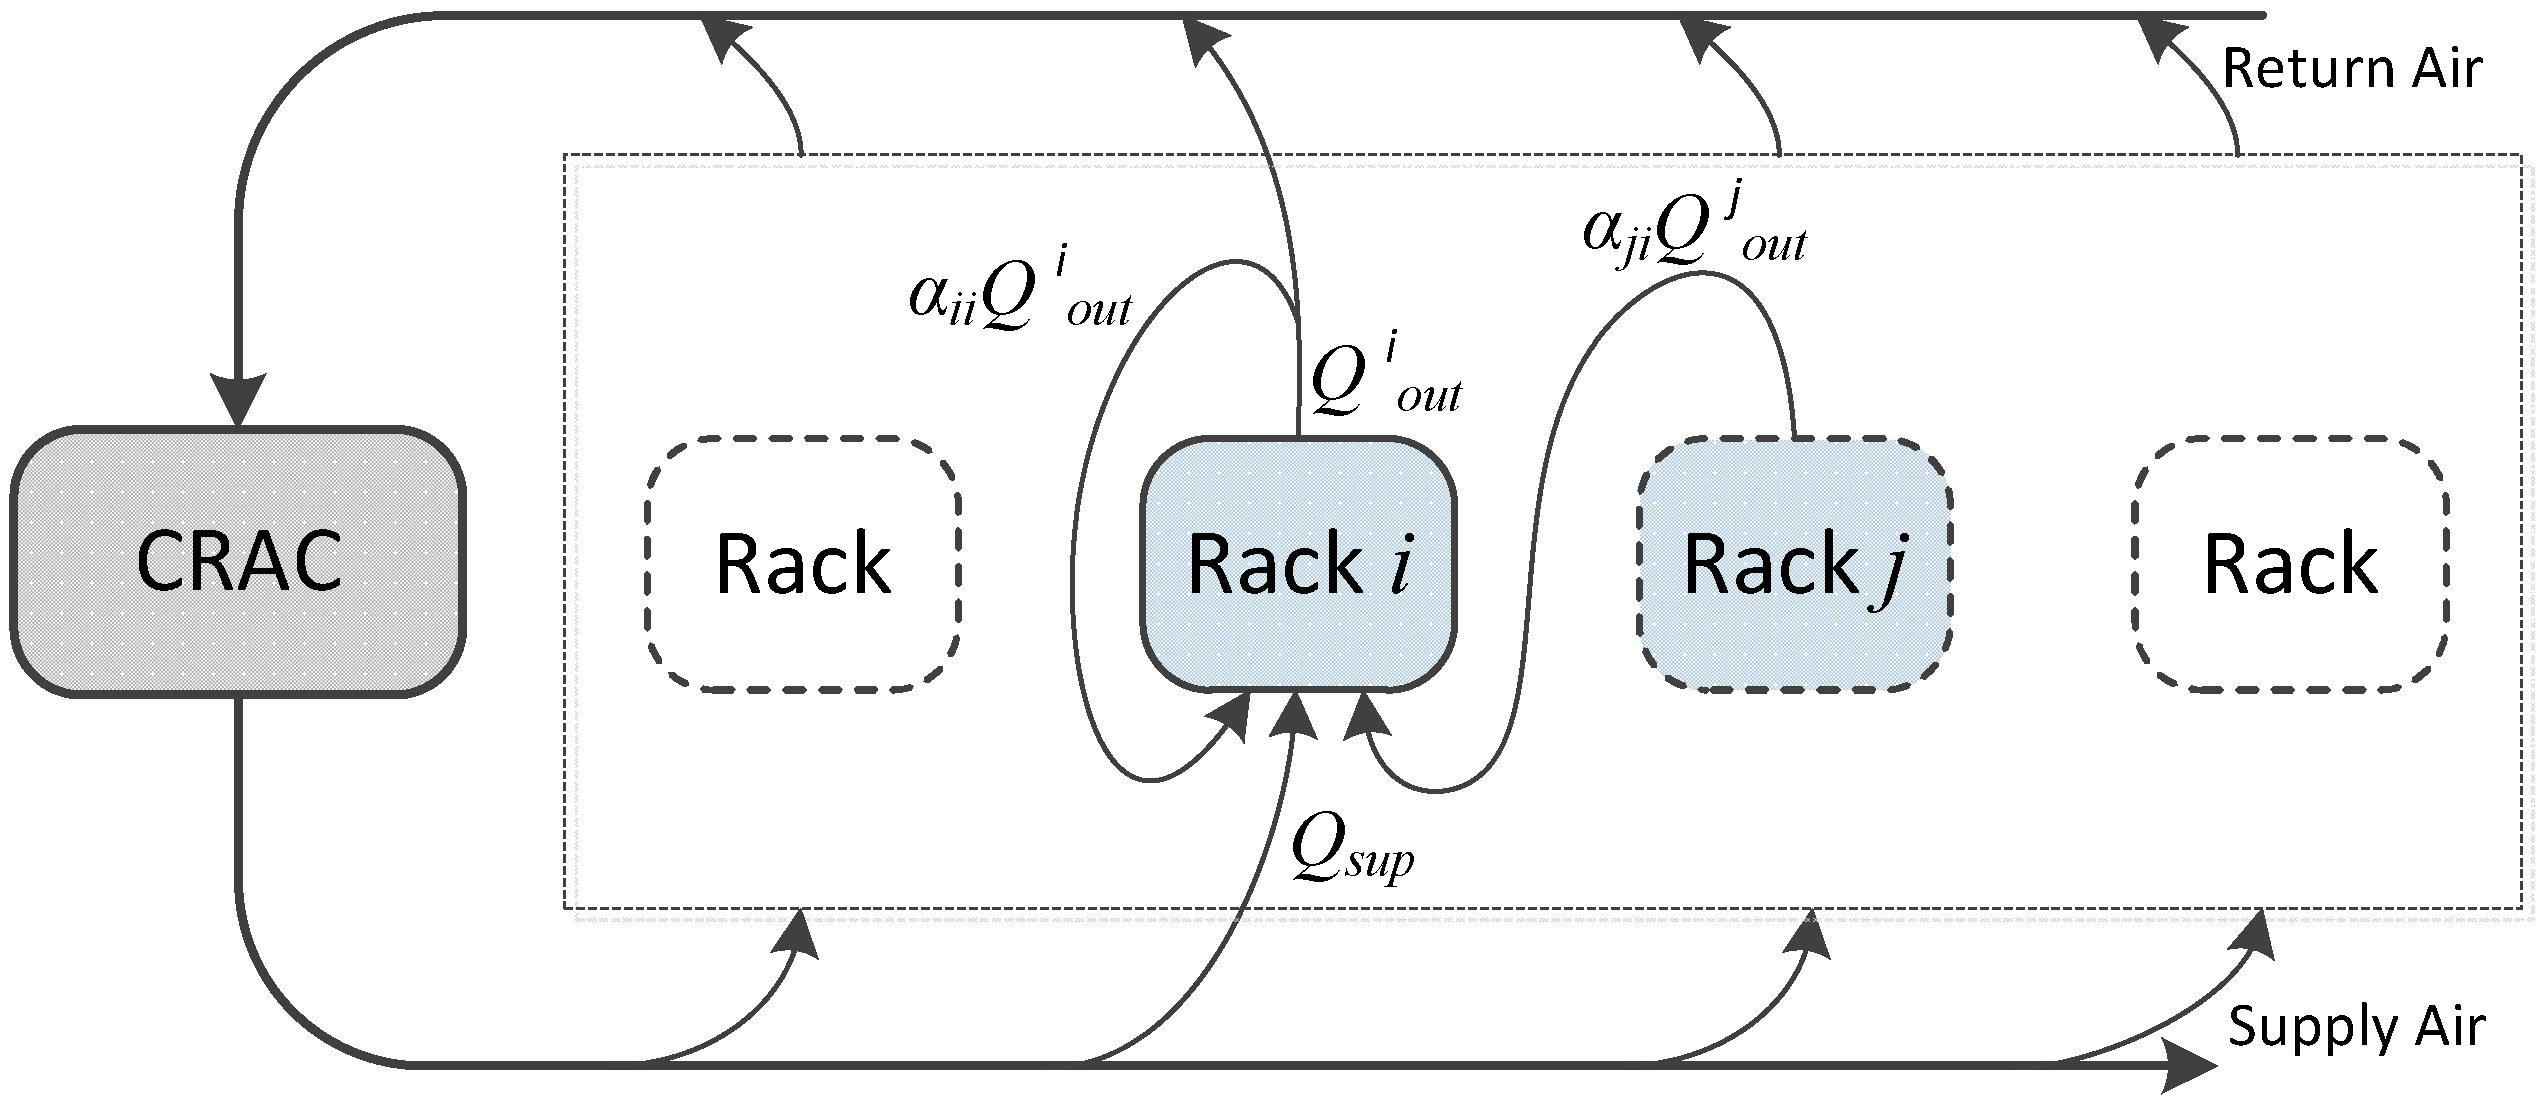
In the present study, we assume the sample data center houses n server chassis. Each chassis houses an equal number of servers, which run at the same utilization rate. The server chassis are regarded as thermal nodes from the thermal perspective. The node i sucks a fixed amount of air from the inlet to cool down the IT equipment and expels the same amount of exhaust air to the outlet; and denote the average temperature at the server inlet and the server outlet, respectively. The heat load of node i determines the temperature rise of airflow passing through the server chassis. Unfortunately, the recirculation heat makes some temperatures at the server inlet higher than the supply temperature of the CRAC. The typical heat transfer among the racks in an air-cooled data center is presented in Figure 2. The heat recirculation can be described with the model proposed by Tang et al. [9].
According to the definition of heat in the law of thermodynamics, the heat carried by an airflow with a specific temperature can be described as
where denotes the air density (), f denotes the volume flow rate of air (), denotes the specific heat of air (), and T denotes the absolute temperature of airflow (K).
Considering that the power consumed by IT equipment will dissipate as heat, the steady-state of a node can be described by the law of conservation of energy. For node i, the relationship between the inlet temperature () and the outlet temperature () is written as
or equivalently as
where denotes the power drawn by node i, and denotes the airflow through node i and . This means that the power consumption heats up the airflow of node i from the inlet temperature to the outlet temperature .
The air drawn by the node inlet originates from the supply air of the CRAC and the recirculated hot air expelled by other nodes, as illustrated in Figure 2. The heat recirculation among the nodes can be expressed with the cross-interference coefficient matrix , where the matrix element denotes the amount of exhaust heat from the outlet of node i to the inlet of node j. Therefore, the total heat carried by the inlet airflow is expressed as
where is the inlet heat of node i, is the total recirculation heat from all nodes to node i, and is the supply heat from the CRAC to node i.
From Equations (4) and (5), we can derive the outlet heat as follows:
According to the air recirculation among racks, as shown in Figure 2, the amount of air from the CRAC drawn by the node i inlet per unit time is written as , and consequently, we have
where is the temperature of the supply air from the CRAC. Thus, Equation (7) is rewritten as
In order to describe all the nodes in the data center, Equations (5) and (9) can be expressed in terms of vectors:
where denotes the transpose of , is a diagonal matrix composed by :
and the outlet temperature, the supply temperature and the node power consumption are defined as respectively.
Therefore, the inlet temperature is written as
In order to simplify the expression of Equation (11), is defined as , which is referred to as the heat distribution matrix. Thus we have
3.3. Equipment Thermal Resistance Model
In the air-cooled data center, all heat generation of node i is taken away by the airflow passing through it. The convective heat transfer between the IT equipment and the cooling air can be described by a thermal resistance model, which is expressed as
where is the chip temperature of node i; is the thermal resistance of node i, which is used to characterize the heat transfer capacity of the IT equipment. The value of the heat resistance depends on the surface area and the surface air velocity. Equation (14) can be rewritten as
For all nodes from 1 to n, the chip temperature can be written in vector form:
where the diagonal matrix is defined as
and the column vector is defined as
Combining Equations (13) and (16), the chip temperature can be expressed as
3.4. Total Power Consumption of Data Center
The cooling power in the data center depends on its heat load and performance efficiency. The COP of the cooling system in the data center can be expressed as
where is the IT equipment power in the data center, and is the cooling power.
In the present study, we adopt a simplified model to estimate the cooling power of the CRAC [32]. This model is widely accepted by many researchers [10,11,12,13,14]. The relationship is expressed as
The COP is related with the temperature of the supply air. In other words, increasing the temperature of the supply air will lead a higher COP.
In our study, the holistic power consumption of the data center consists of cooling power and IT equipment power, and the power consumed by ancillary facilities is not taken into account. Thus, the holistic power consumption in the data center is expressed as
where is given by . Because the server power model has considered the effect of leakage power, raising the supply temperature of the cooling system will increase the leakage power while reducing the cooling power.
3.5. Problem Statement and GA Optimization
In order to optimize the holistic power consumption of the data center, a constrained nonlinear optimization problem is formulated with the aim of finding the optimal workload allocation scheme and supply temperature. In the present study, the chip temperature is used to characterize the server’s thermal state to prevent the server from overheating or overcooling. We assume a data center houses n server chassis and each chassis contains the same number of identical servers. The server chassis are considered as thermal nodes, as described in Section 3.2. For simplicity, the computing workload is assigned among the servers in the same chassis uniformly. To keep the server running in a reliable thermal state, the chip temperature needs to be maintained below the critical threshold (e.g., 75 to 90 C [30,33]). In this study, we adopt C as the upper threshold of the chip temperature. Assuming the total amount of incoming workload is and the server utilization rate is linearly mapped to its workload, the optimization problem of minimizing the total power by the CTWA-MTP is defined as follows:
Here,
The minimization problem is based on two decision variables, the supply air temperature , and the task allocation vector, . Equation (20) enforces the total amount of running workload. Equation (21) constraints the temperature of the supply air to be in the operating range of the cooling system. Equation (22) guarantees that the servers are running in a reliable thermal state.
In the previous works, the GA approach [34] is widely used to solve the complex optimization problem. Here, we apply an integer-coded GA to find a near-optimal workload scheduling and supply air temperature. The chromosome of each solution is defined as a vector, . The holistic power consumption is used to characterize the fitness value of the solution:
Thus, the goal is to find a solution that has the minimum holistic power consumption. We suppose that each generation has 200 solutions. The initial populations are generated by allocating the workload to each chassis node equally. The GA optimization approach performed in MATLAB is described in Algorithm 1.
| Algorithm 1: Minimizing the total power consumption using a genetic algorithm approach. |
 |
For the purpose of achieving the global optimum by iteration, the best individual in the current population is passed directly to the next generation.
4. Case Study
4.1. Simulation and Parameter Setup
For the purpose of evaluating the performance of our method in reducing the holistic power consumption of a data center for a given workload, we performed the optimization strategy at a typical air-cooled data center built with the ANSYS 14.5 software. The layout of the data center is presented in Figure 3. The length and width were 8.1 and 6 m, respectively. The sample data center adopted the raised floor structure, and the height of the plenum was 0.8 m. The ceiling was 3 m above the top of the plenum. Twelve server racks were symmetrically arranged in two rows, forming a cold aisle. The single CRAC was placed near the left wall. The height of the server rack and the CRAC was 2 m. In the cold aisle, the perforated tiles were located under the intake faces of the server racks. The side length of the perforated tile was 0.6 m. Both the cold aisle and the hot aisle adopted an open structure. We assumed each rack included six identical server chassis. The required airflow rate of each server chassis was 0.226 . The CRAC supplied a constant flow rate (16.24 ) of cold air, and the supply temperature was set at 15 C. In order to supply the cold air uniformly in the data center, each perforated tile was considered to be 25% open. The pressure drop () caused by perforated tile could be estimated as below:
where V denotes the velocity of the airflow, denotes the density of air and K is a gain factor that characterizes the flow resistance of the perforated tiles. For the 25% open perforated tiles used in present study, the flow resistance factor was given by . The geometry model of this data center was constructed with Gambit 2.4.6 and was meshed with hexahedral volumes.
For the Ansys calculation of the computational domain, the fluid was assumed as an incompressible ideal gas with the properties shown in Table 1. The buoyancy effect in the computational domain was approximated with a Boussinesq model. The convergence criteria for the Ansys calculation were set to the maximum errors, which were less than . To compromise between the computing resource and the simulation accuracy, the optimum mesh contained 120,072 grid points in this study.
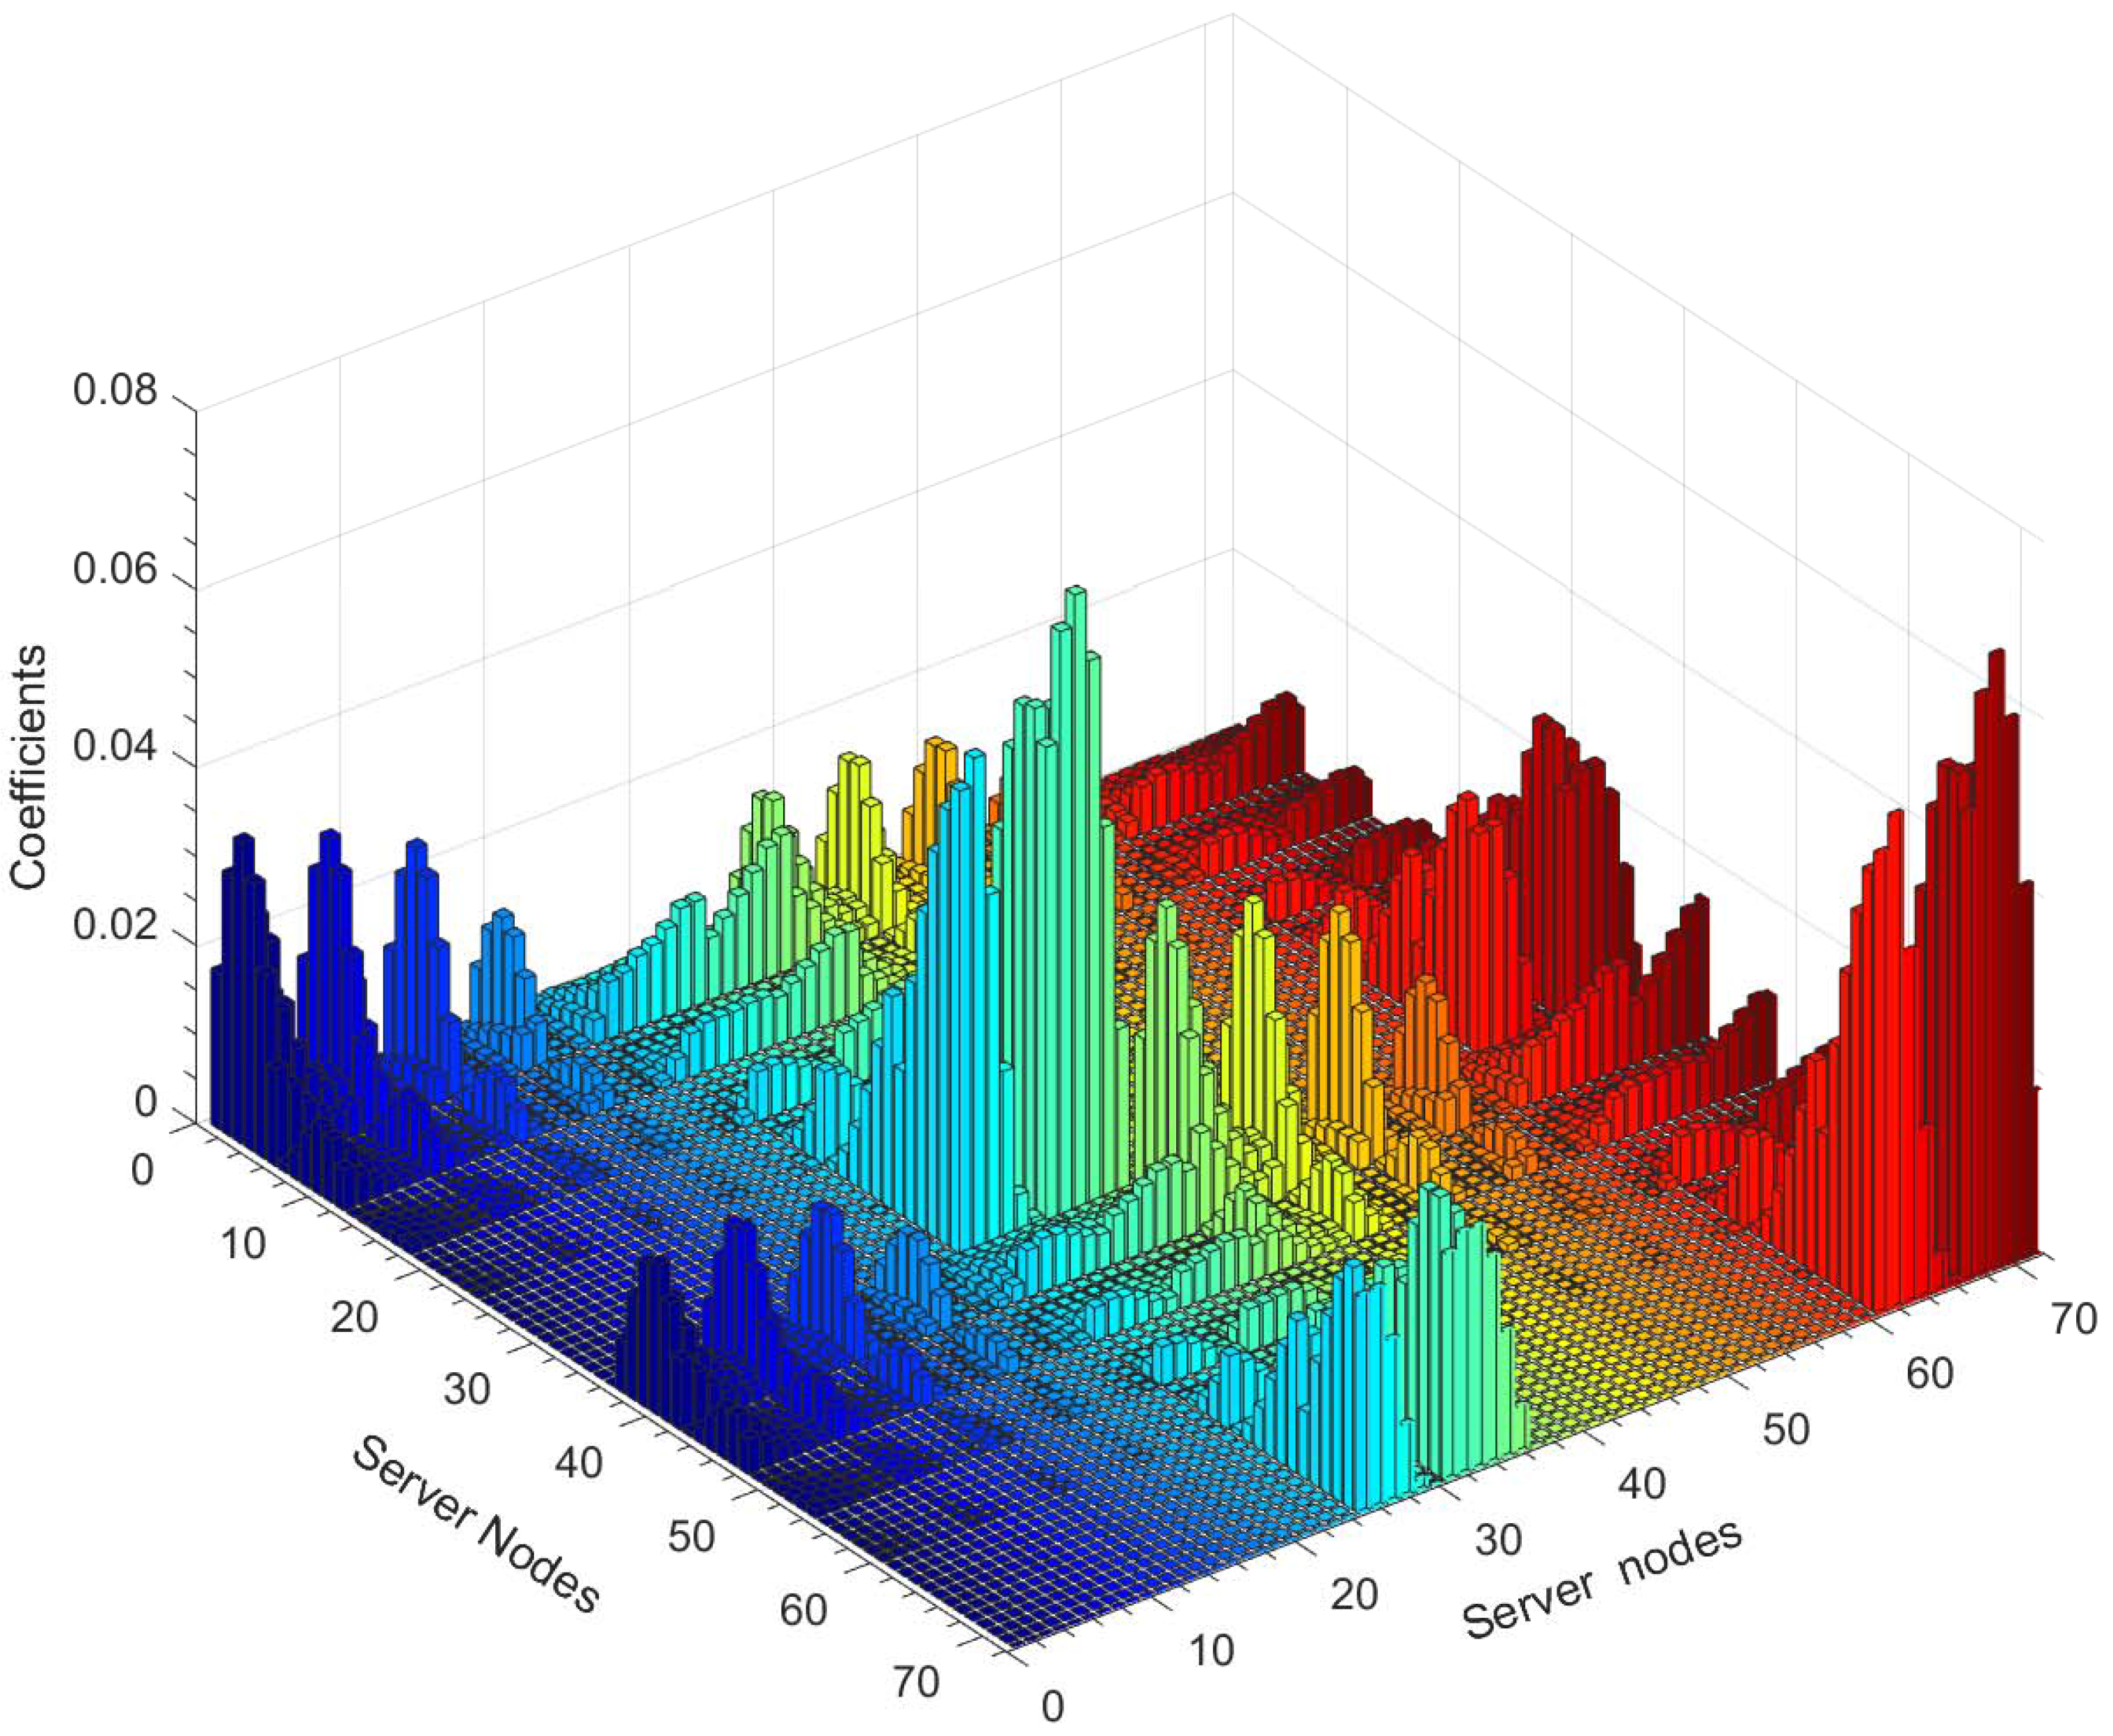
In order to use the cross-interference coefficients to characterize the heat recirculation ratio among the server chassis, virtual tracers were introduced in the CFD simulation [35,36]. We added the virtual tracers at the outlet of each server chassis. The air recirculation ratio could be calculated by measuring the concentrations of these tracers at each server inlet. The cross-interference matrix obtained by CFD simulation is shown in Figure 4. Because the cross-interference coefficient among the server chassis is determined by the geometry layout, the matrix is calculated once for a data center.
In this work, the servers were housed in 72 chassis in the data center to handle the incoming workload. A typical server in idle state consumes nearly 50% of its nominal power [37]. According to the field measurement data in [30], the power consumption of server (W) is given by the function of utilization rate and chip temperature (C):
We assume 30 servers in a chassis that run at the same utilization rate. For simplicity, the servers in the same chassis are seen as a holistic node with the same chip temperature. Thus the power consumption of node i is given by
This implies that the server chassis has a peak power of 3.6 kW at the worst temperature condition. For the server chassis that had a fixed airflow rate in this study, the thermal resistance of the node was approximated as a constant. We assumed that the inlet temperature reached the upper limit () of the guidelines provided by American Society of Heating Refrigeration and Air-conditioning (ASHRAE) [2] and that the chip temperature reached the threshold of our optimization problem () when the server was running in the busy state (u = 100%); thus the thermal resistance was set to according to Equation (14). In the present study, we assumed that the server chassis at the corresponding location in each row had the same amount of workload. The utilization rate of the server was discretized as . The supply temperature of the CRAC was discretized as .
In order to evaluate the effectiveness of the CTWA-MTP algorithm, the optimization approach was performed on the sample data center for different utilizations. The data center utilization rates in the present study were equal to 50%, 60%, 70%, 80%, or 90%. For comparison, two other workload scheduling algorithms were performed for the same utilization rate:
- Modified Uniform Task (MUT): MUT assigns an equal amount of workload to each node. The goal of the MUT algorithm in this paper was to maximize the supply temperature while keeping the peak chip temperature below the threshold ().
- Minimizing the Peak Inlet Temperature through Task Assignment (MPIT-TA): This is a proactive scheduling algorithm that maximizes the supply temperature of teh cooling system through optimizing the workload allocation among servers with respect to the inlet temperature constraint, consequently achieving cooling energy saving. The threshold of the inlet temperature was set to according to the guidelines of ASHRAE [2].
The MPIT-TA and MUT algorithms in this paper have taken into account the effects of temperature-dependent leakage power.
4.2. Evaluation of Total Power Consumption
Figure 5 shows the power consumption profile of the data center with different utilizations. We observe that the CTWA-MTP consistently had the minimal total power consumption and the maximum supply temperature. In addition, MPIT-TA had the worst energy efficiency and the lowest supply temperature under all of the utilizations. Figure 5 also shows that the supply temperatures of the CTWA-MTP, MUT and MPIT-TA increased as the data center utilization decreased, but that the supply temperature of MPIT-TA did not further increase when the data center utilization was below 70%. This was because the static power of the server made the MPIT-TA algorithm unable to further minimize the peak inlet temperature when the data center was running at low utilization. Figure 5 shows that the workload allocation strategy achieved a lower total power consumption with higher IT equipment power; this means the increment in the IT equipment power cannot counteract the saving of cooling power. We observe that the total power of MUT was higher than for CTWA-MTP and was lower than for MPIT-TA; this implies that the performance of the workload allocation methods based on the chip temperature, such as MUT and the CTWA-MTP, is better than that of the workload allocation methods based on the inlet temperature. Moreover, compared to MUT, the CTWA-MTP further improves the energy efficiency of data centers by optimizing the workload distribution among servers, particularly under high data center utilization.
4.3. Evaluation of Chip Temperature and Inlet Temperature
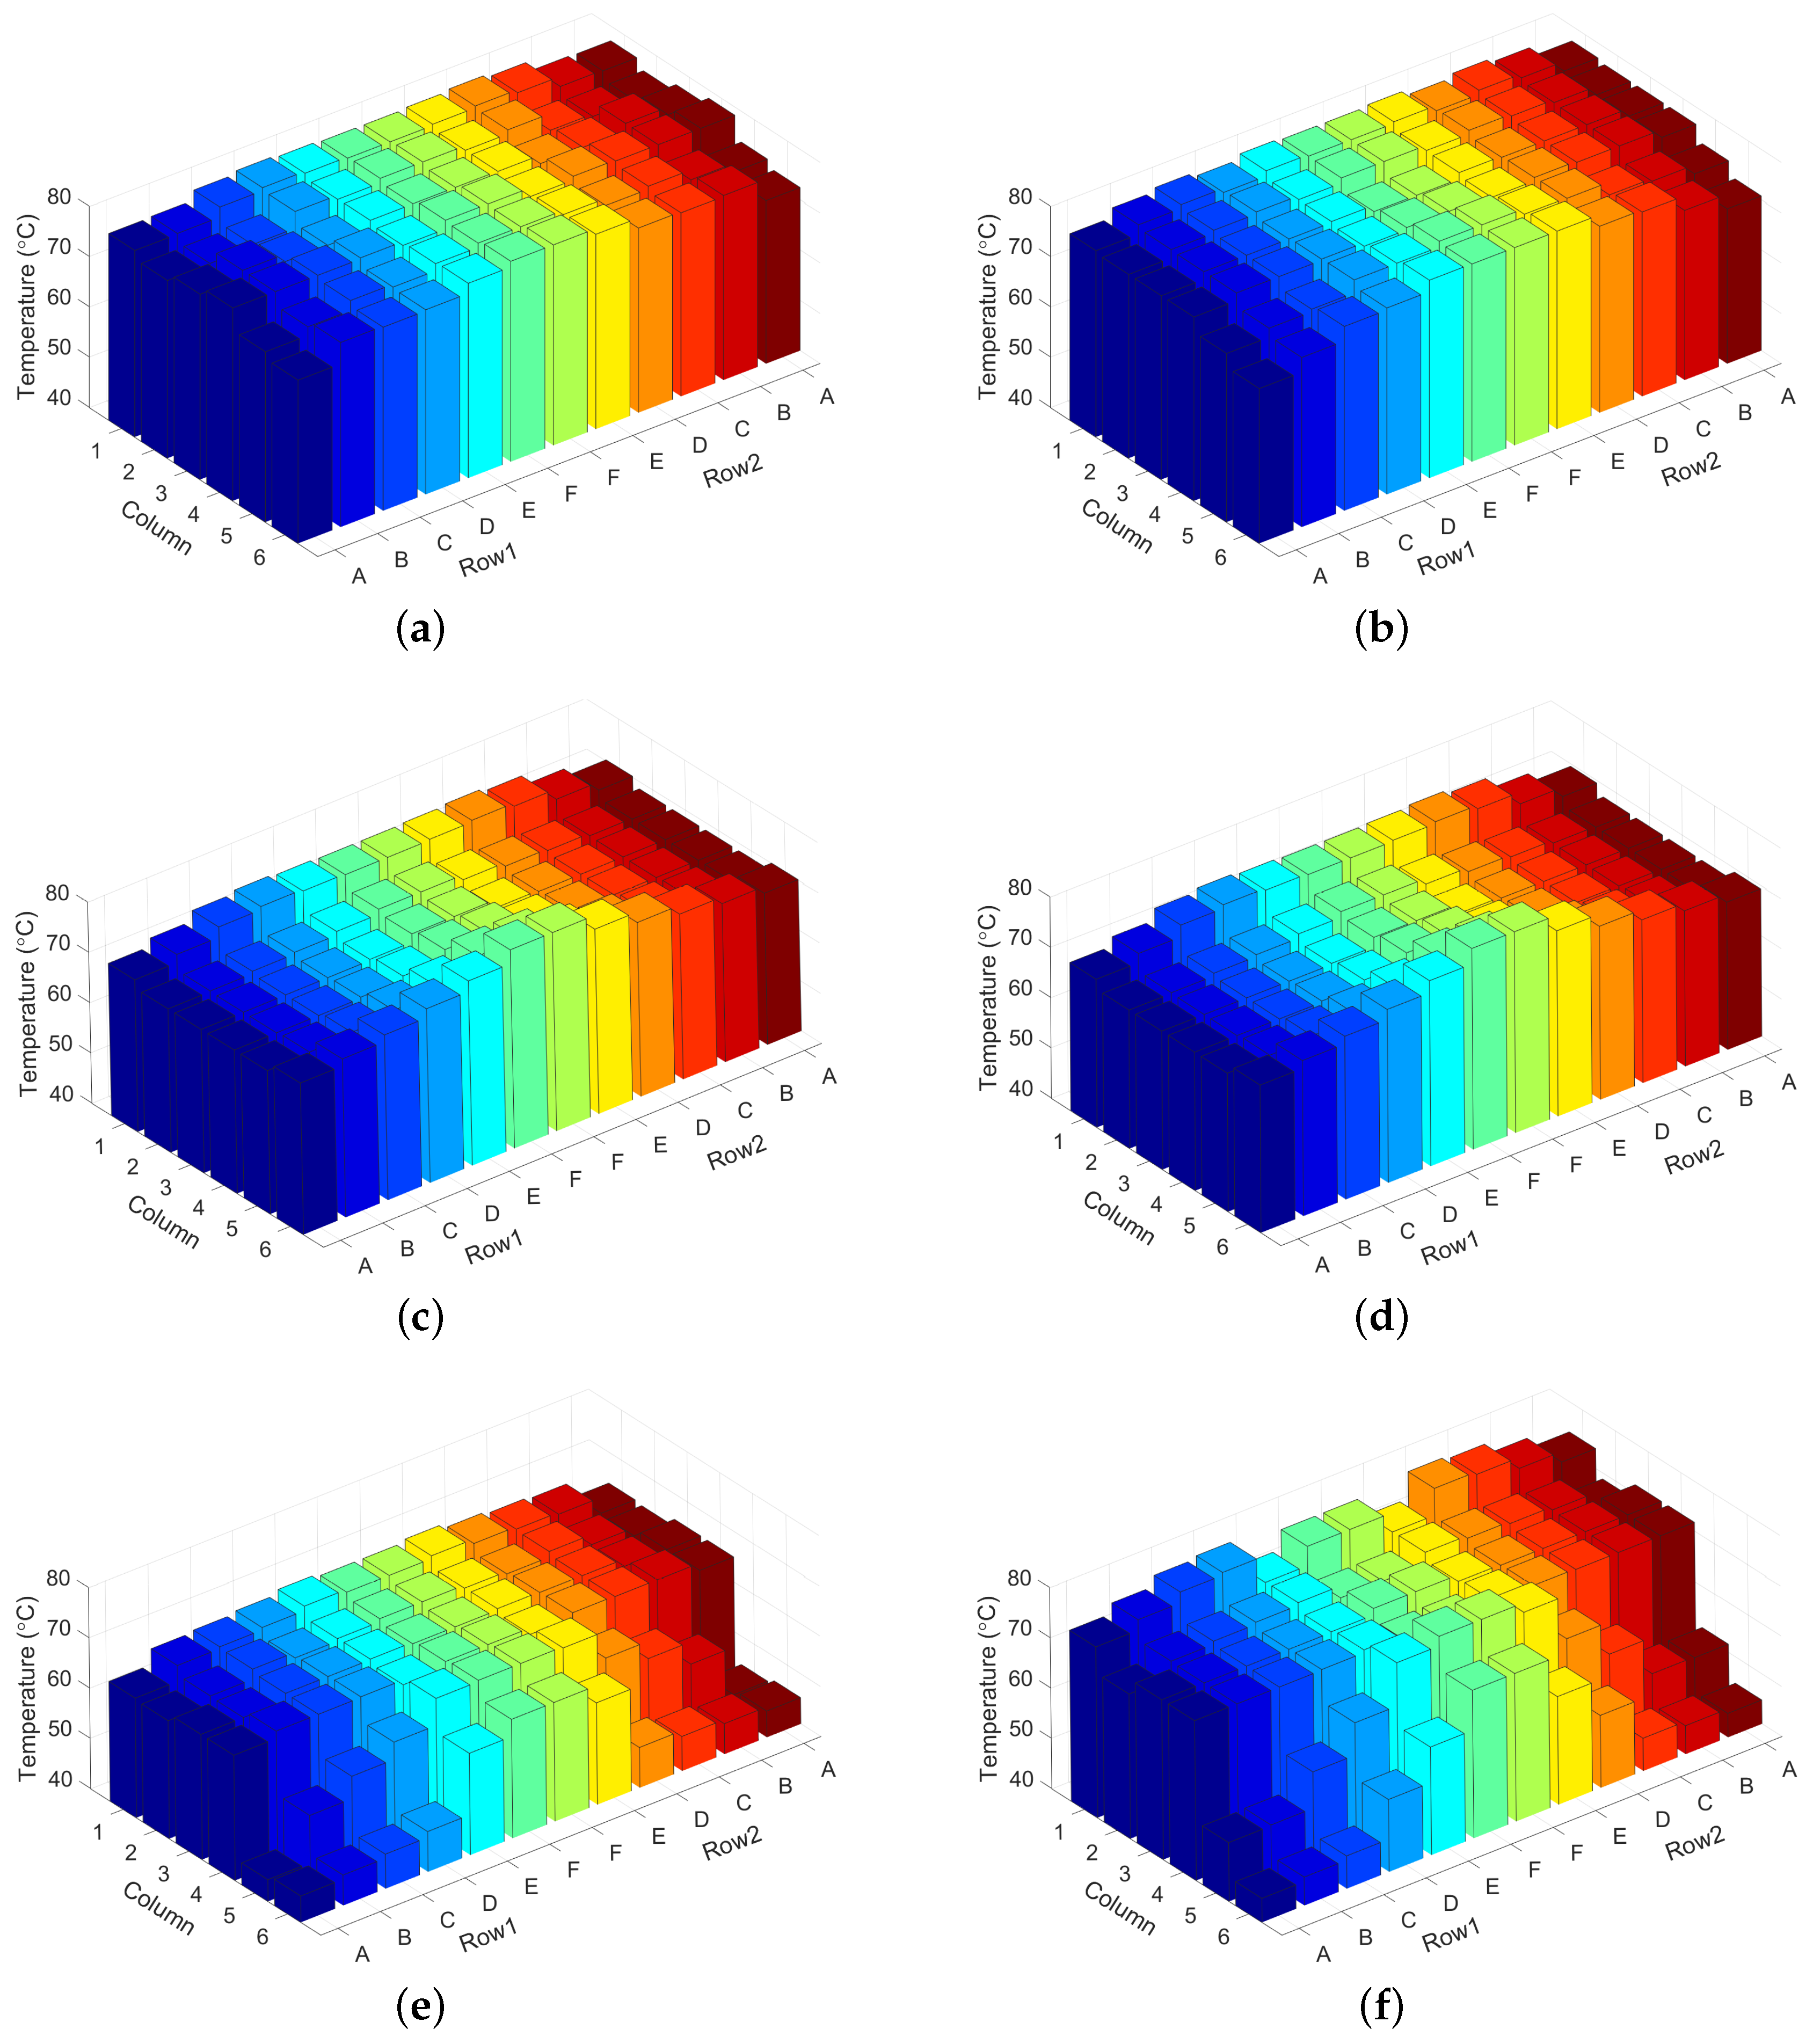
Figure 6 shows the chip temperature distributions achieved by different methods under 60% and 80% utilizations. The server racks in each row were numbered from 1 to 6; a rack with a smaller number was closer to the CRAC and that with a larger number was farther away from the CRAC. In each rack, the server chassis were numbered from A to F; chassis A was at the bottom and chassis F was at the top. Because the workload allocation was optimized with respect to the chip temperature, we could intuitively observe that the chip temperatures of the CTWA-MTP were higher and more uniform than those of MUT or MPIT-TA. For the chip temperature distribution of MUT as shown in Figure 6c,d, the chip temperatures of columns 1 and 6 were higher than others because of the heat recirculation. In comparison to the chip temperature distribution of the CTWA-MTP and MUT, the chip temperature of MPIT-TA was lower, particularly at the bottom of columns 5 and 6. This was because MPIT-TA tends to reduce the workload from the largest contributors of heat recirculation to keep the peak inlet temperature below the threshold, although the low utilization of the server allows for a higher inlet temperature.
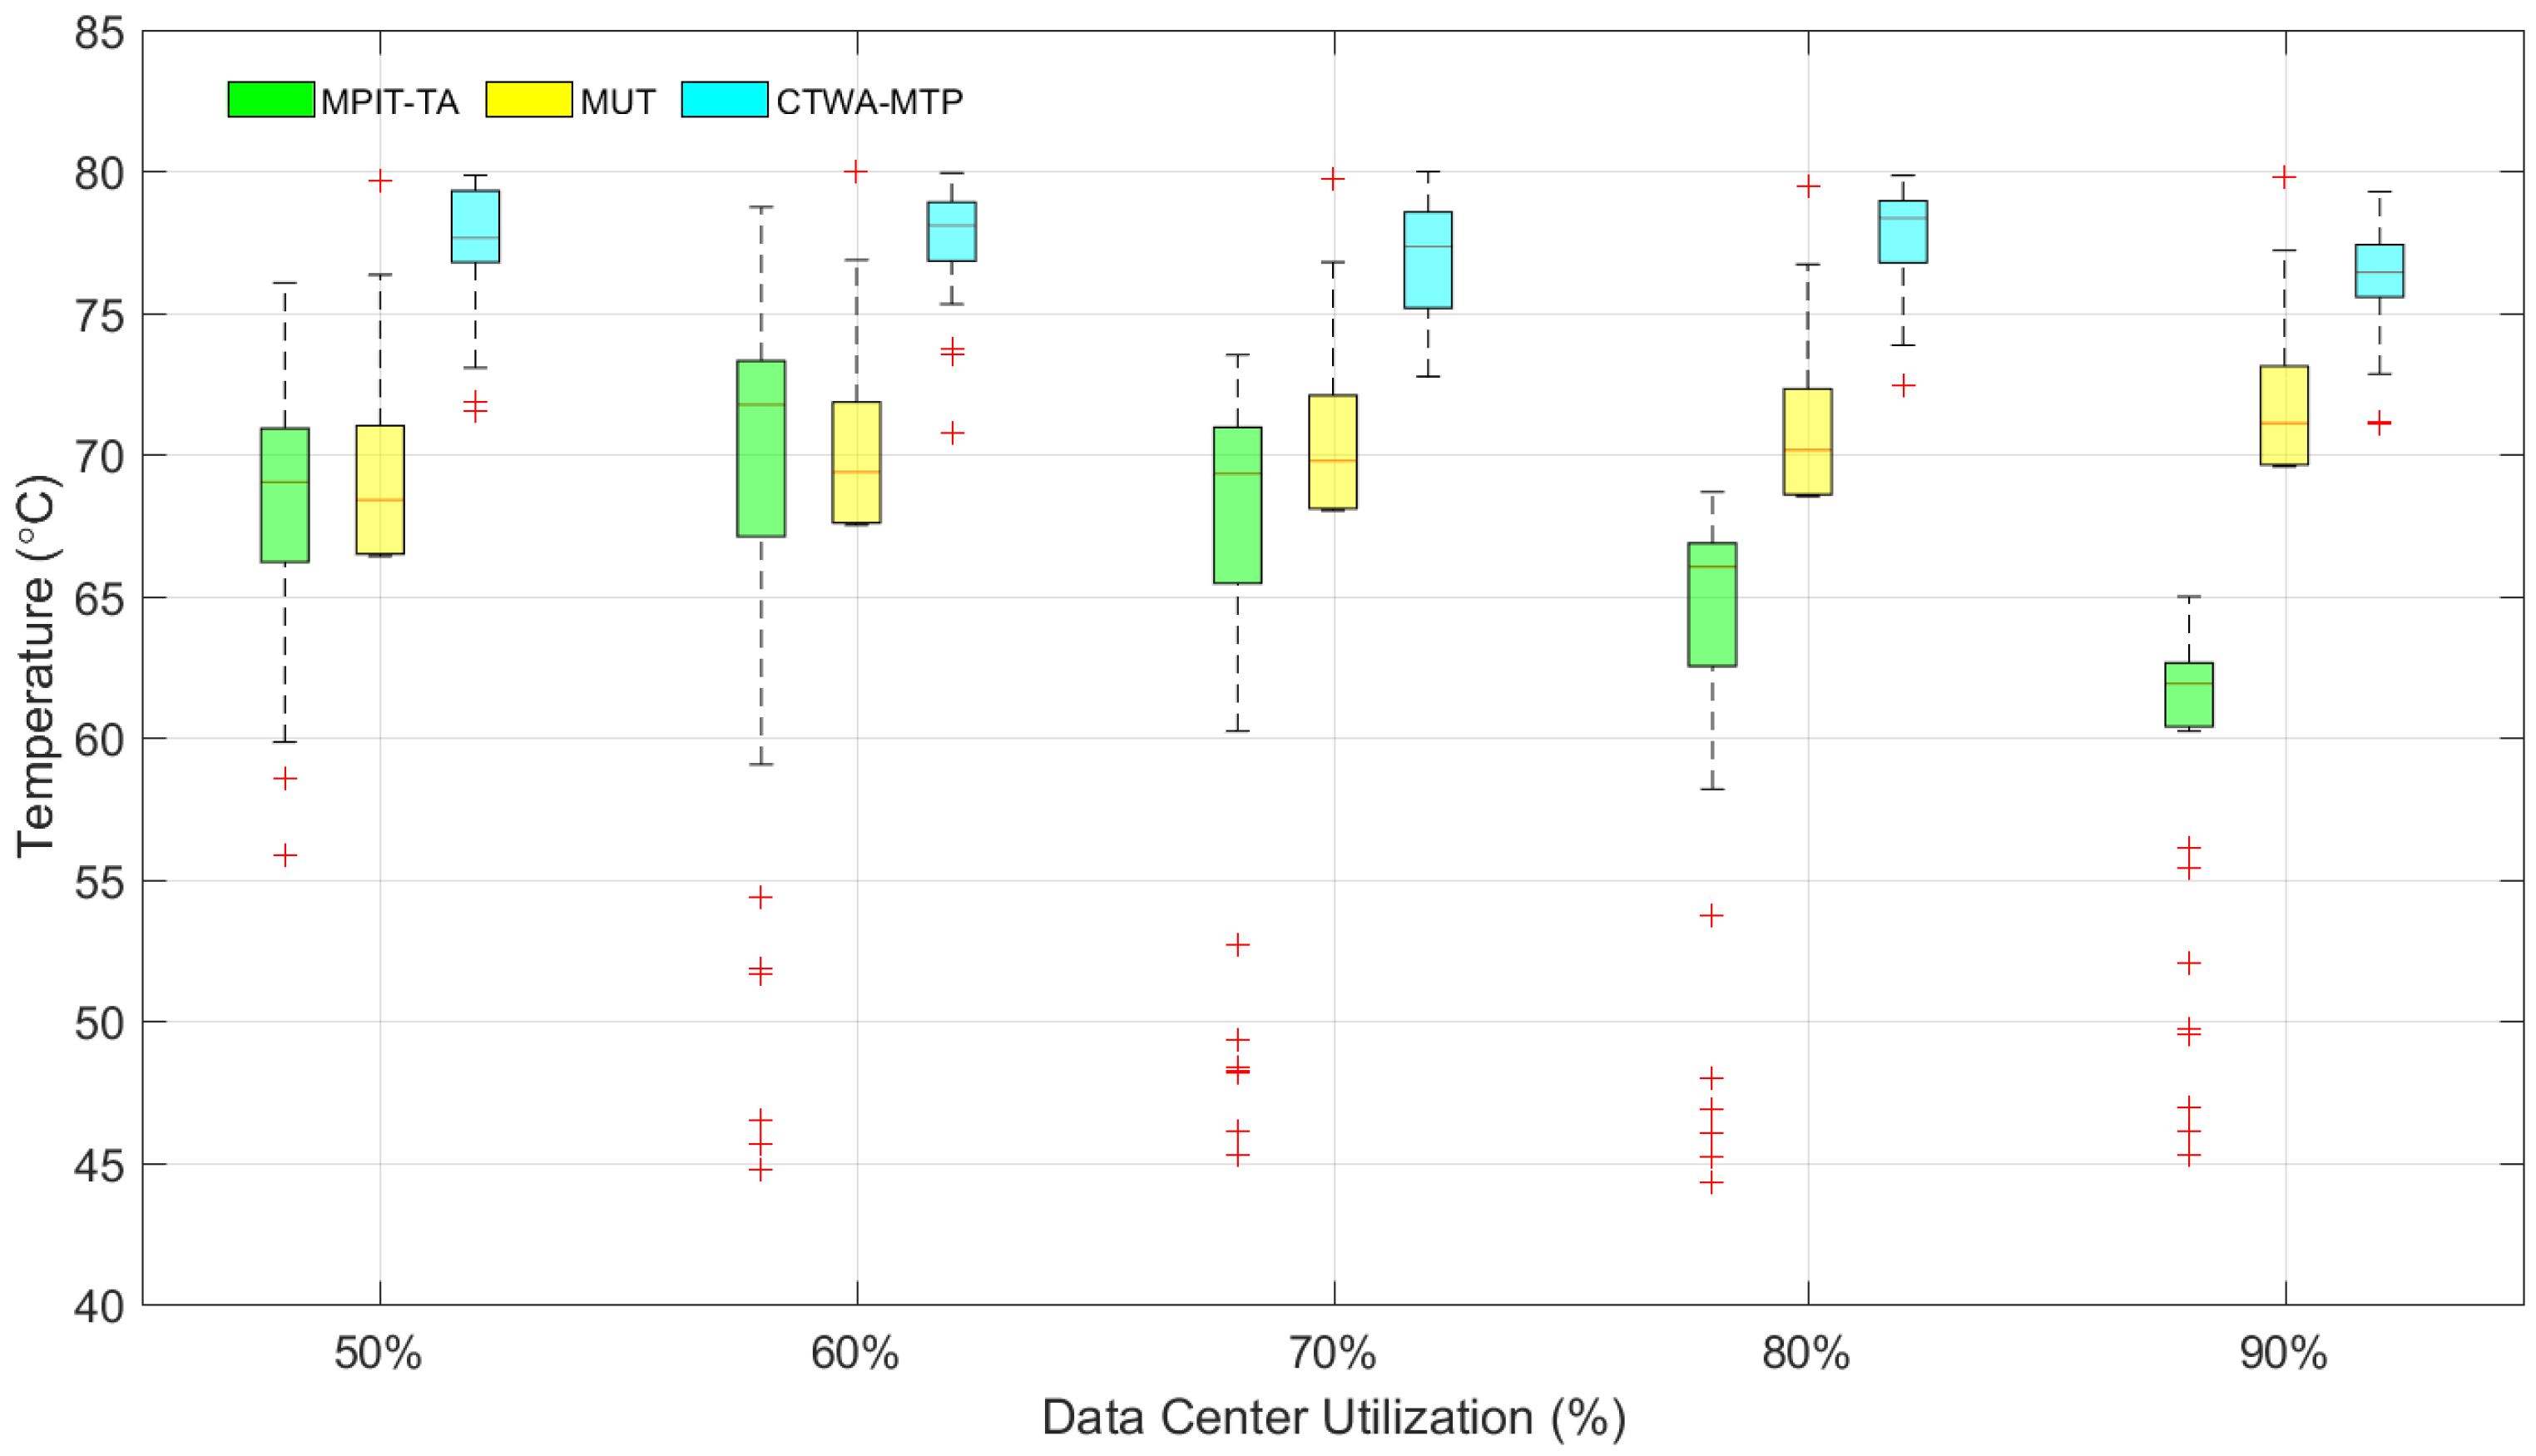
Figure 7 shows the boxplot of the chip temperature distributions under all of the utilizations. Boxplotting is a tool aimed at graphically illustrating some quantiles and the spread of a set of variables. We observe that the chip temperatures of MPIT-TA were spread over a large range, and some temperatures were far below the threshold, particularly in the case of high utilization (e.g., some chip temperatures of MPIT-TA were below 50 C, which means that the servers were overcooled). Compared with MPIT-TA, the chip temperature distributions achieved by MUT were mainly concentrated from 65 to 75 C, and the chip temperature distributions achieved by CTWA-MTP were concentrated from 75 to 80 C. This means that the CTWA-MTP prevents the servers from overcooling and makes full use of the cooling capacity of cold air. In addition, a higher chip temperature results in a higher leakage power; thus CTWA-MTP, MUT and MPIT-TA have different IT equipment power under the same utilization. The results contained in Figure 7 confirm the observation results shown in Figure 6.
In order to quantify the dispersion extent of chip temperatures, we have calculated the standard deviation for each case by the following definition:
where are the sample values, is the mean of sample values, and N is the number of samples.
The standard deviations of the chip temperature distributions are listed in Table 2. For all of the utilizations, CTWA-MTP had the minimum standard deviation, which indicates that the chip temperatures of CTWA-MTP were concentrated in a small range, while MPIT-TA had the maximum standard deviation, which means the chip temperatures of MPIT-TA were distributed over a larger range. The analysis of the standard deviation confirms the observation results obtained from Figure 7.
Figure 8 presents the inlet temperature distributions of the CTWA-MTP, MUT and MPIT-TA under 60% and 80% utilizations. We can observe that both CTWA-MTP and MUT allowed the inlet temperatures to exceed the threshold () while keeping the servers running in a reliable thermal state (). Figure 8 shows that the peak inlet temperatures of the CTWA-MTP under a 60% and 80% workload were 42.8 and 38.3 C, respectively. This means that the inlet temperature does not properly characterize the server’s thermal state and leads to an inefficient workload allocation strategy, as shown in Figure 6 and Figure 7.
4.4. Evaluation of Workload Allocation
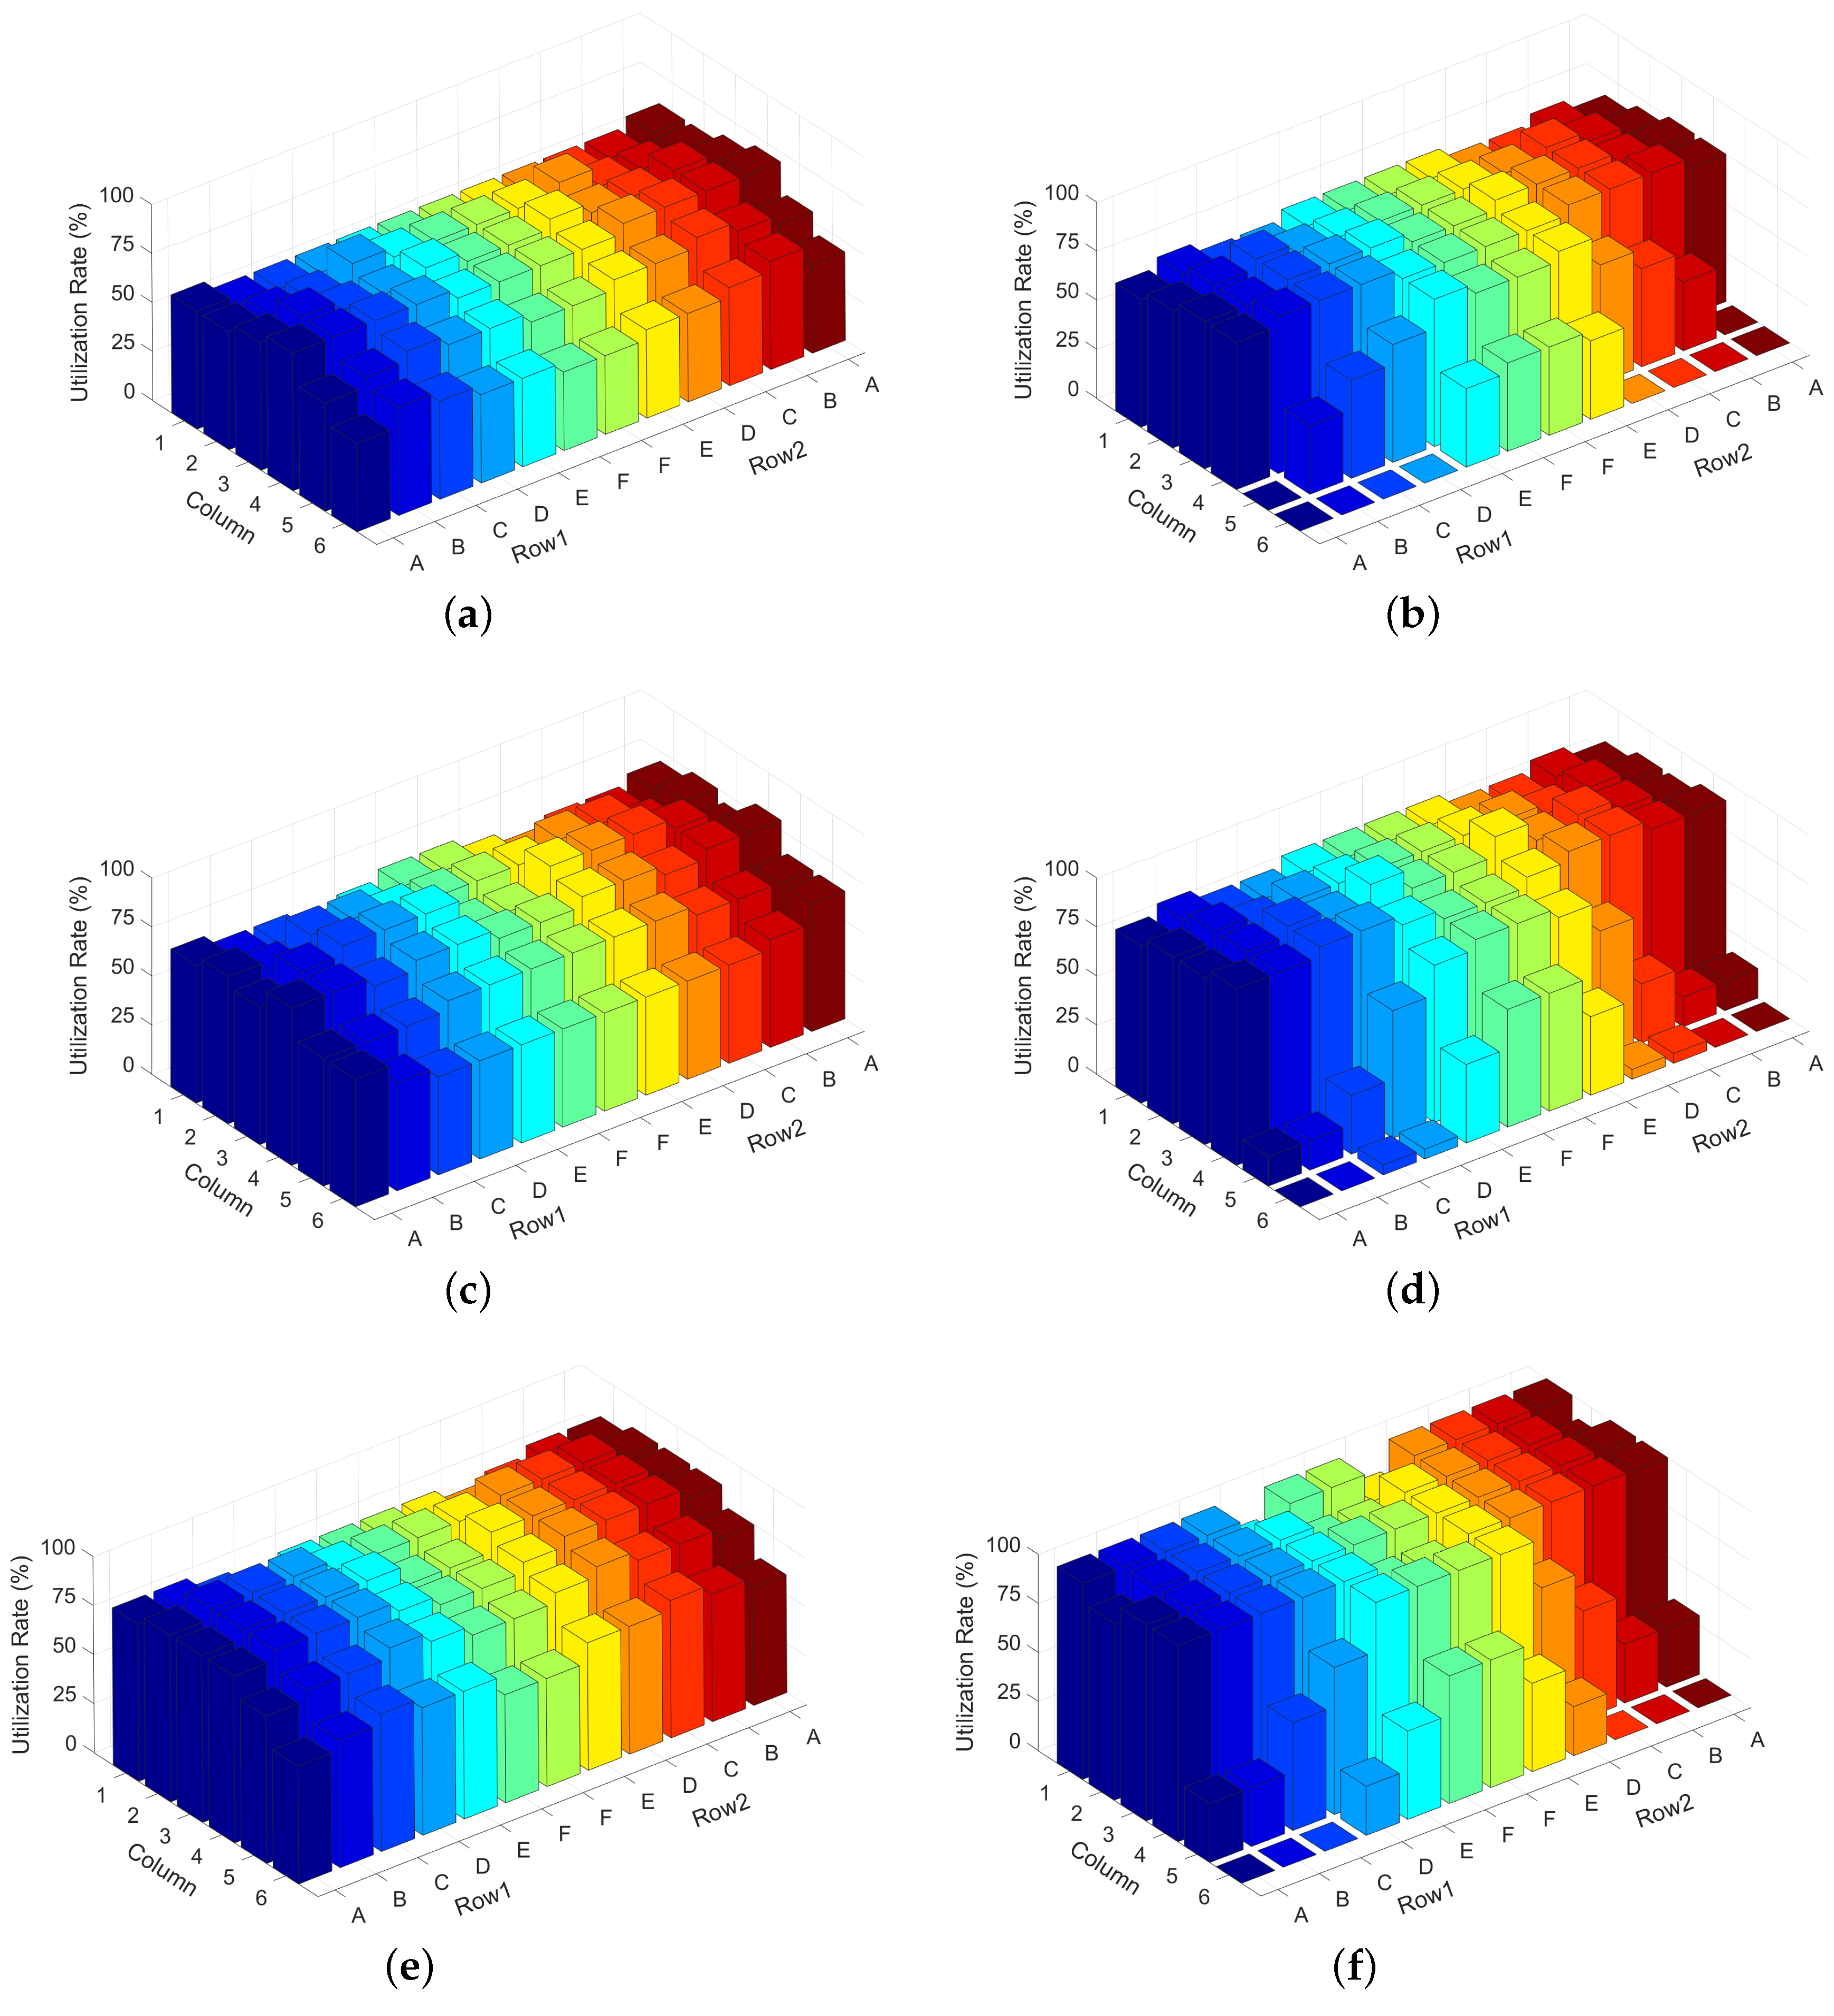
The task allocations of the CTWA-MTP and MPIT-TA under 60% to 80% utilizations are shown in Figure 9. We observe that the workload allocation strategies of CTWA-MTP and MPIT-TA showed different characteristics. As shown in Figure 9b,d,f, MPIT-TA tended to reduce the workload from the largest contributors of heat recirculation, which were located at the end of row and the bottom of rack. In particular, the servers located at the bottom of columns 5 and 6 were running in idle state when the data center utilization was below 80%. In contrast, MPIT-TA achieved a more uniform workload distribution, and it tended to reduce the workload from both the largest contributors of heat recirculation (e.g., the server located at the bottom of each rack) and the servers within the worst thermal environment (e.g., the server located at the top of column 6). The reason is that the CTWA-MTP takes into account the effect of both the inlet temperature and the workload on the thermal state of the server when optimizing the workload distribution. The server with the higher inlet temperature can maintain a reliable thermal state by reducing its workload directly, rather than by reducing its inlet temperature.
5. Conclusions
Currently, the existing knowledge of thermal management in data centers is mainly performed with respect to the server inlet temperature. In this paper, we present a chip temperature-based workload allocation strategy to minimize the holistic power consumption of the IT equipment and cooling system. Our method adopts an abstract heat-flow model and a thermal resistance model to predict the thermal environment in data centers. The temperature-dependent leakage power is also considered in our study. The workload allocation strategy is described as a constrained nonlinear optimization problem constrained by the thresholds of chip temperature, server utilization and the CRAC supply temperature. The proposed method was applied to a sample data center built with Ansys software. To evaluate the effectiveness of our method, we compare the optimization results with those of MPIT-TA and MUT. The result of this work shows that the chip temperature-based workload allocation strategy achieves a significant amount of energy saving and prevents the servers from overheating or overcooling.
In our work, we assumed that the server chassis and CRAC had a fixed airflow rate. One way this work can be extended is to take into account the effects of a variable airflow rate of the server and CRAC.
Acknowledgments
This work was supported by the Fundamental Research Funds for the Central Universities (2016XS41).
Author Contributions
Yan Bai contributed to the optimization problem design. Lijun Gu performed the designing of the model, the CFD simulation and the results’ analysis, and principally wrote this article.
Conflicts of Interest
The authors declare no conflict of interest. The founding sponsors had no role in the design of the study; in the collection, analyses, or interpretation of data; in the writing of the manuscript; or in the decision to publish the results.
References
- Masanet, E.R.; Brown, R.E.; Shehabi, A.; Koomey, J.G.; Nordman, B. Estimating the energy use and efficiency potential of U.S. data centers. Proc. IEEE 2011, 99, 1440–1453. [Google Scholar] [CrossRef]
- ASHRAE. Thermal Guidelines for Data Processing Environments-Expanded Data Center Classes and Usage Guidance; Whitepaper Prepared by ASHRAE Technical Committee (TC) 9.9; ASHRAE: Atlanta, GA, USA, 2011. [Google Scholar]
- Siriwardana, J.; Jayasekara, S.; Halgamuge, S.K. Potential of air-side economizers for data center cooling: A case study for key Australian cities. Appl. Energy 2013, 104, 207–219. [Google Scholar] [CrossRef]
- Greenberg, S.; Mills, E.; Tschudi, B.; Rumsey, P. Best practices for data centers: Lessons learned from benchmarking 22 data centers. In Proceedings of the ACEEE Summer Study on Energy Efficiency in Buildings, Pacific Grove, CA, USA, 13–18 August 2006; pp. 76–87. [Google Scholar] [CrossRef]
- Meijer, G.I. Cooling energy-hungry data centers. Science 2010, 328, 318–319. [Google Scholar] [CrossRef] [PubMed]
- Nada, S.A.; Said, M.A.; Rady, M.A. Numerical investigation and parametric study for thermal and energy management enhancements in data centers’ buildings. Appl. Therm. Eng. 2016, 98, 110–128. [Google Scholar] [CrossRef]
- Nagarathinam, S.; Fakhim, B.; Behnia, M.; Armfield, S. A comparison of parametric and multivariable optimization techniques in a raised-floor data center. J. Electron. Packag. 2013, 135, 030905. [Google Scholar] [CrossRef]
- Srinarayana, N.; Fakhim, B. Thermal performance of an air-cooled data center with raised-floor and non-raised-floor configurations. Heat Transf. Eng. 2014, 35, 384–397. [Google Scholar] [CrossRef]
- Tang, Q.; Gupta, S.K.S.; Stanzione, D.; Cayton, P. Thermal-Aware Task Scheduling to Minimize Energy Usage of Blade Server Based Datacenters. In Proceedings of the 2nd IEEE International Symposium on Dependable, Autonomic and Secure Computing, Indianapolis, IN, USA, 29 September–1 October 2006; pp. 195–202. [Google Scholar] [CrossRef]
- Tang, Q.; Gupta, S.K.S.; Varsamopoulos, G. Energy-efficient thermal-aware task scheduling for homogeneous high-performance computing data centers: A cyber-physical approach. IEEE Trans. Parallel Distrib. Syst. 2008, 19, 1458–1472. [Google Scholar] [CrossRef]
- Banerjee, A.; Mukherjee, T.; Varsamopoulos, G.; Gupta, S.K.S. Integrating cooling awareness with thermal aware workload placement for HPC data centers. Sustain. Comput. Inform. Syst. 2011, 1, 134–150. [Google Scholar] [CrossRef]
- Siriwardana, J.; Halgamuge, S.K.; Scherer, T.; Schott, W. Minimizing the thermal impact of computing equipment upgrades in data centers. Energy Build. 2012, 50, 81–92. [Google Scholar] [CrossRef]
- Meng, J.; Mccauley, S.; Kaplan, F.; Leung, V.J.; Coskun, A.K. Simulation and optimization of hpc job allocation for jointly reducing communication and cooling costs. Sustain. Comput. Inform. Syst. 2014, 6, 48–57. [Google Scholar] [CrossRef]
- Fang, Q.; Wang, J.; Gong, Q.; Song, M. Thermal-aware energy management of hpc data center via two-time-scale control. IEEE Trans. Ind. Inform. 2010, 13, 2260–2269. [Google Scholar] [CrossRef]
- Khalaj, A.H.; Scherer, T.; Siriwardana, J.; Halgamuge, S.K. Multi-objective efficiency enhancement using workload spreading in an operational data center. Appl. Energy 2015, 138, 432–444. [Google Scholar] [CrossRef]
- Lorenzi, F.D.; Vömel, C. Neural network-based prediction and control of air flow in a data center. J. Therm. Sci. Eng. Appl. 2012, 4, 021005. [Google Scholar] [CrossRef]
- Song, Z.; Murray, B.T.; Sammakia, B. Airflow and temperature distribution optimization in data centers using artificial neural networks. Int. J. Heat Mass Transf. 2013, 64, 80–90. [Google Scholar] [CrossRef]
- Samadiani, E.; Joshi, Y. Proper orthogonal decomposition for reduced order thermal modeling of air cooled data centers. J. Heat Transf. 2010, 132, 271–291. [Google Scholar] [CrossRef]
- Samadiani, E.; Amur, H.; Krishnan, B.; Joshi, Y.; Schwan, K. Coordinated optimization of cooling and it power in data centers. J. Electron. Packag. 2010, 132, 031006. [Google Scholar] [CrossRef]
- Samadiani, E.; Joshi, Y.; Allen, J.K.; Mistree, F. Adaptable robust design of multi-scale convective systems applied to energy efficient data centers. Numer. Heat Transf. A Appl. 2010, 57, 69–100. [Google Scholar] [CrossRef]
- Ghosh, R.; Joshi, Y. Rapid temperature predictions in data centers using multi-parameter proper orthogonal decomposition. Numer. Heat Transf. A Appl. 2014, 66, 41–63. [Google Scholar] [CrossRef]
- Joshi, Y. Reduced order thermal models of multi-Scale microsystems. J. Heat Transf. 2012, 134, 031008. [Google Scholar] [CrossRef]
- Demetriou, D.W.; Khalifa, H.E. Thermally aware, energy-based load placement in open-aisle, air-cooled data centers. J. Electron. Packag. 2013, 135, 030906. [Google Scholar] [CrossRef]
- Demetriou, D.W.; Khalifa, H.E. Expanded assessment of a practical thermally aware energy-optimized load placement strategy for open-aisle, air-cooled data centers. J. Electron. Packag. 2013, 135, 030907. [Google Scholar] [CrossRef]
- Fouladi, K.; Wemhoff, A.P.; Silva-Llanca, L.; Abbasi, K.; Ortega, A. Optimization of data center cooling efficiency using reduced order flow modeling within a flow network modeling approach. Appl. Therm. Eng. 2017, 124, 929–939. [Google Scholar] [CrossRef]
- Wan, J.; Gui, X.; Zhang, R.; Fu, L. Joint cooling and server control in data centers: A cross-layer framework for holistic energy minimization. IEEE Syst. J. 2017, 99, 1–12. [Google Scholar] [CrossRef]
- Hirokaw, T.; Hond, K.; Shibuy, T. Mercury and freon: Temperature emulation and management for server systems. ACM Sigplan Not. 2006, 41, 106–116. [Google Scholar] [CrossRef]
- Ranganathan, P.; Leech, P.; Irwin, D.; Chase, J. Ensemble-level Power Management for Dense Blade Servers. In Proceedings of the 33rd Annual International Symposium on Computer Architecture, Boston, MA, USA, 17–21 June 2006; Volume 34, pp. 66–77. [Google Scholar] [CrossRef]
- Liu, Y.; Dick, R.P.; Shang, L.; Yang, H. Accurate temperature-dependent integrated circuit leakage power estimation is easy. In Proceedings of the Conference on Design, Automation and Test in Europe, Nice, France, 16–20 April 2007; pp. 1526–1531. [Google Scholar] [CrossRef]
- Zapater, M.; Tuncer, O.; Ayala, J.L.; Moya, J.M.; Vaidyanathan, K.; Gross, K.; Coskun, A.K. Leakage-aware cooling management for improving server energy efficiency. IEEE Trans. Parallel Distrib. Syst. 2015, 26, 2764–2777. [Google Scholar] [CrossRef]
- Arroba, P.; Zapater, M.; Ayala, J.L.; Moya, J.M.; Olcoz, K.; Hermida, R. On the Leakage-Power modeling for optimal server operation. In Proceedings of the 24th Jornadas de Paralelismo, Madrid, Spain, 17–20 September 2013; pp. 240–244. [Google Scholar]
- Moore, J.; Chase, J.; Ranganathan, P.; Sharma, R. Making scheduling “Cool”: Temperature-aware workload placement in data centers. In Proceedings of the Annual Conference on USENIX Annual Technical Conference, Anaheim, CA, USA, 10–15 April 2005; pp. 61–75. [Google Scholar] [CrossRef]
- Ham, S.W.; Kim, M.H.; Choi, B.N.; Jeong, J.W. Simplified server model to simulate data center cooling energy consumption. Energy Build. 2015, 86, 328–339. [Google Scholar] [CrossRef]
- Konak, A.; Coit, D.W.; Smith, A.E. Multi-objective optimization using genetic algorithms: A tutorial. Reliab. Eng. Syst. Saf. 2006, 91, 992–1007. [Google Scholar] [CrossRef]
- Jayaraman, B.; Finlayson, E.U.; Sohn, M.D.; Thatcher, T.L.; Price, P.N.; Wood, E.E.; Sextro, R.G.; Gadgil, A.J. Tracer gas transport under mixed convection conditions in an experimental atrium: Comparison between experiments and cfd predictions. Atmos. Environ. 2006, 40, 5236–5250. [Google Scholar] [CrossRef]
- Bhagwat, H.; Singh, U.; Deodhar, A.; Singh, A.; Sivasubramaniam, A. Fast and accurate evaluation of cooling in data centers. J. Electron. Packag. 2014, 137, 011003. [Google Scholar] [CrossRef]
- Schall, D.; Harder, T. Energy-proportional query execution using a cluster of wimpy nodes. In Proceedings of the Ninth International Workshop on Data Management on New Hardware, New York, NY, USA, 22–27 June 2013; pp. 1–6. [Google Scholar] [CrossRef]
Figure 1.
Typical air cooling system in data centers.
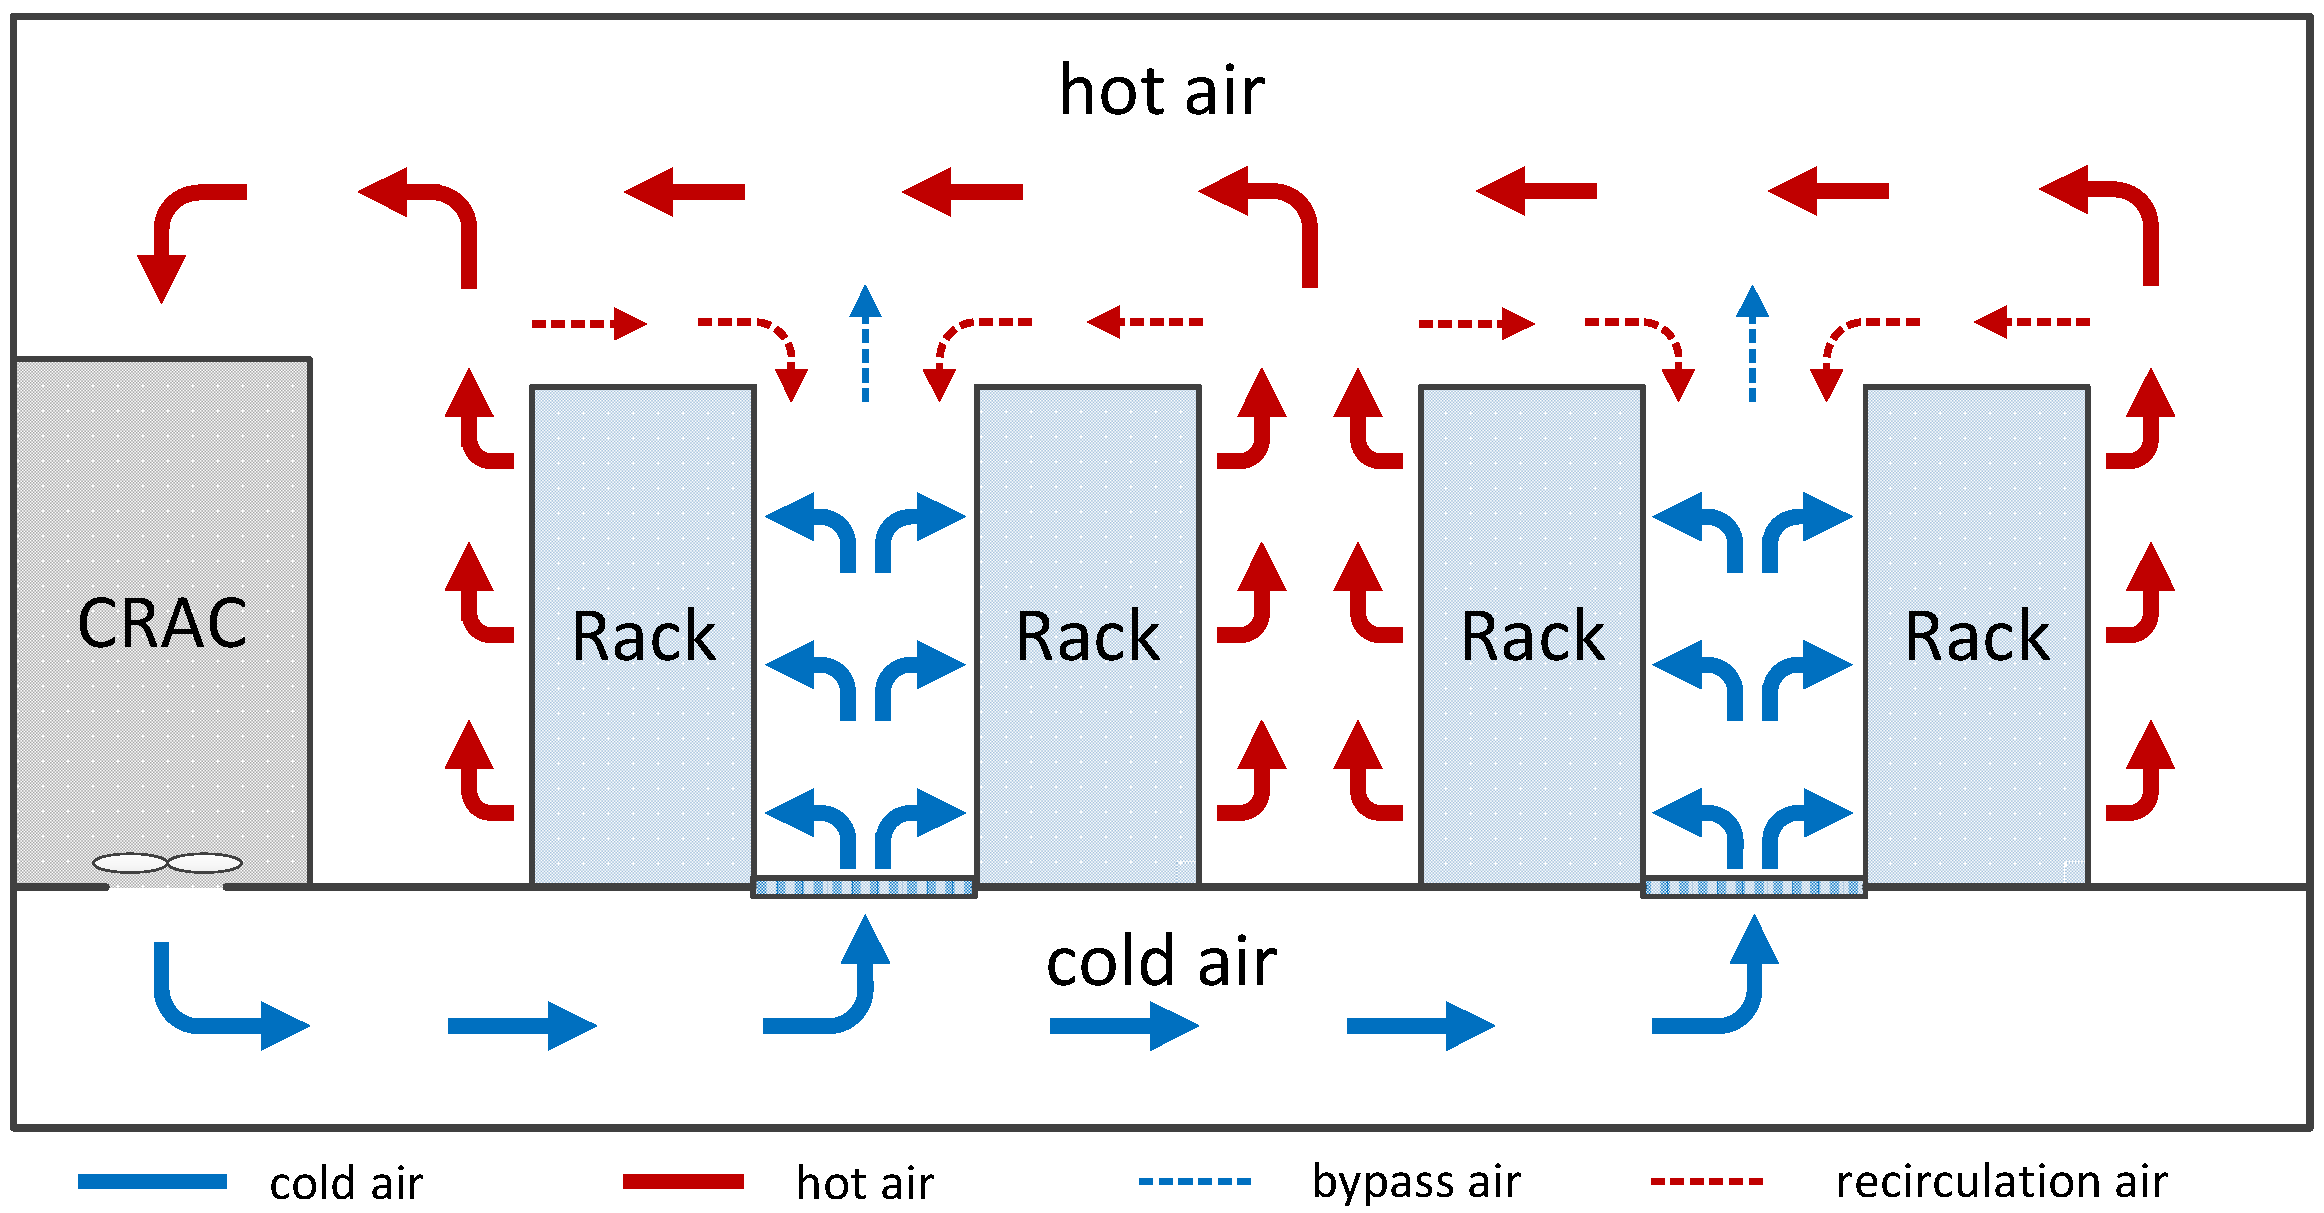
Figure 2.
Schematic of typical thermal cross-interference among equipment.

Figure 3.
Data center layout used in our study.
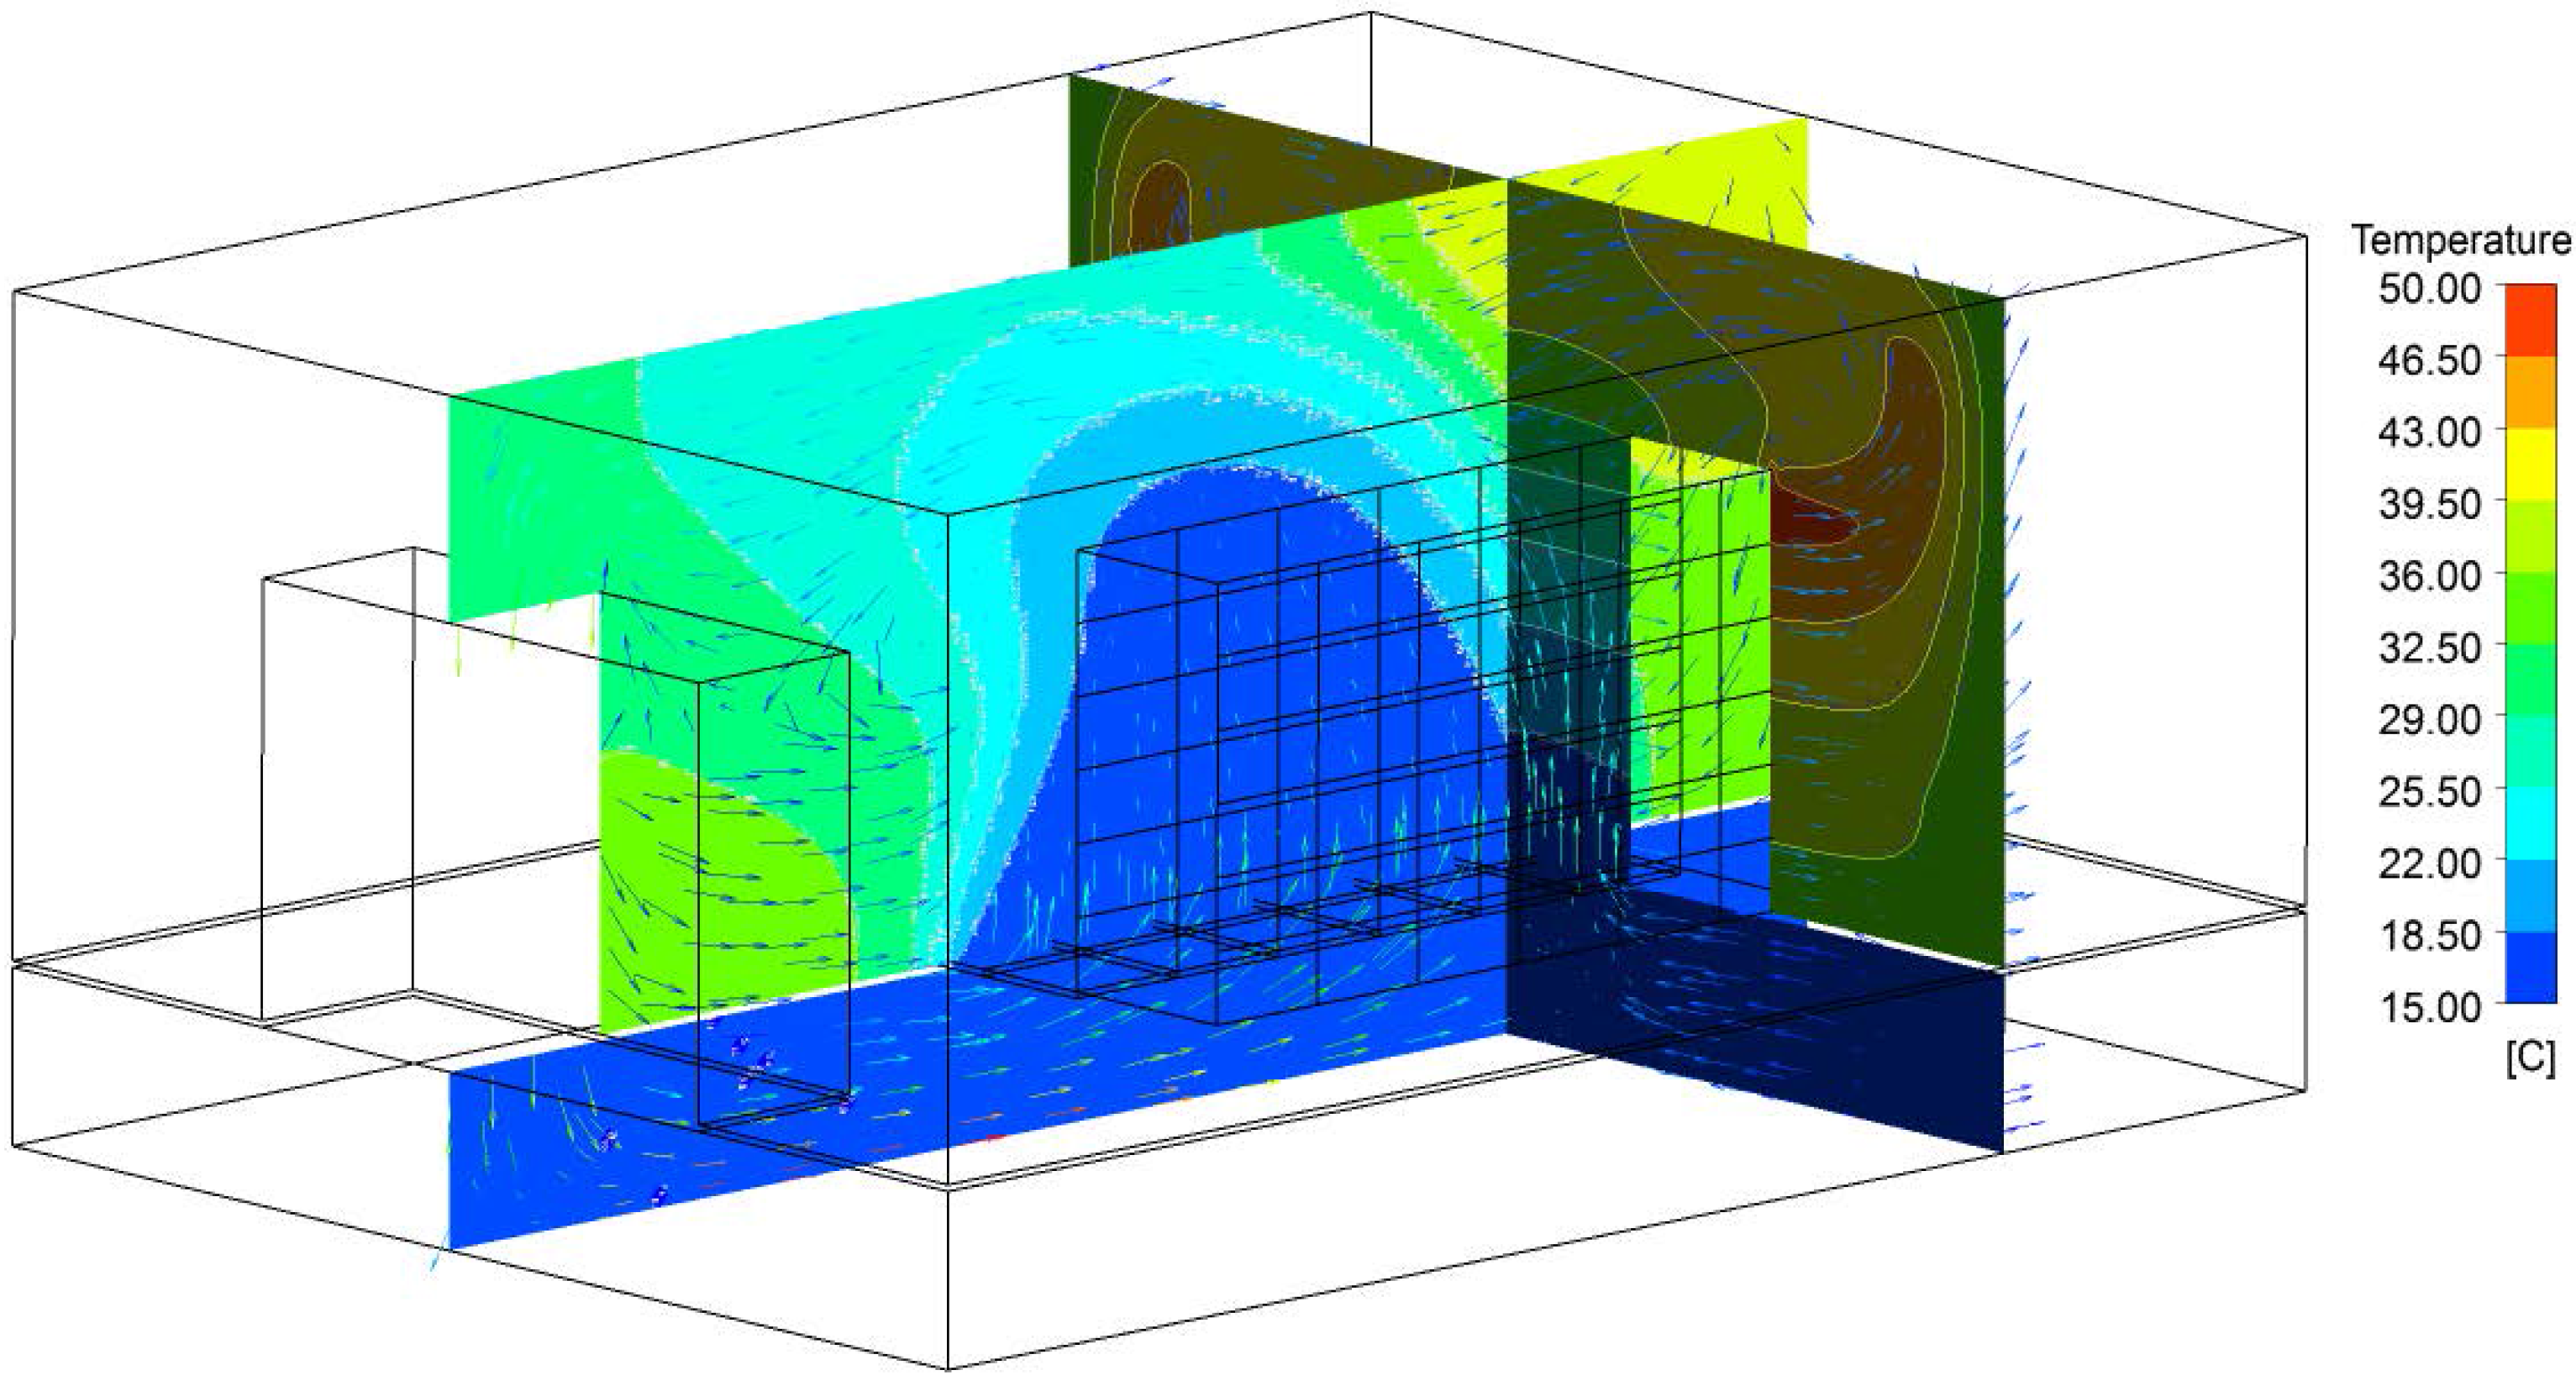
Figure 4.
Cross-interference matrix A obtained by computational fluid dynamics (CFD) simulations.
Figure 5.
Power consumption under different utilizations.
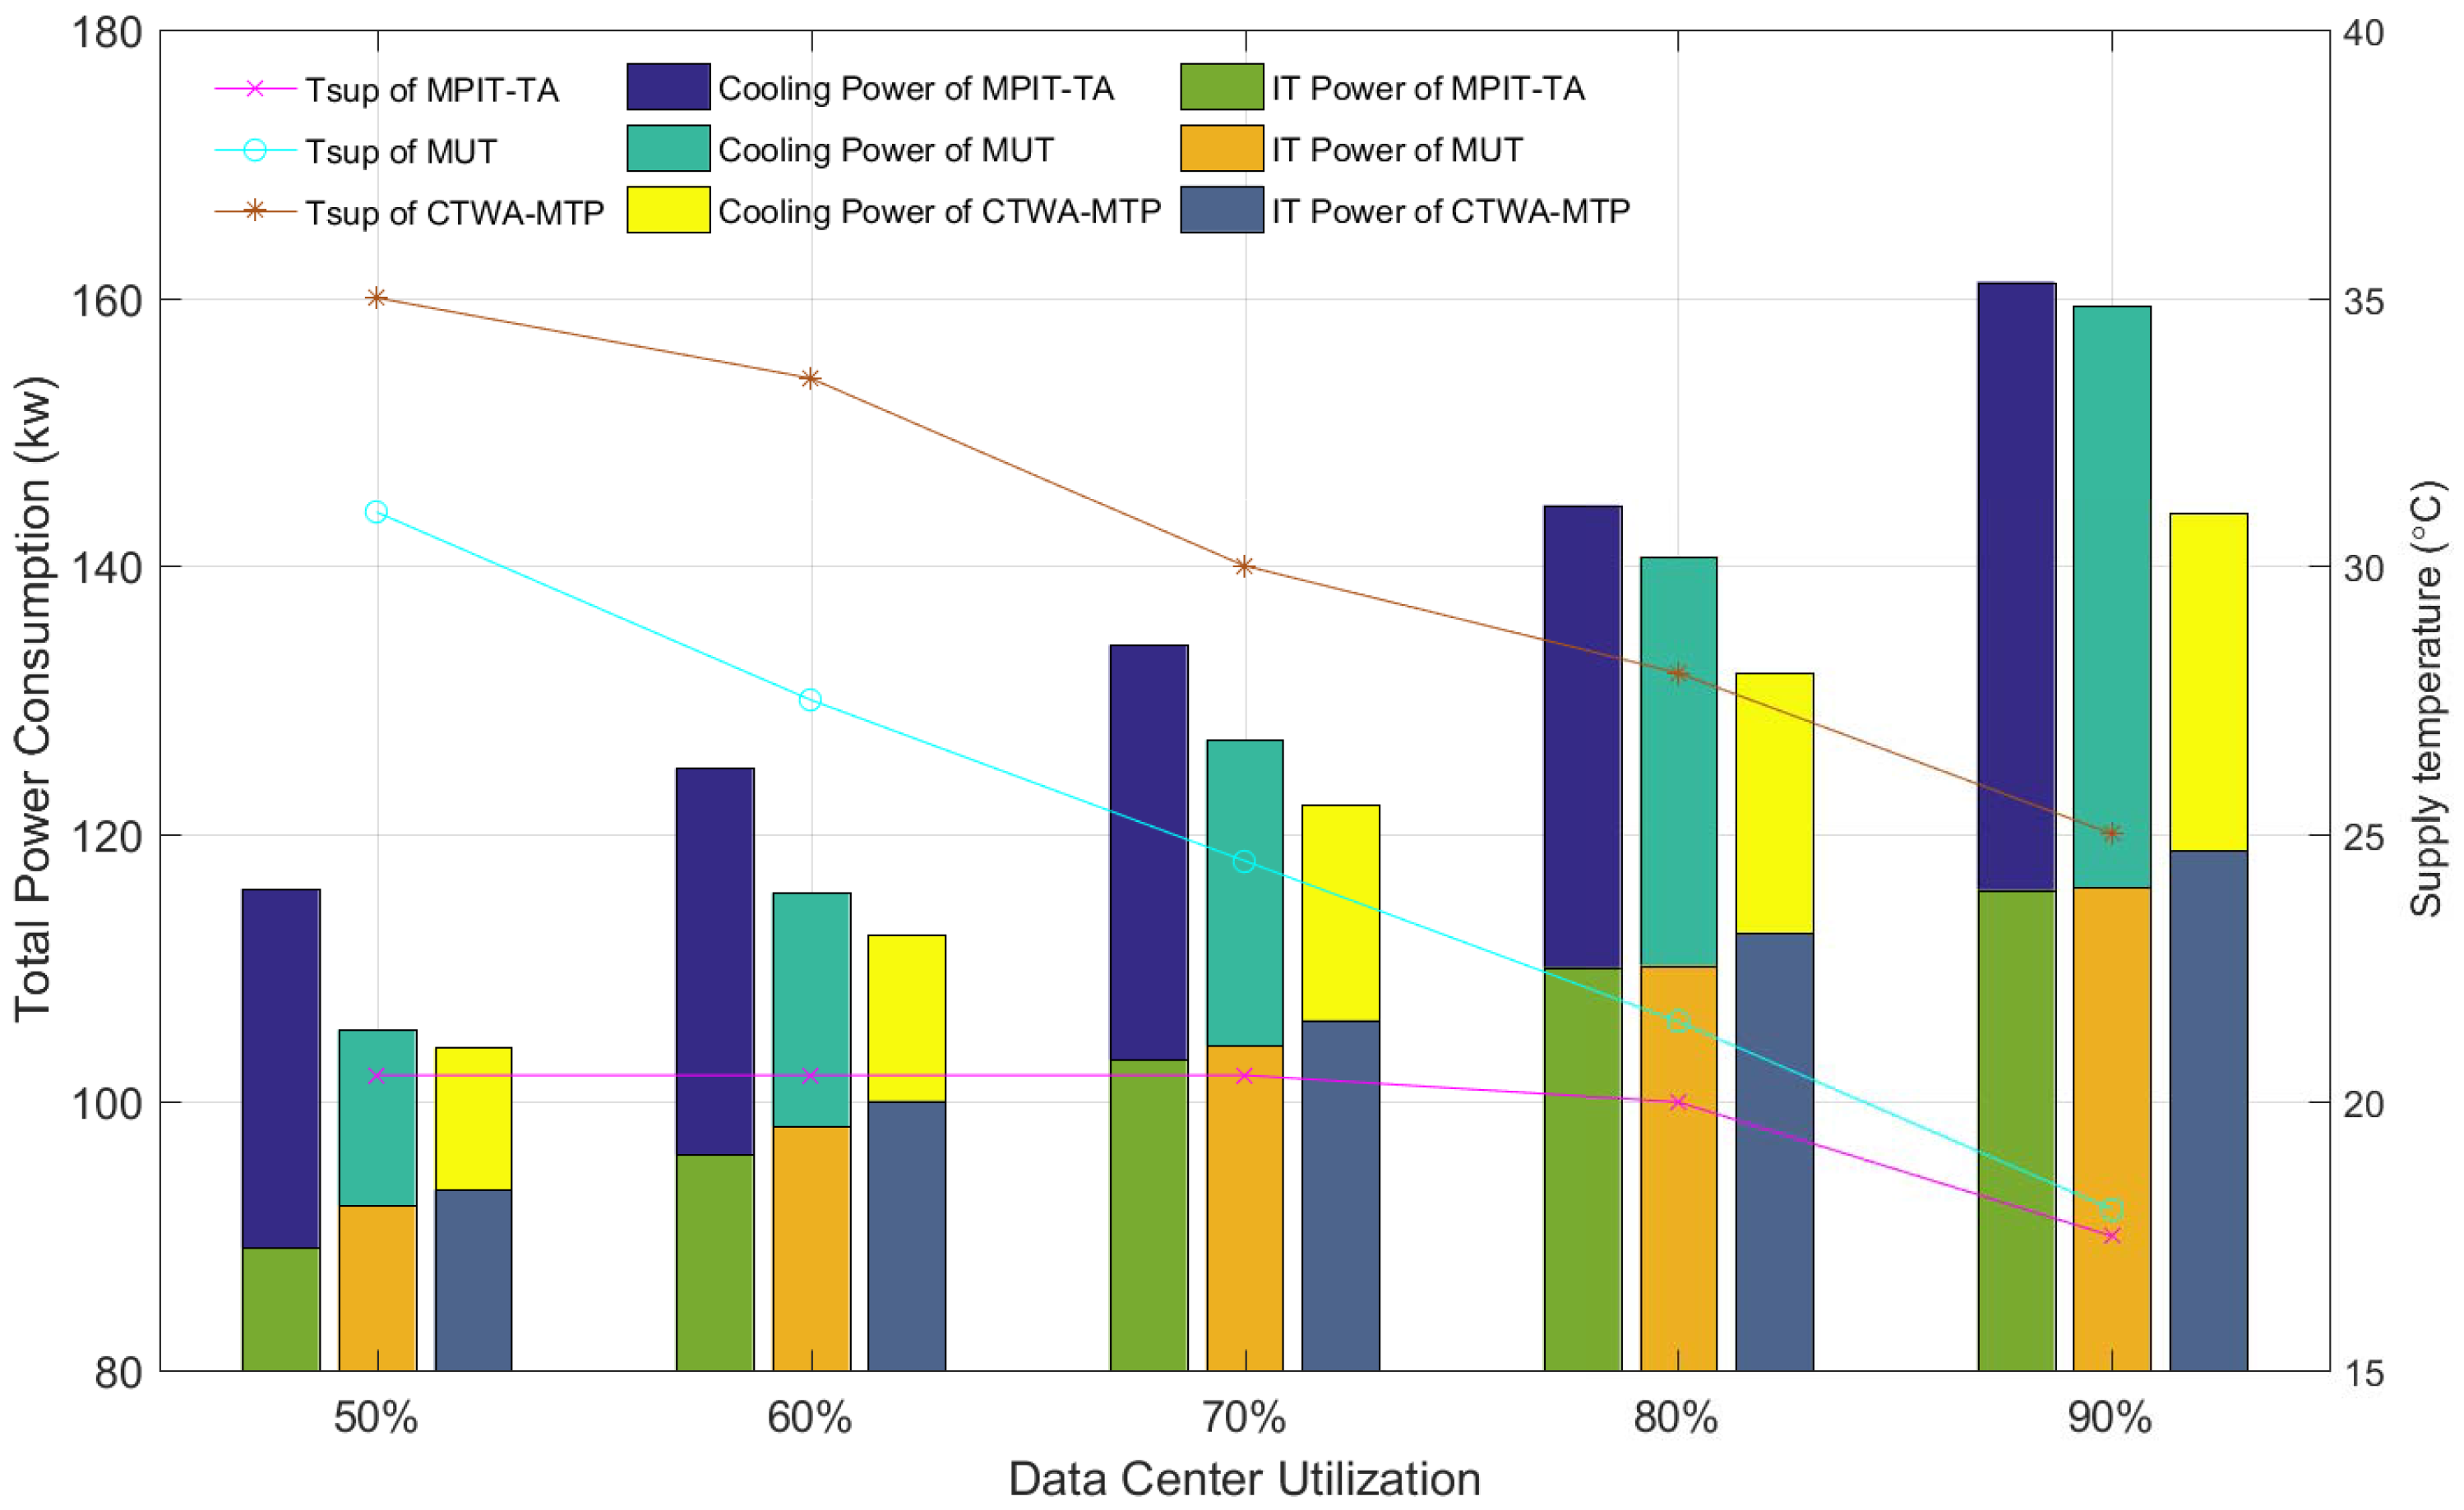
Figure 6.
Chip temperature distributions achieved by different methods. (a) Chip temperature distribution of chip temperature-based workload allocation strategy (CTWA-MTP) with 60% utilization. (b) Chip temperature distribution of CTWA-MTP with 80% utilization. (c) Chip temperature distribution of modified uniform task (MUT) with 60% utilization. (d) Chip temperature distribution of MUT with 80% utilization. (e) Chip temperature distribution of MPIT-TA with 60% utilization. (f) Chip temperature distribution of minimizing the peak inlet temperature through task assignment (MPIT-TA) with 80% utilization.
Figure 7.
Boxplot for chip temperature distributions with different data center utilizations.
Figure 8.
Inlet temperature distribution achieved by different methods. (a) Inlet temperature distribution of chip temperature-based workload allocation strategy (CTWA-MTP) with 60% utilization. (b) Inlet temperature distribution of CTWA-MTP with 80% utilization. (c) Inlet temperature distribution of modified uniform task (MUT) with 60% utilization. (d) Inlet temperature distribution of MUT with 80% utilization. (e) Inlet temperature distribution of minimizing the peak inlet temperature through task assignment (MPIT-TA) with 60% utilization. (f) Inlet temperature distribution of MPIT-TA with 80% utilization.
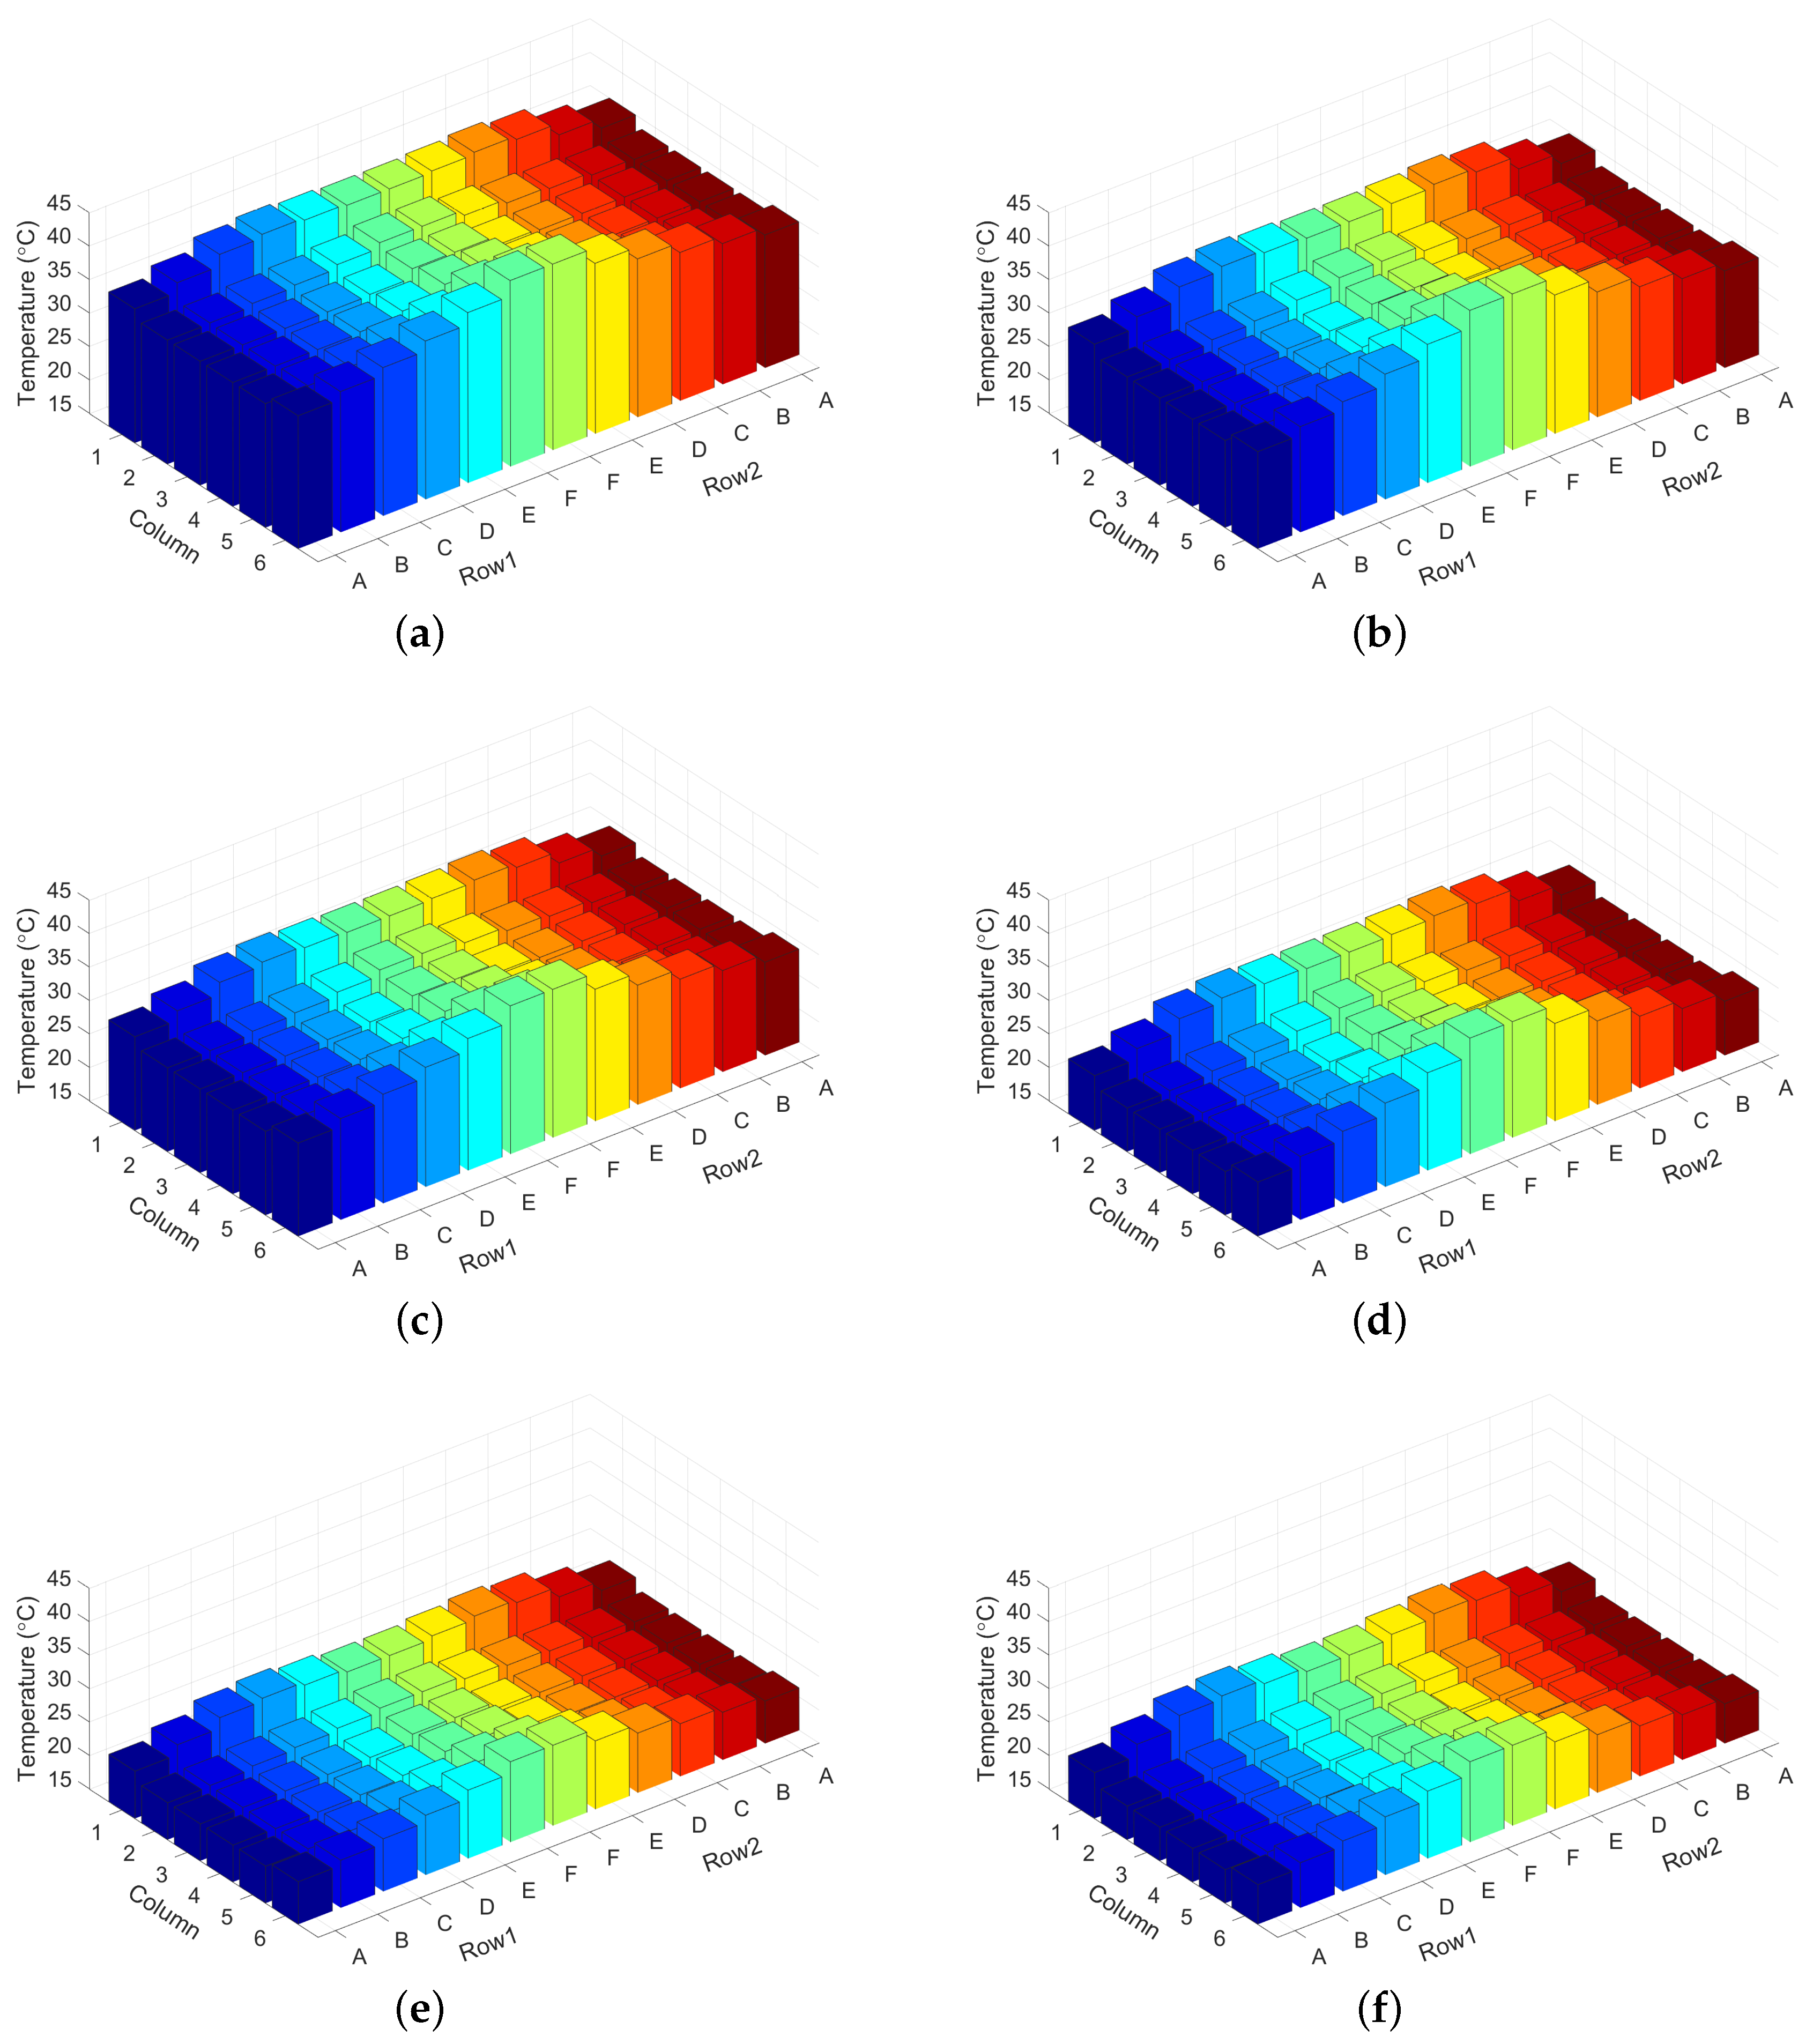
Figure 9.
Workload allocation results for different data center utilizations. (a) Allocation result of chip temperature-based workload allocation strategy (CTWA-MTP) with 60% utilization. (b) Allocation result of minimizing the peak inlet temperature through task assignment (MPIT-TA) with 60% utilization. (c) Allocation result of CTWA-MTP with 70% utilization. (d) Allocation result of MPIT-TA with 70% utilization. (e) Allocation result of CTWA-MTP with 80% utilization. (f) Allocation result of MPIT-TA with 80% utilization.


Table 1.
Fluid properties used in computational fluid dynamics (CFD) simulation.
| Property | Value and Unit |
|---|---|
| Reference temperature | 25 C |
| Reference pressure | 101,325 Pa |
| Specific heat capacity | 1004.4 J/kg·K |
| Density | 1.225 kg/ |
Table 2.
The standard deviation of chip temperature.
| Data Center Utilization | Standard Deviation | ||
|---|---|---|---|
| CTWA-MTP | MUT | MPIT-TA | |
| 90% | 2.28 | 3.31 | 5.05 |
| 80% | 1.94 | 3.12 | 9.52 |
| 70% | 2.14 | 2.92 | 9.01 |
| 60% | 1.70 | 2.73 | 7.30 |
| 50% | 2.01 | 2.54 | 5.58 |
© 2017 by the authors. Licensee MDPI, Basel, Switzerland. This article is an open access article distributed under the terms and conditions of the Creative Commons Attribution (CC BY) license (http://creativecommons.org/licenses/by/4.0/).
Share and Cite
MDPI and ACS Style
Bai, Y.; Gu, L. Chip Temperature-Based Workload Allocation for Holistic Power Minimization in Air-Cooled Data Center. Energies 2017, 10, 2123. https://doi.org/10.3390/en10122123
AMA Style
Bai Y, Gu L. Chip Temperature-Based Workload Allocation for Holistic Power Minimization in Air-Cooled Data Center. Energies. 2017; 10(12):2123. https://doi.org/10.3390/en10122123
Chicago/Turabian StyleBai, Yan, and Lijun Gu. 2017. "Chip Temperature-Based Workload Allocation for Holistic Power Minimization in Air-Cooled Data Center" Energies 10, no. 12: 2123. https://doi.org/10.3390/en10122123
Note that from the first issue of 2016, this journal uses article numbers instead of page numbers. See further details here.