A Study of Spill Control Characteristics of JP-8 and Conventional Diesel Fuel with a Common Rail Direct Injection System


1
Leaders in Industry-University Cooperation (LINC) of Chosun University, 309 Pilmun-daero, Dong-gu, Gwangju 501-759, Korea
2
Department of Mechanical and Automotive Engineering, Songwon University, Songarm-ro, Gwangju-ci 61756, Korea
*
Author to whom correspondence should be addressed.
Energies 2017, 10(12), 2104; https://doi.org/10.3390/en10122104
Submission received: 19 October 2017
/
Revised: 6 December 2017
/
Accepted: 7 December 2017
/
Published: 11 December 2017
(This article belongs to the Section I: Energy Fundamentals and Conversion)
Abstract
:Diversification of energy sources is a key task for decreasing environmental impacts and global emission of gases. JP-8, a fuel derived from natural gas, coal, biomass, and waste plastics, is a bright prospect. JP-8 is considered a multi-source multi-purpose fuel, with several applications. A preliminary characterization of the JP-8 injection rate and injection quantity behavior was investigated based on the high-pressure common rail injection system used in a heavy-duty engine. According to the spill injection and injection pressure, a trade-off trend between injection rate and injection quantity was observed. As expected, pilot injection of JP-8 aviation fuel and diesel fuel affects the spray quantity and injection evolution of the subsequent operation without pilot injection. The difference in spilling between diesel and JP-8 aviation fuel is greater than the difference in injection amount per time; in the process of controlling the injector solenoid through ECU (Electric Control Units), the oil pressure valve and the needle valve operate to a higher extent in order to maintain the diesel fuel’s injection quantity volume. It was found that the total injection quantity was decreased by adding 20% pilot injection duration. Because the pilot injection quantity causes solenoid response, loss and needle lift stroke friction loss.
1. Introduction
Direct injection diesel engines have proved to be efficient choices for large-scale applications such as in transportation and power generation, where fuel consumption at low speed and high load is a major concern. However, owing to the high pressure and high temperature conditions in the combustion process, the diesel engine emits a considerable amount of pollutants, in particular nitrogen oxides (NOx) and particulate matter (PM). Other contaminants such as hydrocarbon (HC) and carbon monoxide (CO) are also present in the exhaust gas of the diesel engine, although not at the PM and NOx levels. This is the reason of the emphasis placed in reducing emission levels and breaking the widely observed trade-off between NOx and particles, i.e., without lowering the efficiency of the engine [1,2].
The importance of the fuel injection system in the operation of diesel engines has been recognized from the earliest stages of the engine. The rate at which fuel is introduced into the combustion chamber determines the performance of the engine, and the properties of the spray are very important in the design of diesel engines. In this regard, the Zeuch and, in particular, the Bosch methods are the most frequently used today [3].
Diesel engines, which are now widely used for industrial and automotive purposes, have excellent thermal efficiency compared to gasoline engines, and small diesel engines already account for a large market share in Europe and other regions. However, while they have excellent efficiency, they also emit a high level of NOx and PM, which is a chronic problem that has long been in need of a solution. Thus, there is an urgent need for research on reducing these two emissions while preserving the thermal efficiency of diesel engines, and one alternative is a synthetic aviation fuel, JP-8 [4].
Kurman et al., [1] investigated the effect of nozzle configuration on the liquid and vapor phases of JP-8 sprays using the Mie scattering and Schlieren methods. In addition, various studies investigated the liquid/vapor phase penetration length for improving combustion and fuel efficiency, and measured the injection rate of three types of injectors with one, two, and six holes, using the Bosch tube method.
Lee [3] investigated on the measurement of injection rate in a marine diesel engine using the Zeuch method under various conditions of marine nozzle configuration with respect to nozzle-hole diameter and injection angle. In that study, the in-cylinder pressure changed with engine load, and by setting the chamber pressure between 8 MPa and 15 MPa under the imposed engine loads, the error rate in the injection amount was about 4%.
Benajes et al. [5] carried out analyses of the flow characteristics produced by the injector nozzle hole geometry, based on analysis of the experimental values of Cd (drag coefficient), Re (Reynolds number), and K (critical cavitation number).
Therefore, to improve the combustibility of the aviation fuel, an excellent control system and highly accurate measurement of the optimal rate of injection are needed. In an internal combustion engine that uses aviation fuel, if fuel is injected into the engine using a common rail system injector, examining the injector’s initial injection characteristics is an important part of the development process [2,6].
This research examines some of the main technical problems involved in the use of JP-8 as a diesel alternative with a common rail system. In this study, the fuel injection rates in the diesel engine are measured using the Bosch tube method. While the engine load and injection conditions are changed, the resulting injection rates are analyzed and compared using both JP-8 and conventional diesel fuel. This study also carries out a preliminary examination of the problems in the supply system that are expected to occur when actual aviation fuel is used in an internal combustion engine, owing to the injection characteristics. It predicts the performance effects of using aviation fuel in a common rail diesel internal-combustion engine.
2. Experiment Equipment and Methods
2.1. Experiment Equipment
2.1.1. JP-8 Aviation Fuel Characteristics
Currently, the aviation-use JP-8 turbine fuel is used for jet and turbo-propeller engines. For this purpose, other kinds of general commercial petroleum fuels are used, such as Jet-A and the modified petroleum fuel Jet-B2. Jet-B is a modified fuel that is a mixture of gasoline and petroleum and is used in cold regions [4,6].
Table 1 presents a comparison between the JP-8 aviation fuel and other fuels. These fuels have been modified so that they can be used as emergency diesel fuels for vehicles or industrial uses. The aviation fuel is not a product that contains complex ingredients, such as gasoline or kerosene, or petroleum ingredients that maintain the boiling point at 50–300 °C and 100–130 octane, but it must have good combustibility, low-temperature properties, and high caloric value [7].
2.1.2. Aviation Fuel Supply System
In the diesel fuel injection method, the mechanical injection pump uses the opening pressure of the nozzle and the stroke to perform the injection as shown Figure 1. Thus, when JP-8 fuel is used in conditions where there are high-speed revolutions and a high load, the control over the injection quantity becomes unstable owing to the pulses and leaks. However, in the common line method, the JP-8 fuel’s rail pressure can be supplied without regard to the external temperature, while maintaining a fixed pressure at the supply pump via an ECU program, which means that the drawbacks of the existing mechanical injection methods can be resolved [7,8,9,10,11]. In order to understand the characteristics of the JP-8 aviation fuel regarding its use in a common rail injection system, we used an injection test bench for measuring injection pumps (Model: 15NPE, accuracy ±1%, Doowon Corporation, Ansung, Korea).
2.1.3. Common Rail Injector
2.1.4. Common Rail Control System
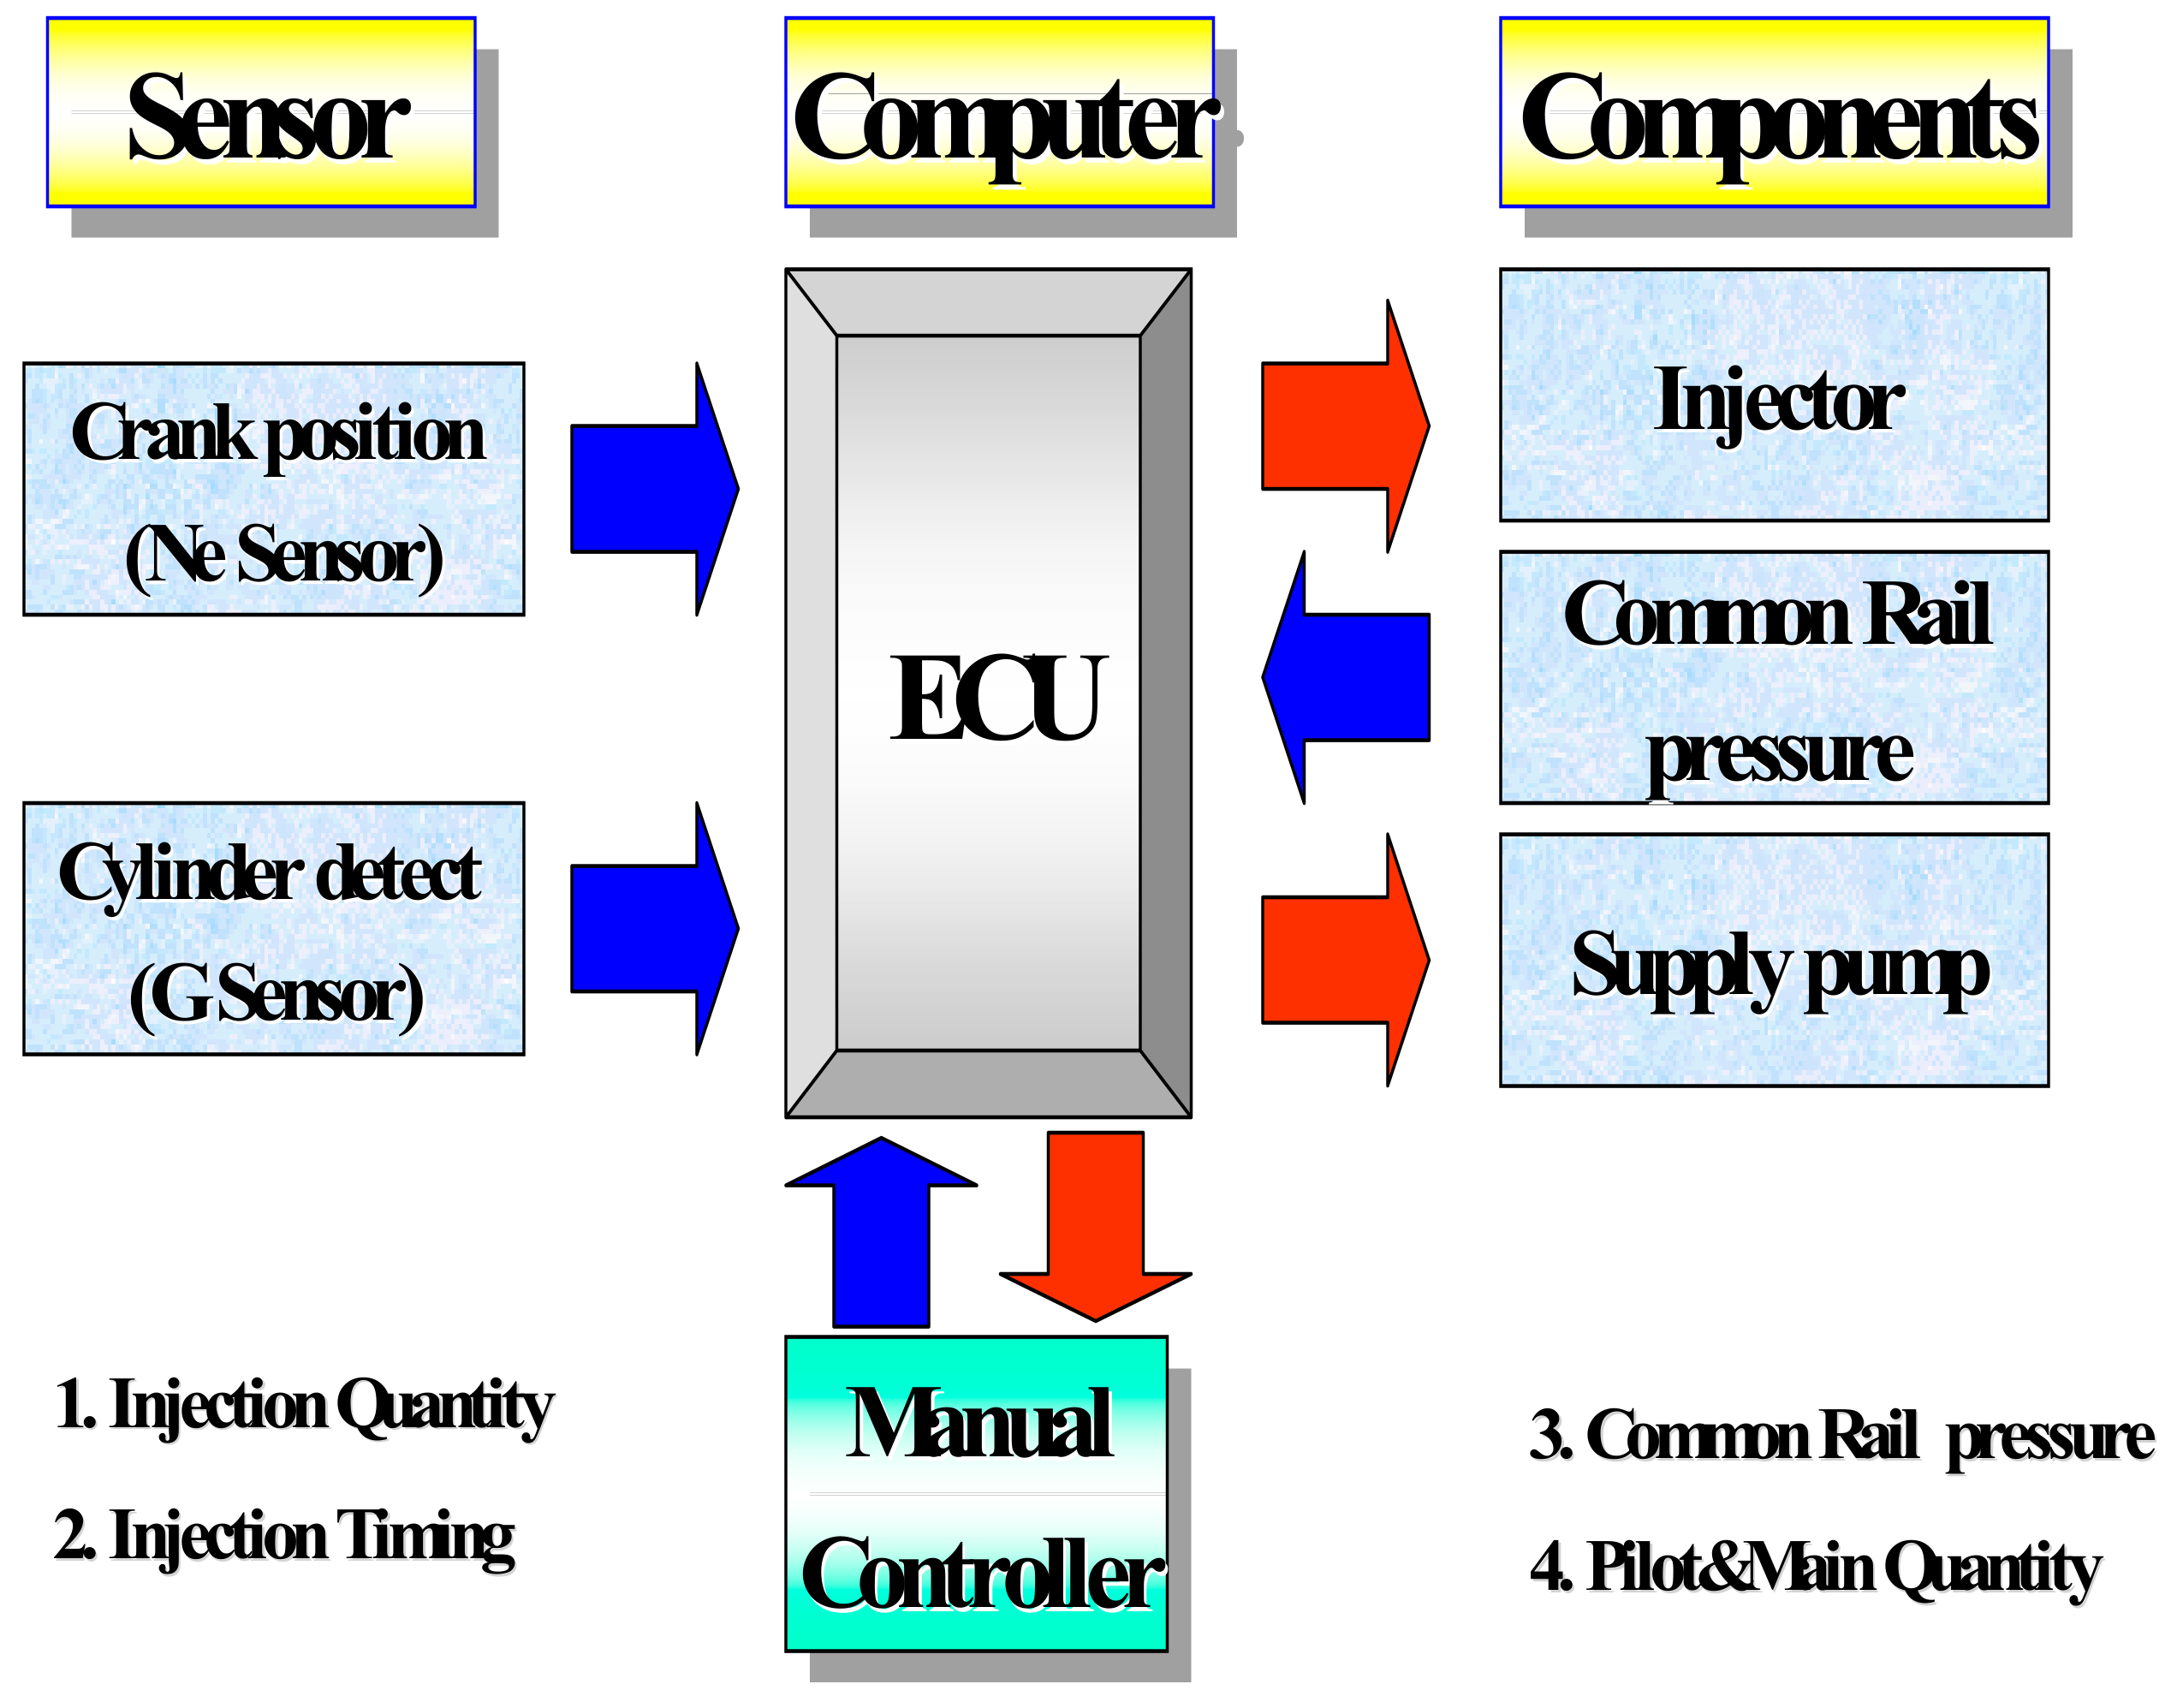
Figure 2 shows the structure of the common rail system control. It is divided into three parts: sensor, computer, and components. It receives three input signals and produces two output signals.
2.2. Experiment Method
Experiment Conditions and Measuring Methods
The conditions for the experiment involved performing ECU operation pulses with a standard engine revolution of 750–2000 RPM, an injection pressure of 60 MPa, a BTDC of 14°, a φ0.21 × 6 nozzle, and a chamber pressure of 0–10 MPa. A current probe (A6302) and current amplifier (AM503B) made by TEKTRONIX Co. (New York, NY, USA), are attached to the electrical connection of the injector in order to capture the start of the injection, injection duration, and injection events. The current probe captures the signal waveform passing to the injector. An optical encoder is installed on the camshaft to measure the instantaneous crank angle degree. The encoder mounted on the camshaft is supported by a bracket to take into account any vibration or misalignment that could arise between the encoder shaft and camshaft. This optical shaft encoder has a resolution of 0.25 pulses/degree. A resolution of 0.25 CAD was selected because a higher resolution would induce more noise, and a lesser resolution would result in the loss of pressure data. A piezo-resistive high-pressure sensor (Model type, 4067A2000 and 6229A, KISTLER Co. Ltd., Winterthur, Switzerland) was installed on the high-pressure fuel line and high-pressure chamber. The accuracy of the high-pressure sensors is approximately 0.1%.
The pressure data was recorded at the crank angle depending on the type of signal. The crank angle based high-speed data acquisition was attained through a data acquisition system from Electro Mechanical Associates (EMA, Ann Arbor, MI, USA), which recorded the high-pressure chamber pressure, fuel rail pressure, ion current signal, and current probe injection signal. The acquired data can be displayed as an average of many cycles. In order to reduce cycle-to-cycle variation, all the recorded data was based on an average of 100 cycles. Smoothing is applied to the signals in order to reduce noise during the capture of the signals.
For the first step of the experiment, an injection was made into the static chamber at 0–100 MPa, which is the diesel injection condition for existing test engines, and the injection was performed at the combustion pressure of the JP-8 engine. In the second step, the line pressure was maintained steady at a supply pressure of 60 MPa, and the JP-8 and diesel were injected under diesel injection conditions in order to make a comparison.
3. Experiment Results and Discussions
3.1. Pilot and Main Injection Quantities with Different Injection Times
3.1.1. Two-Way Valve (TWV) Driving Pulse
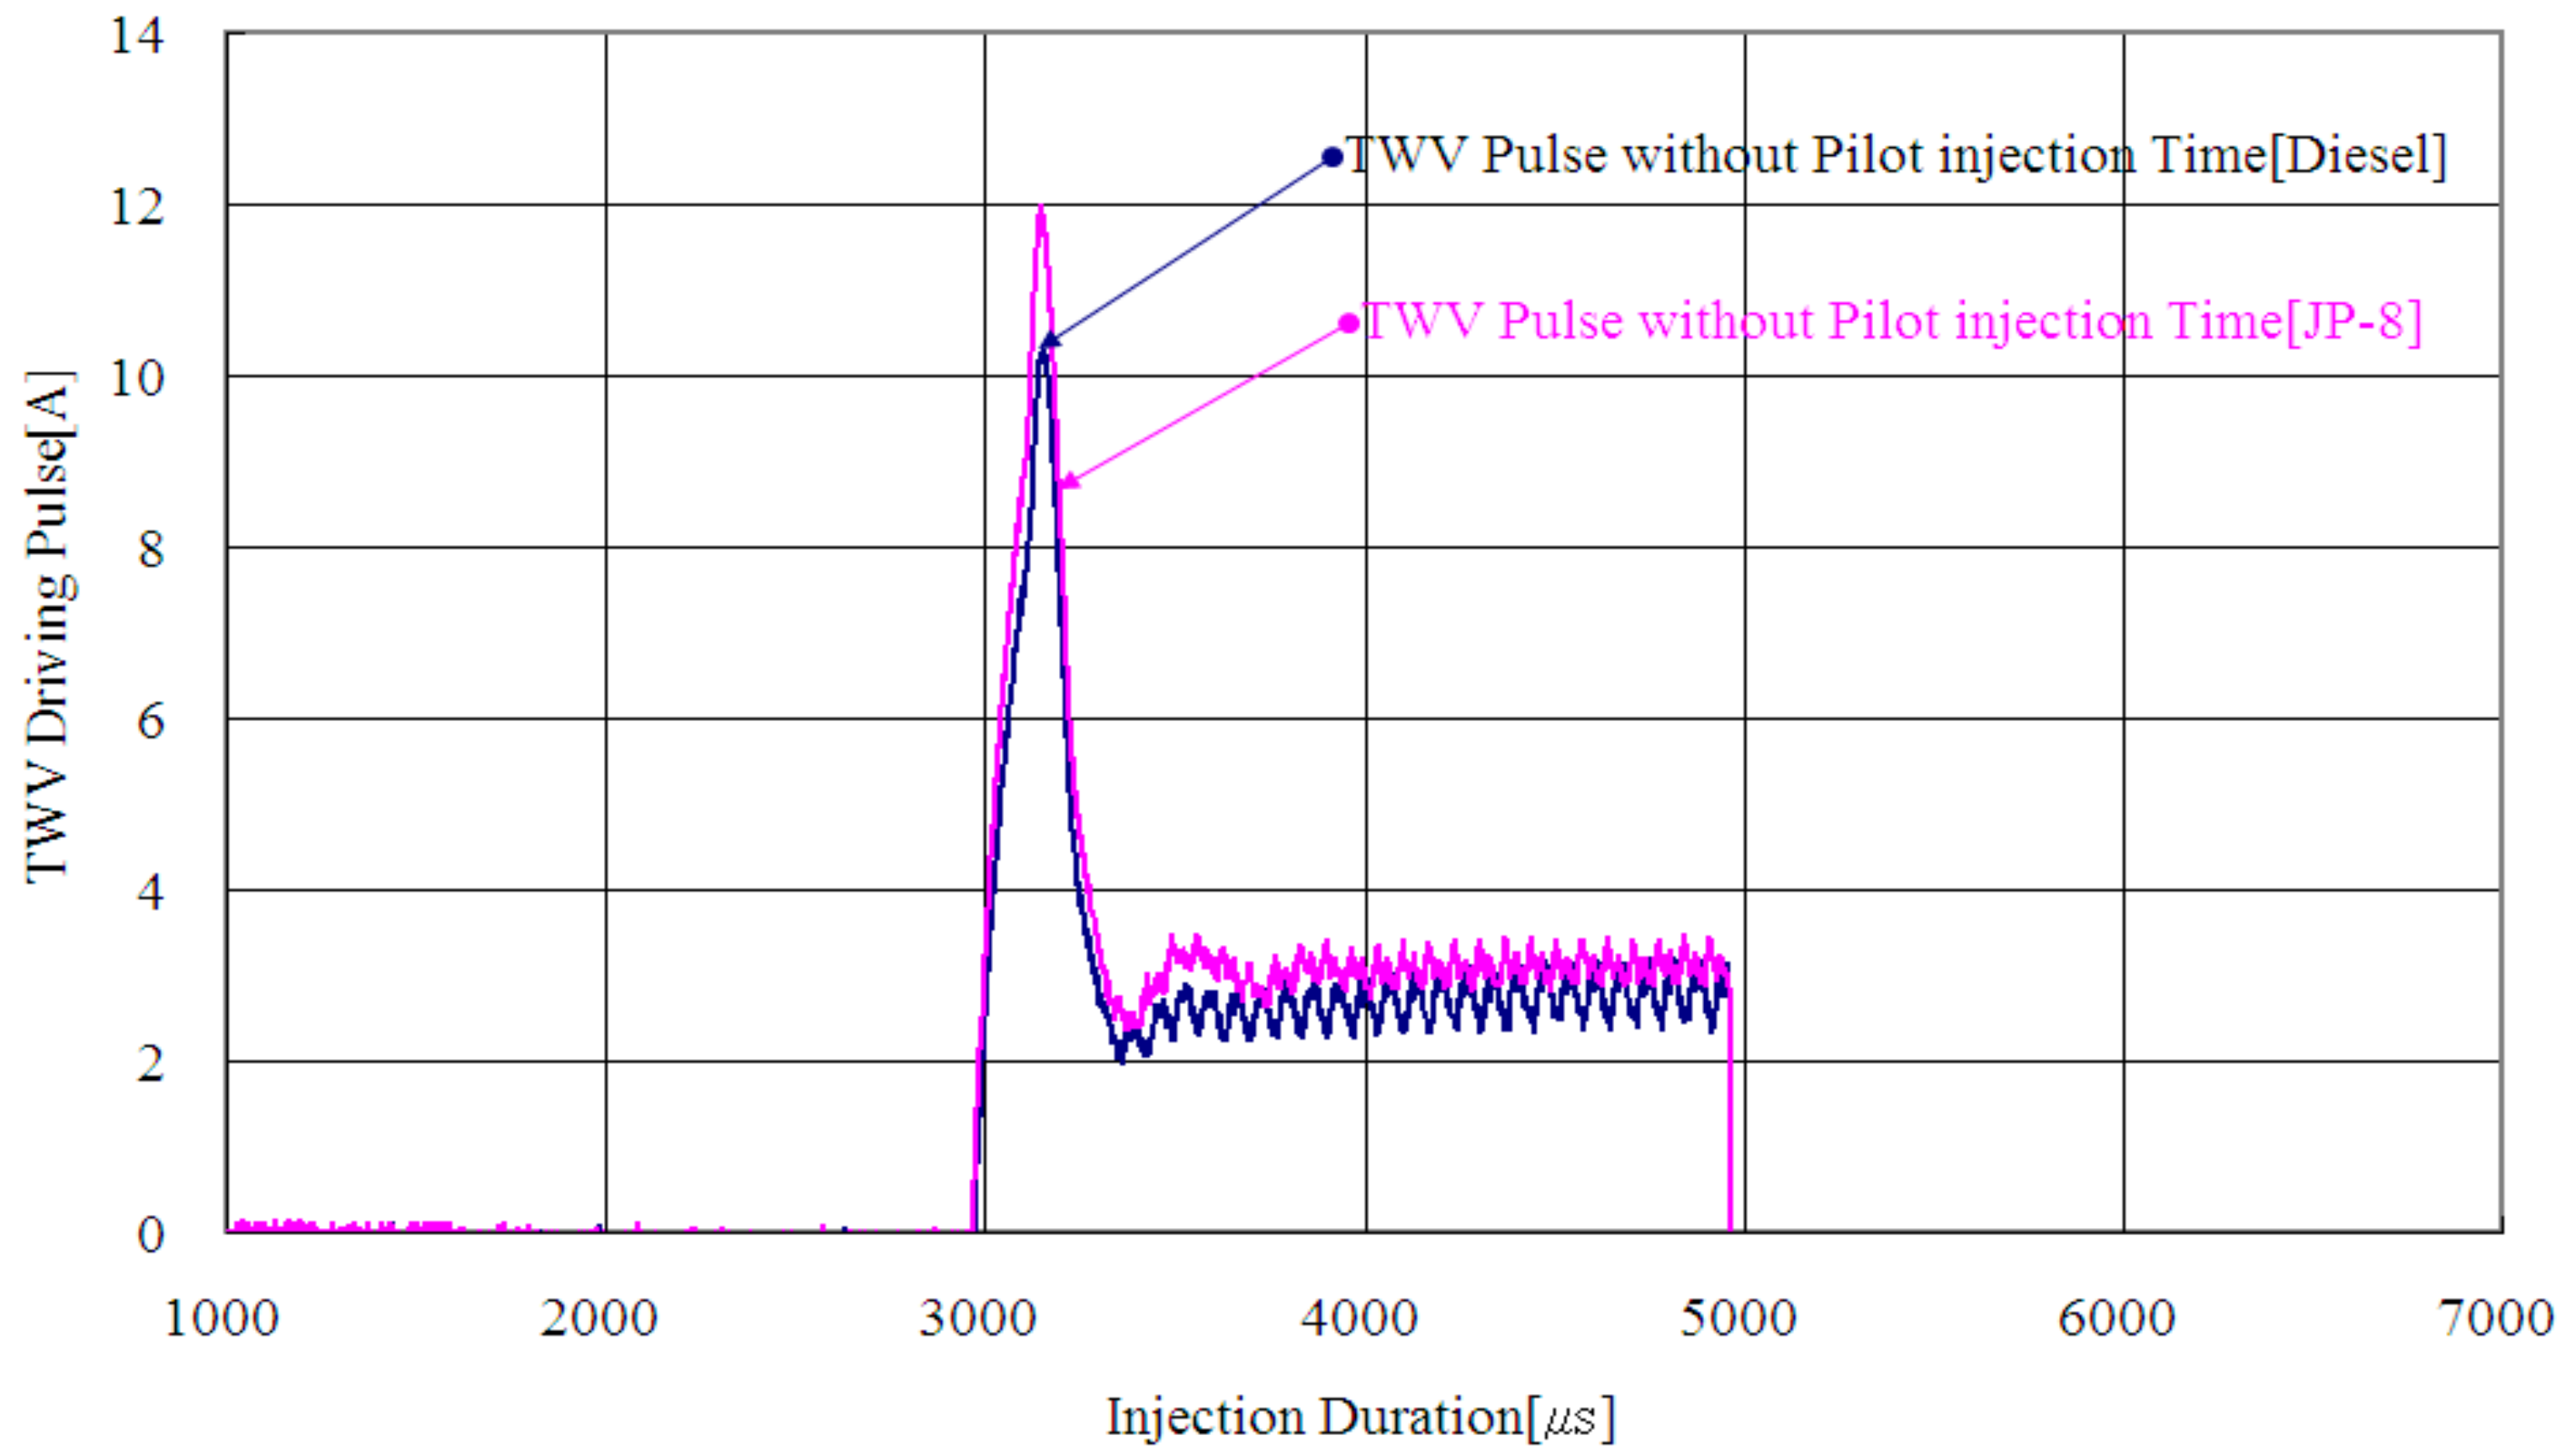
Figure 3 shows the TWV pulses when diesel and JP-8 were injected in the main injection mode. Here, when the JP-8 and diesel injection periods were fixed, the TWV active pulse was around 12 A for JP-8 and 10 A for diesel. Looking at the expected test engine, this was an injection period that corresponded to 75% of the load factor. The maximum current for JP-8 was approximately 1 A different from that for diesel. This was the operating current that compensated for the required response as the ECU operated the solenoid valve according to the reductions in density of the JP-8 and diesel.
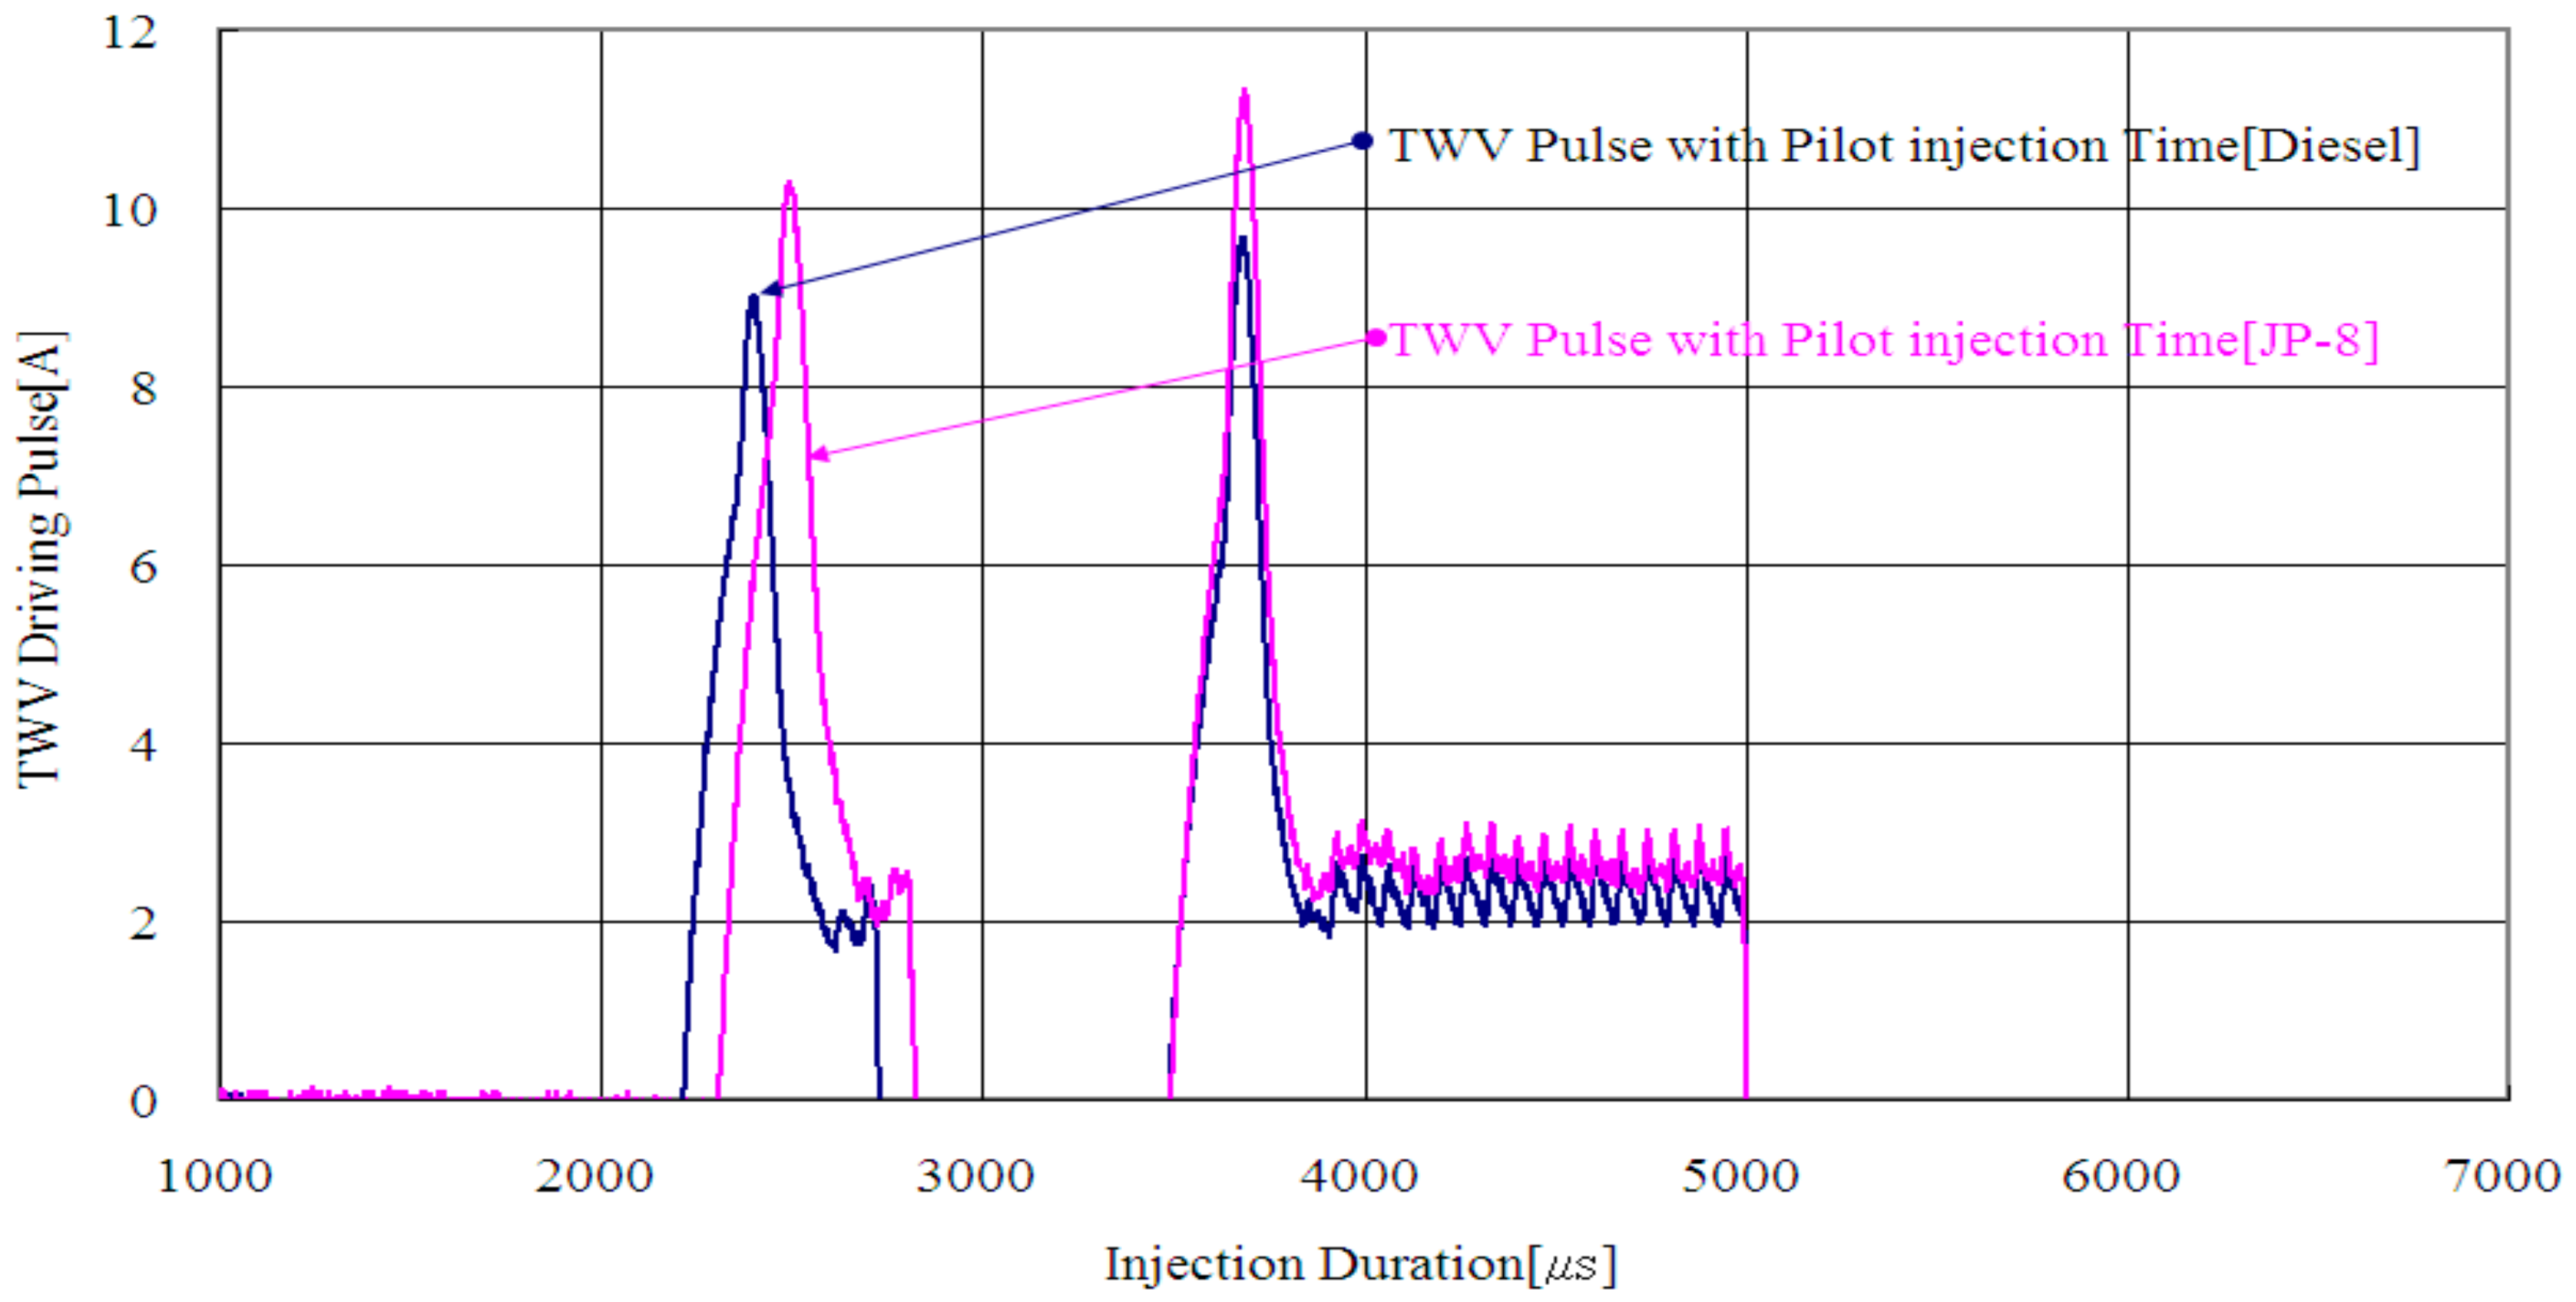
Figure 4 shows the TWV signals during JP-8 and diesel injection with pilot injection. Here, during the main injection period, the maximum current was 0.5 A higher than the pilot maximum current. This was because when the pilot and the main injection were performed, the amount of current consumed increased owing to loss of the solenoid response. Thus, if the map, which responds to revolution speed load, temperature, air pressure, etc., is controlled, it is possible to obtain optimal control characteristics that are suited for operating conditions. In addition to this, the revolution and load map control make it possible to control the response speed in order to prevent sudden changes in the quantity of injection during acceleration along with high-pressure injection and low oil transfer rates. These are related to checking and adjusting the common rail ECU spill control, and the TWV pulses are an important metric for this.
3.1.2. Rail Pressure
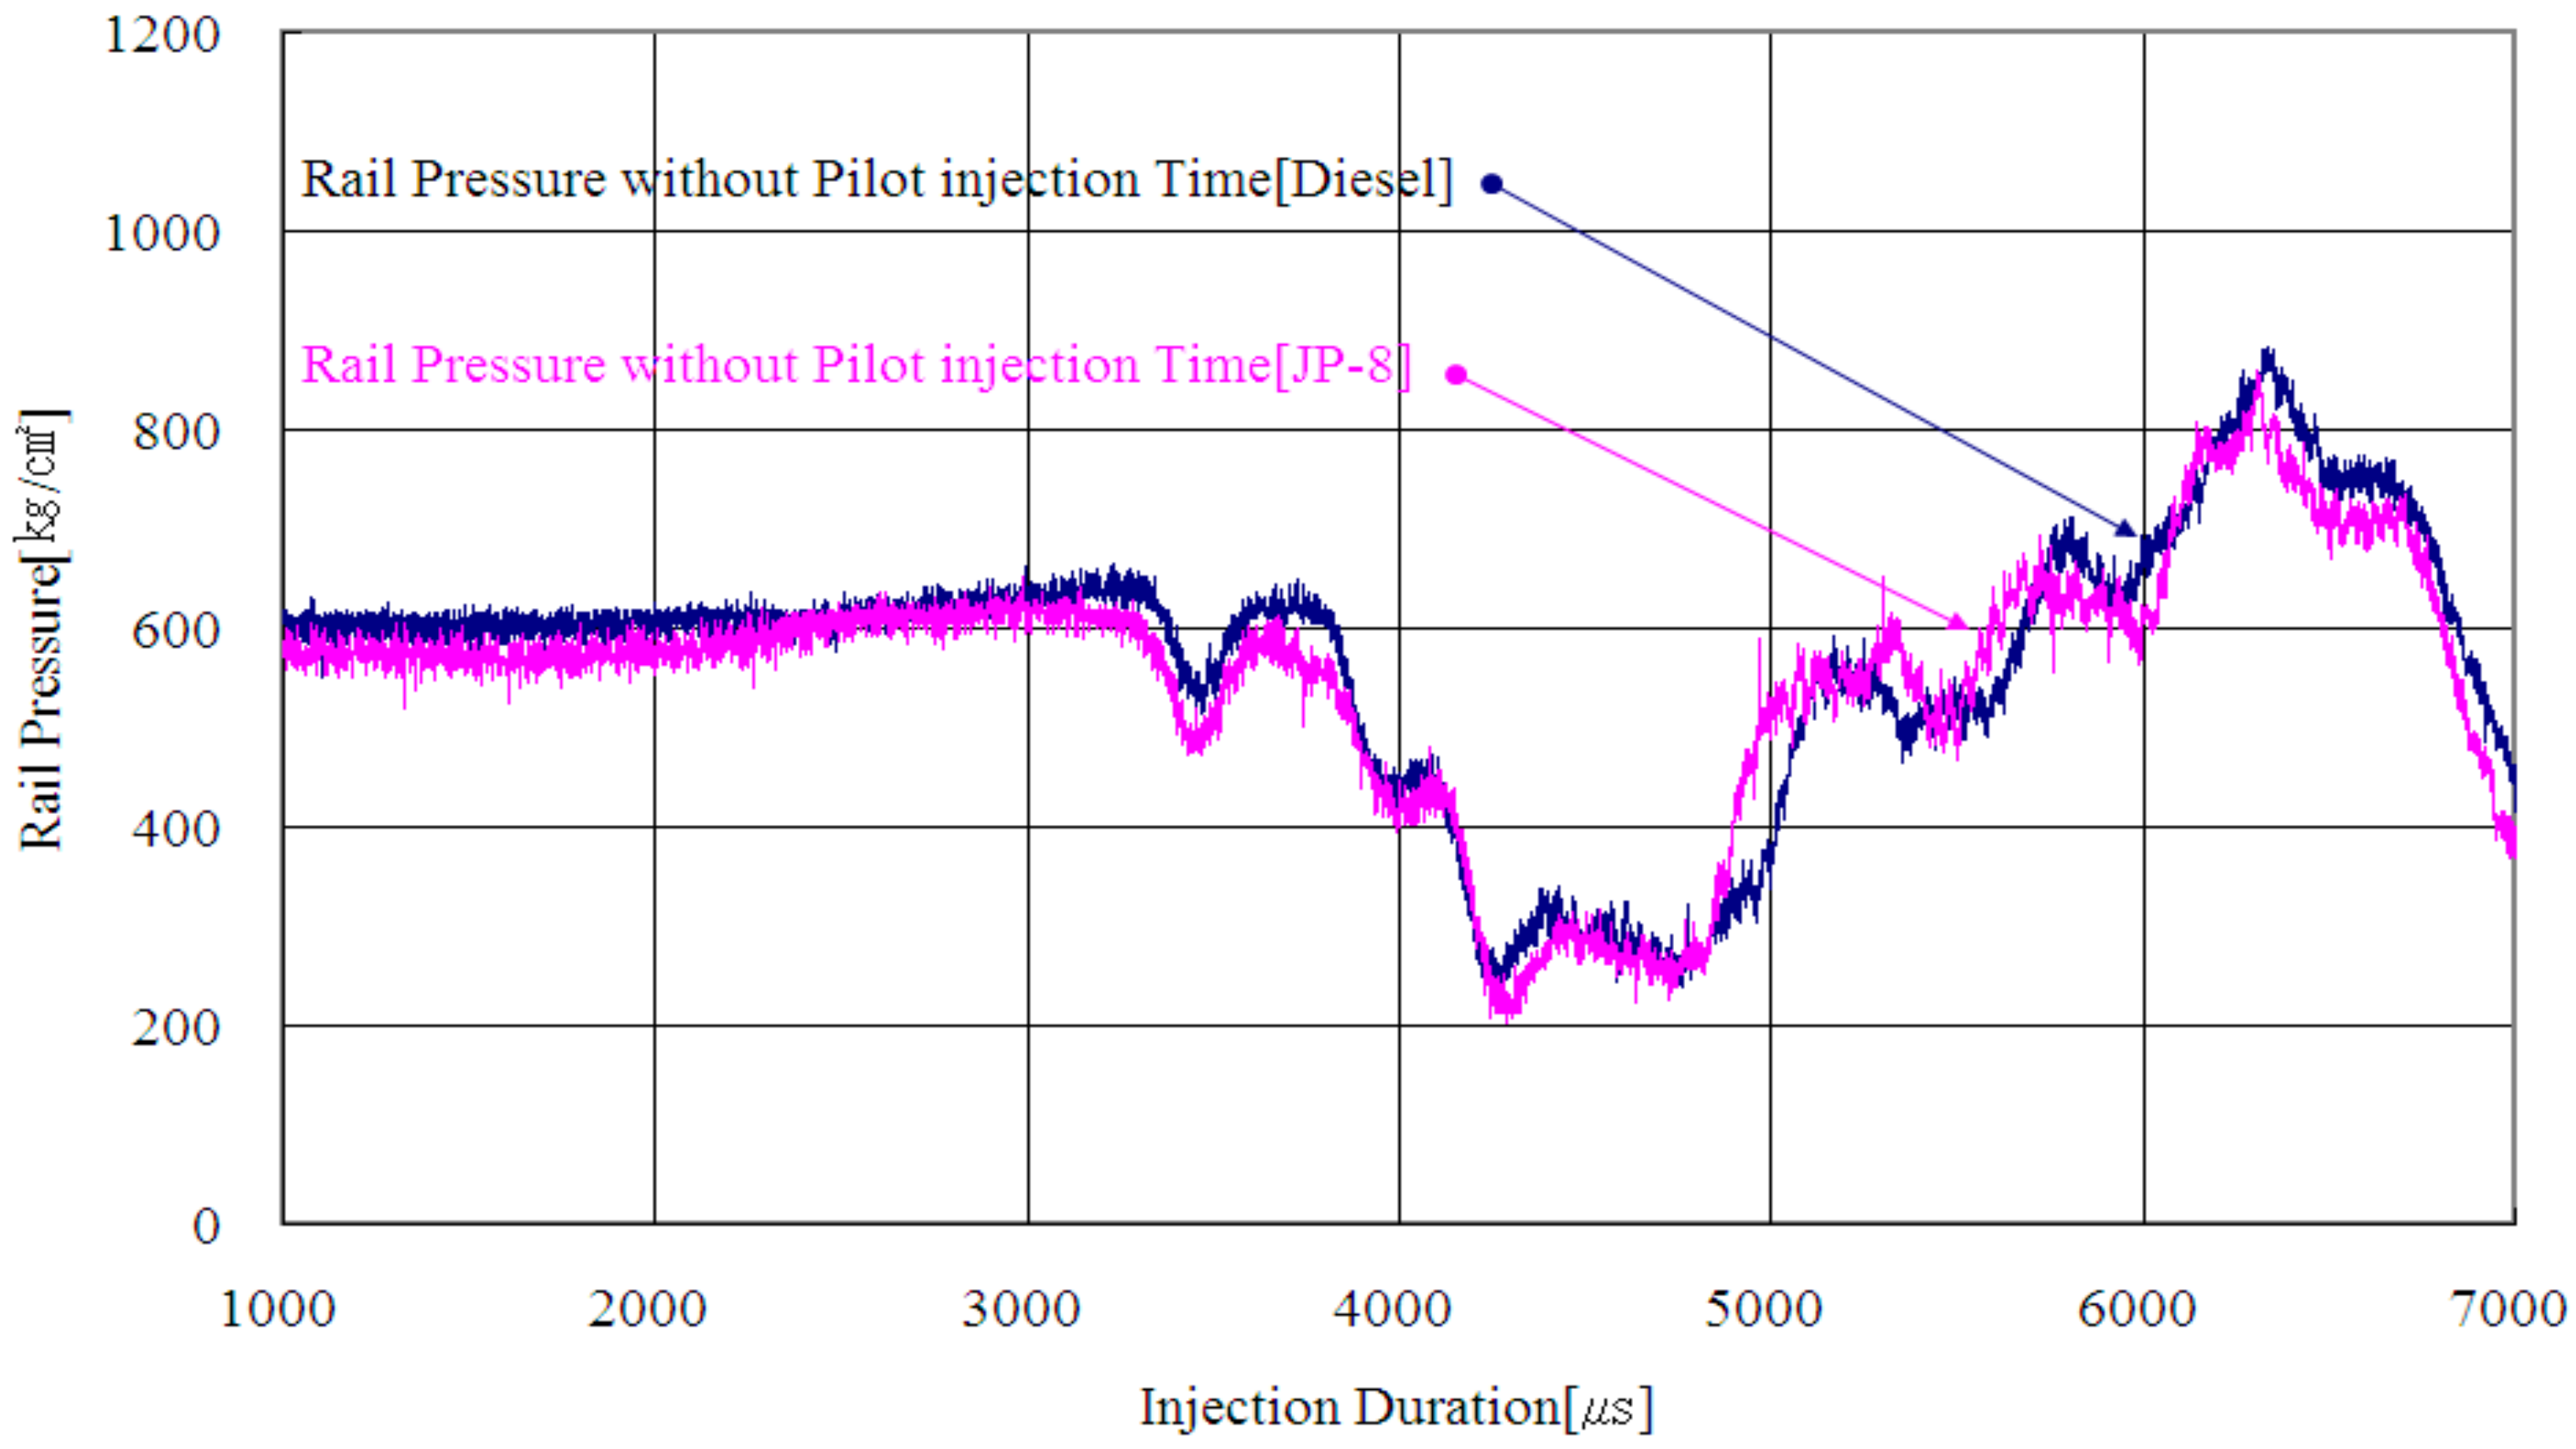
Figure 5 shows the changes in the rail’s internal pressure without pilot injection. Here, the initial pressure change was similar, but after passing the 5000 µs time point, JP-8 showed more rapid pressure changes than diesel. This result was expected because of the characteristics of the low density, low viscosity liquids, which experience rapid density and sonic changes. This leads us to believe that the JP-8 supply pump consumes additional energy, compared to the diesel supply pump.
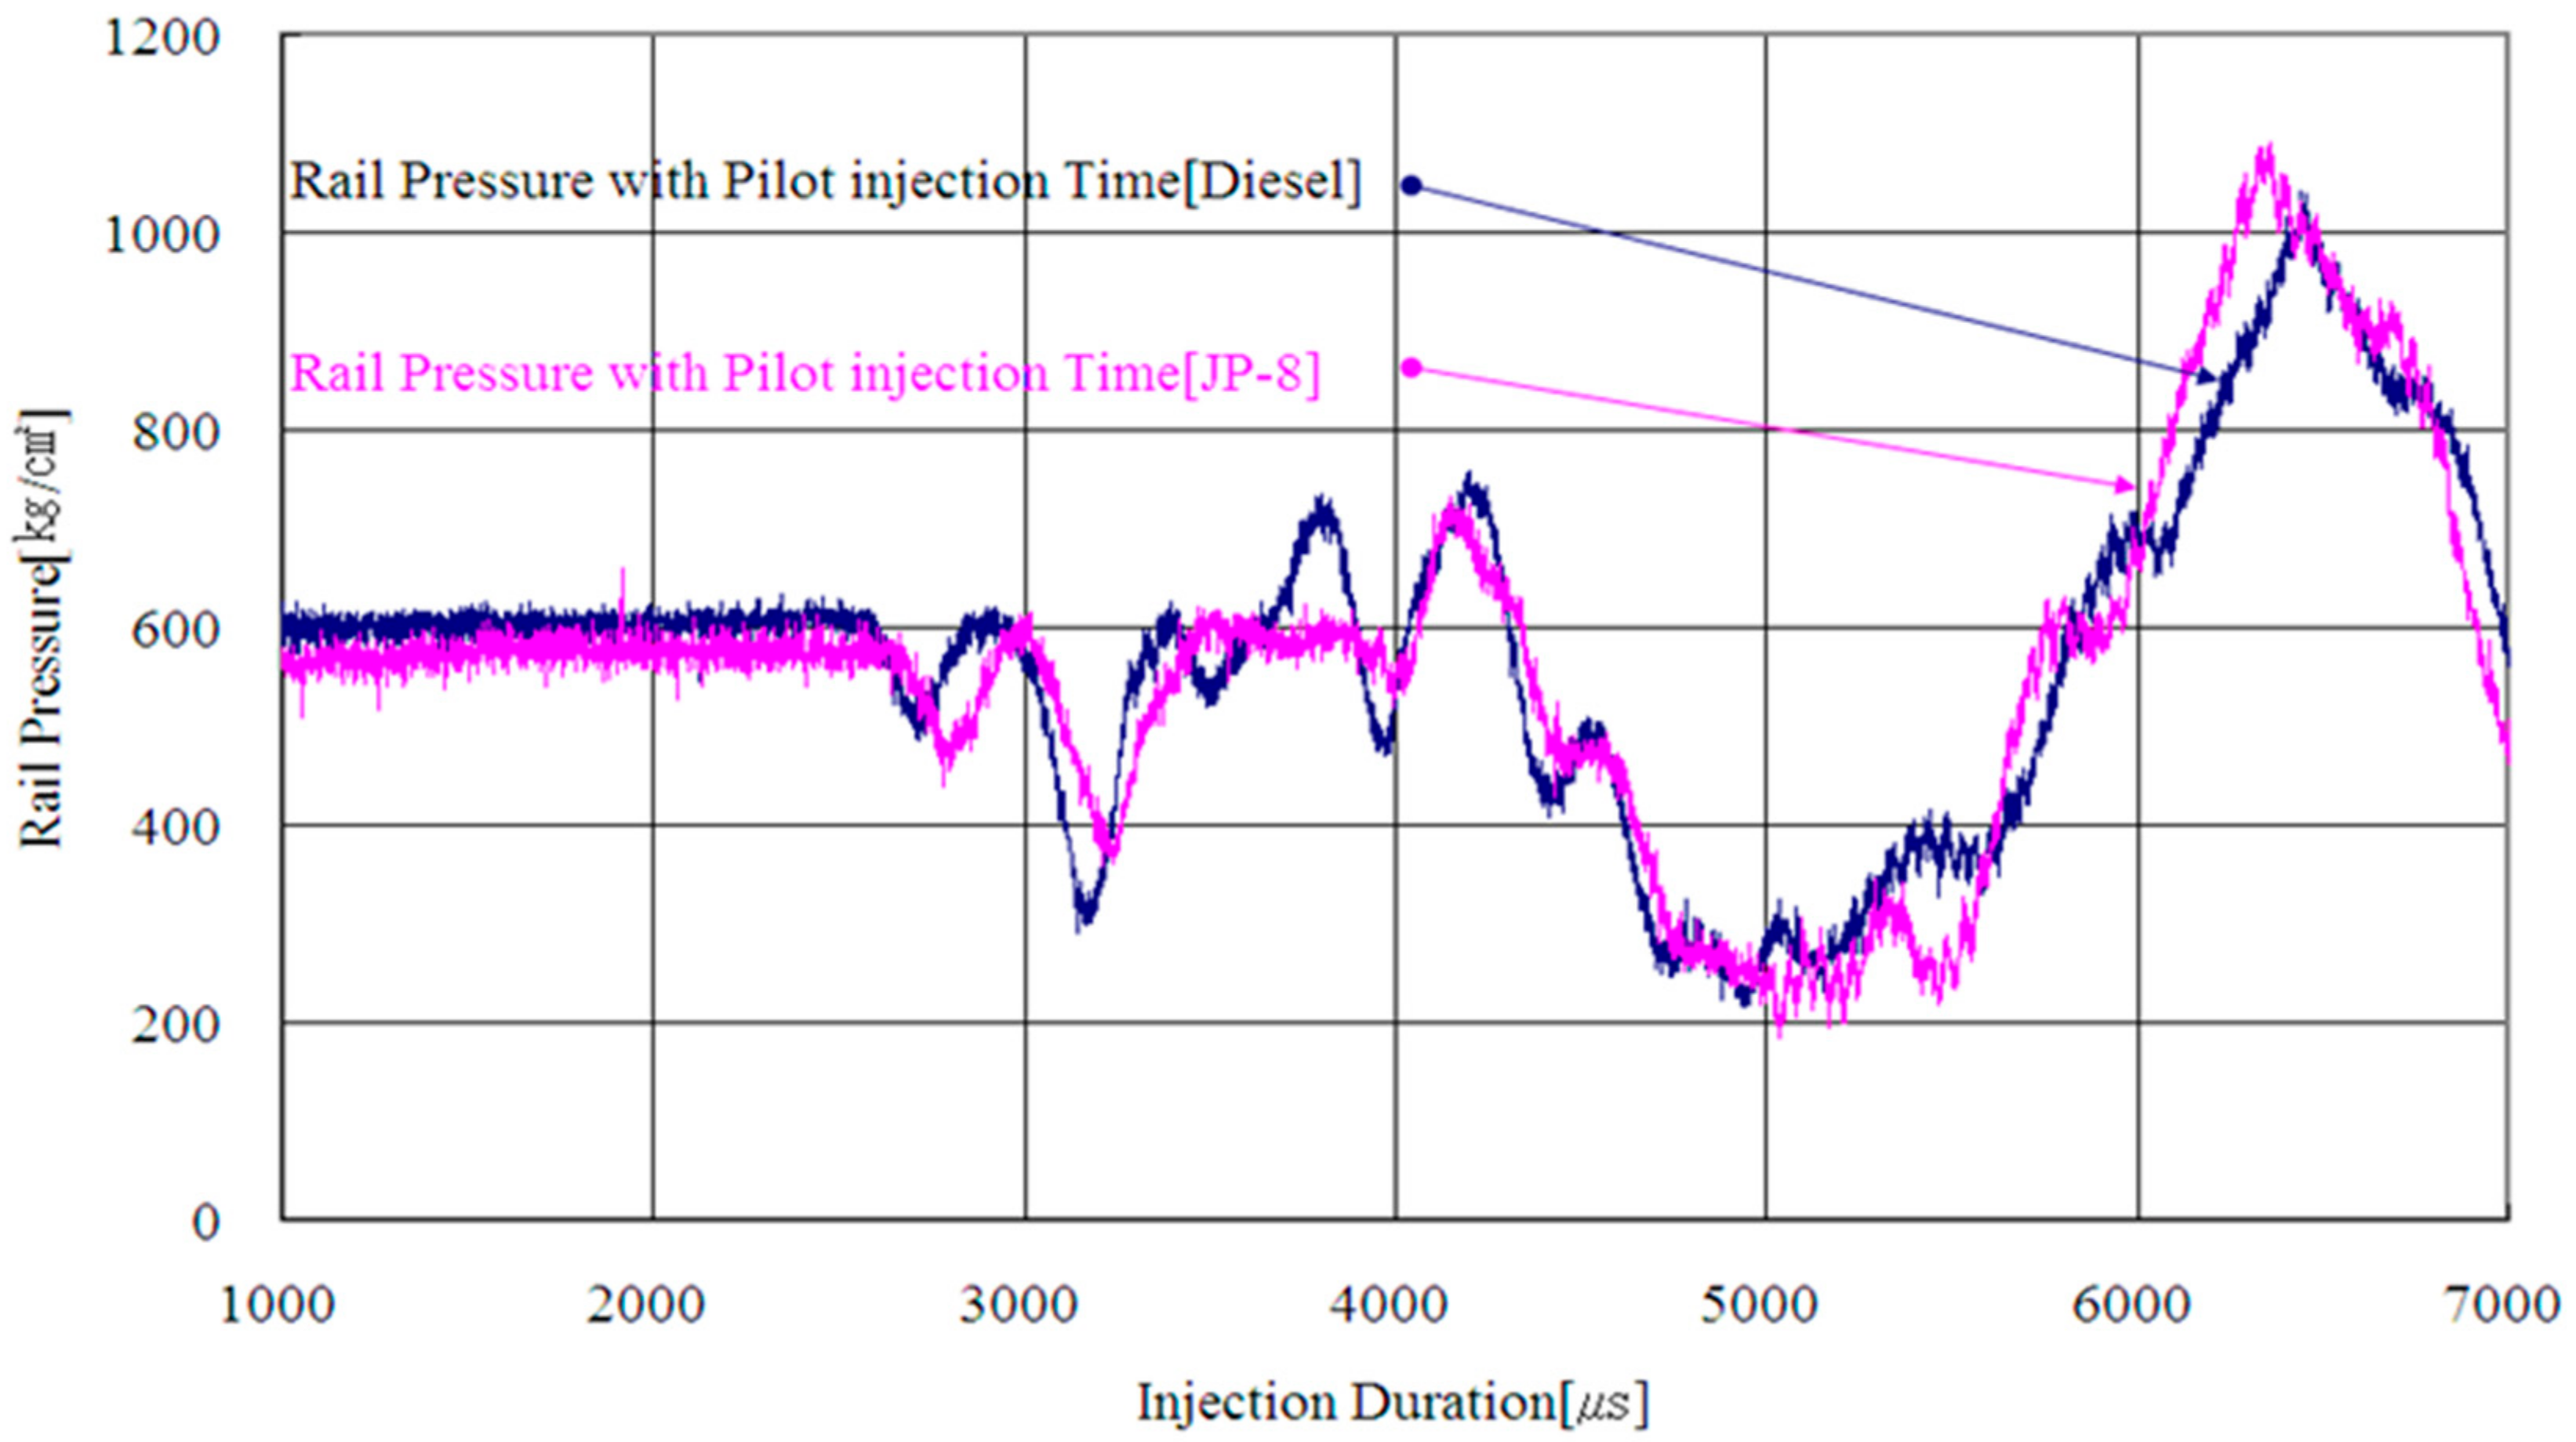
Figure 6 shows the pressure changes in diesel and JP-8 injection with pilot injection. When JP-8 and diesel were injected under the same conditions, the time of JP-8’s pressure changes was delayed approximately 100 µs compared to diesel. This could be because, at the same pressure, JP-8 has lower density than diesel and fuel spilling occurred early but the oil pressure valve did not sense the pressure difference; thus, injection occurred with that delay. Moreover, in the pressure changes of a rail including pilot injection, the maximum pressure was increased by a margin of about 200 kg/cm2 compared to the rail pressure changes without pilot injection. This was because when pilot injection was included, the injection per unit of time occurred twice, and thus, there was a momentary compensation in rail pressure from the supply pump.
3.1.3. Needle Lift
Figure 7 shows the needle lift motion time in diesel and JP-8 injection without main injection and pilot injection. Generally, the needle lift motion for JP-8 was about 0.01 mm higher than that for diesel, and when pilot injection was added, it was about 0.02 mm higher. This is believed to be a result of the high gap in the needle movement needed to maintain a set injection rate owing to the low lubrication and low density of JP-8. Therefore, in the same injection period, the needle lift gap was 0.325 mm for diesel and 0.35 mm for JP-8.
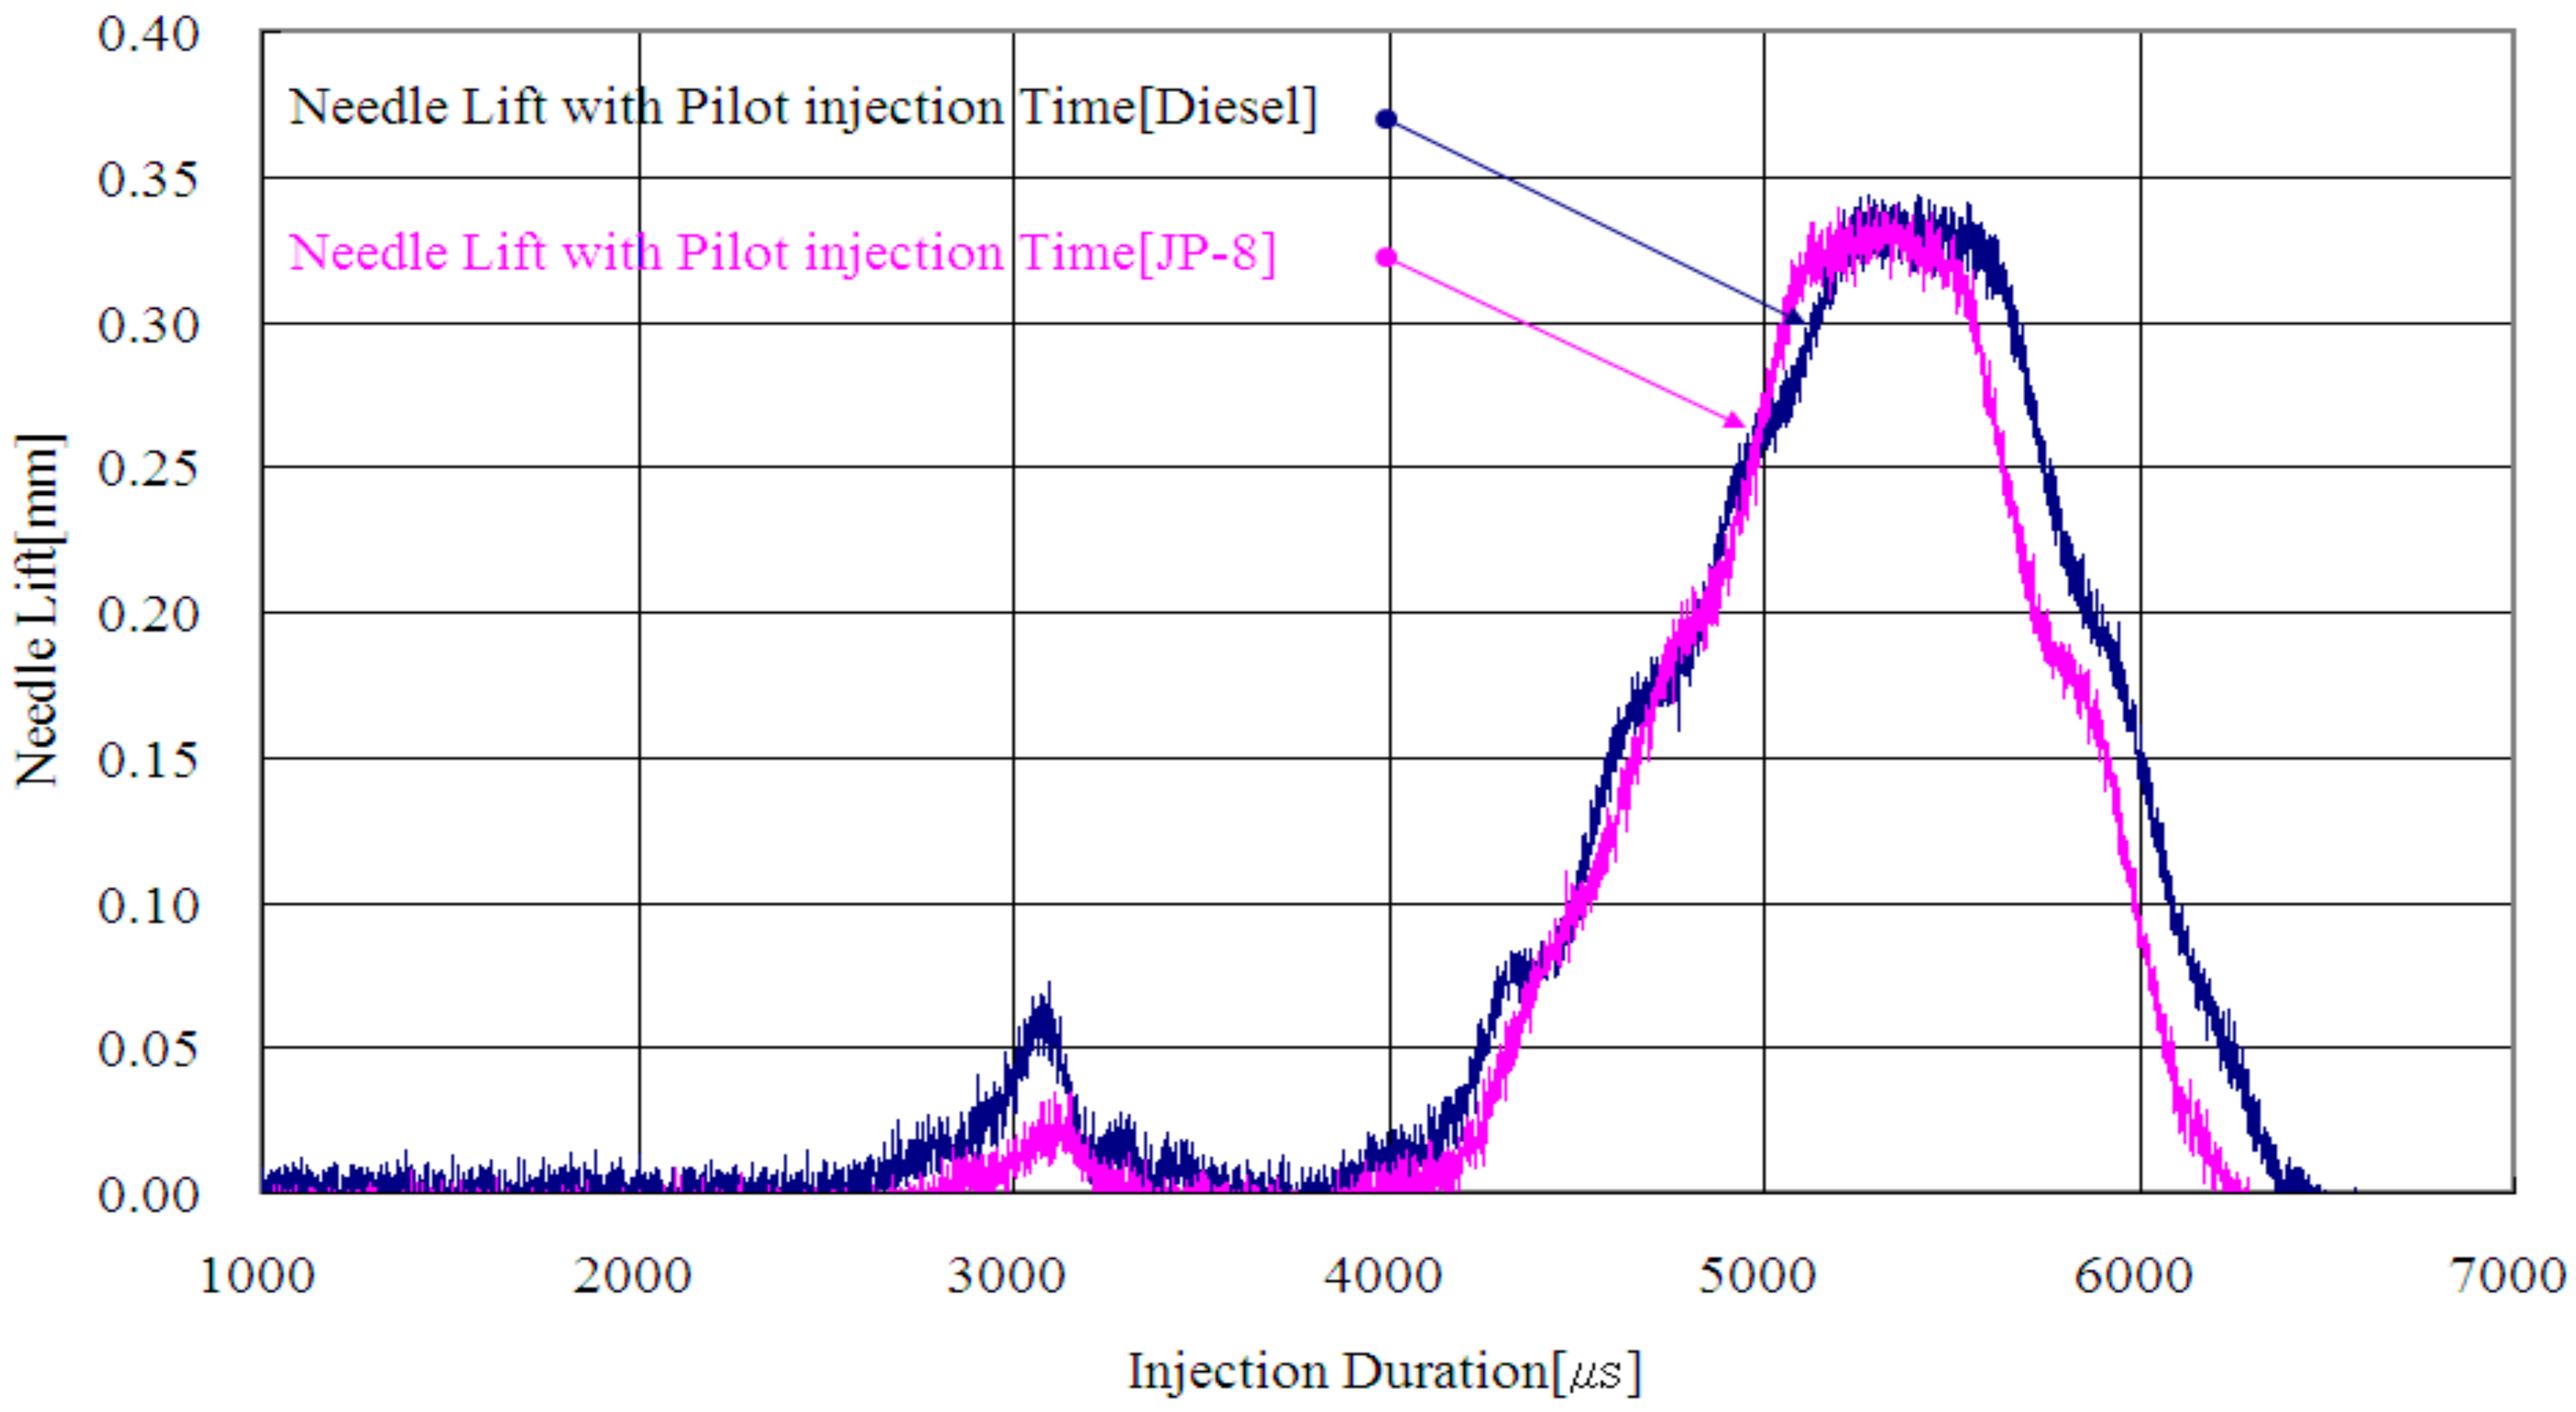
Figure 8 shows that during injection of JP-8 and diesel, with main injection and pilot injection, there were changes in the needle lift when the main injection occurred, but if only pilot injection was added, the needle lift was that much lower. That is, when the fuel pressure and supply quantity were fixed, the main injection quantity became smaller by the pilot injection quantity; thus, the injection time and quantity must be adjusted with consideration to combustion and exhaust performance. In addition, when we look at the initial pilot injection time for the needle lift that occurred owing to the solenoid valve and the oil pressure valve because of ECU operation pulses, it was delayed by about 200 µs, but for the main injection time, the end time was proportionally moved forward. JP-8 has lower lubrication than diesel at the initial injection time, and thus, the oil pressure valve’s operating gap was not controlled optimally.
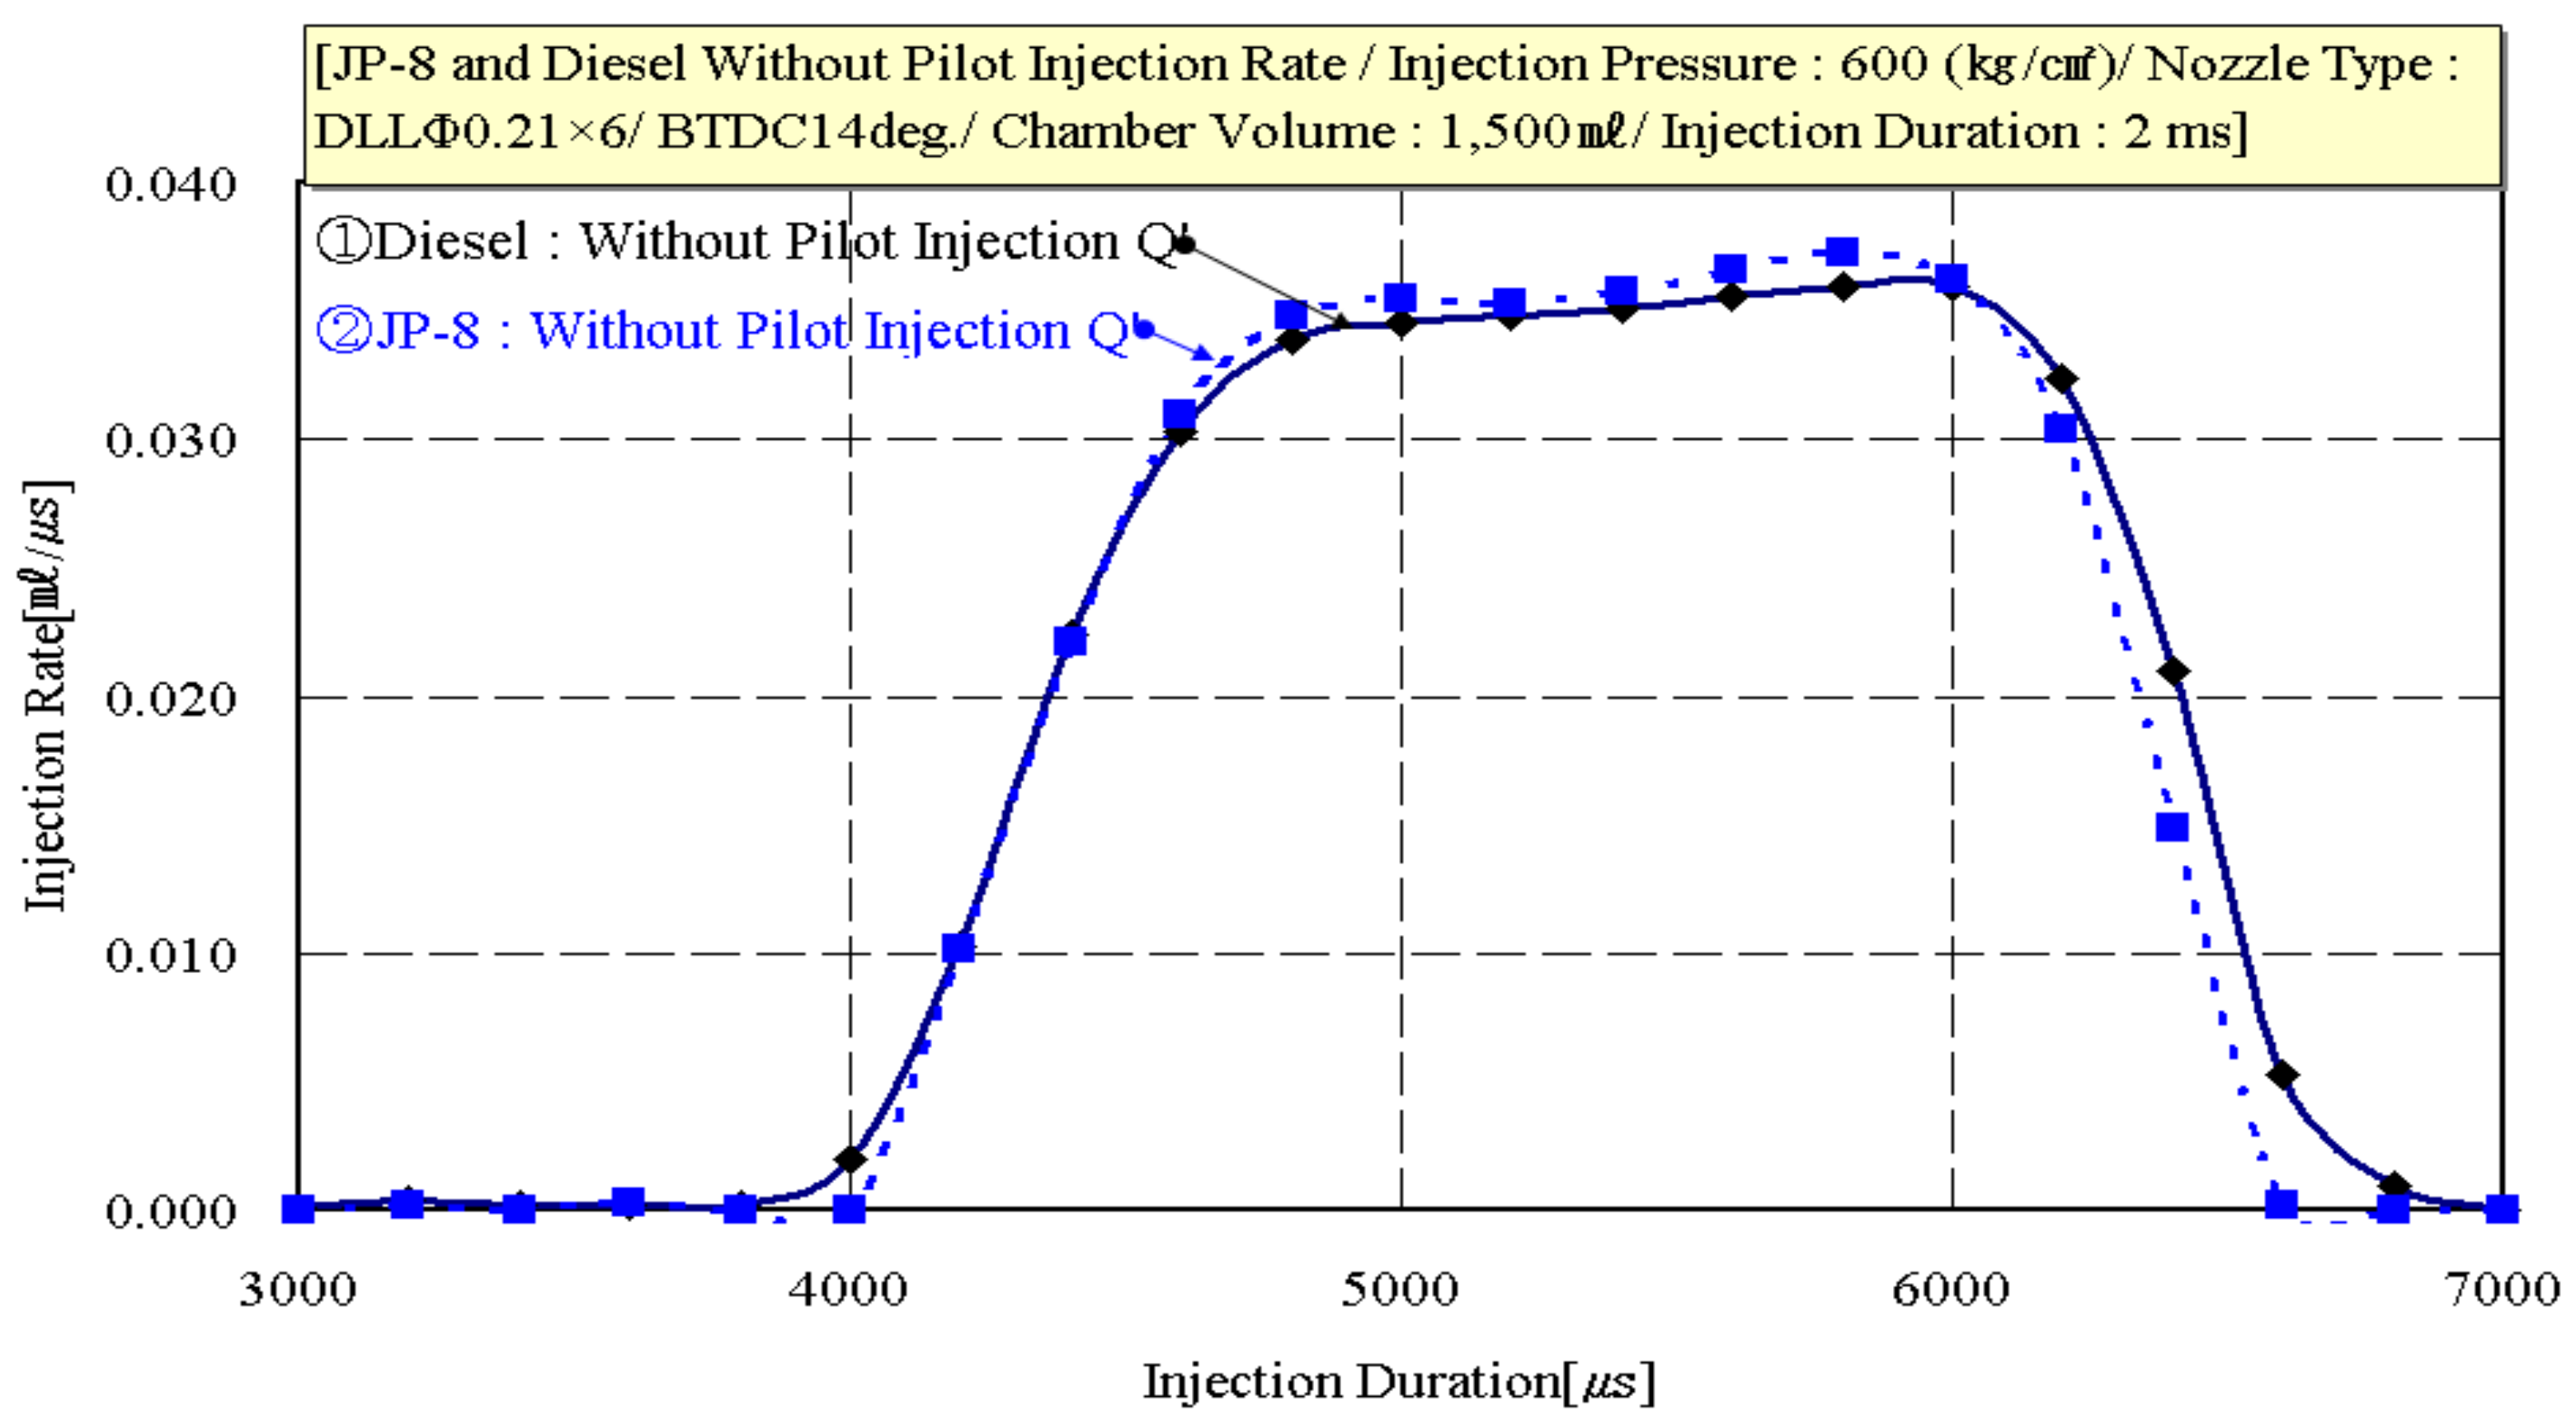
3.1.4. Injection Rate
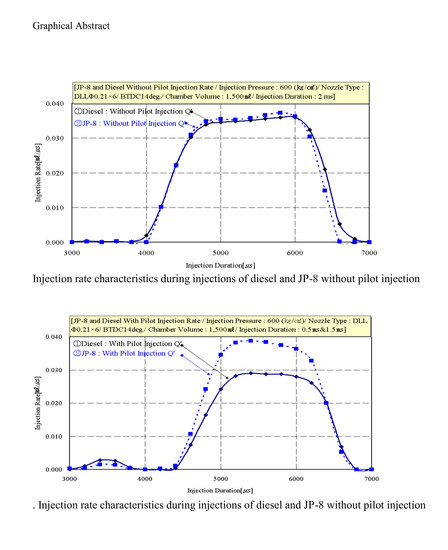
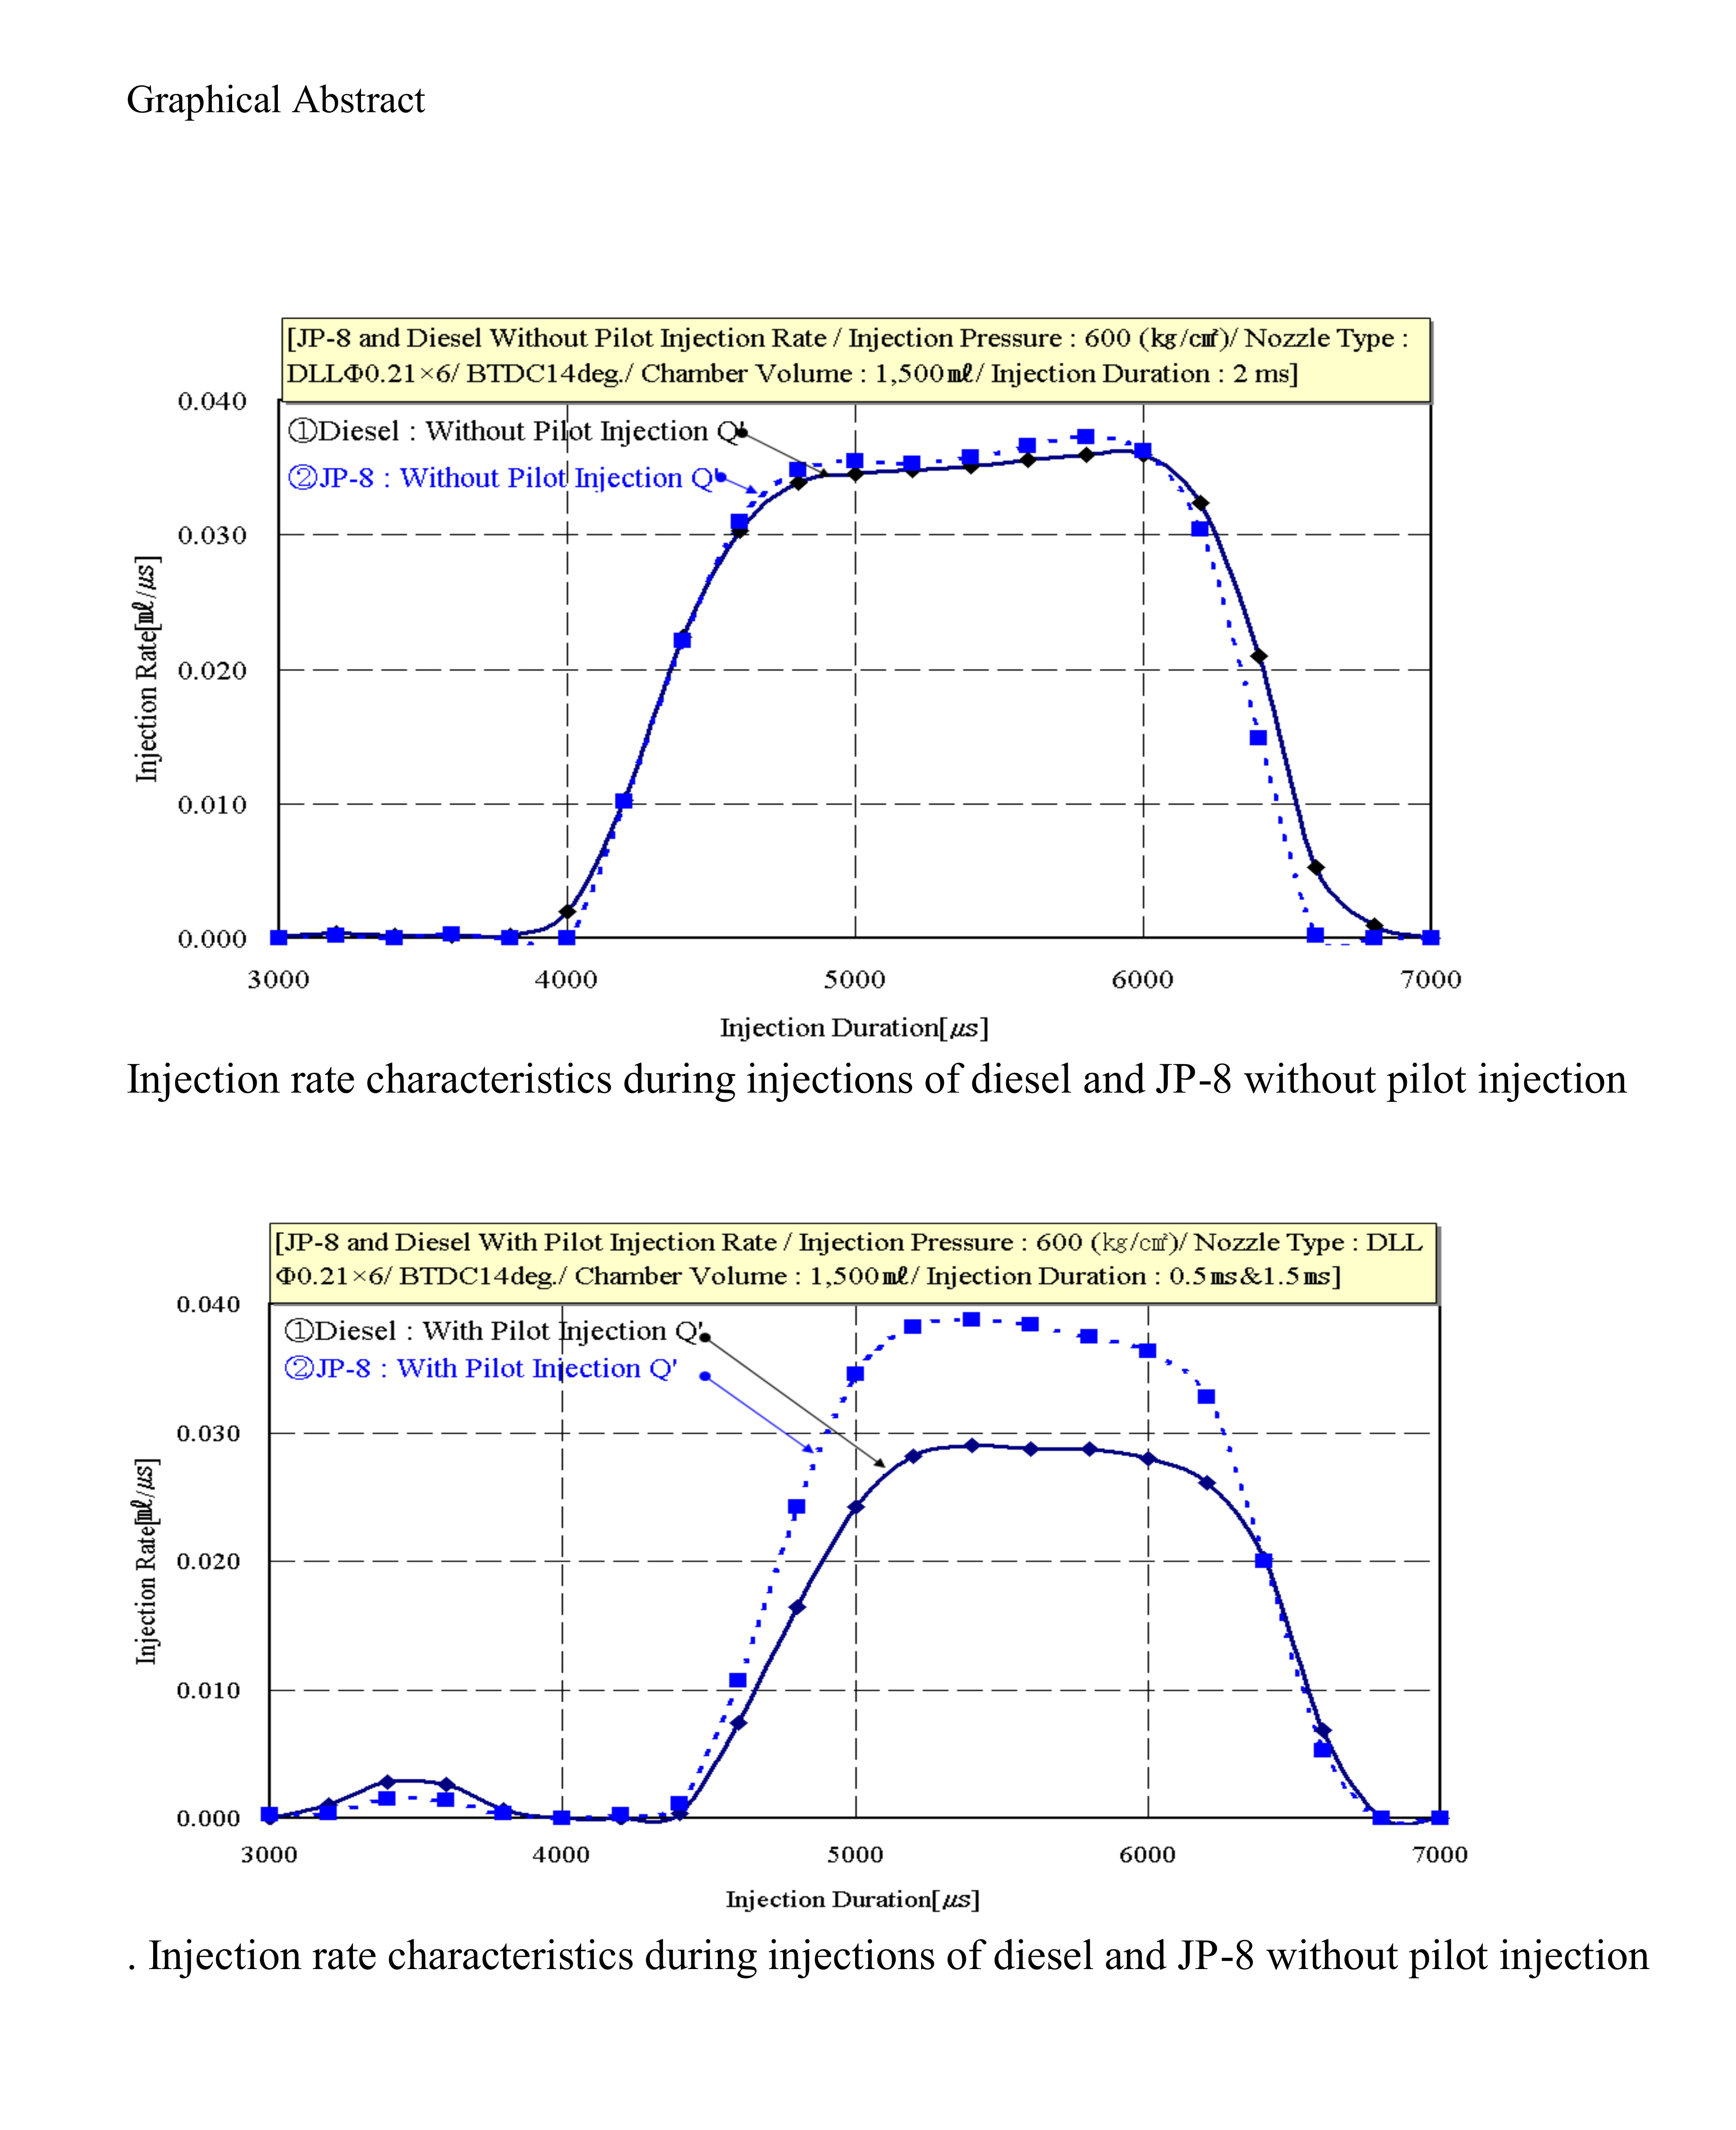
Figure 9 shows the injection rate for JP-8 and diesel without pilot injection. When we compare this injection rate to the ECU pulses in Figure 4 and the needle lift in Figure 8, the JP-8 and diesel’s injection time was similar at 3000 µs, while the end of the injection rate was almost the same at 7000 µs. This was moved forward by about 1000 µs in the ECU-Logic when the engine was being operated.
The injection rate measurements of JP-8 and diesel when a pilot time period was not added were compared through the accumulated injection quantity measurement method. Accordingly, the accumulated injection quantities for JP-8 (injection time: 3.6 × 10⁹ µs, injection quantity: 6.312 × 10⁷ mL) and diesel (injection time: 3.6 × 10⁹ µs, injection quantity: 6.584 × 10⁷ mL) were led to flow into a container through the fixed chamber pressure.
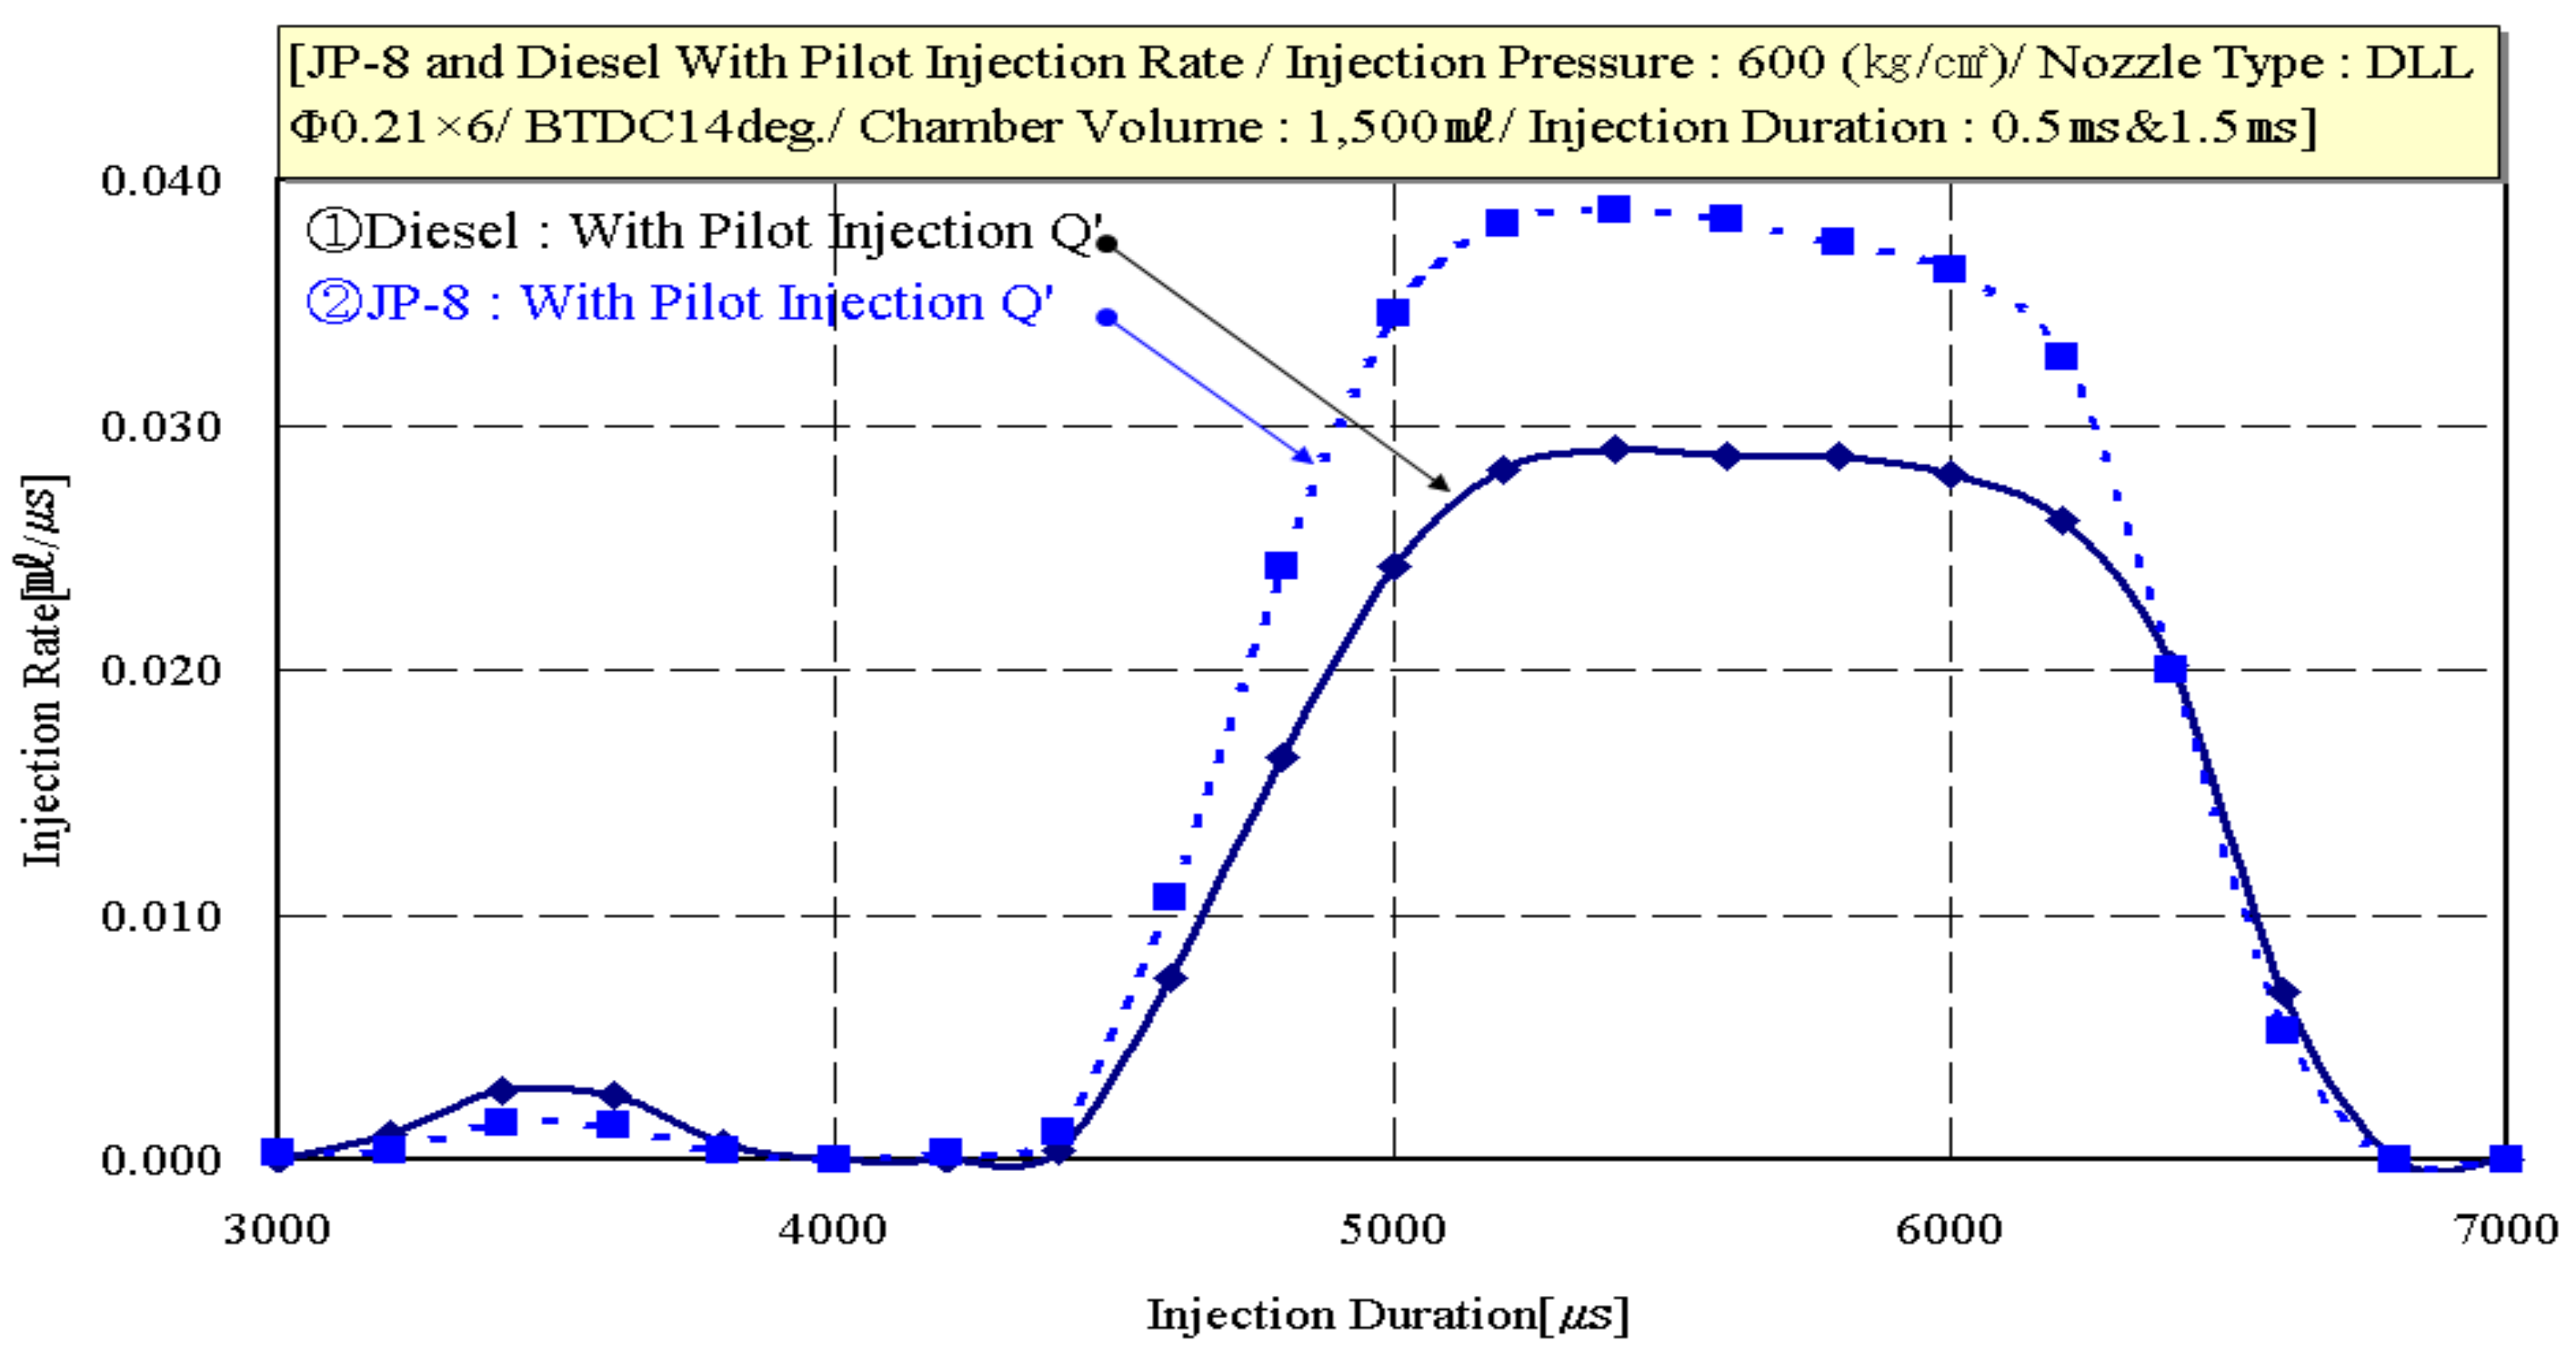
This is the result of separating the pilot injection time in the main injection mode in Figure 10. The abovementioned injection quantities for JP-8 and diesel were measured through the accumulated injection quantity measurement method, and an injection rate pulse was made in the internal pressure of the chamber and pipe to compare these results with the injection quantity accumulated in the test bench.
3.1.5. Injection Quantity and Spill Injection Quantity
Figure 11 shows the fuel injection quantities for JP-8 and diesel at 2000 rpm, with and without pilot injection. Here, the injection quantity per unit of time was about 120 mL/min for JP-8 and diesel with pilot injection. However, without pilot injection, the JP-8 and diesel fuels reached 130–150 mL/min, which was about 10–20 mL/min higher than when pilot injection was included. Owing to an increase in the opening and closing in the common rail injector’s oil pressure valve, the needle valve movement was higher, and an increase in the injection quantity could be expected.
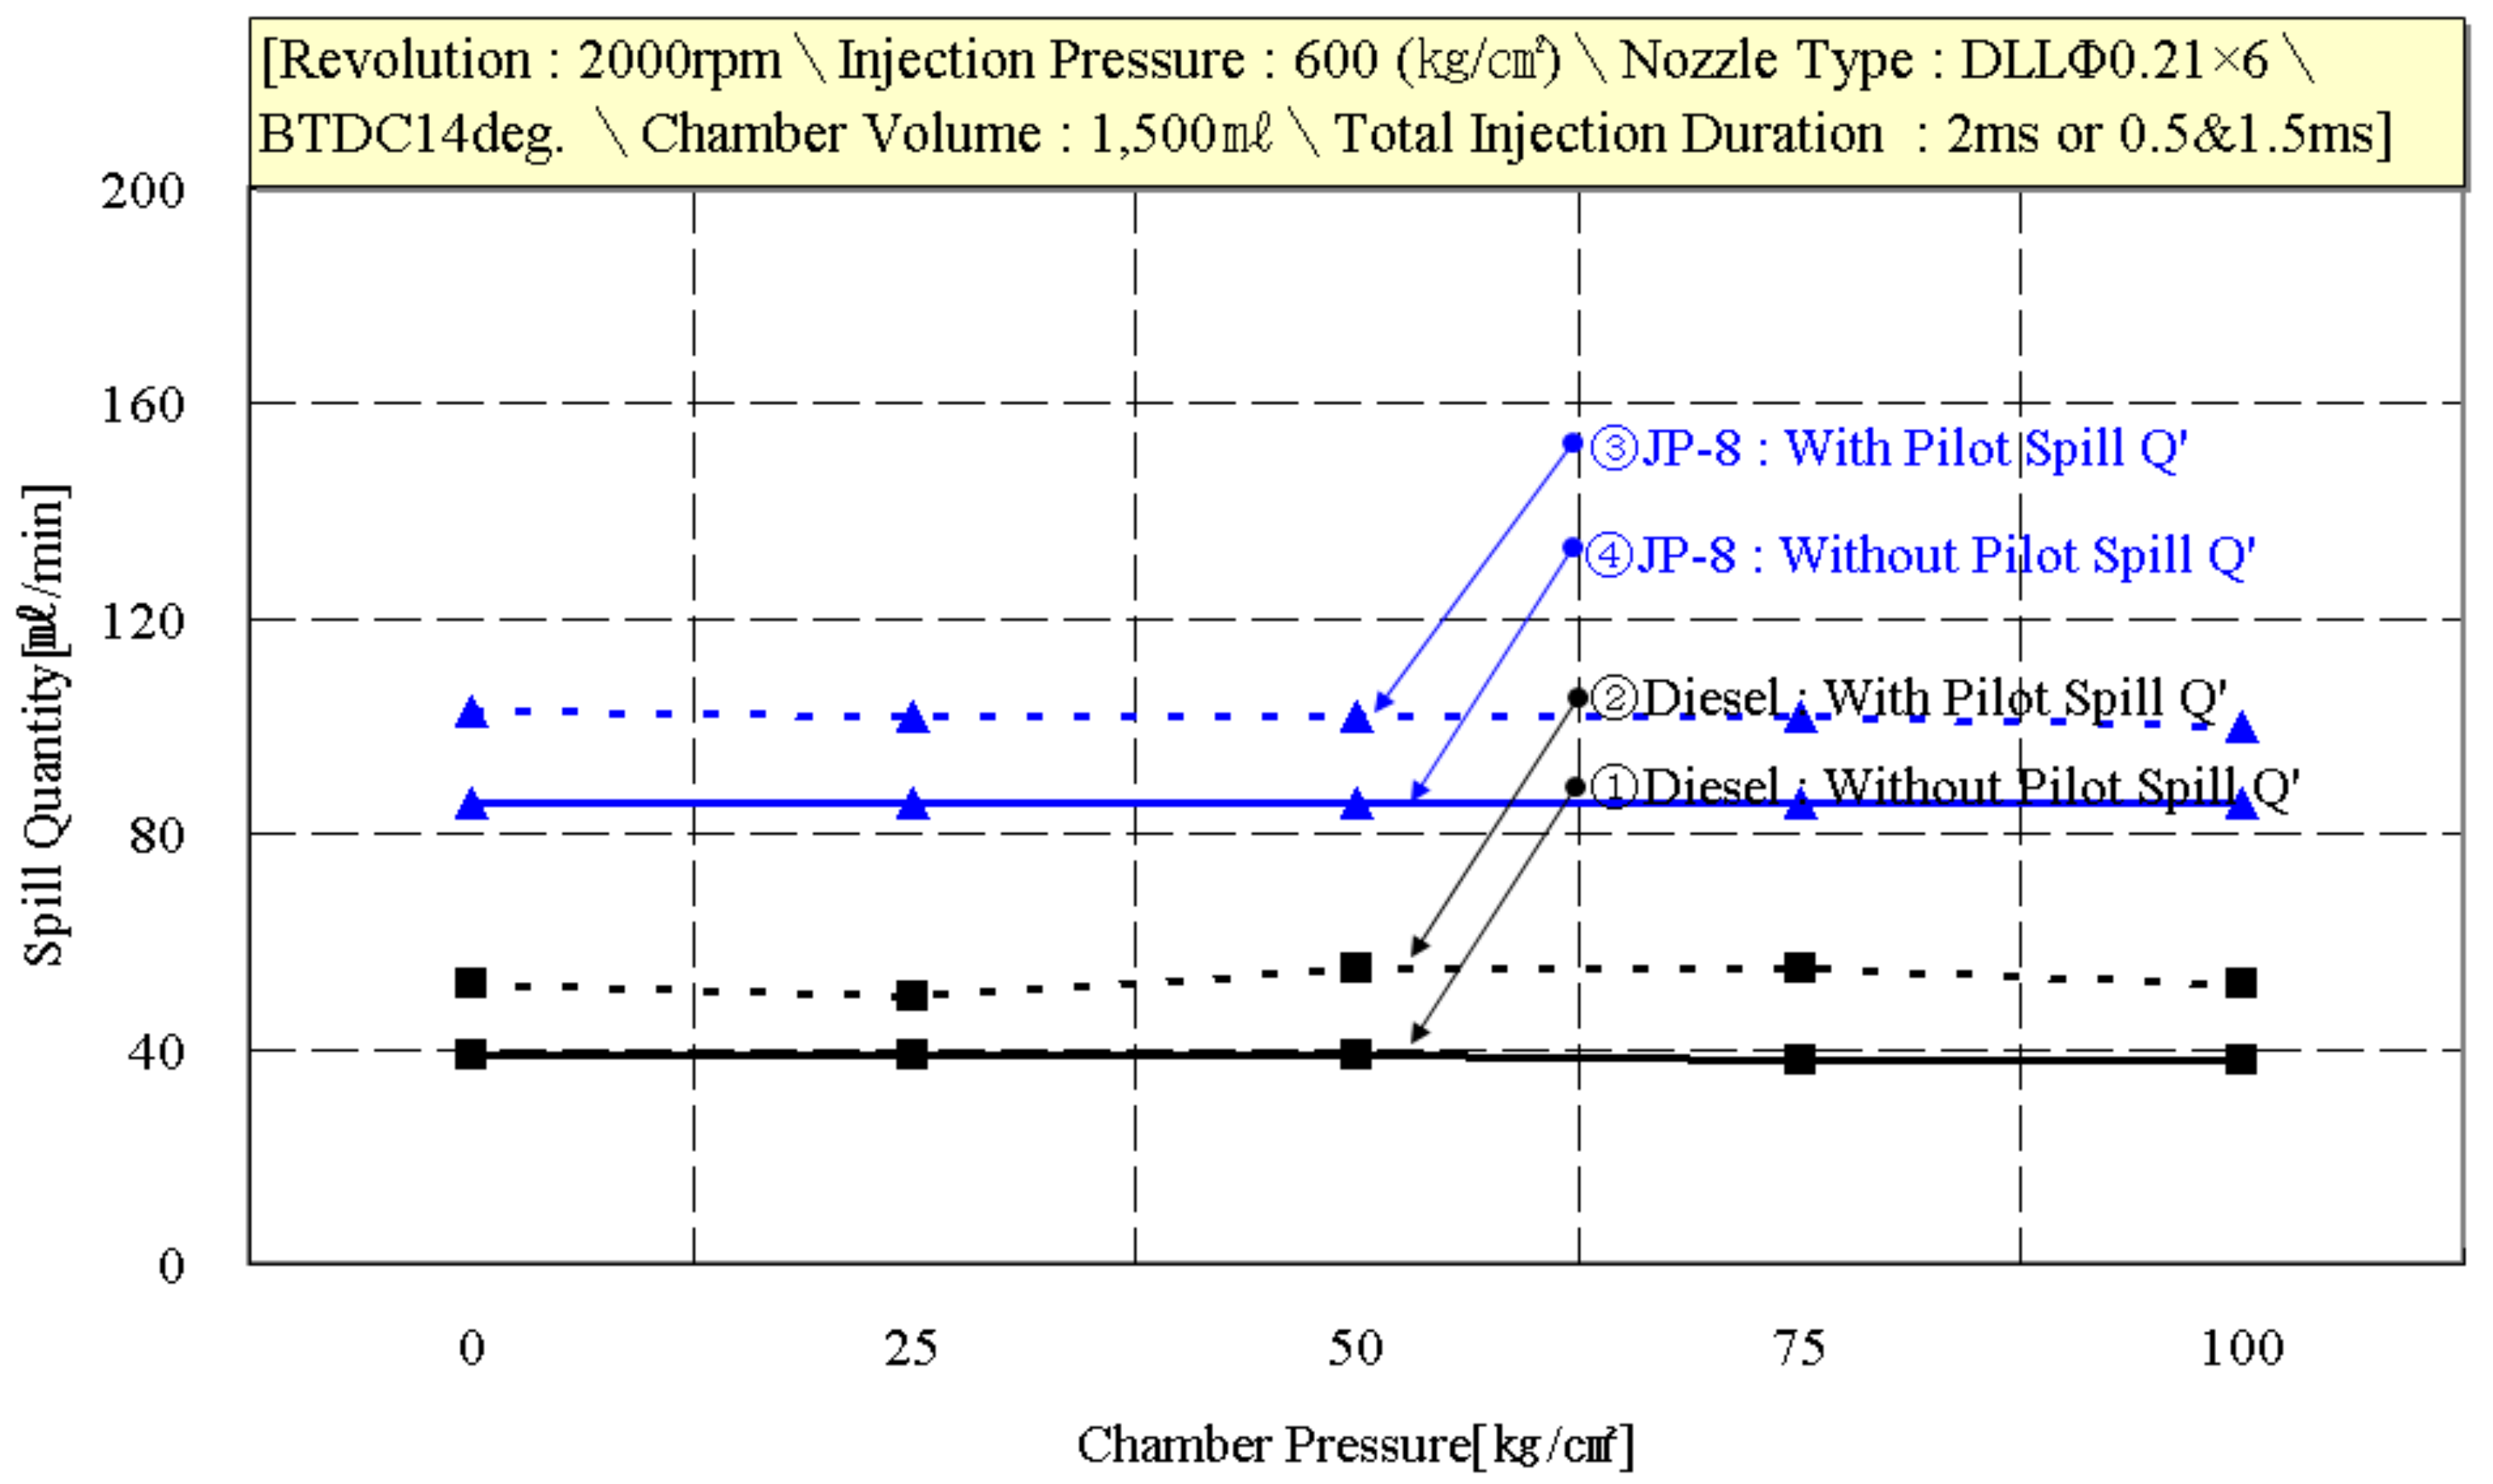
Figure 12 shows the spill quantities for JP-8 and diesel at 2000 rpm with and without pilot injection. Here, the spill quantity without pilot injection was 80 mL/min for JP-8 and 40 mL/min for diesel, making JP-8 almost twice as high. In the process of controlling the common rail injector solenoid through ECU & EDU (Electric Dosing Unit), the number of times that the solenoid oil-pressure valve operated per unit of time increased in order to maintain the injection quantity per unit of time, based on the level of diesel volume.
3.2. Pilot and Main Injection Quantities According to Engine Revolution
3.2.1. Injection Quantity without Pilot Injection
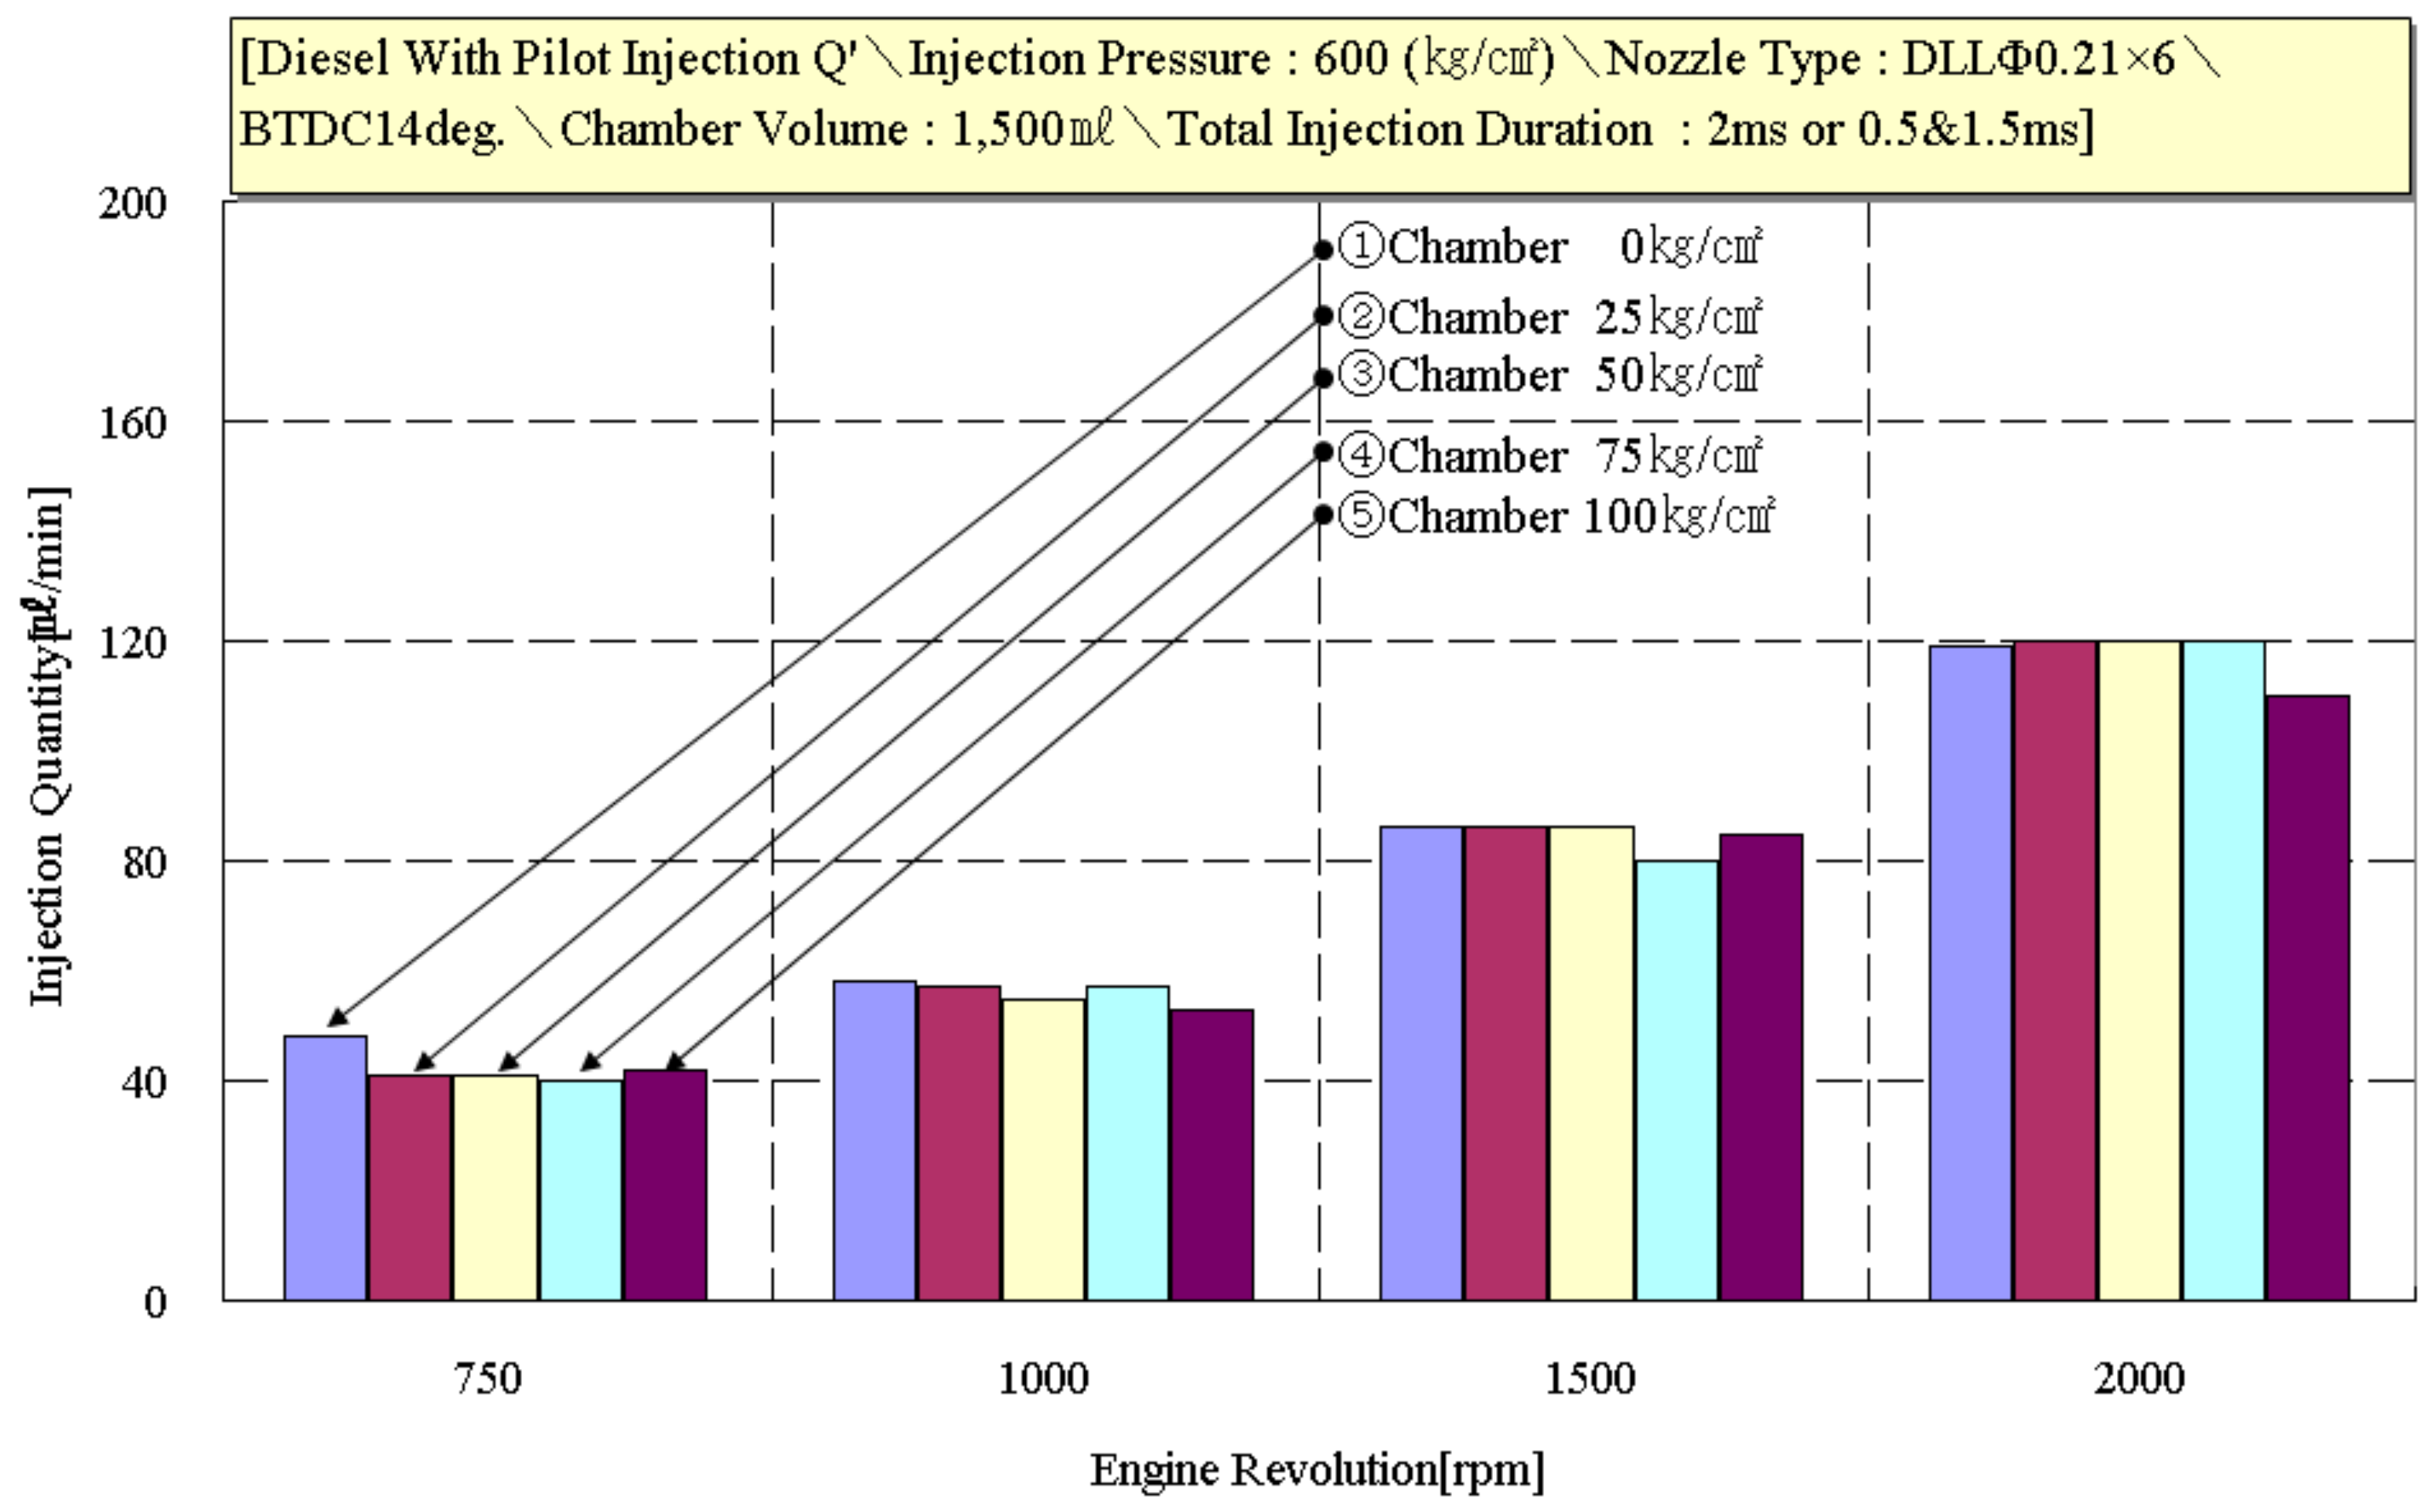
Figure 13 shows the diesel-fuel injection quantity according to engine revolutions without pilot injection. Looking at the injection quantity according to engine revolutions, at 750–2000 rpm, the diesel injection quantities were uniform at each level of chamber pressure. This shows that the common rail system has been optimized according to the initial properties of diesel.
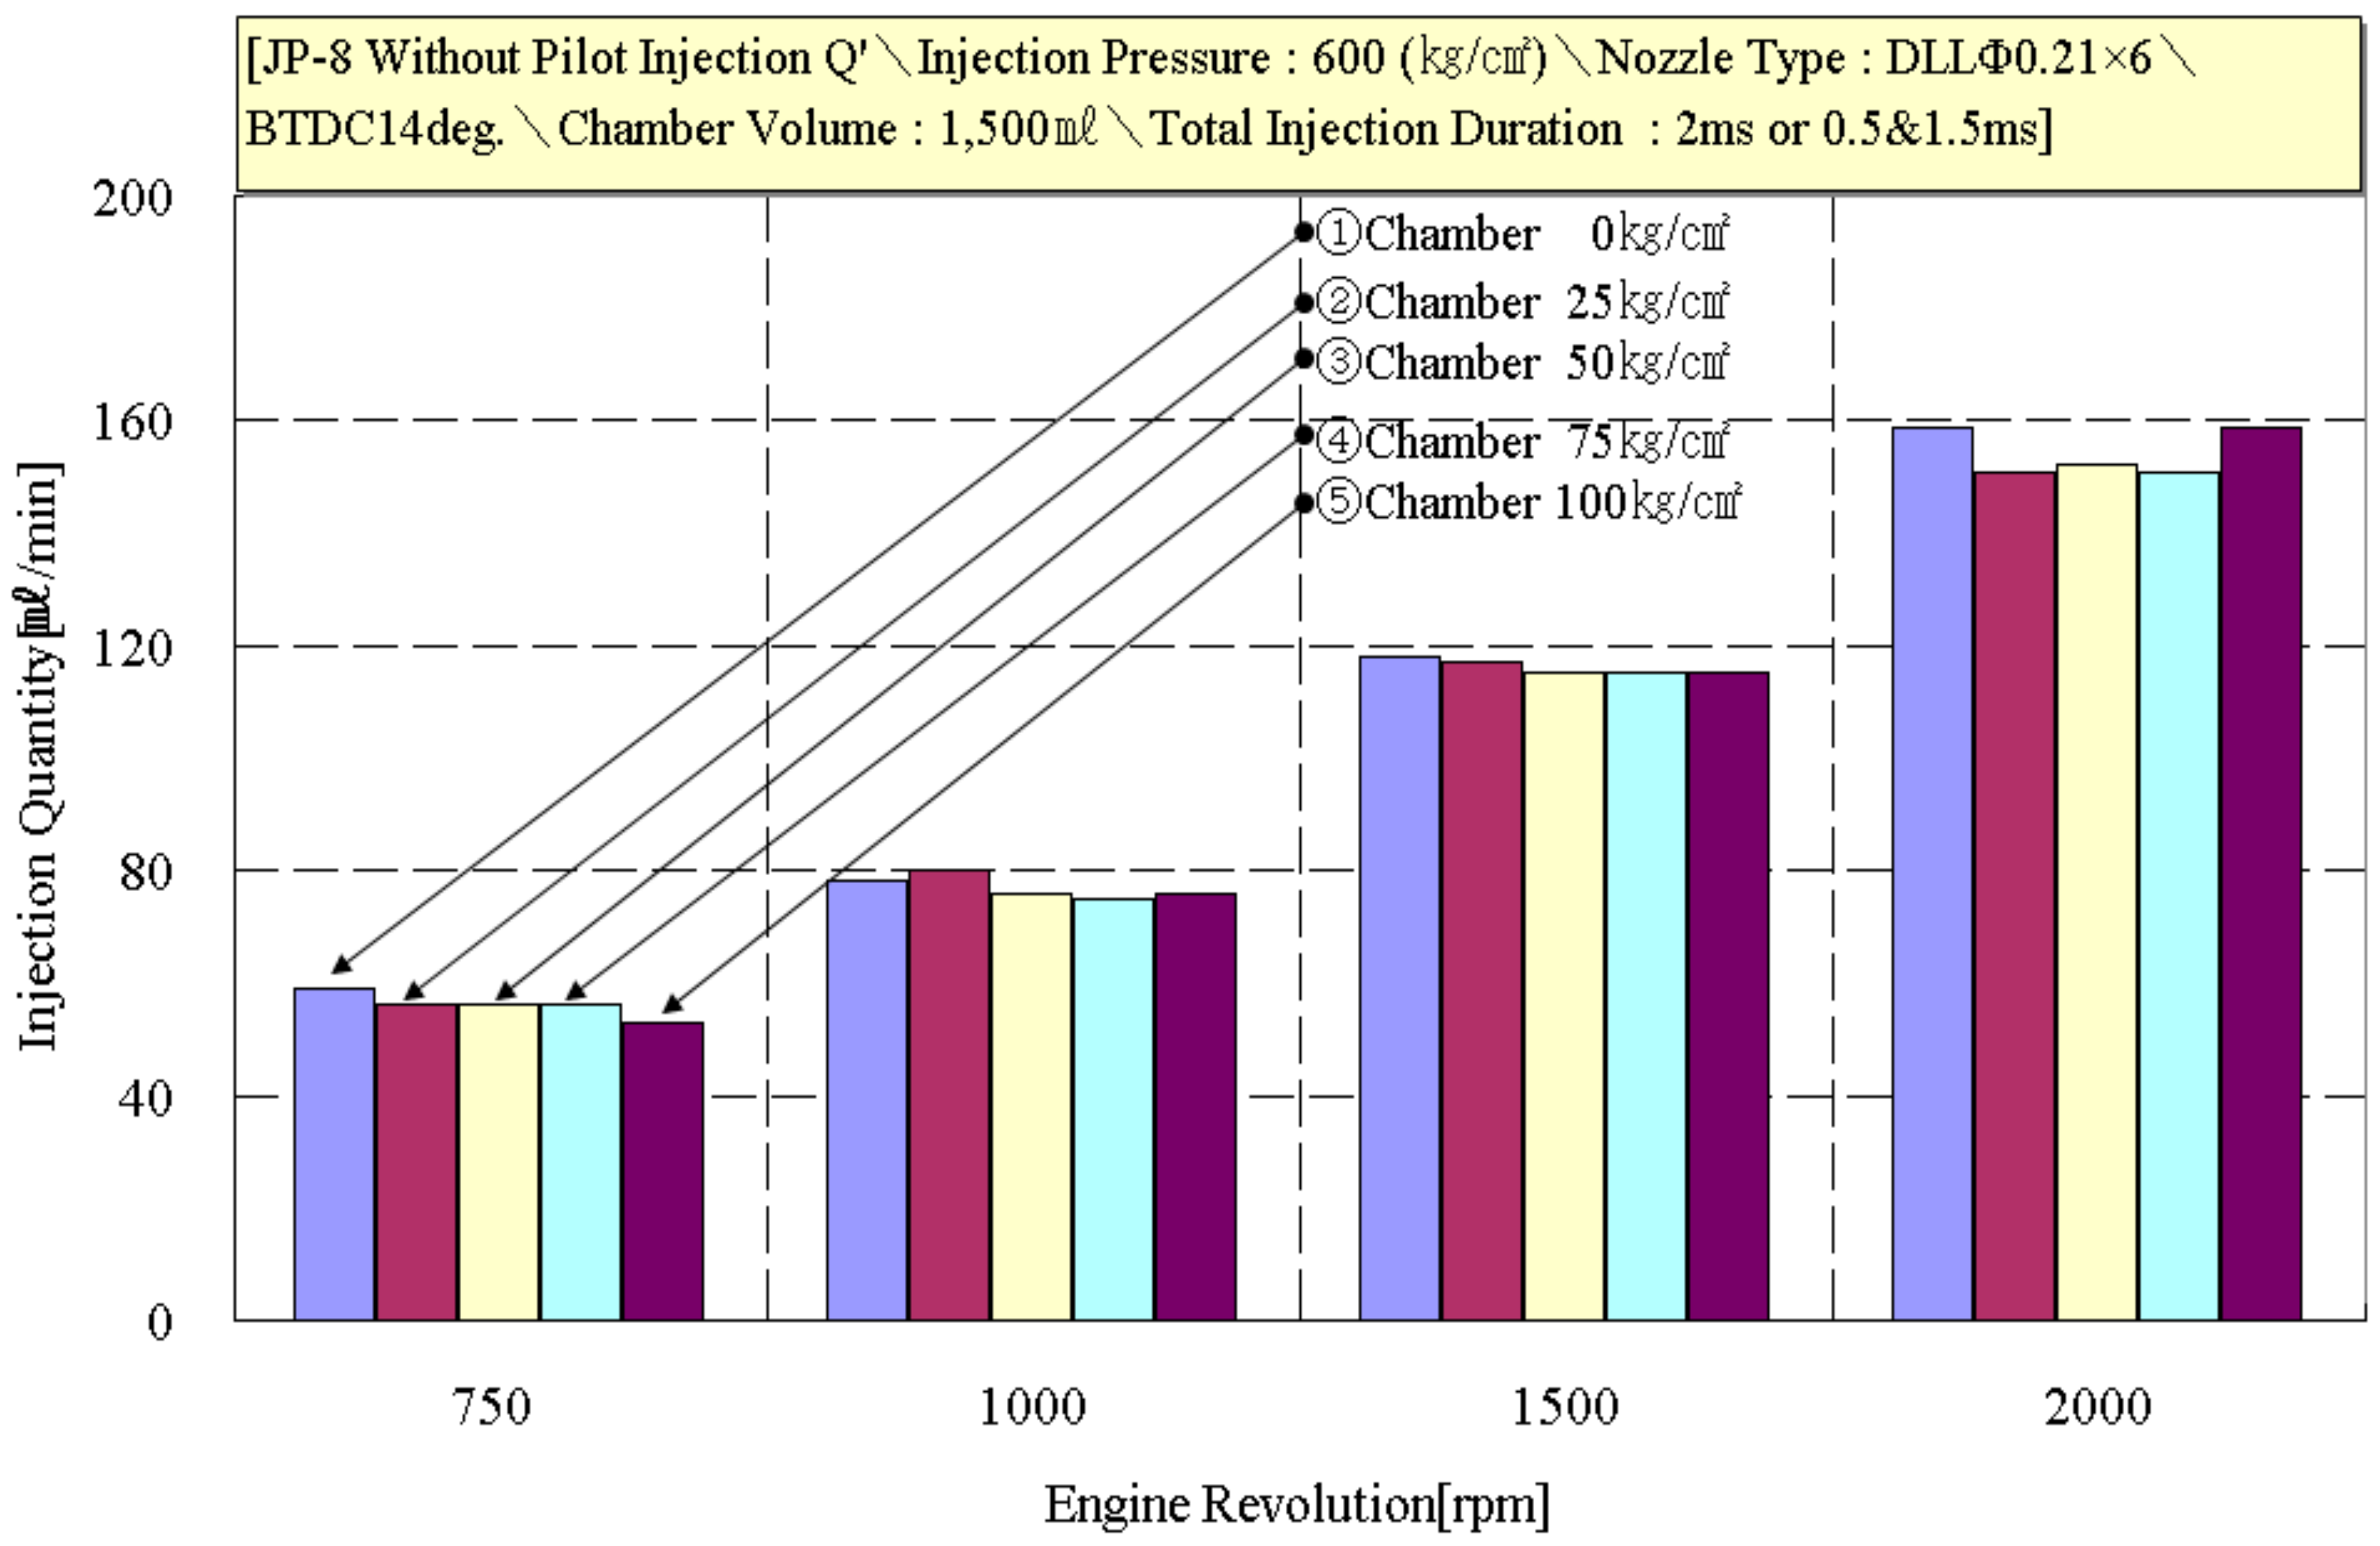
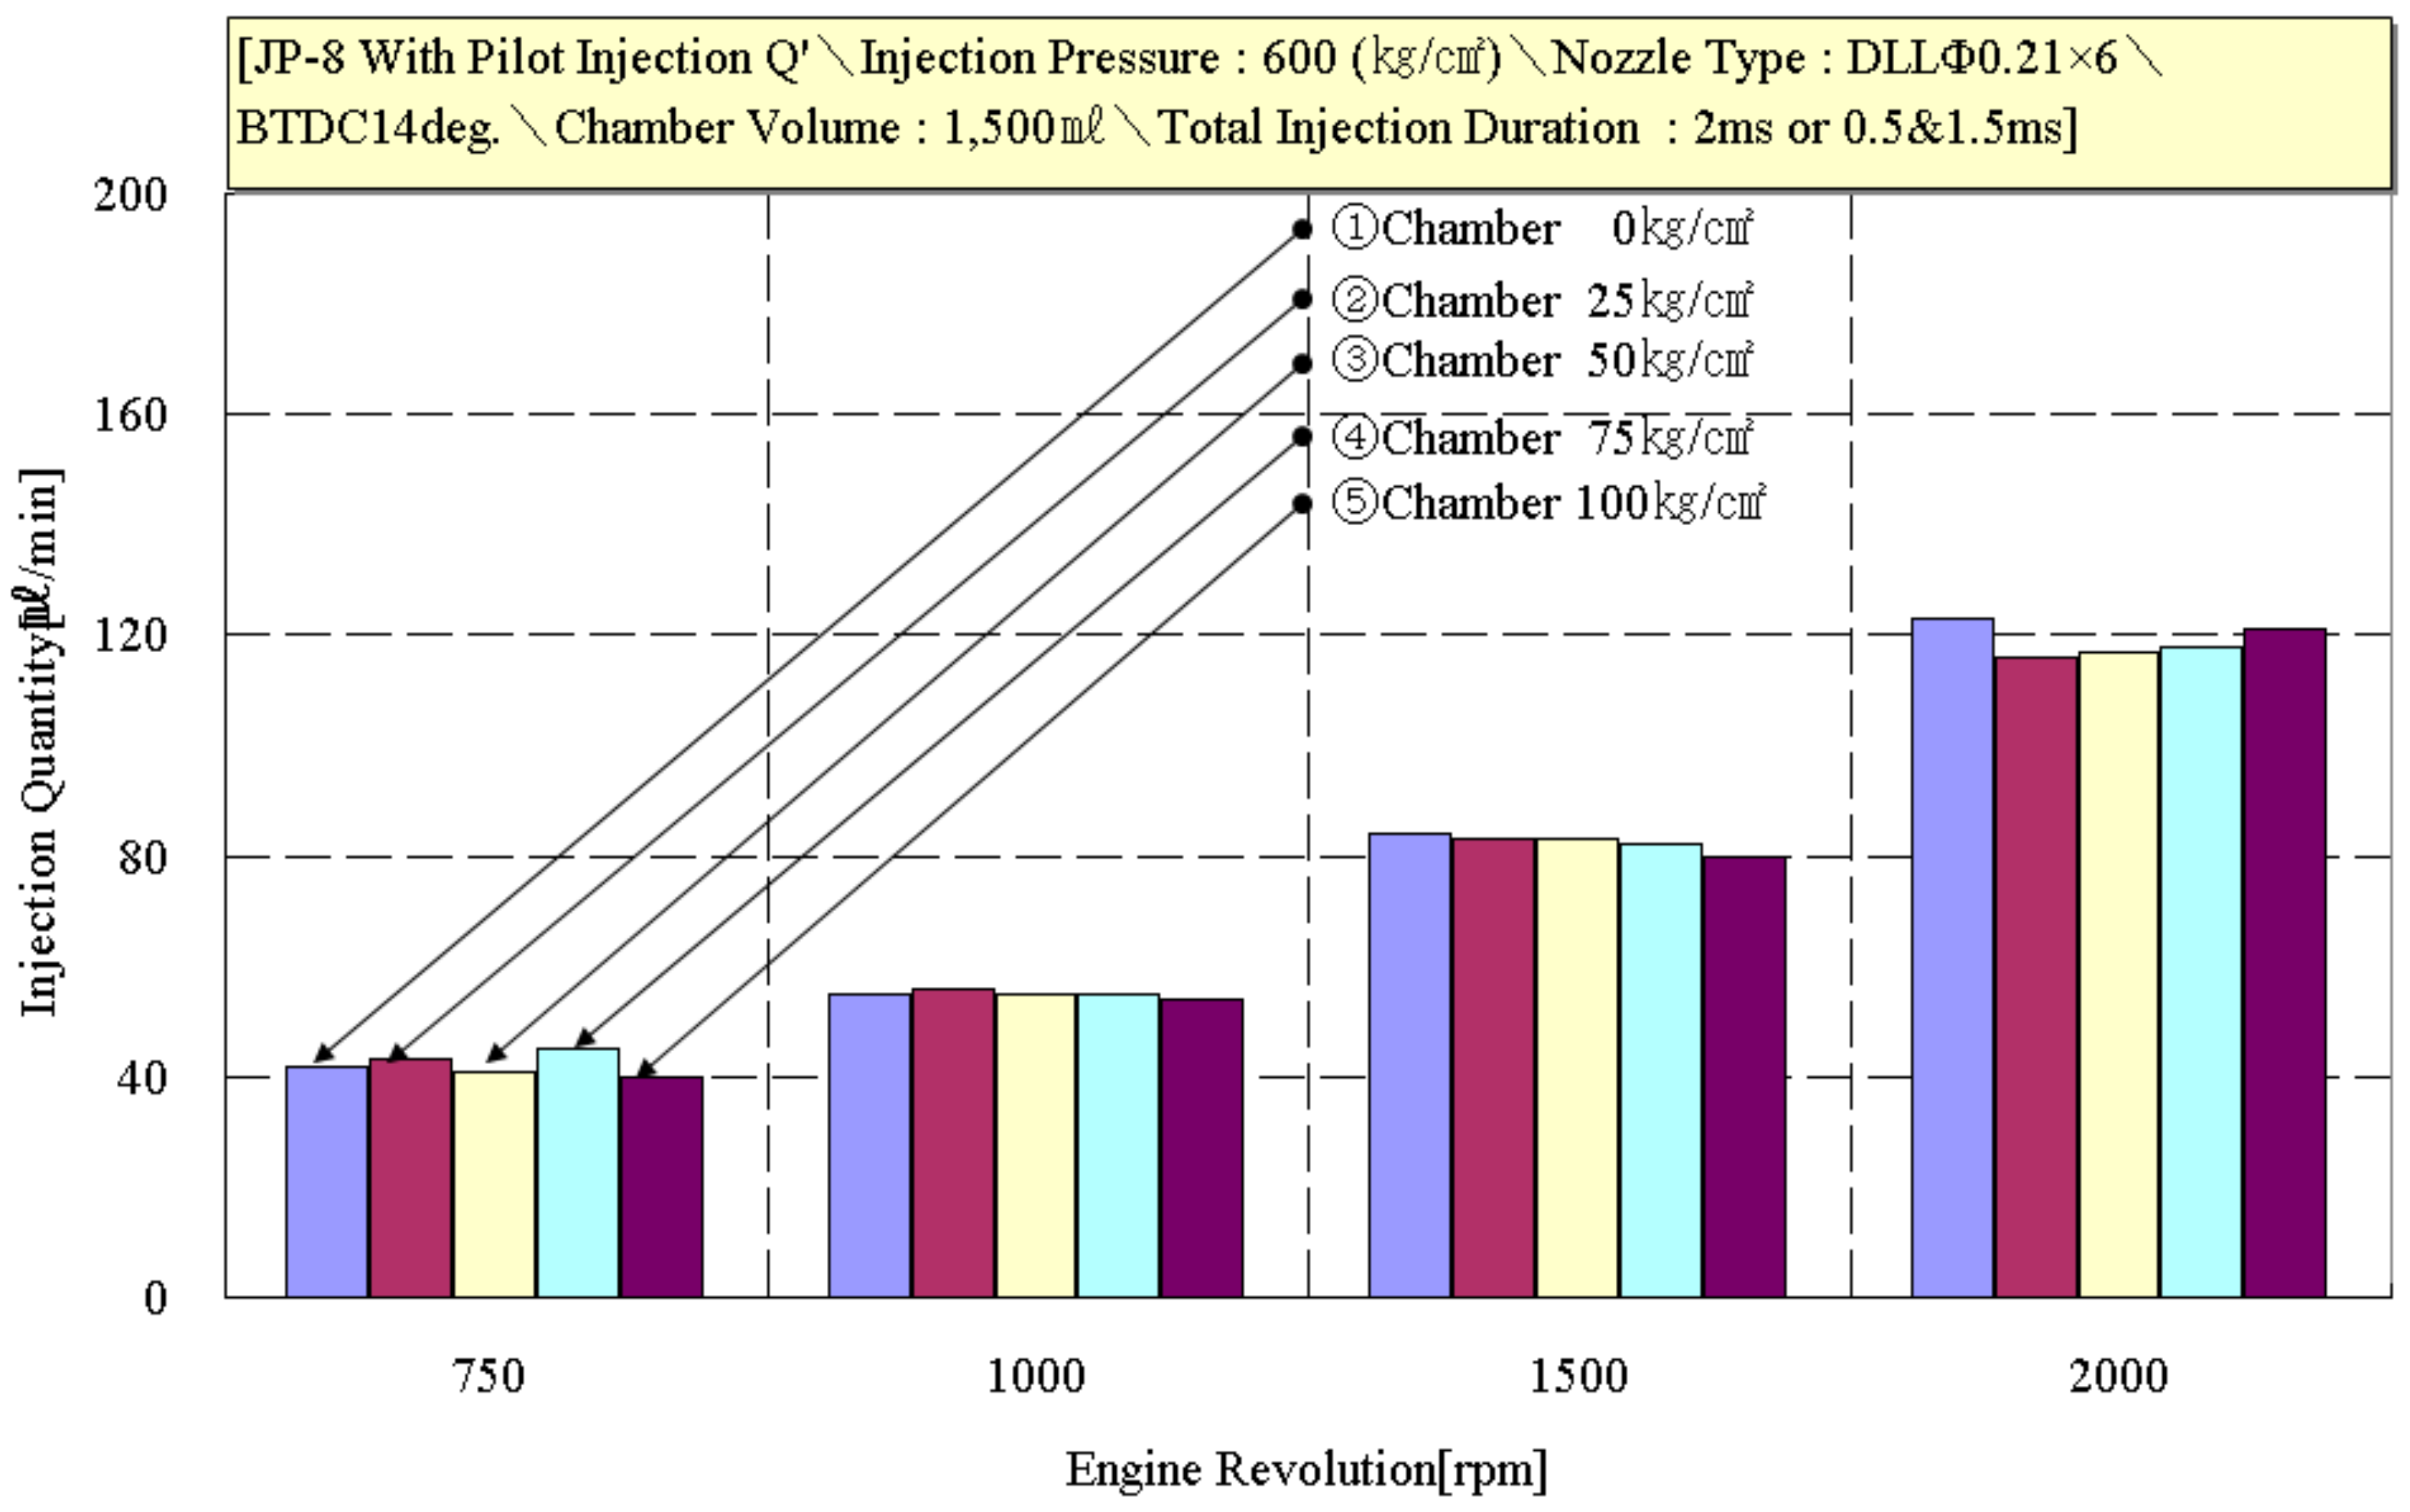
Figure 14 shows the injection quantities of JP-8 aviation fuel according to engine revolutions without pilot injection. If we compare this to the diesel fuel in Figure 14, we can see that the injection quantities in the low-speed section (750–1000 rpm) were regular. However, in the high-speed section (1500–2000 rpm) they were greater than those of diesel by approximately 15–20 mL/min. This shows that compared to the low-speed section, the high-speed section created a needle lift operation time, which was longer in proportion to the increase in the pressure valve’s amount of operation. As a result, as applied to the common rail system used with the JP-8 fuel, the increase in injection per unit time by the diesel fuel can cause an increase in fuel economy during engine application.
3.2.2. Injection Quantity with Pilot Injection
Figure 15 shows the diesel fuel injection quantities according to engine revolutions with pilot injection. Looking at the injection rates according to number of revolutions, the diesel fuel injection quantities were uniform for each level of chamber pressure (0–100 kg/cm2) at 750–2000 rpm. This shows that the common rail system has been optimized according to the diesel’s initial properties, and the quantity at the maximum number of revolutions was about 20 mL/min lower than that of Figure 13 when pilot injection was not used.
Figure 16 shows the JP-8 aviation fuel injection quantities according to engine revolutions without pilot injection. Compared to Figure 15 where pilot injection was not used, the injection quantities of all sections (750–2000 rpm) were 40–50 mL/min lower. This shows that in the low- and high-speed sections, the amount of pressure valve operation was increased compared to when pilot injection was not used and the needle lift operation time increased. When JP-8 was used with a common rail, the injection quantity per unit of time increased compared to the diesel fuel according to the degree of pressure valve optimization. Therefore, when JP-8 aviation fuel is used, the spill valve design should be considered.
4. Conclusions
- (1)
- JP-8 has a lower value than the diesel fuel’s (DF-1) required minimum kinematic viscosity of 1.3 cSt/40 °C (DF-2’s average kinematic viscosity is 2.73–2.8 cSt/40 °C), and there is the possibility that the common rail pump and injector’s friction points will become stuck.
- (2)
- Pressure pulses, which occur owing to pressure waves caused by injection, are a major cause of changes in the injection rate, and they can have a great impact on engine performance; thus, they should be reduced as much as possible.
- (3)
- For the same injection period, the diesel fuel needle lift gap is 0.325 mm and 0.35 mm for JP-8; this means that JP-8, which has a lower density, requires more injection time than diesel fuel.
- (4)
- The injection rate of JP-8 is higher than that of diesel fuel; thus, under fixed torque conditions, the amount of JP-8 consumed per unit of time is expected to be higher than that of diesel fuel.
- (5)
- When used in a diesel engine with an electronic common rail and without pilot injection, JP-8 has a similar low amount of heat to that of diesel fuel; thus, there is a possibility of increasing engine power without unsafe combustion.
- (6)
- The difference in spilling between diesel and JP-8 aviation fuel is greater than the difference in the injection amount per time. It is expected that in the process of controlling the injector solenoid through ECU and EDU, the oil pressure valve and the needle valve operate to a higher extent in order to maintain the diesel fuel’s injection quantity volume.
Acknowledgments
This study was supported by the development of key fusion technology of the industry—academia research cooperation cluster support project.
Author Contributions
Seomoon Yang and Changhee Lee conceived and designed the experiments; Seomoon Yang performed the experiments; Changhee Lee and Hoonyoung Moon analyzed the data; Seomoon Yang contributed reagents/materials/analysis tools; Changhee Lee wrote the paper.
Conflicts of Interest
The authors declare no conflict of interest.
References
- Kurman, M.; Bravo, L.; Kweon, C. The effect of fuel nozzle configuration on JP-8 sprays at diesel engine conditions. In Proceedings of the ILASS Americas 26th Annual Conference on Liquid Atomization and Spray Systems, Portland, OR, USA, 5–8 May 2014. [Google Scholar]
- Papagiannakis, R.; Kotsiopoulos, P.; Hountalas, D.; Yfantis, E. Single Fuel Research Program Comparative Results of the Use of JP-8 Aviation Fuel Versus Diesel Fuel on a Direct Injection and Indirect Injection Diesel Engine; SAE Technical Paper; 2006-01-1673; SAE: Warrendale, PA, USA, 2006. [Google Scholar]
- Lee, C. An experimental study on advanced injection rate measurement of a marine engine using the Zeuch method. J. Therm. Sci. Technol. 2016, 11, JTST0026. [Google Scholar] [CrossRef]
- Yu, J.; Lee, J.; Bae, C.S. Diemethyl Ether(DME) Spray Characteristics in Common Rail High Presure Injection Equipment; ISAF XIV Technical Papers; 2002-VT-10; ISAF: Kabul, Afghanistan, 2002. [Google Scholar]
- Benajes, J.; Pastor, J.V.; Payri, R.; Plazas, A.H. Analysis of the influence of diesel nozzle geometry in the injection rate characteristics. J. Fluids Eng. 2004, 126, 63–71. [Google Scholar] [CrossRef]
- Forester, D.R.; Malik, B.B.; Taylor, S.E. Jet fuel thermal stability-lab testing for JP8+100. In Proceedings of the International Spring Fuels & Lubricants Meeting & Exhibition, Reno, NV, USA, 6–9 May 2002. SAE2002011650. [Google Scholar]
- Gonzalez, C.; Jesik, R.L. The Multi-Fuel General Aviation Piston Engine; SAE Technical Paper; 2000-01-1714; SAE: Warrendale, PA, USA, 2000. [Google Scholar]
- Kato, N.; Moritsugu, M.; Shimura, T.; Matsui, J. Piston Temperature Measuring Technology Using Electromagnetic Induction; SAE Paper; 2001-01-2027; SAE: Warrendale, PA, USA, 2001. [Google Scholar]
- Boehner, W.; Hummel, K. Common Rail Injection System for Commercial Diesel Vehicles; SAE Paper; No. 970345; SAE: Warrendale, PA, USA, 1997. [Google Scholar]
- Diesel EMS and Injection Engineering Department. ECD-U2 System Operation Manual (for Rir Test & Engine Test); DENSO Co.: Kariya, Japan, 1996. [Google Scholar]
- Kim, Y.; Ayusawa, T.; Takishita, T.; Koo, Y.; Iwai, N. What is the potential of alcohol fuel-stratified charge engine for advanced power plant. In Proceedings of the First International Automotive Fuel Economy Research Conference, Arlington, VA, USA, 31 October–2 November 1996. [Google Scholar]
Figure 1.
Photograph of common rail injection system and test bench.
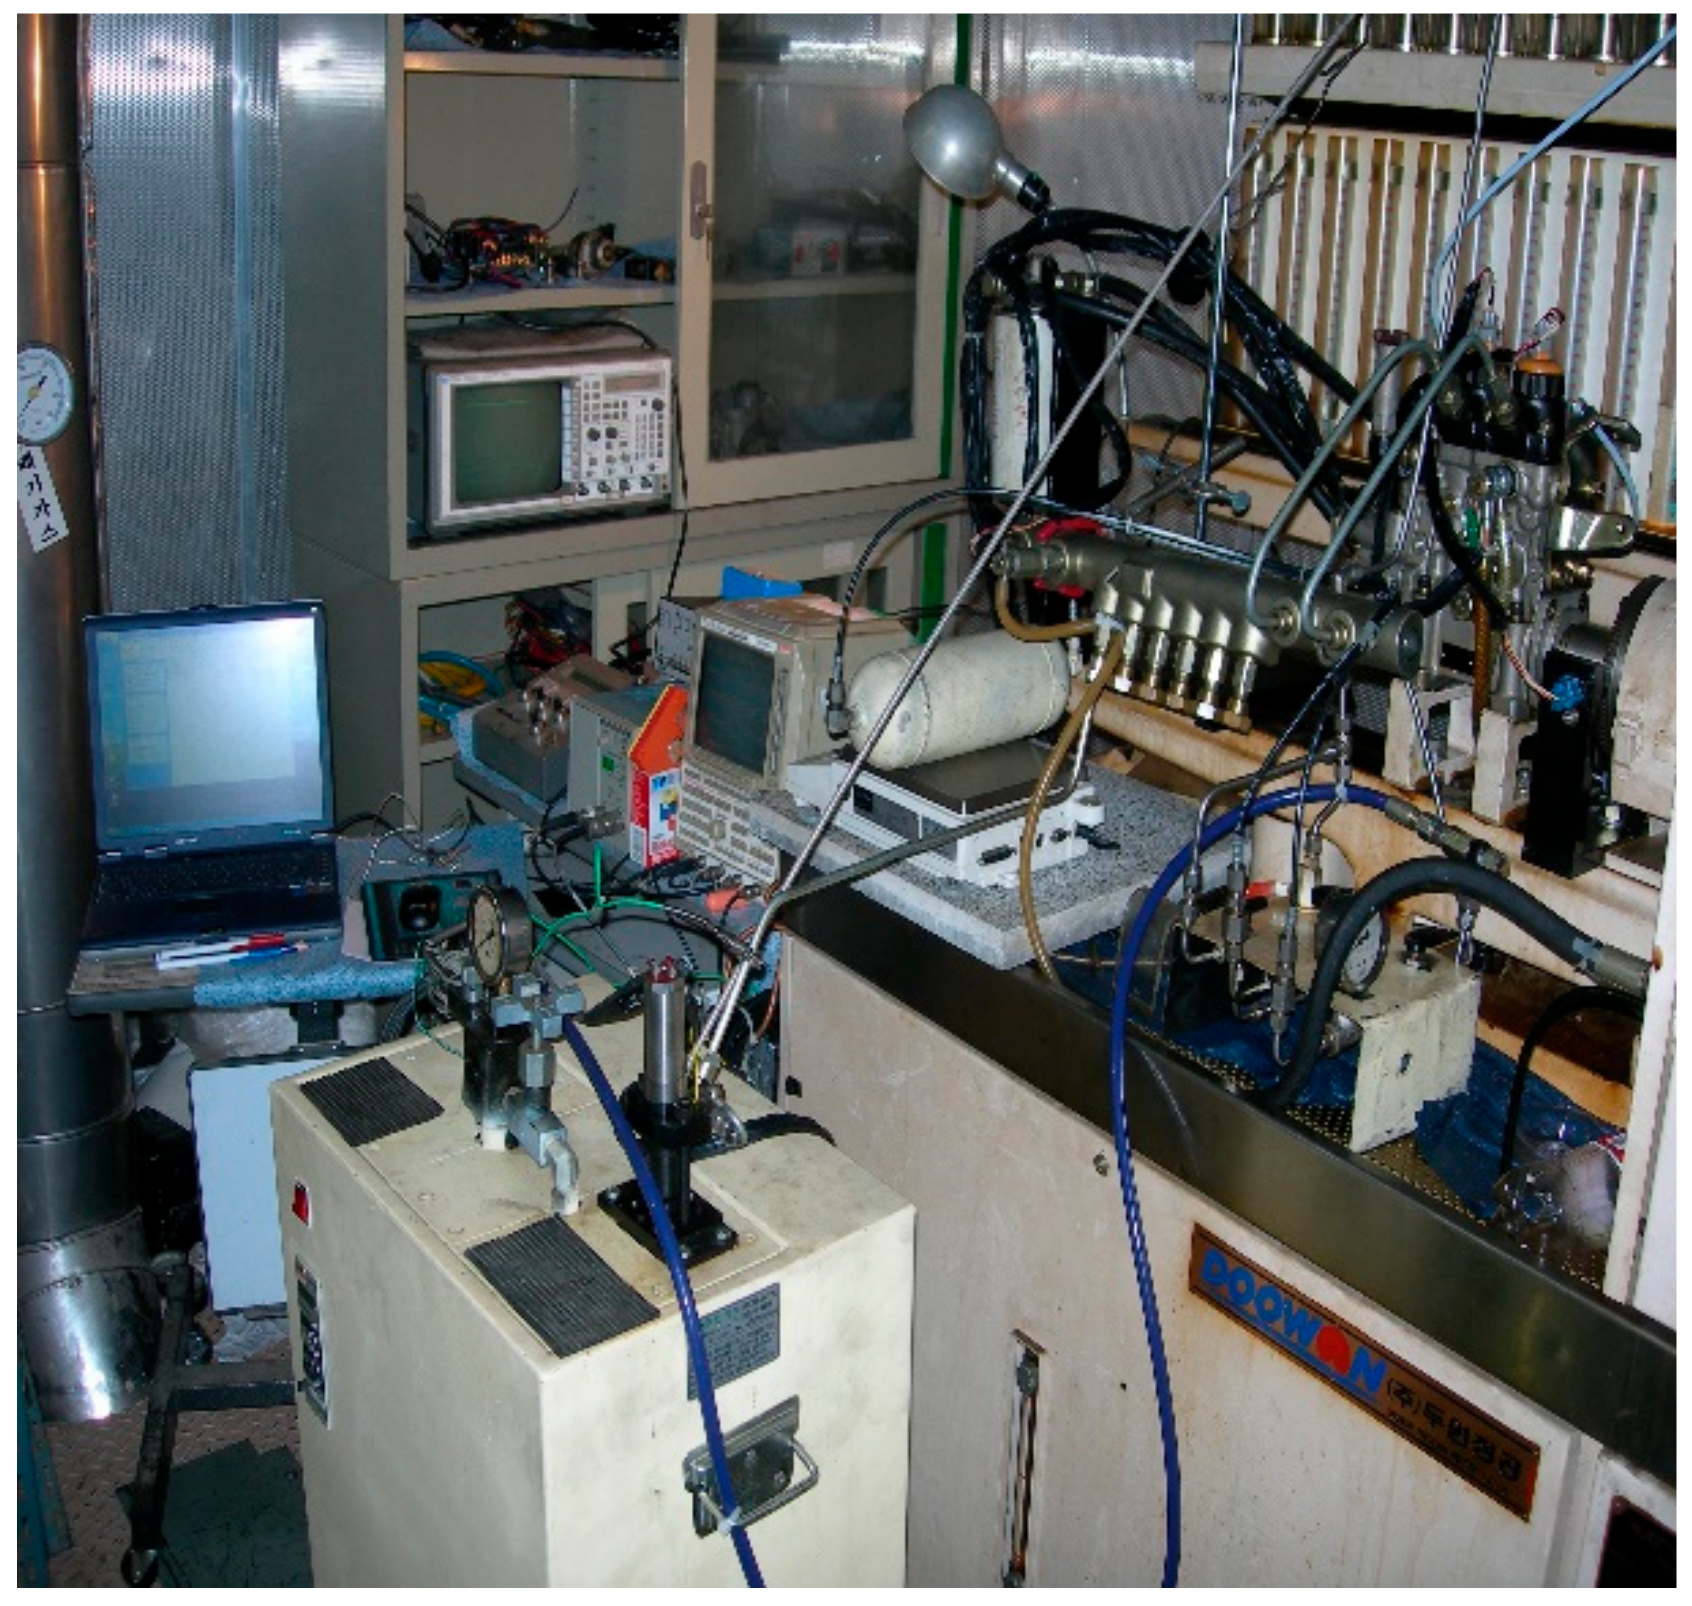
Figure 2.
Schematic diagram of control signal routes.

Figure 3.
Signal for injection of JP8 and diesel without pilot injection.

Figure 4.
Signal for injection of JP-8 and diesel with pilot injection.

Figure 5.
Fuel line pressure between common rail and injector during injections of diesel and JP-8 without pilot injection.
Figure 5.
Fuel line pressure between common rail and injector during injections of diesel and JP-8 without pilot injection.

Figure 6.
Fuel line pressure between common rail and injector during injections of diesel and JP-8 with pilot injection.
Figure 6.
Fuel line pressure between common rail and injector during injections of diesel and JP-8 with pilot injection.

Figure 7.
Needle lift characteristics during injections of diesel and JP-8 without pilot injection.
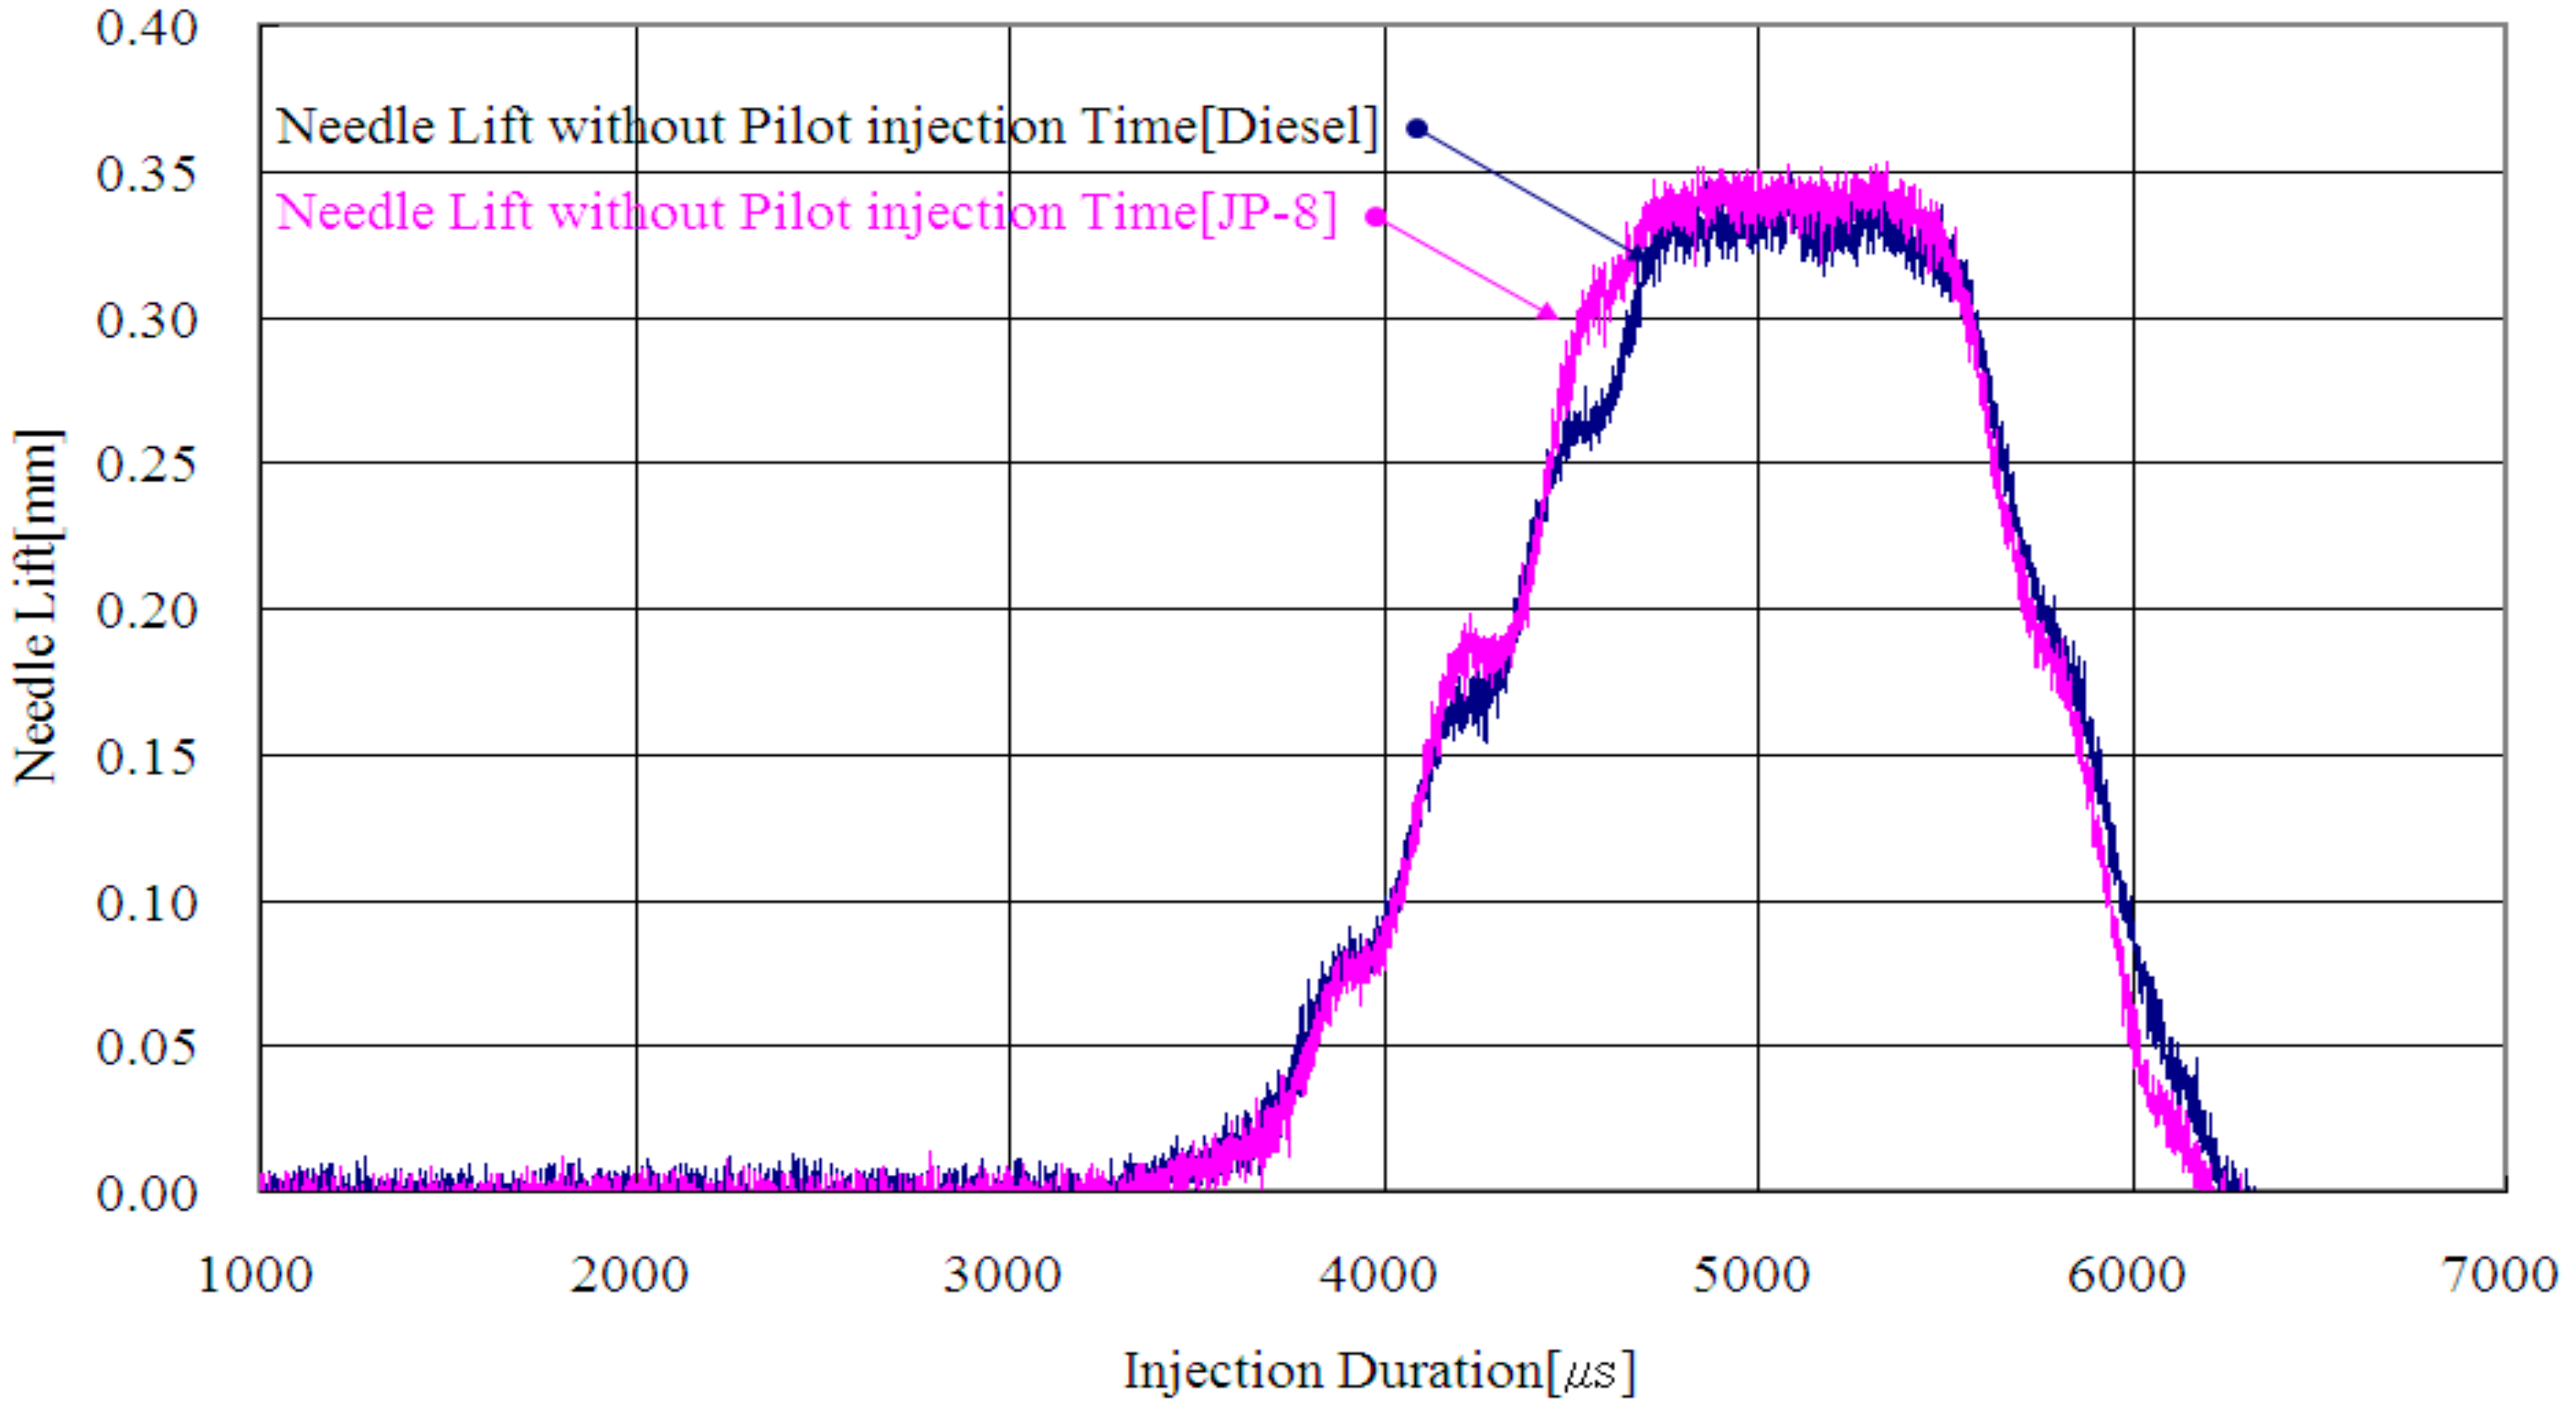
Figure 8.
Needle lift characteristics during injections of diesel and JP-8 with pilot injection.

Figure 9.
Injection rate characteristics during injections of diesel and JP-8 without pilot injection.
Figure 9.
Injection rate characteristics during injections of diesel and JP-8 without pilot injection.

Figure 10.
Injection rate characteristics during injections of diesel and JP-8 with pilot injection.
Figure 10.
Injection rate characteristics during injections of diesel and JP-8 with pilot injection.

Figure 11.
Injection quantity of JP-8 and diesel without pilot injection or with pilot injection.
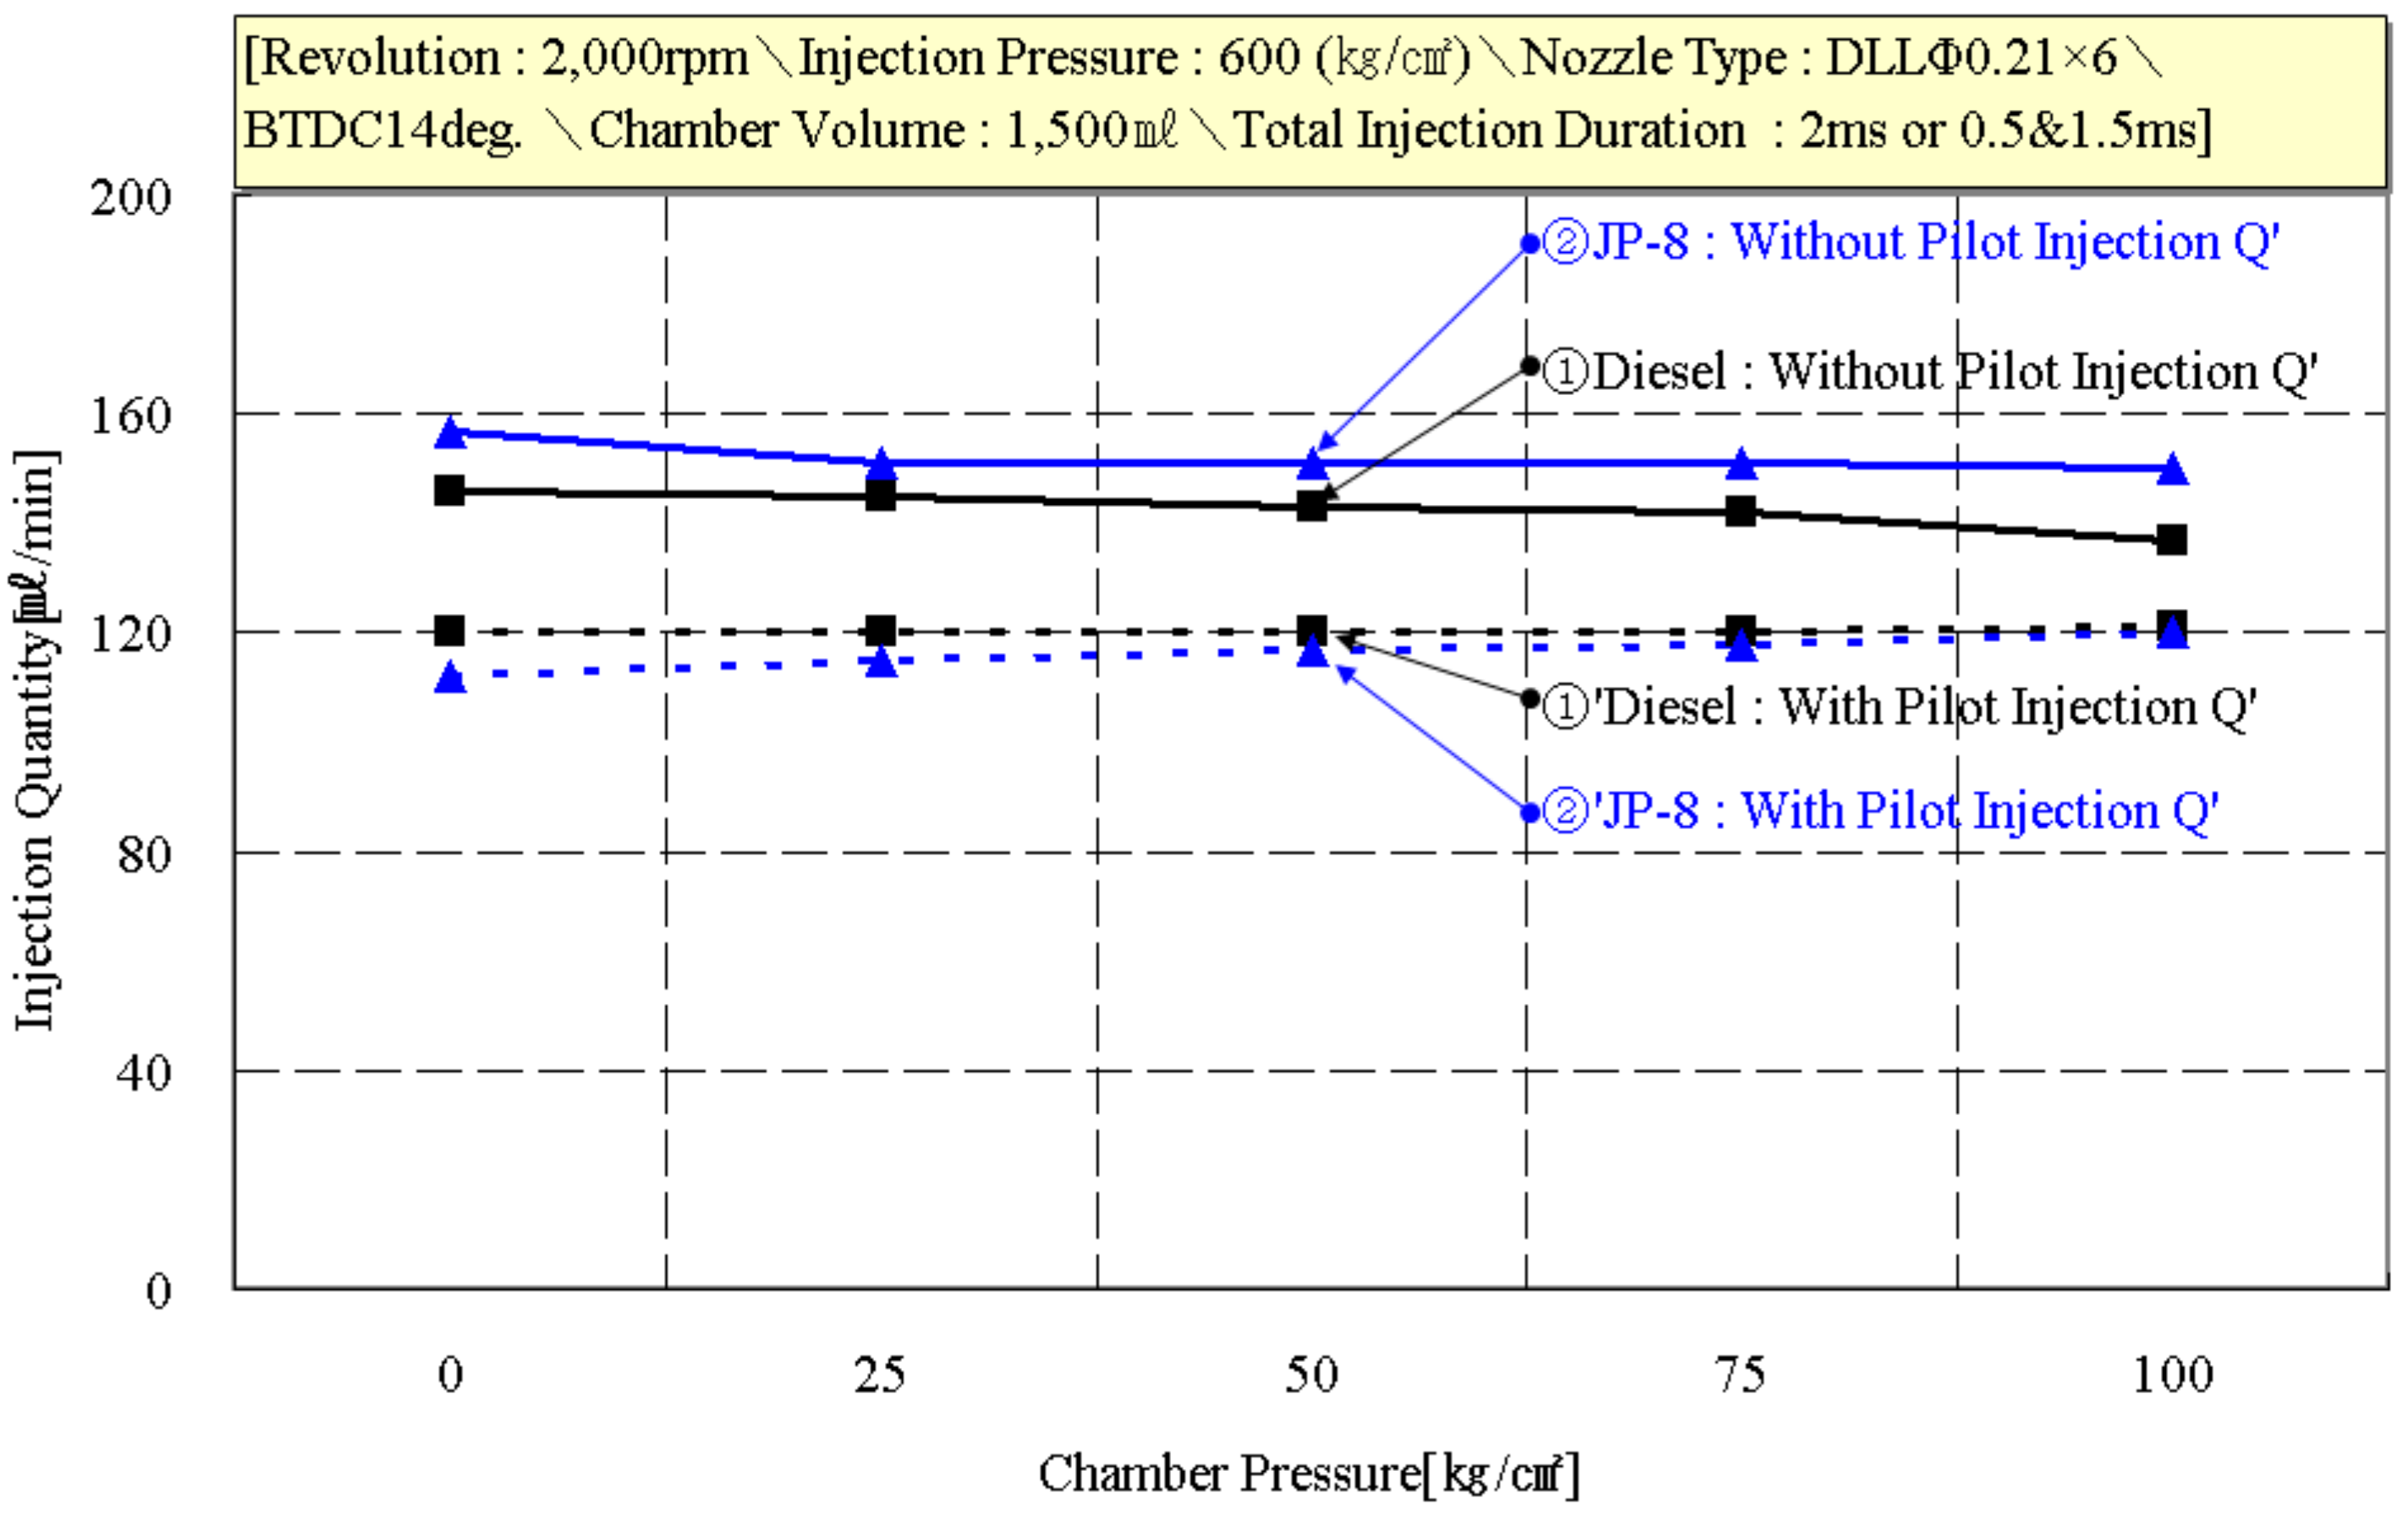
Figure 12.
Spill quantity of JP-8 and diesel without pilot injection or with pilot injection.

Figure 13.
Injection quantity on engine revolution without pilot injection of diesel fuel.
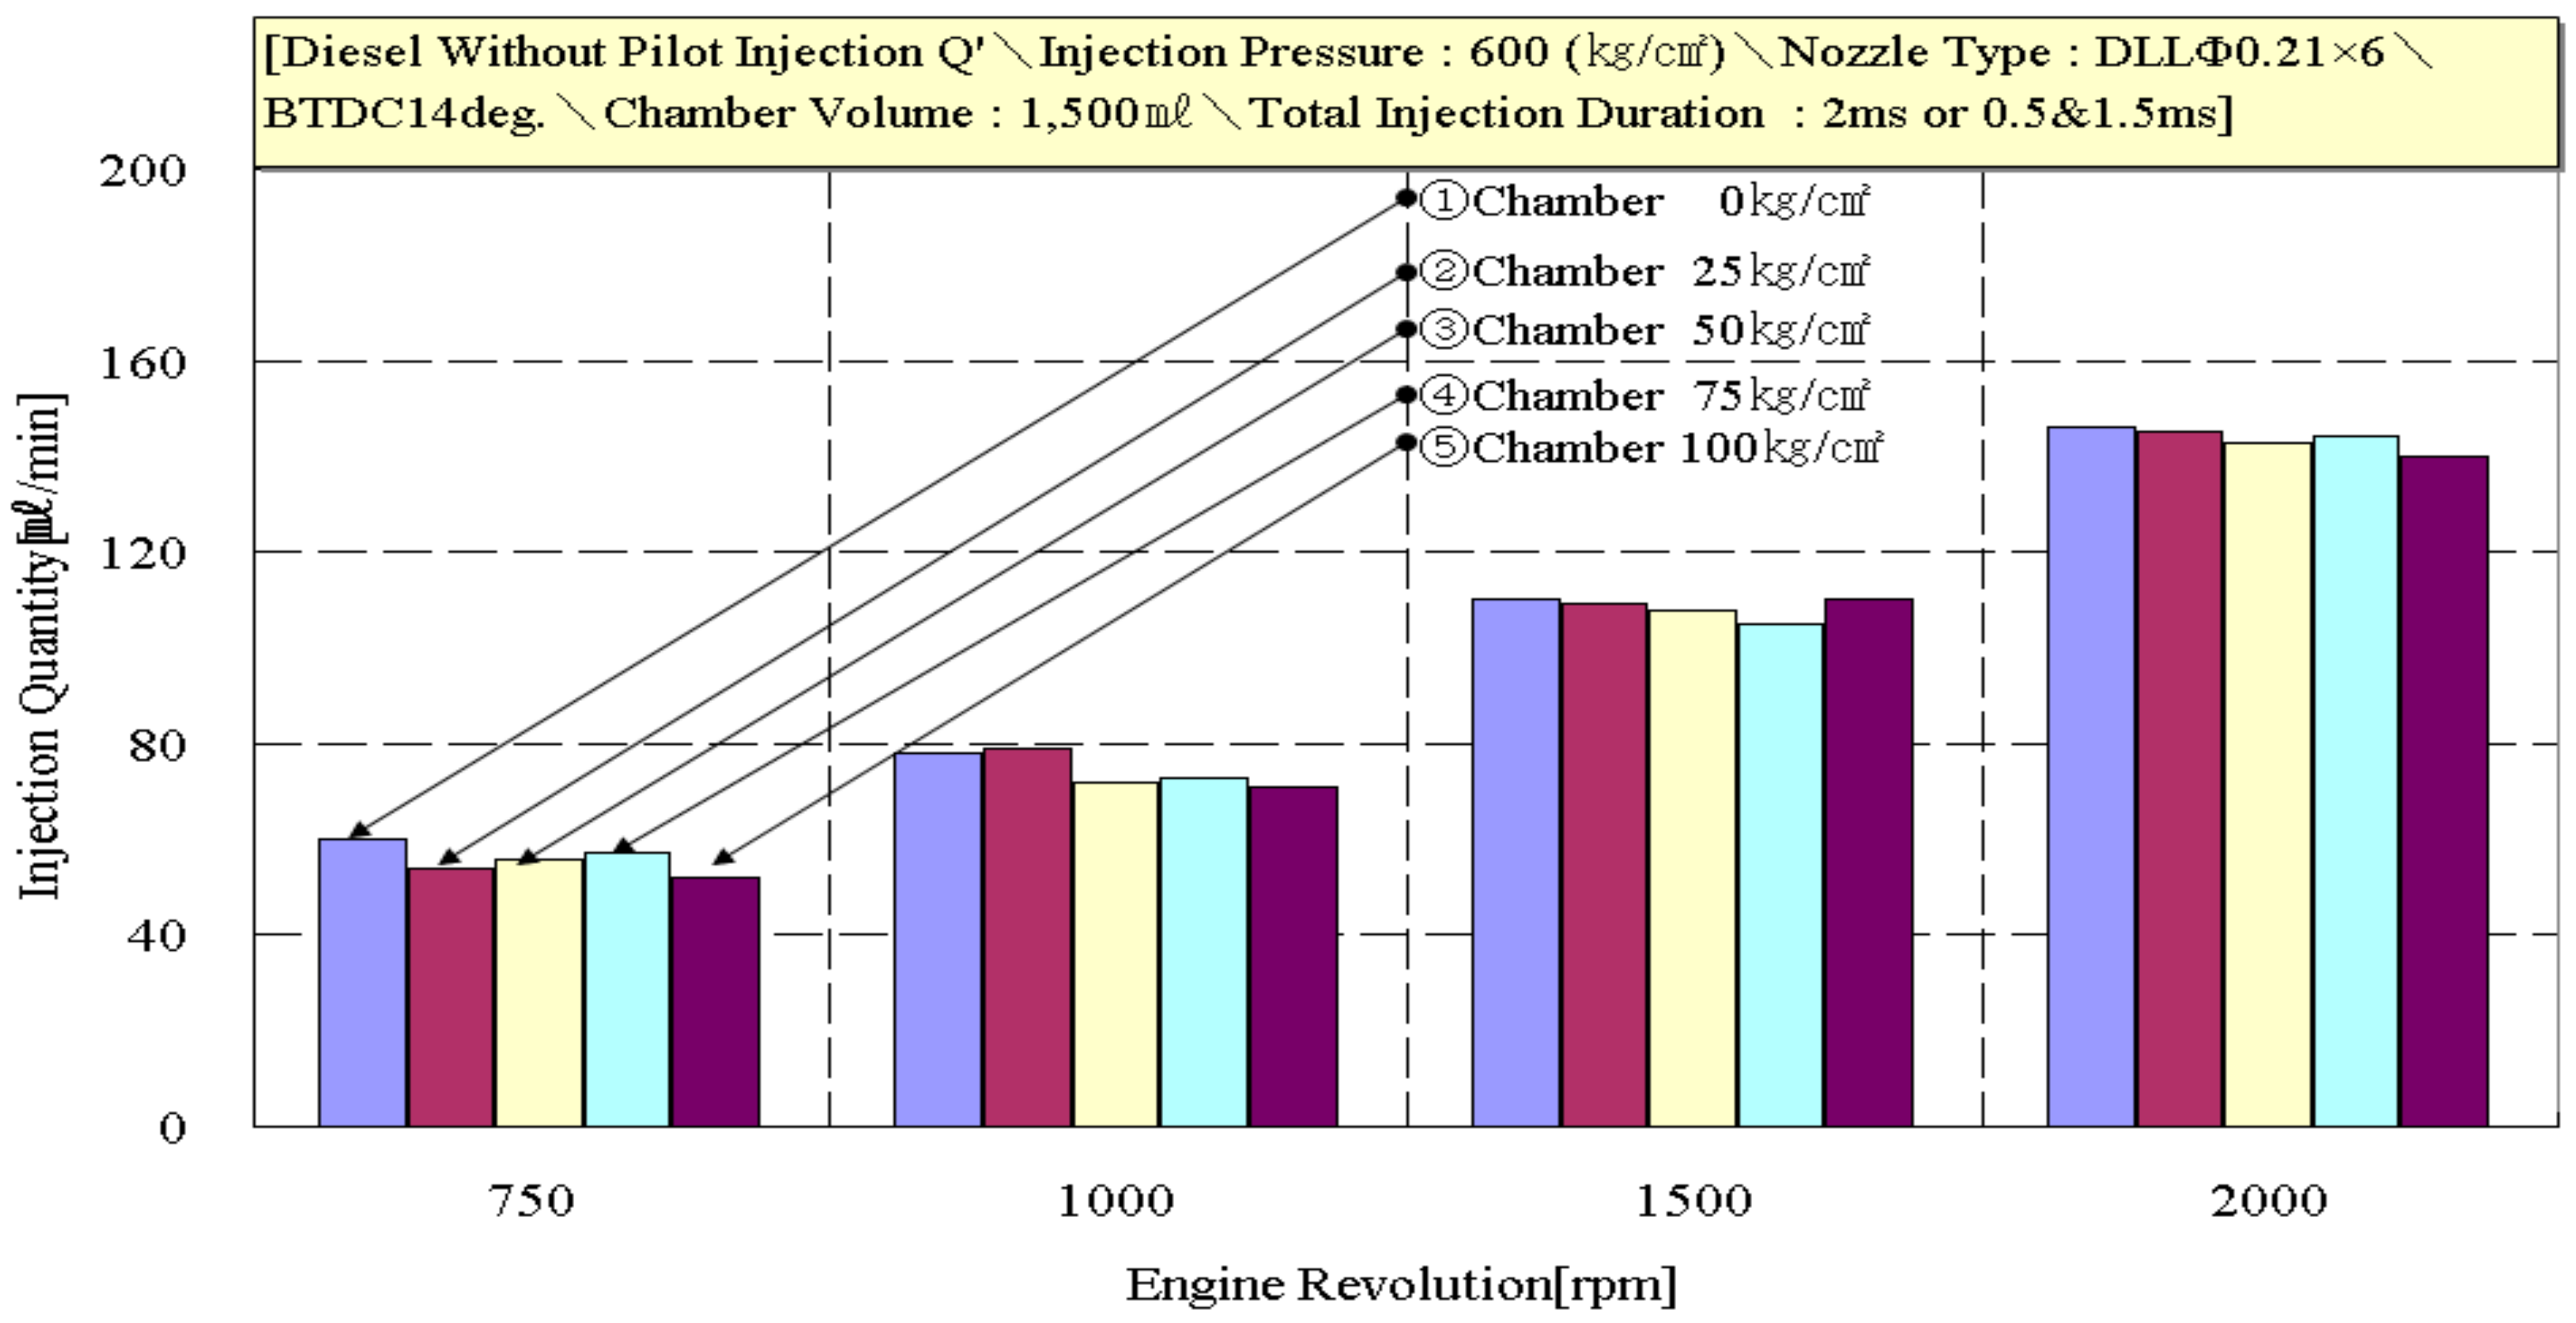
Figure 14.
Injection Quantity on Engine Revolution without Pilot Injection of JP-8 Aviation Fuel.

Figure 15.
Injection Quantity on Engine Revolution with Pilot Injection of Diesel Fuel.

Figure 16.
Injection Quantity on Engine Revolution with Pilot Injection of JP-8 Aviation Fuel.


Table 1.
Comparison of JP-8 (synthetic fuel and another fuel including diesel).
| Division | Unit | DF-2 (ASTM 2D) | JP-8 |
|---|---|---|---|
| T10 | °C | 226 | 170 |
| T90 | °C | 303 | 240 |
| T100 | °C | 326 | 266 |
| Cetane index | - | 47 | 39 |
| Cetane number | - | 46 | 38 |
| Low heating value | MJ/kg | 43.796 | 43.228 |
| Density at 15 °C | Kg/m3 | 847 | 812 |
| Aromatics | Vol. % | 33.8 | 11.0 |
| H2 | Mass % | 12.99 | 13.9 |
| Sulfur | ppm | - | 4 |
| Kin. Visc. (−20 °C) | mm2/s | - | 4.465 |
| Kin. Visc. (40 °C) | mm2/s | 2.86 | ~1.4 |
| Freeze point | °C | - | −57 |
| Flash point | °C | 78 | 47 |
Table 2.
Common rail specification of injection system.
| Items | Spec. | ||
|---|---|---|---|
| Injector | Max. Injection quantity (mm3/st) | 35 | |
| Max. Pressure (MPa) | 8.6 | ||
| Valve | Lift (µm) | 35–40 | |
| Nozzle | Open pressure (MPa) | 8.6 | |
| Needle lift (mm), (0.36 mm ⇒ Change) | 0.14–0.36 | ||
| Sack hole type | Mini sack | ||
| Seat diameter (mm) | φ1.9 | ||
| Injection hole (mm), (0.18 mm ⇒ Change) | φ0.21 × 5 | ||
© 2017 by the authors. Licensee MDPI, Basel, Switzerland. This article is an open access article distributed under the terms and conditions of the Creative Commons Attribution (CC BY) license (http://creativecommons.org/licenses/by/4.0/).
Share and Cite
MDPI and ACS Style
Yang, S.; Moon, H.; Lee, C. A Study of Spill Control Characteristics of JP-8 and Conventional Diesel Fuel with a Common Rail Direct Injection System. Energies 2017, 10, 2104. https://doi.org/10.3390/en10122104
AMA Style
Yang S, Moon H, Lee C. A Study of Spill Control Characteristics of JP-8 and Conventional Diesel Fuel with a Common Rail Direct Injection System. Energies. 2017; 10(12):2104. https://doi.org/10.3390/en10122104
Chicago/Turabian StyleYang, Seomoon, Hoonyoung Moon, and Changhee Lee. 2017. "A Study of Spill Control Characteristics of JP-8 and Conventional Diesel Fuel with a Common Rail Direct Injection System" Energies 10, no. 12: 2104. https://doi.org/10.3390/en10122104
Note that from the first issue of 2016, this journal uses article numbers instead of page numbers. See further details here.