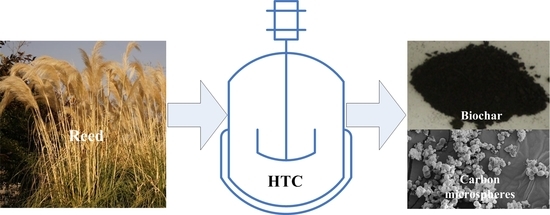
Efficient Low Temperature Hydrothermal Carbonization of Chinese Reed for Biochar with High Energy Density


1
School of Environmental and Chemical Engineering, Shanghai University, Shanghai 200444, China
2
Shanghai Advanced Research Institute, CAS. No. 100 Haike Road, Shanghai 201210, China
*
Author to whom correspondence should be addressed.
Energies 2017, 10(12), 2094; https://doi.org/10.3390/en10122094
Submission received: 15 November 2017
/
Revised: 30 November 2017
/
Accepted: 6 December 2017
/
Published: 11 December 2017
(This article belongs to the Special Issue Biomass Chars: Elaboration, Characterization and Applications Ⅱ)
Abstract
:Hydrothermal carbonization (HTC), as an environmental friendly process, presents wide potential applicability for converting biomass to biochar with high energy density. Reed, a major energy crop, was converted by a HTC process in a batch reactor at 200–280 °C for 0.5 to 4 h. Biochar mass yield changed from 66.7% to 19.2% and high heating value (HHV) from 20.0 kJ/g to 28.3 kJ/g, respectively, by increasing the carbonization temperature from 200 °C to 280 °C and decreasing the residence time from 2 h to 1 h. The Fourier Transform infrared spectroscopy (FTIR), X-ray Diffraction (XRD), and Scanning Electron Microscope (SEM) results indicated the lignocellulosic crosslink structure of reed is broken and biochar having a high energy density is obtained with the increase of temperature. The microcrystal features of reed are destroyed and biochar contained mainly lignin fractions. The HTC of biocrude is carried out at 200–280 °C for 2.0 h and the results showed that the obtained biochar has uniform particles filled with carbon microspheres.
1. Introduction
Recently, abundant research efforts have been focused on the use of renewable biomass for producing energy, chemicals and materials. During the whole process for biomass growth and utilization, the carbon balance has been realized, so the concentration of CO2 in the atmosphere theoretically remains constant during this cycle [1]. Most of the biomass is inefficiently used for the heating purposes in the absence of other reliable and cheaper sources of energy. The biomass has been exploited in ways involving pyrolysis, gasification, fermentation and hydrothermal processes to obtain the useful clean energy, materials and biochemicals. H2 [2], ethanol [3], lactic acid [4], biochemicals [5], and biochar [6,7,8] can be obtained in different reaction processes. Recently, the acceleration of carbonization in a hydrothermal medium by a factor of 106–109 under rather mild conditions, down to a scale of hours, makes it a useful pathway for biochar production. The research attention has largely focused on the conversion of biomass to biochar which has higher heating value (over 28.0 kJ/g) and better carbonaceous materials performance [9].
Hydrothermal carbonization (HTC) is a thermochemical process to produce biochar from raw biomass or carbohydrates under mild temperatures (180–350 °C) and self-generated pressures in subcritical water. Compared to the typical carbonization routes such as pyrolysis (500 to 800 °C), HTC is able to explore fresh feedstock without any drying treatment [10,11]. During the HTC process, subcritical water serves as green solvent, reagent and catalyst that facilitate the hydrolysis and cleavage of lignocellulosic biomass [12,13]. Hydrolysis, dehydration, decarboxylation, condensation polymerization and aromatization take place during the HTC process [14]. In the past decades, HTC has been explored the reveal the mechanisms of natural coalification in the coal-forming process, but attention was seldom paid to the production of solid residues. The biochar obtained by the HTC process from fresh biomass even bio-waste, can be used as a solid fuel, adsorbent and soil amendment with wide applicability. Some research has indicated a series of novel carbon materials with specific properties could be prepared through the HTC process under mind conditions using carbohydrates as starting materials [15,16].
A HTC process was used for the conversion of eucalyptus bark (EB) into biochar in the range of 220–300 °C after 2–10 h. The results showed that the biochar yield decreased slightly from 46.4% at 220 °C to 40.0% at 300 °C and high heating value (HHV) increased from 20.2 to 29.2 kJ/g [17]. The optimum conditions for maximum yield production of biochar through HTC of palm shell were also discussed. Using 180 °C, 0.5 h, and 1.60 wt.%, optimized biochar was obtained and the temperature was proven to have a greater influence on the efficiency of biochar production [18]. Liu carried out HTC of glucose, sucrose, and starch at temperatures ranging from 170 to 240 °C. The results indicated that biochar is made up of uniform spherical micrometer-sized particles that have a 0.4–6 mm diameter, which can be modulated by modifying the preparation conditions [19]. Sevilla et al. provided a method for producing carbonaceous materials by means of the HTC of cellulose at 220–250 °C. The formation of this material essentially follows the path of a dehydration process, similar to the HTC of saccharides such as glucose, sucrose or starch [20,21].
In the present work, our interest was the production of biochar with higher energy density and carbonaceous materials from biocrude, so the HTC process was explored to convert reed into biochar and biocrude in a batch reactor under mild conditions. The effect of reaction time, temperature and pressure in the range of 0.5–4 h, 200–280 °C and 2.4–27.2 MPa, respectively, were studied. The HTC of biocrude was carried out in a batch reactor at 200 °C for 2 h. Through Fourier Transform infrared spectroscopy (FTIR), X-ray Diffraction (XRD), and Scanning Electron Microscope (SEM) analysis of the biochar produced from reed, the transformation process, structure performance and energy value of biochar were discussed. Based on the yields and SEM analysis, the possible pathways for HTC of biocrude into carbon microspheres were provided.
2. Results
The characteristics of the reed raw material are presented in Table 1. Details of yield, HHV and energy yield of biochar prepared under various conditions using the setup illustrated in Figure 1 are shown in Table 2. In general, biochar yield (wt.%) decreased with temperature whereas HHV increased. The results are discussed in the following sections. The effects of residence time and pressure on the carbonization of reed for biochar production at 200 °C and 230 °C are discussed. The time and pressure ranged from 2.0 to 4.0 h and 17.6 and 27.2 MPa, respectively. The reed and biochar were characterized by FTIR (wave number: 4000–400 cm−1) and a typical spectrum was shown in Figure 2. Typically bands in FTIR spectrum for reed and biochar were listed in Table 3. As the hydrolysis product of reed in the HTC process, biocrude contains various sugars and organic acids. The glucose, lactic acid, acetic acid, HMF (5-hydroxymethylfurfural) and furan in biocrude obtained from 200 °C to 280 °C are listed in the Table 4.
3. Discussion
3.1. Performance of HTC for Biochar
At 200 °C, the higher yield and HHV for biochar were obtained at 2.0 h, 27.6 MPa and 4.0 h, 27.6 MPa, respectively, and the values were determined as 66.7% and 21.8 kJ/g. A higher temperature favored the conversion of raw materials to higher energy density fuel and HHV, as indicated by the values provided at 230 °C which were 26.9 kJ/g at 2 h and 17.2 MPa. Compared to the yield of biochar at 200 °C, it showed a descending trend at the same conditions for 230 °C. Higher yield and HHV can be obtained at 200 °C and 230 °C, respectively. The desired pressure was achieved by pumping water into the reactor. The increased pressure of the reaction system keeps the water in its aqueous phase and influences the density properties of water [10]. At comparatively low temperature (200–230 °C), the amorphous components of reed were mainly hydrolyzed and the liquid product mainly contained oligomers and monomers produced by the hydrolysis of the sugar components in reed. The HHV of the product biochar remained low because of low deoxygenation rate in this temperature range.
Temperature plays a key role in the conversion of reed to biochar. Further experiments were performed at 200 °C to 280 °C for 4.0 h and the results are shown in the Table 2. Fifty mL of water was added into the reactor and the mass ratio of biomass and water was changed from 1:6.5 (shown in the Table 2) to 1:25. The pressure was autogenously adjusted and it increased above the vapor pressure of water because of the formation of gaseous products during the HTC process. The influence of temperature is obviously, though biochar yield decreased at 280 °C, the HHV of the product was increased considerably with temperature.
The highest yield of 60.6% for biochar was obtained at 200 °C. At the same time, the higher temperature is propitious to obtain higher energy density fuel and this value reached 28.1 kJ/g at 280 °C. The yield and HHV obtained at 230 °C are 37.8% and 23.5 kJ/g, which lower than the results under the set pressure. The results showed that high pressure provides a higher yield and HHV for the conversion of reed to biochar despite it being lower from the influence of temperature. Based on the results of yield and HHV at different temperatures, the energy conversion efficiency, which was defined as the ratio of contained energy in raw reed and obtained biochar, were 52.4%, 43.0%, and 31.2% at 230, 260, and 280 °C, respectively. The results indicated that energy conversion efficiency displays a decreasing tendency with the increase of temperature. To obtain a higher energy conversion efficiency and biochar with higher energy density, a higher temperature should be used and the reaction conditions should be changed to improve the HHV of biochar.
Table 2 displays the obtained biochar yield and HHV at 280 °C from 0.5 to 4.0 h. The yield of biochar shows a descending curve, but the values of HHV increase slightly from 0.5 h to 4.0 h. The HHV obtained from 0.5 h at 280 °C is higher than that of 4 h at 230 °C, but the yield (20.7%) is lower than with the former conditions (37.8%). Reed provides less biochar yield in the case of 1.0 h at 280 °C than 4.0 h at 260 °C, but the HHV for biochar were high as 28.4 and 25.9 kJ/g. Similar biochar yield and HHV results were obtained at 1.0 h and 4.0 h under 280 °C. Future work will focus on getting the optimal conditions for conversion of reed to biochar with higher yield and energy density.
3.2. Characterization of Reed and Biochar
The FTIR spectrum of biochar was partly similar to that of reed and the typical peaks of lignin were maintained in biochar. These results indicated that the biochar had a high degree of polymerization oligomers with lingo-like molecular structures. The reed was not liquefied completely for the appearance of absorption peaks at 1060 and 1160 cm−1 at 200 °C and 230 °C. From Figure 2, it can be seen that the absorbance peaks in the raw, 200 °C and 230 °C materials are similar and hemicellulose and cellulose were present in the biochar obtained at lower temperature [22]. As for 260 °C and 280 °C, the FTIR displays peak changes for the biochar obtained at higher temperature which is different from reed and lower temperature product. The results showed that the two kinds of biochar have a different functional groups than reed. In the higher temperature process, the hemicellulose and cellulose were converted and a polymerization process was realized. From the spectral difference of FTIR spectra of these biochar obtained at higher temperature and reed, the absorbance peak appeared in the range of 1600–650 cm−1. It was shown that the aromatic rings started to recombine at this temperature. The possible presence of alkenes was indicated by the absorbance peaks between 1680 and 1580 cm−1. The ether linkages around 1200 cm−1 and 1000 cm−1 between the cellulose skeleton units were hydrolyzed with the hydrothermal treatment from 260 °C to 280 °C under subcritical conditions [23,24,25]. As for the skeleton structure of reed, the lignin remained in the biochar when the temperature increased from 200 °C to 280 °C. The results were confirmed by the lignin peaks at 1265, 1424 and 1513 cm−1 in the FTIR. At the same time, peaks of polymeric product were also shown in the FTIR spectra at 1600 and 1700 cm−1. These results proved that the biochar was composed by the conserved lignin and polymeric products produced in the HTC process [22].
We conducted SEM observations of reed and biochar after the HTC process. The SEM images for biochar and reed are shown in Figure 3. These results suggested that biochar has a different macromolecular structure from reed and their average particle sizes grew smaller at the temperature reached 260 °C. The results show that the lignocellulosic structure of reed was destroyed as the hemicellulose and cellulose were hydrolyzed in the HTC process. Small globular particles which come from the polymer particles of reed decomposition can be seen precipitated over thin fibers. The cross-linked structure which was made up by the lignin and cellulose in reed was broken in the HTC process as the cellulose was hydrolyzed into aqueous phase [26,27]. Compared with lignin, the microcrystal structure of cellulose is relatively easily damaged under higher temperature conditions and the results were demonstrated in the FTIR analysis. As shown in the Figure 3B, the lignin can resist the higher temperature disruption and form the main skeleton structure for biochar obtained in higher temperature.
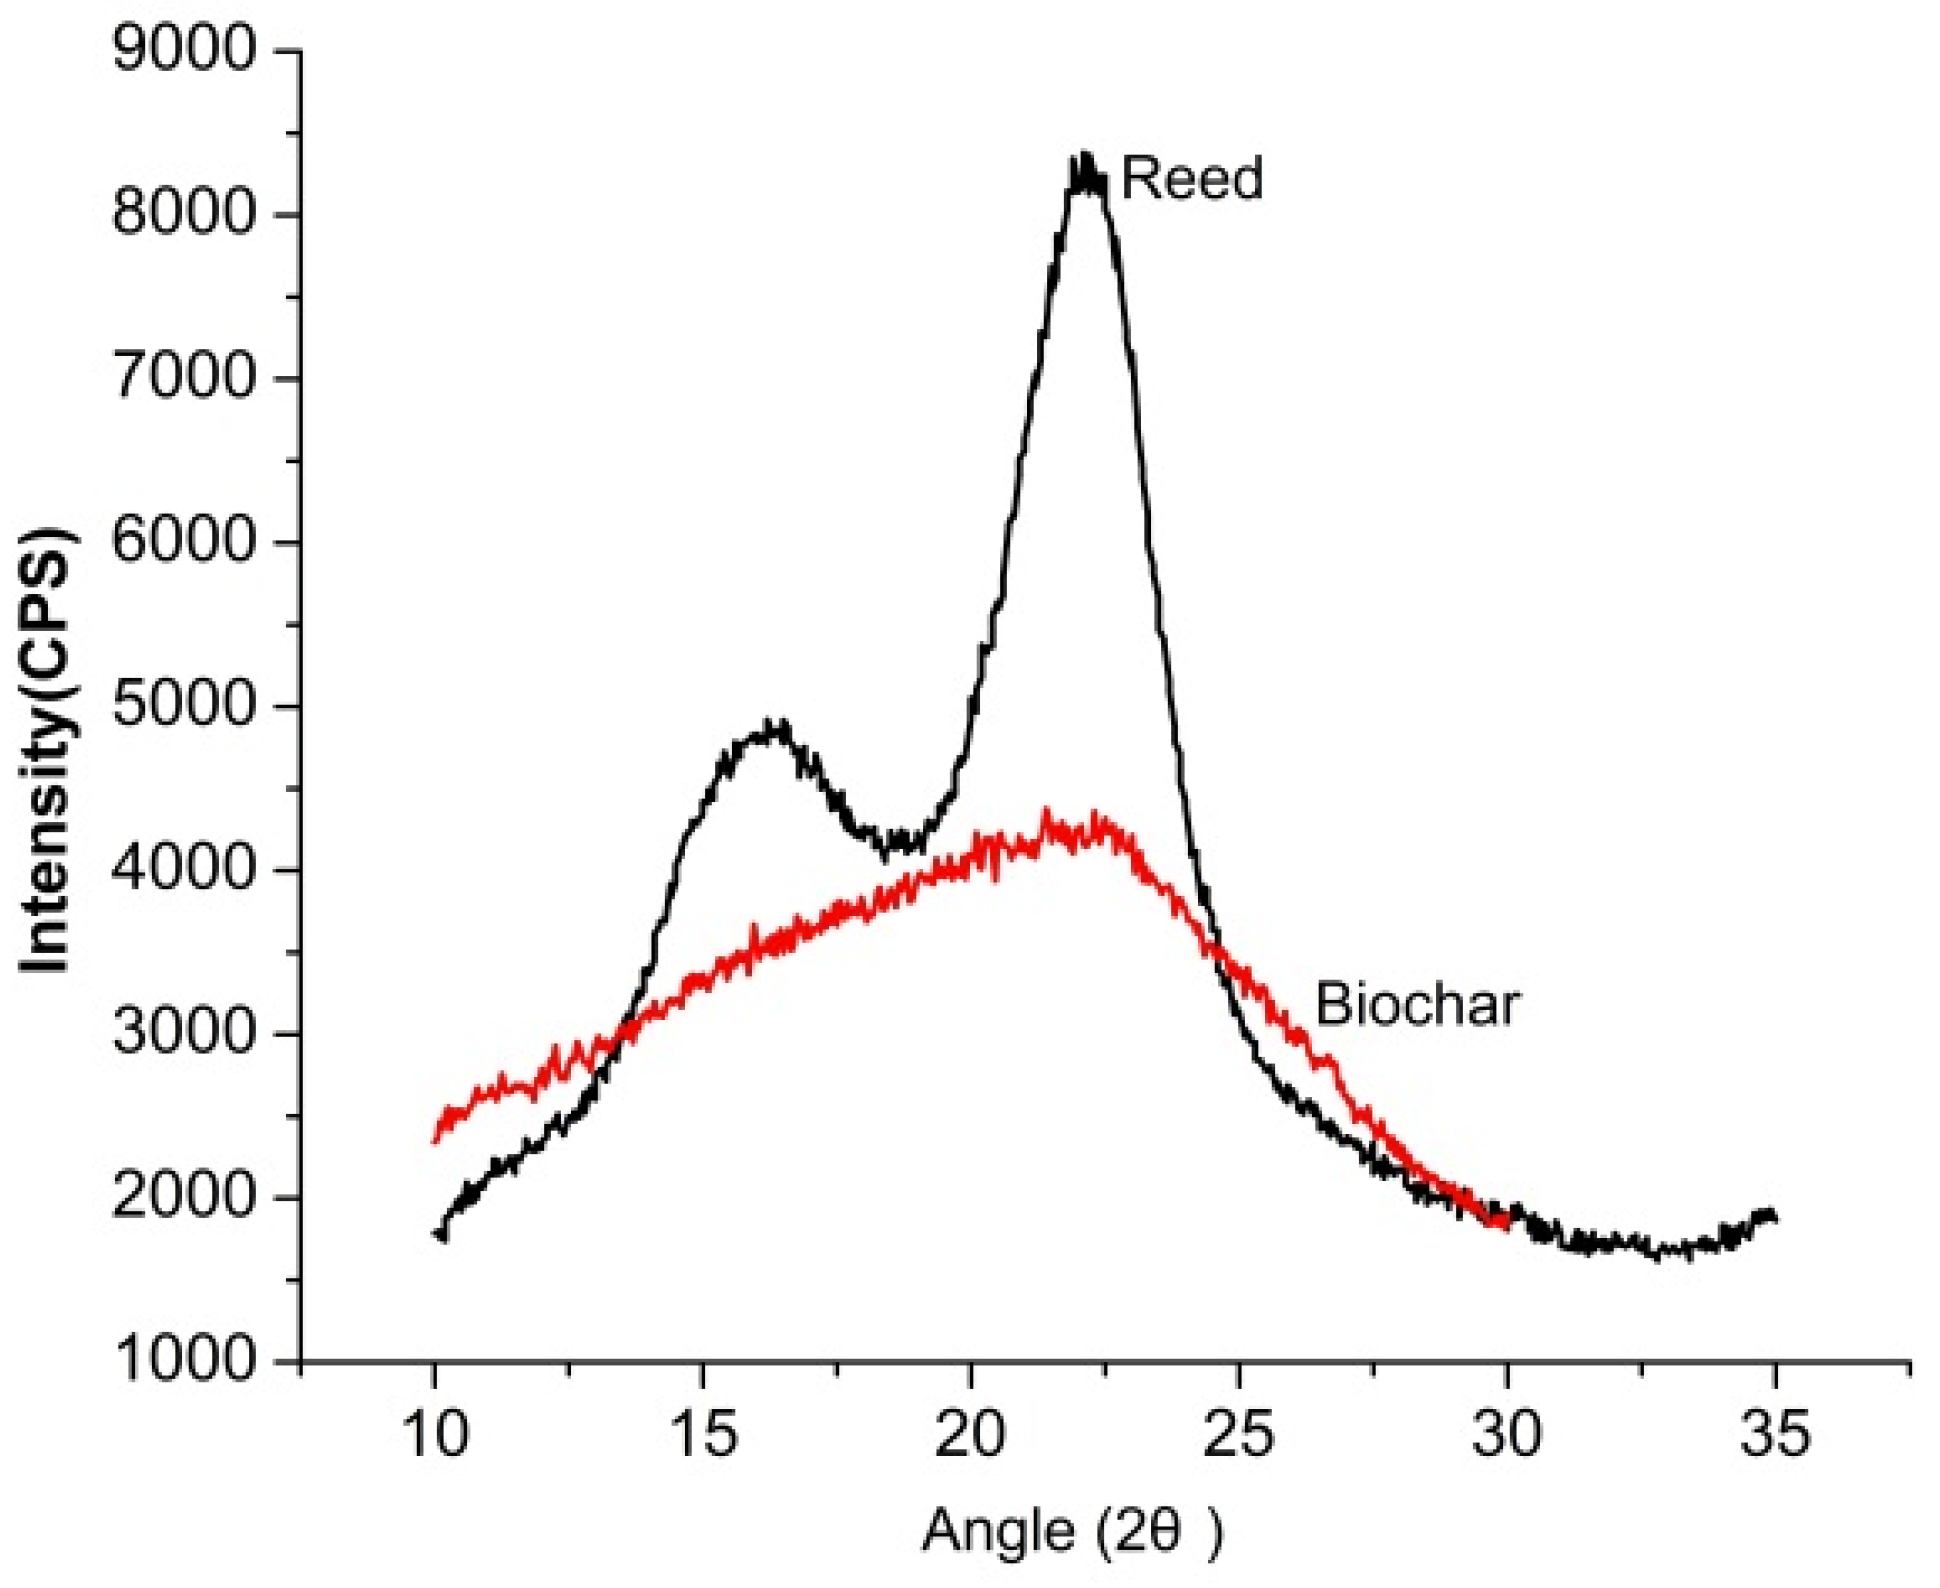
The XRD patterns for biochar (obtained 280 °C, 4.0 h) and reed were compared and are shown in Figure 4. The distinct sharp crystalline cellulosic peak (2θ = 22.7°) which comes from the crystal structure of cellulose was displayed in the reed, but the peak was absent in the biochar, which confirms that it contained mainly less crystalline or amorphous components. As the cellulose in the reed was decomposed, the transformation from microcrystal features to a non-crystalline structure were realized in the HTC process. A carbon-rich product with an amorphous structure and lignin as the major component was retained in the biochar. The results are consistent with the FTIR and SEM analyses. Through the analysis of FTIR, SEM and XRD for the reed and obtained biochar, the change for structure, morphology and composition from reed to biochar were displayed to help understand the HTC process for biochar production. Through fragmentations and deoxygenation, reed conversion into biochar is realized. The main components of the biochar obtained at higher temperature are lignin and cellulose was hydrolyzed into biocrude. The elemental analysis of the biochar obtained at 280 °C indicated that the elemental carbon is over 70%. The results confirm that O/C ratio decrease with temperature from 0.90 for reed to 0.32 for biochar obtained at 280 °C. The decrease in O/C ratio may be attributed to the deoxygenation, caused mainly by the dehydration of reed.
3.3. HTC of Biocrude for Biochar
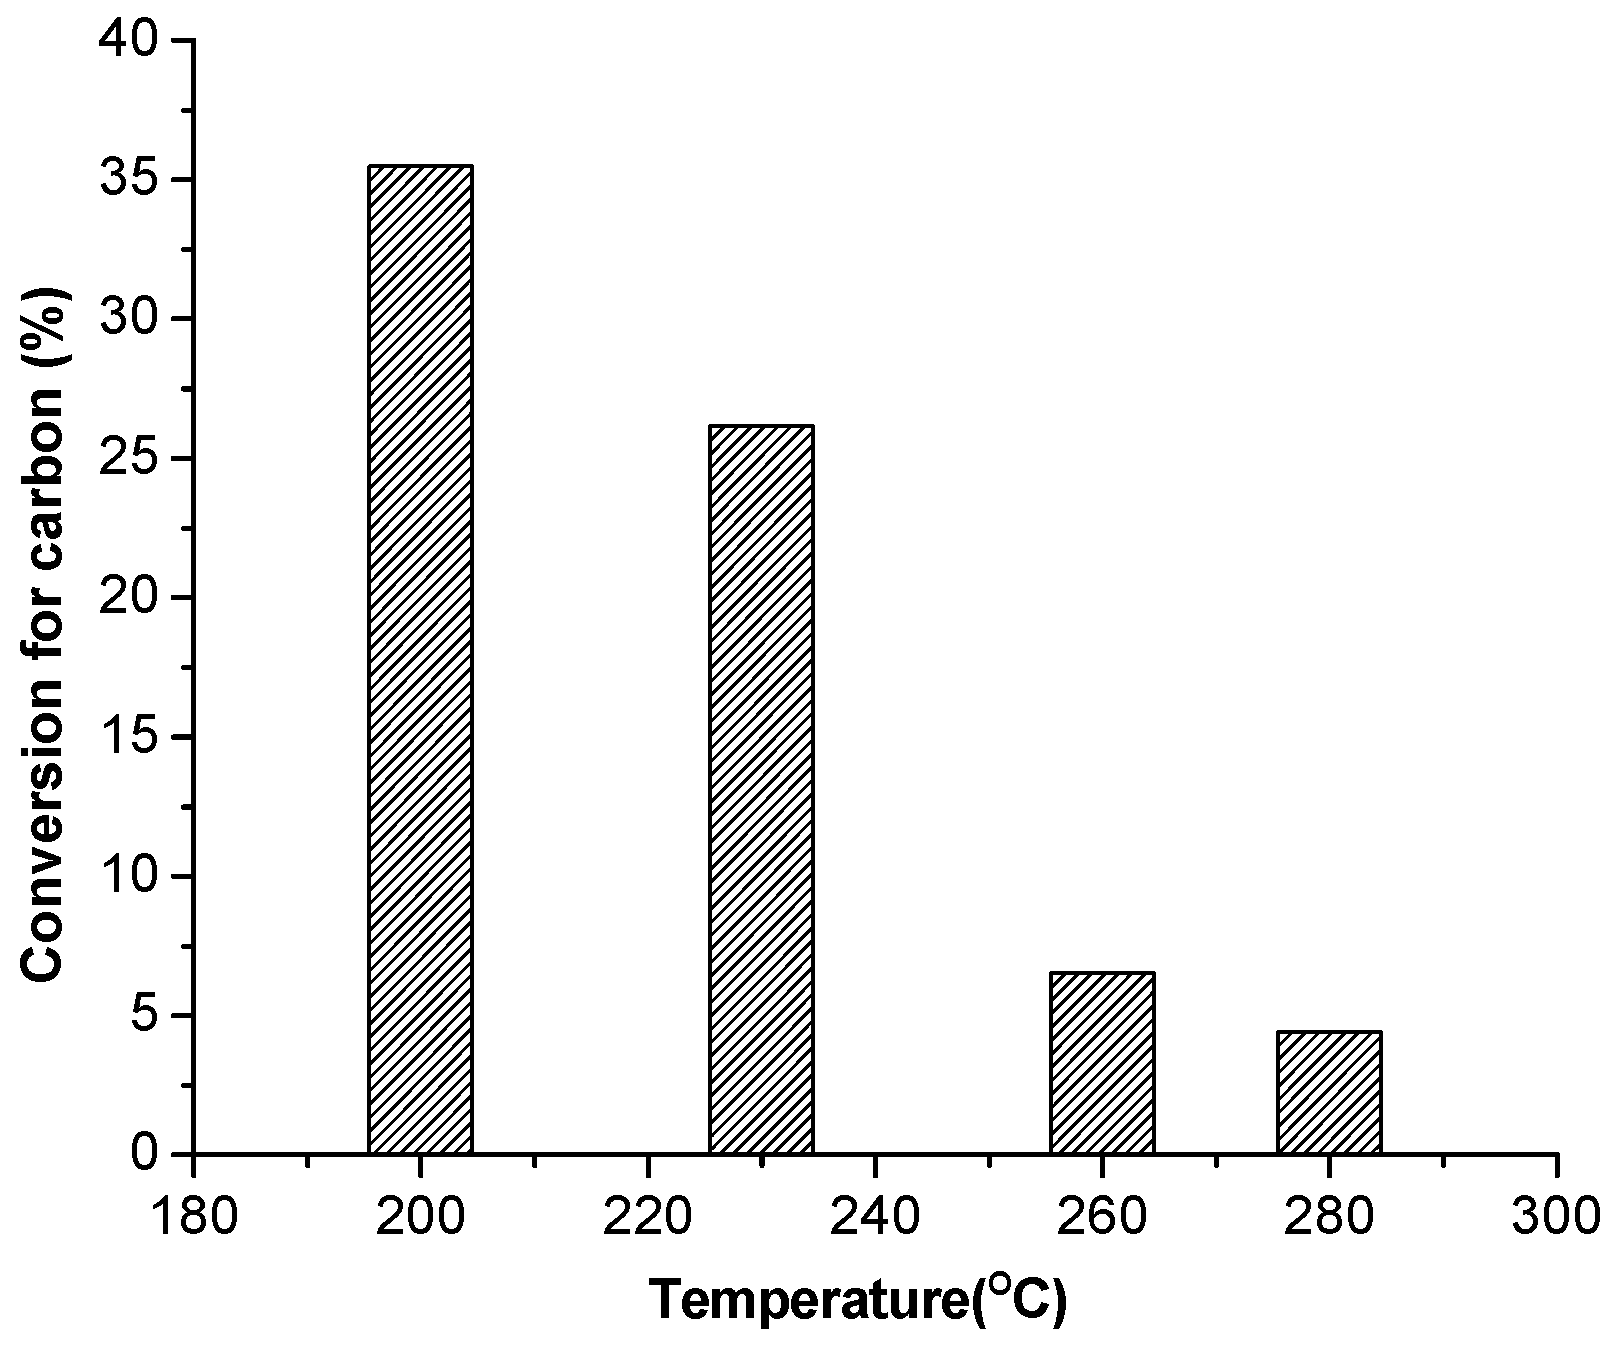
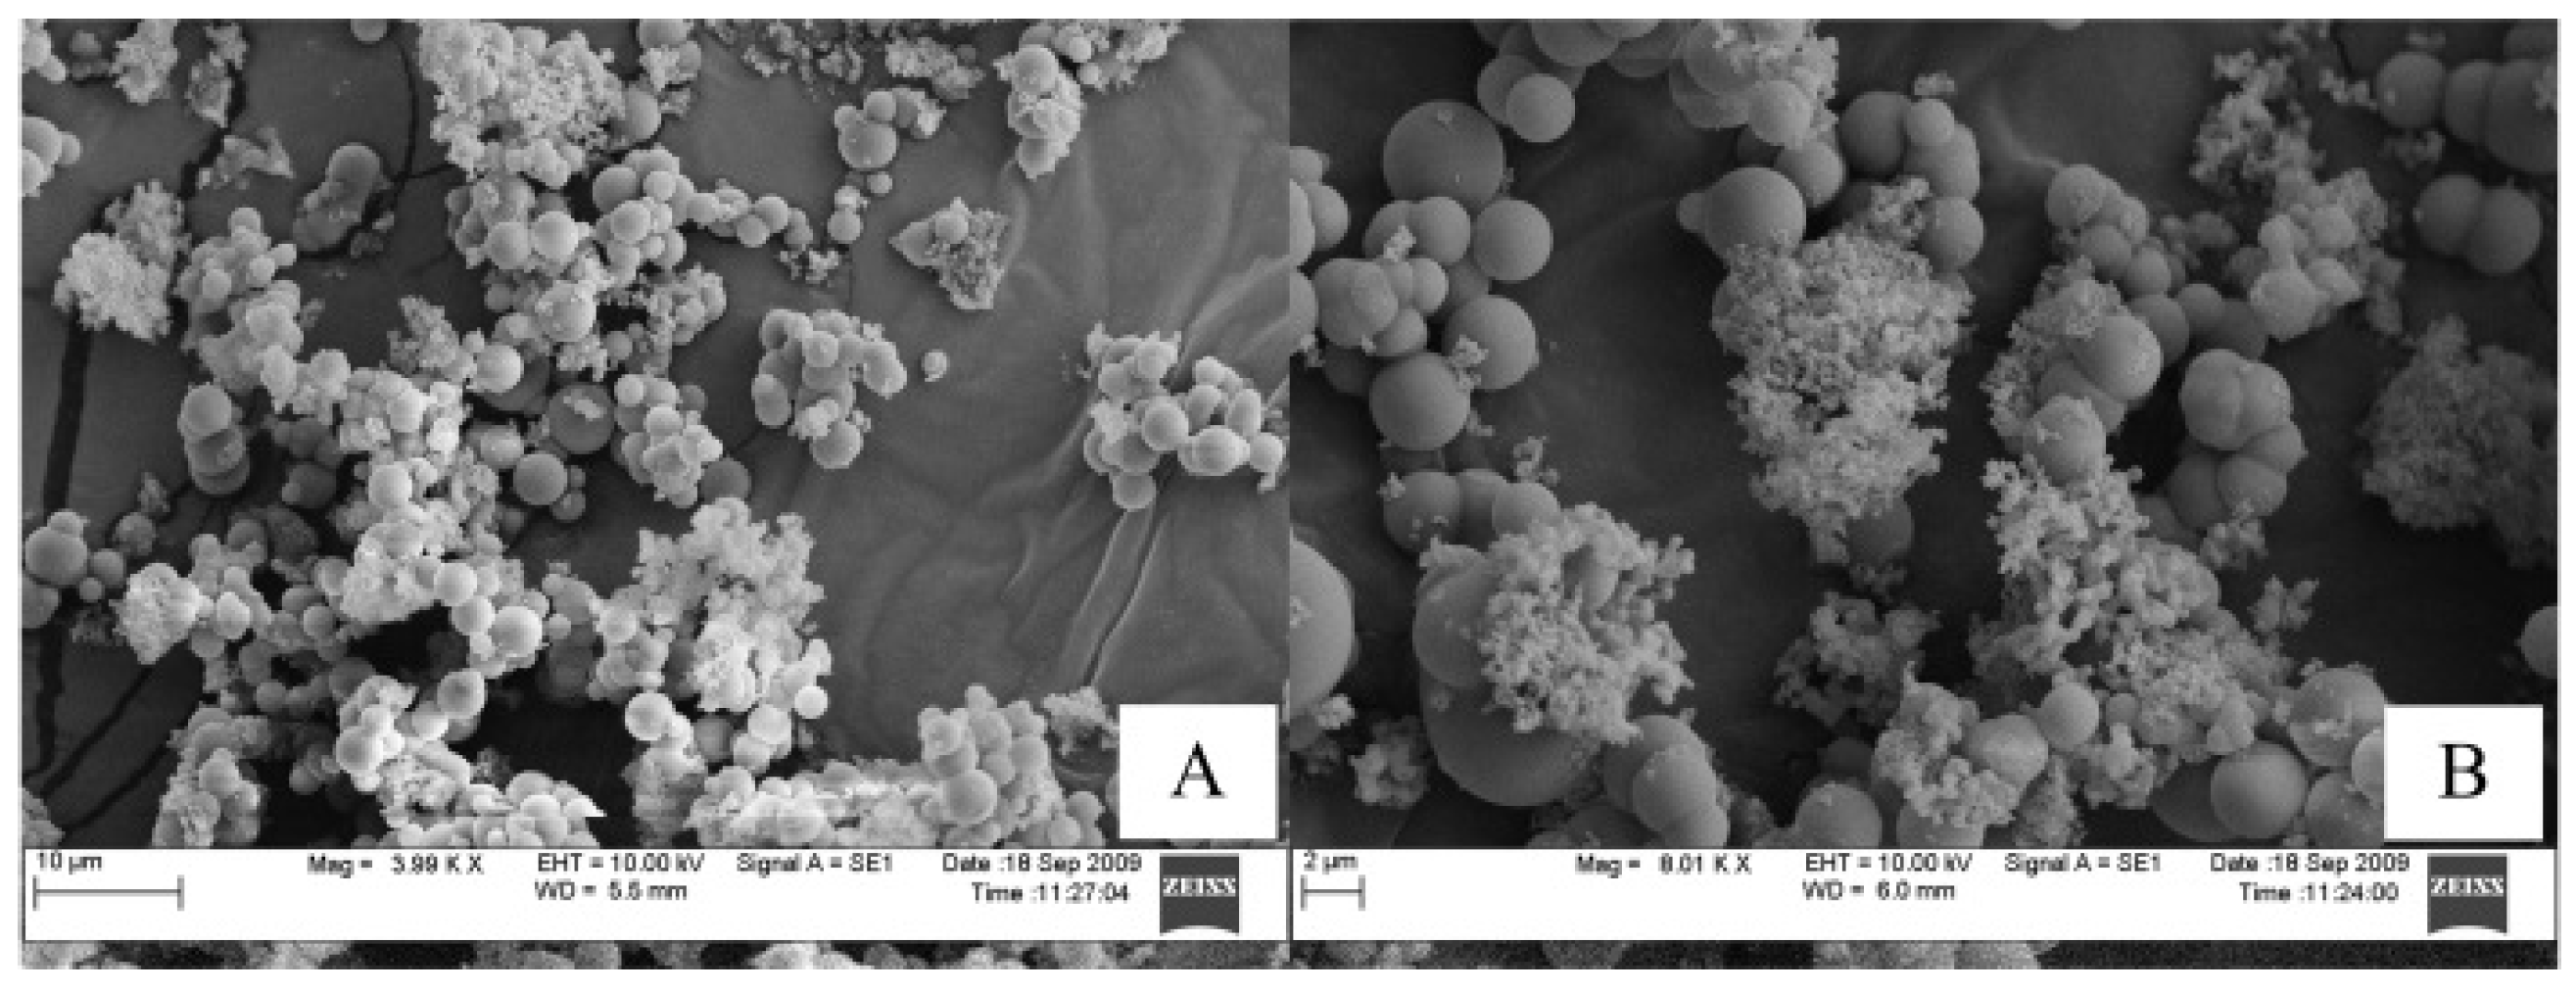
From Table 4 we know that glucose serves as the main contributor in the biocrude which is obtained at low temperature. The main hydrolysis products of reed include glucose, acetic acid, lactic acid, HMF and furan. The oligomers and glucose constitute the majority of the organic compounds in the liquefaction of reed at low temperatures such as 200 °C. Organic acids and aromatic compounds are formed by different pathways, especially in the high temperature interval. As the temperature increases from 200 °C to 280 °C, the amount of glucose decreases whereas that of organic acids displays an upward trend. For the hydrolysis product of hemicellulose and cellulose, lower temperature is favorable for the production of glucose and higher temperature is beneficial for producing organic acids. We carried out experiments on the HTC of biocrude at 200 °C for 2.0 h. The biocrude was obtained in the HTC of reed in a temperature range from 200 °C to 280 °C. The conversion efficiency of carbon from biocrude to biochar is shown in Figure 5. The conversion efficiency of carbon was 35.5% when the biocrude was obtained at 200 °C. As for the biocrude obtained at 280 °C and 4.0 h, the value decreased to 4.4%. The conversion efficiency of carbon for biocrude obtained from 230 °C and 260°C were 26.2% and 6.5%, respectively. The experimental results indicated that biocrude produced at lower temperature is favorable for the conversion of organic carbon to biochar. Sugar plays an important role in the HTC process for biochar production which was similar to that use the glucose as a raw material. Through polycondensation and molecular rearrangements of sugar, the conversion of biocrude to biochar was realized in the HTC process [28]. The SEM image for HTC conversion biocrude obtained at 200 °C to biochar is shown in Figure 6.
As shown in the Figure 6, the biochar obtained in the HTC of biocrude has uniform features. Interestingly, the majority of the 2 μm particles are composed of the biochar and biocrude transformed into carbon microspheres during the hydrothermal carbonization process. A comparison of biochar produced from reed and biocrude indicated that different formation pathways lead to various biochar properties. The biochar obtained the HTC of reed can be used as a higher energy density fuel for its higher carbon content. Because of the homogenization characteristics, the biochar resulting from the HTC of biocrude can provide a new method for producing carbonaceous materials.
4. Materials and Methods
4.1. Material
Reed (2–5 mm long pieces, powdered) was used as raw material for the HTC experiments. The physical and chemical properties of the reed are listed in Table 1. Biocrude obtained from liquefaction of reed also was used for producing biochar.
4.2. Apparatus and Procedure
HTC of reed was carried out in a batch reactor with an internal volume of 65.0 cm3 (Figure 1). The experiments were carried out at 200–280 °C for 0.5–4.0 h. The HTC process was as follows: the desired amount of reed (10.0 g) and water (45 cm3) was put into the reactor, which was then sealed. The reactor was heated up to a desired temperature for HTC of reed. After the set time, the reactor was rapidly cooled to room temperature using air flow. The reaction time was defined as the time at the reaction temperature excluding preheating and cooling time. To study the effect of pressure on HTC process, reactor pressure was controlled by pumping water into the reactor until the set value was reached. After HTC of Chinese reed, the biochar and biocrude were separated with a 0.22 μm filtration membrane. The biocrude was used as starting material for preparing carbon materials. As for the biochar produced from the biocrude, the experiments on the HTC of biocrude were carried out at 200 °C for 2.0 h in the batch reactor. The reactor was filled with liquid phase (biocrude) which was obtained from the different HTC processes and the biochar was collected through a 0.22 μm filtration membrane after the reaction. The biochar obtained from biomass and biocrude was washed using deionized water and oven dried for 24 h at 105 °C.
4.3. Characterization
Surface morphology of the sample was recorded using an environmental scanning electron microscope (SEM, EVO 50, Zeiss, Jena, Germany). XRD patterns of the reed and biochar were obtained on a Miniflex powder X-ray diffractometer (Rigaku, Tokyo, Japan ) with a Cu Kα radiation source in a 2θ range from 10° to 35° with a scanning rate of 1°/min. Infrared spectra (4000–400 cm−1) were analyzed by a IR100 infra-red spectroscopy (FTIR) instrument (Nicolet, Waltham, MA, USA) which was equipped with a TGS/PE detector and a silicon beam splitter with 1 cm−1 resolution. The higher heating value (HHV) of reed and biochar was determined by an IKA-C200 calorimeter (IKA Works, Wilmington, NC, USA). The collected liquid solution was filtered through a 0.22 μm pore-size filter prior to analysis. The main products in the resultant solution were identified based on standard compounds and their structures were further confirmed by HPLC (LC-20AD system, Shimadzu, Tokyo, Japan) equipped with an Aminex HPX-87H Ion Exclusion Column, 300 mm × 7.8 mm) with a differential refraction detector (RID-10A). The column was held at 65°C. H2SO4 (0.01 mol/L) was used as the mobile phase at a flow rate of 1.0 mL/min. The peak identification was accomplished by comparison of sample peak retention times with those of standard solutions of pure compounds. The total organic carbon (TOC) in aqueous phase was measured with a TOC analyzer (Shimadzu TOC 5000 A).
5. Conclusions
Reed was converted into biochar in a temperature range of 200–280 °C for 0.5–4.0 h in a batch reactor. Compared with the residence time and pressure, the temperature plays a key role in the conversion of reed to biochar. Higher temperature is favorable for the production of a higher energy density fuel but is negative for the mass of biochar. The yield of biochar decreased when the temperature increased from 200 °C to 280 °C. The FTIR and SEM results suggested that the complete breakdown of the lignocellulosic crosslinked structure of reed is realized at higher temperature and biochar contained mainly lignin fractions. The XRD image of untreated reed and biochar indicated that the microcrystal features are converted into a non-crystalline structure in the HTC process. HTC of biocrude for biochar production were carried out from 200–280 °C and 2.0 h. The results indicated that biocrude obtained at lower temperature is favorable for biochar production and polycondensation of sugar is the major factor in the HTC of biocrude. The biochar obtained from the HTC of biocrude has a uniform particle size filled with globular carbon microspheres.
Acknowledgments
Authors acknowledge financial supports provided by the National Natural Science Foundation of China (21406255), the Shanghai Science and Technology Committee (16dz1207200) and the Youth Innovation Promotion Association CAS (2015231).
Author Contributions
Xin Huang and Lingzhao Kong conceived and designed the experiments; Chang Liu performed the experiments; Chang Liu and Lingzhao Kong analyzed the data; Chang Liu and Xin Huang contributed reagents/materials/analysis tools; Lingzhao Kong wrote the paper.
Conflicts of Interest
The authors declare no conflict of interest.
References
- Matsumura, Y.; Sasaki, M.; Okuda, K. Supercritical water treatment of biomass for energy and material recovery. Combust. Sci. Technol. 2006, 178, 509–536. [Google Scholar] [CrossRef]
- Lee, I.; Kimm, M.; Ihm, S. Gasification of glucose in supercritical water. Ind. Eng. Chem. Res. 2002, 41, 1182–1188. [Google Scholar] [CrossRef]
- Motonobu, G.; Ryusaku, O.; Tsutomu, H. Hydrothermal conversion of municipal organic waste into resources. Bioresour. Technol. 2004, 93, 279–284. [Google Scholar]
- Kong, L.Z.; Li, G.M.; Wang, H. Hydrothermal catalytic conversion of biomass for lactic acid production. J. Chem. Technol. Biotechnol. 2008, 83, 383–388. [Google Scholar] [CrossRef]
- Selhan, K.; Thallada, B.; Akinori, M. Low-temperature catalytic hydrothermal treatment of wood biomass: Analysis of liquid products. Chem. Eng. J. 2005, 108, 127–133. [Google Scholar]
- Sevilla, M.; Macia-Agullo, J.A.; Fuertes, A.B. Hydrothermal carbonization of biomass as a route for the sequestration of CO2: Chemical and structural properties of the carbonized products. Biomass Bioenergy 2011, 35, 3152–3159. [Google Scholar] [CrossRef]
- Liu, W.J.; Zeng, F.X.; Jiang, H. Preparation of high adsorption capacity bio-chars from waste biomass. Biomass Bioenergy 2011, 102, 8247–8252. [Google Scholar]
- Libra, J.A.; Ro, K.S.; Kammann, C. Hydrothermal carbonization of biomass residuals: A comparative review of the chemistry, processes and applications of wet and dry pyrolysis. Biofuels 2011, 2, 89–124. [Google Scholar] [CrossRef]
- Gupta, R.B.; Kumar, S.; Kong, L.Z. Biomass to Biochar Conversion in Subcritical Water. U.S. Patent 8,637,718 B2, 8 January 2014. [Google Scholar]
- Sevilla, M.; Fuertes, A.B. The production of carbon materials by hydrothermal carbonization of cellulose. Carbon 2009, 47, 2281–2289. [Google Scholar] [CrossRef]
- Sevilla, M.; Fuertes, A.B. Chemical and structural properties of carbonaceous products obtained by hydrothermal carbonization of saccharides. Chem. A Eur. J. 2009, 15, 4195–4203. [Google Scholar] [CrossRef] [PubMed]
- Titirici, M.M.; Thomas, A.; Antonietti, M. Back in the black: Hydrothermal carbonization of plant material as an efficient chemical process to treat the CO2 problem? New J. Chem. 2007, 31, 787–788. [Google Scholar] [CrossRef]
- Phillip, E. Organic chemical reactions in supercritical water. Chem. Rev. 1999, 99, 603–621. [Google Scholar]
- Hu, B.; Yu, S.H.; Wang, K.; Liu, L.; Xu, X.W. Functional carbonaceous materials from hydrothermal carbonization of biomass: An effective chemical process. Dalton Trans. 2008, 6, 5414–5423. [Google Scholar] [CrossRef] [PubMed]
- Laginhas, C.; Valente Nabais, J.M.; Titirici, M.M. Activated carbons with high nitrogen content by a combination of hydrothermal carbonization with activation. Microporous Mesoporous Mater. 2016, 226, 125–132. [Google Scholar] [CrossRef]
- Kumar, S.; Loganathan, V.A.; Gupta, R.B.; Barnett, M.O. An Assessment of U(VI) removal from groundwater using biochar produced from hydrothermal carbonization. J. Environ. Manag. 2011, 92, 2504–2512. [Google Scholar] [CrossRef] [PubMed]
- Gao, P.; Zhou, Y.Y.; Meng, F.; Zhang, Y.H.; Liu, Z.H.; Zhang, W.Q.; Xue, G. Preparation and characterization of hydrochar from waste eucalyptus bark by hydrothermal carbonization. Energy 2016, 97, 238–245. [Google Scholar] [CrossRef]
- Nizamuddin, S.; Mubarak, N.M.; Jayakumar, N.S.; Sahu, J.N.; Ganesan, P. Chemical, dielectric and structural characterization of optimized hydrochar produced from hydrothermal carbonization of palm shell. Fuel 2016, 163, 88–97. [Google Scholar] [CrossRef]
- Liu, Z.G.; Zhang, F.S. Removal of copper (II) and phenol from aqueous solution using porous carbons derived from hydrothermal chars. Desalination 2011, 267, 101–106. [Google Scholar] [CrossRef]
- Watanabe, M.; Sato, T.; Inomata, H.; Smith, R.L., Jr.; Arai, K., Jr.; Kruse, A.; Dinjus, E. Chemical reactions of C1 compounds in near-critical and supercritical water. Chem. Rev. 2004, 104, 5803–5821. [Google Scholar]
- Savova, D.; Apak, E.; Ekinci, E.; Yardim, F.; Petrov, N.; Budinova, T.; Razvigorova, M.; Minkova, V. Biomass conversion to carbon adsorbents and gas. Biomass Bioenergy 2011, 21, 133–142. [Google Scholar] [CrossRef]
- Kong, L.Z.; Miao, P.J.; Qin, J.G. Characteristics and pyrolysis dynamic behaviors of hydrothermally treated micro crystalline cellulose. J. Anal. Appl. Pyrolysis 2013, 100, 67–74. [Google Scholar] [CrossRef]
- Sakanishi, K.; Ikeyama, N.; Sakaki, T. Comparison of the hydrothermal decompositionreactivities of chitin and cellulose. Ind. Eng. Chem. Res. 1999, 38, 2177–2181. [Google Scholar] [CrossRef]
- Kong, L.Z.; Li, G.M.; He, W.Z. Reutilization disposal of sawdust and maize straw by hydrothermal reaction. Energy Sources Part A 2009, 31, 876–887. [Google Scholar] [CrossRef]
- Biagini, E.; Barontini, F.; Tognotti, L. Devolatilization of biomass fuels and biomass components studied by TG/FTIR technique. Ind. Eng. Chem. Res. 2006, 45, 4486–4493. [Google Scholar] [CrossRef]
- Kobayashi, N.; Okada, N.; Hirakawa, A.; Sato, T.; Kobayashi, J.; Hatano, S.; Itay, Y.; Mori, S. Characteristics of solid residues obtained from hot-compressed-water treatment of woody biomass. Ind. Eng. Chem. Res. 2009, 48, 373–379. [Google Scholar] [CrossRef]
- Zhu, N.Y.; Yan, T.M.; Qiao, J. Adsorption of arsenic, phosphorus and chromium by bismuth impregnated biochar: Adsorption mechanism and depleted adsorbent utilization. Chemosphere 2016, 164, 32–40. [Google Scholar] [CrossRef] [PubMed]
- Kumar, S.; Kothari, U.; Lee, Y.Y.; Gupta, R.B. Hydrothermal pretreatment of switchgrass and corn stover for production of ethanol and carbon microspheres. Biomass Bioenergy 2011, 35, 956–968. [Google Scholar] [CrossRef]
Figure 1.
Setup for hydrothermal carbonization (HTC) of reed biomass to produce biochar.
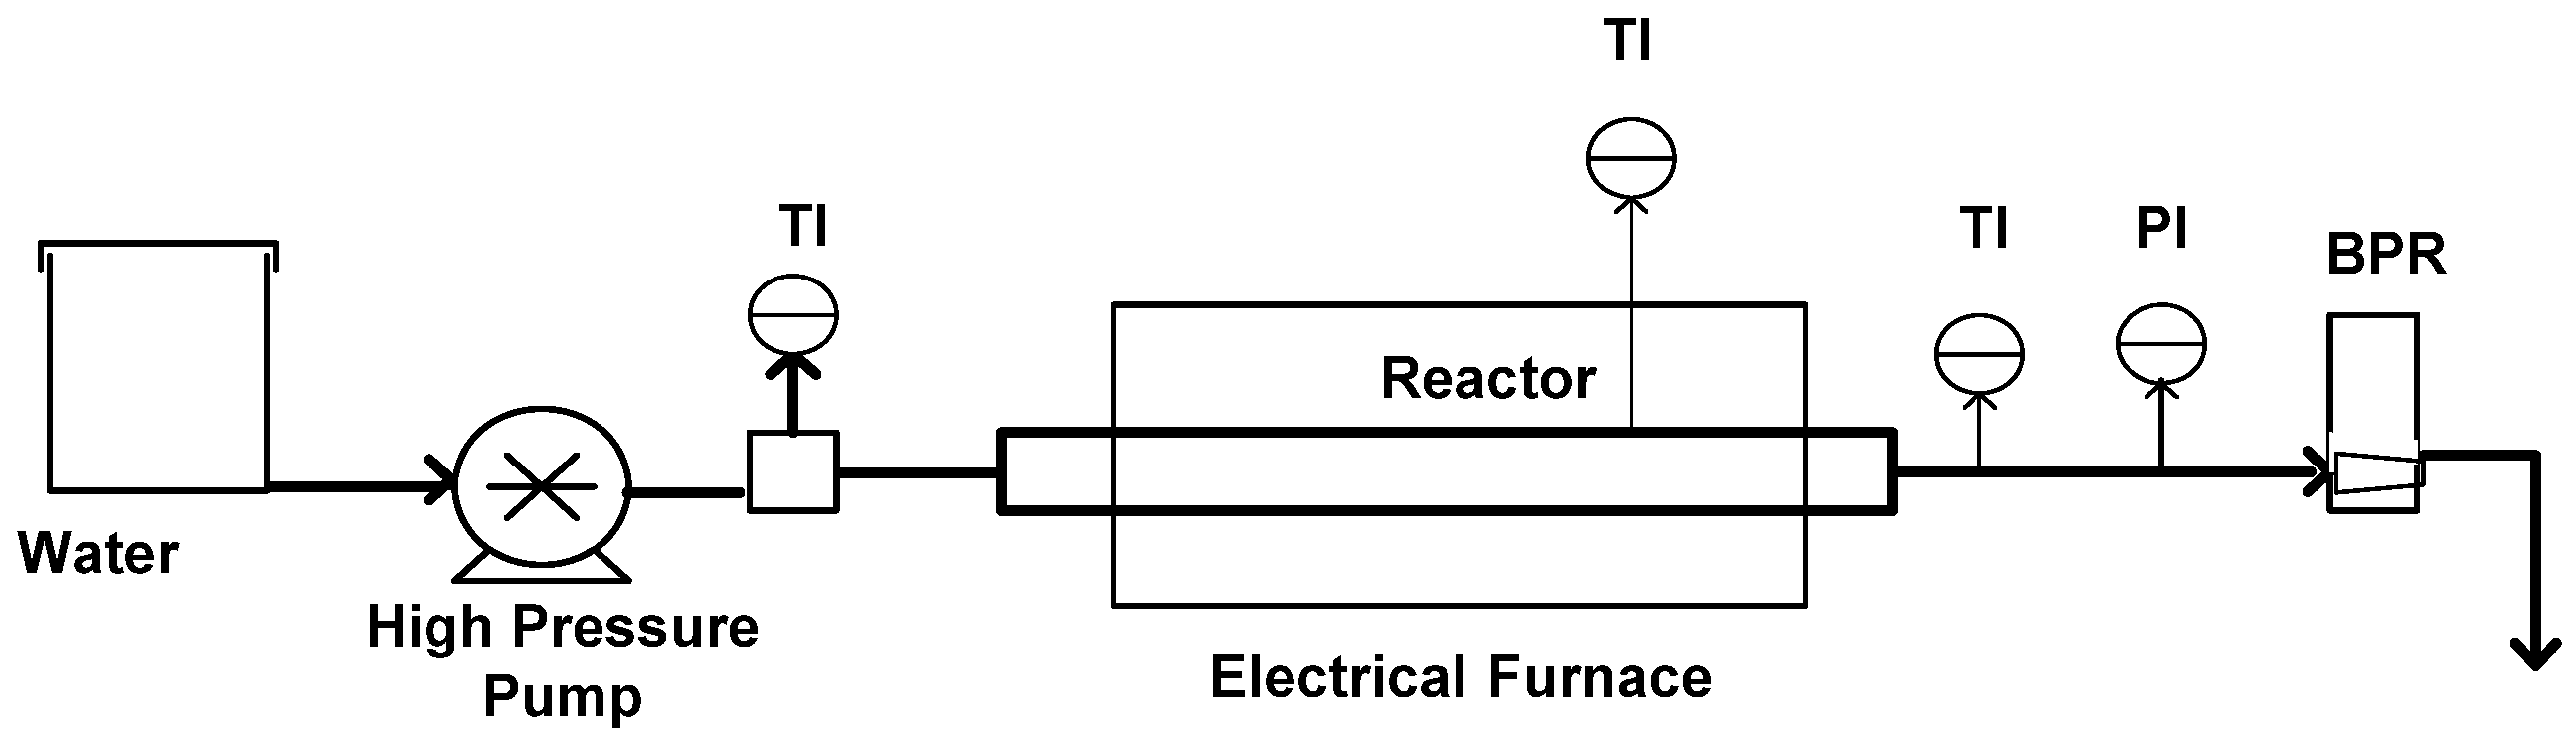
Figure 2.
Transform infrared spectroscopy (FTIR) results of reed and biochar, processing time 4.0 h (A—Reed, B—200 °C, C—230 °C, D—260 °C, E—280 °C).
Figure 2.
Transform infrared spectroscopy (FTIR) results of reed and biochar, processing time 4.0 h (A—Reed, B—200 °C, C—230 °C, D—260 °C, E—280 °C).
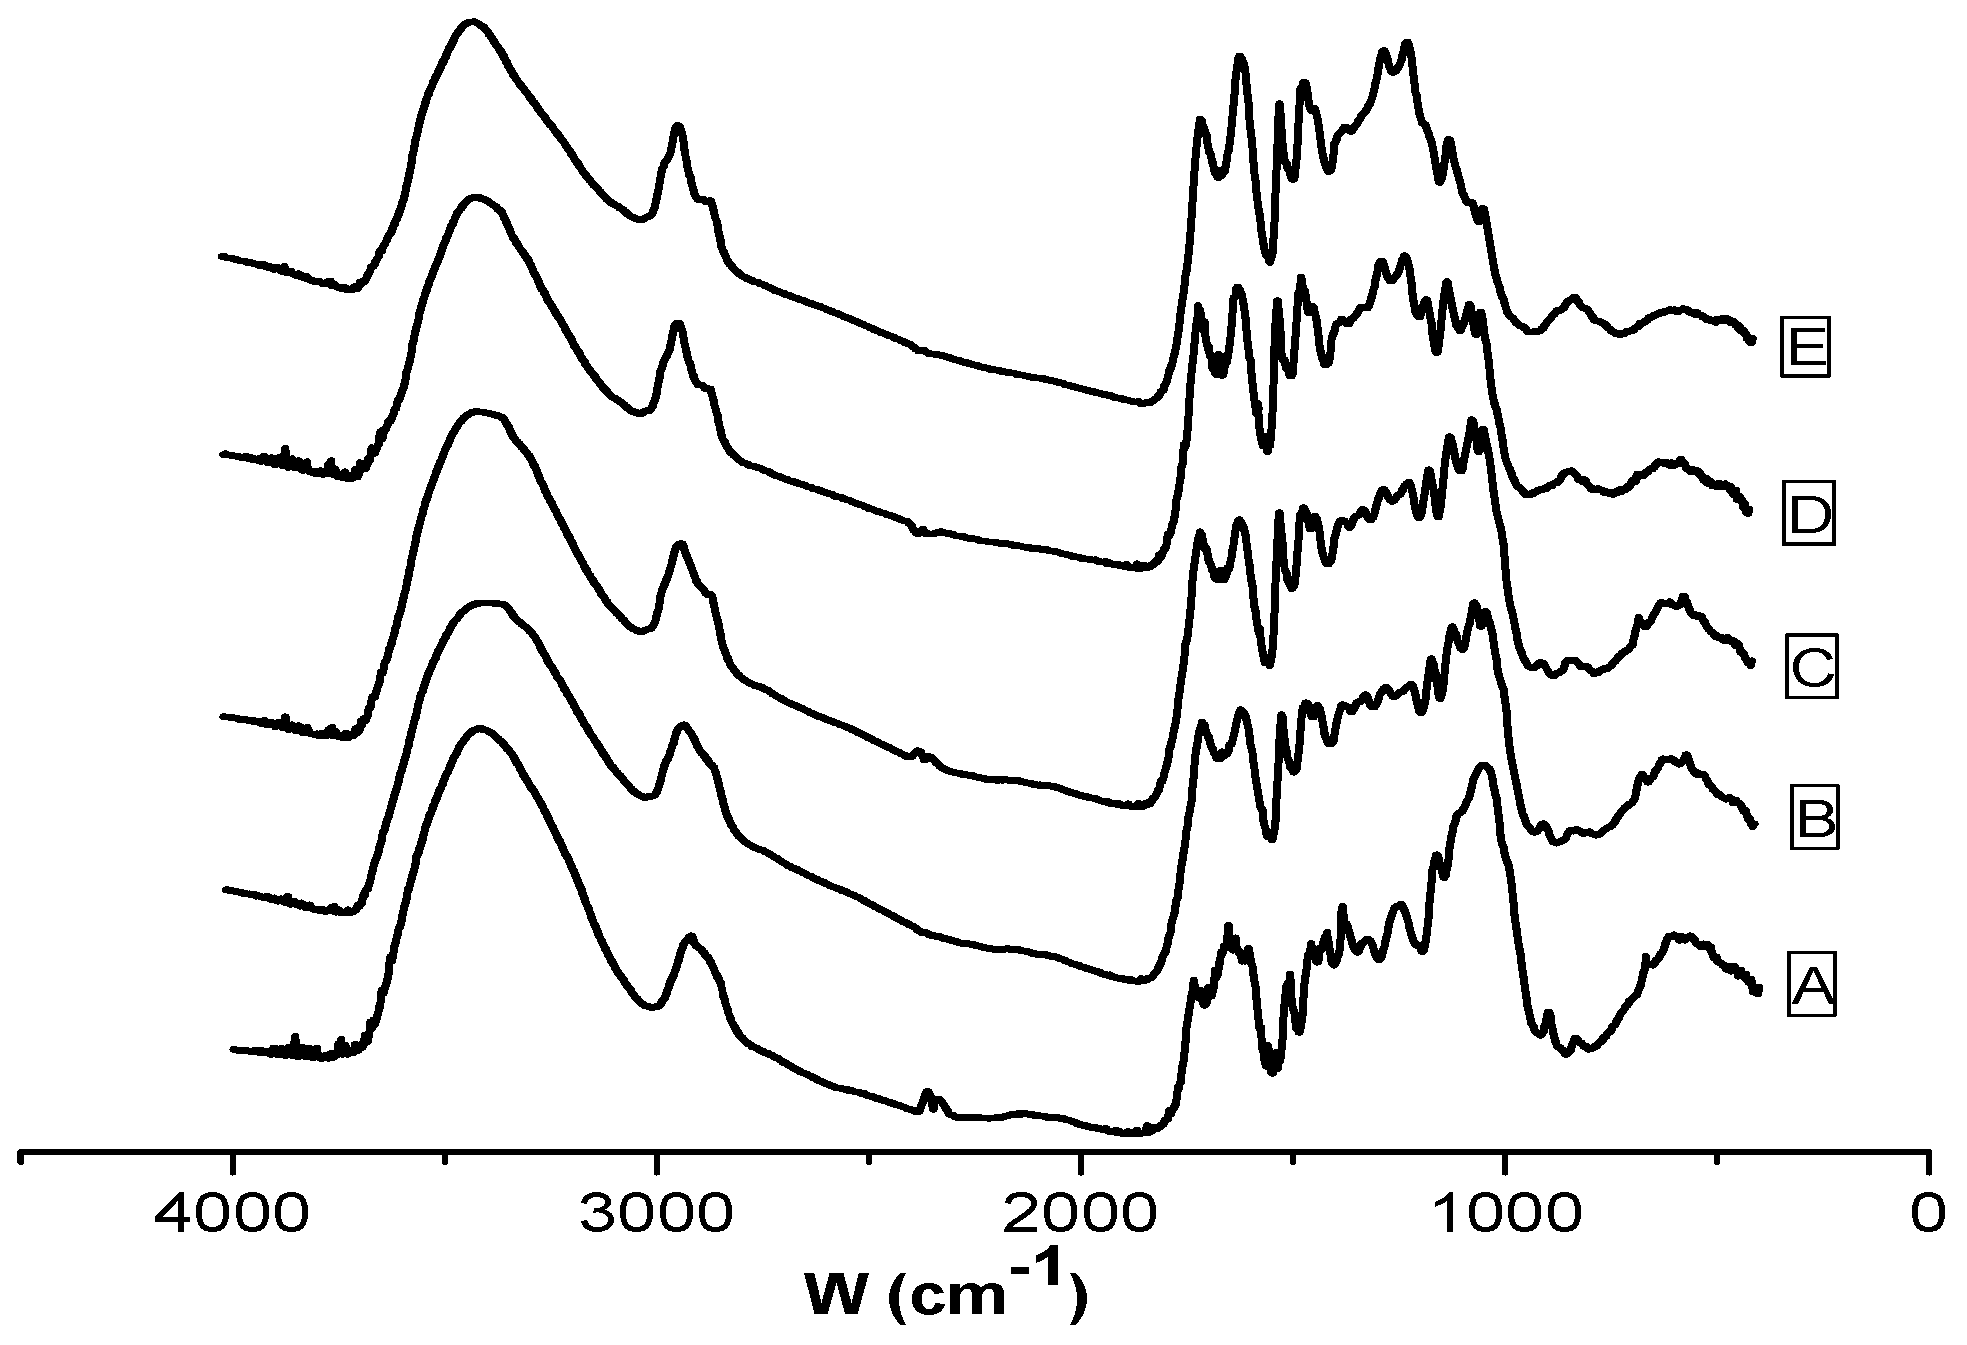
Figure 3.
Scanning Electron Microscope (SEM) results for reed (A) and biochar (B) obtained at 260 °C, 4.0 h.
Figure 3.
Scanning Electron Microscope (SEM) results for reed (A) and biochar (B) obtained at 260 °C, 4.0 h.
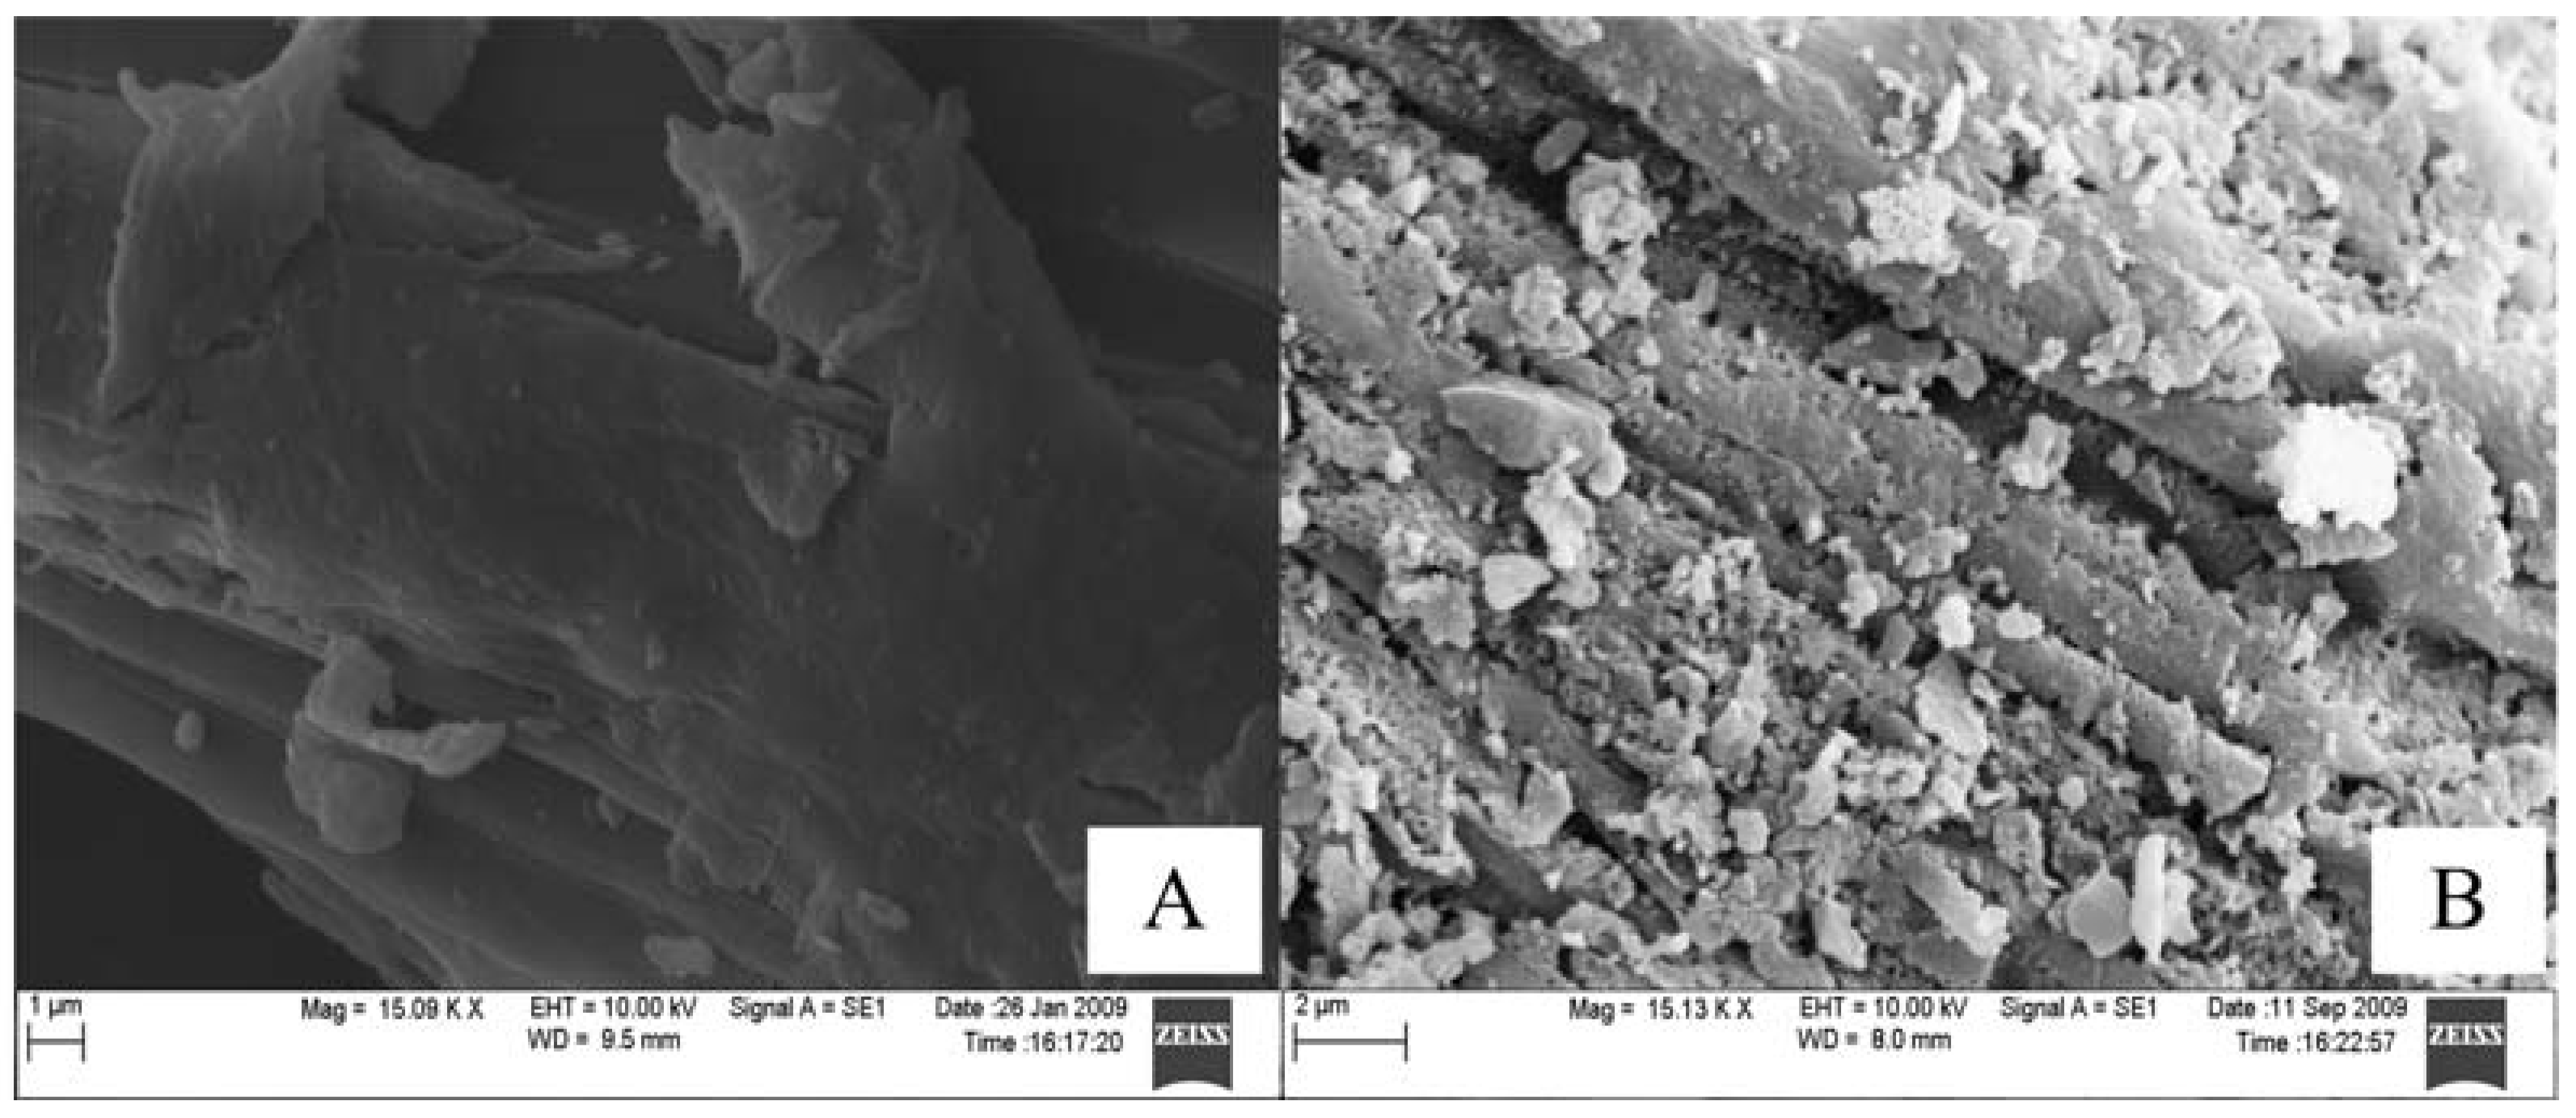
Figure 4.
X-ray Diffraction (XRD) results for reed and biochar obtained at 280 °C, 4.0 h.
Figure 5.
The conversion efficiency of carbon from biocrude obtained at different temperature (experiments on the HTC of biocrude at 200 °C, 2.0 h).
Figure 5.
The conversion efficiency of carbon from biocrude obtained at different temperature (experiments on the HTC of biocrude at 200 °C, 2.0 h).
Figure 6.
SEM image of biochar (HTC of biocrude obtained at 200 °C), 200 °C, 2.0 h. (A: scale: 10 μm; B: scale: 2 μm.)
Figure 6.
SEM image of biochar (HTC of biocrude obtained at 200 °C), 200 °C, 2.0 h. (A: scale: 10 μm; B: scale: 2 μm.)


Table 1.
The main properties of the reed.
| Properties | Mass |
|---|---|
| Moisture (wt.%) | 2.6 |
| Lignin (wt.%) | 23.5 |
| Cellulose (wt.%) | 39.5 |
| Hemicellulose (wt.%) | 26.7 |
| Carbon (wt.%) | 44.6 |
| HHV (kJ/g) | 17.1 |
Table 2.
Experiment summary and results.
| Run | Temp. (°C) | Time (h) | P (MPa) | Yield (wt.%) | HHV (kJ/g) | Energy Yield (%) |
|---|---|---|---|---|---|---|
| 1 | 200 | 2.0 | 17.2 | 59.8 | 21.5 | 75.2 |
| 2 | 200 | 2.0 | 27.6 | 66.7 | 20.9 | 81.5 |
| 3 | 200 | 4.0 | 17.2 | 63.2 | 21.5 | 79.5 |
| 4 | 200 | 4.0 | 27.6 | 60.6 | 21.8 | 77.2 |
| 5 | 230 | 2.0 | 17.2 | 48.9 | 26.9 | 76.9 |
| 6 | 230 | 4.0 | 27.6 | 45.6 | 24.3 | 64.8 |
| 7 | 230 | 2.0 | 17.2 | 52.8 | 25.7 | 79.4 |
| 8 | 230 | 4.0 | 27.6 | 49.1 | 25.4 | 72.9 |
| 9 | 200 | 4.0 | 2.4 | 66.4 | 20.3 | 78.9 |
| 10 | 230 | 4.0 | 4.1 | 37.8 | 23.5 | 51.9 |
| 11 | 260 | 4.0 | 6.5 | 28.4 | 25.9 | 43.0 |
| 12 | 280 | 4.0 | 8.3 | 19.0 | 28.1 | 31.2 |
| 13 | 280 | 0.5 | 7.2 | 20.7 | 24.7 | 29.9 |
| 14 | 280 | 1.0 | 7.2 | 19.2 | 28.3 | 31.8 |
Table 3.
FRIR spectrum of the reed and biochar.
| Position of the Bands (cm−1) | Functional Group |
|---|---|
| 3401 | O–H stretching vibration |
| 2920 | CH, CH2 stretching vibration |
| 1700 | Carbonyl C=O stretching vibration |
| 1600 | C=C stretching vibration |
| 1513 | Benzene ring stretching vibration |
| 1424 | CH2 shearing, CH2 bending vibration |
| 1383 | CH bending vibration |
| 1267 | C–O–C stretching vibration in alkyl aromatic |
| 1160 | C–O–C asymmetry stretching vibration |
| 1060 | C–O stretching vibration |
Table 4.
The main organic compounds in biocrude.
| Composition | 200 °C | 230 °C | 260 °C | 280 °C |
|---|---|---|---|---|
| Glucose (g/L) | 2.7 | 1.2 | 0.4 | 0.3 |
| Lactic acid (g/L) | 3.2 | 3.5 | 3.6 | 2.7 |
| Acetic acid (g/L) | - | 0.6 | 1.1 | 0.9 |
| HMF (g/L) | - | - | - | 0.7 |
| Furan (g/L) | - | - | - | 1.9 |
© 2017 by the authors. Licensee MDPI, Basel, Switzerland. This article is an open access article distributed under the terms and conditions of the Creative Commons Attribution (CC BY) license (http://creativecommons.org/licenses/by/4.0/).
Share and Cite
MDPI and ACS Style
Liu, C.; Huang, X.; Kong, L. Efficient Low Temperature Hydrothermal Carbonization of Chinese Reed for Biochar with High Energy Density. Energies 2017, 10, 2094. https://doi.org/10.3390/en10122094
AMA Style
Liu C, Huang X, Kong L. Efficient Low Temperature Hydrothermal Carbonization of Chinese Reed for Biochar with High Energy Density. Energies. 2017; 10(12):2094. https://doi.org/10.3390/en10122094
Chicago/Turabian StyleLiu, Chang, Xin Huang, and Lingzhao Kong. 2017. "Efficient Low Temperature Hydrothermal Carbonization of Chinese Reed for Biochar with High Energy Density" Energies 10, no. 12: 2094. https://doi.org/10.3390/en10122094
Note that from the first issue of 2016, this journal uses article numbers instead of page numbers. See further details here.