A Method of Abnormal States Detection Based on Adaptive Extraction of Transformer Vibro-Acoustic Signals


1
School of Electrical Engineering, Shandong University, Jinan 250061, China
2
Shandong Provincial Key Lab of UHV Transmission Technology and Equipment, Jinan 250061, China
*
Author to whom correspondence should be addressed.
Energies 2017, 10(12), 2076; https://doi.org/10.3390/en10122076
Submission received: 27 October 2017
/
Revised: 26 November 2017
/
Accepted: 3 December 2017
/
Published: 7 December 2017
Abstract
:State monitoring is very important for the safe operation of high-voltage transformers. A non-contact vibro-acoustic detection method based on the Blind Source Separation (BSS) was proposed in this paper to promote the development of transformer on-line monitoring technology. Firstly, the algorithm of Sparse Component Analysis (SCA) was applied for the adaptive extraction of vibro-acoustic signals, which utilizes the sorted local maximum values of the potential function. Then, the operating states of the transformer were detected by analyzing the vibro-acoustic signal eigenvectors. Different conditions including running normally, increasing of transformer vibro-acoustic amplitude and changing of frequency component of transformer vibro-acoustic were simulated. Moreover, experiments were carried out in a 220 kV substation. The research results show that the number of mixed noise sources can be estimated and the transformer vibro-acoustic signal was always ranked first in the separation signals. The source signals were effectively separated from the mixed signals while all of the correlation coefficients are more than 0.98 and the quadratic residuals are less than −32 dB. As for the experiments, the vibro-acoustic signal was separated out successfully from two voice signals and two interference signals. The acoustic signal reflection is considered as the main cause of the signal interference, and the transformer volume source model is considered as the main reason of unstable vibro-acoustic signal amplitude. Finally, the simulated abnormal states of the transformer were well recognized and the state of the tested transformer was judged to be normal.
1. Introduction
As an important part of the transmission grid, high-voltage transformers play a critical role in the stability and reliability of the whole power grid. It is imperative to monitor the operating states of transformers to avoid breakdowns [1,2]. Different amplitudes and frequencies of vibro-acoustic signals will be radiated to the surroundings along with the internal vibration of a running transformer including periodic vibration caused by the magnetostrictive effect of core silicon steel sheet and the winding vibration produced by electrodynamic force [3,4]. The operation states of the transformer can be obtained by monitoring the amplitudes and frequencies of the vibro-acoustic signals which contains rich information about the transformer. It is worth noting that internal faults such as the winding deformation and loose-parts with a negative impact on operation are generally difficult to detect through conventional electrical measurement methods. Nevertheless, these hidden faults can be reflected by the vibro-acoustic signals. Therefore, it is necessary to study and discussion on abnormal states detection based on vibro-acoustic signals [5,6,7,8].
During the last decades, major works have been carried out for development of reliable and accurate condition assessment techniques, including partial discharge (PD) diagnostic techniques, frequency response analysis (FRA) for electrical or mechanical damages of windings, dissolved gas analysis (DGA) for internal transformer faults, the induced voltages ratio-based algorithm, vibration signals detection, etc. However, it is impossible to conduct live detection and diagnosis with electric isolation between transformer and the sensors for the above methods which use contact sensors. These contact sensors may be interfered with or damaged by the complex operation environment with high voltages and strong electromagnetic fields, which would affect the normal operation of the detection system. In addition, the contact sensor, which is very inconvenient to install and maintain, destroys the integrity of external electrical equipment and may bring unexpected serious consequences when failure occurs [9,10,11,12,13,14,15]. Hence, abnormal states detection with non-contact systems has good application prospects.
The vibro-acoustic signal contains rich information about the operation status of the transformer [16,17,18]. Thus we can collect vibro-acoustic signals of power equipment through non-contact acoustic sensors, and analyze the acoustic signals to detect the transformer operation status. However, the vibro-acoustic signal of high-voltage transformers may be mixed with a variety of noises that affect signal acquisition and fault diagnosis. Blind Source Separation (BSS) is a typical method to separate source signals from several different observations provided by sensors [12,19]. Reference [20] describes a BSS algorithm based on the Sub-Band Decomposition Independent Component Analysis (SDICA) which is capable of separating the core vibration signal and winding vibration signal from the mixed transformer vibration signal [20]. In [21], an electrical equipment fault detection algorithm based on audio features was proposed. The sound signals are collected through the microphone array and it is separated by applying Independent Component Analysis (ICA). After that, the separated signals are used for the fault detection. ICA, as well as its extended algorithm, is a classic BSS method, but the number of observed signals must be more than or equal to the number of source signals. Therefore, the sensor must be set inasmuch as possible to make sure that all independent components will be separated [21]. Meanwhile, the order of the transformer vibro-acoustic signal and other separated noise signals is uncertain due to the blur rank problem of BSS.
An adaptive transformer vibro-acoustic signal extraction method based on BSS is proposed in which the algorithm of Sparse Component Analysis (SCA) based on potential function is improved according to the analysis of substation noise. The transformer vibro-acoustic signal and the hybrid noise signals are separated out by defining a potential function. The blur rank problem of BSS is solved by sorting the local maxima of the potential function. As a result, the transformer vibro-acoustic signal is always ranked first in the separation signals while other mixed noise signals are arranged in the light of their impact on the transformer vibro-acoustic signal. With respect to the detection of abnormal states, an algorithm based on eigenvectors of the vibro-acoustic signal is proposed in which the transformer vibro-acoustic signal is characterized by the short-time average amplitude, short-time zero crossing ratio and maximum spectrum. Because of the mixed eigenvectors, the information of the signal both in time domain and sparse domain is obtained completely. The accuracy of the algorithm is guaranteed since the signal is analyzed frame by frame.
2. Adaptive Extraction of Vibration Sound
Firstly, it is necessary to introduce the sound environment of a substation. It is worth noting that the vibro-acoustic emissions of the transformer result from the internal vibration including the magnetostrictive effect in the core, Maxwell forces in the core, Lorentz forces in the windings [22]. Besides, noise sources of the transformer substation can be divided into two kinds: one is persistent deterministic noise, including corona noise generated by high voltage transmission lines as well as reactor noise produced by substation reactors, the other is occasionally occurring random noise, including staff voice noises near the transformer, noise produced by electronic equipment such as mobile phones, the sound of the wind, etc. [23,24,25]. The acoustic signals model of the transformer substation is described as:
where y(t) is the mixed acoustic signal, l(t) is the transformer vibro-acoustic signal, m(t) is the deterministic noise, n(t) is the random noise.
Deterministic noise is easily eliminated by using filters. Nevertheless, the random noise is difficult to process because of its randomness and uncertainty. In this case, it is necessary to take full advantage of BSS to get rid of the random noise.
2.1. Sparse Component Analysis
In the underdetermined condition where the number of composite signal is less than that of source signal, the mathematical model of transformer composite signal is:
where x1(t) and x2(t) are two composite signals which means there are two sound sensors, sn(t) is n-th source signal and n > 2 in the underdetermined condition, amn is element in m rows and n columns of the hybrid matrix A.
Most of the time, the values of the sparse signal are zero or close to zero. That is to say, it is very likely that only one source signal is nonzero at the same time if all source signals meet the sparse requirements. In most cases, Equation (2) can be simplified as:
Thus, each source signal determines a straight line where the direction is (a1j, a2j)T. Making use of this sparse characteristics, hybrid matrix A can be estimated and source signals can be extracted [26].
However, the transformer vibro-acoustic signal does not meet the sparse requirements. Firstly, the hybrid signals must be transformed into sparse domain by Fourier transform. Then, the source signals are reconstructed by inverse Fourier transform after the separation. The signals are transformed from time domain to frequency domain, meanwhile the assumption of the sparse component analysis in time domain should be extended to frequency domain [27,28,29]. That is to say, it is almost impossible that two source signals are both nonzero at the same frequency if all source signals meet the sparse requirements after applying the Fourier transform.
2.2. Improved Potential Function
Multiple source signals are mixed into two ways expressed as x1(t) and x2(t) in the application of transformer vibro-acoustic signal extraction. Taking x1(t) as abscissa axis and x2(t) as vertical axis, the direction of observed data point can be represented as:
Defining a global potential function as follows:
where lt is the weight factor of each data point, θ is the directional angel of each point, λ represents the scale factor which is used for adjusting the resolution of window function. Then a primary function can be defined as:
where α is angular difference between θ and θt. Next, potential function variable θ is discretized as:
where θk is kth sampling point of θ, and (θk,λ) can be solved after θ is discretized. Then local maximums of the potential function can be found out. Furthermore, corresponding angles are obtained to determine the hybrid matrix.
The selection of local maximums can be improved considering the working condition of the substation. In particular, neglecting some local maximums whose features are not obvious will speed up the calculations, specifically, by taking the difference between a local maximum and its adjacent left local minimum as a characteristic parameter while multiplying the maximum value of the potential function by a scale parameter as a reference value. Only if the characteristic parameter of the local maximum point is greater than the reference value, is the point considered to be an effective local maximum point.
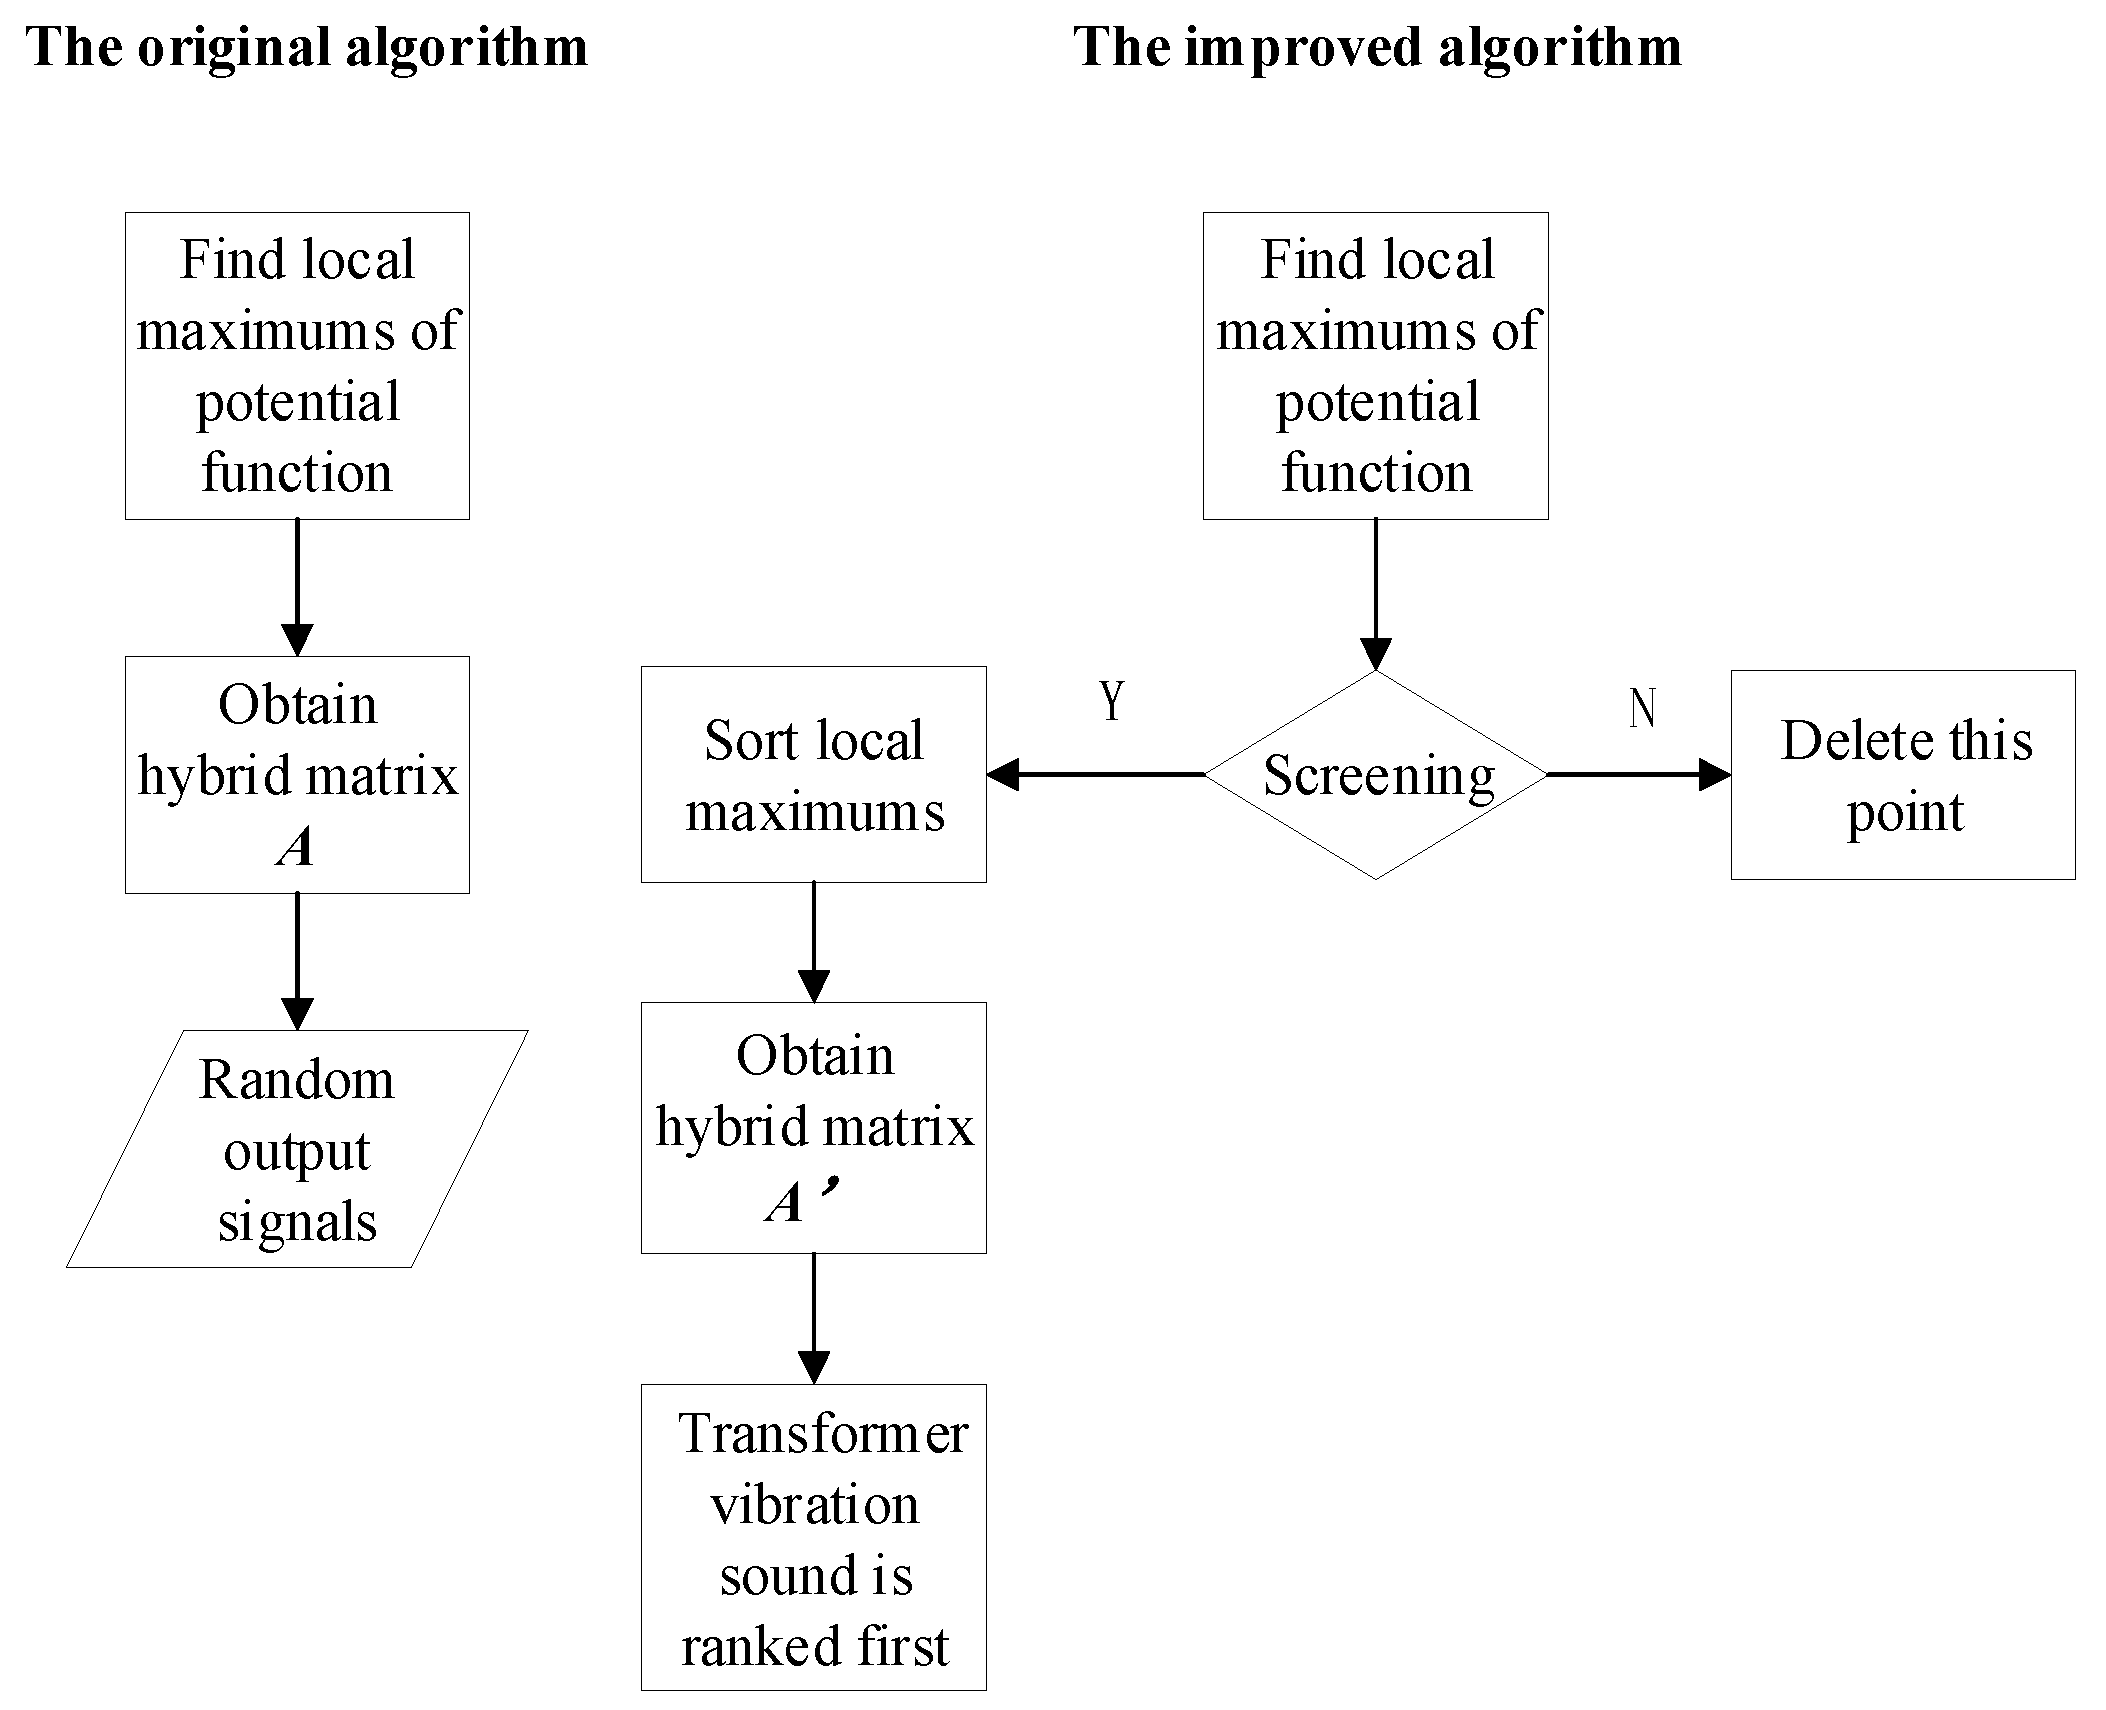
In order to solve the problem that the output of the Blind Source Separation (BBS) is chaotic, sorting part is added to the algorithm. Compared to random noise, transformer vibro-acoustic signals generally have the greatest energy with obvious periodic characteristics. As a result, transformer vibro-acoustic signals usually correspond to the maximum value of the potential function curve. According to the above analysis, the algorithm can be improved to arrange the outputs in descending order, so that the transformer vibro-acoustic signal will be always ranked first in the separation signals.
As shown in Figure 1, A’ is sorted by the values of potential function. The difference between hybrid matrix A and A’ is that A’ gets rid of some local maximums which do not meet the requirements.
3. Detection of Abnormal States
3.1. Signal Framing
In order to reduce the energy leakage during signal processing, different truncation functions called window functions are employed. Several common window functions are rectangular windows, triangular windows, Hanning windows and Hamming windows. Combined with the above principle, a Hanning window was applied to the mixed signals as well as the separated transformer vibro-acoustic signal. Assuming that the window size is N, the time-domain function of Hanning window is:
The frequency-domain function of Hanning window:
where w(n) is Hanning window function in time-domain, W(w) is Hanning window function in frequency-domain, N is window size, n is sampling point and WR is function of amplitude-frequency characteristic.
3.2. Extract the Eigenvectors
Mixed eigenvectors including short-time average amplitude, short-time zero crossing ratio and maximum spectrum are selected to characterize the signal. Assuming that sound signal is x(n), the window size is N, the short-time average amplitude Mn is defined as follows:
Mn is the sum of the absolute values of one frame signal’s amplitude. As a sign of signal energy, Mn can be used to characterize changes of the vibro-acoustic signal.
The short-time zero-crossing rate Zn is:
where N is window size, sgn[·] is symbolic function as:
The short-time zero-crossing rate Zn is times that the signal pass through the zero value per frame. The threshold value of short-term zero-crossing rate is employed to get rid of the illegal zero crossing point. Assuming that temp1 and temp2 are two adjacent and opposite sampling points, only when the result of temp1-temp2 is bigger than the threshold value, the zero crossing point can be seen as valid. The maximum spectrum is the maximum Fourier amplitude of each frame signal after being processed by the fast Fourier transform.
3.3. Detection
Generally, the transformer vibro-acoustic signal is smooth if the transformer is running normally. Nevertheless, transformer faults such as looseness of mechanical parts will result in an amplitude increase or frequency change. According to this, the Euclidean distance between adjacent eigenvectors and deviation of eigenvectors which can reflect the change of sound signal both in amplitude and frequency are proposed to detect the abnormal states of transformer:
- (1)
- Feature vector. Combine the eigenvectors of each frame signal into Xn = [x1n x2n x3n].
- (2)
- Euclidean distance between adjacent eigenvectors (Dn). Calculate the Euclidean distance of feature vector between nth window and (n − 1)th window from the second frame:
- (3)
- The deviation of eigenvectors (dn). Calculate the Euclidean distance deviation of each frame signal’s eigenvectors. The normal feature vector is X0 = [x10 x20 x30]:
- (4)
- Detection of abnormal states: determine the operation condition of transformer by plotting the Euclidean distance between adjacent eigenvectors and deviation of eigenvectors.
4. Simulation Analysis
It is worth noting that transformers rarely malfunction, hence a simulation analysis is necessary. Three conditions, including running normally, increase of transformer vibro-acoustic signal amplitude and change of the frequency component of the transformer vibro-acoustic signal were simulated by MATLAB Signal Processing Toolbox (R2016a, MathWorks, Natick, MA, USA) to verify the validity and accuracy of the algorithm under different circumstances. The simulation signals were mixtures of transformer vibro-acoustic signals and speech signals. Firstly, the mixed signals need to be transformed to the sparse domain by Fast Fourier Transform (FFT) to meet the application requirements. After the separation is completed, the source signals were reconstructed by the inverse Fourier transform.
4.1. Sparse Transformation of Mixed Signals
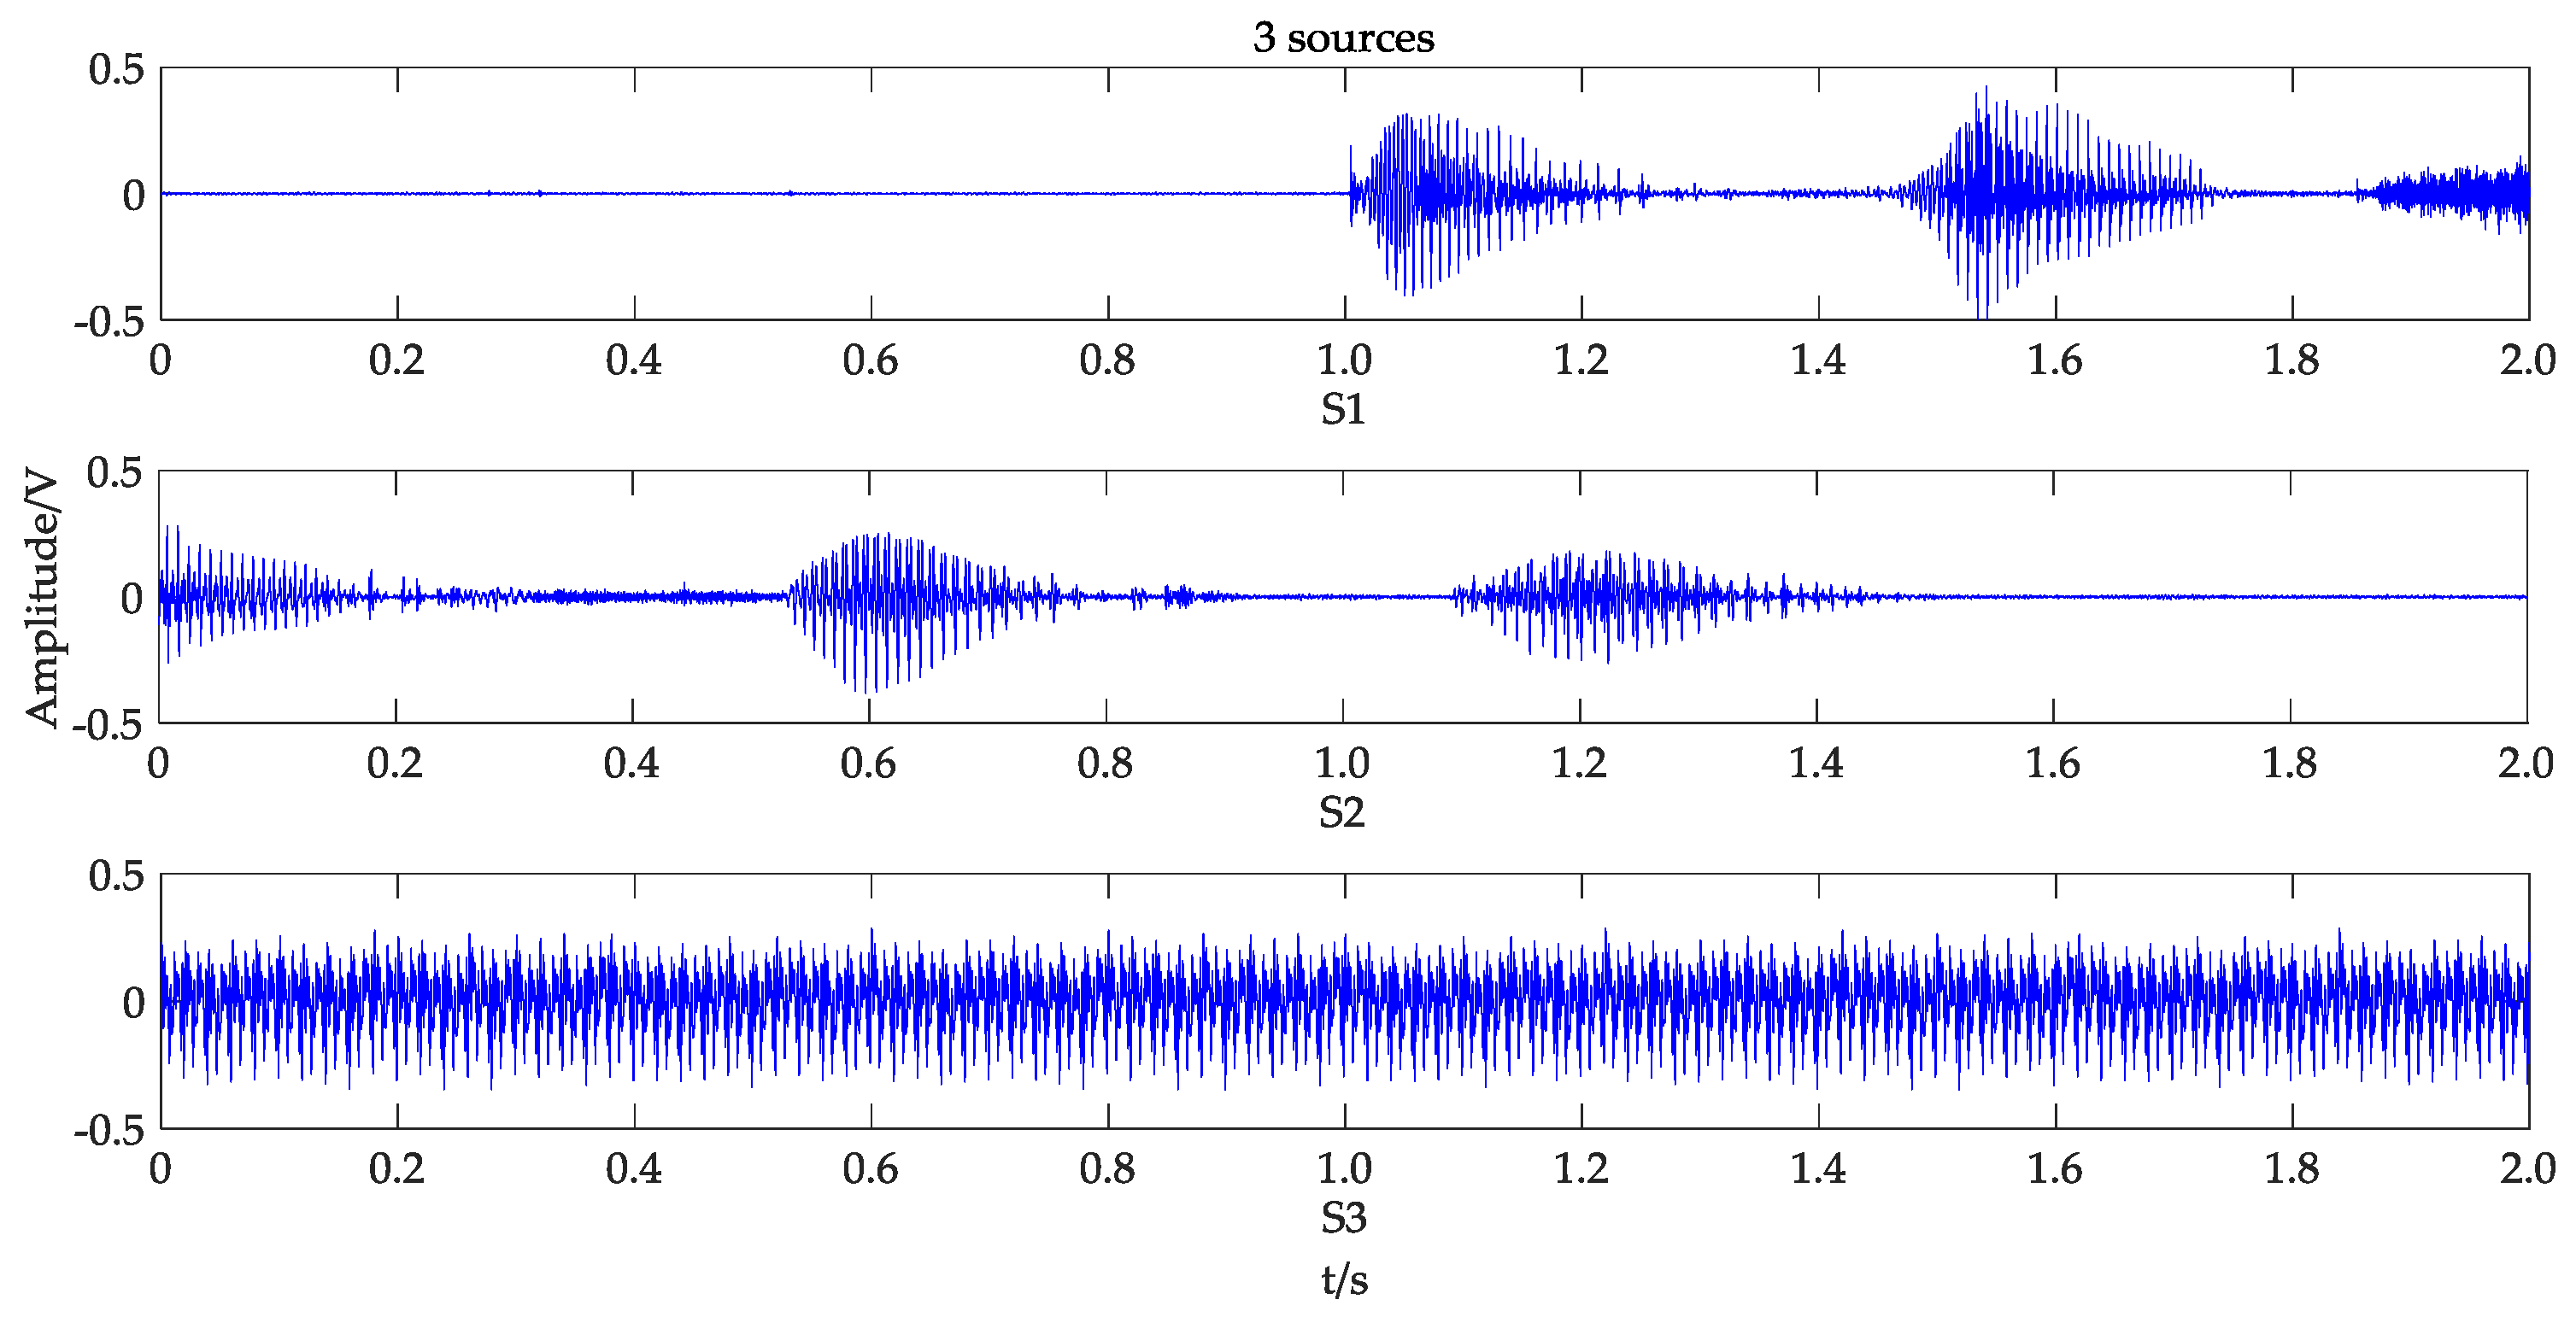
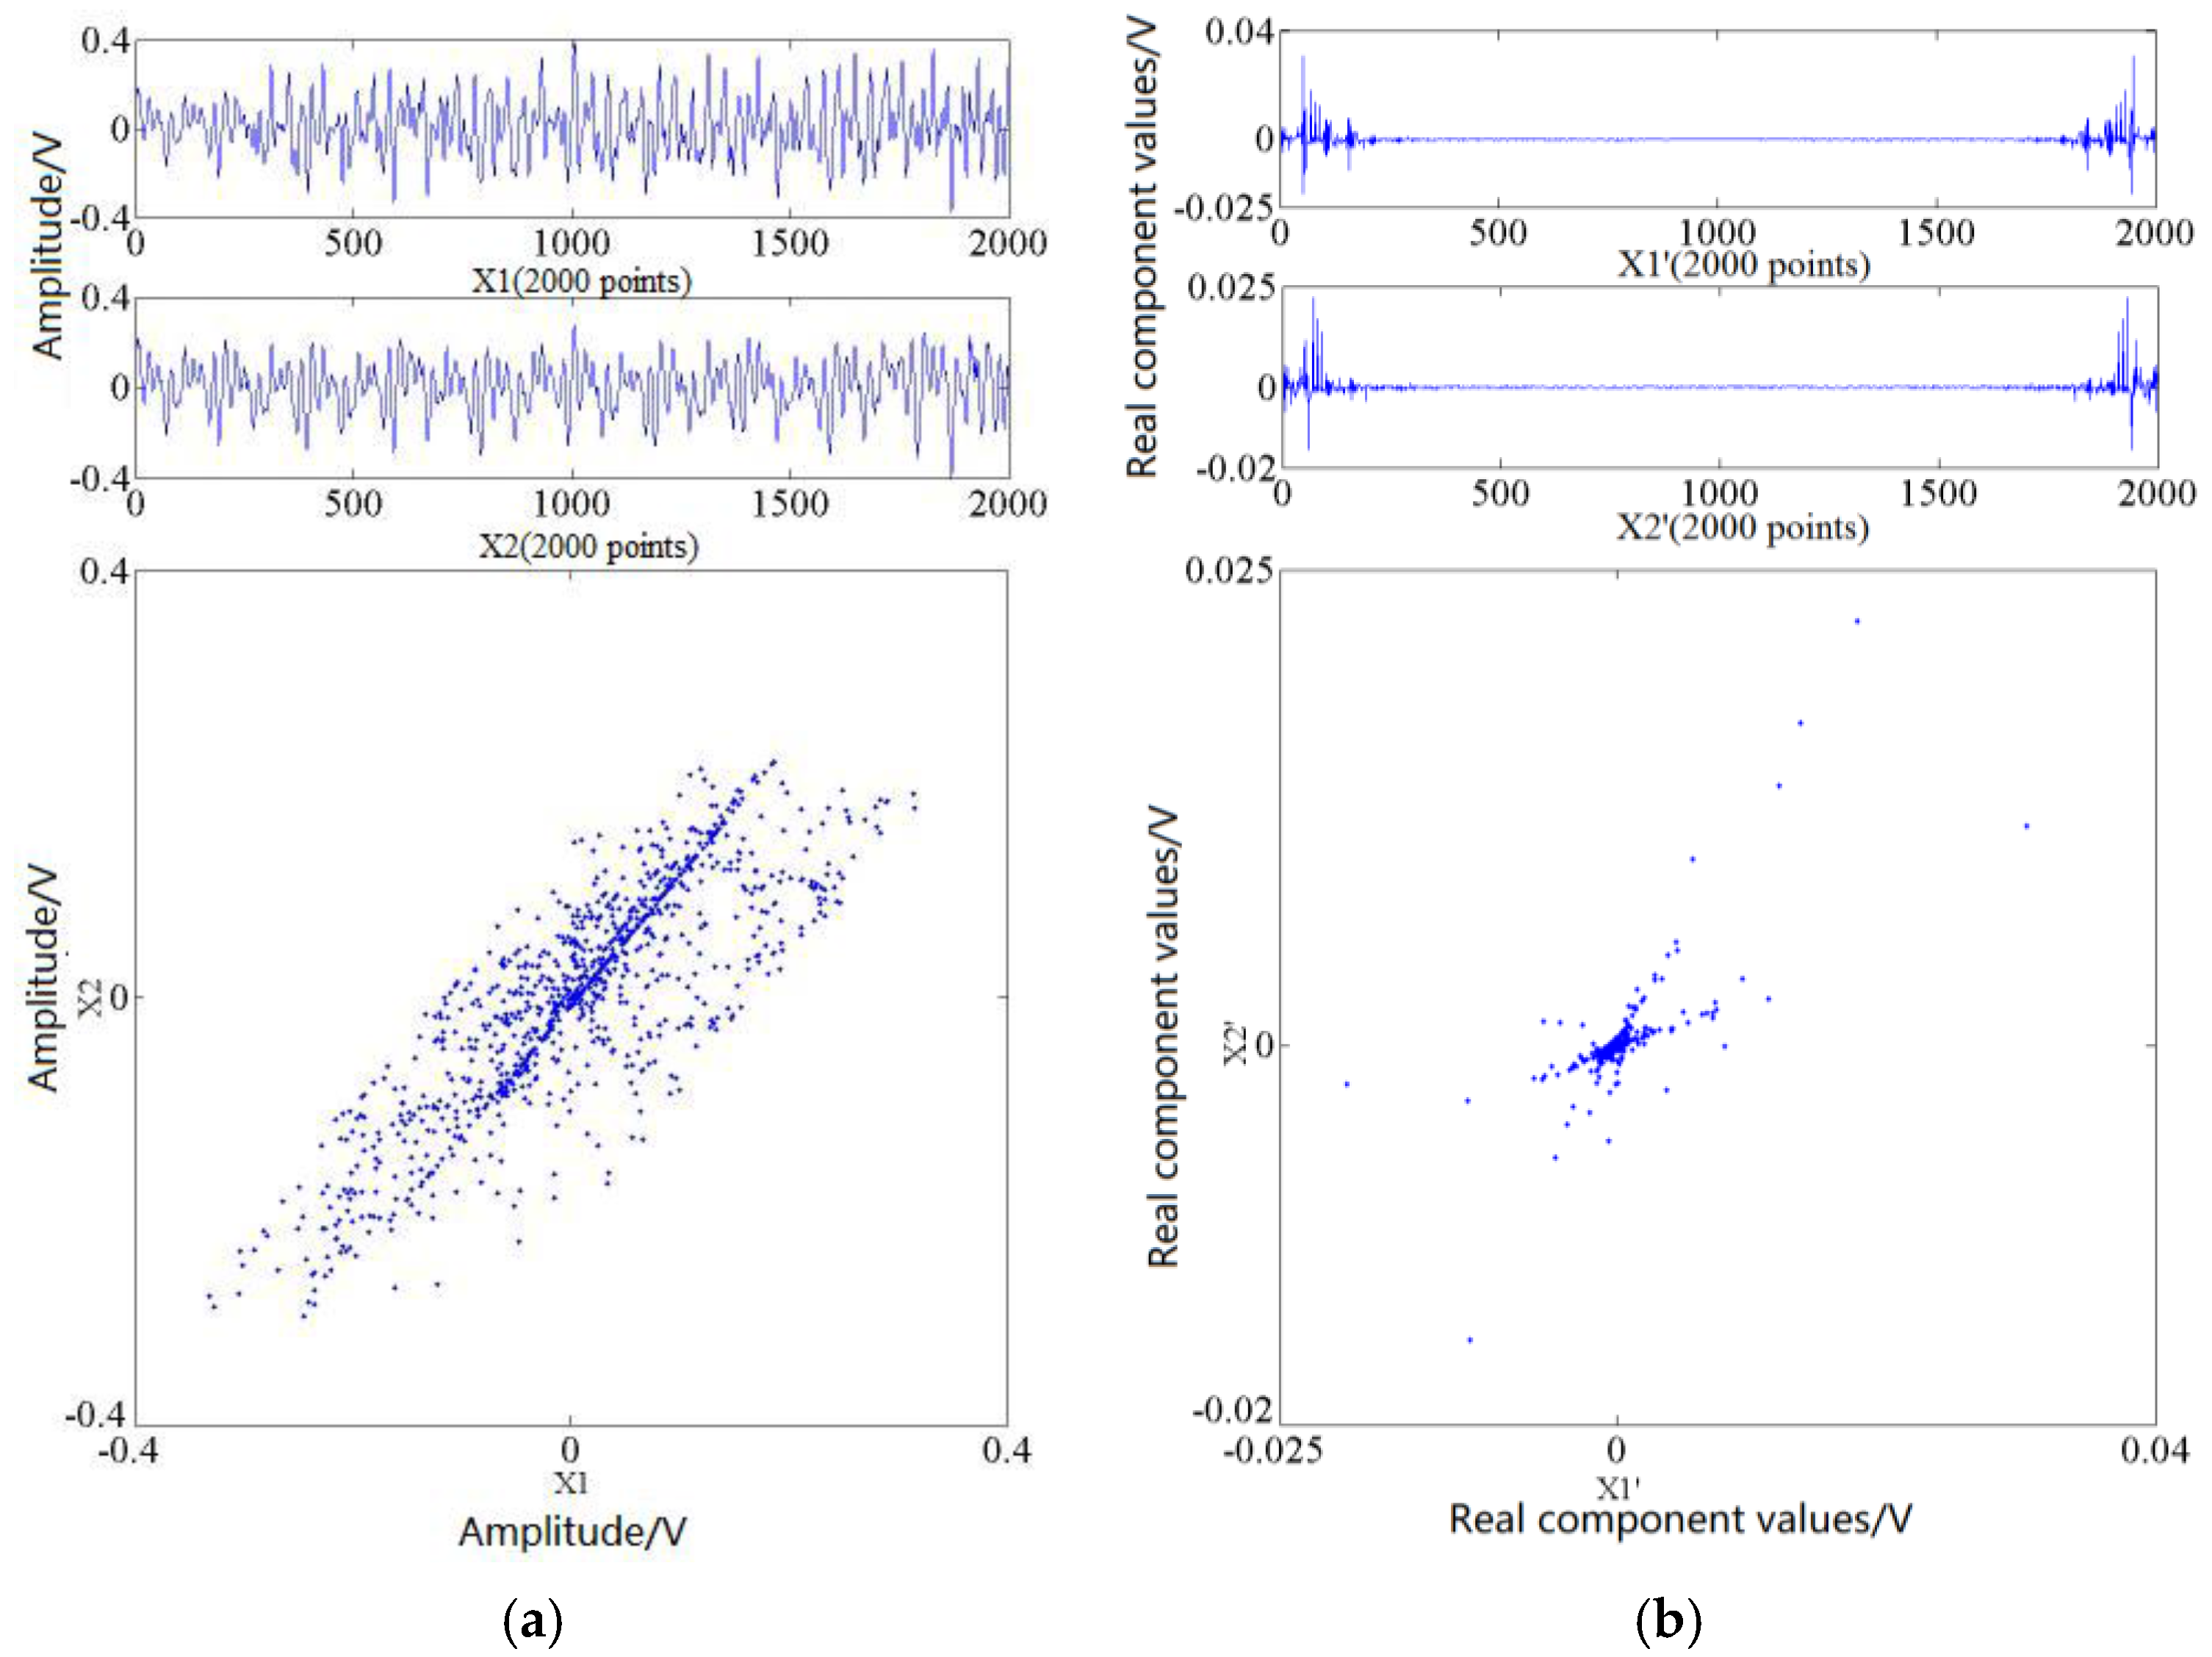
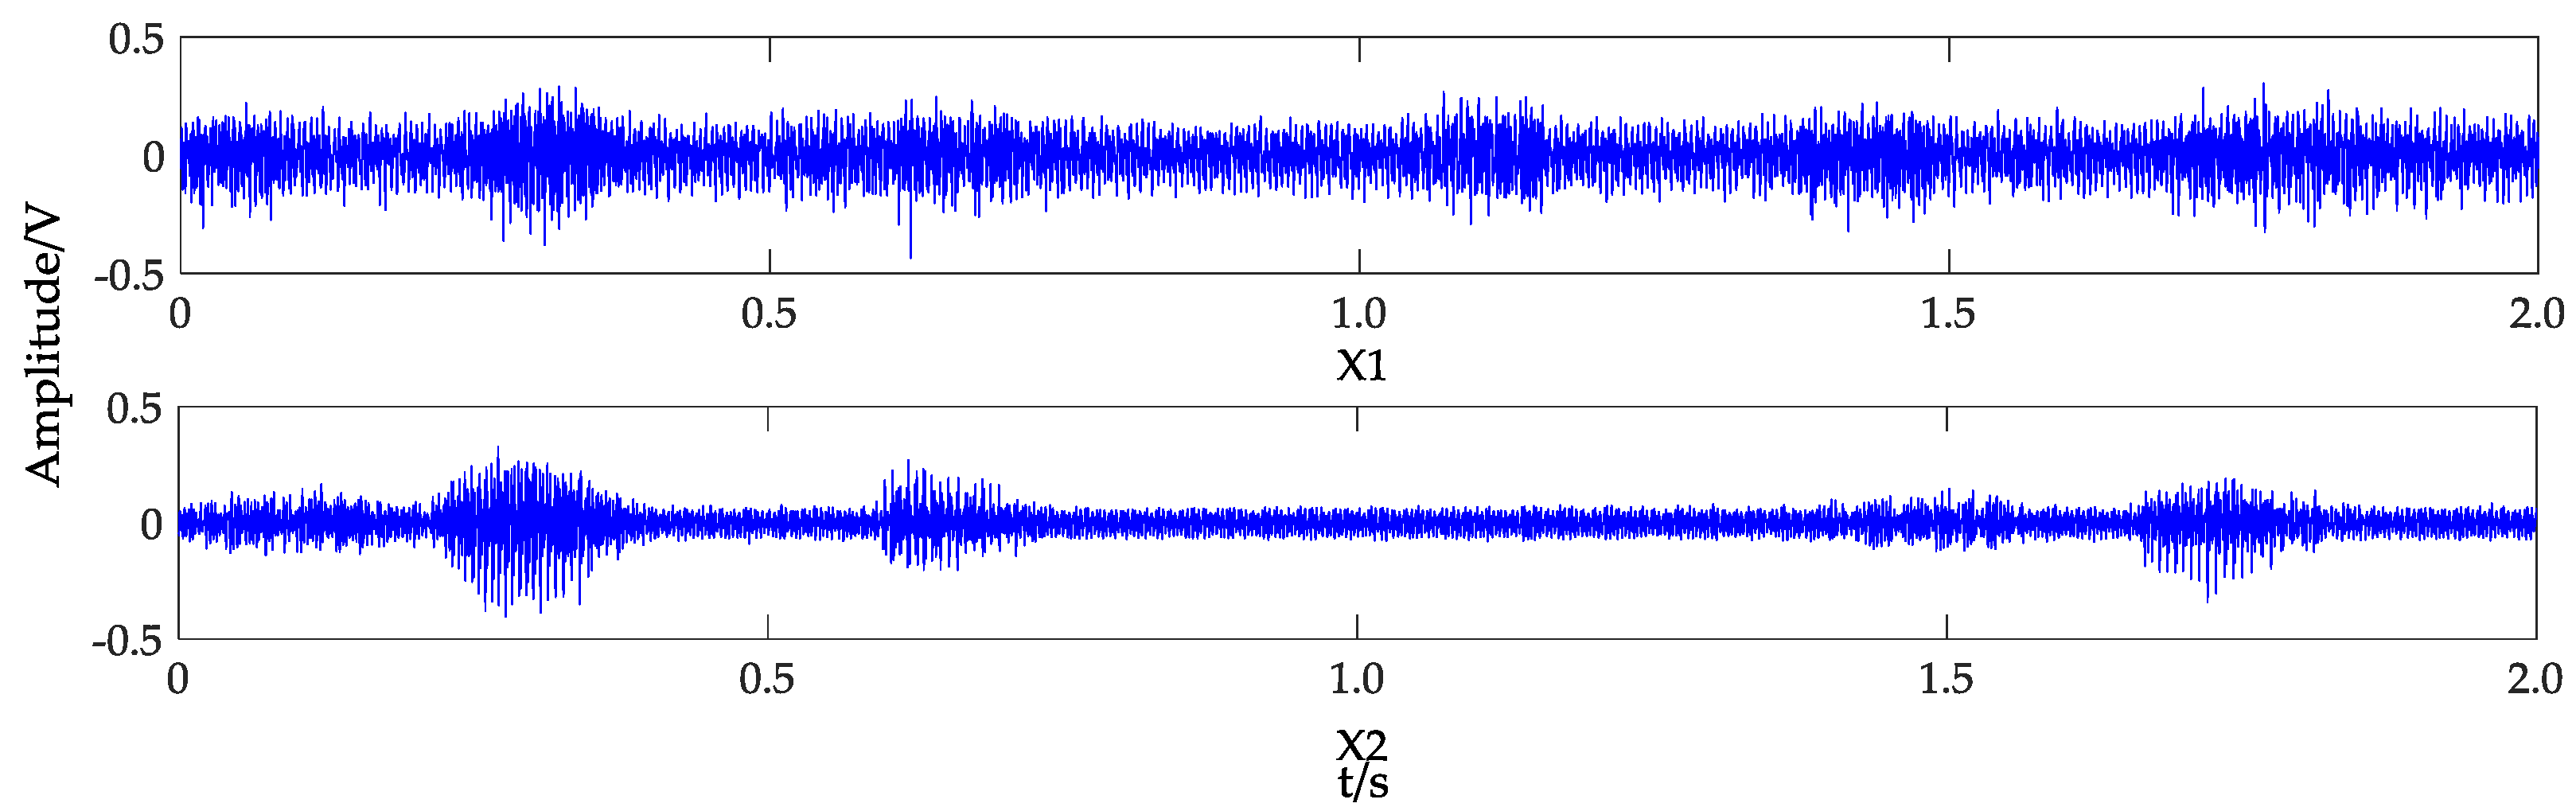
As shown in Figure 2, S1 and S2 are voice signals, and S3 is a transformer vibro-acoustic signal. The hybrid matrix A had two rows and X = A × S, hence two observed signals would be acquired. Based on the actual situation in the substation, the elements of A were generated randomly while the size relationship of the elements was determined. Besides, the mixed non-sparse signals had been transformed to sparse domain to meet the application requirements before the separation. The simulation time was set to 2 s and sampling frequency was set to 10,000 Hz. The window size of FFT was 2000, which corresponds to 0.2 s in time domain.
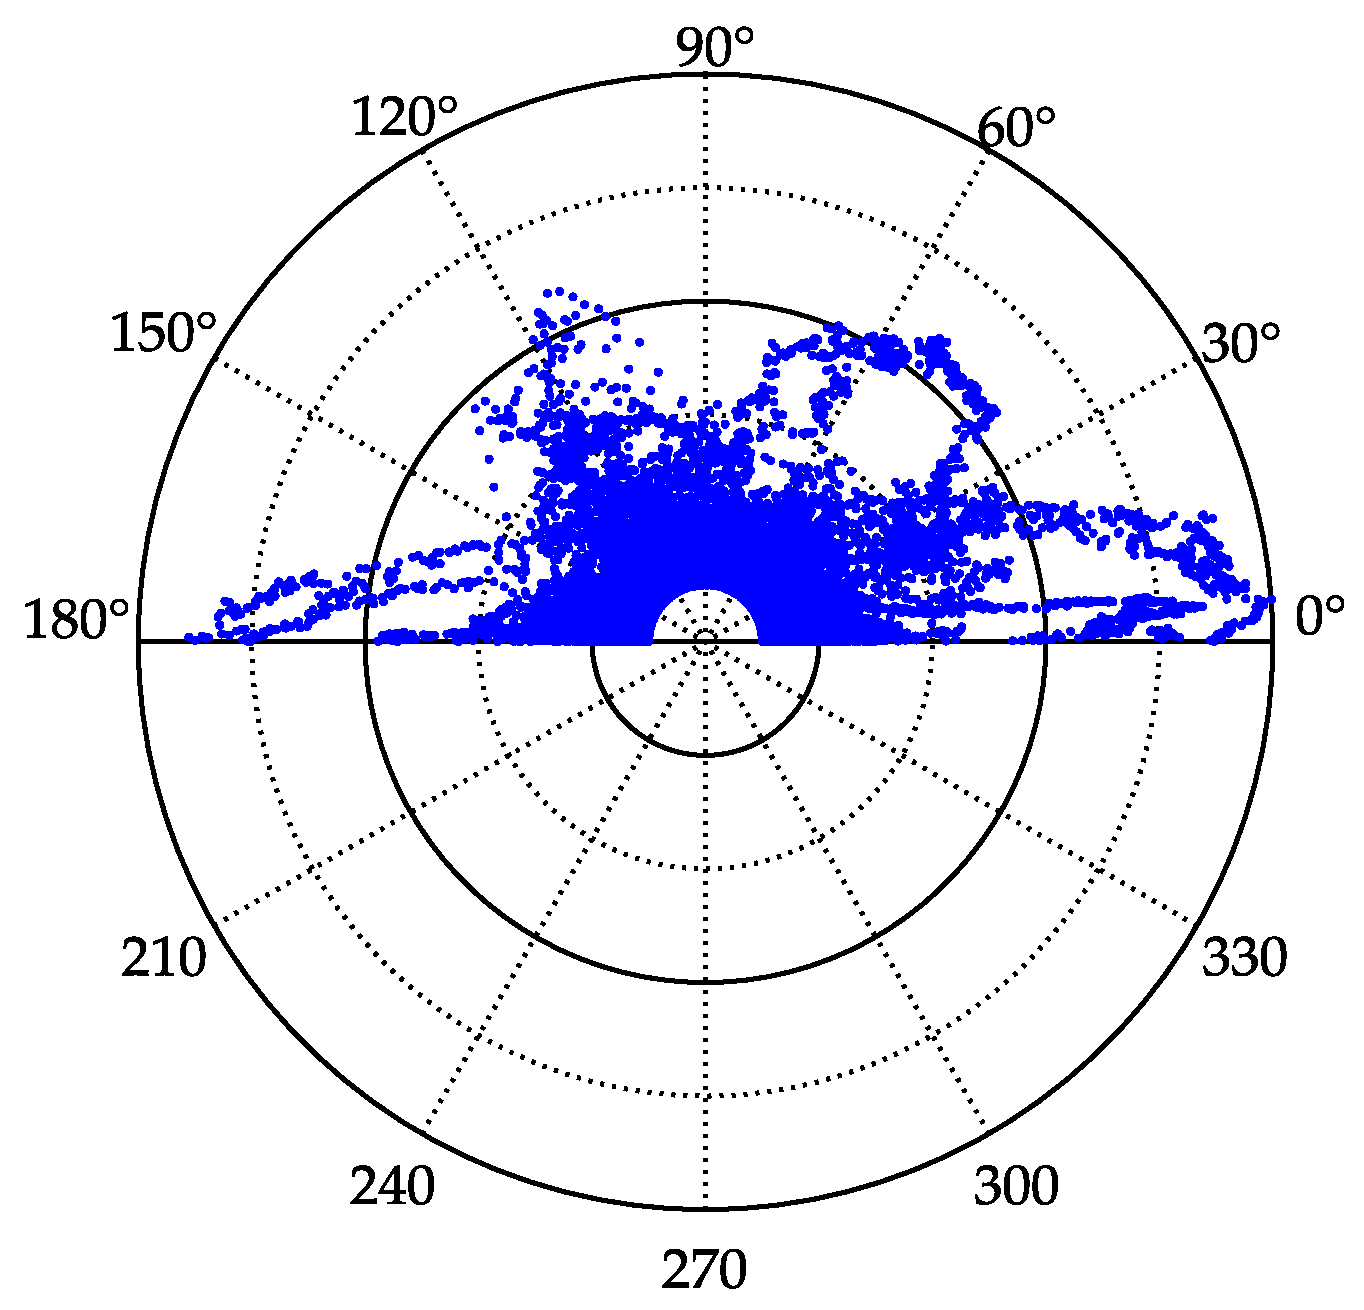
Figure 3a shows one frame signal in time domain as well as its scatter diagram in two-dimensional space. The x-axis is the amplitude of X1 and the y-axis is the amplitude of X2 in scatter diagram. Figure 3b shows one frame sparse domain signal where the x-axis of scatter diagram is the real part of X1’ converted from X1 by FFT, the y-axis of scatter diagram is the real part of X2’ converted from X2 by FFT.
As shown in Figure 3, the mixed signals become sparse after being transformed to frequency domain. Since the discrete Fourier transform has conjugated symmetry, the real part of X1’ and X2’ is symmetrical and half of the frequency signal can be abandoned in practical application. Moreover, there are roughly two directions in the sparse signal, preliminarily showing that X1’ and X2’ have two source signals.
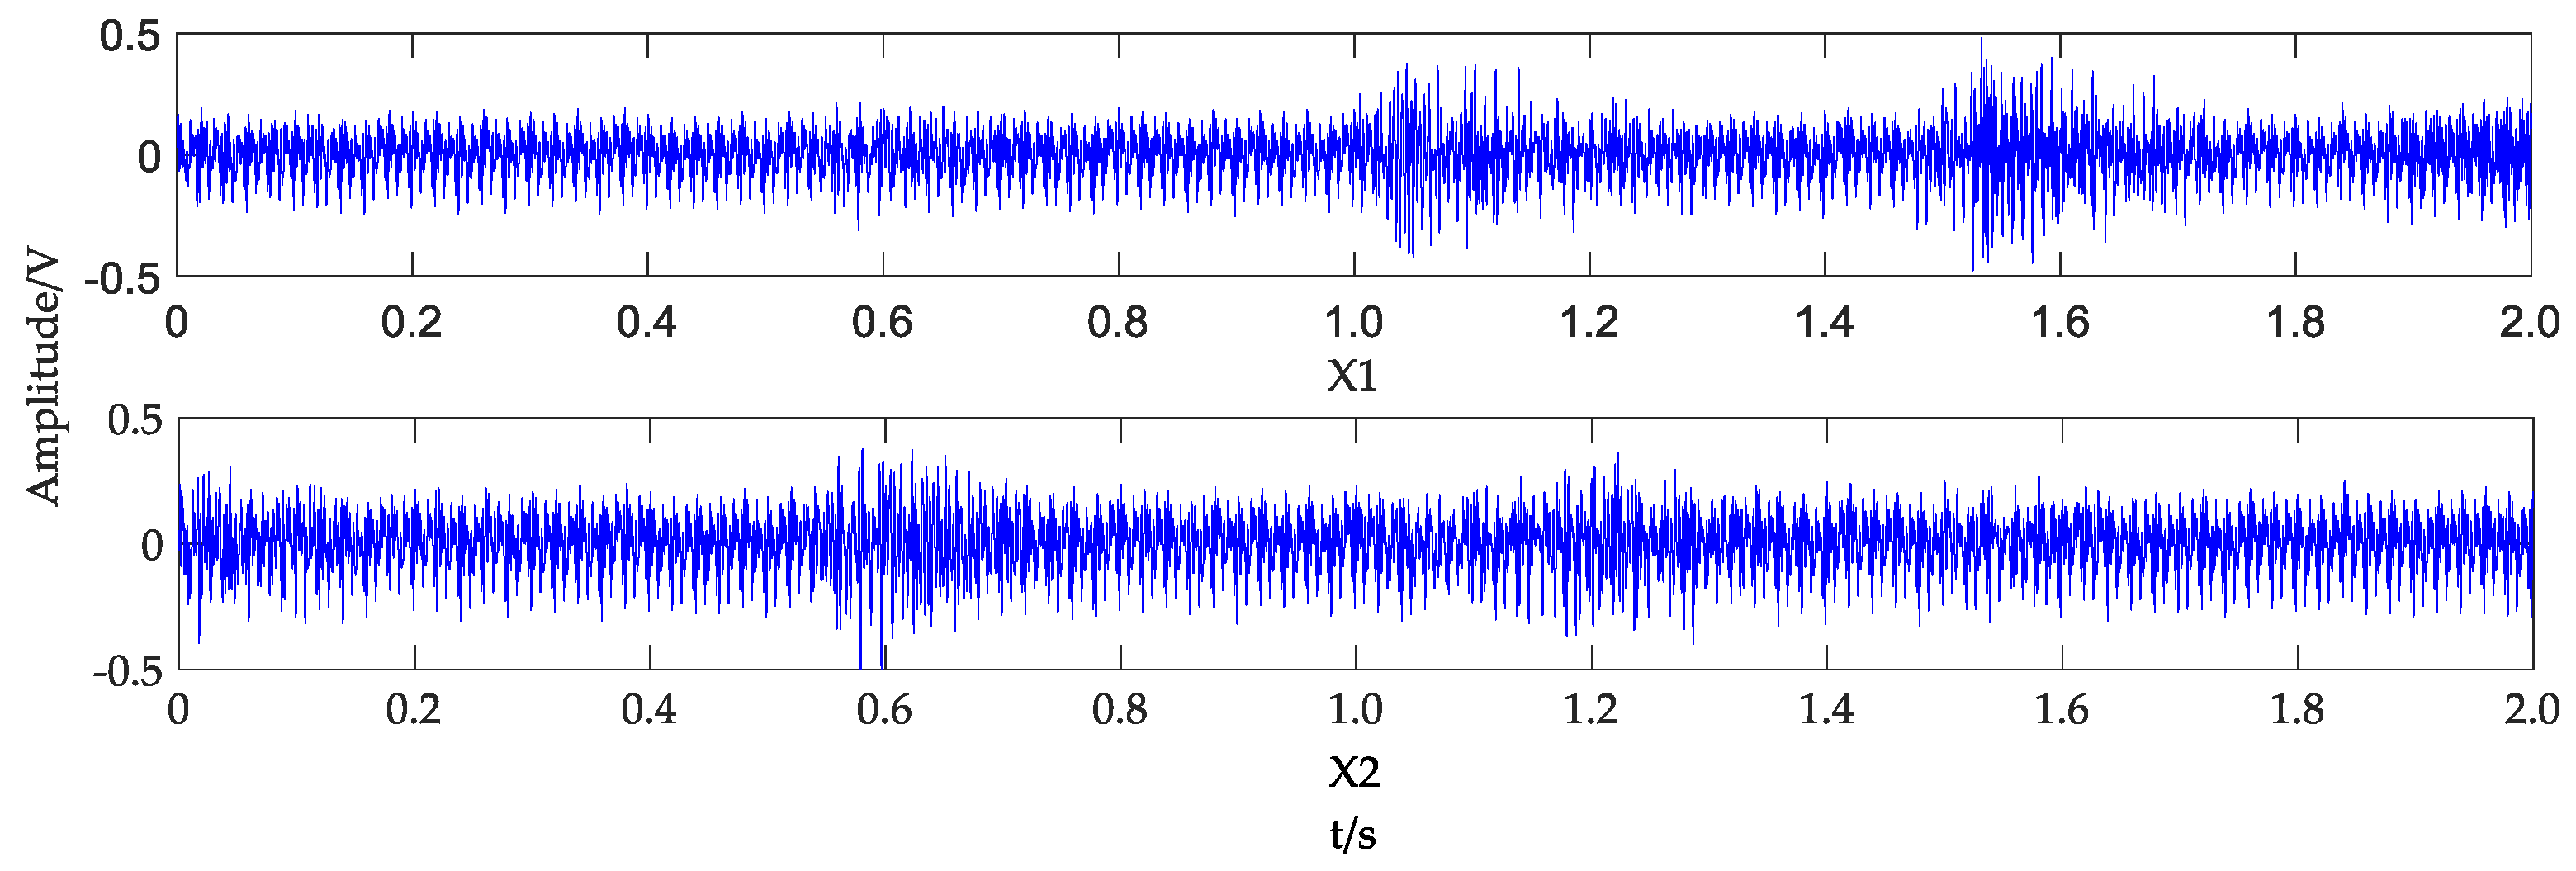
4.2. The Extraction of Normal Signal
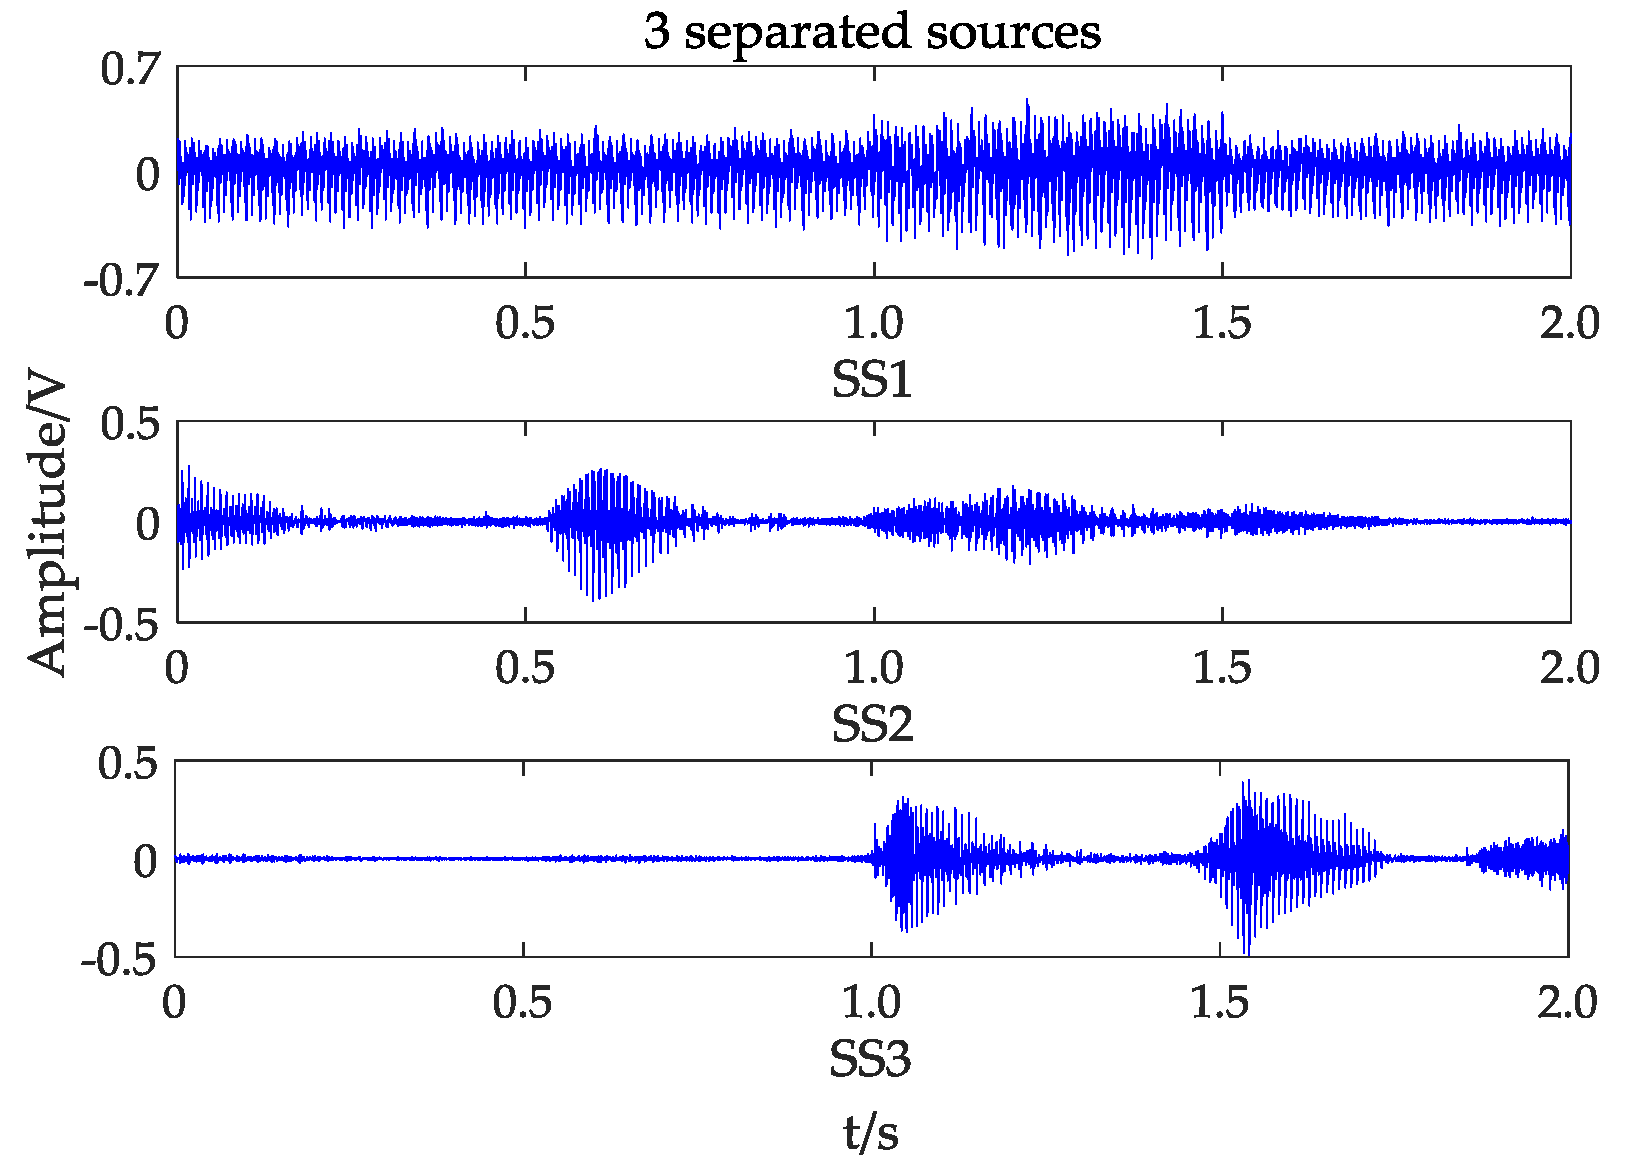
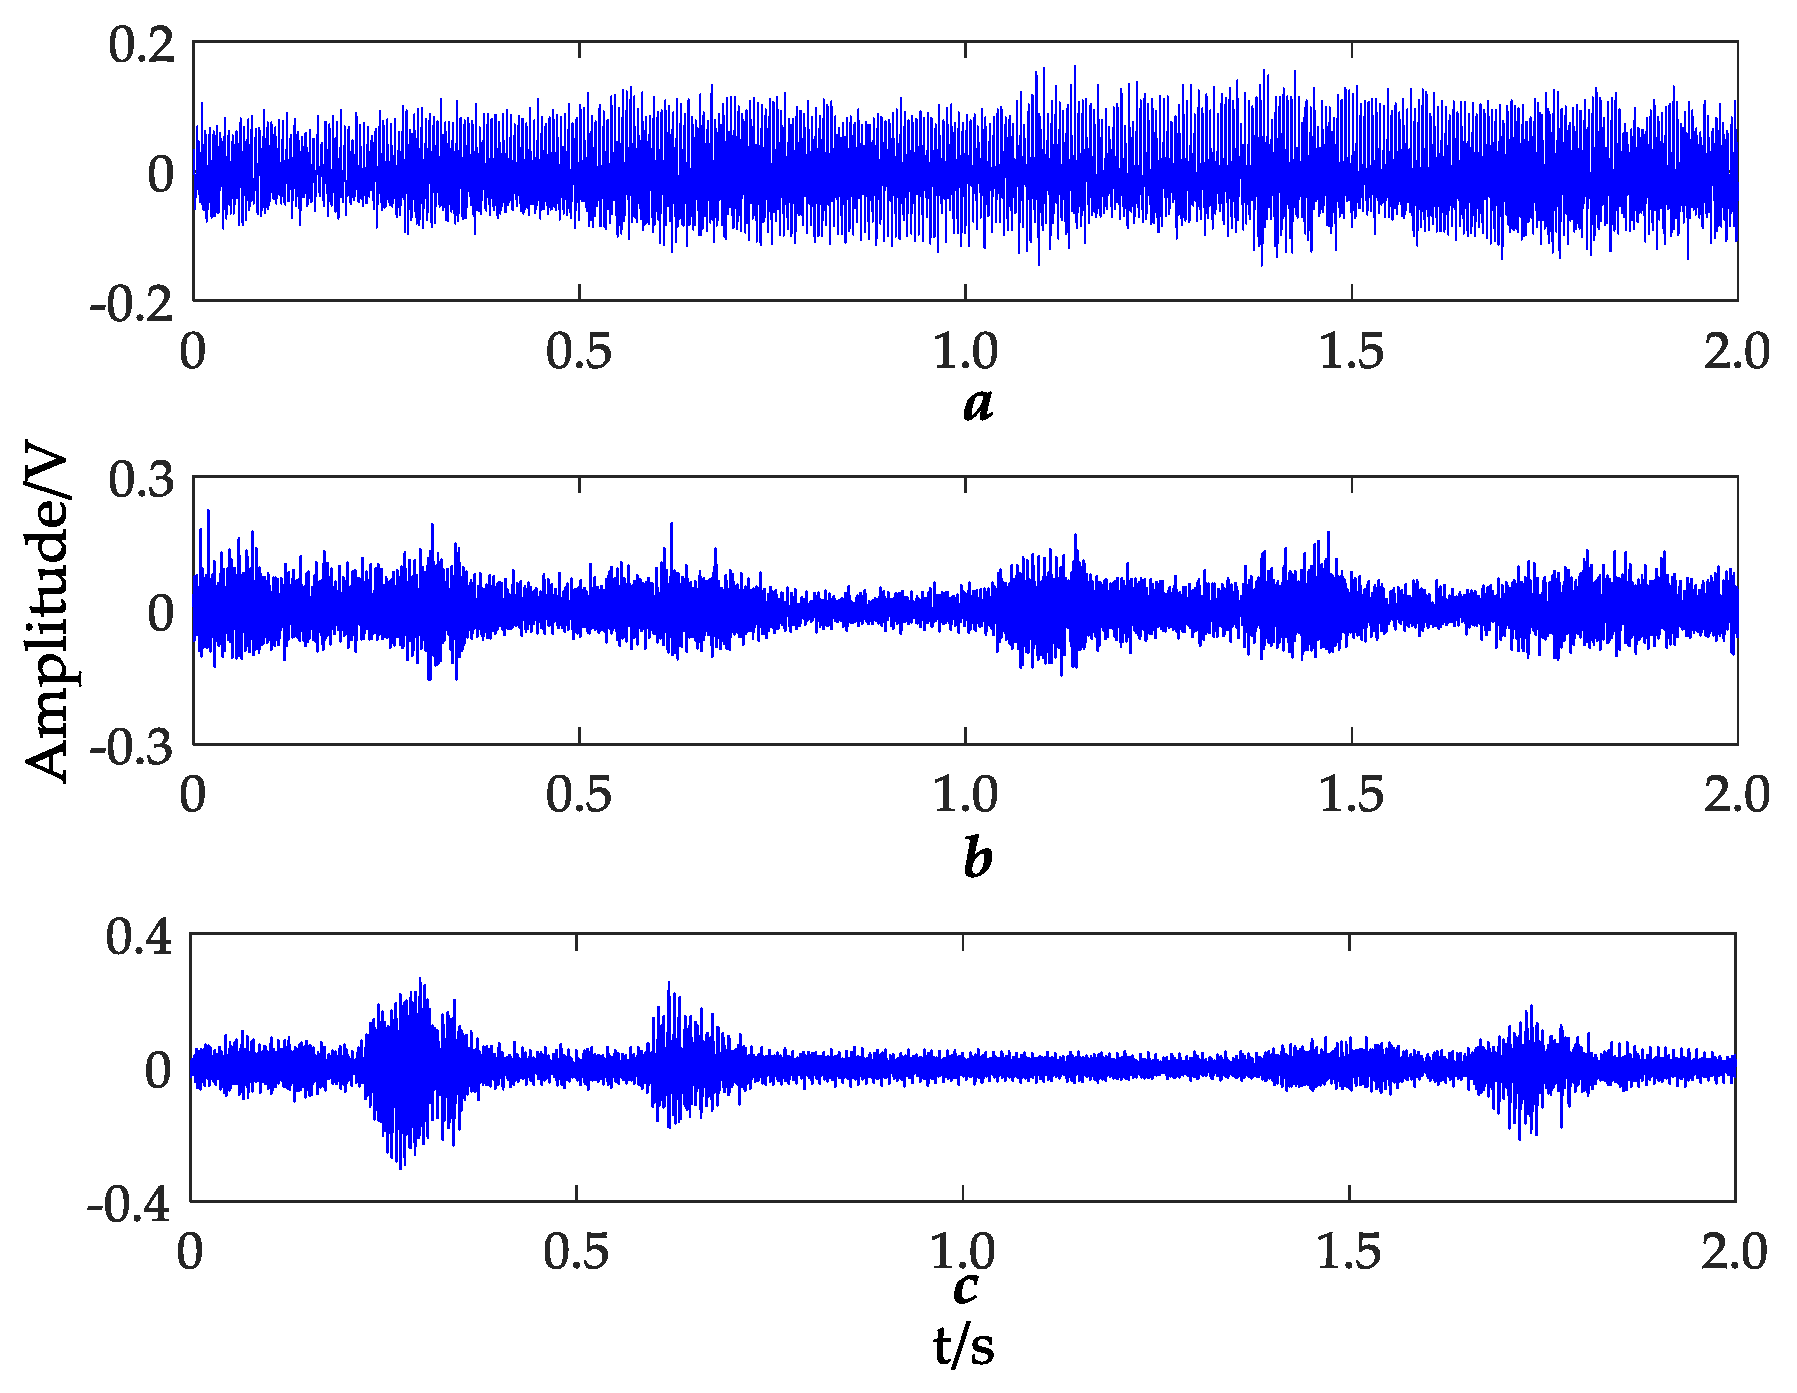
Two signals X1, X2 mixed of S1, S2, S3 represent two observed sound signals acquired from sensors in a substation shown in Figure 4. As shown in Figure 5, the scatter plot of polar coordinates is symmetrical, thus only the upper part needs to be pointed out. Some data near the origin point are ignored in order to increase the calculating speed, as long as the accuracy is guaranteed. According to Equation (5), the potential function value from 0° to 180° can be calculated to draw the potential function curve shown in Figure 6. Then, three source signals are separated out from the mixed signal on the basis of local maximums in the potential function curve. The angles of three source signals are θ1, θ2, θ3 in Figure 6, corresponding to θ1, θ2, θ3 in Figure 5. Furthermore, local maximum values are numbered from large to small as SS1, SS2, SS3. As shown in Figure 7, the order of three separated signals corresponds to the order of local maximum values in Figure 6. Three separated signals, in turn, are transformer vibro-acoustic signal SS1, voice signal SS2, voice signal SS3.
The results indicate that the number of source signals can be adaptively determined by the algorithm. In the potential function curve, local maximums and source signals are one-to-one correspondence. In addition, for the algorithm based on improved potential function, transformer vibro-acoustic signal is ranked first in the separation signals. Hence, only the first separation signal is needed to extract the transformer vibro-acoustic signal.
4.3. The Extraction of Abnormal Signals
- (1)
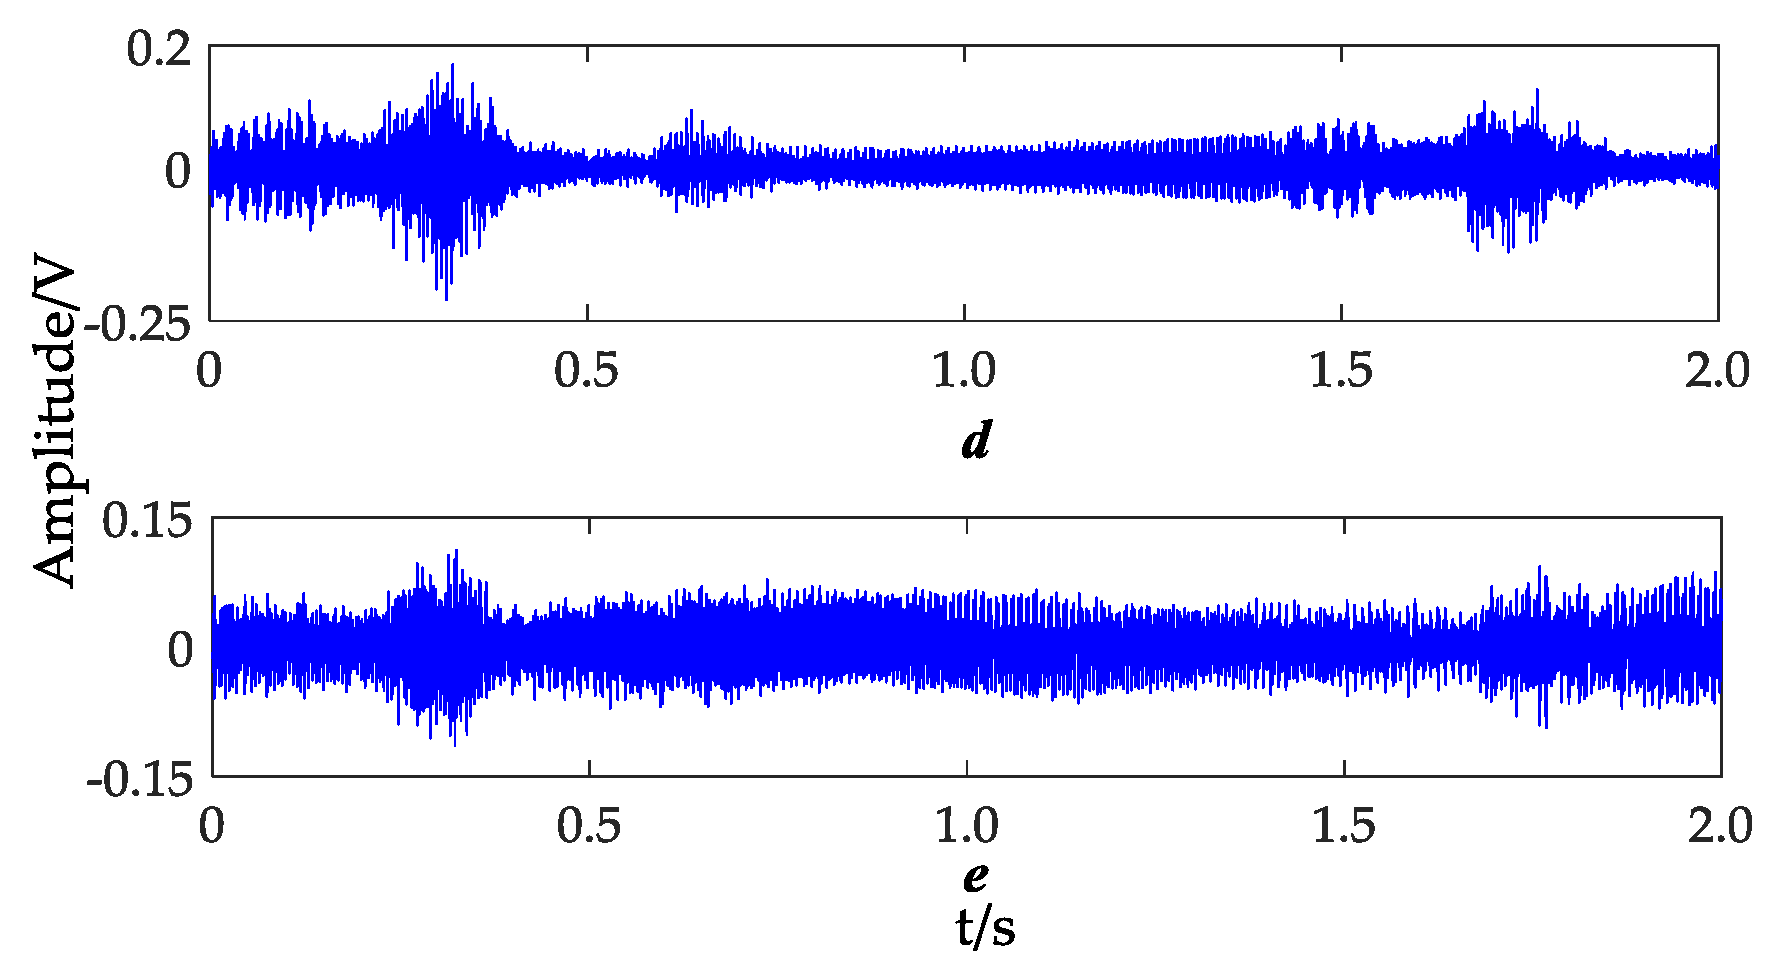
- Increasing of amplitude. Simulation was carried out by increasing the amplitude of the signal by 1.5 times from 1 s to 1.5 s. Three source signals and three separated signals are shown in Figure 8 and Figure 9, respectively. The results indicate that the algorithm extracts well the transformer vibro-acoustic signal when the amplitude of vibro-acoustic signal is increased.
- (2)
- Changing of frequency. The transformer vibro-acoustic signal whose fundamental frequency is 100 Hz usually contains an integral multiple of harmonic waves in the normal situation. However, when the transformer is out of order, the transformer vibro-acoustic signal may contain harmonic wave of 50 Hz and its integral multiples. In this case, simulation was carried out by adding harmonic components of 50 Hz and 150 Hz to the signal from 1 s to 1.5 s. Three source signals and three separated signals are shown in Figure 10 and Figure 11, respectively. The results also indicate that the algorithm well extracted the transformer vibro-acoustic signal when the frequency of vibro-acoustic signal was changed.
4.4. Evaluation of Separation Effect
Noticing that the extraction effect is one of the most important indicator to verify the vibro-acoustic signal adaptive extraction algorithm applying in the transformer fault early warning, two evaluation methodologies satisfying the mutual authentication were put forward to evaluate the separation effect of the algorithm in different cases. First one is the correlation coefficient R, defined as:
where cov(·) is the variance; ssi is the ith separation signal; sj is the jth source signal. The closer R is to 1, the closer the separation signal is to the source signal.
The other one is the quadratic residual (VQM), defined as:
where r = E[yi(t)si(t)]/E[si(t)2]; ssi is the ith separation signal; sj is the jth source signal; E is expectation. If VQM is less than −23, meaning that the separation effect is good.
The separation effect data of the above two evaluation methods in different situations is detailed in Table 1. All of the correlation coefficients between the separated signals and the original source signals are more than 0.98, and the quadratic residuals are less than −32 dB, prove that the algorithm well extracted the transformer vibro-acoustic signal in different simulated situations. Reference [12] compared the fast independent component analysis (Fast ICA) algorithm with the Joint Approximate Diagonalization of Eigenmatrices (JADE) algorithm, the results show that by the JADE algorithm, the similar coefficients between the separated signals and the original source signals are all above 0.9, far greater than that by Fast ICA algorithm. But the correlation coefficients between the separated signals and the original source signals in this paper are all above 0.98 under three different situations, which proves the validity and accuracy of the SCA algorithm based on potential function.
4.5. Detection
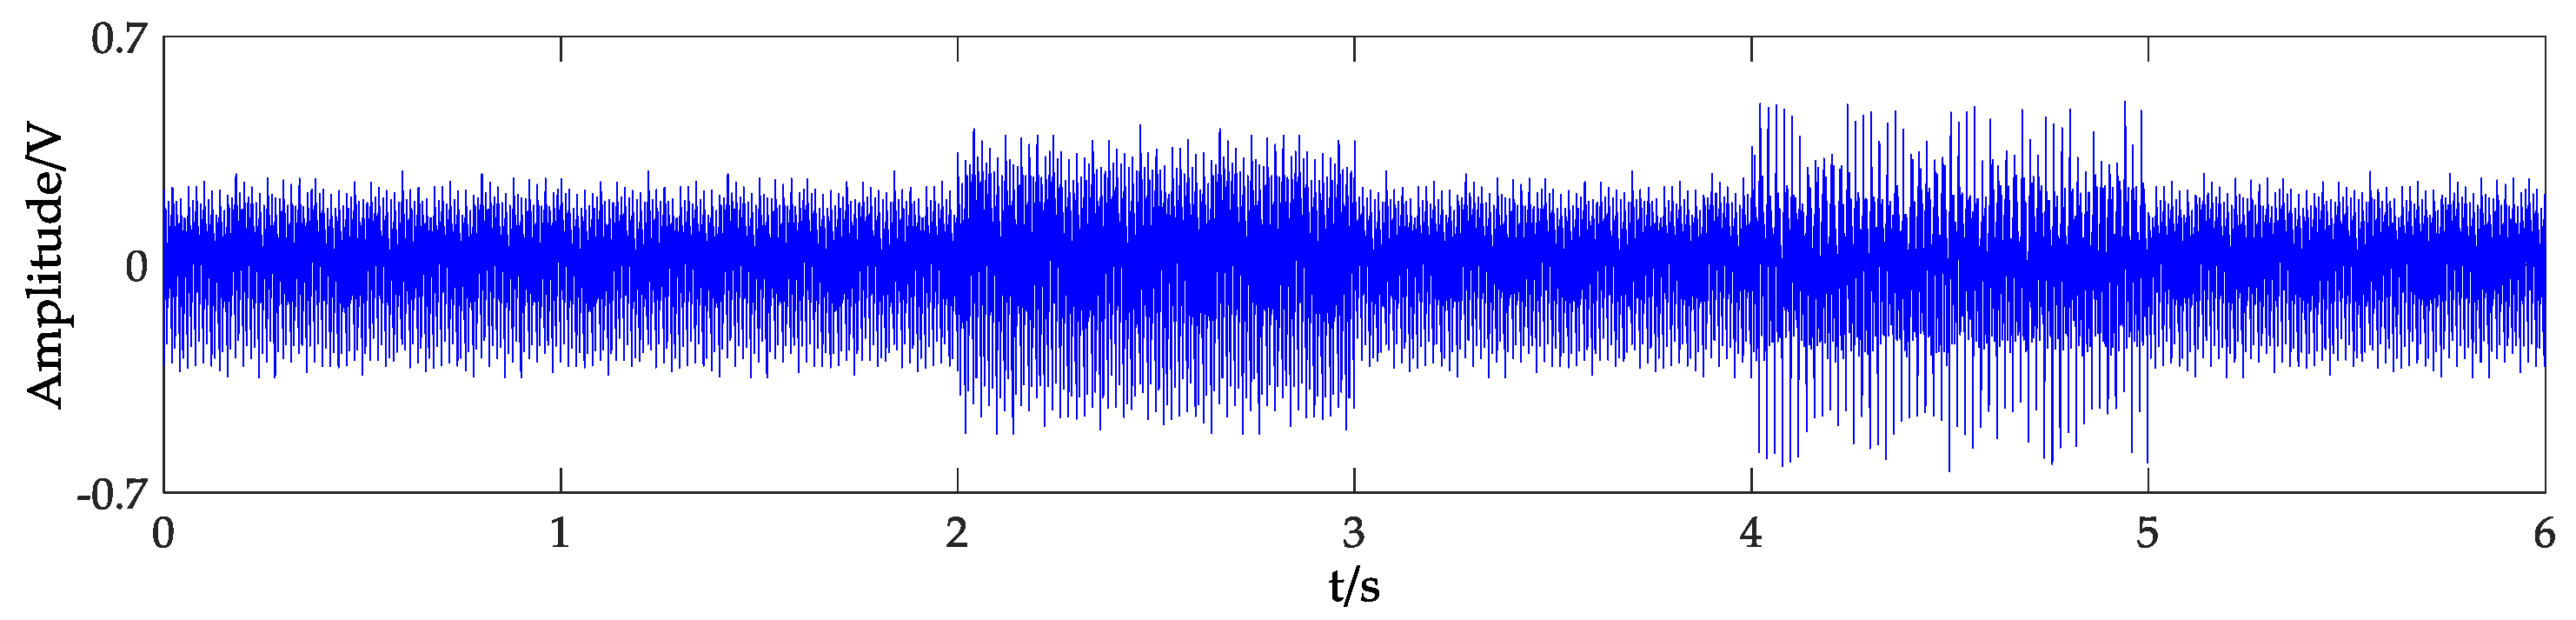
As shown in Figure 12, the abnormal states were simulated by increasing the amplitude of signal by 1.5 times from 2 s to 3 s and adding harmonic components of 50 Hz and 150 Hz to the signal from 4 s to 5 s.
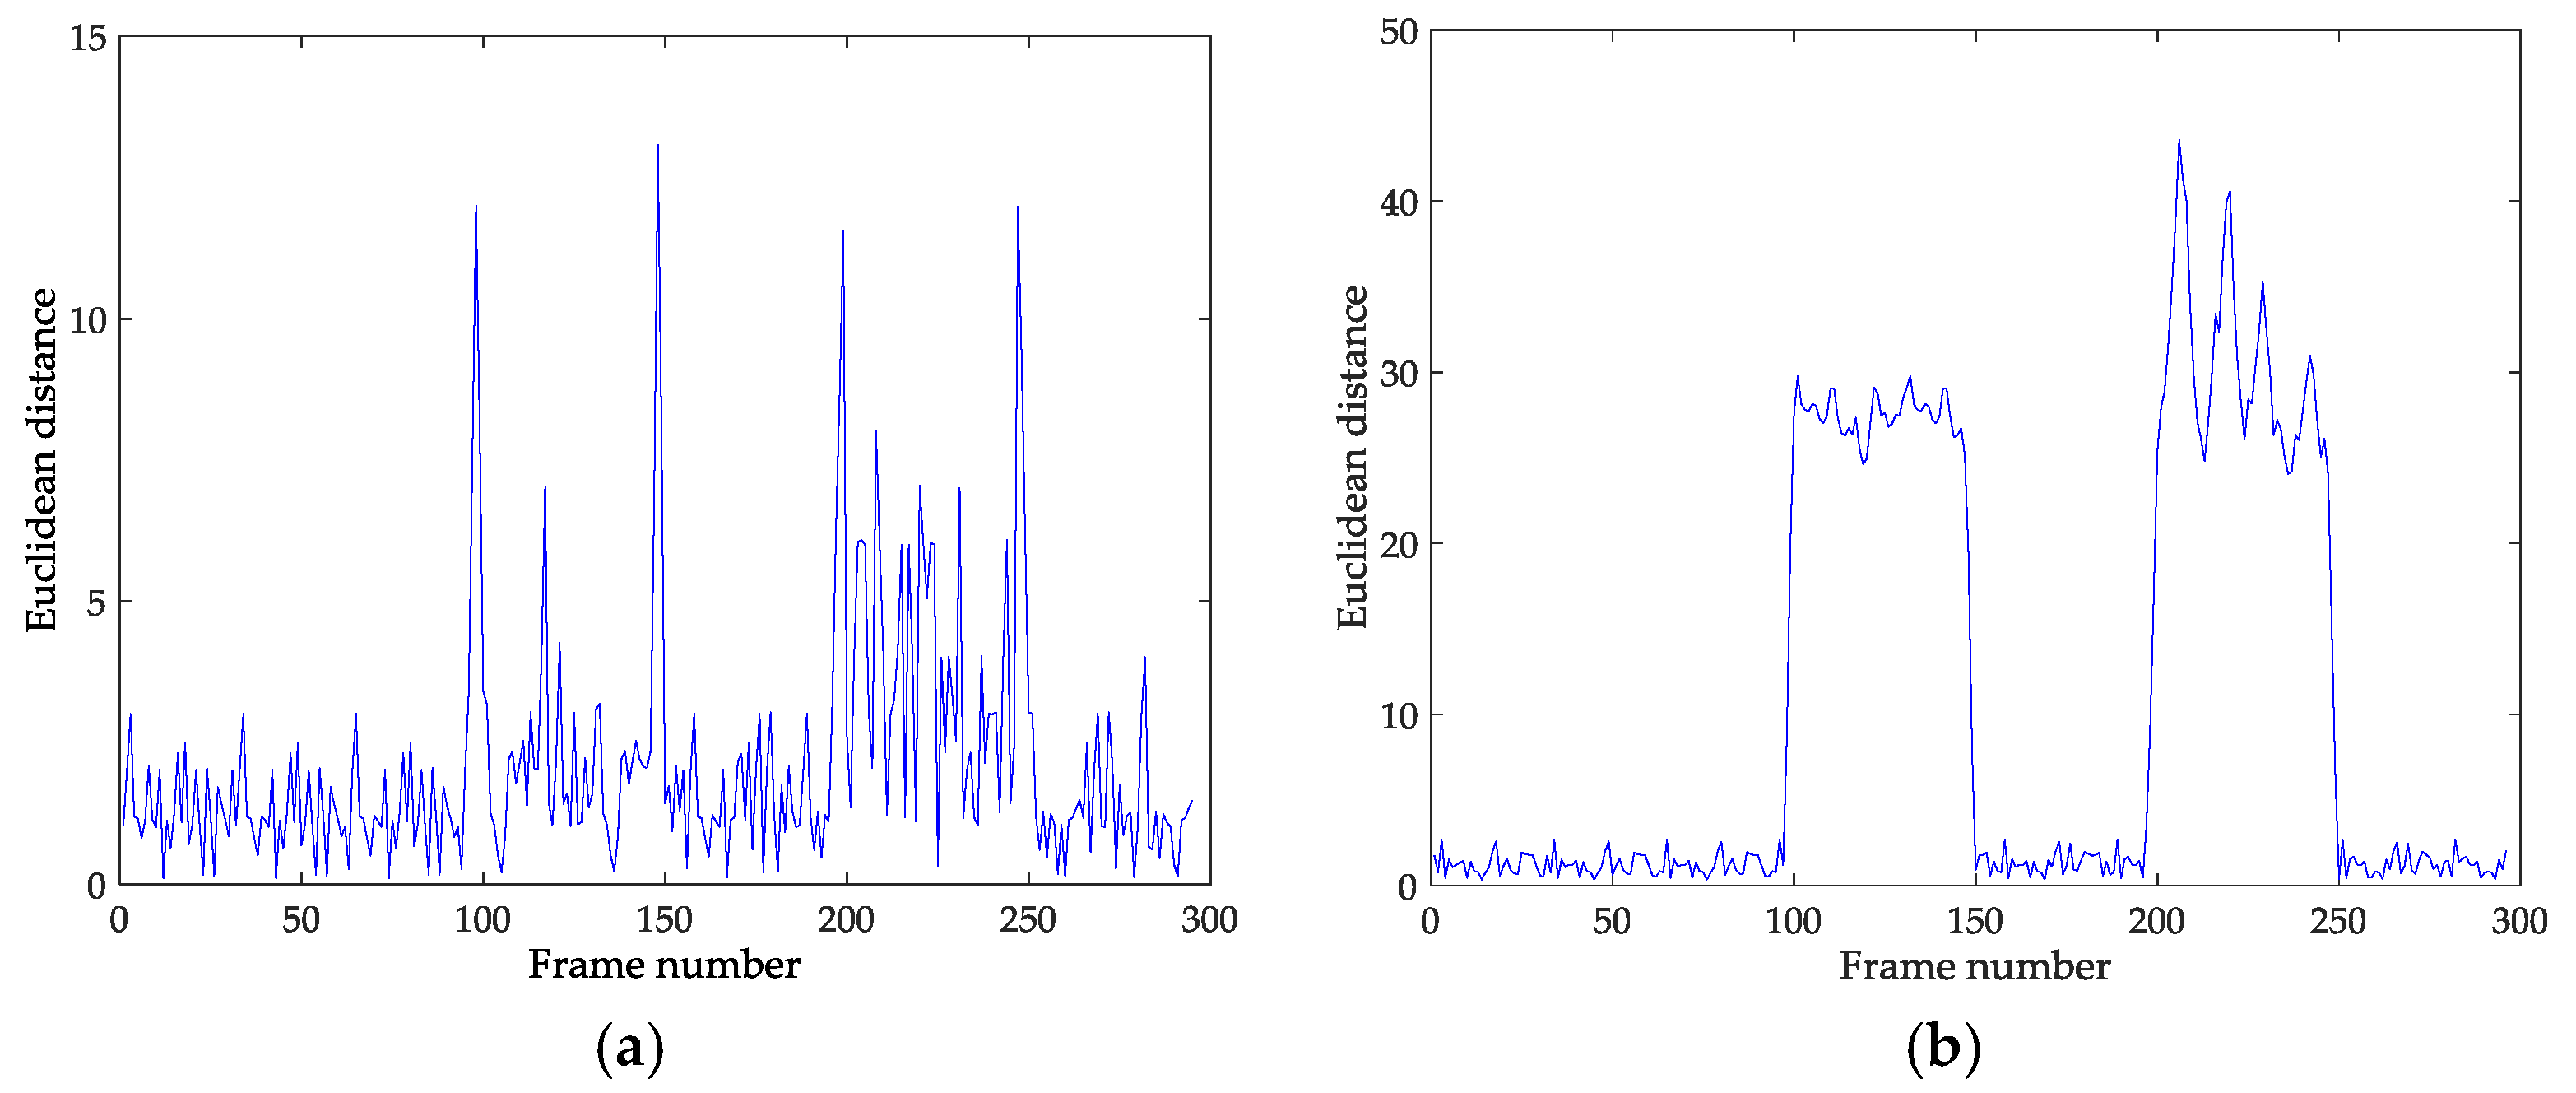
While the sampling frequency fs was 10,000 Hz, the frame length N was 1000, the frame shift l was 200, the correspondence between time t and frame number n is t = nl/fs.
Euclidean distance between adjacent eigenvectors is shown in Figure 13a. The Euclidean distance suddenly becomes bigger than 10 at 2 s, 3 s, 4 s, 5 s, which indicates the starting and ending times of the abnormal states. This method based on adjacent thresholds can monitor the operation status of the transformer without comparison with the normal signal.
Deviation of eigenvectors is shown in Figure 13b. The large fluctuations occurred in 2–3 s and 4–5 s, which illustrate the whole process of transformer abnormal states. This method needs to compare with the pure vibro-acoustic signal of the normally operated transformer, but more detailed information about the abnormal states can be obtained.
4.6. Results Discussion
- (1)
- The transformer vibro-acoustic signal is well extracted by the algorithm under three different conditions, including running normally, increase of amplitude and change of frequency component. In addition, all of the correlation coefficients between the separated signals and the original source signals were more than 0.98, and the quadratic residuals were less than −32 dB.
- (2)
- The abnormal states of the transformer can be effectively detected by the SCA algorithm. Dn and dn both have their own advantages: Dn is faster and more convenient than dn because Dn does not need compare with the pure vibro-acoustic signal which is difficult to obtained; dn can obtain more detailed information about the abnormal states once the pure vibro-acoustic signal of the normally operated transformer is obtained.
5. Experimental Analysis
5.1. Experimental Setup
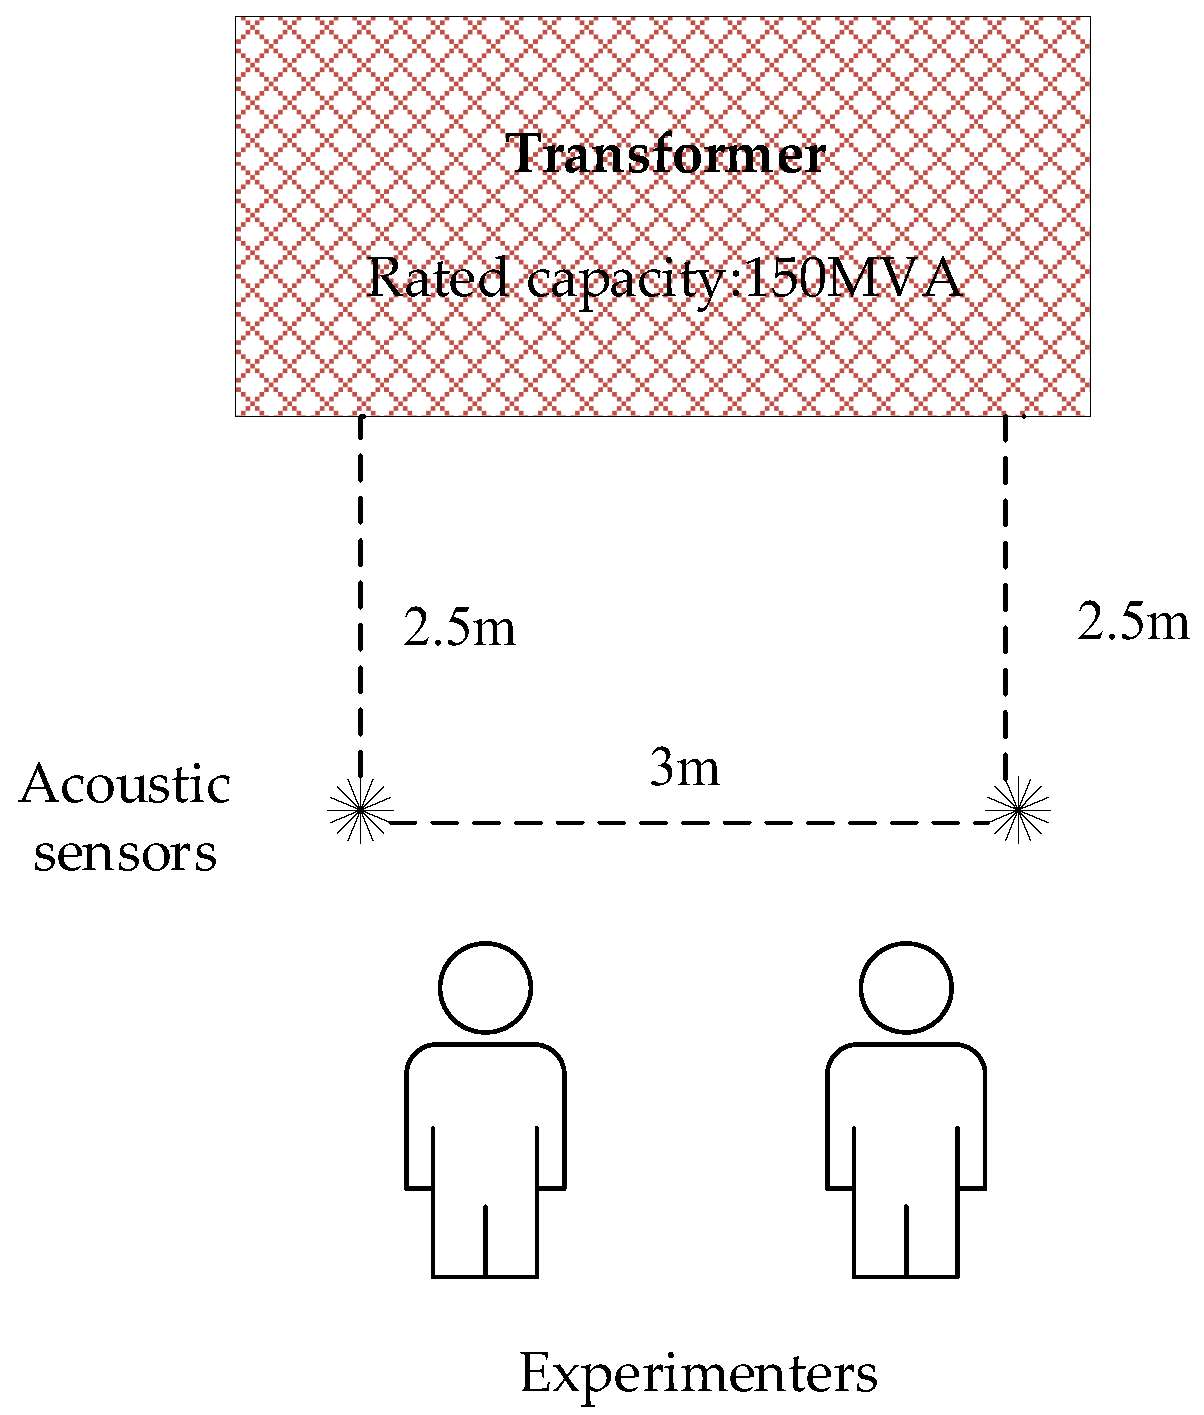
The experiment was conducted in a 220 kV substation near the main transformer whose cold wind fan was not running under the circumstances. Two acoustic sensors were set 2.5 m away from the transformer tank, and the distance between each other was 3 m. Two experimental assistants located on each side of the sensor began talking to each other as soon as the experiment started. The schematic diagram is shown in Figure 14.
The transformer is a 3-phase oil-immersed air-cooled transformer, whose rated capacity is 150 MVA, rated voltage is (230 ± 5 × 0.25%)/121/38.5 kV, rated frequency is 50 HZ. The preamplifier is a model AWA14604 (Hangzhou Aihua Instrument Co., Ltd., Zhejiang, China) while the microphone is an AWA14403 (Hangzhou Aihua Instrument Co., Ltd., Zhejiang, China). The outer diameter of the microphone is 12.7 mm, the nominal sensitivity is 15 mV/Pa, the polarization voltage is 200 V, the frequency range is 20 Hz~40 kHz, the dynamic range is 30~160 dB, the capacitance is 18 pF.
The outer diameter of the preamplifier is 12.7 mm, the frequency response between 10 Hz~20 kHz is ±0.1 dB, the transmission gain is −0.1 dB, the distortion is less than 0.1%, the a-weighted noise floor (20 Hz~20 kHz) is less than 5 μV, the z-weighted noise floor (20 Hz~20 kHz) is less than 7 μV.
5.2. Separation Results
Figure 15 shows the mixed signals in substation. Different from simulation, the direction and quantity of source signals cannot be found with naked eyes as shown in Figure 16 due to a lot of interference mixed in the sound field of experimental environment. Nevertheless, as shown in Figure 17, 5 local extremums were obtained and labeled A to E from large to small after calculating the potential function.
The experimental separated signals are shown in Figure 18. In the experiment, the transformer vibro-acoustic signal had the greatest energy in the vicinity of the sensor, the second was two voice signals from two experimental assistants. Therefore, three local extremums A, B, C can be regarded as separated signals. While D and E are thought to be the jamming signals shown in Figure 19.
5.3. Detection Results
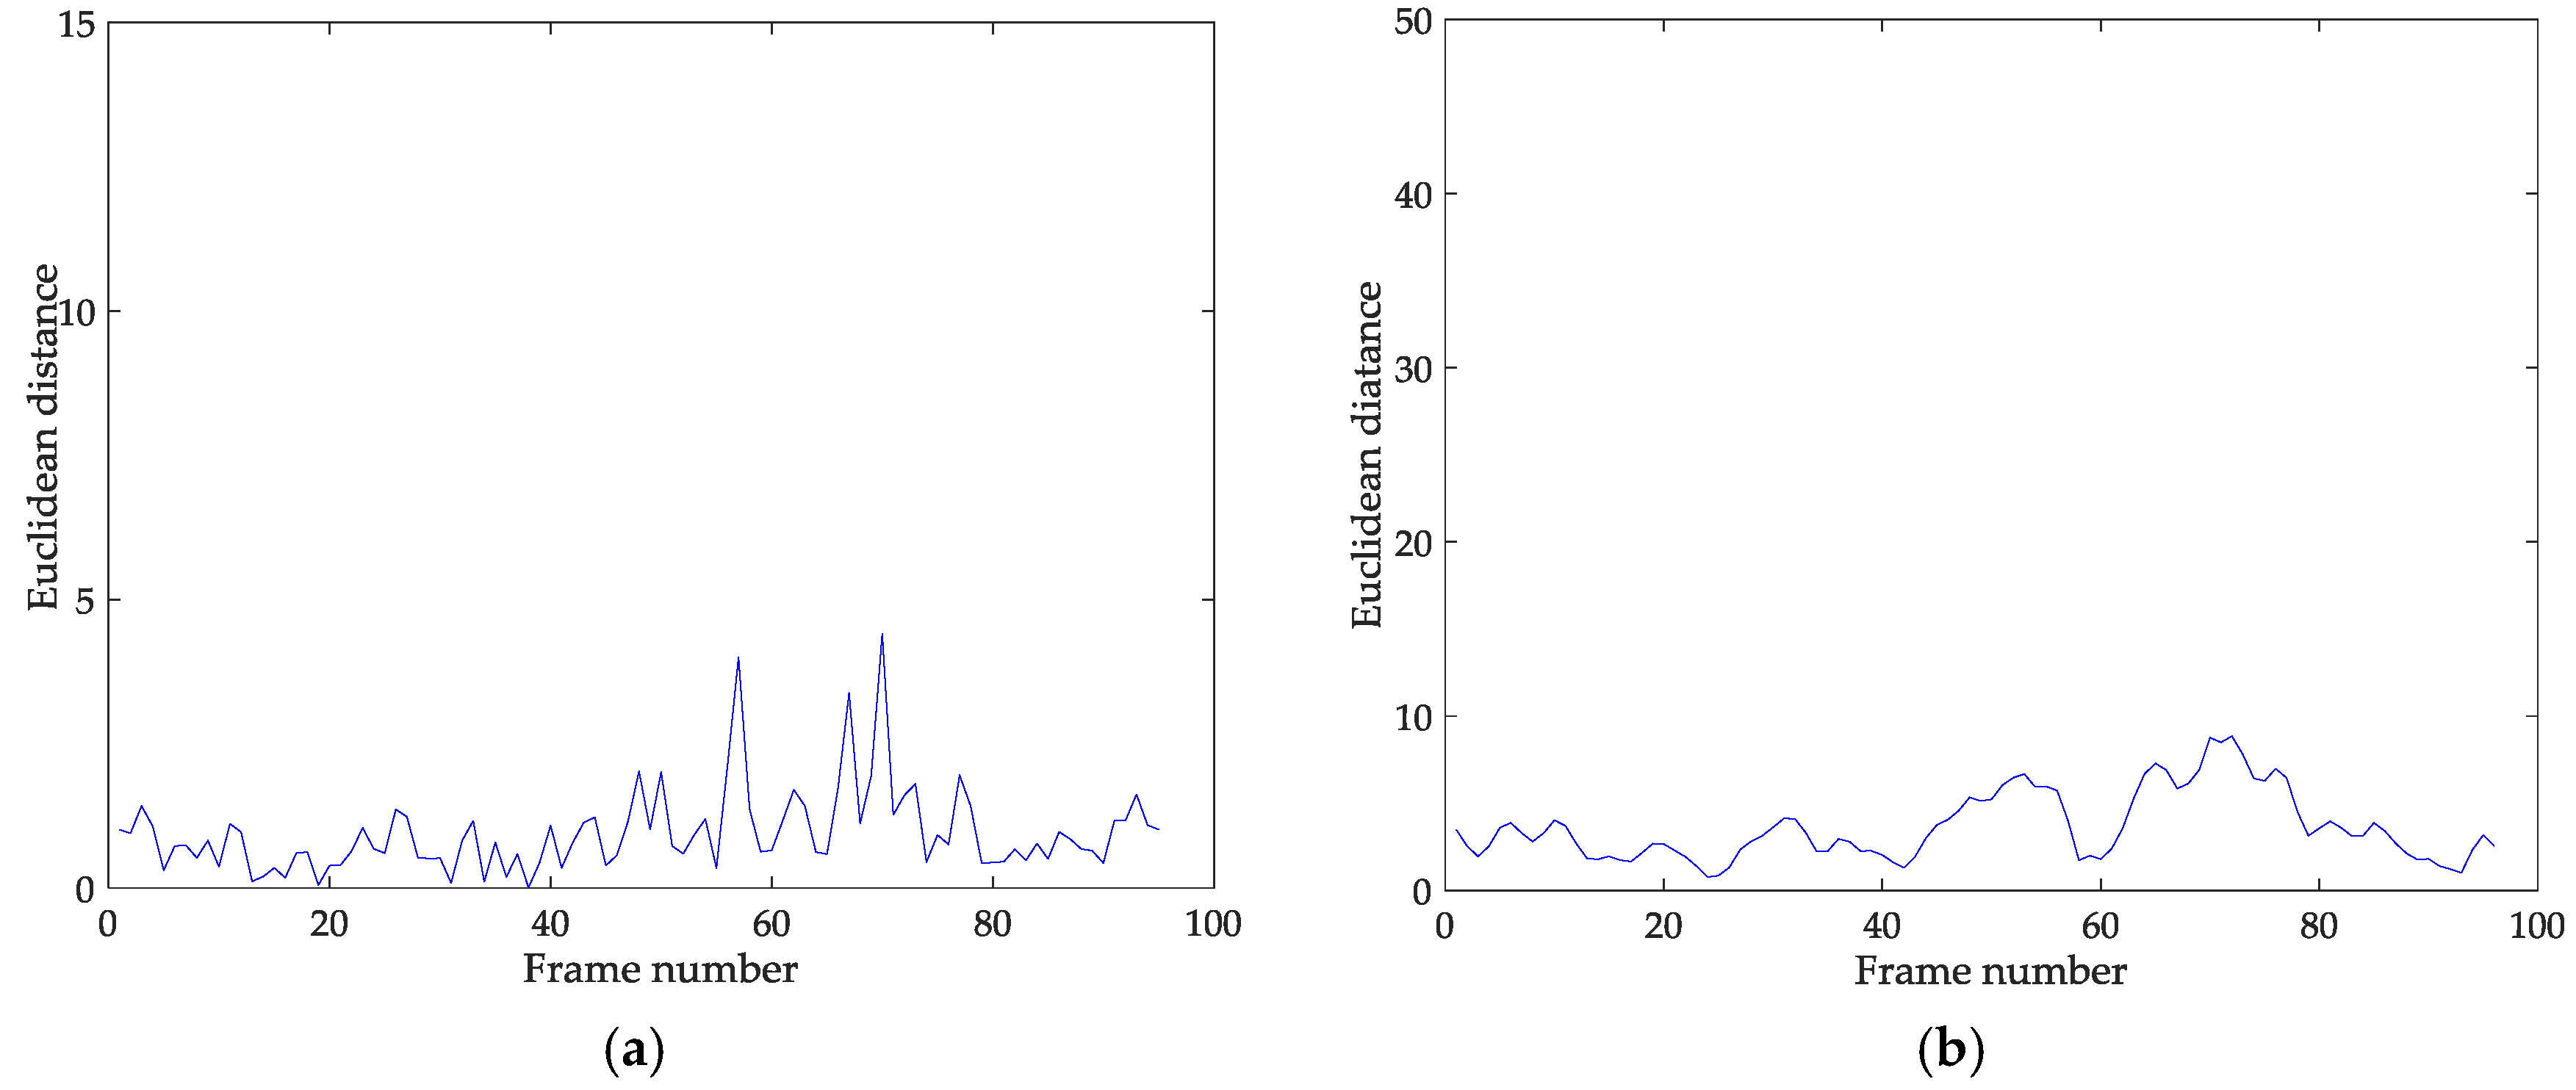
Figure 20a is Euclidean distance between adjacent eigenvectors (experiment). Figure 20b is deviation of eigenvectors (experiment). It can be observed that there are slight fluctuations both in the Euclidean distance and the deviation of eigenvectors. But the operating status of the transformer still can be recognized to be normal because the curves have no suddenly huge fluctuations as above simulation.
5.4. Results Discussion
- (3)
- In observing Figure 5, it appears that the three directions are well extracted, but in observing Figure 16, it is not so evident due to a lot of interference mixed in the sound field of the experimental environment. To be specific, the sound of the wind, the reflection of the substation buildings walls and transformer tanks, etc. Although the sound environment has certainly a great influence on signal separation, the largest local maximum A in Figure 17 is obvious after calculating the potential function. That is to say, the extraction of the transformer vibro-acoustic signal is not affected by the interference. The method is adapted to the sound environment.
- (4)
- As shown in Figure 17, D and E are located between A and C. Although they are thought to be local maximum points at first, their forms are not independent compared with A, B, C. Considering the overall trend of the potential function curve, local extremums of A, B, C are more reasonable and realistic, while signals in Figure 19 are quite different from the expected source signals in the experiment. Besides, interference signals waveform of D and E are similar to that of point C. Considering that separated signal of C has the maximum value, signals of D and E are thought to be the reflections of the buildings walls in the substation on the signal of C.
- (5)
- Separation signals of point A with maximum local maximum value is thought to be the transformer vibro-acoustic signal according to its characteristics. However, the actual transformer operation vibration signal is more stable than the separation signal. The differences appear because the sensors are too close to the transformer. To be specific, the transformer is a body source, there would be subtle differences between two sensors which are 3 m apart. It is these subtle differences that result in the instability of the amplitude of the separated signals. That is why there are slight fluctuations both in the Euclidean distance and the deviation of eigenvectors.
6. Conclusions
In this paper, the BBS algorithm is applied to the adaptive extraction of transformer vibro-acoustic signals to solve the problem that the collection of the transformer vibro-acoustic signals is easily disturbed. Besides, a preliminary method of abnormal states detection based on transformer vibro-acoustic signals is presented to determine whether the transformer is in abnormal state. The feasibility of the above algorithm has been validated by simulation and experiment with conclusions as followed:
- (1)
- In the simulation, the source signals are correspondingly processed for the various situations that may arise in the substation. The transformer vibro-acoustic signal is always ranked first and the algorithm is effective when the amplitude or frequency of the vibration sound changes. That is to say, the blur rank problem of BSS is solved and the adaptive separation of transformer vibro-acoustic signals is realized.
- (2)
- The correlation coefficient and the quadratic residual are used to evaluate the transformer vibro-acoustic signal extracted from simulation and experiments. All correlation coefficient values are above 0.98 and all quadratic residual values are below −32 dB, proving that separation effect is good. In addition, the detection algorithm successfully identified the abnormal states by the changes of Euclidean distance between adjacent eigenvectors and the deviation of eigenvectors when the amplitude and frequency of the vibro-acoustic signal was changed.
- (3)
- In the experiment, the first separated signal is thought to be the transformer vibro-acoustic signal, however, with no pure transformer vibro-acoustic signal source signal for comparison, this still needs to be further investigated to evaluate the effect of sound extraction in the experimental site. In addition, the transformer is a body source, thus there would be subtle differences between two sensors that were set apart. For this reason, the separated sound signal is not stable, meanwhile, the curves of Euclidean distance between adjacent eigenvectors and the deviation of eigenvectors have sustained slight fluctuations.
- (4)
- Both the simulation and experiment show that the abnormal states of the transformer can be detected effectively by the algorithm. However, the abnormal states of the transformer are not equal to the transformer faults, but just a subset. The relationship between transformer faults and vibro-acoustic signals has yet to be studied thoroughly. As a result, specific faults cannot be distinguished by this kind of detection method. The next step in our research is to focus on specific fault identification and diagnosis after accumulating enough experimental data.
Author Contributions
Liang Zou and Yongkang Guo designed the algorithm, performed the data analysis, and prepared the manuscript. Li Zhang and Han Liu assisted the project and managed to obtain the substation acoustical signals. Tong Zhao led the project and research. All authors discussed the results and approved the publication.
Conflicts of Interest
The authors declare no conflict of interest.
References
- Godina, R.; Rodrigues, E.M.; Matias, J.C.; Catalão, J.P. Effect of loads and other key factors on oil-transformer ageing: Sustainability benefits and challenges. Energies 2015, 8, 12147–12186. [Google Scholar] [CrossRef]
- Wang, C.; Wu, J.; Wang, J.; Zhao, W. Reliability analysis and overload capability assessment of oil-immersed power transformers. Energies 2016, 9, 43. [Google Scholar] [CrossRef]
- Wang, F.H.; Duan, R.C.; Geng, C. Research of vibration characteristics of power transformer winding based on magnetic-mechanical coupling field Theory. Proc. CSEE 2016, 36, 2555–2562. [Google Scholar]
- Zhang, L.; Wang, G.Z.; Dong, P.T. Study on the vibration of grain-oriented transformer core based on the magneto-strictive intrinsic characteristics. Proc. CSEE 2016, 36, 3990–4000. [Google Scholar]
- Wang, M. Winding Movement and Condition Monitoring of Power Transformers in Service; University of British Columbia: Vancouver, BC, Canada, 2003. [Google Scholar]
- Ji, S.; Zhang, F.; Qian, G. Characteristics and influence factors of winding axial vibration of power transformer in steady-state operation condition. High Volt. Eng. 2016. [Google Scholar] [CrossRef]
- Meigen, C.; Juan, M.; Haishu, M. Correlation analysis and prediction method on structure vibration and noise caused by transformer in underground substation. Proc. CSEE 2014, 34, 5998–6005. [Google Scholar]
- Sun, X.; He, W.; Zhan, J. Current status and development of test and diagnostic technique of transformer winding deformation. High Volt. Eng. 2016, 42, 1207–1220. [Google Scholar]
- Hashemnia, N.; Abu-Siada, A.; Islam, S. Detection of power transformer bushing faults and oil degradation using frequency response analysis. IEEE Trans. Dielectr. Electr. Insul. 2016, 23, 222–229. [Google Scholar] [CrossRef]
- Yang, Q.; Su, P.; Chen, Y. Comparison of Impulse Wave and Sweep Frequency Response Analysis Methods for Diagnosis of Transformer Winding Faults. Energies 2017, 10, 431. [Google Scholar] [CrossRef]
- Sun, C.; Ohodnicki, P.R.; Stewart, E.M. Chemical Sensing Strategies for Real-Time Monitoring of Transformer Oil: A Review. IEEE Sens. J. 2017, 17, 5786–5806. [Google Scholar] [CrossRef]
- Zhang, K.; Tian, G.; Lan, T. Blind source separation based on JADE algorithm and application. In Proceedings of the International Conference on Mechatronics, Robotics and Automation, Beijing, China, 2–5 August 2015. [Google Scholar]
- Tenbohlen, S.; Coenen, S.; Djamali, M.; Müller, A.; Samimi, M.H.; Siegel, M. Diagnostic measurements for power transformers. Energies 2016, 9, 347. [Google Scholar] [CrossRef]
- Lee, B.E.; Park, J.W.; Crossley, P.A.; Kang, Y.C. Induced voltages ratio-based algorithm for fault detection, and faulted phase and winding identification of a three-winding power transformer. Energies 2014, 7, 6031–6049. [Google Scholar] [CrossRef]
- Wang, Y.; Eng, B.; Eng, M. Transformer Vibration and Its Application to Condition Monitoring. Ph.D. Thesis, Degree of Philosophy, School of Mechanical and Chemical Engineering, University of Western Australia, Perth, Australia, 2015. [Google Scholar]
- Mollasalehi, E.; Sun, Q.; Wood, D. Contribution of small wind turbine structural vibration to noise emission. Energies 2013, 6, 3669–3691. [Google Scholar] [CrossRef]
- Hsu, C.H.; Lee, C.Y.; Chang, Y.H.; Lin, F.J.; Fu, C.M.; Lin, J.G. Effect of magnetostriction on the core loss, noise, and vibration of fluxgate sensor composed of amorphous materials. IEEE Trans. Magn. 2013, 49, 3862–3865. [Google Scholar] [CrossRef]
- Li, Q.; Wang, X.; Zhang, L.; Lou, J.; Zou, L. Modelling methodology for transformer core vibrations based on the magnetostrictive properties. IET Electr. Power Appl. 2012, 6, 604–610. [Google Scholar] [CrossRef]
- Guerrero, V.; Pontt, J.; Dixon, J.; Rebolledo, M.J. A novel noninvasive failure-detection system for high-power converters based on SCRs. IEEE Trans. Ind. Electr. 2013, 60, 450–458. [Google Scholar] [CrossRef]
- Guo, J.; Ji, S.C.; Shen, Q. Blind source separation technology for the detection of transformer fault based on vibration method. Trans. China Electrotech. Soc. 2012, 10, 68–78. [Google Scholar]
- Du, S.B. Research on Electrical Equipments Fault Detection Based on Audio Feature; Shandong University: Jinan, China, 2014. [Google Scholar]
- Case, J.J. Numerical Analysis of the Vibration and Acoustic Characteristics of Large Power Transformers. Ph.D. Thesis, Queensland University of Technology, Brisbane City, Australia, 2017. [Google Scholar] [CrossRef]
- Kreutzer, M. Modelling of Core Noise from Power Transformers. Master’s Thesis, KTH Royal Institute of Technology, Stockholm, Sweden, 2011. [Google Scholar]
- Yu, Y.; Chen, B. Noise analysis and control of large power transformer. Transformer 2007, 44, 23–26. [Google Scholar]
- Yanada, T.; Minowa, S.; Ichinokura, O.; Kikuchi, S. Design and analysis of noise-reduction transformer based on equivalent circuit. IEEE Trans. Magn. 1998, 34, 1351–1353. [Google Scholar] [CrossRef]
- Bofill, P.; Zibulevsky, M. Underdetermined blind source separation using sparse representations. Signal Proc. 2001, 81, 2353–2362. [Google Scholar] [CrossRef]
- Bofill, P. Underdetermined blind separation of delayed sound sources in the frequency domain. Neurocomputing 2003, 55, 627–641. [Google Scholar] [CrossRef]
- Yilmaz, O.; Rickard, S. Blind separation of speech mixtures via time-frequency masking. IEEE Trans. Signal Proc. 2004, 52, 1830–1847. [Google Scholar] [CrossRef]
- Kolossa, D.; Astudillo, R.F.; Hoffmann, E.; Orglmeister, R. Independent Component Analysis and Time-Frequency Masking for Speech Recognition in Multitalker Conditions. EURASIP J. Audio Speech Music Proc. 2009, 2010, 651420. [Google Scholar] [CrossRef]
Figure 1.
Flow chart of the improved part of SCA.

Figure 2.
Three source signals of simulation.

Figure 3.
Mixed signals and scatter plot of time domain and frequency domain; (a) time domain; (b) frequency domain.
Figure 3.
Mixed signals and scatter plot of time domain and frequency domain; (a) time domain; (b) frequency domain.

Figure 4.
Two mixed signals of simulation.

Figure 5.
Scatter plot of frequency domain in polar coordinates.
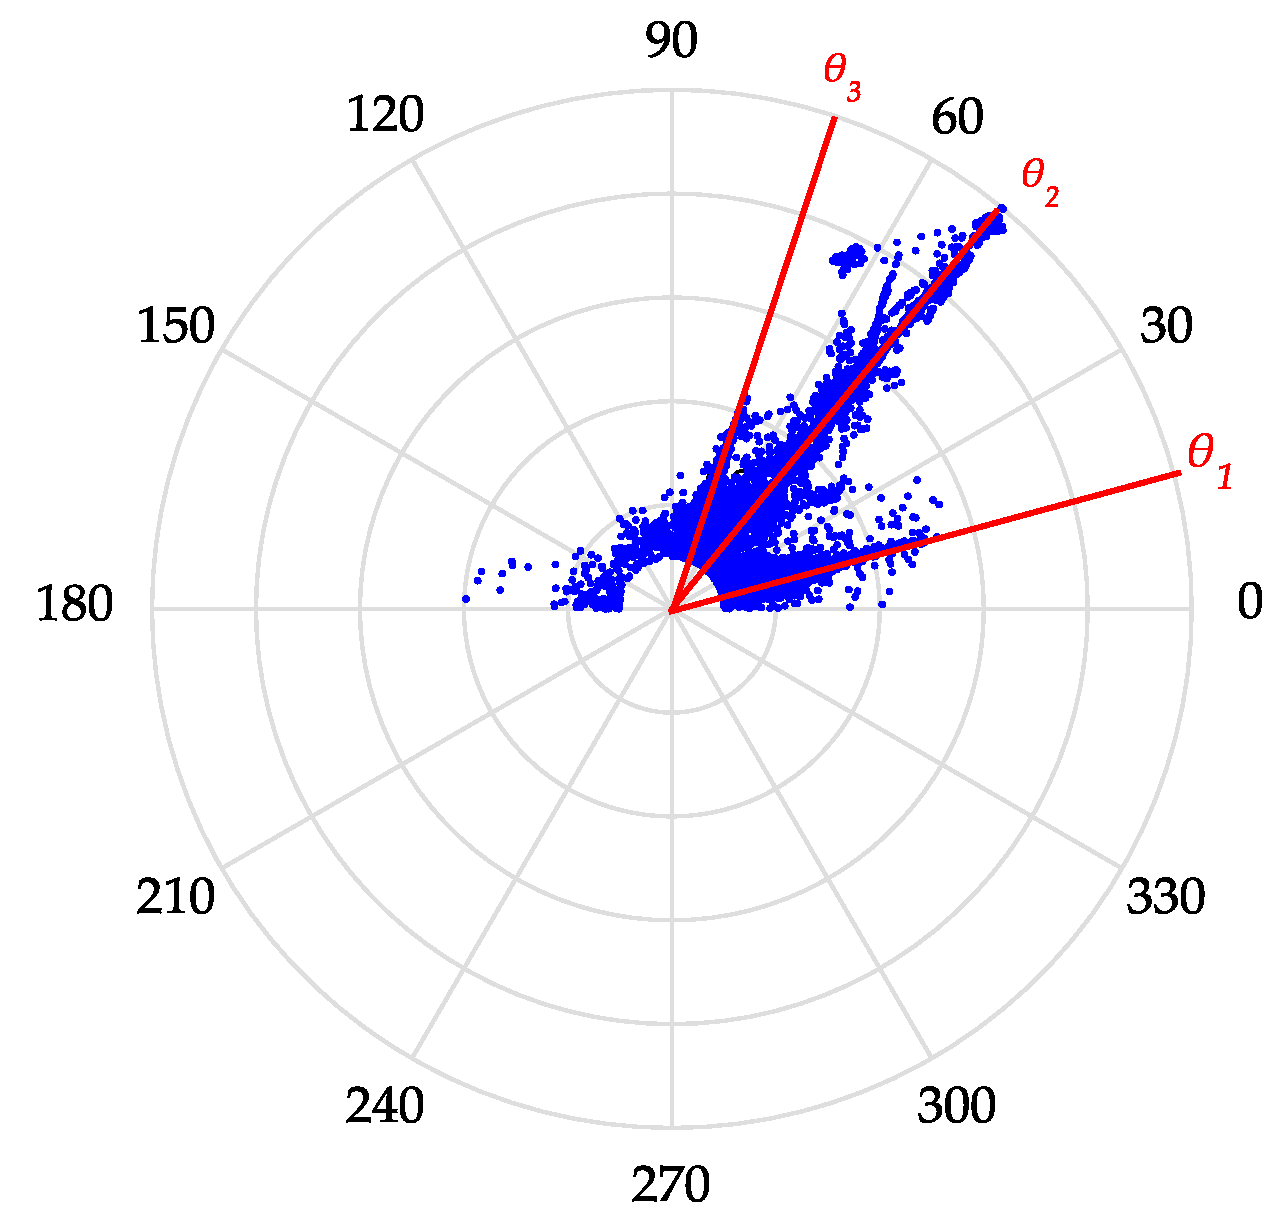
Figure 6.
Graph of potential function.
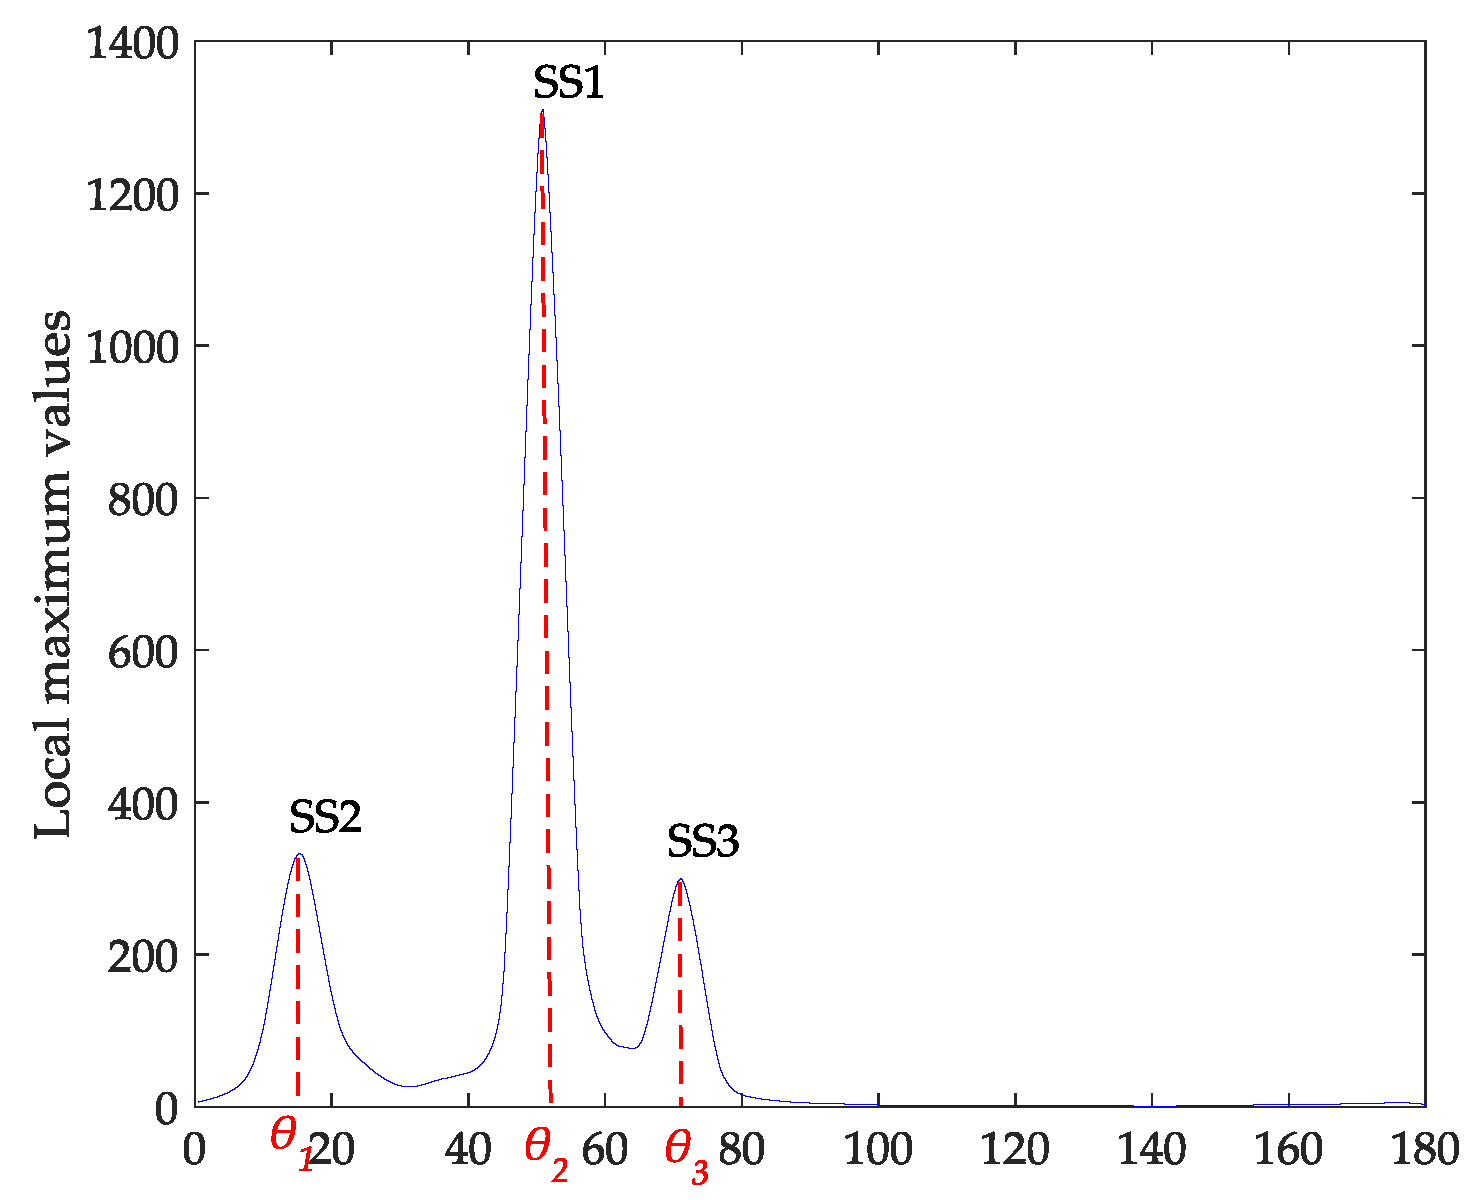
Figure 7.
Three separated simulation signals.
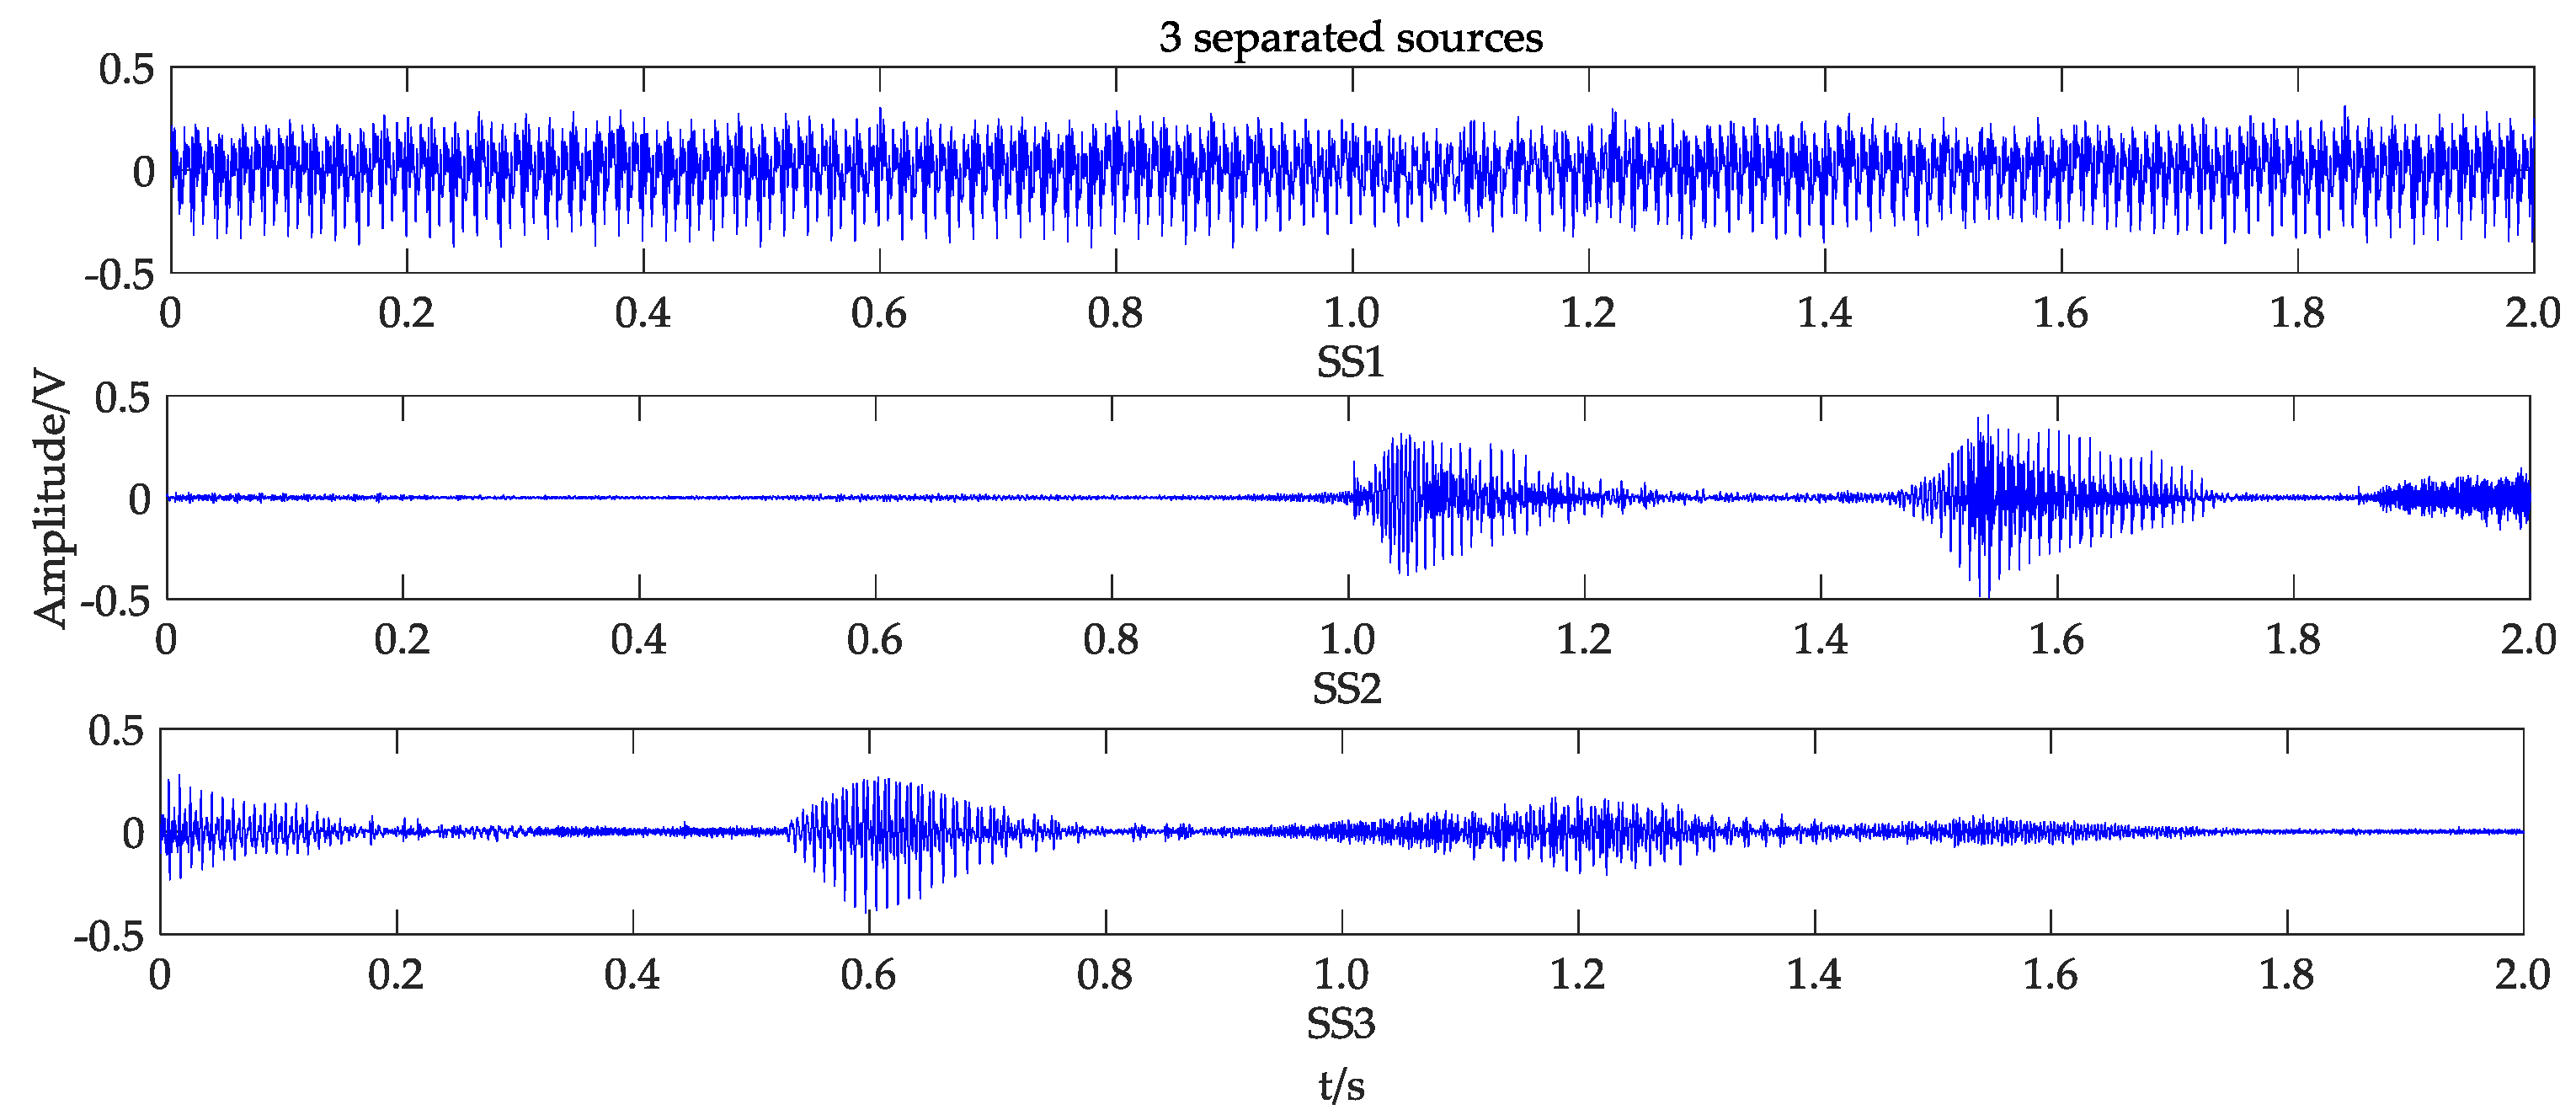
Figure 8.
Three source signals (increasing amplitude).
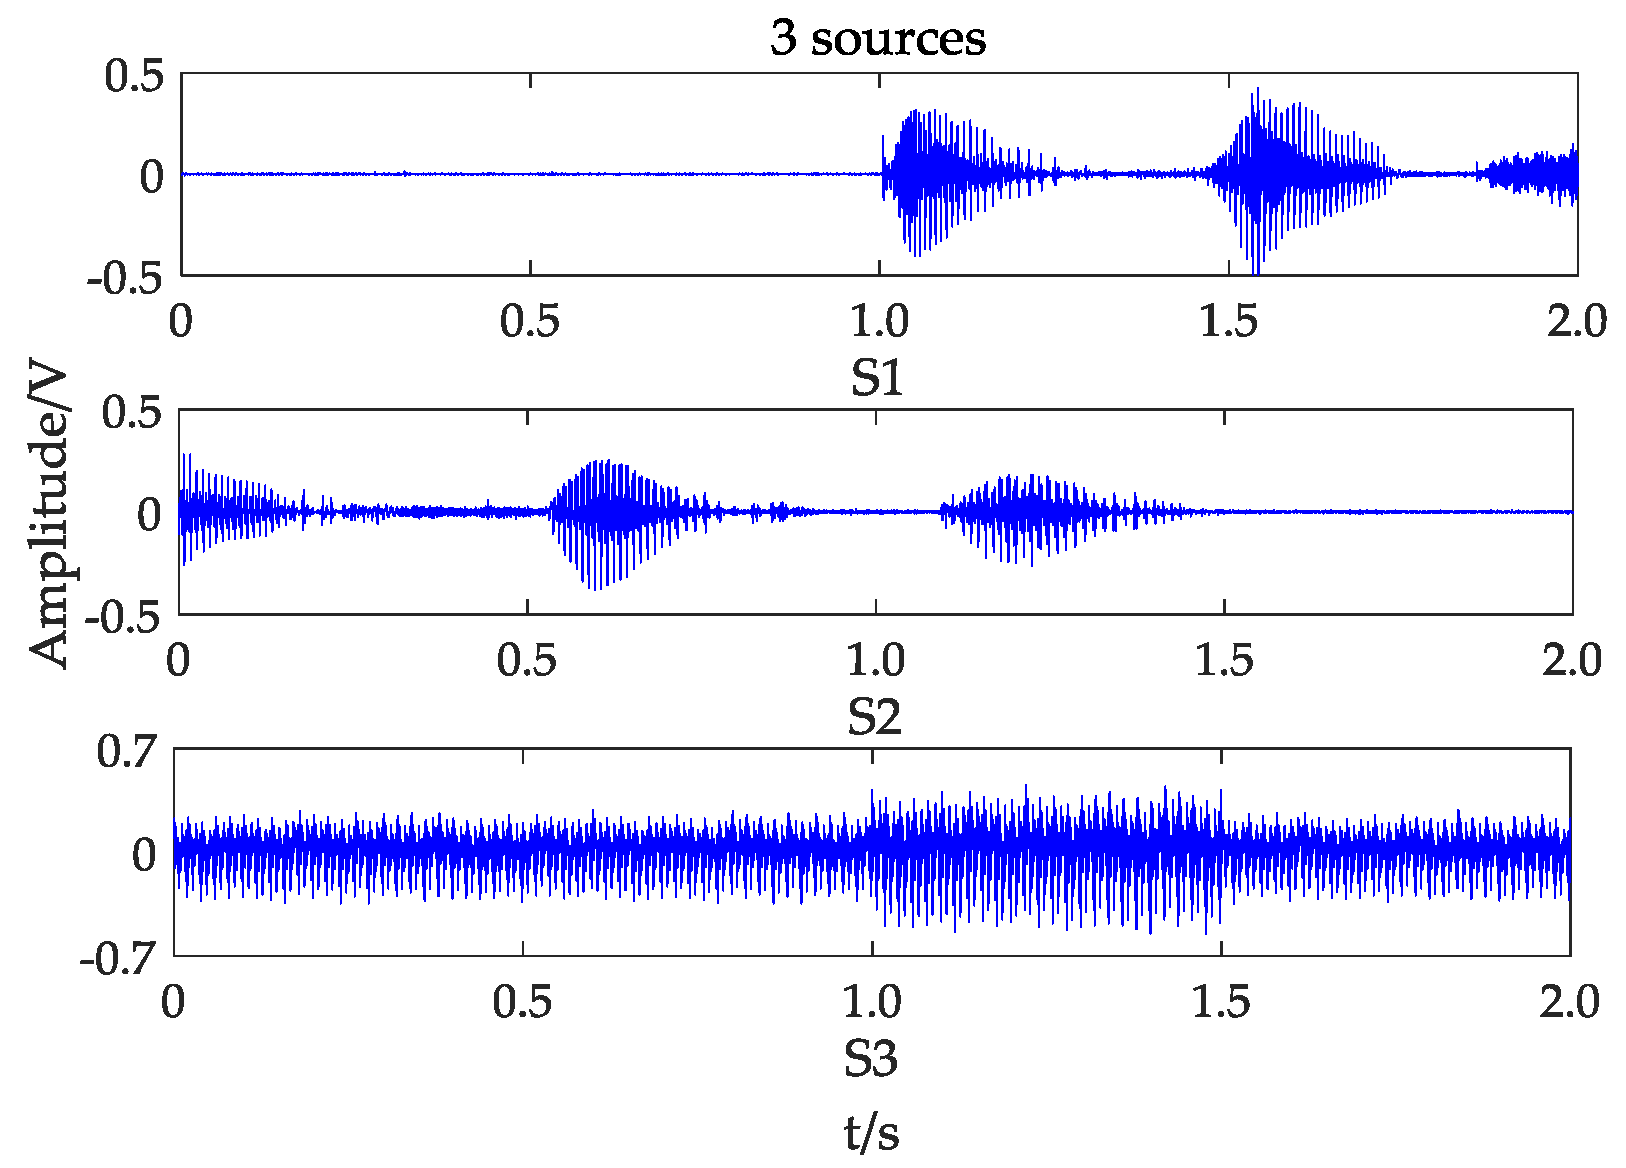
Figure 9.
Three separated signals (increasing amplitude).

Figure 10.
Three source signals (changing frequency).
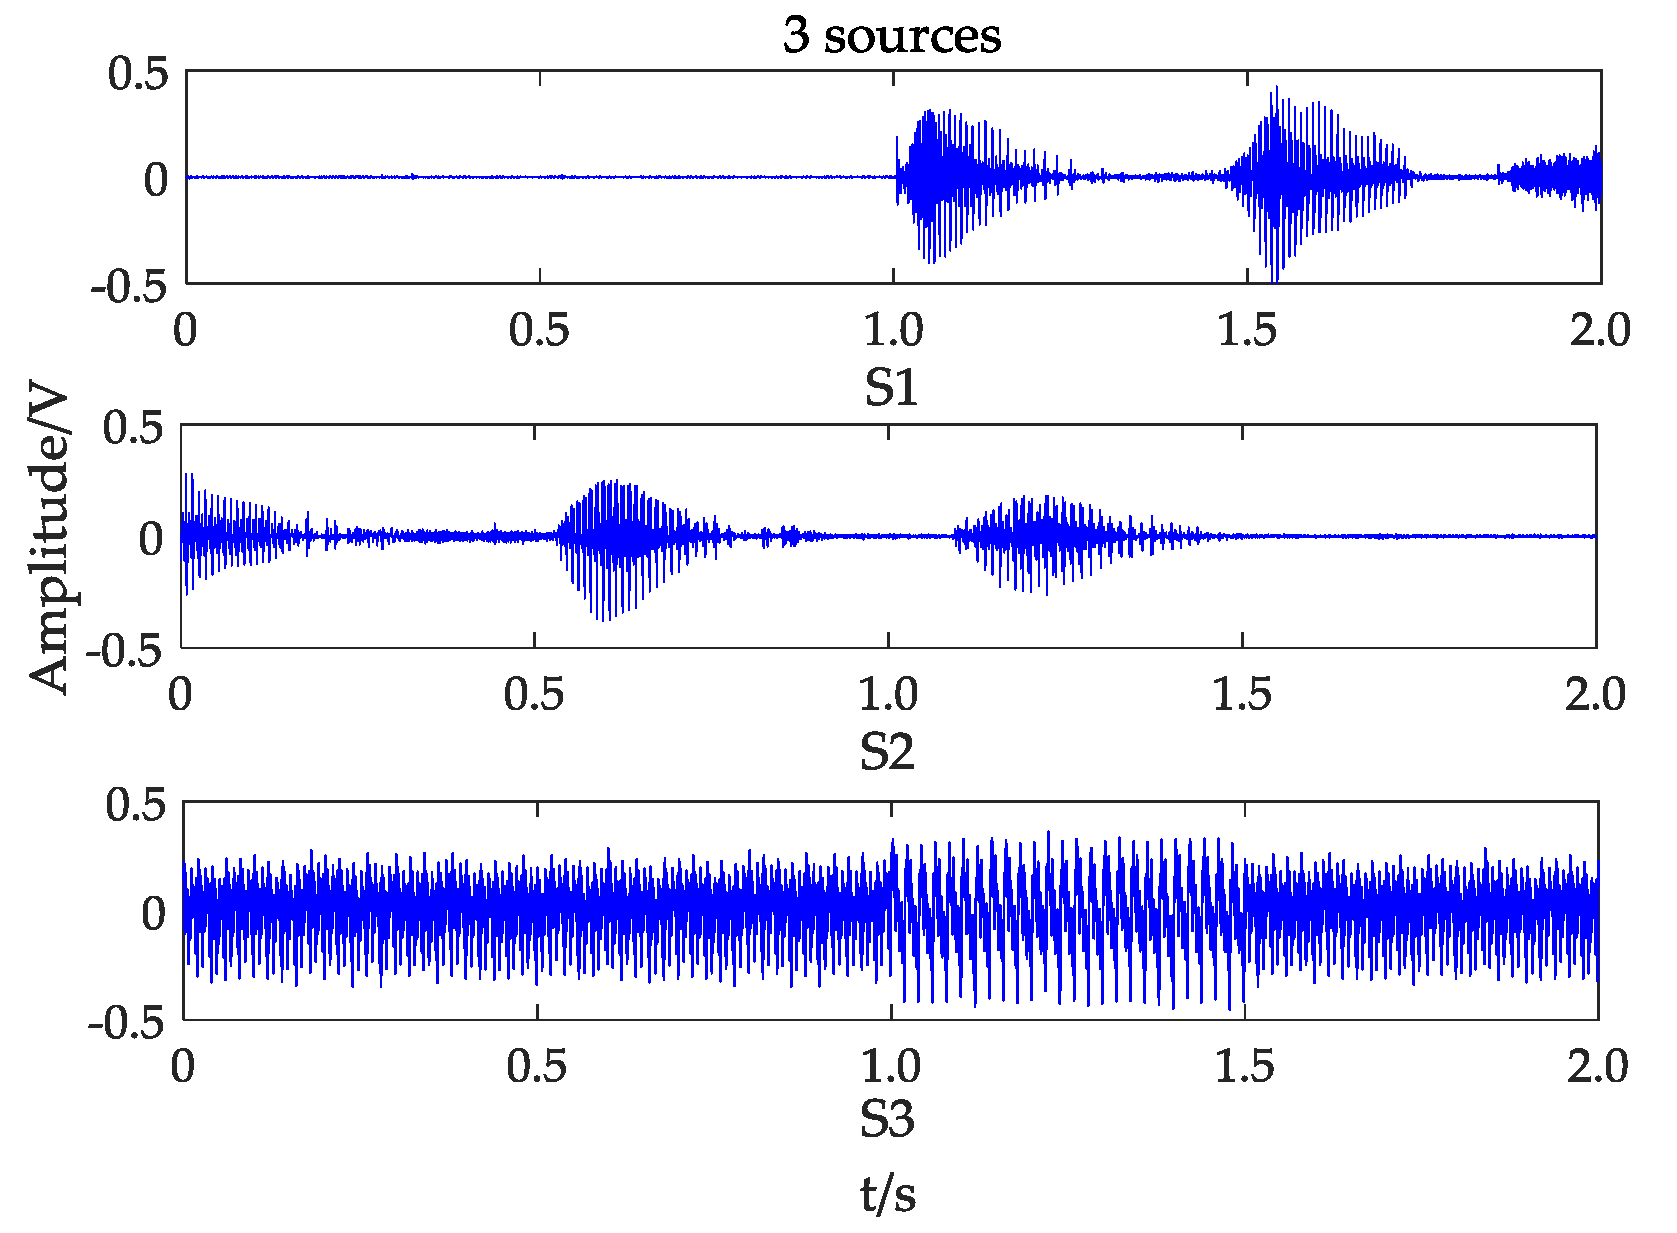
Figure 11.
Three separated signals (changing frequency).
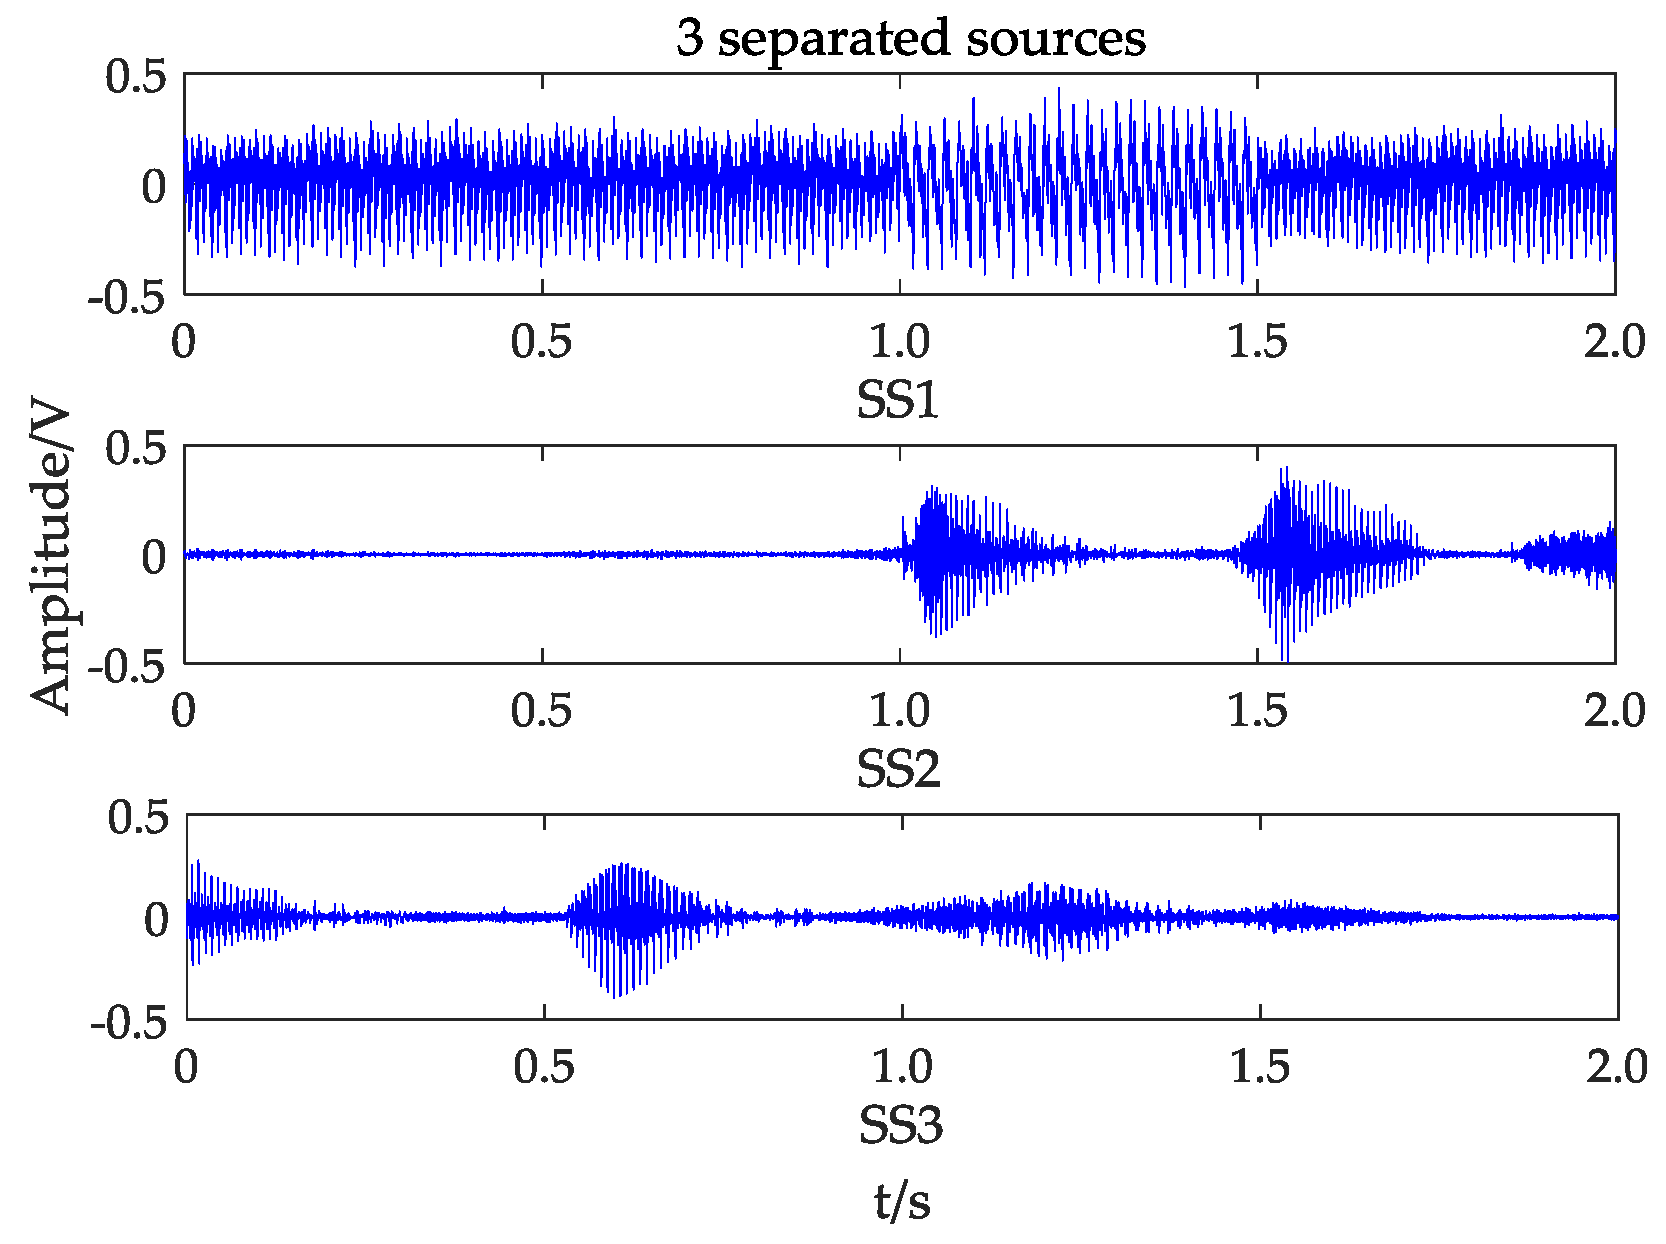
Figure 12.
Transformer vibro-acoustic signal (abnormal states).

Figure 13.
(a) Euclidean distance between adjacent eigenvectors; (b) Deviation of eigenvectors.

Figure 14.
Experiment schematic diagram.

Figure 15.
Mixed signals in substation.

Figure 16.
Scatter plot of frequency domain in polar coordinates.

Figure 17.
Graph of potential function.
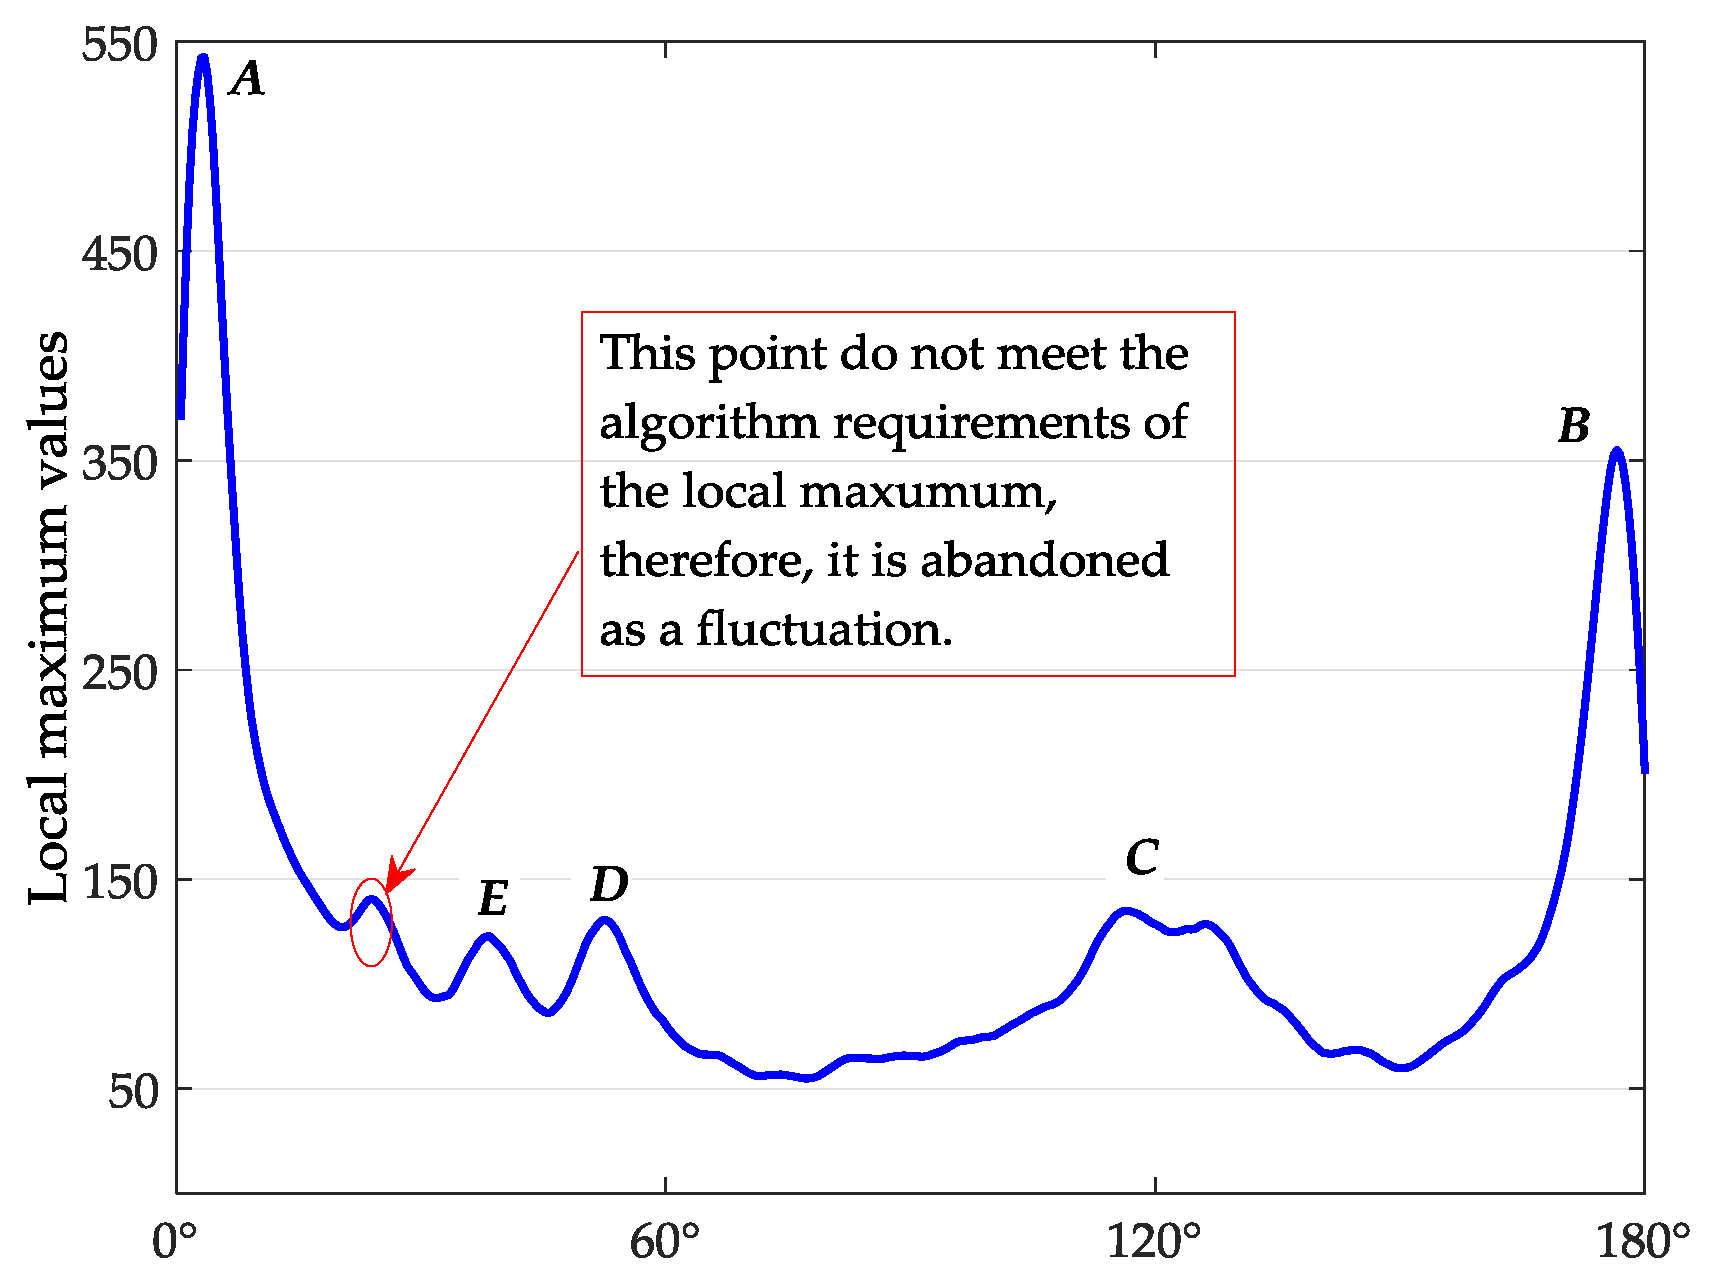
Figure 18.
Three separated signals (experiment).

Figure 19.
Interference signals (experiment).

Figure 20.
(a) Euclidean distance between adjacent eigenvectors; (b) Deviation of eigenvectors.

Table 1.
Effect evaluation of improved SCA algorithm.
| Evaluation Index | Normal Signal | Increasing Amplitude | Changing Frequency |
|---|---|---|---|
| R | 0.9804 | 0.9846 | 0.9833 |
| VQM | −32.0752 | −34.5847 | −33.7101 |
© 2017 by the authors. Licensee MDPI, Basel, Switzerland. This article is an open access article distributed under the terms and conditions of the Creative Commons Attribution (CC BY) license (http://creativecommons.org/licenses/by/4.0/).
Share and Cite
MDPI and ACS Style
Zou, L.; Guo, Y.; Liu, H.; Zhang, L.; Zhao, T. A Method of Abnormal States Detection Based on Adaptive Extraction of Transformer Vibro-Acoustic Signals. Energies 2017, 10, 2076. https://doi.org/10.3390/en10122076
AMA Style
Zou L, Guo Y, Liu H, Zhang L, Zhao T. A Method of Abnormal States Detection Based on Adaptive Extraction of Transformer Vibro-Acoustic Signals. Energies. 2017; 10(12):2076. https://doi.org/10.3390/en10122076
Chicago/Turabian StyleZou, Liang, Yongkang Guo, Han Liu, Li Zhang, and Tong Zhao. 2017. "A Method of Abnormal States Detection Based on Adaptive Extraction of Transformer Vibro-Acoustic Signals" Energies 10, no. 12: 2076. https://doi.org/10.3390/en10122076
Note that from the first issue of 2016, this journal uses article numbers instead of page numbers. See further details here.