Maximum Power Point Tracking Control of a Thermoelectric Generation System Using the Extremum Seeking Control Method


1
Fluids & Thermal Engineering Research Group, Faculty of Engineering, University of Nottingham, Nottingham NG7 2RD, UK
2
Electrical Engineering Department, King Fahd University of Petroleum & Minerals, Dhahran 31261, Saudi Arabia
*
Author to whom correspondence should be addressed.
Energies 2017, 10(12), 2016; https://doi.org/10.3390/en10122016
Submission received: 24 October 2017
/
Revised: 24 November 2017
/
Accepted: 28 November 2017
/
Published: 1 December 2017
Abstract
:This study proposes and implements maximum power Point Tracking (MPPT) control on thermoelectric generation system using an extremum seeking control (ESC) algorithm. The MPPT is applied to guarantee maximum power extraction from the TEG system. The work has been carried out through modelling of thermoelectric generator/dc-dc converter system using Matlab/Simulink. The effectiveness of ESC technique has been assessed by comparing the results with those of the Perturb and Observe (P&O) MPPT method under the same operating conditions. Results indicate that ESC MPPT method extracts more power than the P&O technique, where the output power of ESC technique is higher than that of P&O by 0.47 W or 6.1% at a hot side temperature of 200 °C. It is also noted that the ESC MPPT based model is almost fourfold faster than the P&O method. This is attributed to smaller MPPT circuit of ESC compared to that of P&O, hence we conclude that the ESC MPPT method outperforms the P&O technique.
1. Introduction
Thermoelectric generators (TEGs) have become more popular for waste heat recovery [1] and from other energy sources including solar [2], geothermal [3], human body heat harvesting [4], as well as from solid fuel stoves [5]. Today, TEGs allow lost thermal energy to be recovered, energy to be produced in extreme environments, electric power to be generated in remote areas and micro sensors to be powered [6]. Despite the wide range of applications, TEGs are still faced with a number of challenges that limit their further utilization in selected applications. These challenges include, TEG devices’ assembly challenges, device geometry problems, low figure of merit (ZT) of TEG materials as well as low device efficiency [7]. However, more efforts are underway to improve the performance, more especially due to the advantages associated with TEG devices such as high reliability, silent operation, having no moving parts and the less complex mechanical components that enable them lasting for a very long time [8].
Several research works on TEG device improvement have been published. The effect of adding macroscopic pores into thermoelectric materials was analysed purposely to improve the heat transfer between TEG and the external heat reservoirs, which definitely improves the output power [9]. Huang et al. [10] have optimized the geometry of two-stage TEGs using simplified conjugate-gradient method, clearly balancing the output power and the conversion efficiency to improve the device performance. The design and fabrication of plasma spray synthesized sub-stoichiometric titanium oxide-based TEGs using scalable and additive manufacturing has been carried out [11]. The main purpose of that research work was to provide guidelines for the large scale synthesis and fabrication of TEG systems directly incorporated in waste heat systems covering large areas. However, the results revealed that the output power of TEG is 2.43 mW with a maximum efficiency of 0.85%, which is still very low for particular applications which require higher power. Dunham et al. [12] have performed the power density optimization for micro-TEG systems by applying an accurate closed-form approach.
In view of the application of TEG to serve specific loads, the generated voltage and power are unstable because the heat source from which the temperature difference is acquired to activate the Seebeck effect is itself unstable and nonlinear. Therefore, a power conditioning mechanism is indispensable to stabilise the output power before the intended load is supplied. The use of dc-dc converters serves this purpose. Maximum power point trackers (MPPTs) are also used in conjunction with the converters to monitor the maximum power points (MPP) and subsequently extract the maximum power from the TEG system. MPPTs have seen wide application in solar photovoltaic (PV) systems for normal and shaded conditions in the two previous decades [13]. Currently, the application of MPPT algorithms to TEG is booming due to the fact that the TEG devices have similar characteristics as PV systems. Some research efforts so far pertaining the application of MPPT techniques on TEG systems deserve to be reported in this regard. An inverse dynamic analysis of MPPT technique has been applied to thermoelectric-solar hybrid energy harvesting system in which the harvested voltage response from both sources is initially converted into a third-order exponential function and then boosted up to nearly 5 V from a few mV [14]. Another MPPT technique is proposed based on controlling a dc-dc converter so that it operates on a pre-programmed locus of operating points close to MPPs of the power-voltage curve [15]. The analysis shows that for MPP power levels in the range of 1–17 mW, the mean variation of the power generated by the system from the MPP power of the TEG source is 1.87%. A novel MPPT is developed to take into account the variation of battery voltage during charging and the non-constant power loss in the converter for a hybrid TEG-solar system [16]. It is noted that up to 14.5% and 22.6% output power improvements are realized compared with the cases without using MPPT and even without power conditioning, respectively. The thermodynamic studies and MPPT system are analysed on the combined TEG-thermoelectric cooling (TEC) system to maximize the cooling power and the overall efficiency [17]. With MPPT, the output power of TEG increases from 20.49 W to 43.92 W, cooling power of TEC improves from 32.66 W to 46.51 W whereas the overall system efficiency increases from 2.606% to 4.375%. Besides, another research work analysed the performance of TEG/dc-dc converter system with incremental conductance (IC) based MPPT method [18]. The comparative results indicate that perturb and observe (P&O) technique outperforms the IC method in terms of efficiency and output power extraction. Similarly, Yi-Hua et al. have presented an MPPT technique that is composed of the advantages of the P&O and open circuit voltage (OCV) techniques [19]. Compared to conventional P&O technique, the hybrid method is highly noted to improve the tracking speed.
There are several other MPPT methods that can be used to improve performance of TEG systems. This study proposes and implements Maximum Power Point Tracking (MPPT) control on a thermoelectric generation system using an extremum seeking control (ESC) algorithm.
2. Thermoelectric Generators
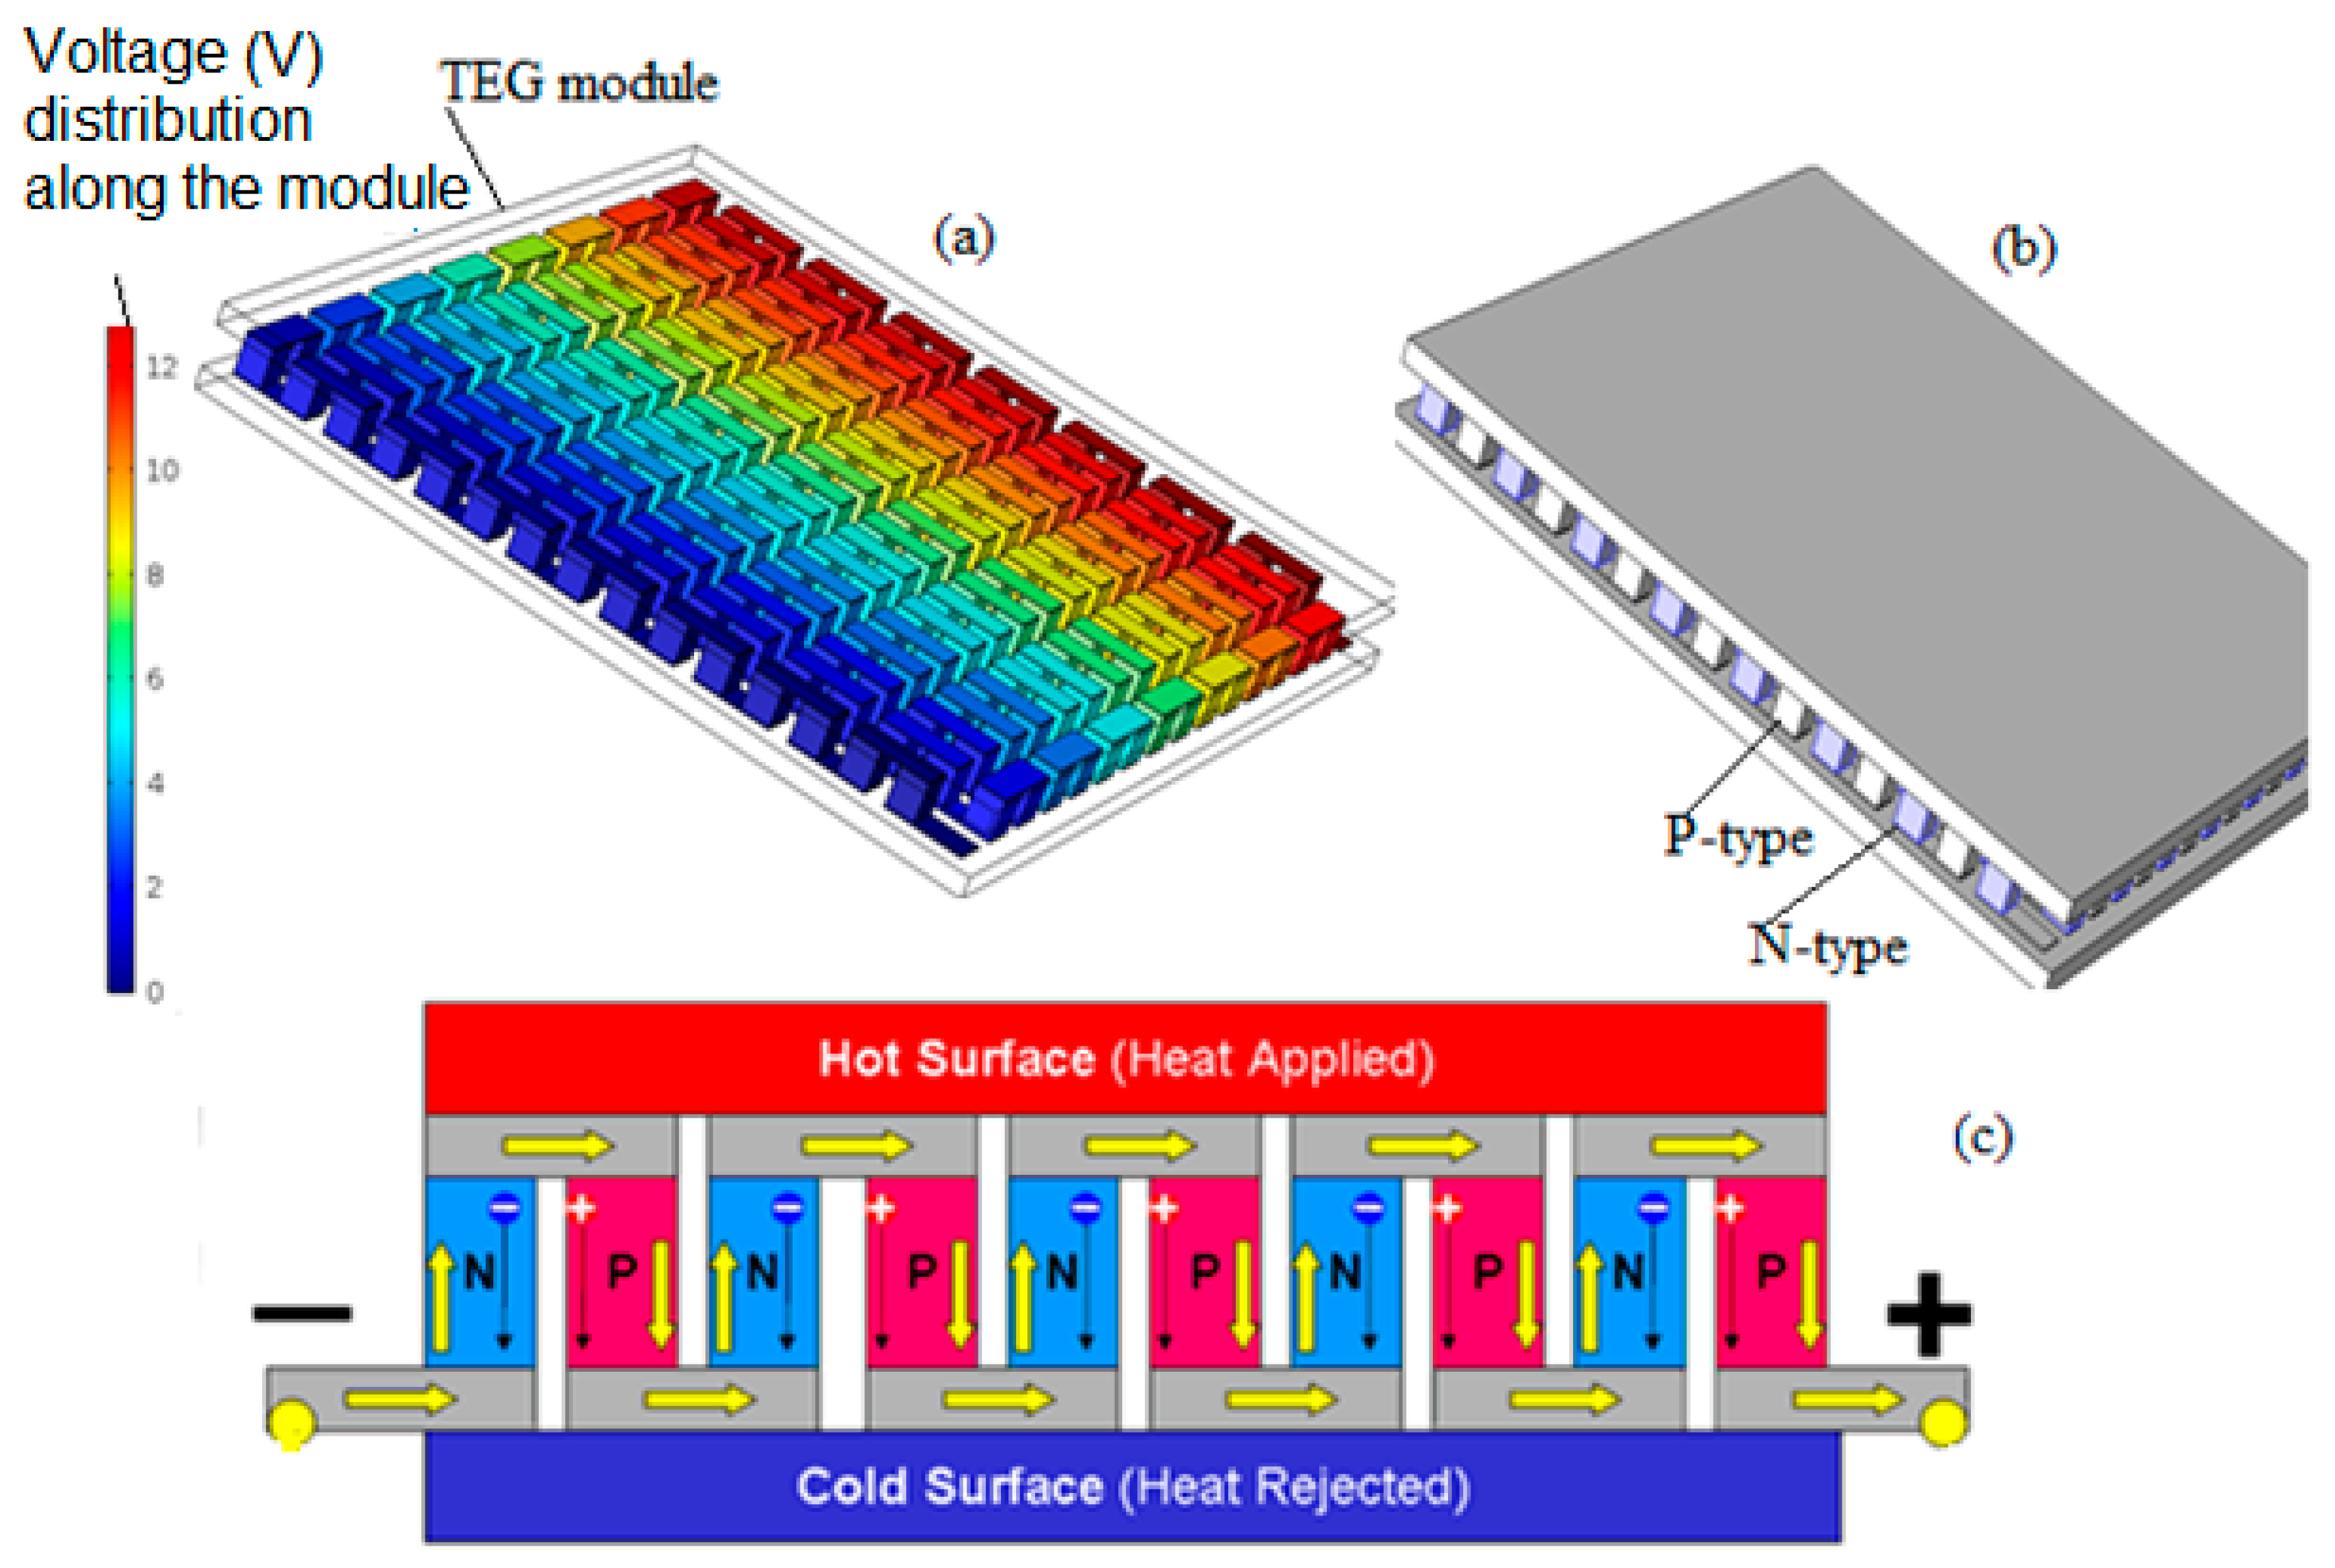
Physically, a TEG device is mainly composed of thermoelectric modules (TEMs) which have a hot and a cold side to establish a temperature difference across a thermoelectric material [20]. A typical TEG device is shown in Figure 1a. A TEG module consists of arrays of N and P type semiconductors as shown in Figure 1b, in which, by applying a heat source on the hot side and a cold heat sink to the other side, electric power is produced. In a thermoelectric material, there are free electrons or holes which carry both charges (negative and positive) and heat. If the free charges are positive (p-type material), positive charge will build up on the cold end which will have a positive potential. Similarly, negative free charges (n-type material) will produce a negative potential at the cold end [21] as shown in Figure 1c.
The principle feature of a TEG is the Seebeck effect, S or thermopower which is defined as [23]:
where is the electric potential; is the temperature difference between and , the hot and cold side temperatures of the TEG.
While the electric potential (voltage) produced by a temperature difference is known as the Seebeck effect, its proportionality constant is called the Seebeck coefficient. The resultant Seebeck coefficient of a TE element can also be derived analytically from the temperature dependence of the intrinsic Seebeck coefficient by taking into account the Thomson effect [24].
The thermoelectric efficiency is also quantified by a figure of merit expressed as [25]:
where σ, T, and k are the electrical conductivity, temperature, and thermal conductivity, respectively.
During modelling, the TEG structure is simplified to a solid structure so as to make heat transfer analysis easy, keeping its thermal behavior equivalent to that of the TEG based on 1D heat conduction theory [26]. In the simplified TEG models, some assumptions include: (1) homogeneity of TEG component materials as well as constant heat specific capacity, density thermal resistance i.e., they are independent of temperature; (2) negligible thermal contact effect inside the TEG and on the interfaces between the heat exchanger, and the heater and the TEG; (3) the effects of the air inside, free heat convection and equivalent density of the TEG are not accounted for.
Three-dimensional multi-physics model, energy equations of the metal connector, p-type semiconductor, n-type semiconductor, and ceramic plate are given as [27]:
where is the thermal conductivity, is the electric conductivity, and is the Thomson coefficient. The subscript j is for the connector, p for the p-type semiconductor, n for the n-type semiconductor, ce for the ceramic plate. The first term on the left side in Equation (3) is the Fourier heat conduction, the second is the internal heat sources due to the Joule heating. J(x, y, z) is the local current density, where J = 0 represents the ceramic plate.
T third term is the Thomson coefficient expressed as:
where S is the Seebeck coefficient of semiconductor materials.
However, if the Thomson effect is assumed constant, the third term of Equation (3) becomes zero.
The simplest approach to model a TE element is to set up an overall thermal energy balance equation, assuming a symmetrical distribution of the Joule effect between the cold and hot sides of the TE element. The Seebeck coefficient, thermal conductivity, and electrical conductivity of the thermoelectric element are kept constant in the material. In this study, the TEG is based on the simplified model applied in [18].
The following equations are used to design the model:
For TEG made of two semiconductor components, its output voltage is expressed as [28]:
For TEG made of a single semiconductor type, is given as:
where and are the Seebeck coefficients of the p- and n-type materials of the TEG, respectively; Vmatch is the matched load voltage, ΔTsp is the temperature difference of the measurement stated in the TEG datasheet; NTEG-s is the number of TEG modules, Rint is the TEG internal resistance, m is the TEG internal resistance vs. TEG temperature (Rint vs. T) curve slope and n is the Rint vs. T curve intercept.
3. The dc-dc Converters and MPPT
For an ordinary dc-dc converter, the switch is triggered by the use pulse width modulated (PWM) signal. The duty cycle is normally tuned to get the required output voltage from the converter. However, with the change in the input to the converter, it becomes hard to keep in touch with the changes to provide the maximum power to the load [29]. With the use of the MPPT algorithm, the maximum power can easily be tracking as the MPPT tracker is technically configured to respond to the changes in the input. The use of MPPT algorithm along with the dc-dc converter makes it possible to extract maximum power from TEG. In this study, we have applied a boost dc-dc converter topology. A boost converter topology converts from a low voltage to higher voltage and can either be controlled by PWM or MPPT, with the load current smaller than the input current. It is the most commonly used in the middle and low voltage level conversion networks. It is suitable for TEG with unstable internal resistance and output voltage [7].
3.1. Extremum Seeking Control MPPT Technique
The ESC deals with the online optimization problem of finding and optimizing an input for mainly an unknown and/or time-varying cost function , where u(t) is the input parameter vector [30], i.e.,
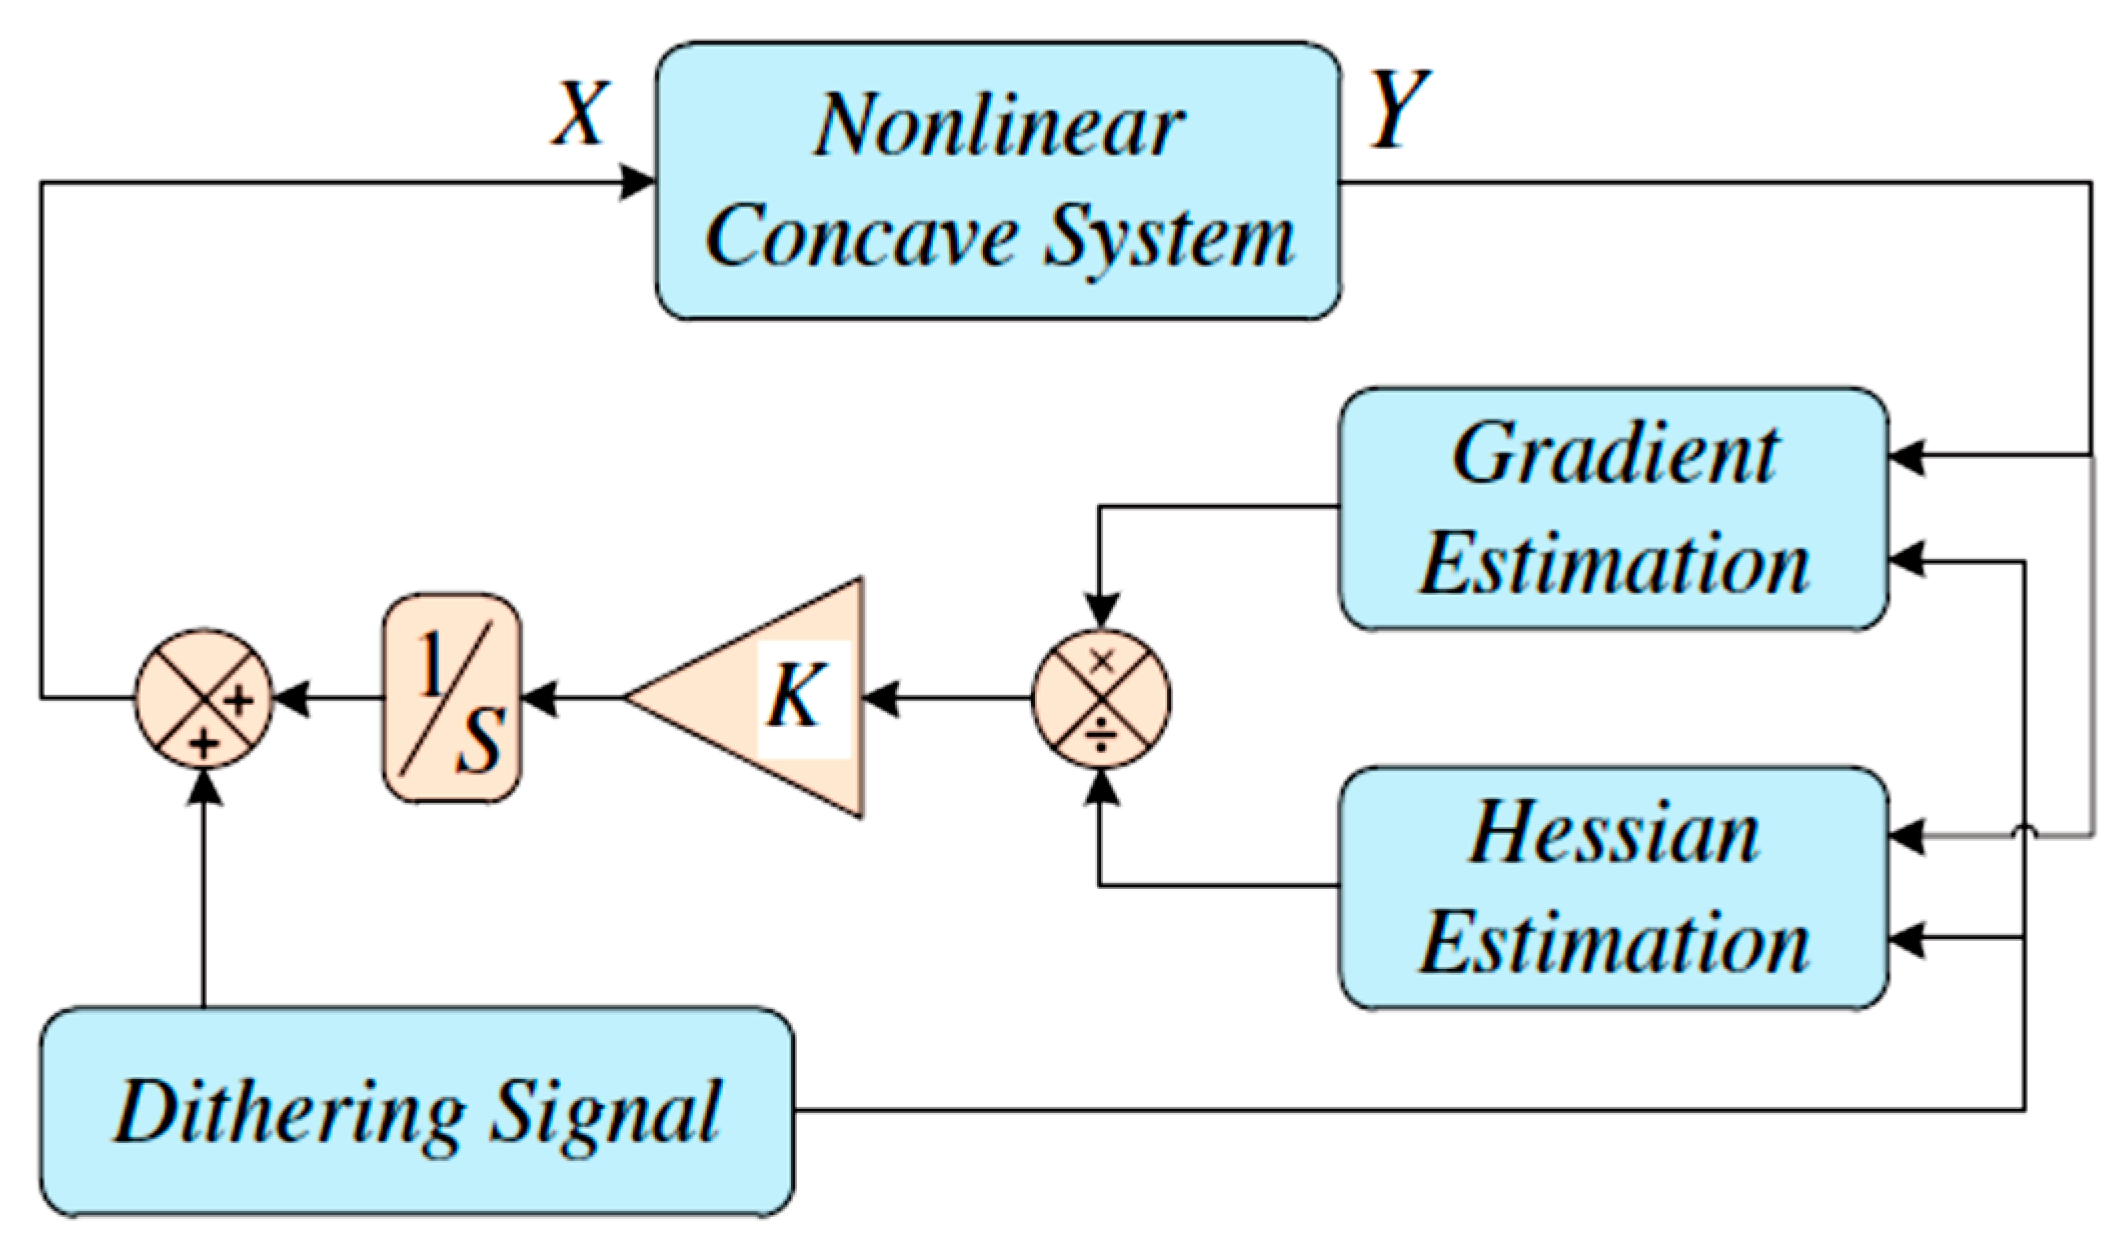
The block diagram of a classic ESC method is shown in Figure 2. In this method it is assumed that the characteristics curve of the system under consideration is concave. Therefore, this method can find application in tracking the MPP in TEG systems where the P-V characteristic curves are nonlinear.
A classic ESC algorithm should have a gradient estimator to fulfil the MPPT functionality. For MPPT, a nonlinear characteristic power curve for the TEG is expressed as:
where p is the output power of TEG and x is the input of the TEG device which is a function of the signal u, and is the dithering signal. Consequently the output power is as follows:
The dithering signal aids in reducing the electromagnetic interference in the system, hence improving the performance of the MPPT algorithm [32]. However, there are some extremum seeking controllers without dither in the extremum seeking loop but instead depend on the past data of the performance map to estimate the gradient of the performance map by means of a 1st-order least squares fit [33]. The dither-less ESC controllers allow for an asymptotic stability result, as opposed to practical stability in dither-based schemes and, therefore enables convergence to the optimal performance of the parameters.
Now, Equation (11) could be approximated by Taylor’s series around u:
It could be seen that the TEG output power now has a low frequency with harmonics having frequencies of and . Applying a high pass filter, the output becomes:
Multiplication of and gives:
When has gone through a low-pass filter, the output of ESC system is expressed as:
The block diagram of ESC system estimator is shown in Figure 3.
The ESC algorithm applied in this study is modified from the ESC technique proposed and applied to PV systems by Malek [34]. The ESC MPPT is a fractional order extremum-seeking algorithm that utilizes output measurements of the plant, with superior performance in various aspects such as robustness and convergence speed [35]. The block diagram of the applied ESC circuit is shown in Figure 4. The constants k1 and k2 represent the frequencies of the low and high pass filters of the estimator, respectively. G1 is a proportional gain of the controller which is used to adjust the value from the integrator. The dithering sinusoidal signal is also passed through a gain G2. The integrator 1/s is applied to the output of the low pass filter to eliminate the steady state offset of the controller. The gains G1 and G2 are tuned until a suitable output power is achieved from the converter.
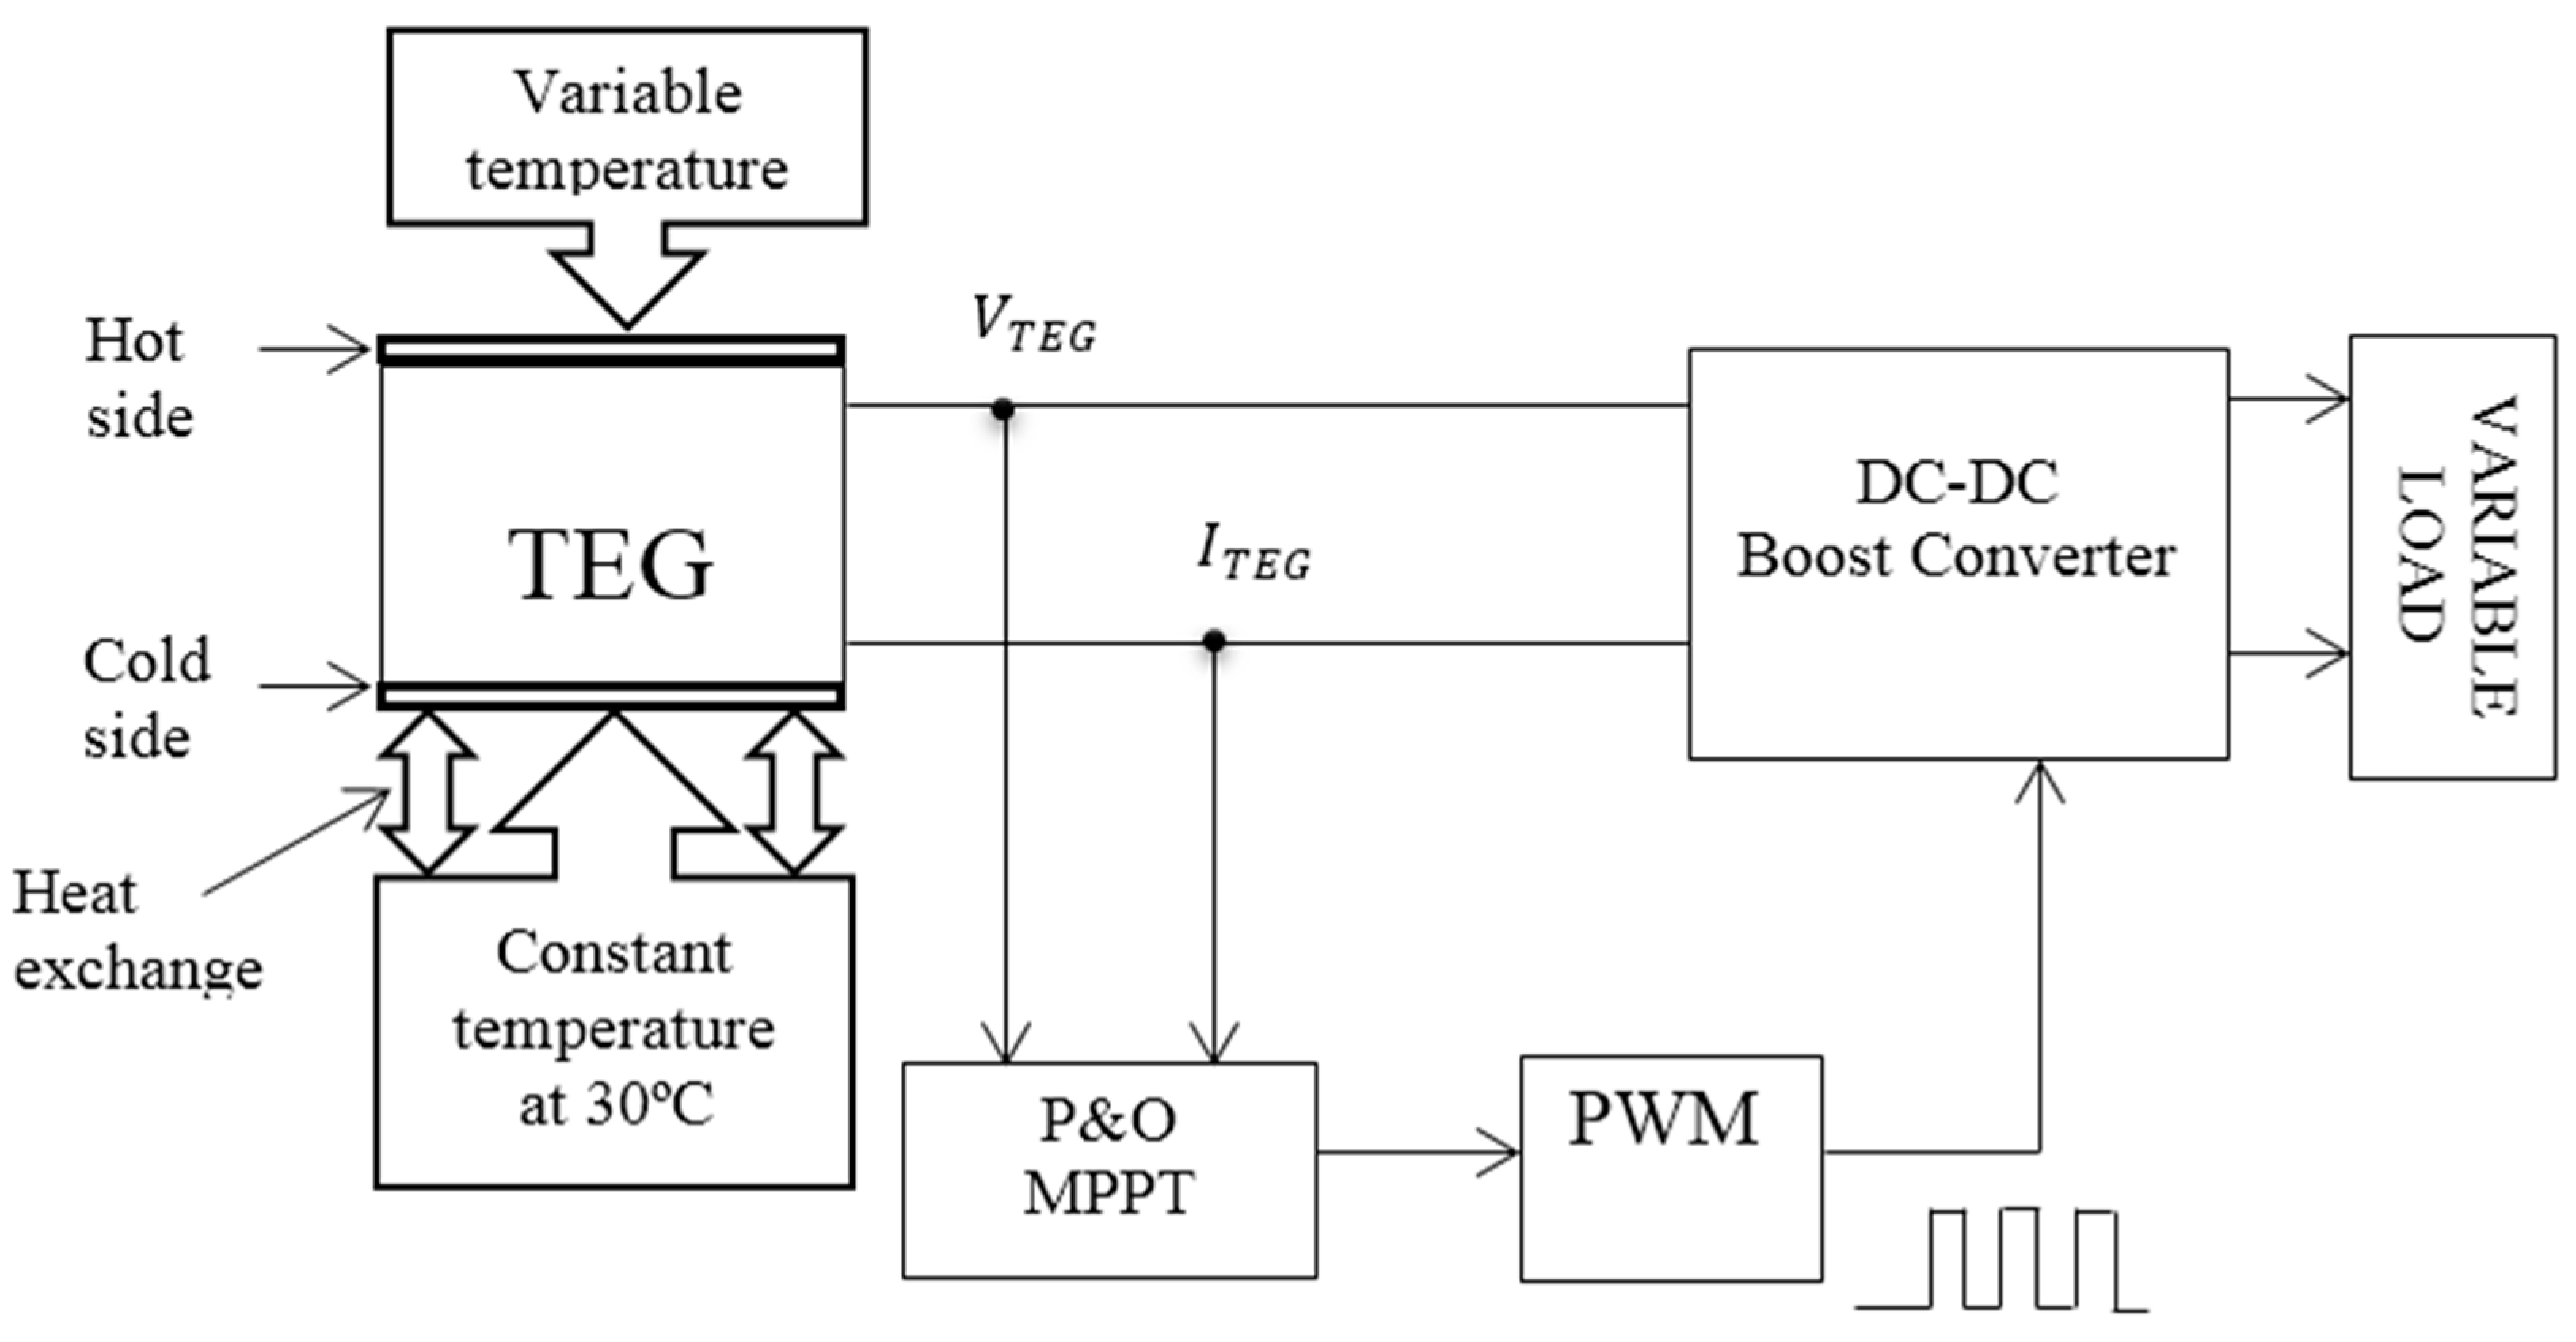
Figure 5 shows the block diagram of the implemented TEG/dc-dc converter system with ESC MPPT. The cold side temperature is maintained at 30 °C while the hot side temperature is varied, initially set at 200 °C and incremented by 25 °C up to the highest temperature of 400 °C. The TEG model implemented in the current study was first introduced by Li [36] to simulate the TEG with real time temperature inputs. Although, it has been applied to the previous work [18], no attempt has been made to validate the model. In this work, it has been found necessary to verify the model as well as suggesting ways of improving it.
3.2. Perturb & Observe MPPT Technique
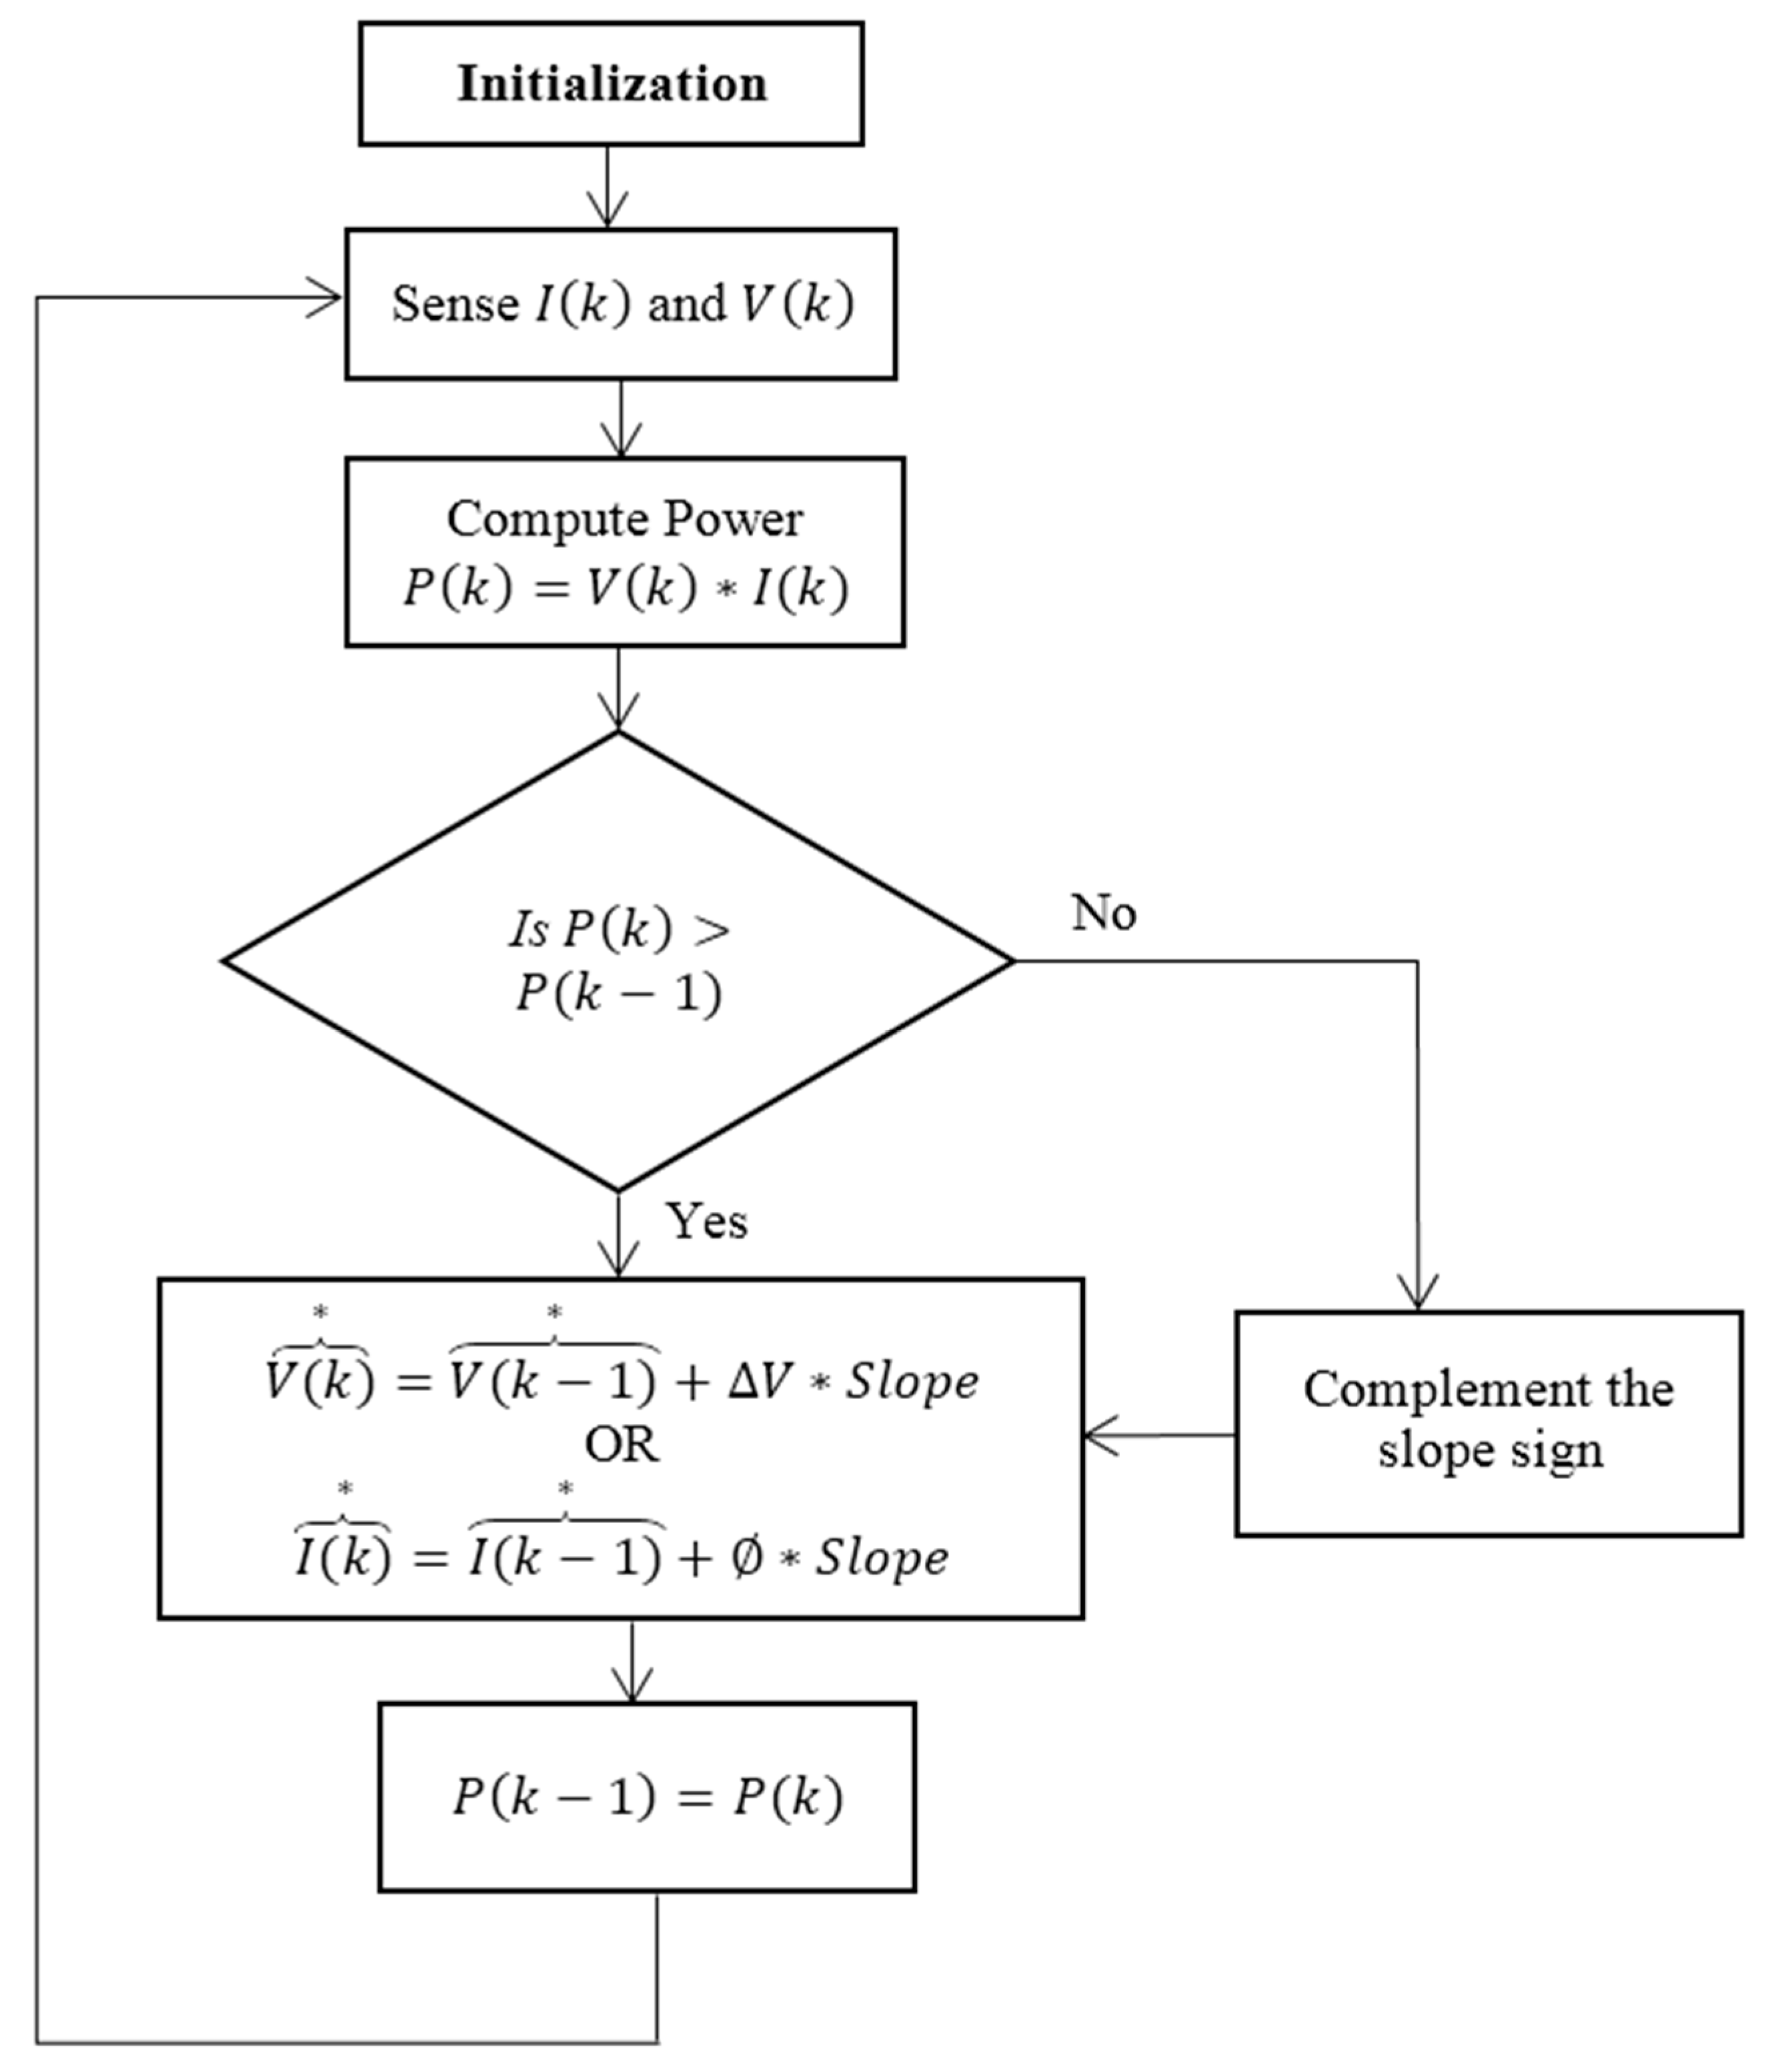
The P&O algorithm whose working principle is demonstrated in Figure 6 introduces a perturbation in the operating voltage and current of TEG. As a result, the change in the operating power is observed. The relative increase in the operating power indicates that the converter is approaching the MPP. Similarly, during the succeeding sampling cycle, the slope (direction) of perturbation is maintained whereas the reference current and voltage are further increased by value. Once the vicinity of MPP is reached, for each new perturbation (with alternating sign polarity), the algorithm will go back and forth around the MPP. Consequently, it does not reach exactly the MPP but it oscillates around that point indefinitely [37]. The P&O MPPT algorithm provides a change in V, due to the variation in P according to the following rule:
The slope in Equation (16) indicates the perturbation direction, i.e., to the right (climbing) or left (descending). Obviously, the size of the perturbation, is crucial; the larger the value of , the faster the convergence, although this results in large fluctuation in P, and vice versa. In conventional P&O technique, the oscillation is highly undesirable as it leads to a significant energy loss. Therefore, adaptive P&O is used to solve this problem [38].
Figure 7 shows the block diagram of the implemented TEG/dc-dc converter system with P&O MPPT, with the same input temperature and load as in the ESC model described above.
Figure 8 shows the Simulink model of TEG/dc-dc boost converter system. The Simulink for TEG model is well explained in previous work [18]. The same Simulink TEG model was used for P&O simulation except that the ESC block was replaced P&O block indicated in Figure 9. The P&O circuit was designed based on the flowchart in Figure 6.
The hot side temperature “t” was varied in steps according to:
t = 200, 225, 250, 275, 300, 325, 350, 375 and 400 °C
For each value of hot side temperature (t) and the cold side temperature (30 °C), the TEG/dc-dc converter model was simulated to find the output voltage and current.
The dc-dc converter is designed based on a known procedure in literature. The electronic components selection criteria for the boost converter are well described in our previous work [39]. Figure 10 shows the simulated boost converter circuit whereas Table 1 displays a list of electronic components and their values, used in the boost converter design.
The load resistance Rload was varied in steps based on:
Rload = [0, 0.2, 0.4, 0.6, 0.8, 1, 1.1, 1.8, 2.4, 2.8, 3.2, 3.6, 4, 4.4, 4.8, 6, 10, 14] Ω
The load resistance range is based on the internal resistance of the TEG of 1.1 Ω, so that lower and upper values are tested to find the optimum point from the TEG simulation model. From Figure 9, the connection Conn2 represents a control signal from the MPPT circuit as indicated on the boots converter block in Figure 8.
4. Results and Discussion
The results are discussed based on steady state parameters from the TEG/dc-dc converter models. The parameters considered include the output voltage, output power and the simulation speed. Results of the ESC MPPT-based model are presented first, followed by those of the P&O based model. Afterwards, the comparison of the two MPPT techniques is given.
4.1. Results of ESC MPPT Method
Figure 11 shows the output voltages of the converter against the load resistances, for all the hot side temperatures simulated for a single TEG module. It is observed that at a zero load, i.e., when the output terminals of the converter are short circuited, the output voltages for all the temperature conditions also have zero value. It is clearly seen that the output voltages increase with the load resistance and temperature. However, the increase in output voltages is faster at smaller loads than at larger loads, which is a moderately correct trend expected from such TEG/converter models.
The output power of the ESC based model is illustrated in Figure 12. As clearly observed, the output power increases with the hot side temperature since the cold side temperature is fixed. Like the PV systems, there is an optimum load for which the overall converter impedance (converter components’ resistances plus the load) is matched with the internal resistance of TEG, at which point the maximum power is obtained. In this case the load resistance is obtained at 1.8 Ω for all temperatures. Similarly, the output power increases faster with the load resistance at the left side of the optimum point whereas it decreases slowly with increase in the load on the right side of the optimum point, which is the normal trend for TEG, just like in PV systems.
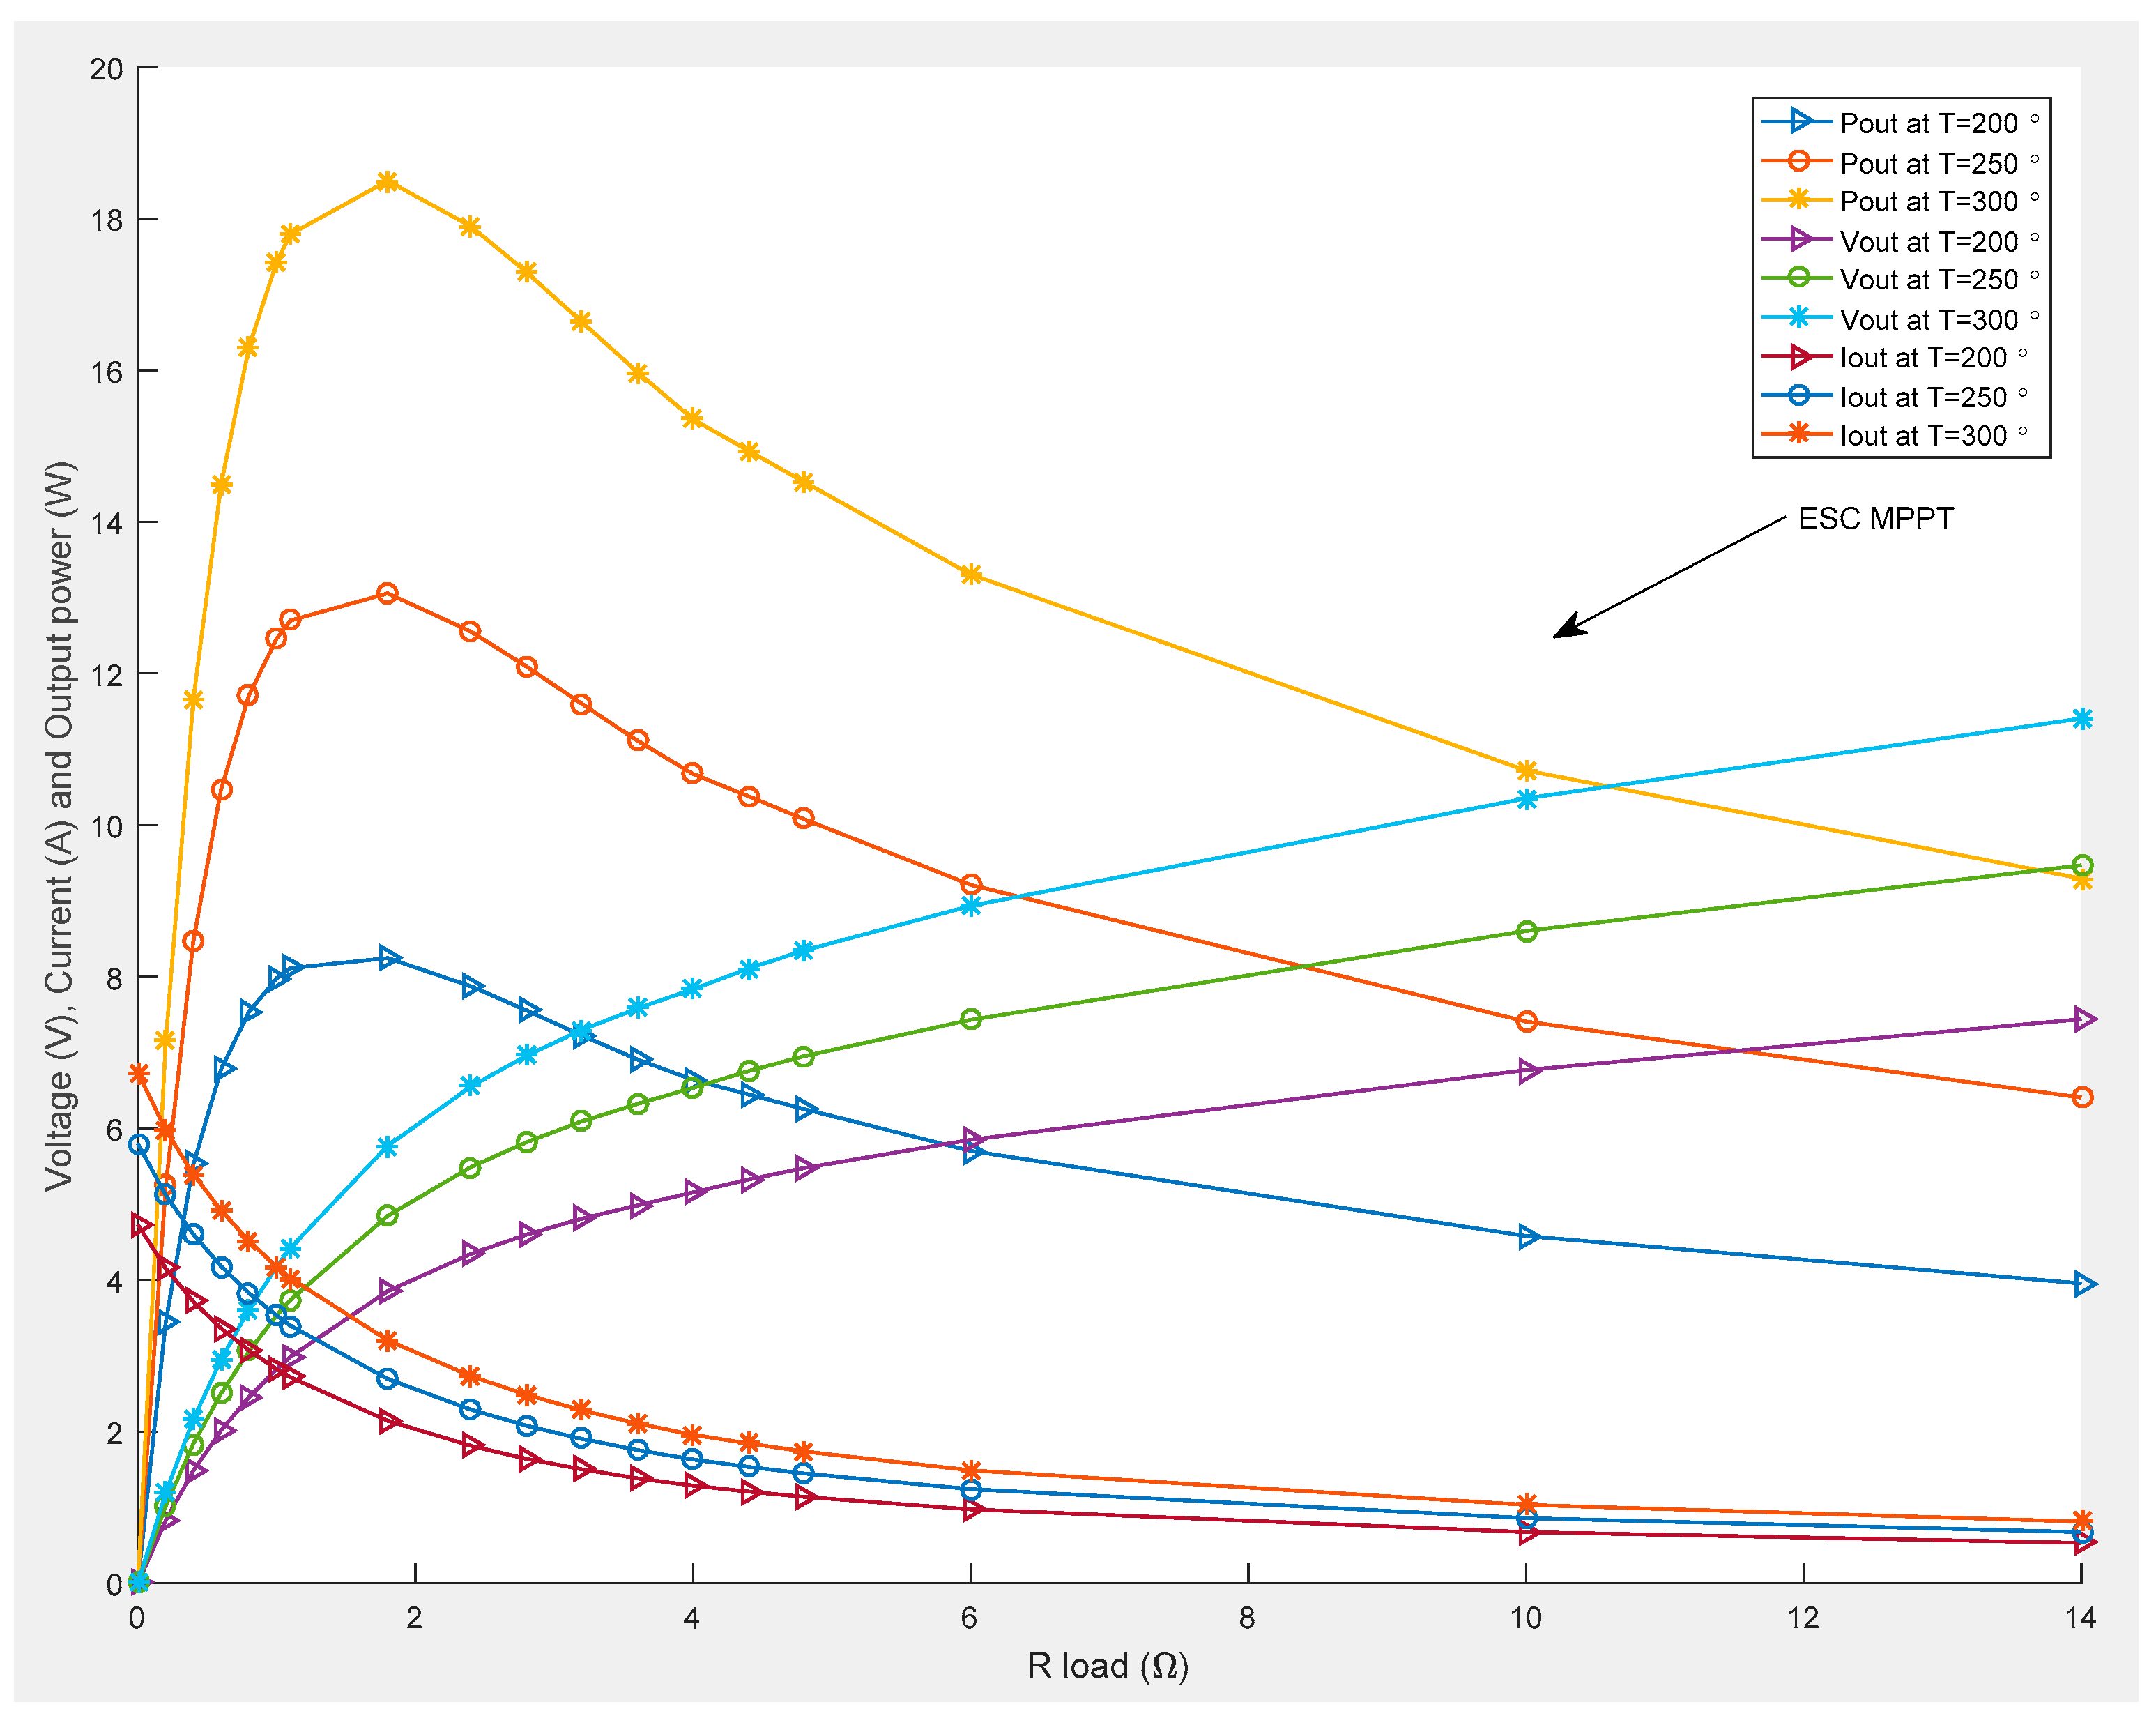
Figure 13 displays a plot of output voltages, currents and the output power of ESC MPPT model. The trend of the output current is opposite to that of the output voltage, i.e., as the output voltages increase, the output currents decrease with increase in hot side temperature and vice-versa. However, the output voltages and currents for each temperature meet at the left of the optimum power points at about 1.1 Ω load resistance, which is almost the internal resistance (1.2 Ω) of the TEG considered in the simulation. This is in conformity with the theoretical and practical nature of TEG.
4.2. Results of P&O MPPT Method
Figure 14 demonstrates the output voltages, currents and power of the P&O MPPT model for a single TEG at hot side temperature of 200 °C, 250 °C and 300 °C. Like the ESC MPPT based model, at zero load, the output voltages for all the three temperature conditions is zero while the output voltages increase with the load resistance and the hot side temperature. The output power curves for P&O technique are similar to those of ESC method, but the difference will be discussed in the next section. The optimum or matching point is obtained at nearly 1.8 Ω with the output power of 30.6 W at a temperature of 400 °C. However, the intersection point of output voltage and current is different from the optimum power point but it is shifted to the left at about 1.1 Ω load resistance, which is similar to that of the ESC-based model.
4.3. Comparison of Both MPPT Techniques
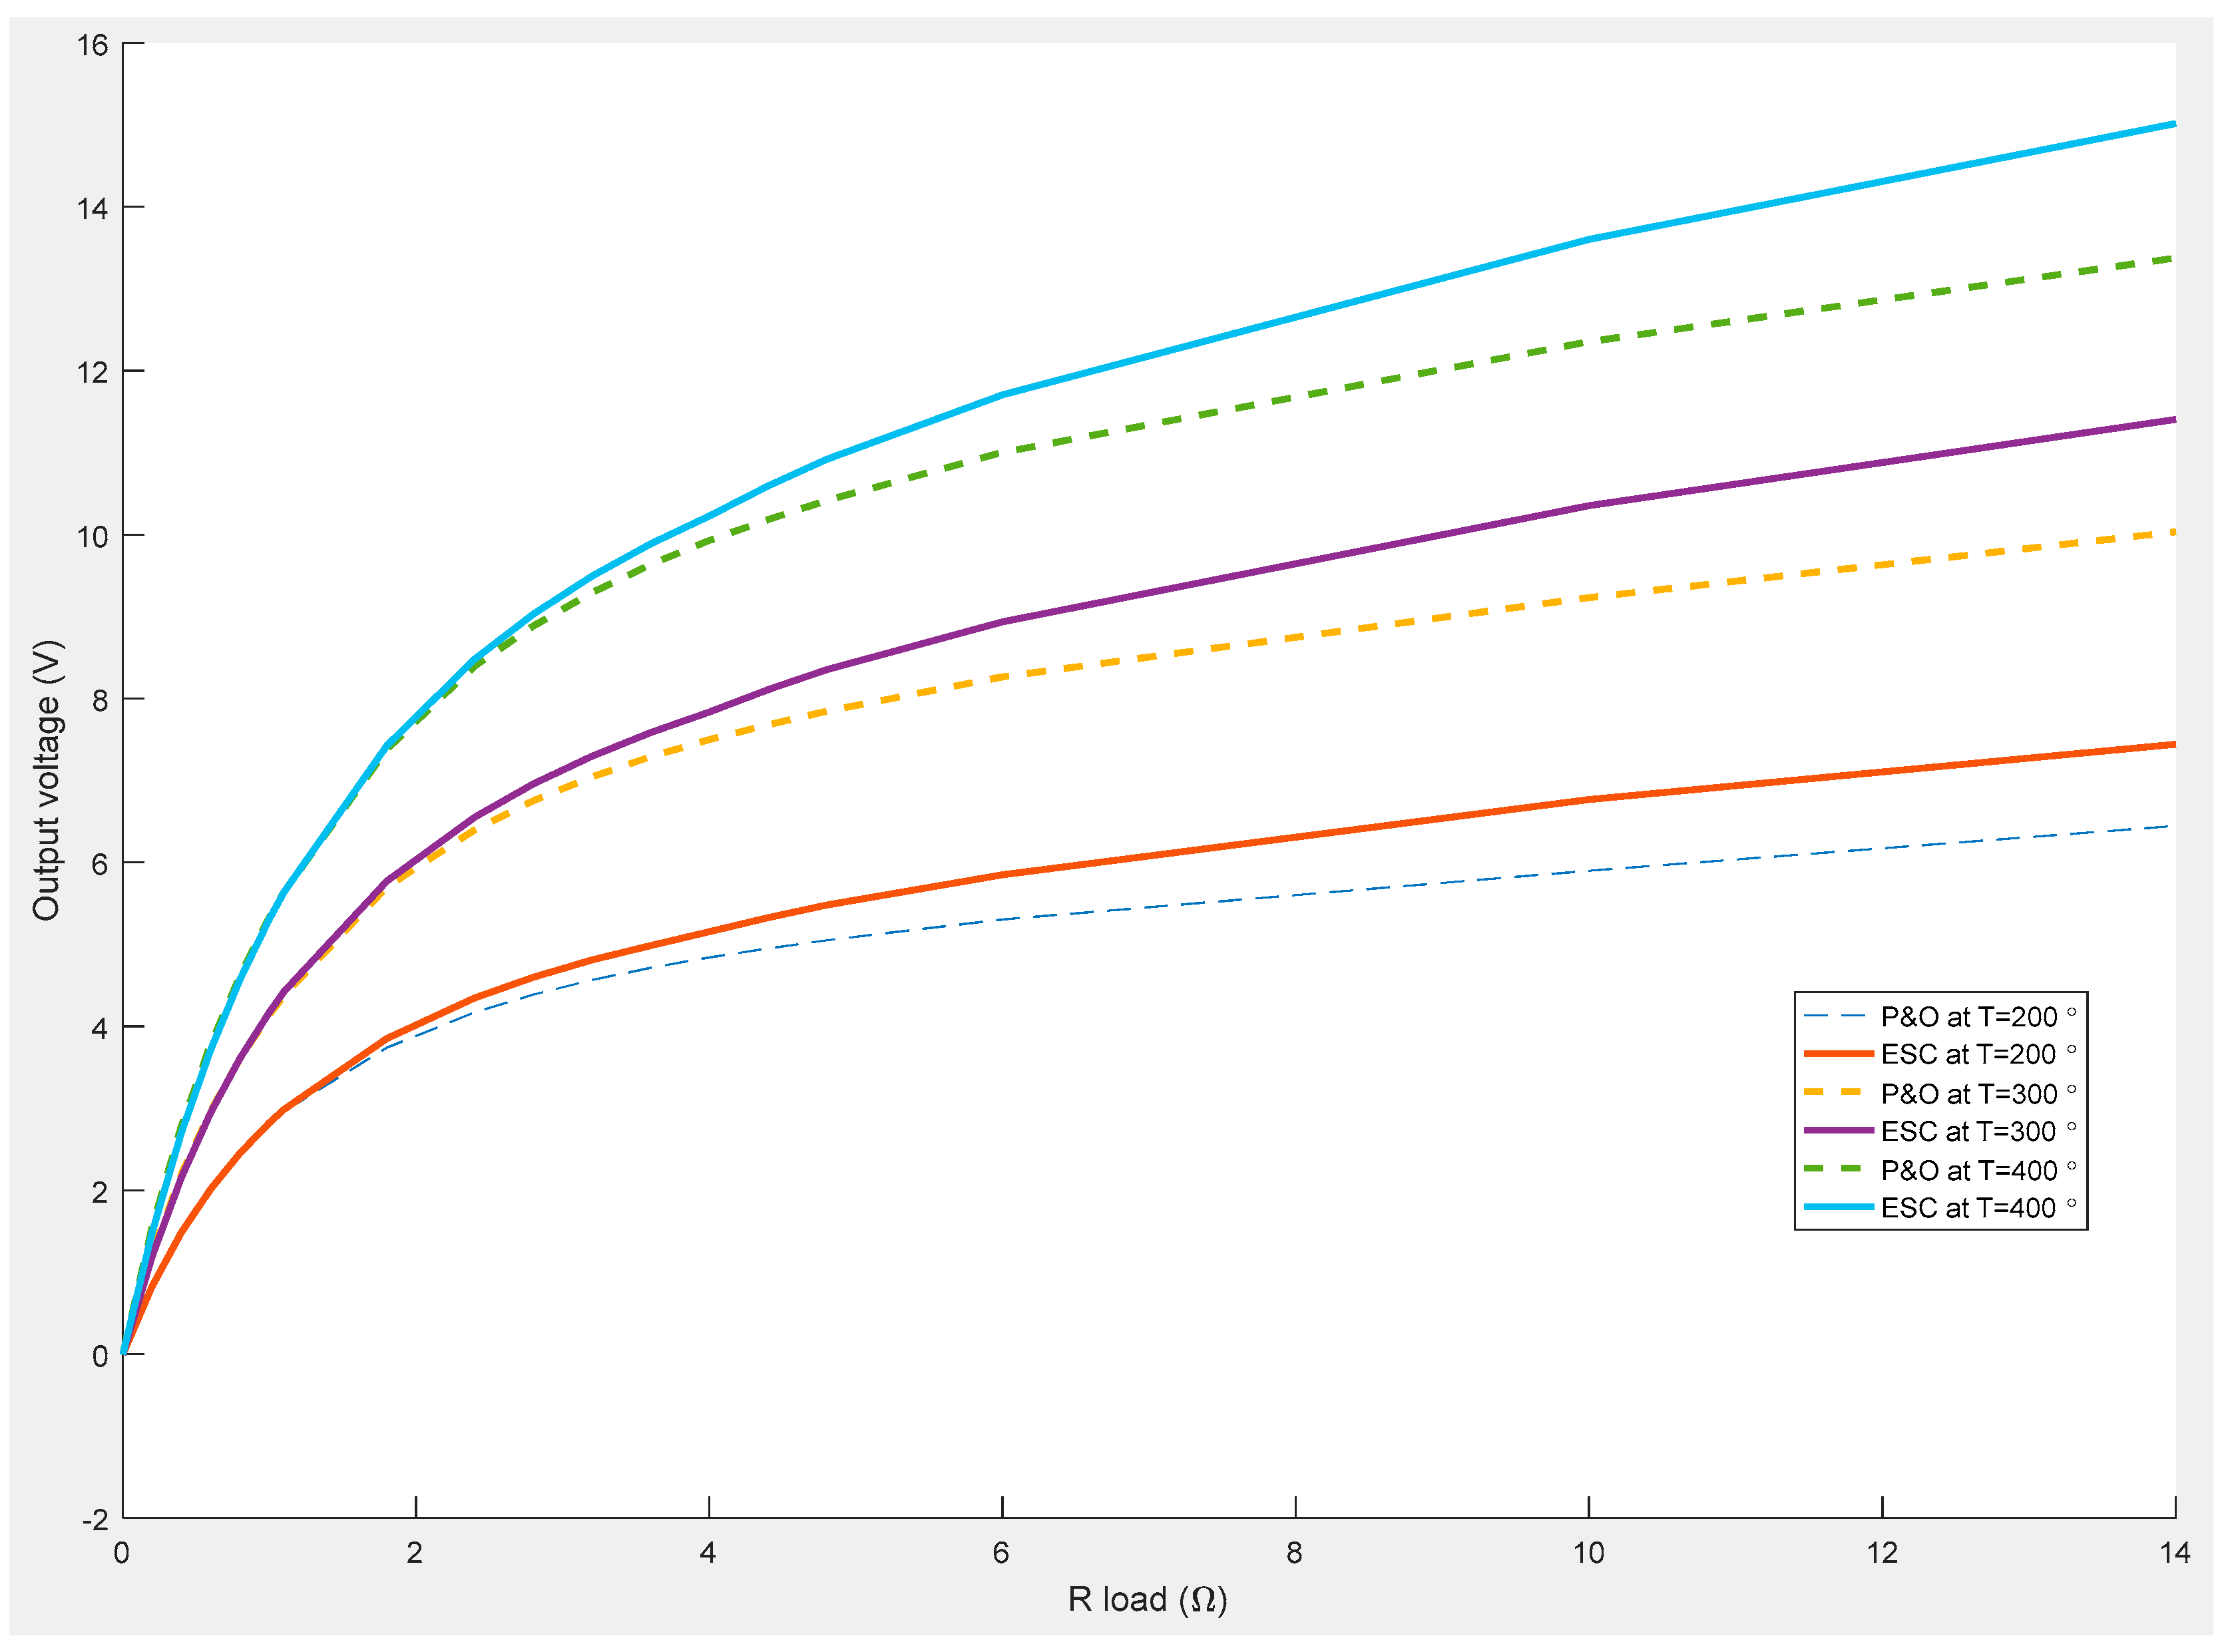
Figure 15 shows the comparison between the output voltages of ESC- and P&O MPPT-based models at hot side temperatures of 200, 300 and 400 °C. It is indicated that at the load resistances below 2 Ω, there is a small difference between the output voltages of ESC- and P&O-based models. Beyond that point, the difference increases with increase in the load. The comparison of the output power is shown in Figure 16, where it is demonstrated that the output power of ESC MPPT model is generally higher than that of P&O-based model. At the optimum load of 1.8 Ω, the maximum power of ESC is 30.6 W whereas for P&O method, it is 30.2 W.
The difference in the performance of these methods in terms of harvesting maximum power is clearly illustrated in Figure 17. The output power of the P&O technique is deducted from that of the ESC method to get the difference which is plotted in Figure 17. It is observed that at load resistances below 1.2 Ω, the output power difference is generally negative, indicating that the output power of P&O is more than that of ESC method. This implies that P&O technique has better performance in terms of the amount of harvested output power in that range. Particularly, at lower hot side temperatures in the same load range, for example at 200 °C, the output power difference is negative for only a short range of the load resistances (0–0.5 Ω), though the performance improves towards higher temperatures with the maximum difference of 1.13 W recorded at a load resistance of 0.4 Ω for a hot side temperature of 400 °C.
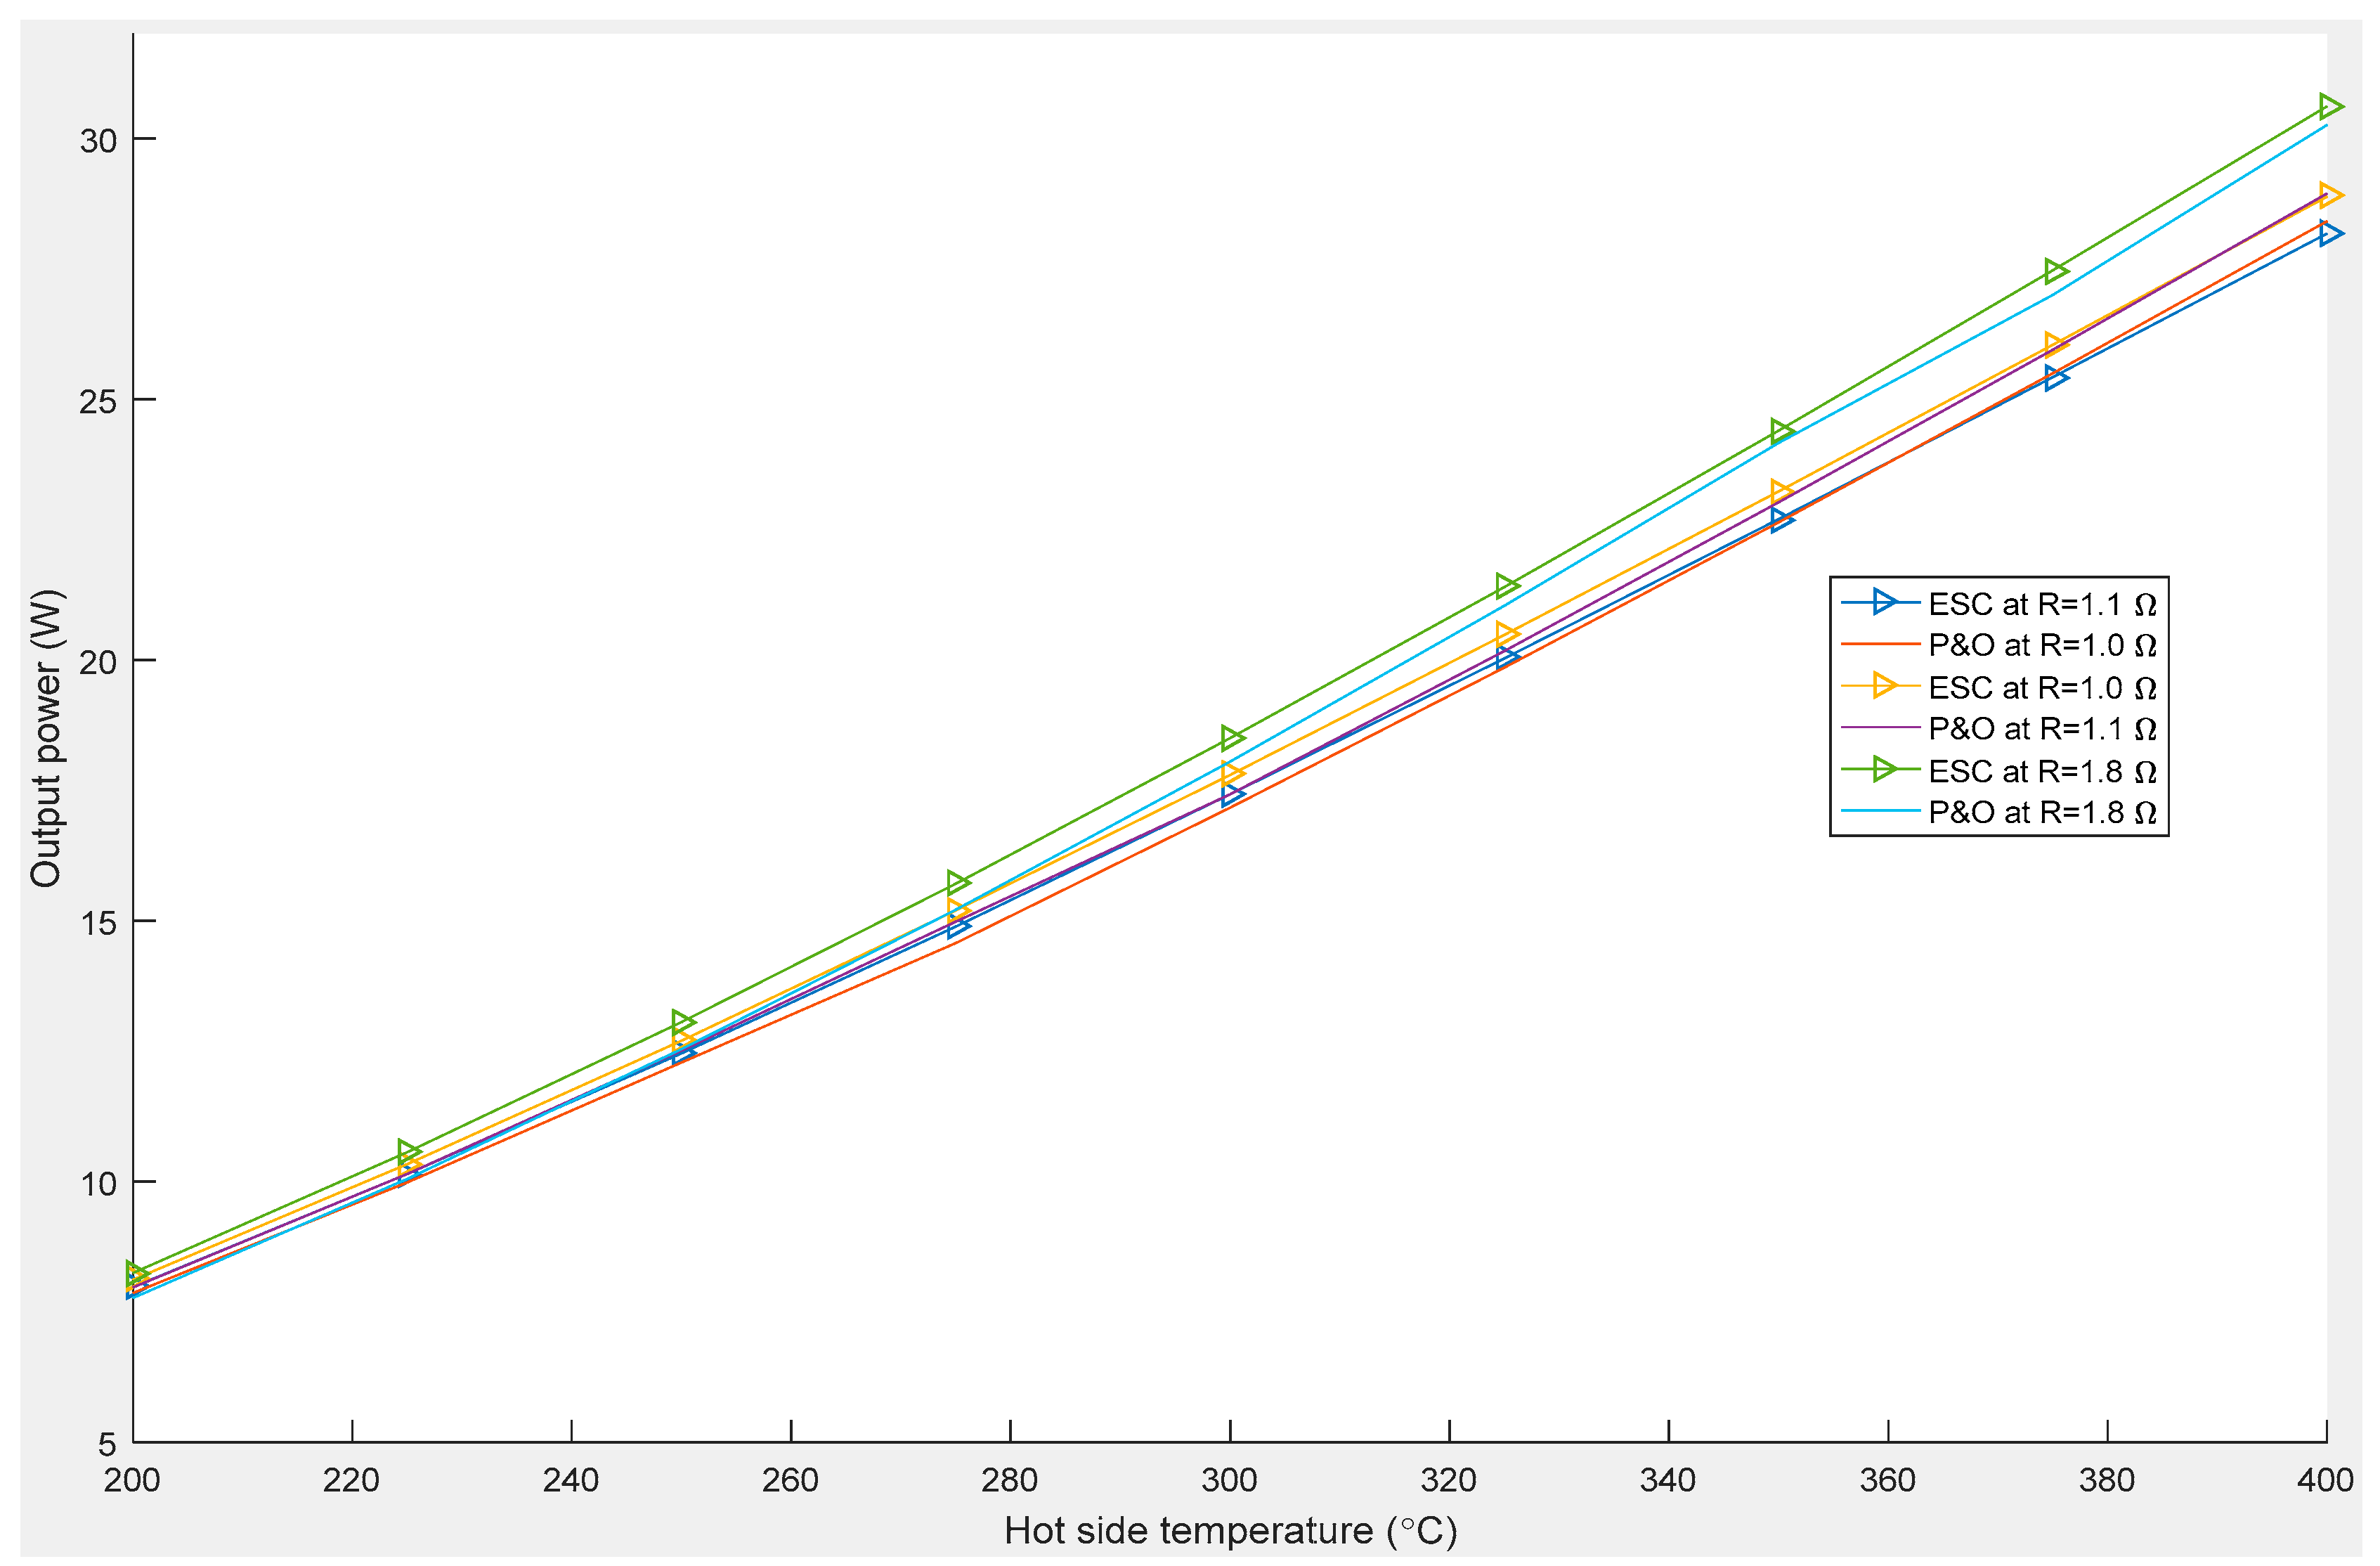
For a load range of 1.2 Ω–14 Ω, the output power difference is positive throughout, indicating that ESC method is better than the P&O method in terms of output power performance in this region. Faster increase in the output power difference is manifested after the optimum point (1.8 Ω). However, the difference generally degrades at 10 Ω load resistance. It is clearly observed from Figure 18 that the performance of ESC MPPT algorithm is better than that of P&O at the optimum point throughout the whole range of temperatures.
The percentage increase in the output power of the converter due to the application of ESC MPPT method is computed by taking the output power of the P&O method as the base case i.e., the output power of P&O (Pout) minus that of ESC divide by Pout times 100. It is indicated that the minimum and maximum percentage increase in Pout is 1.0% and 6.1% achieved at hot side temperatures of 200 °C and 350 °C respectively. It is therefore of no doubt that the ESC MPPT algorithm is better than P&O in extracting maximum power from TEG.
Another aspect of MPPT performance is the speed of computation of both methods. It is noted from the simulation that the ESC MPPT model takes 159.9 s to complete all the loops for the ranges of the simulated hot side temperatures and load resistances of 200–400 °C and 0–14 Ω, respectively. However, for the same simulation settings, the simulation of the P&O MPPT model is completed within a simulation time of 602.6 s, which is almost four times the time taken by the ESC MPPT algorithm. This implies that P&O algorithm is slower than the ESC technique. Based on the computation time, the ESC MPPT technique can be a better choice for fast speed applications than P&O method.
5. Conclusions
This study has proposed and implemented an MPPT control on TEG systems using an ESC algorithm. The MPPT is applied to guarantee maximum power extraction from the TEG system. The work has been carried out through modelling of TEG/dc-dc converter system using Matlab/Simulink. The effectiveness of ESC technique has been assessed by comparing the results with those of the P&O MPPT method under the same operating conditions. Two algorithms, ESC- and P&O-based MPPT techniques have been applied to control the converter so that the results are compared in terms of output voltage, power and speed of computation of the model. Results indicate that ESC MPPT method extracts more power than the P&O technique, whereby the output power of ESC MPPT is higher than that of P&O by 0.47 W or 6.1% at a temperature of 200 °C. It is also noted that the ESC MPPT-based model is almost fourfold faster than the P&O method. Hence, the ESC MPPT method outperforms the P&O technique. Because of its faster computation speed, it can be applied for online applications.
Acknowledgments
The first author acknowledges the Ph.D. scholarship from Islamic development bank.
Author Contributions
Ssennoga Twaha, Jie Zhu and Yuying Yan initiated the idea of the TEG/converter design. Ssennoga Twaha and Luqman Maraaba designed the TEG/converter with MPPT simulation model; Ssennoga Twaha, Kuo Huang and Bo Li analyzed the data; Ssennoga Twaha wrote the paper and Jie Zhu proofread the paper.
Conflicts of Interest
The authors declare no conflicts of interest.
References
- Savani, I.; Waage, M.H.; Børset, M.; Kjelstrup, S.; Wilhelmsen, Ø. Harnessing thermoelectric power from transient heat sources: Waste heat recovery from silicon production. Energy Convers. Manag. 2017, 138, 171–182. [Google Scholar] [CrossRef]
- Hajji, M.; Labrim, H.; Benaissa, M.; Laazizi, A.; Ez-Zahraouy, H.; Ntsoenzok, E.; Meot, J.; Benyoussef, A. Photovoltaic and thermoelectric indirect coupling for maximum solar energy exploitation. Energy Convers. Manag. 2017, 136, 184–191. [Google Scholar] [CrossRef]
- Suter, C.; Jovanovic, Z.R.; Steinfeld, A. A 1 kWe thermoelectric stack for geothermal power generation—Modeling and geometrical optimization. Appl. Energy 2012, 99, 379–385. [Google Scholar] [CrossRef]
- Hyland, M.; Hunter, H.; Liu, J.; Veety, E.; Vashaee, D. Wearable thermoelectric generators for human body heat harvesting. Appl. Energy 2016, 182, 518–524. [Google Scholar] [CrossRef]
- Montecucco, A.; Siviter, J.; Knox, A.R. Combined heat and power system for stoves with thermoelectric generators. Appl. Energy 2015, 185, 1336–1342. [Google Scholar] [CrossRef]
- Champier, D. Thermoelectric generators: A review of applications. Energy Convers. Manag. 2017, 140, 167–181. [Google Scholar] [CrossRef]
- Twaha, S.; Zhu, J.; Yan, Y.; Li, B. A comprehensive review of thermoelectric technology: Materials, applications, modelling and performance improvement. Renew. Sustain. Energy Rev. 2016, 65, 698–726. [Google Scholar] [CrossRef]
- Huang, K.; Li, B.; Twaha, S. Comprehensive Study on Novel Concentric Cylindrical Thermoelectric Power Generation System. Appl. Therm. Eng. 2016, 117, 501–510. [Google Scholar] [CrossRef]
- Flora, A.; Ngondi, N.; Lee, H.; Wee, D. Technical and economic analysis of thermoelectric modules with macroporous thermoelectric elements. Energy Convers. Manag. 2017, 135, 327–335. [Google Scholar]
- Huang, Y.X.; Wang, X.D.; Cheng, C.H.; Lin, D.T.W. Geometry optimization of thermoelectric coolers using simplified conjugate-gradient method. Energy 2013, 59, 689–697. [Google Scholar] [CrossRef]
- Lee, H.; Seshadri, R.C.; Han, S.J.; Sampath, S. TiO2−X based thermoelectric generators enabled by additive and layered manufacturing. Appl. Energy 2017, 192, 24–32. [Google Scholar] [CrossRef]
- Dunham, M.T.; Barako, M.T.; LeBlanc, S.; Asheghi, M.; Chen, B.; Goodson, K.E. Power density optimization for micro thermoelectric generators. Energy 2015, 93, 2006–2017. [Google Scholar] [CrossRef]
- Ramli, M.A.M.; Twaha, S.; Ishaque, K.; Al-Turki, Y.A. A review on maximum power point tracking for photovoltaic systems with and without shading conditions. Renew. Sustain. Energy Rev. 2017, 67, 144–159. [Google Scholar] [CrossRef]
- Yusop, A.M.; Mohamed, R.; Mohamed, A. Inverse dynamic analysis type of MPPT control strategy in a thermoelectric-solar hybrid energy harvesting system. Renew. Energy 2016, 86, 682–692. [Google Scholar] [CrossRef]
- Paraskevas, A.; Koutroulis, E. A simple maximum power point tracker for thermoelectric generators. Energy Convers. Manag. 2016, 108, 355–365. [Google Scholar] [CrossRef]
- Yu, C.; Chau, K.T. Thermoelectric automotive waste heat energy recovery using maximum power point tracking. Energy Convers. Manag. 2009, 50, 1506–1512. [Google Scholar] [CrossRef]
- Manikandan, S.; Kaushik, S.C. Thermodynamic studies and maximum power point tracking in thermoelectric generator-thermoelectric cooler combined system. Cryogenics 2015, 67, 52–62. [Google Scholar] [CrossRef]
- Twaha, S.; Zhu, J.; Yan, Y.; Li, B.; Huang, K. Performance analysis of thermoelectric generator using DC-DC converter with incremental conductance based maximum power point tracking. Energy Sustain. Dev. 2017, 37, 86–98. [Google Scholar] [CrossRef]
- Liu, Y.H.; Chiu, Y.H.; Huang, J.W.; Wang, S.C. A novel maximum power point tracker for thermoelectric generation system. Renew. Energy 2016, 97, 306–318. [Google Scholar] [CrossRef]
- Shi, Y.; Chen, X.; Deng, Y.; Gao, H.; Zhu, Z.; Ma, G.; Han, Y.; Hong, Y. Design and performance of compact thermoelectric generators based on the extended three-dimensional thermal contact interface. Energy Convers. Manag. 2015, 106, 110–117. [Google Scholar] [CrossRef]
- Bell, L.E. Cooling, heating, generating power, and recovering waste heat with thermoelectric systems. Science 2008, 321, 1457–1461. [Google Scholar] [CrossRef] [PubMed]
- Electropaedia, Battery and Energy Technologies. Available online: http://www.mpoweruk.com/thermoelectricity.htm (accessed on 13 March 2017).
- Al Maimani, M.; Black, J.J.; Aldous, L. Achieving pseudo-‘n-type p-type’ in-series and parallel liquid thermoelectrics using all-iron thermoelectrochemical cells with opposite Seebeck coefficients. Electrochem. Commun. 2016, 72, 181–185. [Google Scholar] [CrossRef]
- Yamashita, O. Resultant Seebeck coefficient formulated by combining the Thomson effect with the intrinsic Seebeck coefficient of a thermoelectric element. Energy Convers. Manag. 2009, 50, 2394–2399. [Google Scholar] [CrossRef]
- Oh, J.; Yoo, H.; Choi, J.; Kim, J.Y.; Lee, D.S.; Lee, J.; Kim, W.N.; Grossman, J.C.; Park, M.; Kim, J.K.; et al. Significantly reduced thermal conductivity and enhanced thermoelectric properties of single- and bi-layer graphene nanomeshes with sub-10 nm neck-width. Nano Energy 2016, 35, 26–35. [Google Scholar] [CrossRef]
- Li, W.; Paul, M.C.; Siviter, J.; Montecucco, A.; Knox, A.R.; Sweet, T.; Min, G.; Baig, H.; Mallick, T.K.; Han, G.; et al. Thermal performance of two heat exchangers for thermoelectric generators. Case Stud. Therm. Eng. 2016, 8, 164–175. [Google Scholar] [CrossRef]
- Meng, J.-H.; Wang, X.-D.; Chen, W.-H. Performance investigation and design optimization of a thermoelectric generator applied in automobile exhaust waste heat recovery. Energy Convers. Manag. 2016, 120, 71–80. [Google Scholar] [CrossRef]
- Lv, S.; He, W.; Wang, L.; Li, G.; Ji, J.; Chen, H.; Zhang, G. Design, fabrication and feasibility analysis of a thermo-electric wearable helmet. Appl. Therm. Eng. 2016, 109, 138–146. [Google Scholar] [CrossRef]
- Ishaque, K.; Salam, Z.; Lauss, G. The performance of perturb and observe and incremental conductance maximum power point tracking method under dynamic weather conditions. Appl. Energy 2014, 119, 228–236. [Google Scholar] [CrossRef]
- Lei, P.; Li, Y.; Seem, J.E. Sequential ESC-Based Global MPPT Control for Photovoltaic Array With Variable Shading. IEEE Trans. Sustain. Energy 2011, 2, 348–358. [Google Scholar]
- Heydari-doostabad, H.; Keypour, R.; Reza, M. A new approach in MPPT for photovoltaic array based on Extremum Seeking Control under uniform and non-uniform irradiances. Sol. Energy 2013, 94, 28–36. [Google Scholar] [CrossRef]
- Biagi, E.; Pasetti, G.; Tinfena, F.; Serventi, R.; Fanucci, L. A High Voltage High Power high frequency Boost/Flyback DC-DC converter for automotive applications. In Proceedings of the 2012 International Symposium on Power Electronics, Electrical Drives, Automation and Motion (SPEEDAM), Sorrento, Italy, 20–22 June 2012; pp. 1166–1171. [Google Scholar]
- Hunnekens, B.G.B.; Haring, M.A.M.; van de Wouw, N.; Nijmeijer, H. A dither-free extremum-seeking control approach using 1st-order least-squares fits for gradient estimation. In Proceedings of the IEEE 53rd Annual Conference on Decision and Control (CDC), Los Angeles, CA, USA, 15–17 December 2014; pp. 2679–2684. [Google Scholar]
- Malek, H. Extremum Seeking Control (ESC) for Maximum Power Point Tracking (MPPT) of Photo-Voltaic System. 2016. Available online: Https://uk.mathworks.com/matlabcentral/fileexchange/56545-extremum-seeking-control--esc--for-maximum-power-point-tracking--mppt--of-photo-voltaic-system (accessed on 22 January 2017).
- Malek, H.; Dadras, S.; Chen, Y. Performance analysis of fractional order extremum seeking control. ISA Trans. 2016, 63, 281–287. [Google Scholar] [CrossRef] [PubMed]
- Li, M. Thermoelectric-Generator-Based DC-DC Conversion Network for Automotive Applications. J. Electron. Mater. 2011, 40, 1136–1143. [Google Scholar] [CrossRef]
- Ishaque, K.; Salam, Z. A review of maximum power point tracking techniques of PV system for uniform insolation and partial shading condition. Renew. Sustain. Energy Rev. 2013, 19, 475–488. [Google Scholar] [CrossRef]
- Ahmed, J.; Salam, Z. An improved perturb and observe (P & O) maximum power point tracking (MPPT) algorithm for higher efficiency. Appl. Energy 2015, 150, 97–108. [Google Scholar]
- Twaha, S.; Zhu, J.; Li, B.; Yan, Y.; Huang, K. Parameter analysis of thermoelectric generator/DC-DC converter system with maximum power point tracking. Energy Sustain. Dev. 2017, 41, 49–60. [Google Scholar] [CrossRef]
Figure 1.
Principle of operation of a thermoelectric generator: part (c) is modified from [22].
Figure 1.
Principle of operation of a thermoelectric generator: part (c) is modified from [22].


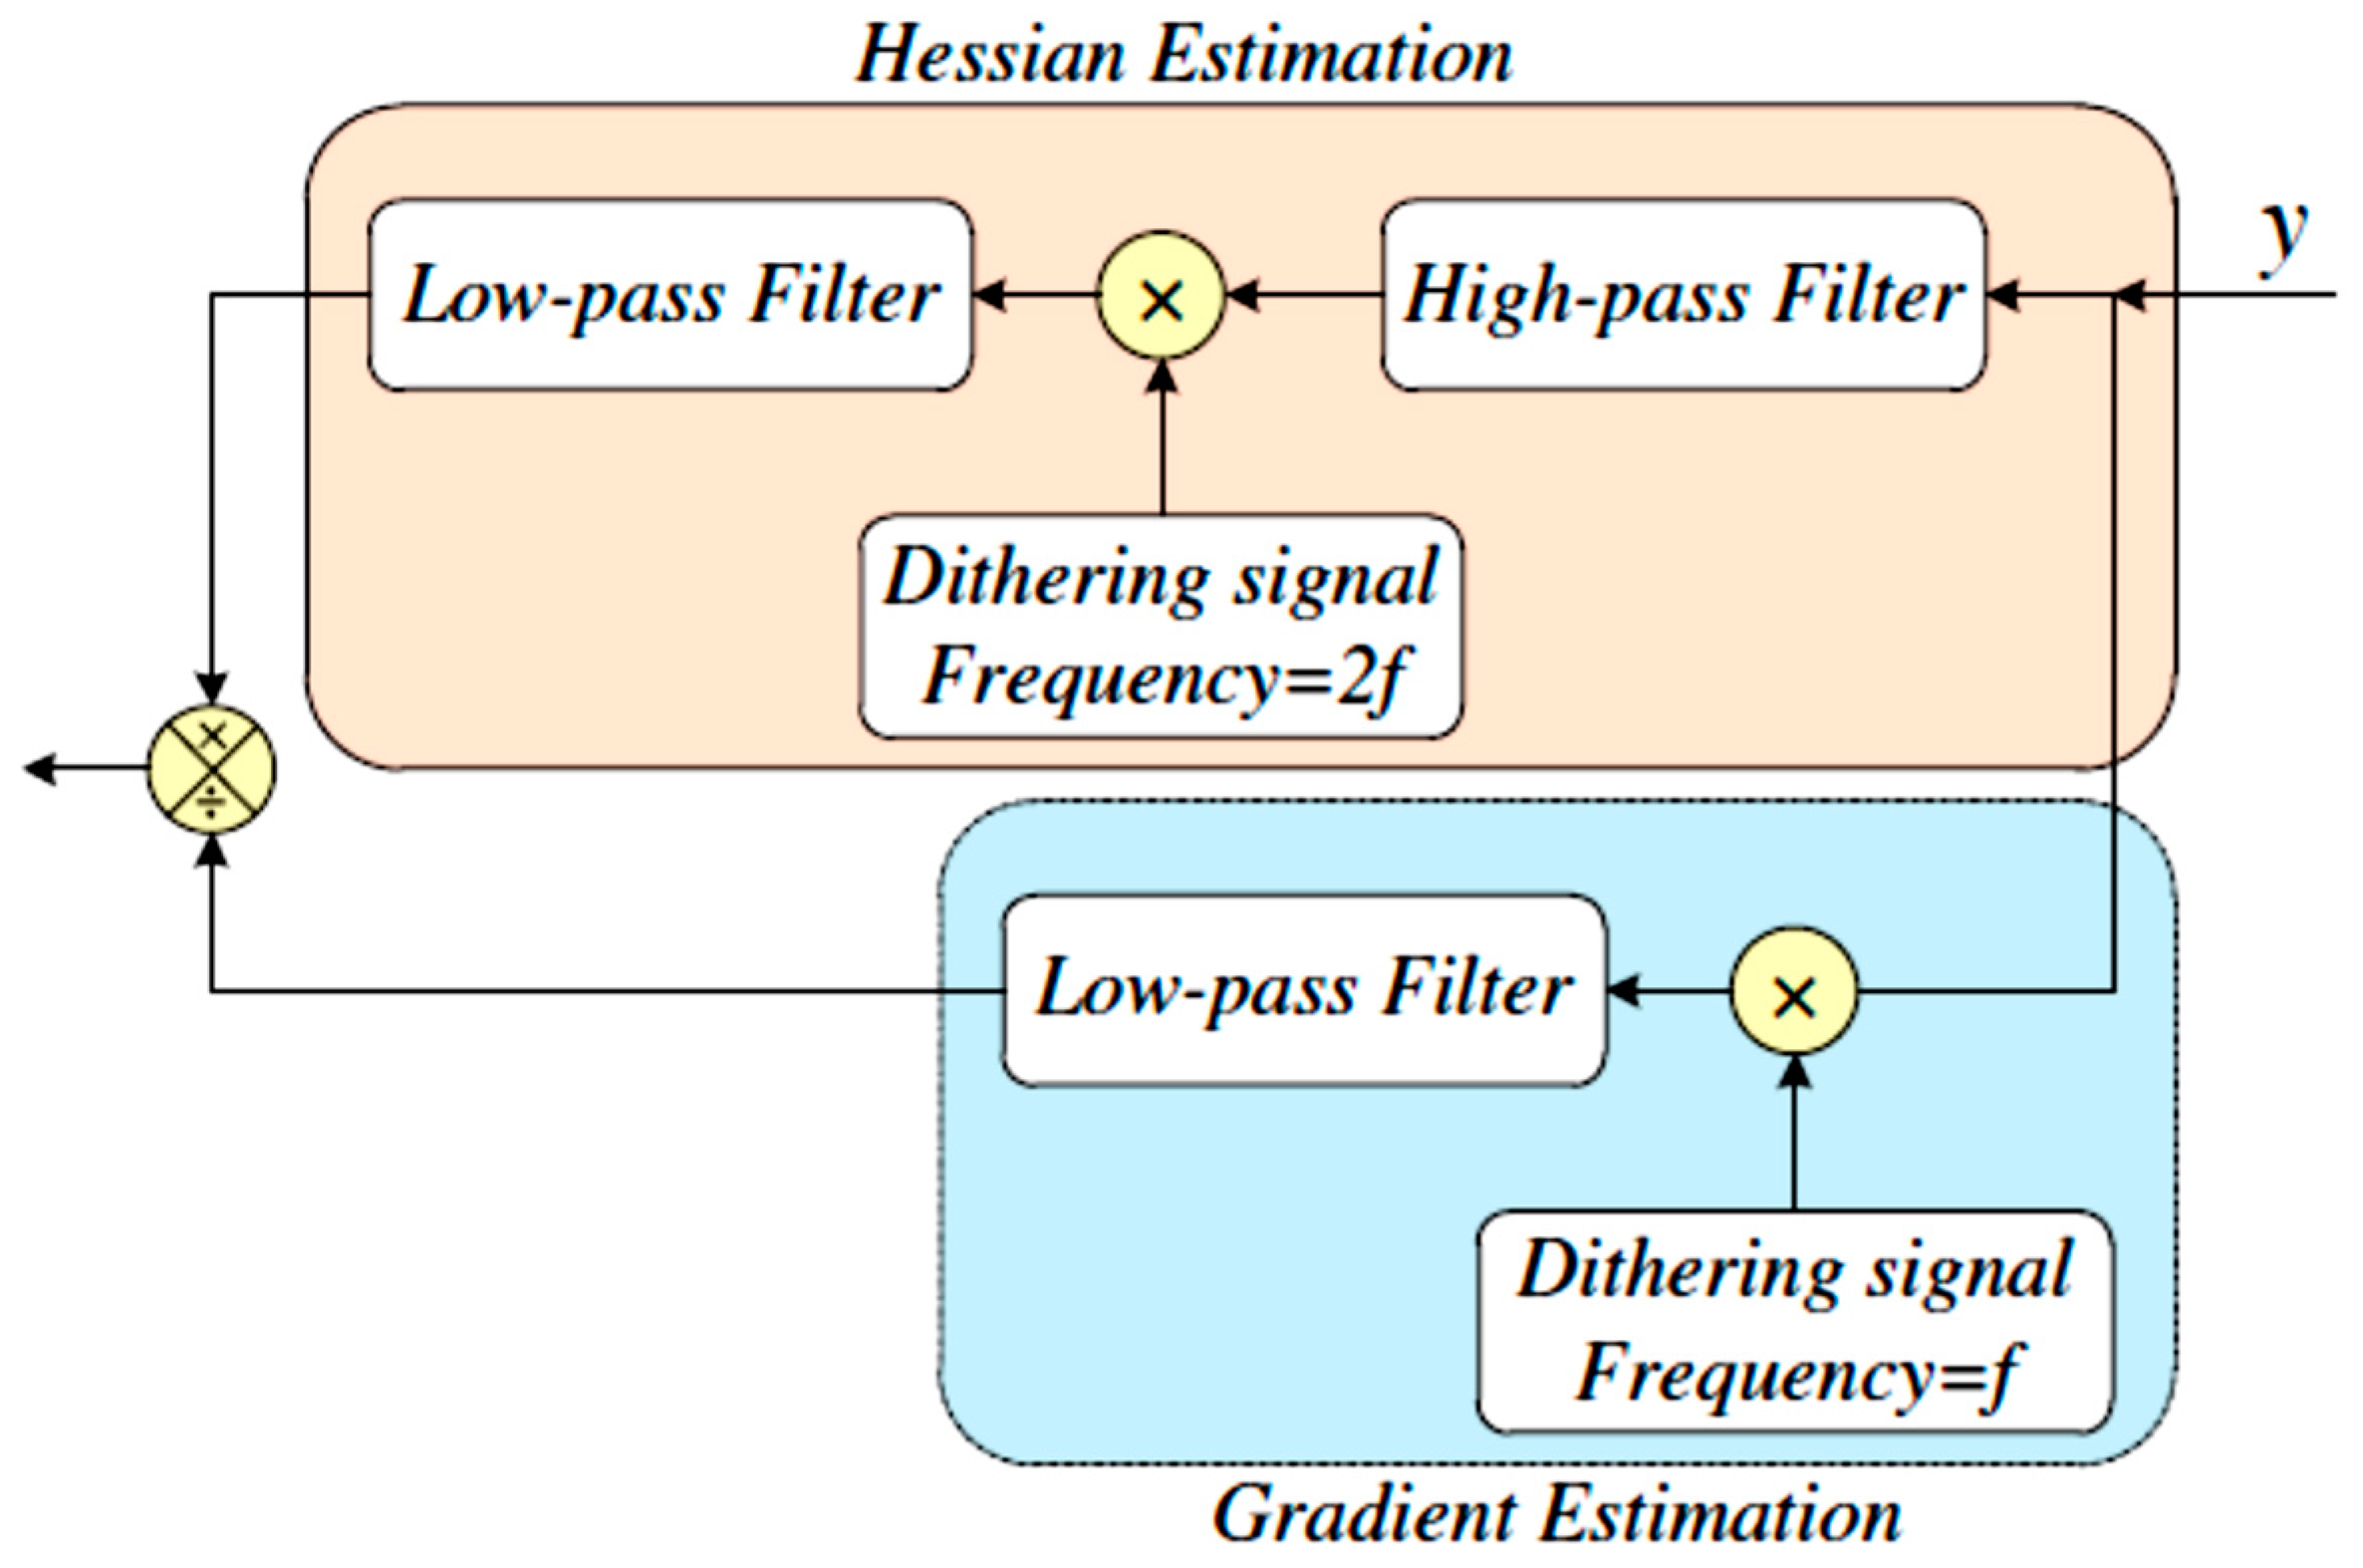
Figure 4.
The block diagram of the applied ESC circuit.
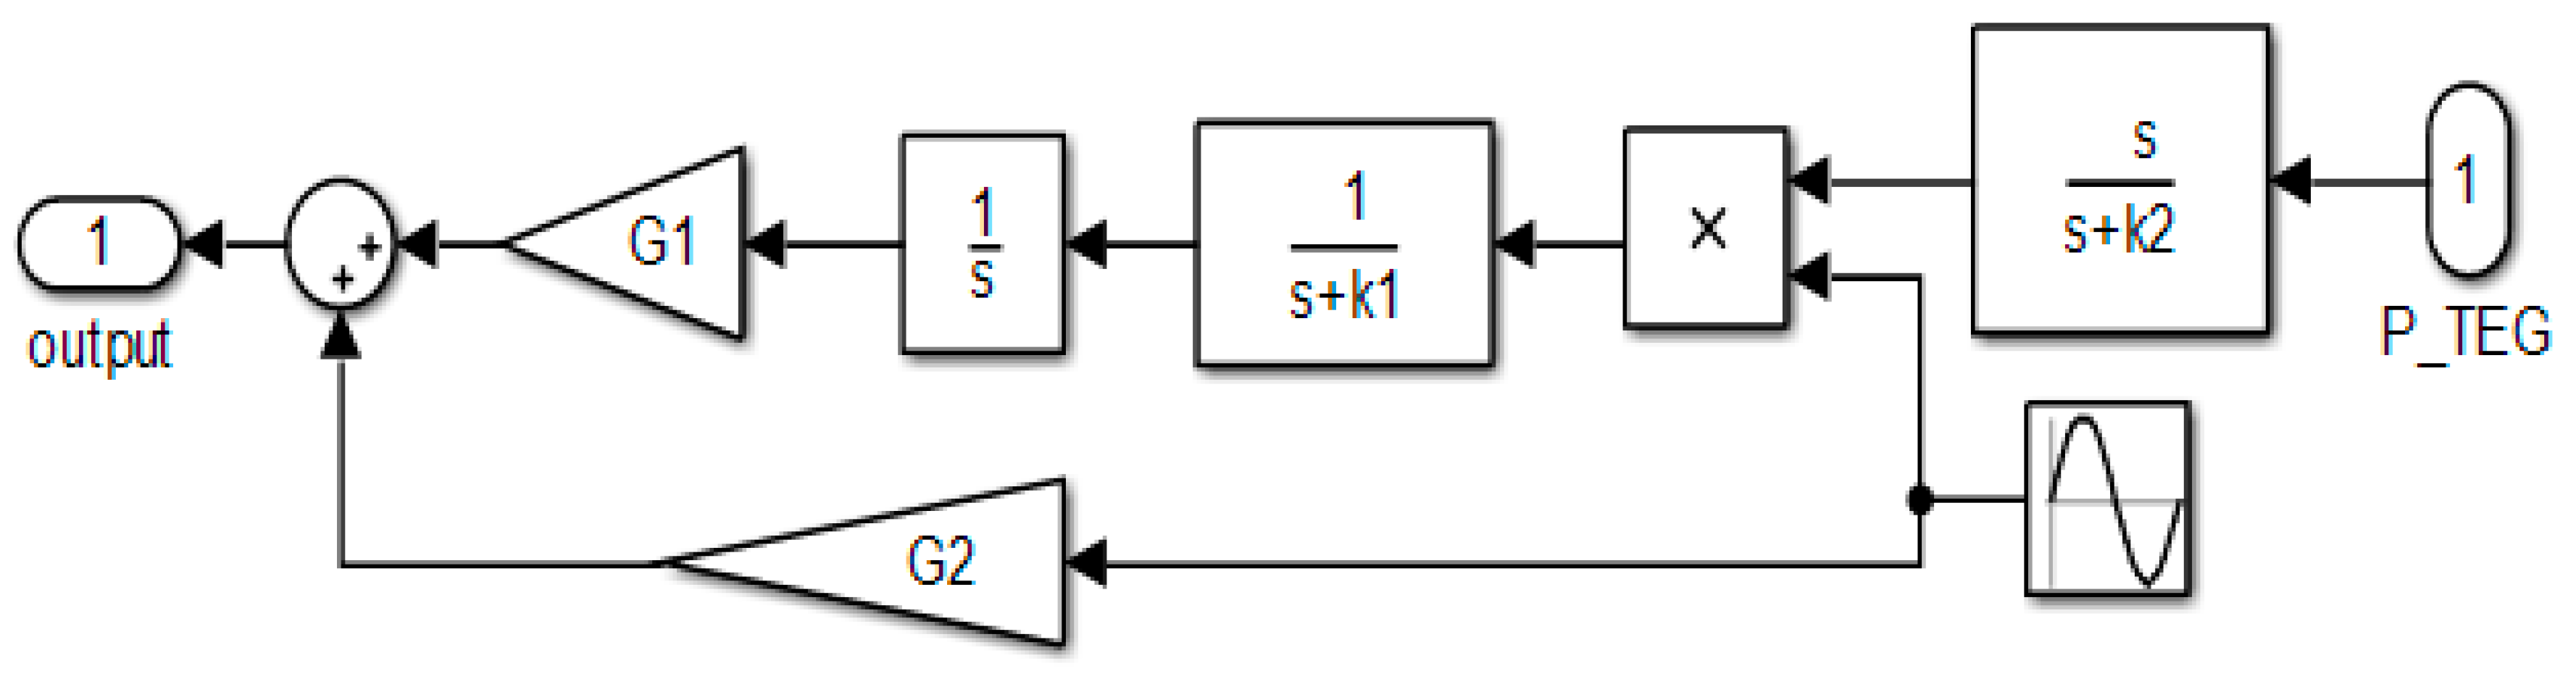
Figure 5.
Block diagram of TEG/dc-dc converter system with ESC MPPT.
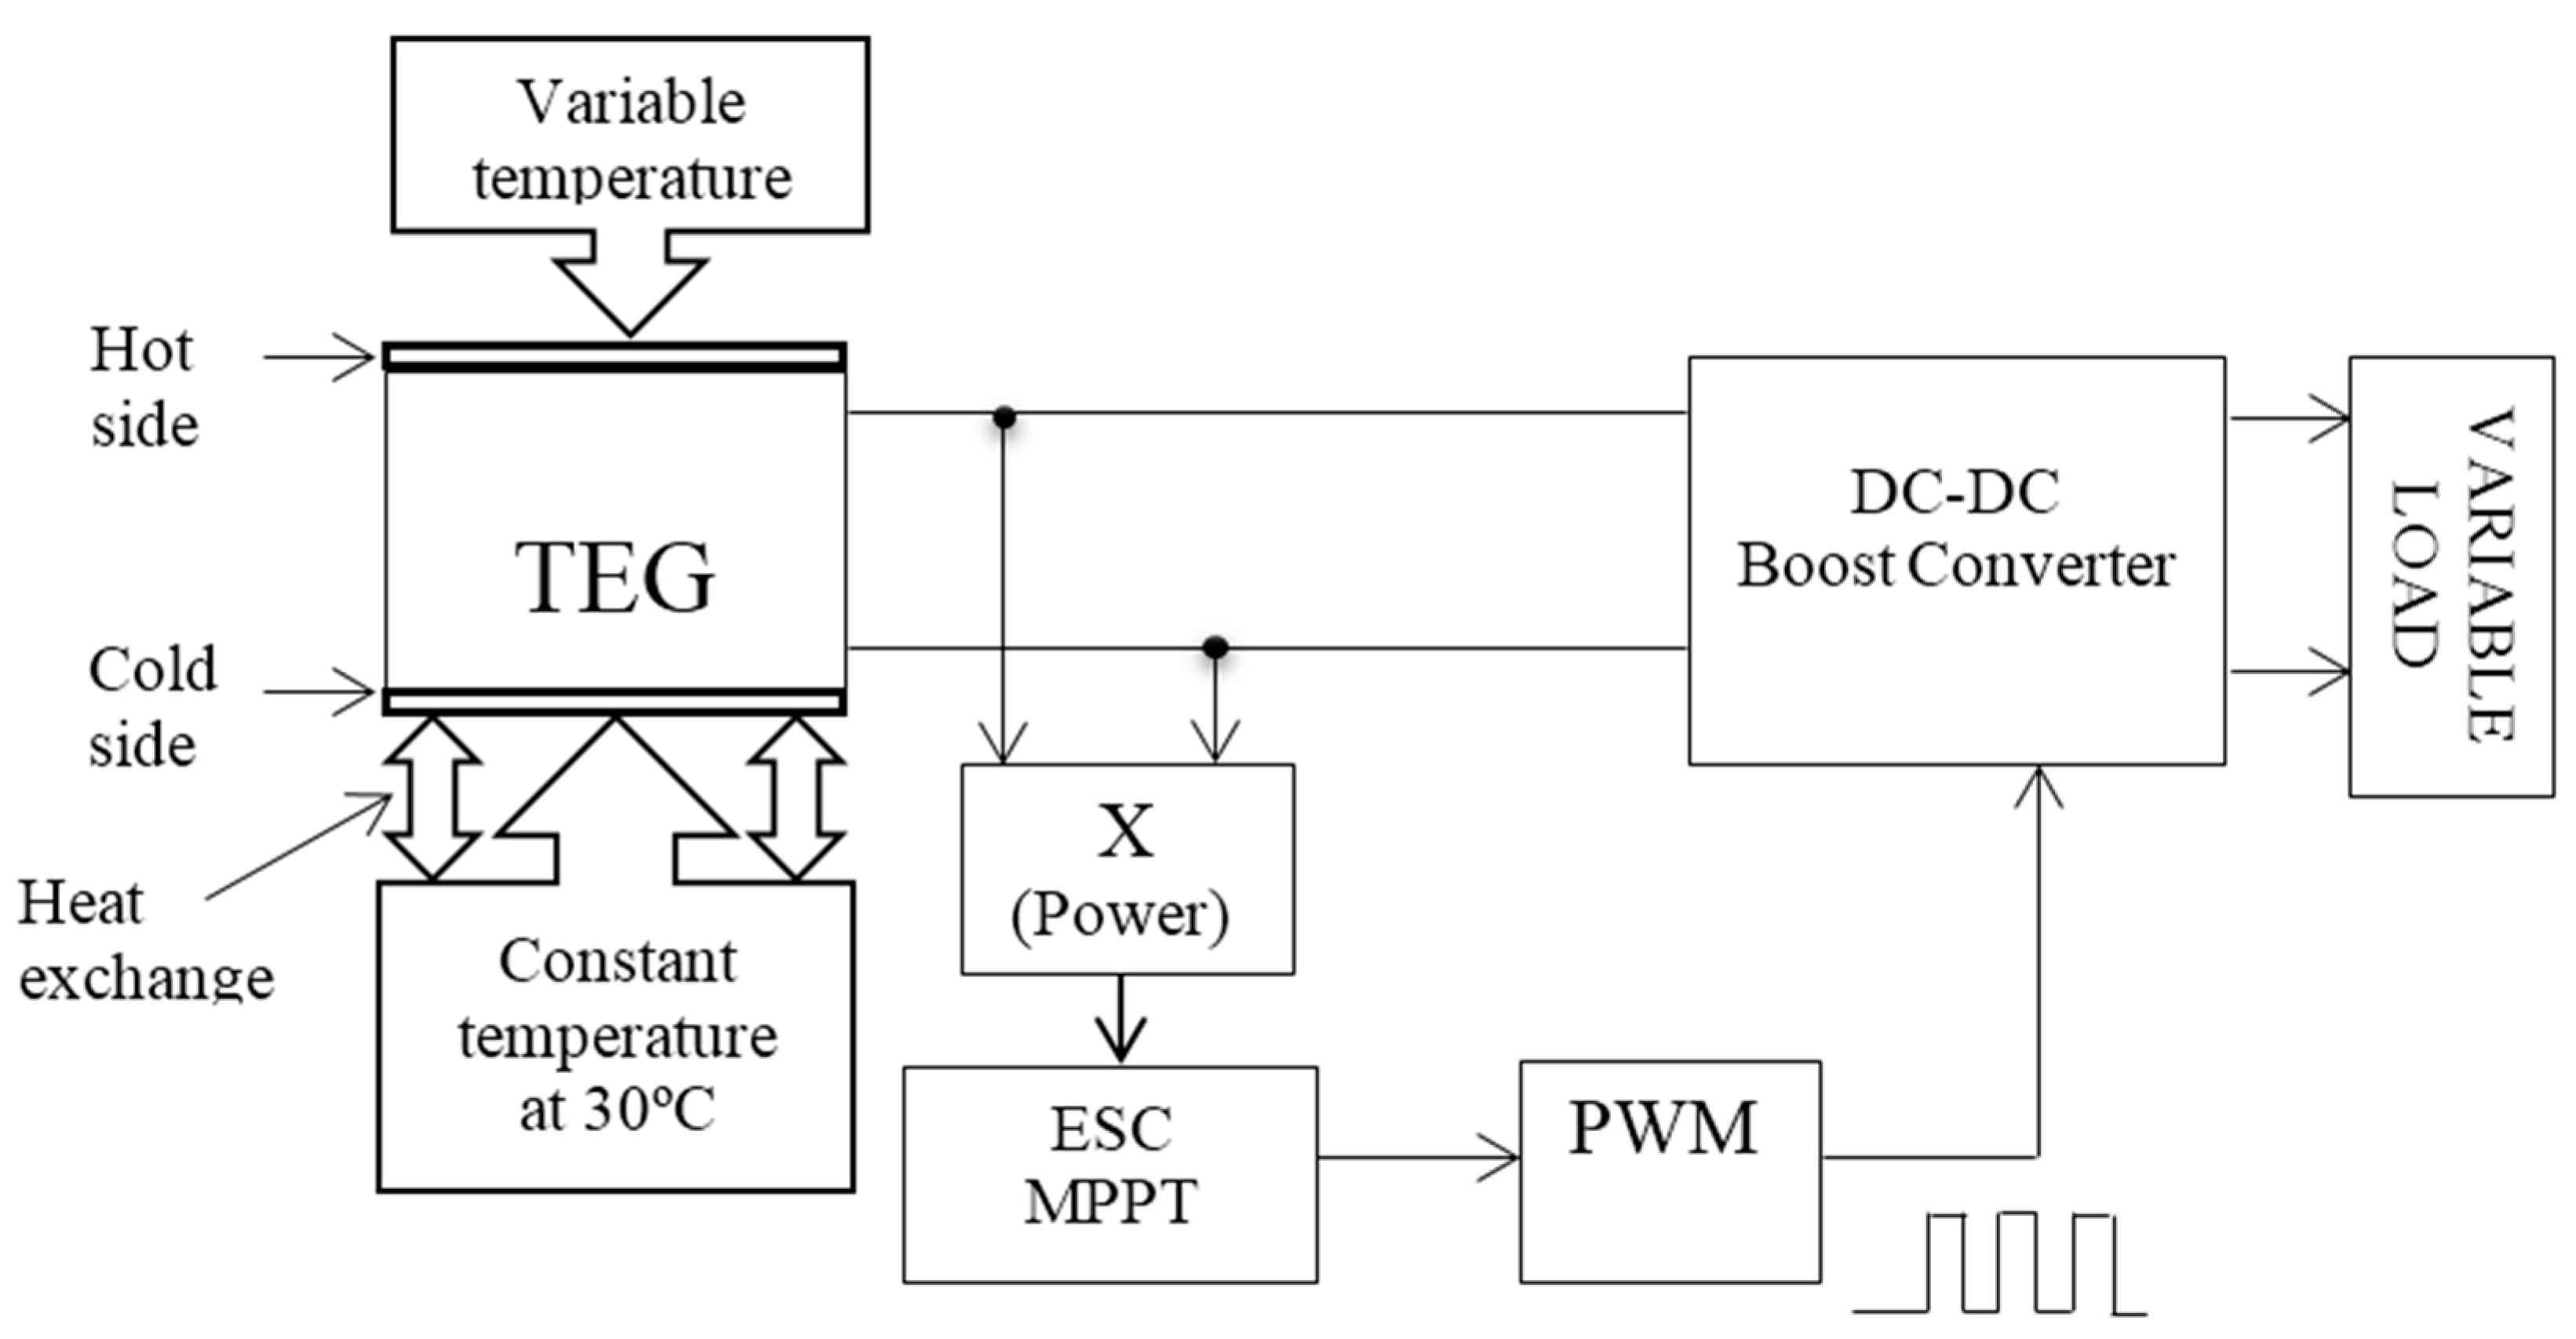
Figure 6.
Flow chart of the conventional Perturb and Observe (P&O) method [37].
Figure 6.
Flow chart of the conventional Perturb and Observe (P&O) method [37].

Figure 7.
Block diagram of TEG/dc-dc converter system with P&O MPPT.

Figure 8.
The Simulink model of TEG/dc-dc boost converter system.
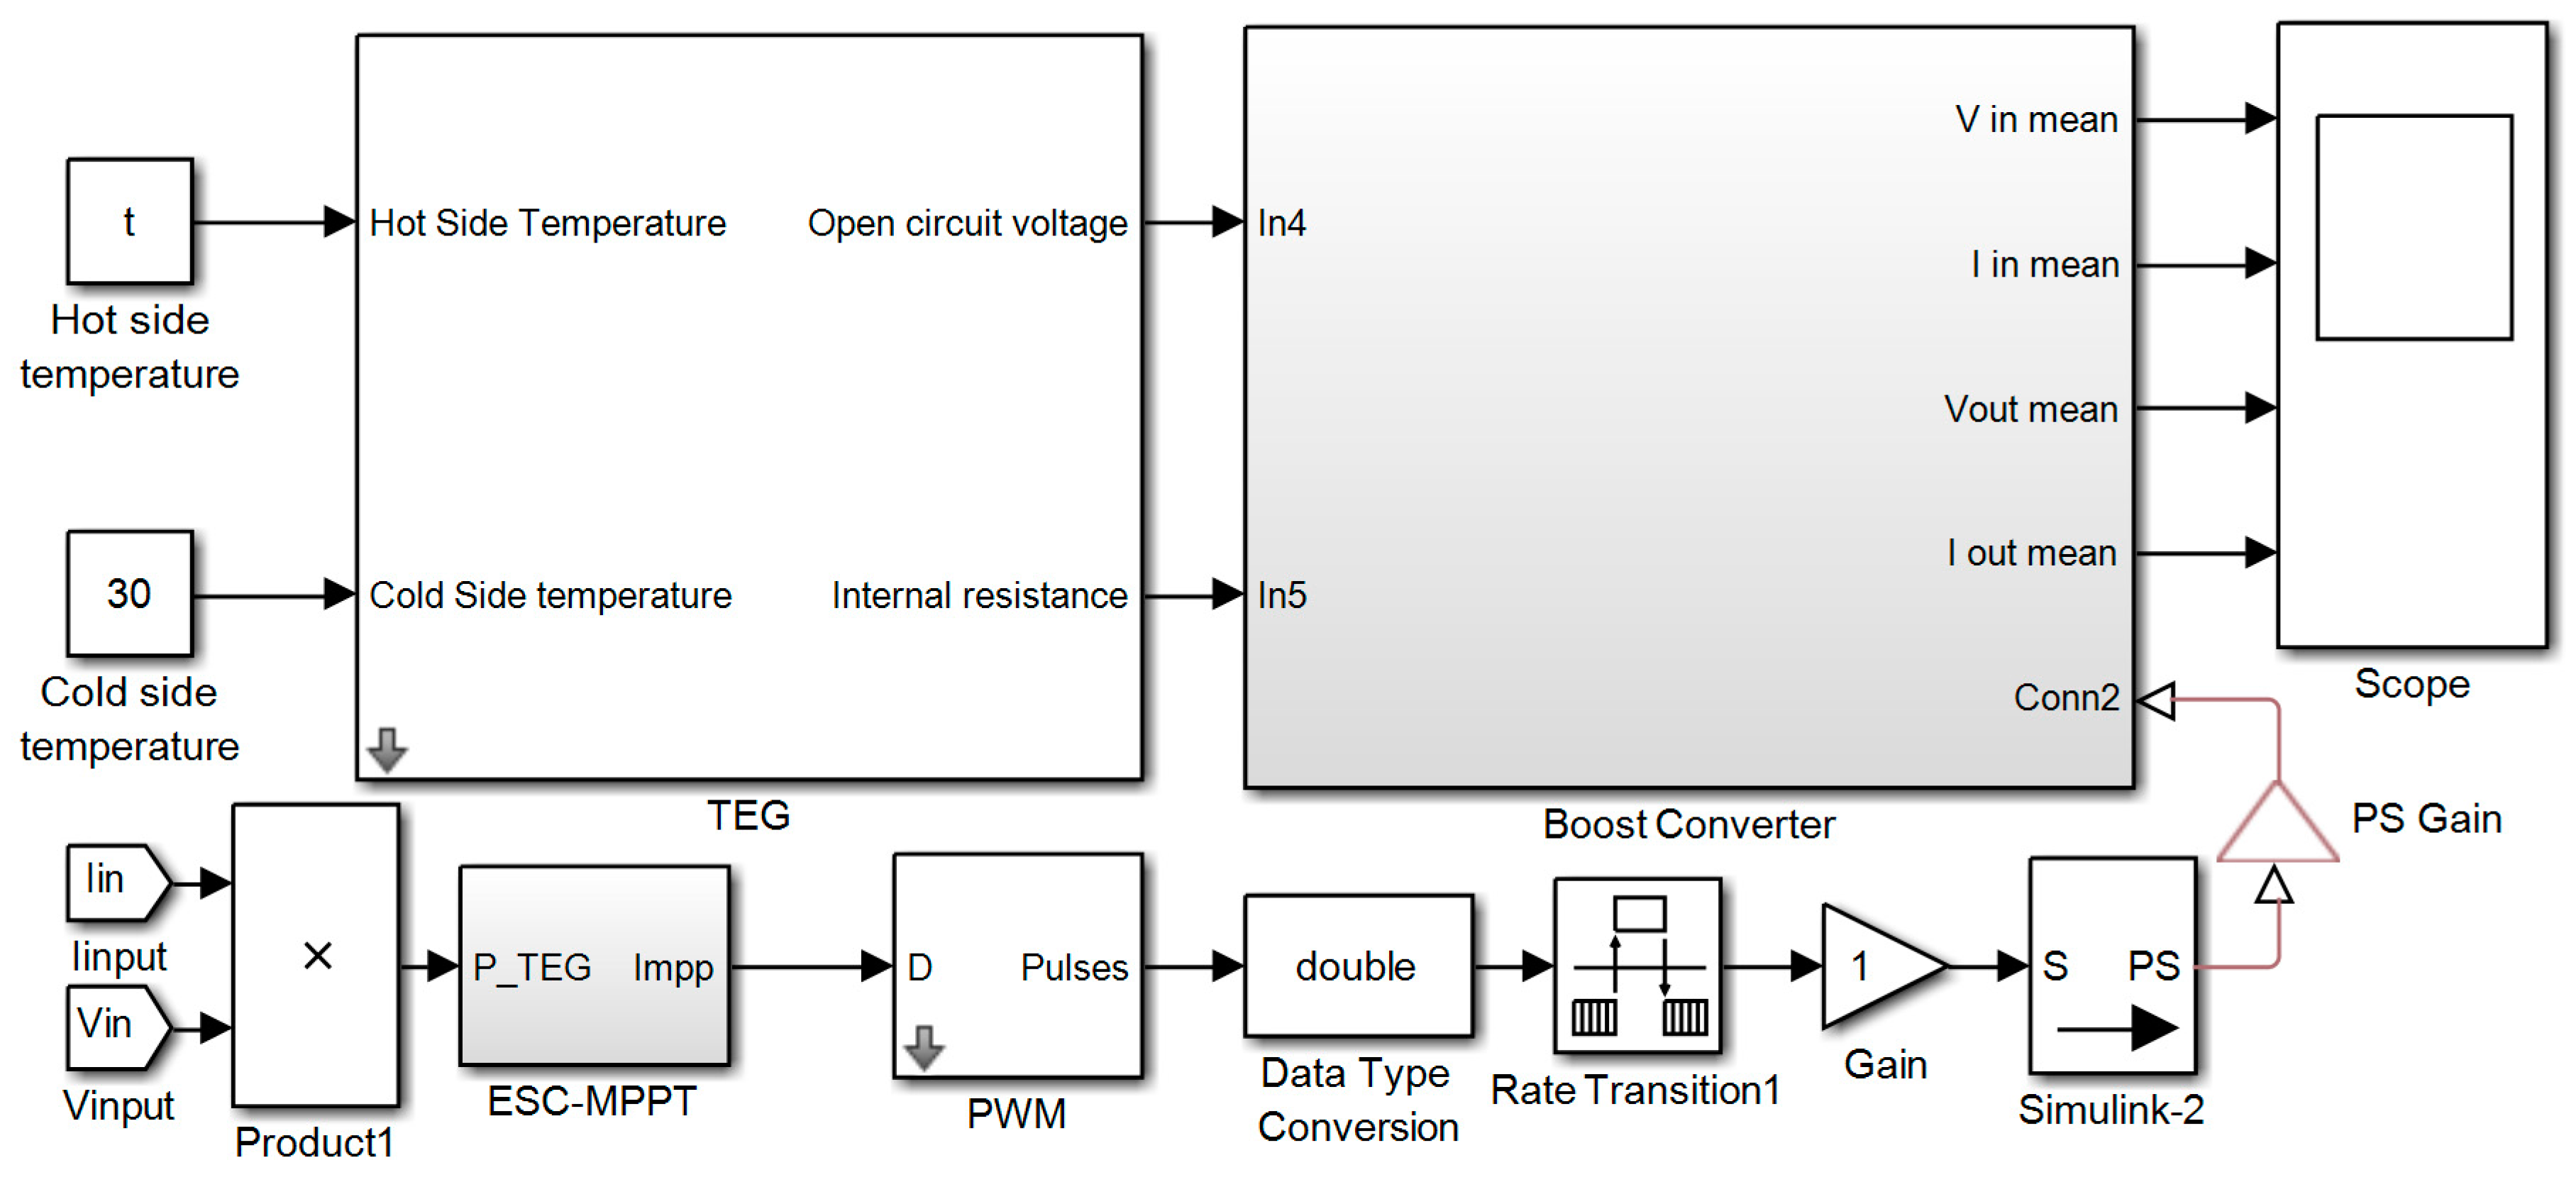
Figure 9.
P&O block.
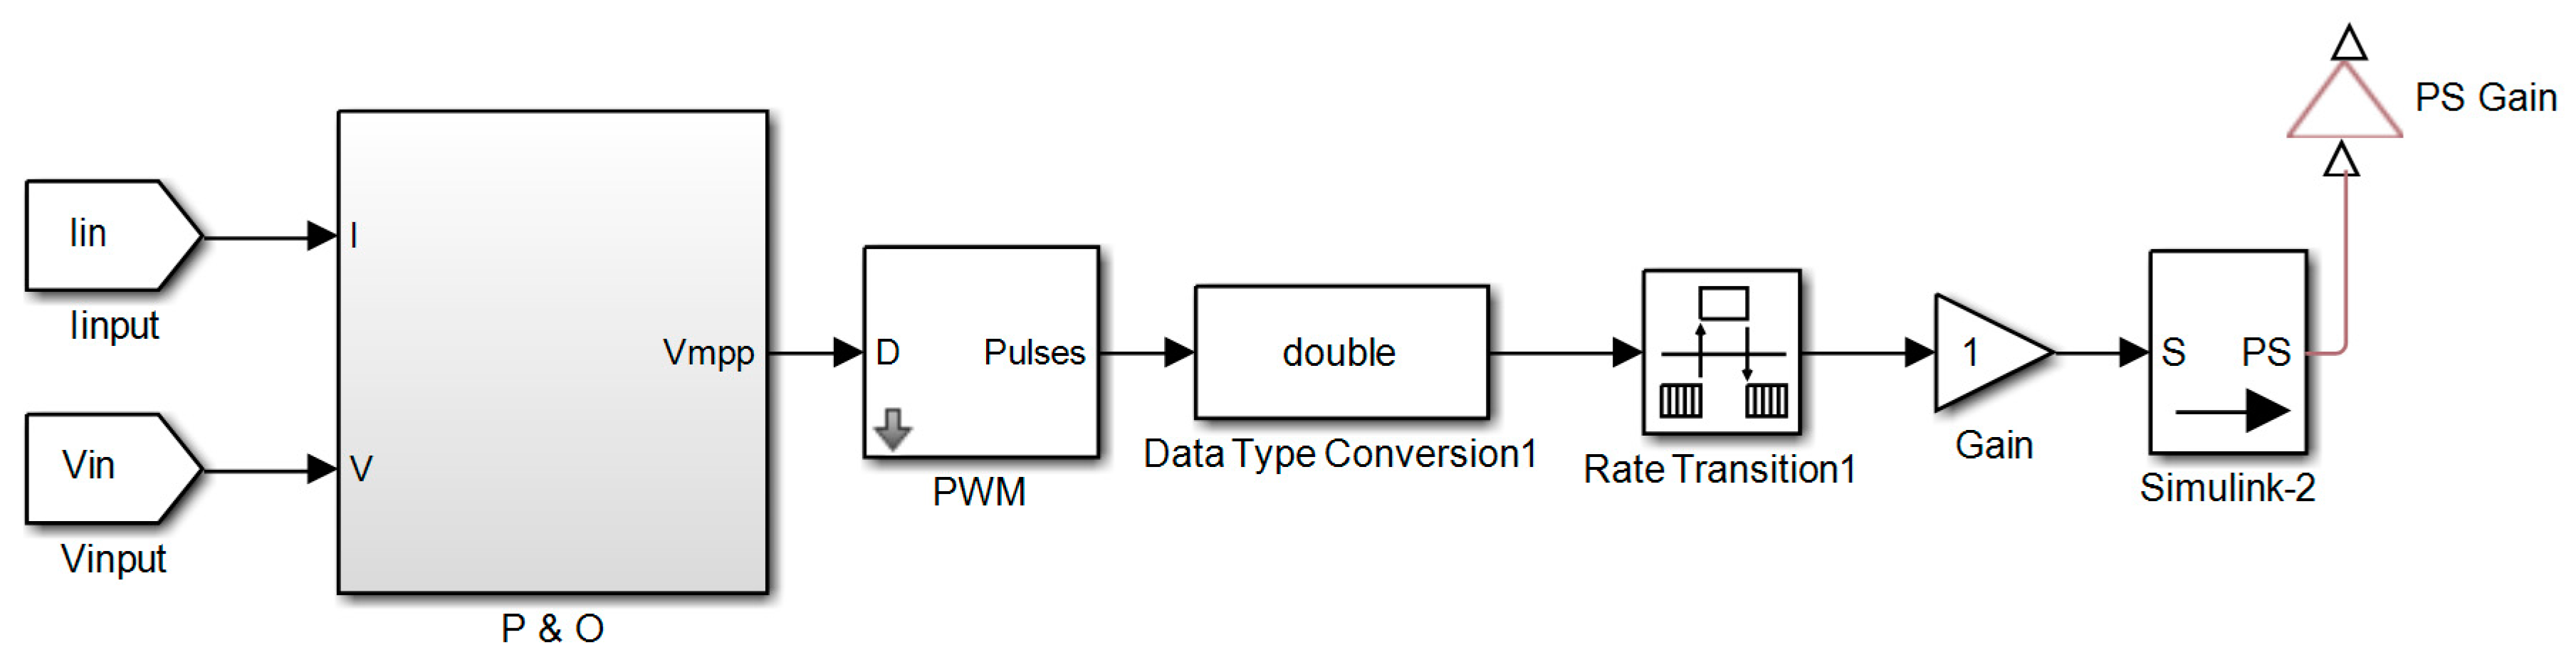
Figure 10.
The simulated boost converter circuit.
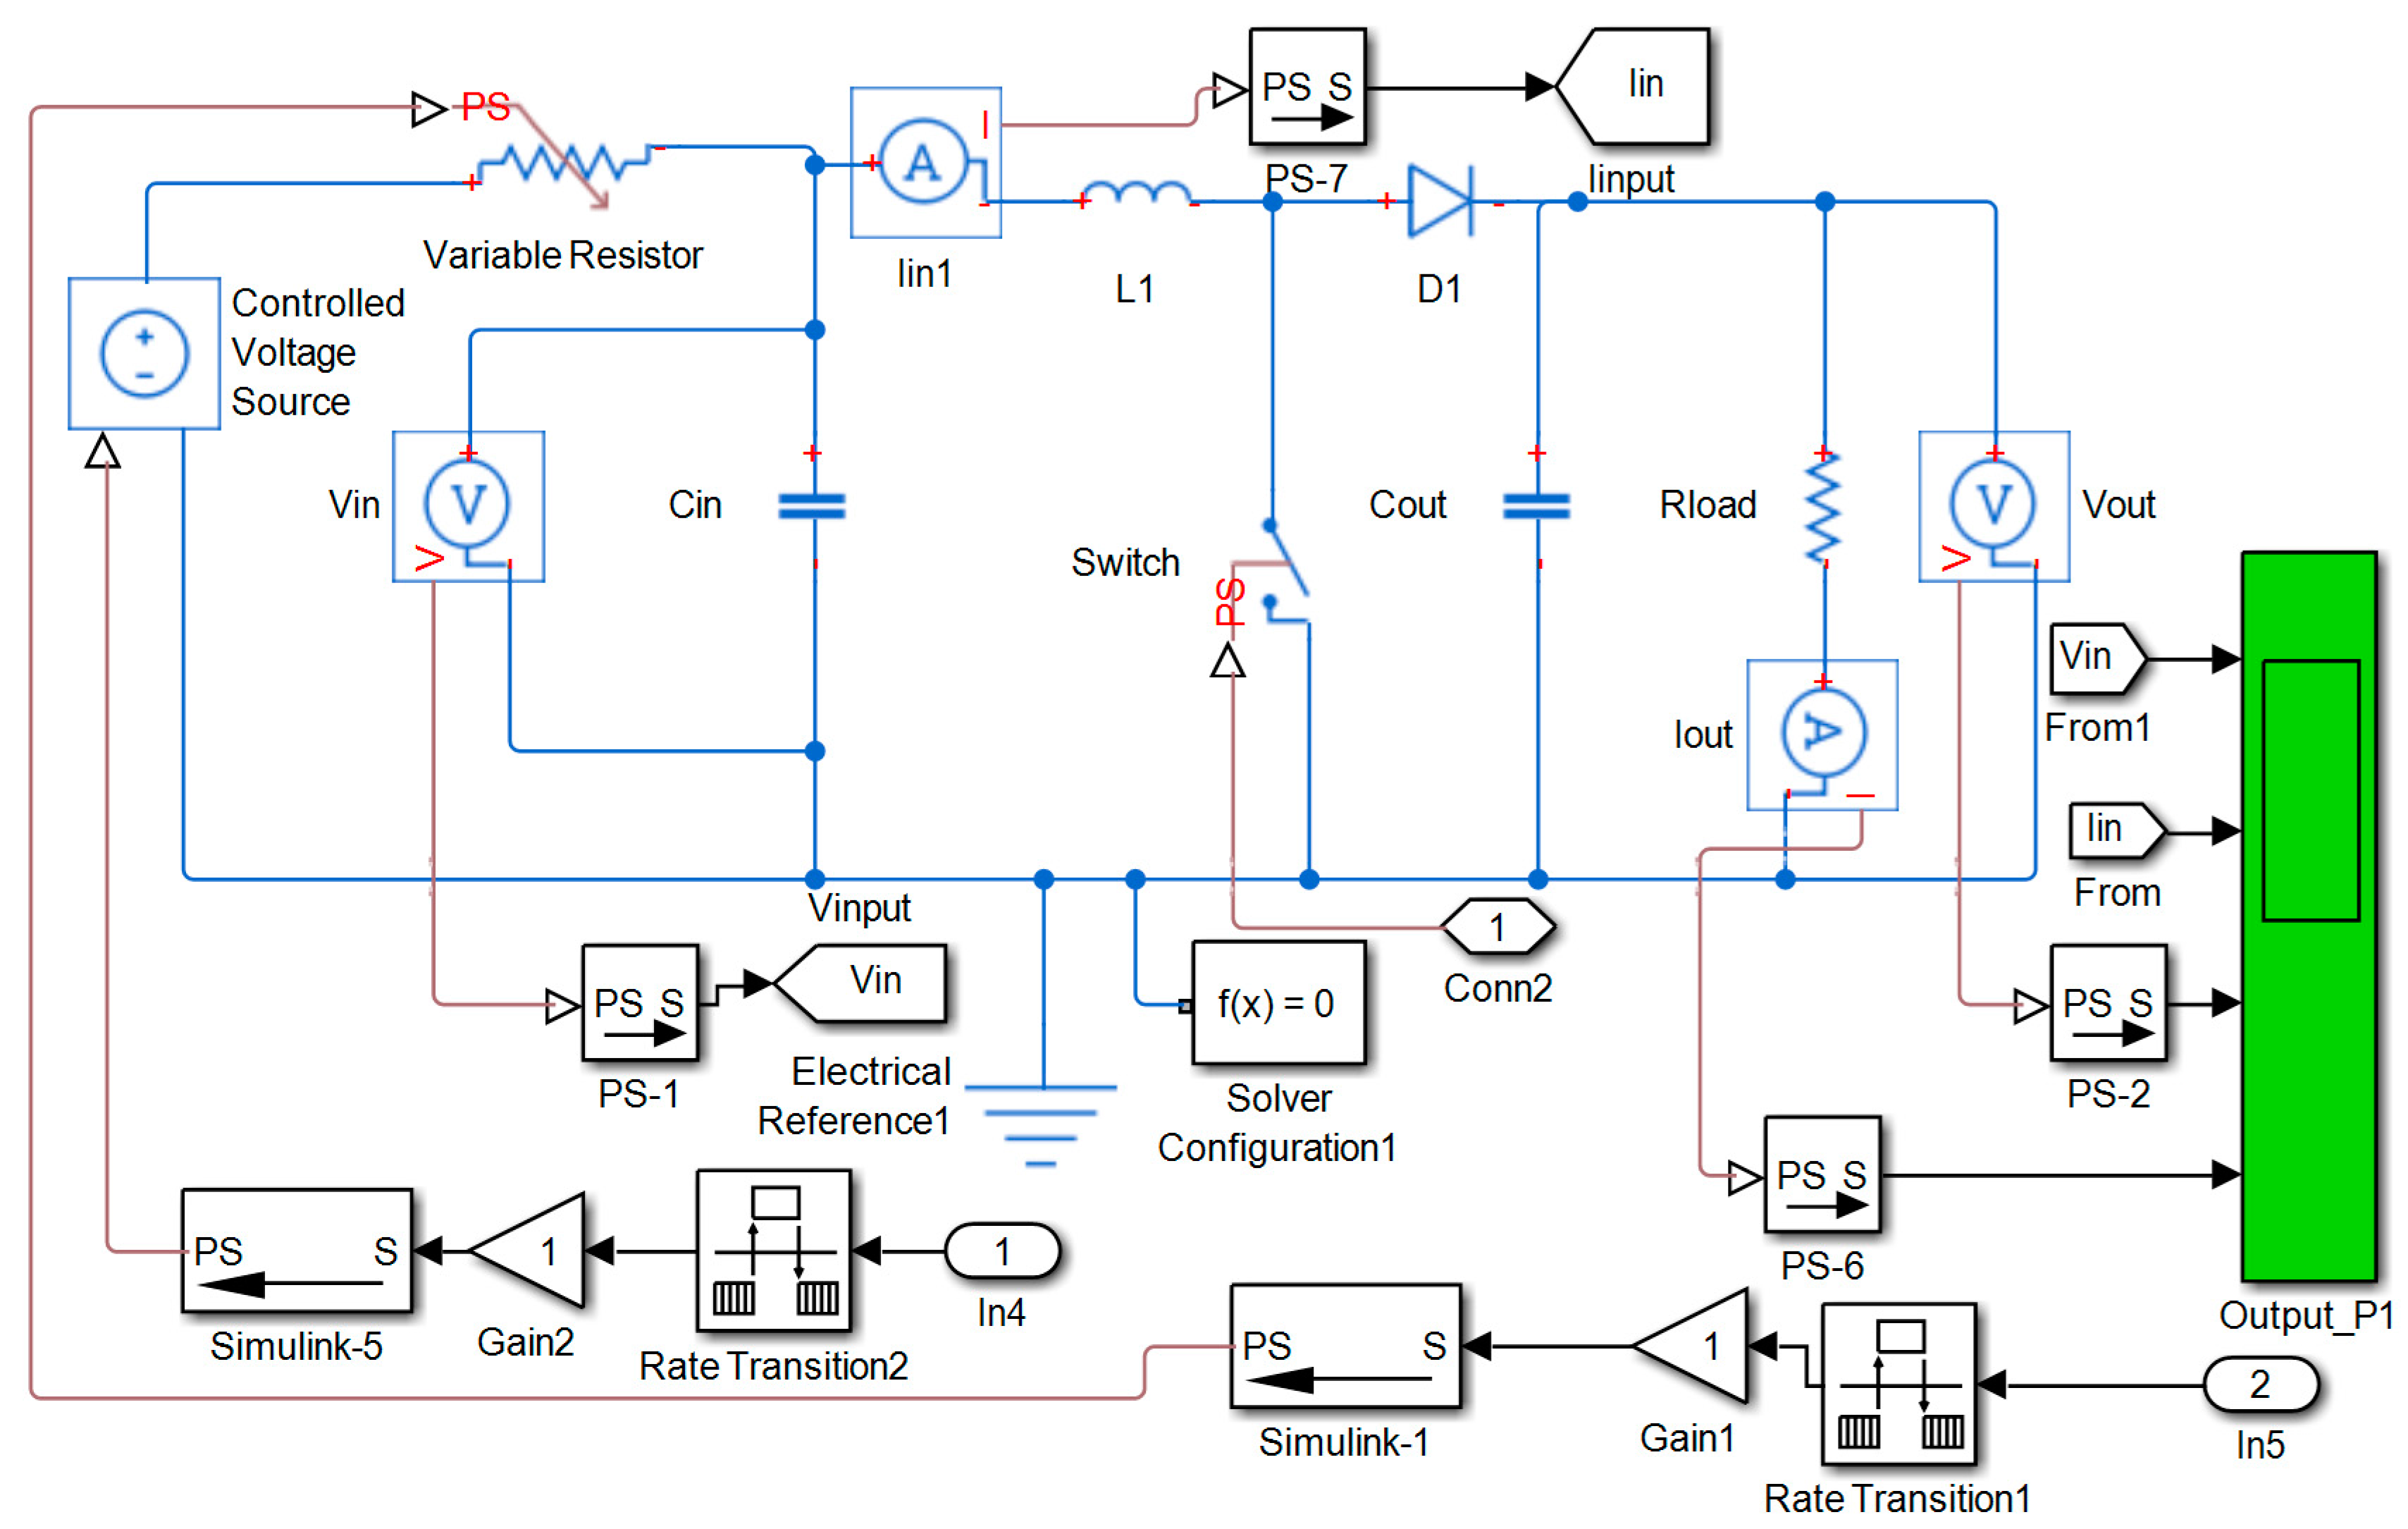
Figure 11.
The output voltages of the ESC MPPT model for a single TEG.
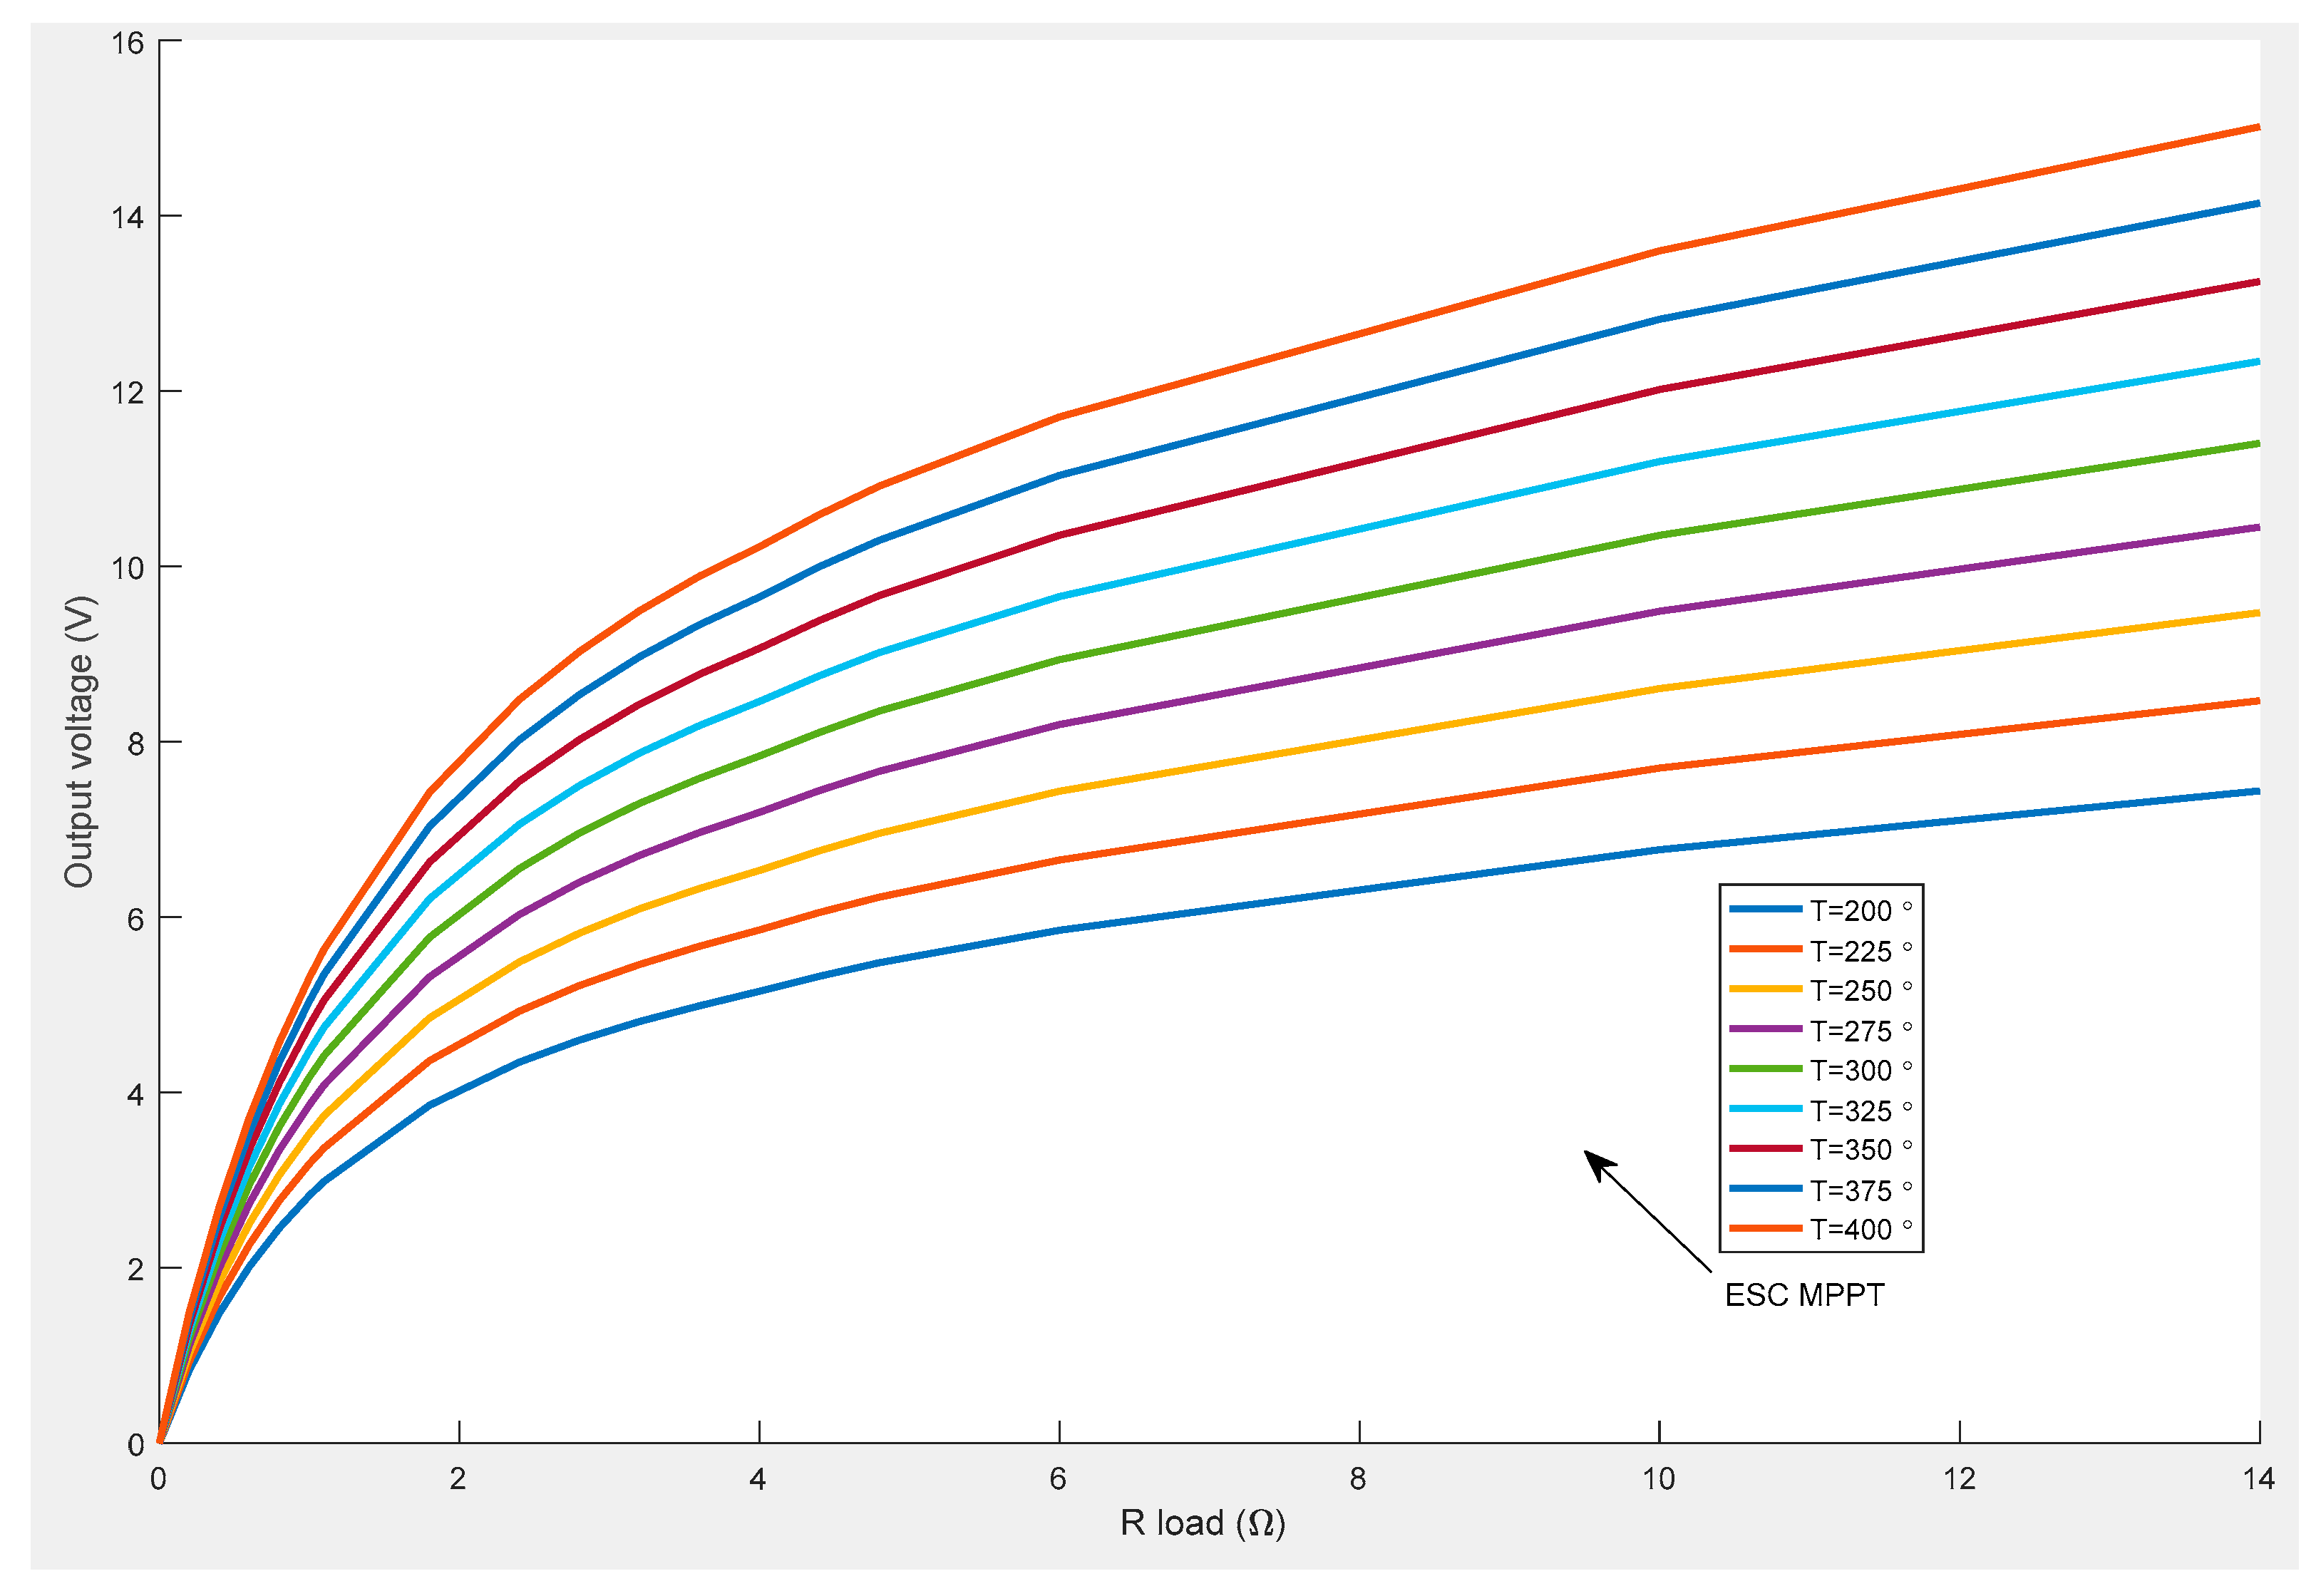
Figure 12.
The output power of the ESC based model for a single TEG.
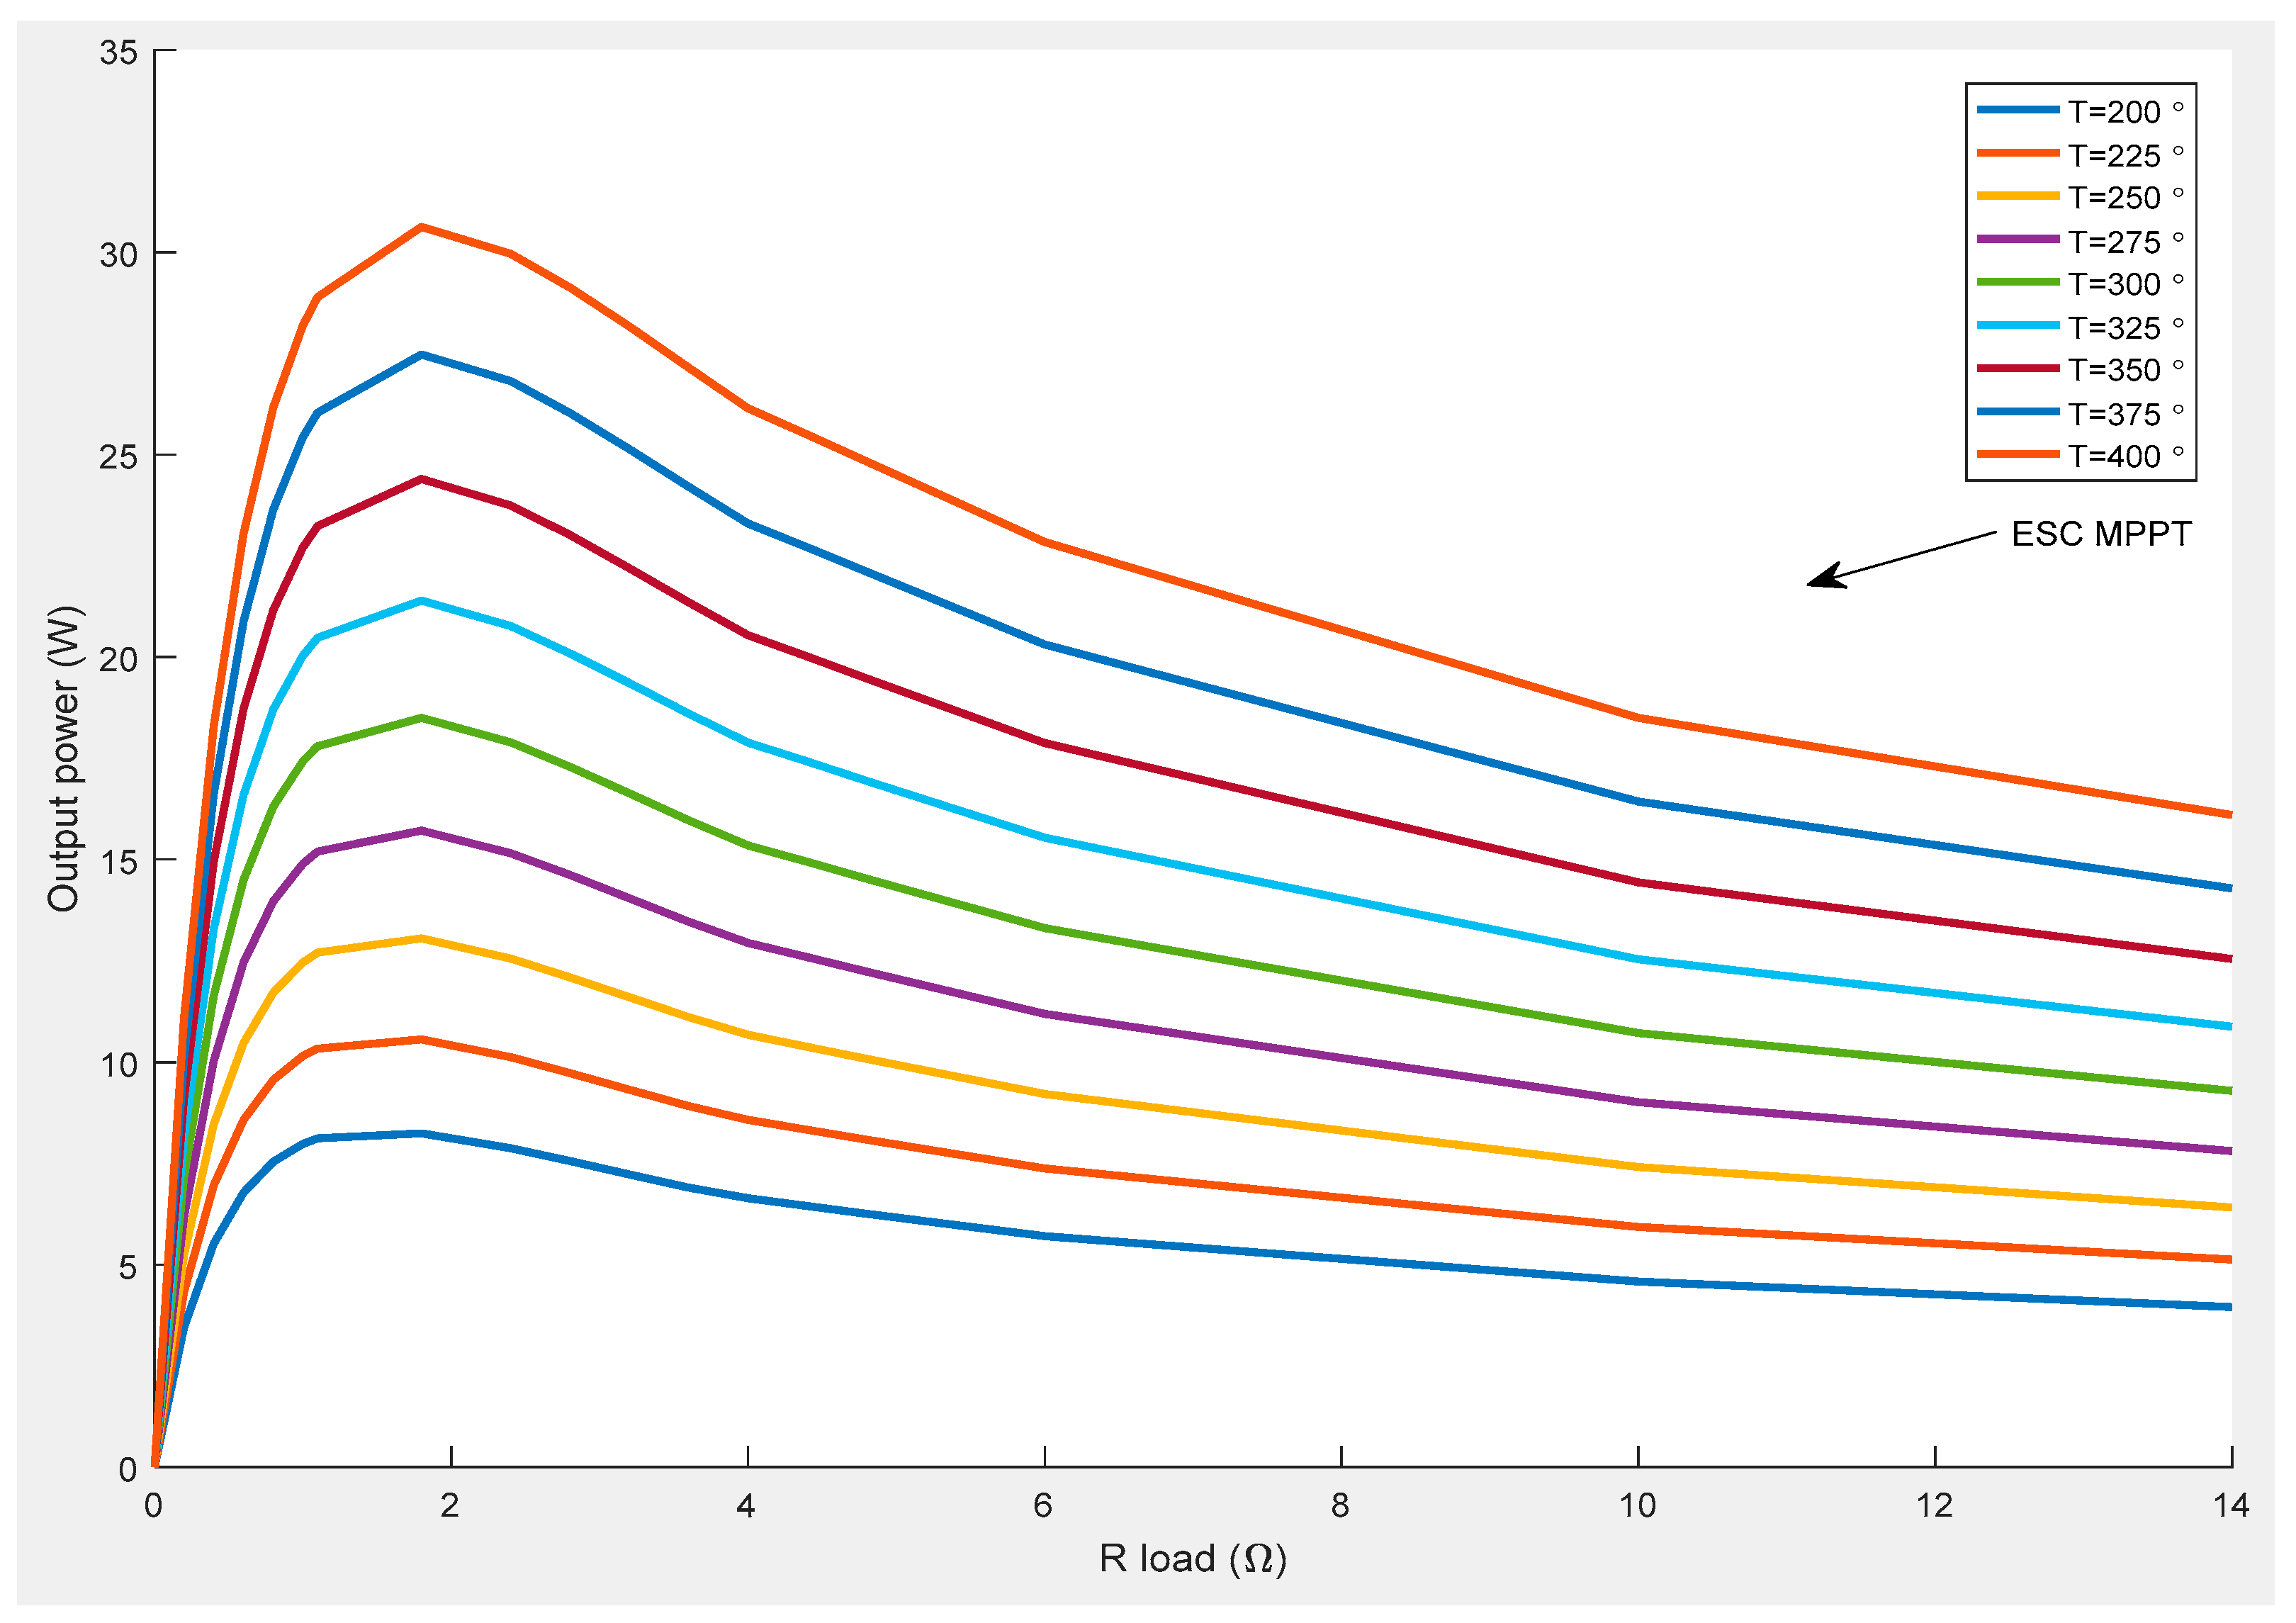
Figure 13.
The voltage, current and output power of ESC MPPT model for a single TEG.

Figure 14.
The output voltage, current and output power of P&O MPPT model for a single TEG.
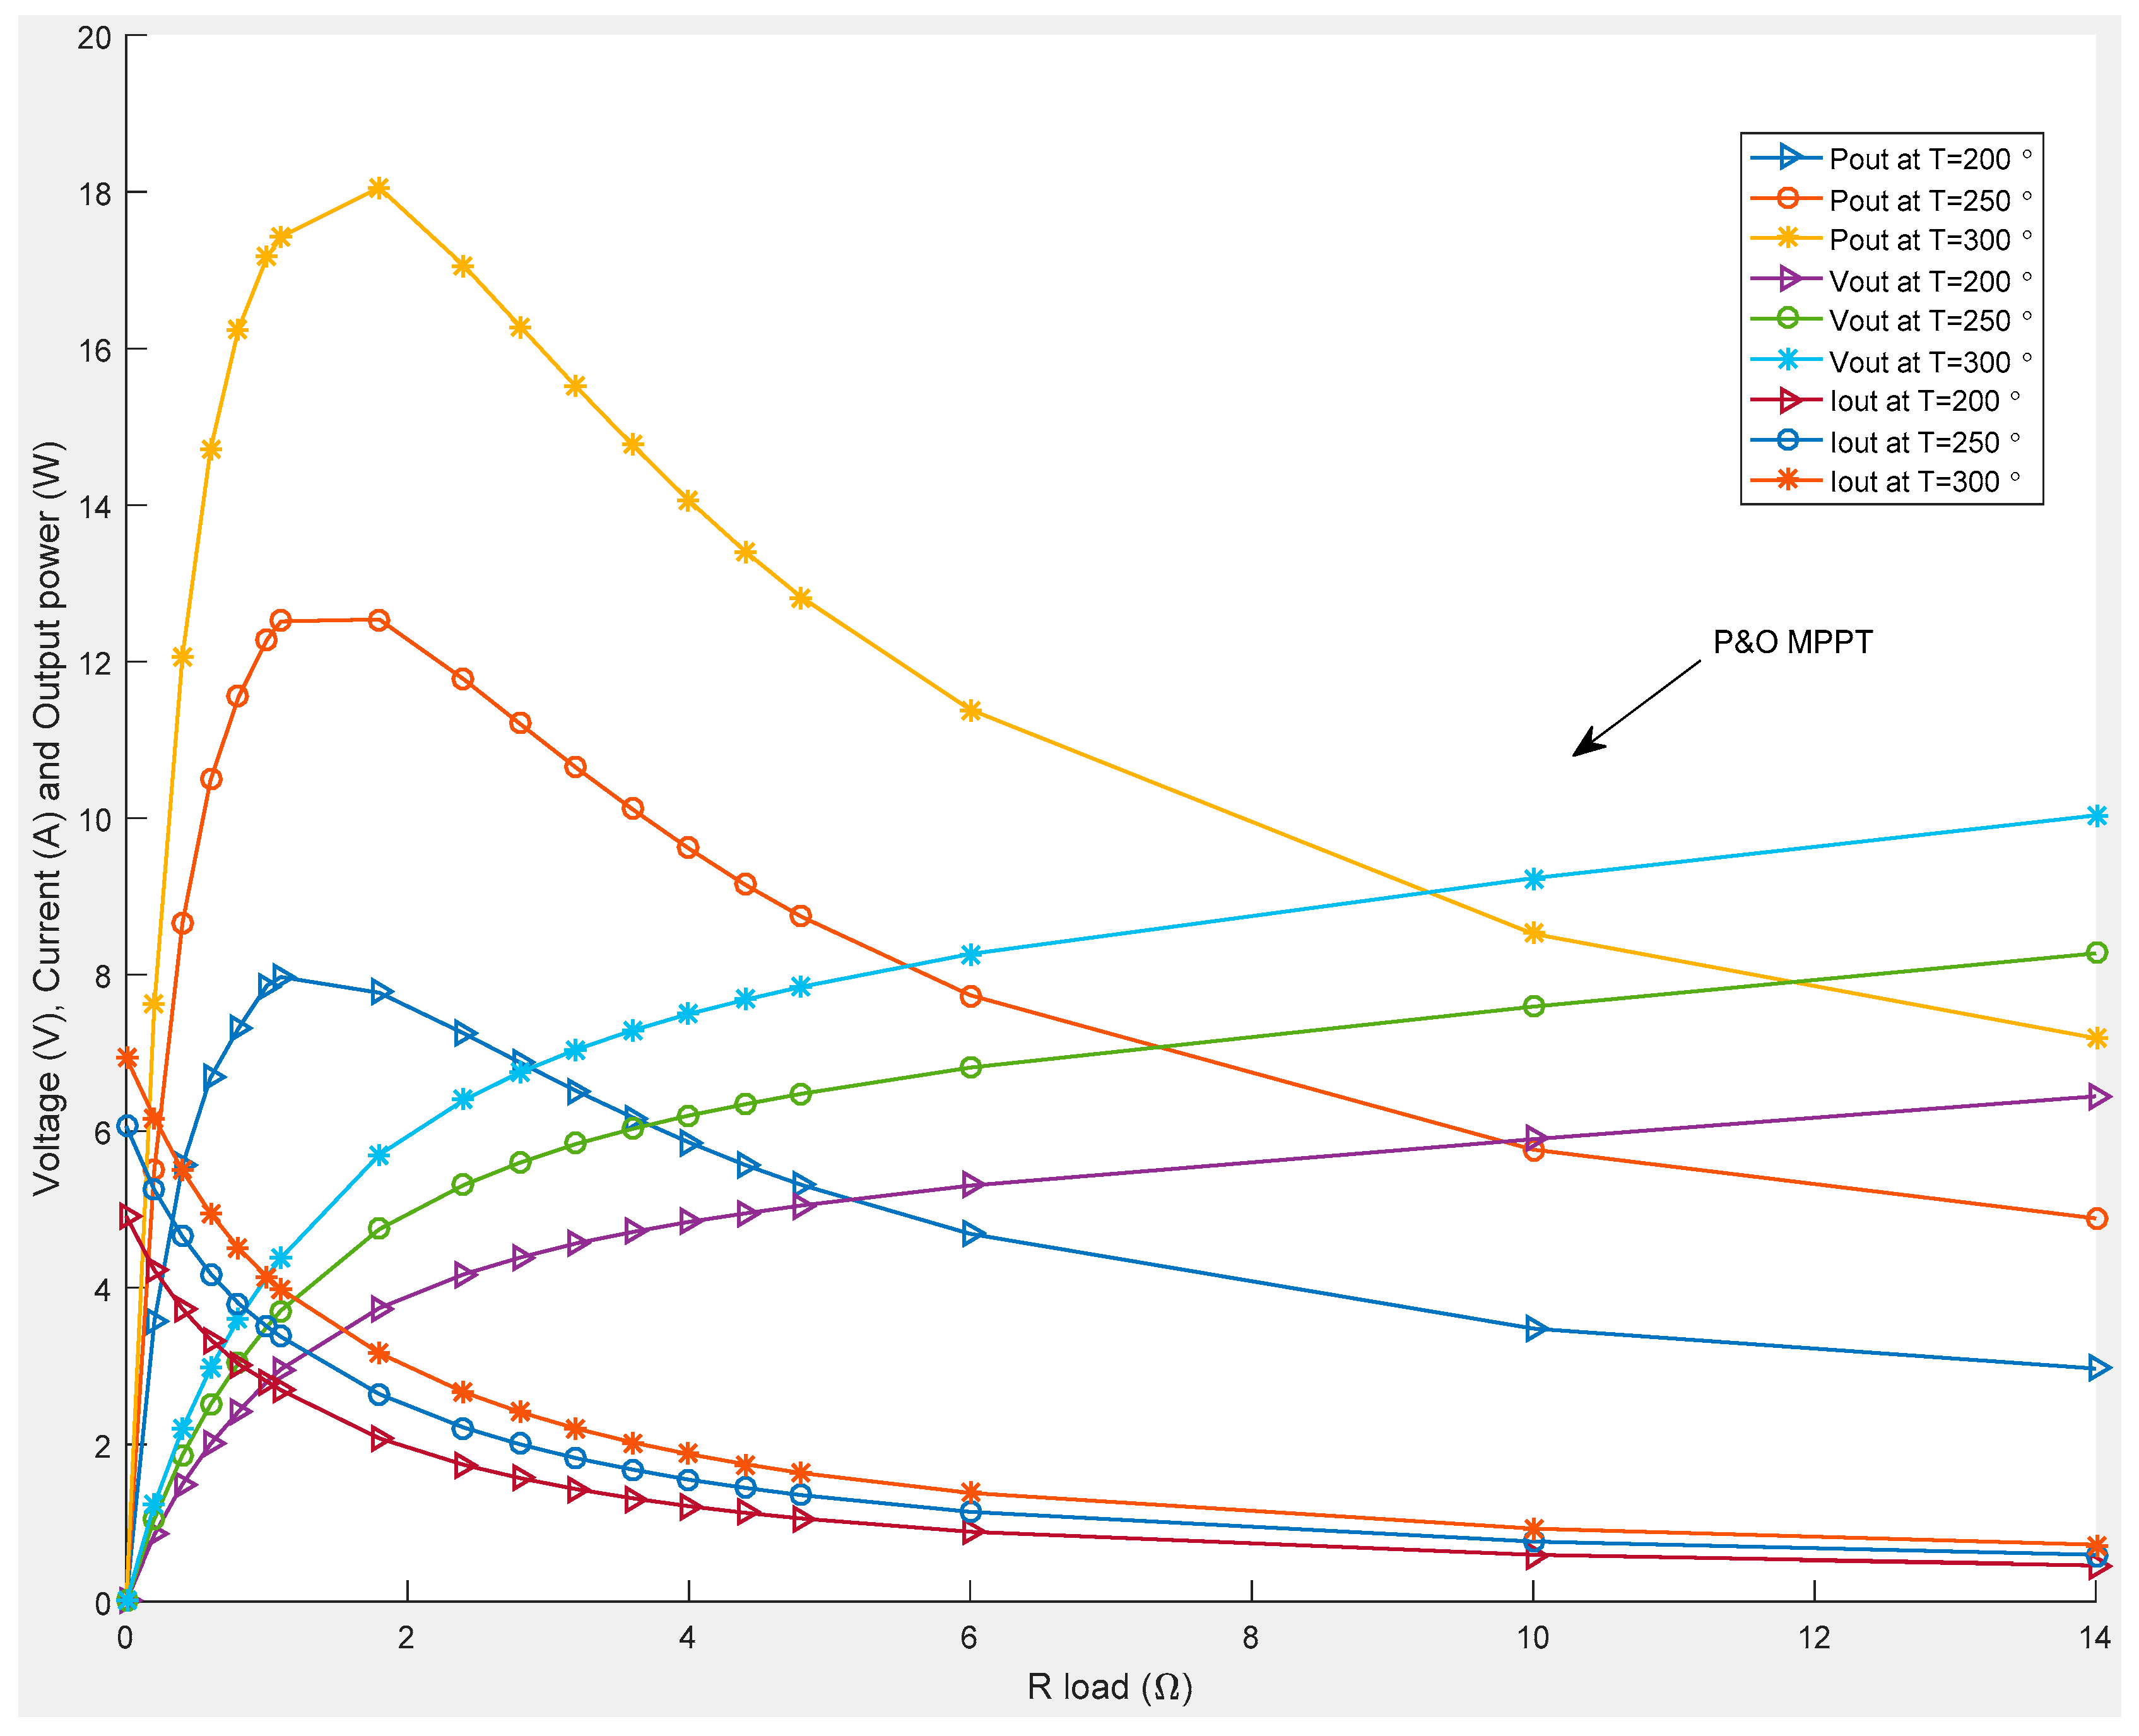
Figure 15.
The comparison between the output voltages of ESC and P&O based models.

Figure 16.
The comparison of output power of ESC and P&O based models.
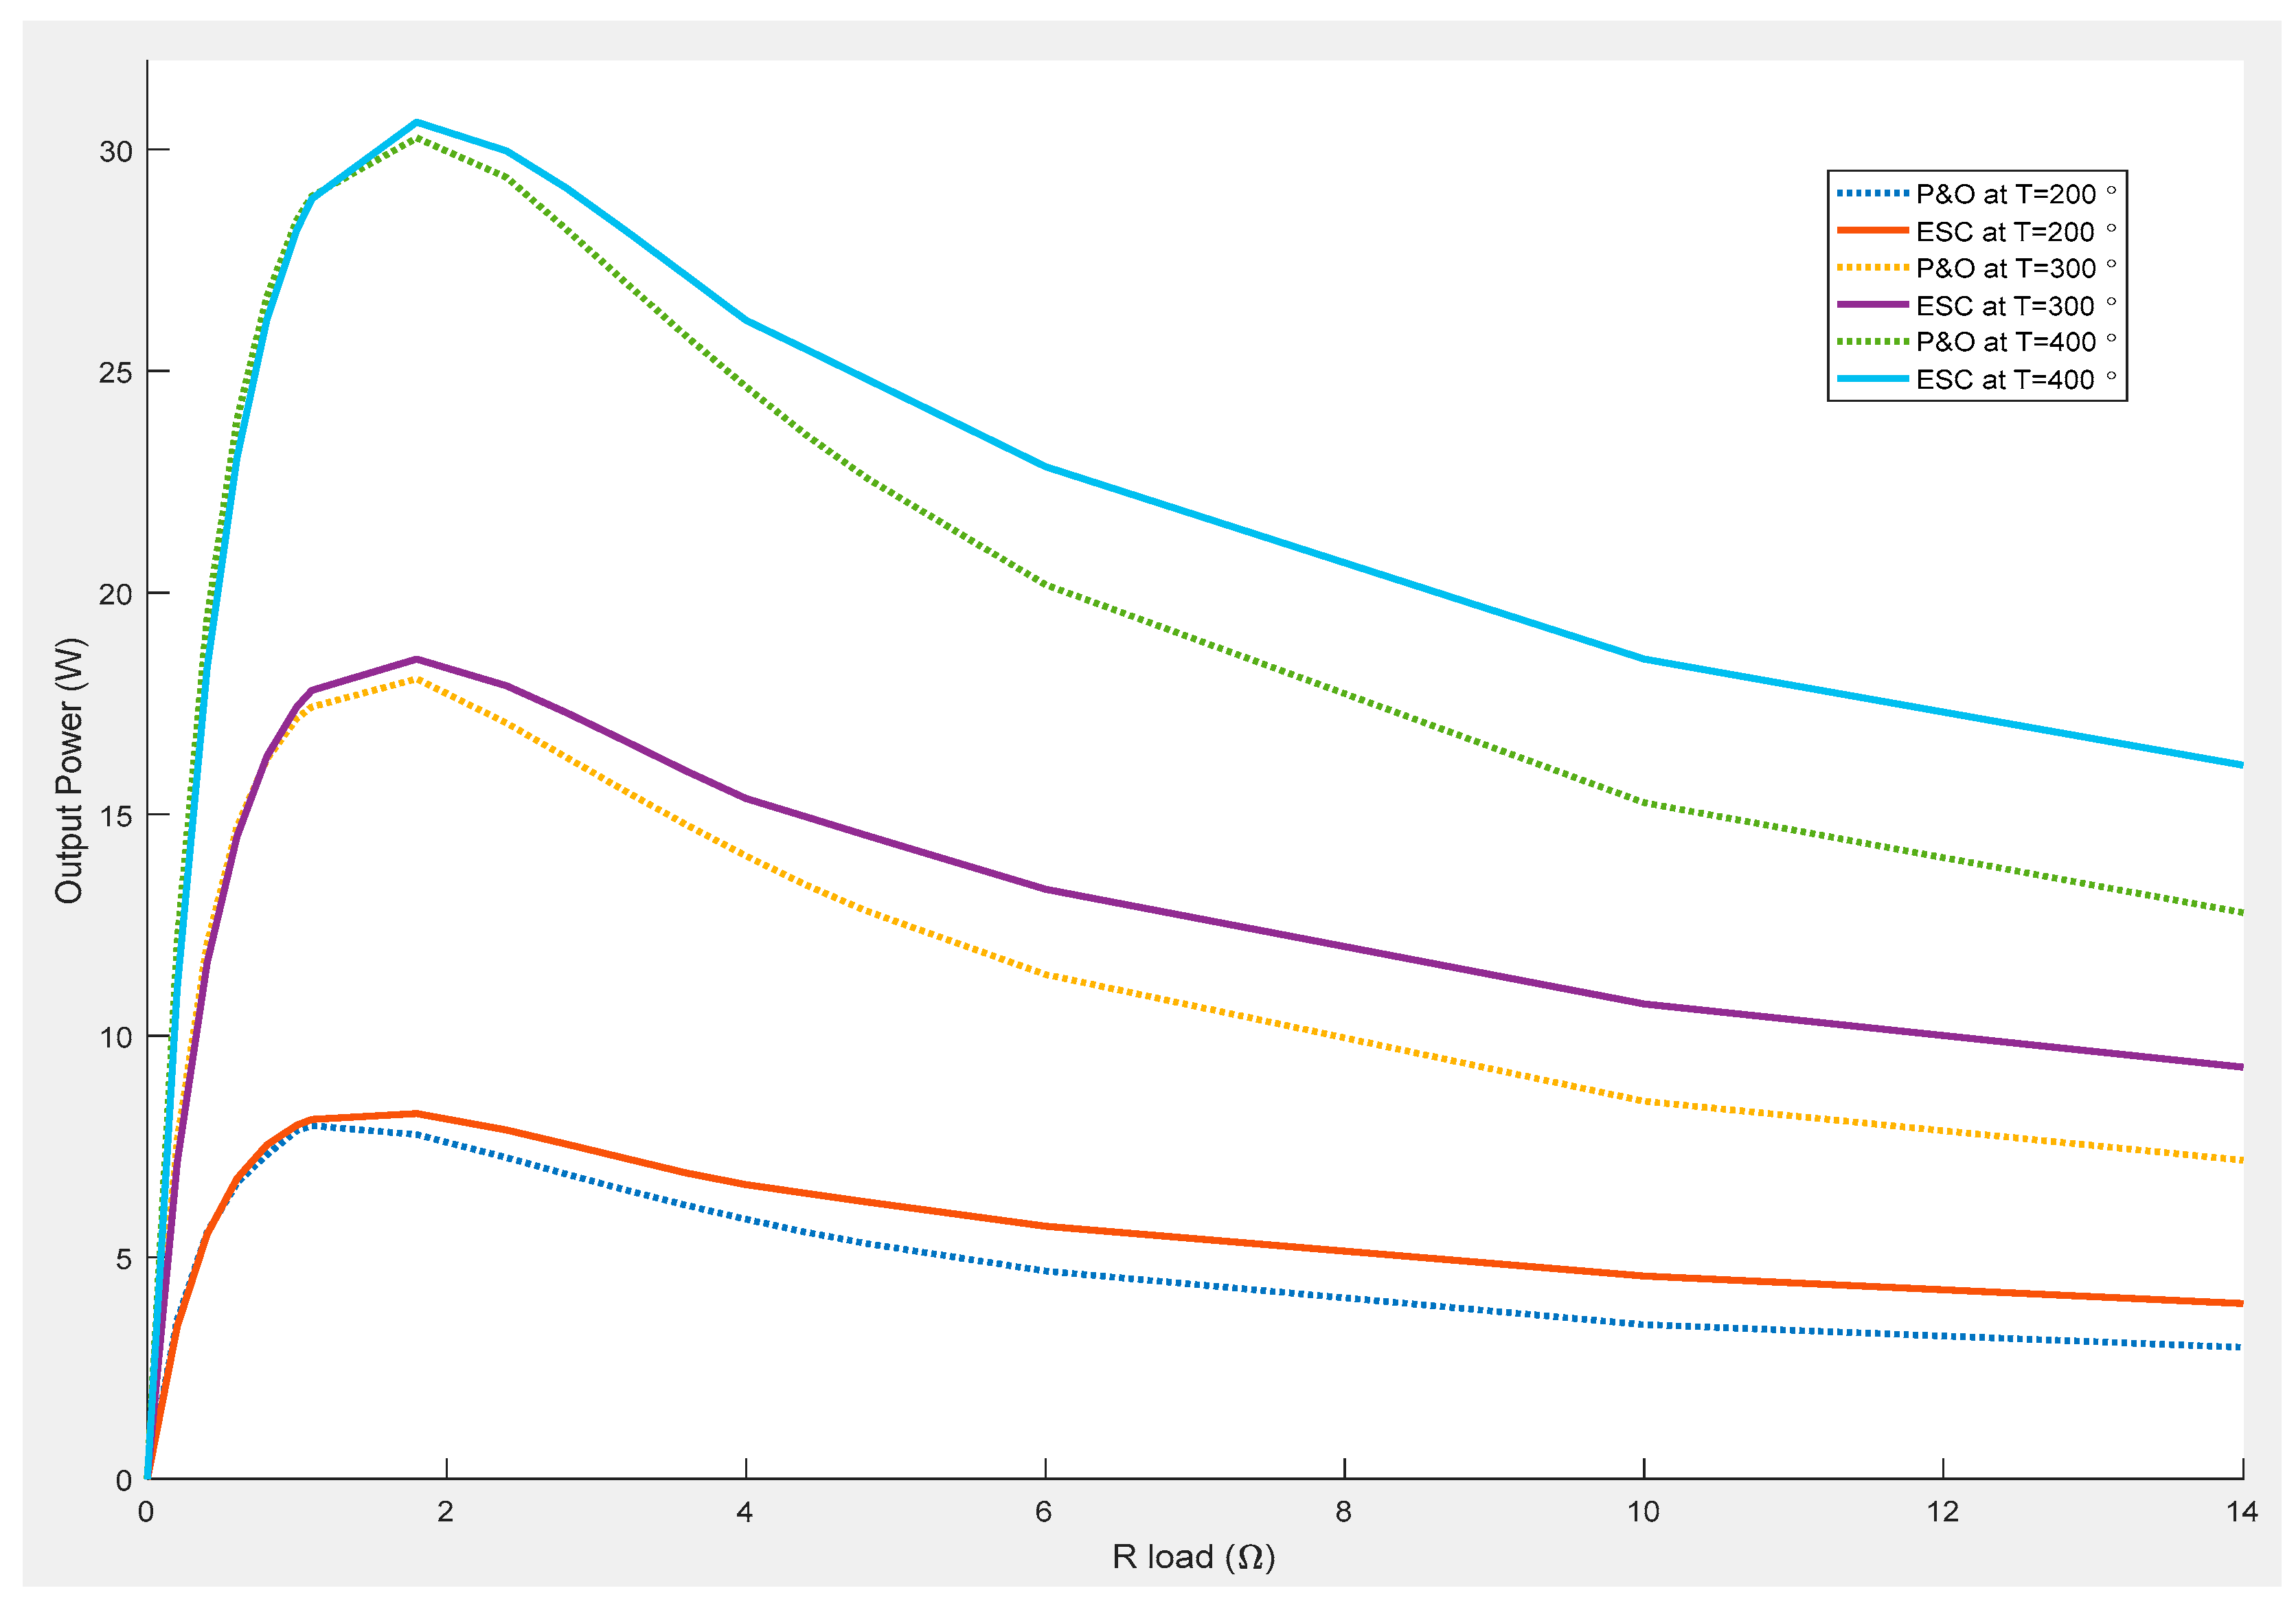
Figure 17.
The output power difference between ESC and P&O based models.
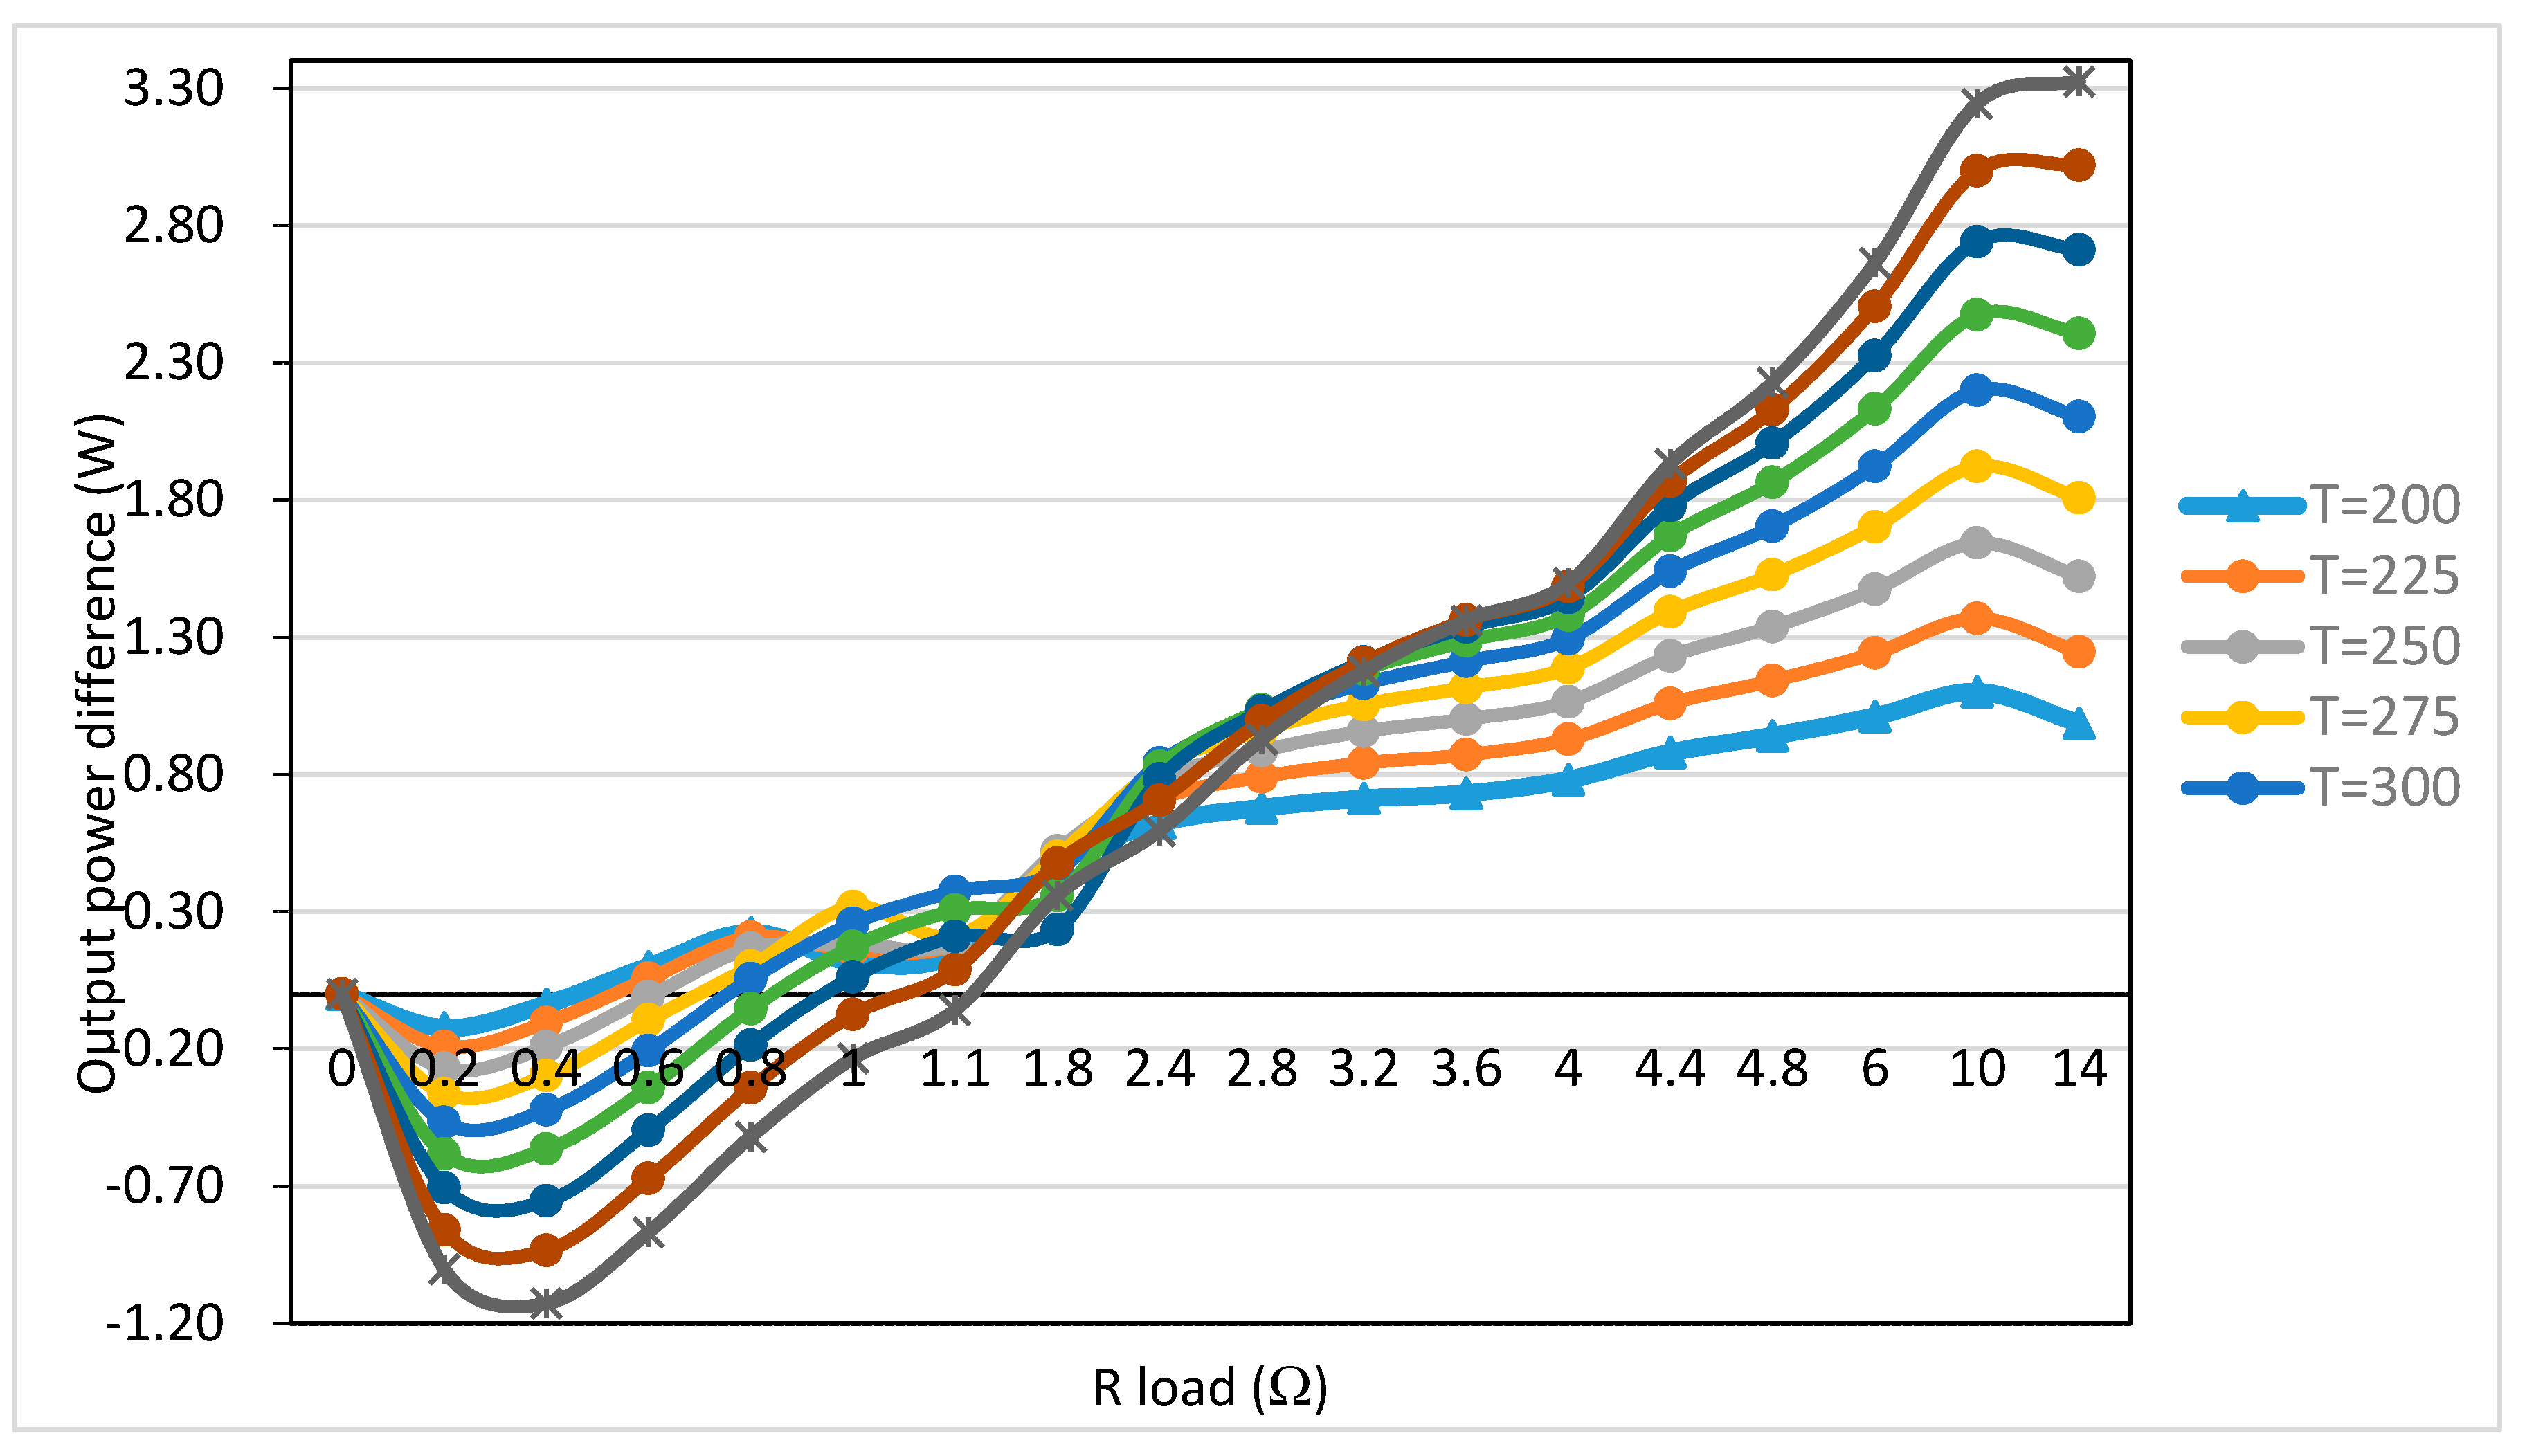
Figure 18.
Output of ESC and P&O near the optimum point.


Table 1.
List of electronic components for the boost converter design.
| Converter Component | Symbol | Value |
|---|---|---|
| Inductor | L1 | 30 µH |
| Diode Forward voltage On resistance | D1 | 0.38 V 0.2 Ω |
| Input capacitor | Cin | 800 µF |
| Series resistance | ESR | 0.05 Ω |
| Output capacitor | Cout | 800 µF |
| SwitchClosed resistance | R_closed | 0.0026 Ω |
| Open conductance | G_open | 0.1n siemens |
© 2017 by the authors. Licensee MDPI, Basel, Switzerland. This article is an open access article distributed under the terms and conditions of the Creative Commons Attribution (CC BY) license (http://creativecommons.org/licenses/by/4.0/).
Share and Cite
MDPI and ACS Style
Twaha, S.; Zhu, J.; Maraaba, L.; Huang, K.; Li, B.; Yan, Y. Maximum Power Point Tracking Control of a Thermoelectric Generation System Using the Extremum Seeking Control Method. Energies 2017, 10, 2016. https://doi.org/10.3390/en10122016
AMA Style
Twaha S, Zhu J, Maraaba L, Huang K, Li B, Yan Y. Maximum Power Point Tracking Control of a Thermoelectric Generation System Using the Extremum Seeking Control Method. Energies. 2017; 10(12):2016. https://doi.org/10.3390/en10122016
Chicago/Turabian StyleTwaha, Ssennoga, Jie Zhu, Luqman Maraaba, Kuo Huang, Bo Li, and Yuying Yan. 2017. "Maximum Power Point Tracking Control of a Thermoelectric Generation System Using the Extremum Seeking Control Method" Energies 10, no. 12: 2016. https://doi.org/10.3390/en10122016
Note that from the first issue of 2016, this journal uses article numbers instead of page numbers. See further details here.