Prospects for Increased Energy Recovery from Horse Manure—A Case Study of Management Practices, Environmental Impact and Costs


Department of Building, Energy and Environmental Engineering, Faculty of Engineering and Sustainable Development, University of Gävle, Kungsbäcksvägen 47, SE-801 76 Gävle, Sweden
*
Author to whom correspondence should be addressed.
Energies 2017, 10(12), 1935; https://doi.org/10.3390/en10121935
Submission received: 29 September 2017
/
Revised: 3 November 2017
/
Accepted: 20 November 2017
/
Published: 23 November 2017
Abstract
:A transition to renewable energy sources and a circular economy has increased interest in renewable resources not usually considered as energy sources or plant nutrient resources. Horse manure exemplifies this, as it is sometimes recycled but not often used for energy purposes. The purpose of this study was to explore horse manure management in a Swedish municipality and prospects for energy recovery. The case study includes a survey of horse manure practices, environmental assessment of horse manure treatment in a biogas plant, including associated transport, compared to on-site unmanaged composting, and finally a simplified economic analysis. It was found that horse manure management was characterized by indoor collection of manure most of the year and storage on concrete slabs or in containers, followed by direct application on arable land. Softwood was predominantly used as bedding, and bedding accounted for a relatively small proportion (13%) of the total mix. Anaerobic digestion was indicated to reduce potential environmental impact in comparison to unmanaged composting, mainly due to biogas substituting use of fossil fuels. The relative environmental impact from transport of manure from horse facilities to anaerobic digestion plant was small. Results also indicate a relatively high cost for horse keepers to change from composting on site to anaerobic digestion in a centralized plant.
1. Introduction
Lower energy use and reduced emissions of carbon dioxide are included in circular economy strategies (CES), as is re-use of raw materials currently handled as waste [1]. Anaerobic digestion is a waste-to-energy (WTE) technology supporting CES, where biological waste is converted to bioenergy and biofertilizer [2]. Nutrient recycling through organic fertilizers represents one step towards a circular economy as it turns waste management problems into economic opportunities. This also reduces dependence on imported phosphates [1]. Natural phosphorous and nitrogen cycles are identified in the planetary boundary framework, with thresholds society needs to manage in a global sustainable approach [3].
Environmental impact, and energy and nutrient recovery from horse manure, depends on collection practices, use of bedding material, manure storage and present manure usage [4].
Horses are to a great extent kept in peri-urban areas, the transition zone between urban and rural areas, where horse activities, like riding schools, are accessible to users situated in urban areas. In these areas horse activities are perceived as being in conflict with existing agriculture and new residential areas [5,6]. High horse density (a large number of horses per hectare), in combination with horse manure stored and left in paddocks, increases the risk for contaminated surface run-off water [7], and dung removal practices are recommended but reported to be lacking in some studies [8,9].
Horse manure is a mixture consisting of horse dung, used bedding and urine soaked in the bedding. In Sweden horse keepers mainly use softwood shavings as bedding material [10]. Other studies mention straw, peat, hemp, and wood and straw pellets among bedding materials [11,12,13]. Added bedding material can increase the amount of nutrients in collected and treated horse manure, indicated for both composted horse manure, where peat increased nitrogen and straw increased potassium [12,14], and in anaerobic digestion simulations [15].
In general horse keepers in Sweden store horse manure on concrete slabs but approximately 25% of the horse keepers store horse manure on ground other than arable land [10]. Storing of horse manure with softwood bedding involves minor leakage of nitrogen to water in a managed, fast-composting process [16], while phosphorous has been found in run-off water to a greater extent from turned and static uncovered horse manure piles than from covered piles [14].
In Sweden horse manure is used as a soil improver or fertilizer to a great extent [10], but it is not commonly used for energy recovery, even if incineration and anaerobic digestion are mentioned in some studies [17,18,19]. Anaerobic digestion can potentially reduce the net environmental impact of horse manure management if the produced biogas replaces fossil fuels in vehicles [20]. Even if fossil fuels are used for transport and in the production process, a decrease of about 75% of greenhouse gases can be reached [21,22].
To enable energy recovery from horse manure by anaerobic digestion, transport of feedstock to a biogas plant is necessary. Transport is generally increasing and the EU aims to increase energy efficiency and use of renewables, and decarbonize the sector [23]. How environmental impact from transport could be reduced is presented in a White Paper [24] focusing on sustainable fuels and propulsion systems, and multimodal logistics using energy-efficient modes and systems. The expected net effect in the present case is that a limited use of transport can help achieve such goals through the production of renewable vehicle fuel from horse manure. Operational decisions like the type of truck used for transport, use of fuel, energy-efficient engines and strategic decisions about size and amount of shipments are among the logistical decisions linked to environmental impact [25].
Potential factors of importance for horse manure as a biogas feedstock are feeding, indoor housing, outdoor keeping, manure storage, fertilization and transport. These factors, identified in a previous study, influence horse manure amounts and characteristics [4]. Horse manure’s methane potential is lower than that of food waste, for example, especially when softwood is used as bedding material [13]. A literature review by Hadin and Eriksson [15] indicates a wide range for horse manure methane potential: 56 L CH4/kg VS for pure horse manure with no bedding material and 277 L CH4/kg VS for horse manure and straw bedding [11,26]. Many digesters use food waste as a substrate, where the methane potential can range between 178 and 531 m3 CH4/tonne VS [27,28]. Concerns about the moderate methane potential motivate this case study of anaerobic digestion, including the environmental and economic aspects of transport of horse manure. This study is based on site-specific data and adds a systems perspective on environmental and economic impact from collection of horse manure at horse keepers’ sites, not previously studied [20]. This is also complementary to previously published research that discusses parts of the system, e.g., horse manure management, or biogas from horse manure, or transport systems [13,26,29,30,31]. In a systems perspective it is important that the benefits of anaerobic digestion are greater than the additional burden related to collection and transport.
The aim of the present case study was to describe a specific case of horse manure management practices and compare unmanaged composting with anaerobic digestion from an environmental and economic perspective. The objectives were to:
- Describe horse keepers’ current horse manure management practices (on site collection, storage and utilization) in a Swedish municipality and provide quantitative and qualitative data for a combined assessment.
- Calculate the potential environmental impact of combined energy recovery and nutrient recycling through anaerobic digestion in a centralized plant, replacing unmanaged composting.
- Explore economic consequences for horse keepers from a changed treatment.
- Discuss how current manure management practice influence an altered treatment in relation to environmental impact and associated costs.
2. Materials and Methods
This study was inspired by an embedded single case study design where multiple units of analysis create the context of the case [32]. The case municipality has about 100,000 inhabitants and is located in the southeastern part of northern Sweden. Research activities used in the study differed between which part of the system was studied and the phase of the study (Table 1). A telephone questionnaire was used to explore horse manure amounts, characteristics and practices. The questionnaire was supported with study visits and field observations at three riding schools and one trotting race track. Distances for, and emissions from, manure transport and data for horse manure treatment were also part of the inventory (Table 1). Compilation and calculations of horse manure data were performed in MS Excel, while the horse manure treatment methods were simulated in ORWARE [33].
2.1. Horse Keeping
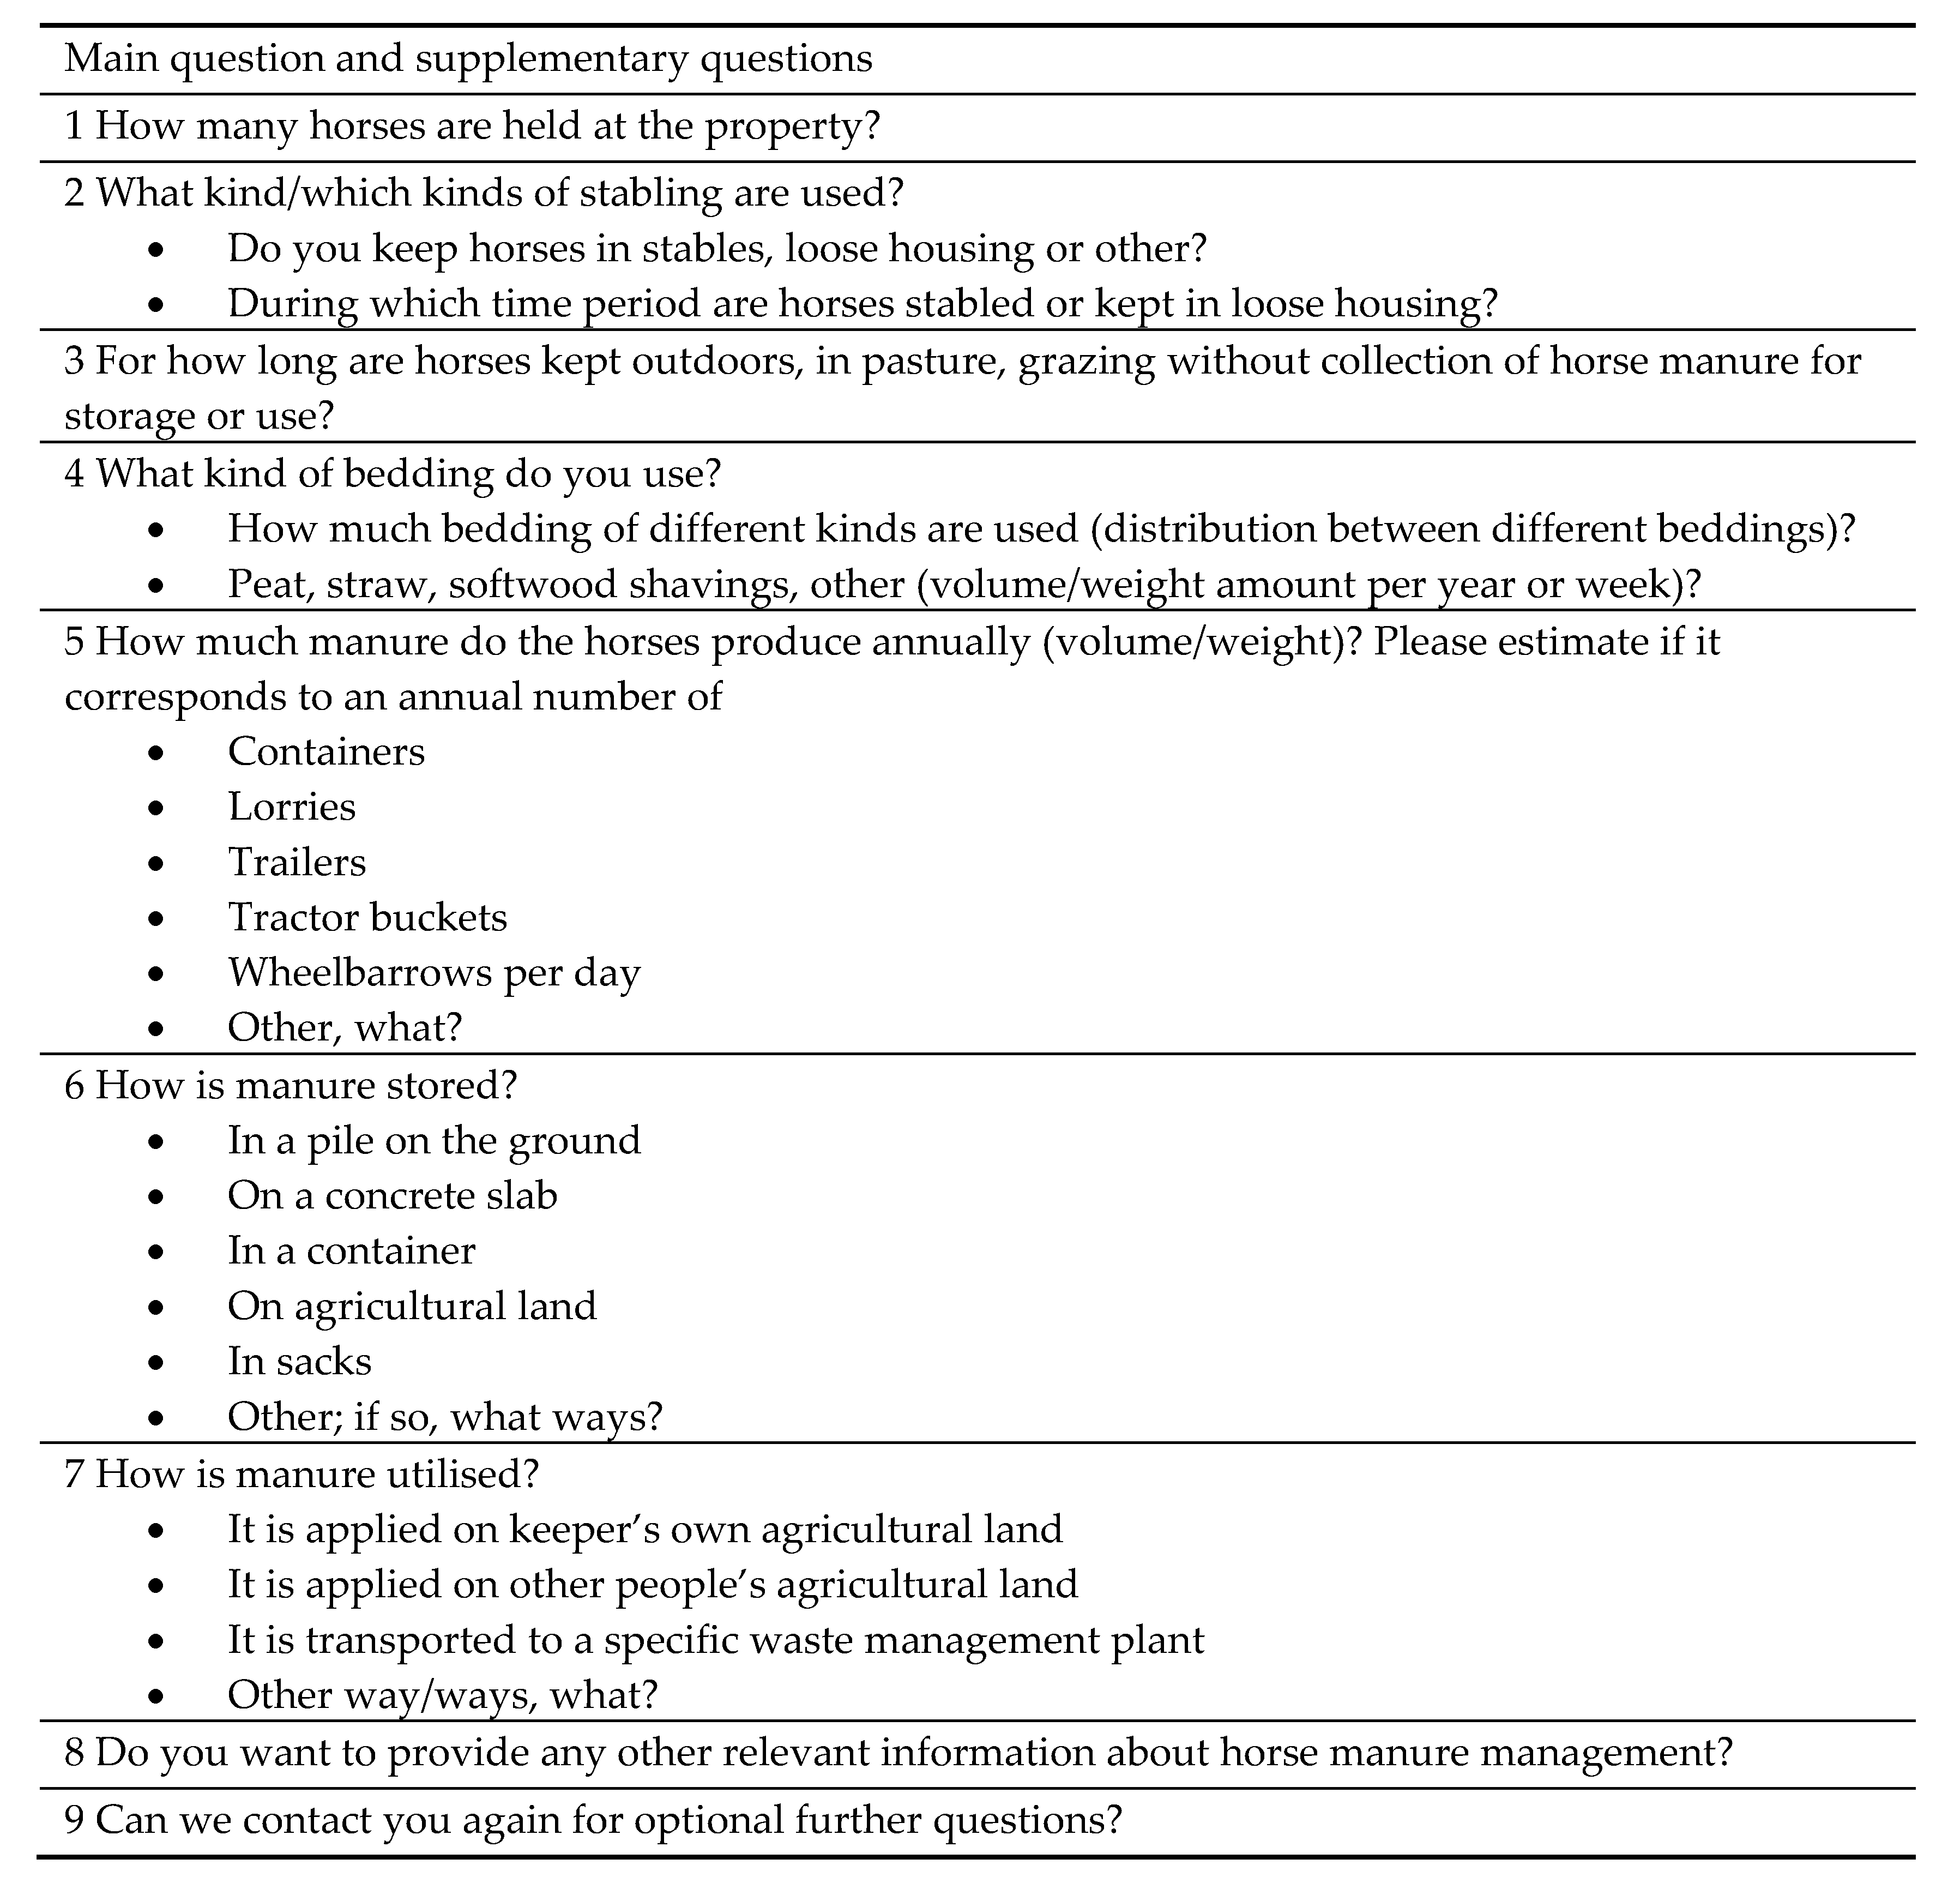
Horse keepers charted by the County Administrative Board and the municipal board were contacted by telephone and asked to answer questions about their horse manure management, e.g., generated amount of horse manure, type and amount of bedding, collection of horse manure outdoors, storage type and spreading of horse manure or other usage/handling (Figure A1 in Appendix A). Collected data were used to explore horse manure management in the case municipality and partly also to provide data (such as total amount of horse manure, content of bedding material and utilization of horse manure) for calculation/simulation of environmental impact from horse manure transport and treatment in the ORWARE model.
2.2. Transport
Transport of manure from horse facilities to a treatment plant was calculated based on the distribution of manure suppliers identified through the survey, and the corresponding amounts to be transported from each address. Transport distances were calculated based on the respondents’ locations and the location of the expected anaerobic treatment facility. Transport energy and emissions to air were based on data from NTMCalc 4.0 [34], using Euro 5 vehicles and European diesel B5. The cargo load factor was set to 40% to incorporate one way almost full (80%) transport and one way empty transport of containers. A transport system consisting of trucks with cargo carrier capacity from 7.5 to 34 tonnes was theoretically constructed (Table 2).
2.3. Treatment
The treatment of horse manure by composting and liquid anaerobic digestion has been examined using ORWARE [33], which is a computer model for simulation of different waste management strategies calculating environmental impact using an LCA (Life Cycle Assessment) approach based on material flow analysis (MFA). The model has been used repeatedly for evaluation of waste management policy and strategies [20,36,37,38,39]. In the anaerobic digestion submodel, the amount of biogas generated is dependent on the composition of different organic compounds such as fat, proteins, cellulose, hemicellulose, lignin and rapidly degradable carbohydrates, and the retention time (HRT). The digester temperature affects the degradation rate, i.e., mesophilic conditions produce less gas than thermophilic conditions for a given HRT. Part of the methane in the raw biogas (a mix of CH4 and CO2) is set exogenously for each organic compound and has been adjusted to meet the methane potential of horse manure, as found in the literature. Carbon that is not degraded to CH4 or CO2 is left in the biofertilizer. All nitrogen in the feedstock is found in the digestate and later separated into liquid and solid fractions. Both are used in agriculture. A more detailed description of the model can be found in [40]. With a few exceptions, the data on manure and process parameters in the simulations are consistent with the data presented in Eriksson et al. [20]. The model was adjusted to this specific case study with respect to actual manure amount, blending of bedding materials, share of digestate being utilized in field cultivation and choice of upgrading and utilization of biogas, thus omitting the general assumptions made in the previous study. The case was structured from horse keeper data reporting a specified amount of horse manure in combination with amount and type of bedding, cf. Table 3.
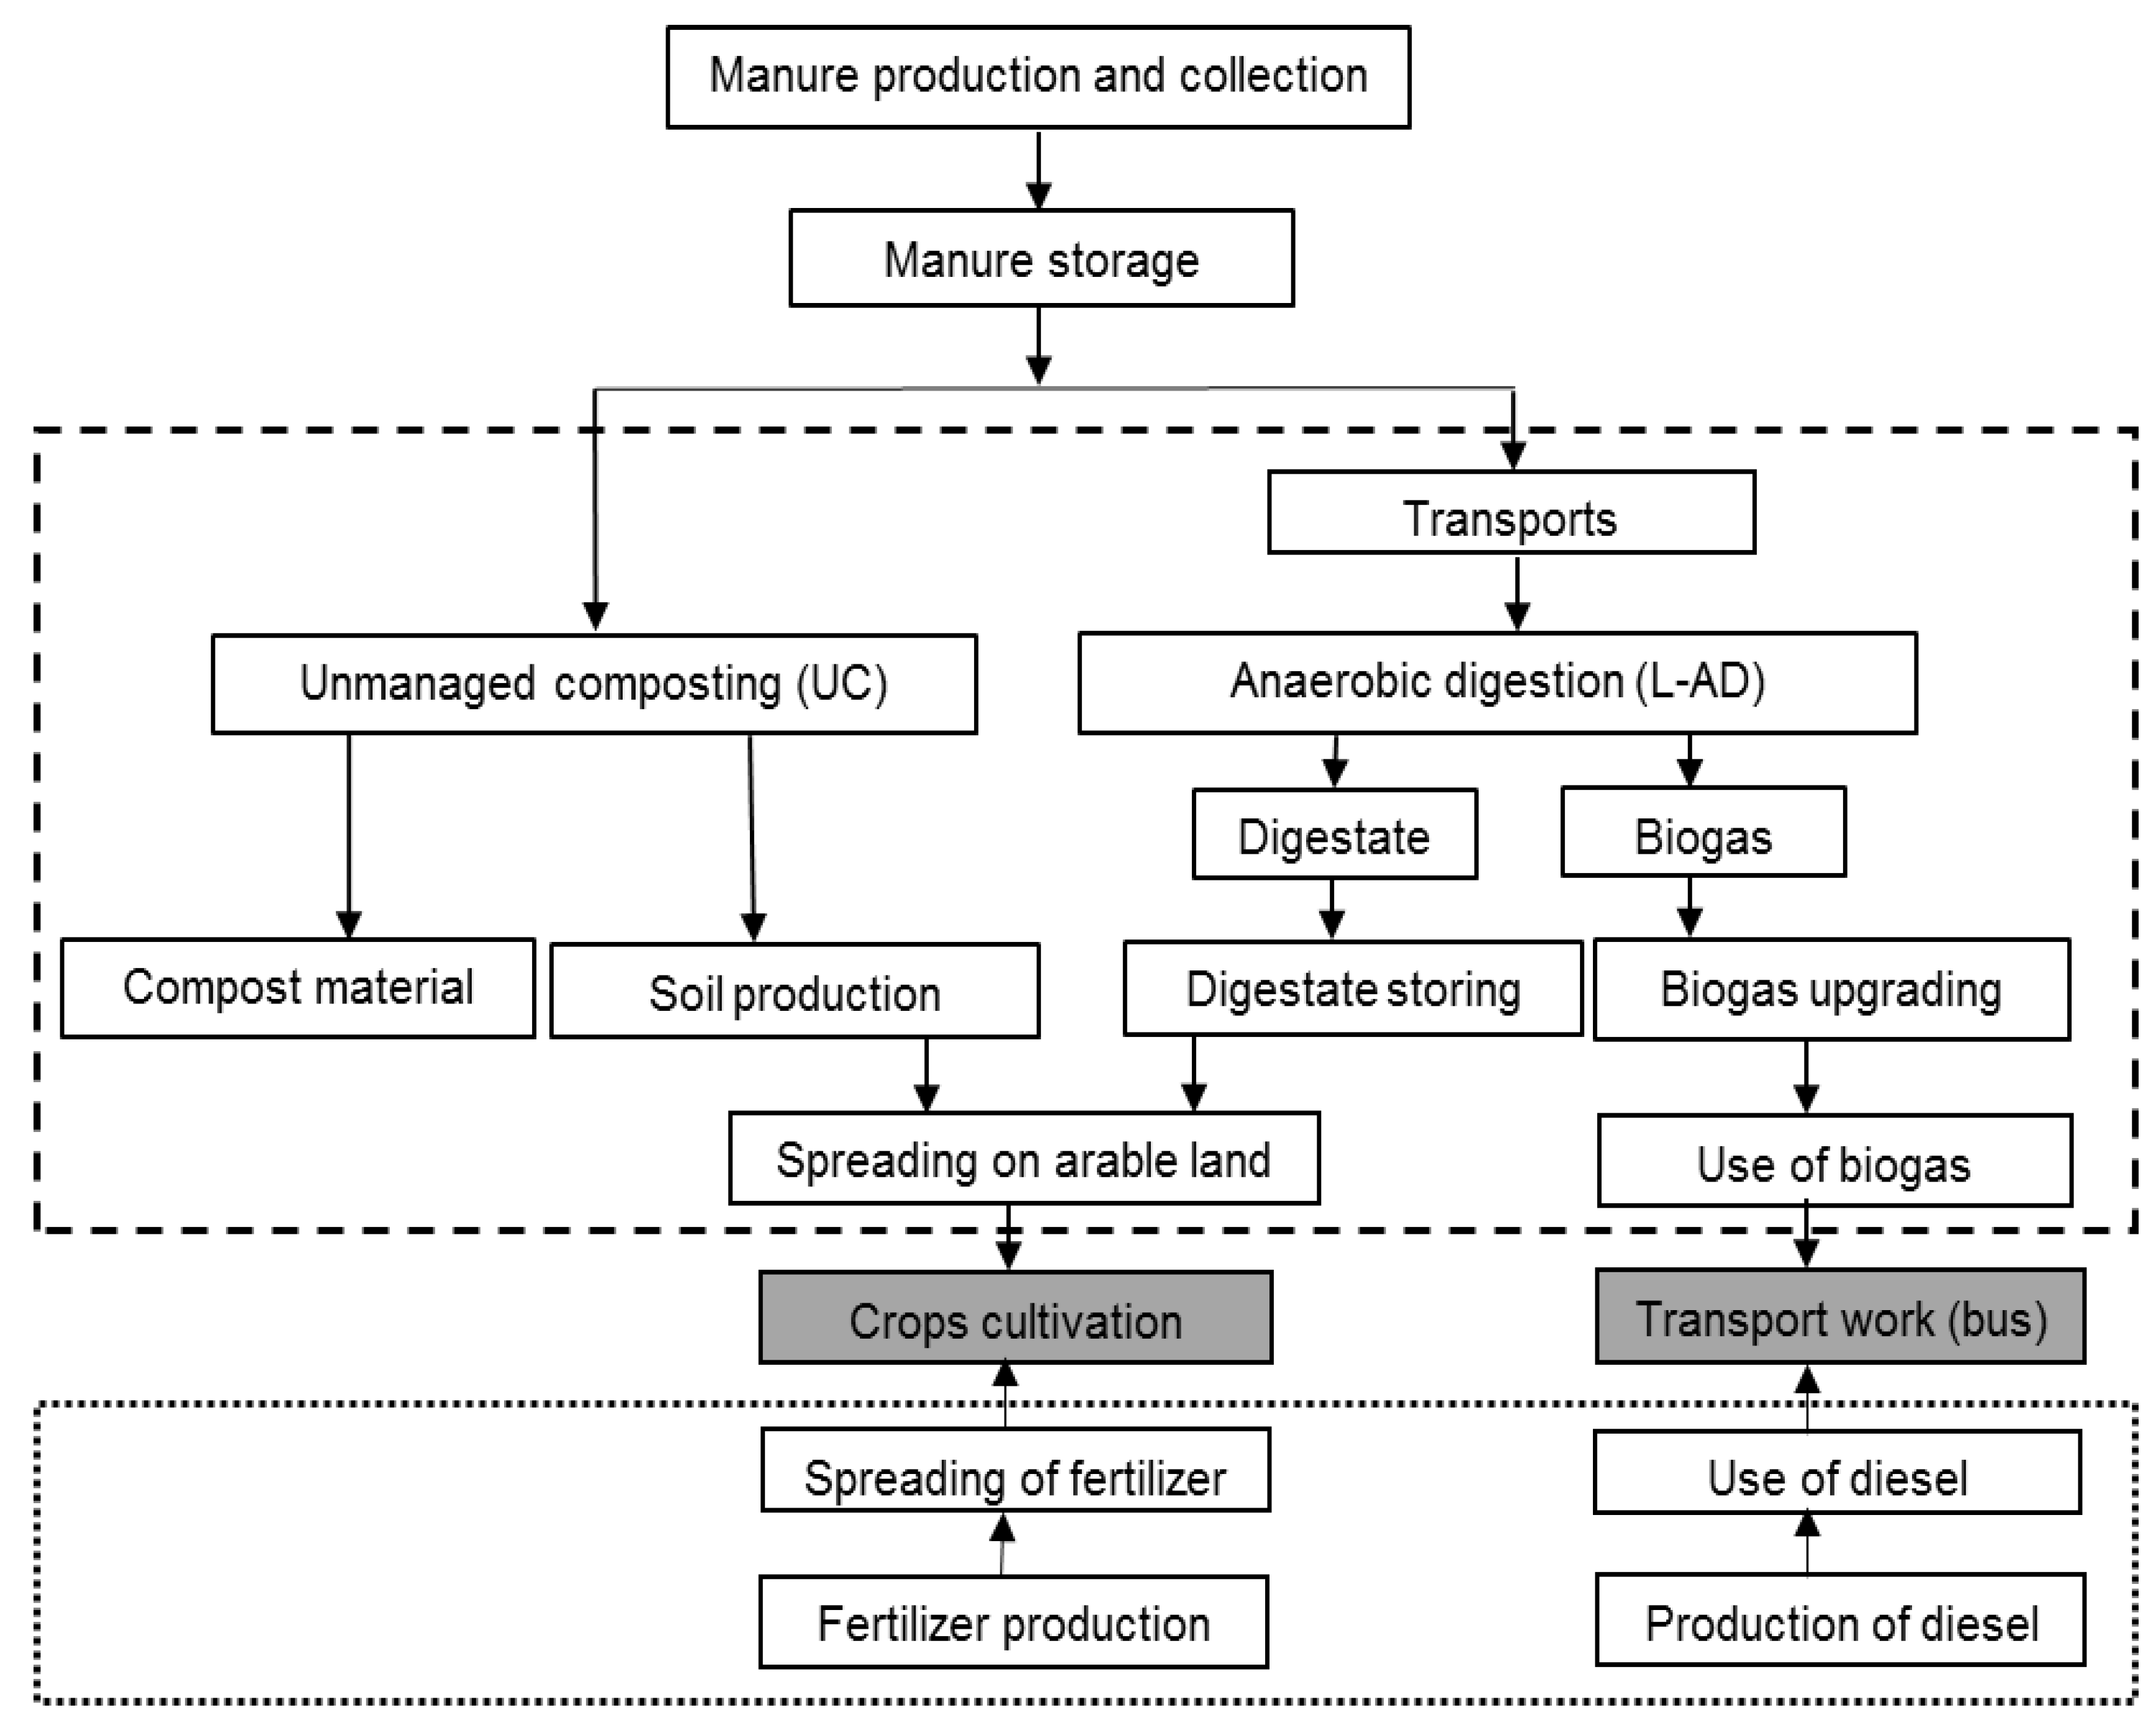
Two scenarios have been compared in the economic and environmental assessment (Figure 1). Scenario 1 refers to handling the horse manure according to business as usual (BAU), where unmanaged composting on or close to the site was chosen as the waste management method, presumably consistent with current practice. In the model simulations 74% of the compost from horse manure was applied to arable land, based on horse keeper responses. In Scenario 2 horse manure was transported from horse facilities to a central liquid anaerobic digestion plant using a container system. All biofertilizer and biogas from the plant was utilized. Considering the compensatory system, biogas from the plant was upgraded and used as fuel in Euro VI buses replacing fossil diesel buses [41]. The biofertilizer was subject to land application, substituting chemical fertilizer.
The environmental impact assessment, based on the life cycle inventory (LCI) from MS Excel (transport; Figure 1) and ORWARE (all processes except manure transport; Figure 1) was restricted to use of primary energy (cumulative energy demand, CED) and associated environmental impact categories; global warming potential (GWP), eutrophication potential (EP) and acidification potential (AP), using the CML 2001 Baseline scenario [42]. CED is the summarized primary energy demand; i.e., all energy input recalculated as the energy content in natural resources such as oil, coal, biomass, etc. in the examined system, and constitutes an analysis of energy resource usage within the performed systems analysis. In the environmental impact assessment, emissions in the system are transferred and assigned to specific impact categories [43]. GWP represents the global warming potential from different greenhouse gases presented in the unit tonnes CO2 equivalent. EP is the eutrophying emissions to air, soil and water in tonnes PO43 equivalent, and AP is the acidifying emissions to air with the unit tonnes SO2 equivalent [42]. The base scenario was followed up by a sensitivity analysis of potentially important parameters including some with high uncertainty: amount of horse manure, bedding type, transport distances, vehicle type and fuel type. Based on the case data, the environmental impact was calculated for the highest and lowest amounts of horse manure, one bedding type at a time, and transport was changed in terms of different distances, use of larger or smaller trucks solely, or use of biodiesel Hydrotreated Vegetable Oil (HVO) instead of fossil diesel. As a last step, a simplistic economic analysis was performed including inventory and calculation of horse keeper costs for the storage, transport and treatment of horse manure.
3. Results
The case consists of information from 81 horse-keeping sites (also referred to as horse facilities) located in the Swedish case municipality. These represent 623 horses in total, where 84% of keepers were in possession of ≤10 horses (Table 4). Statistics for Sweden (with high standard errors) estimate the number of horses in the actual county of 10 municipalities to be 11,700, with 51% located in urban areas and adjoining rural areas. In Sweden the average number of horses per site is 4.6 [44]. The total number of horses in the case municipality is hard to estimate based on available statistics, but is probably several times larger than the number covered in this study.
Data from the questionnaire, related to manure management practices, were compiled in four groups based on the number of horses per respondent (1–2, 3–5, 6–10, and 11–90 horses). The groups’ setup, i.e., the intervals for the number of horses kept at the sites, show similarities with the Swedish legislation about manure storage—Swedish Ordinance (1998:915) on environmental considerations in agriculture [45]—estimated statistics in Sweden [10] and groups in a case study performed in New Jersey [46].
3.1. Horse Manure Management Practices
3.1.1. On-Site Manure Collection
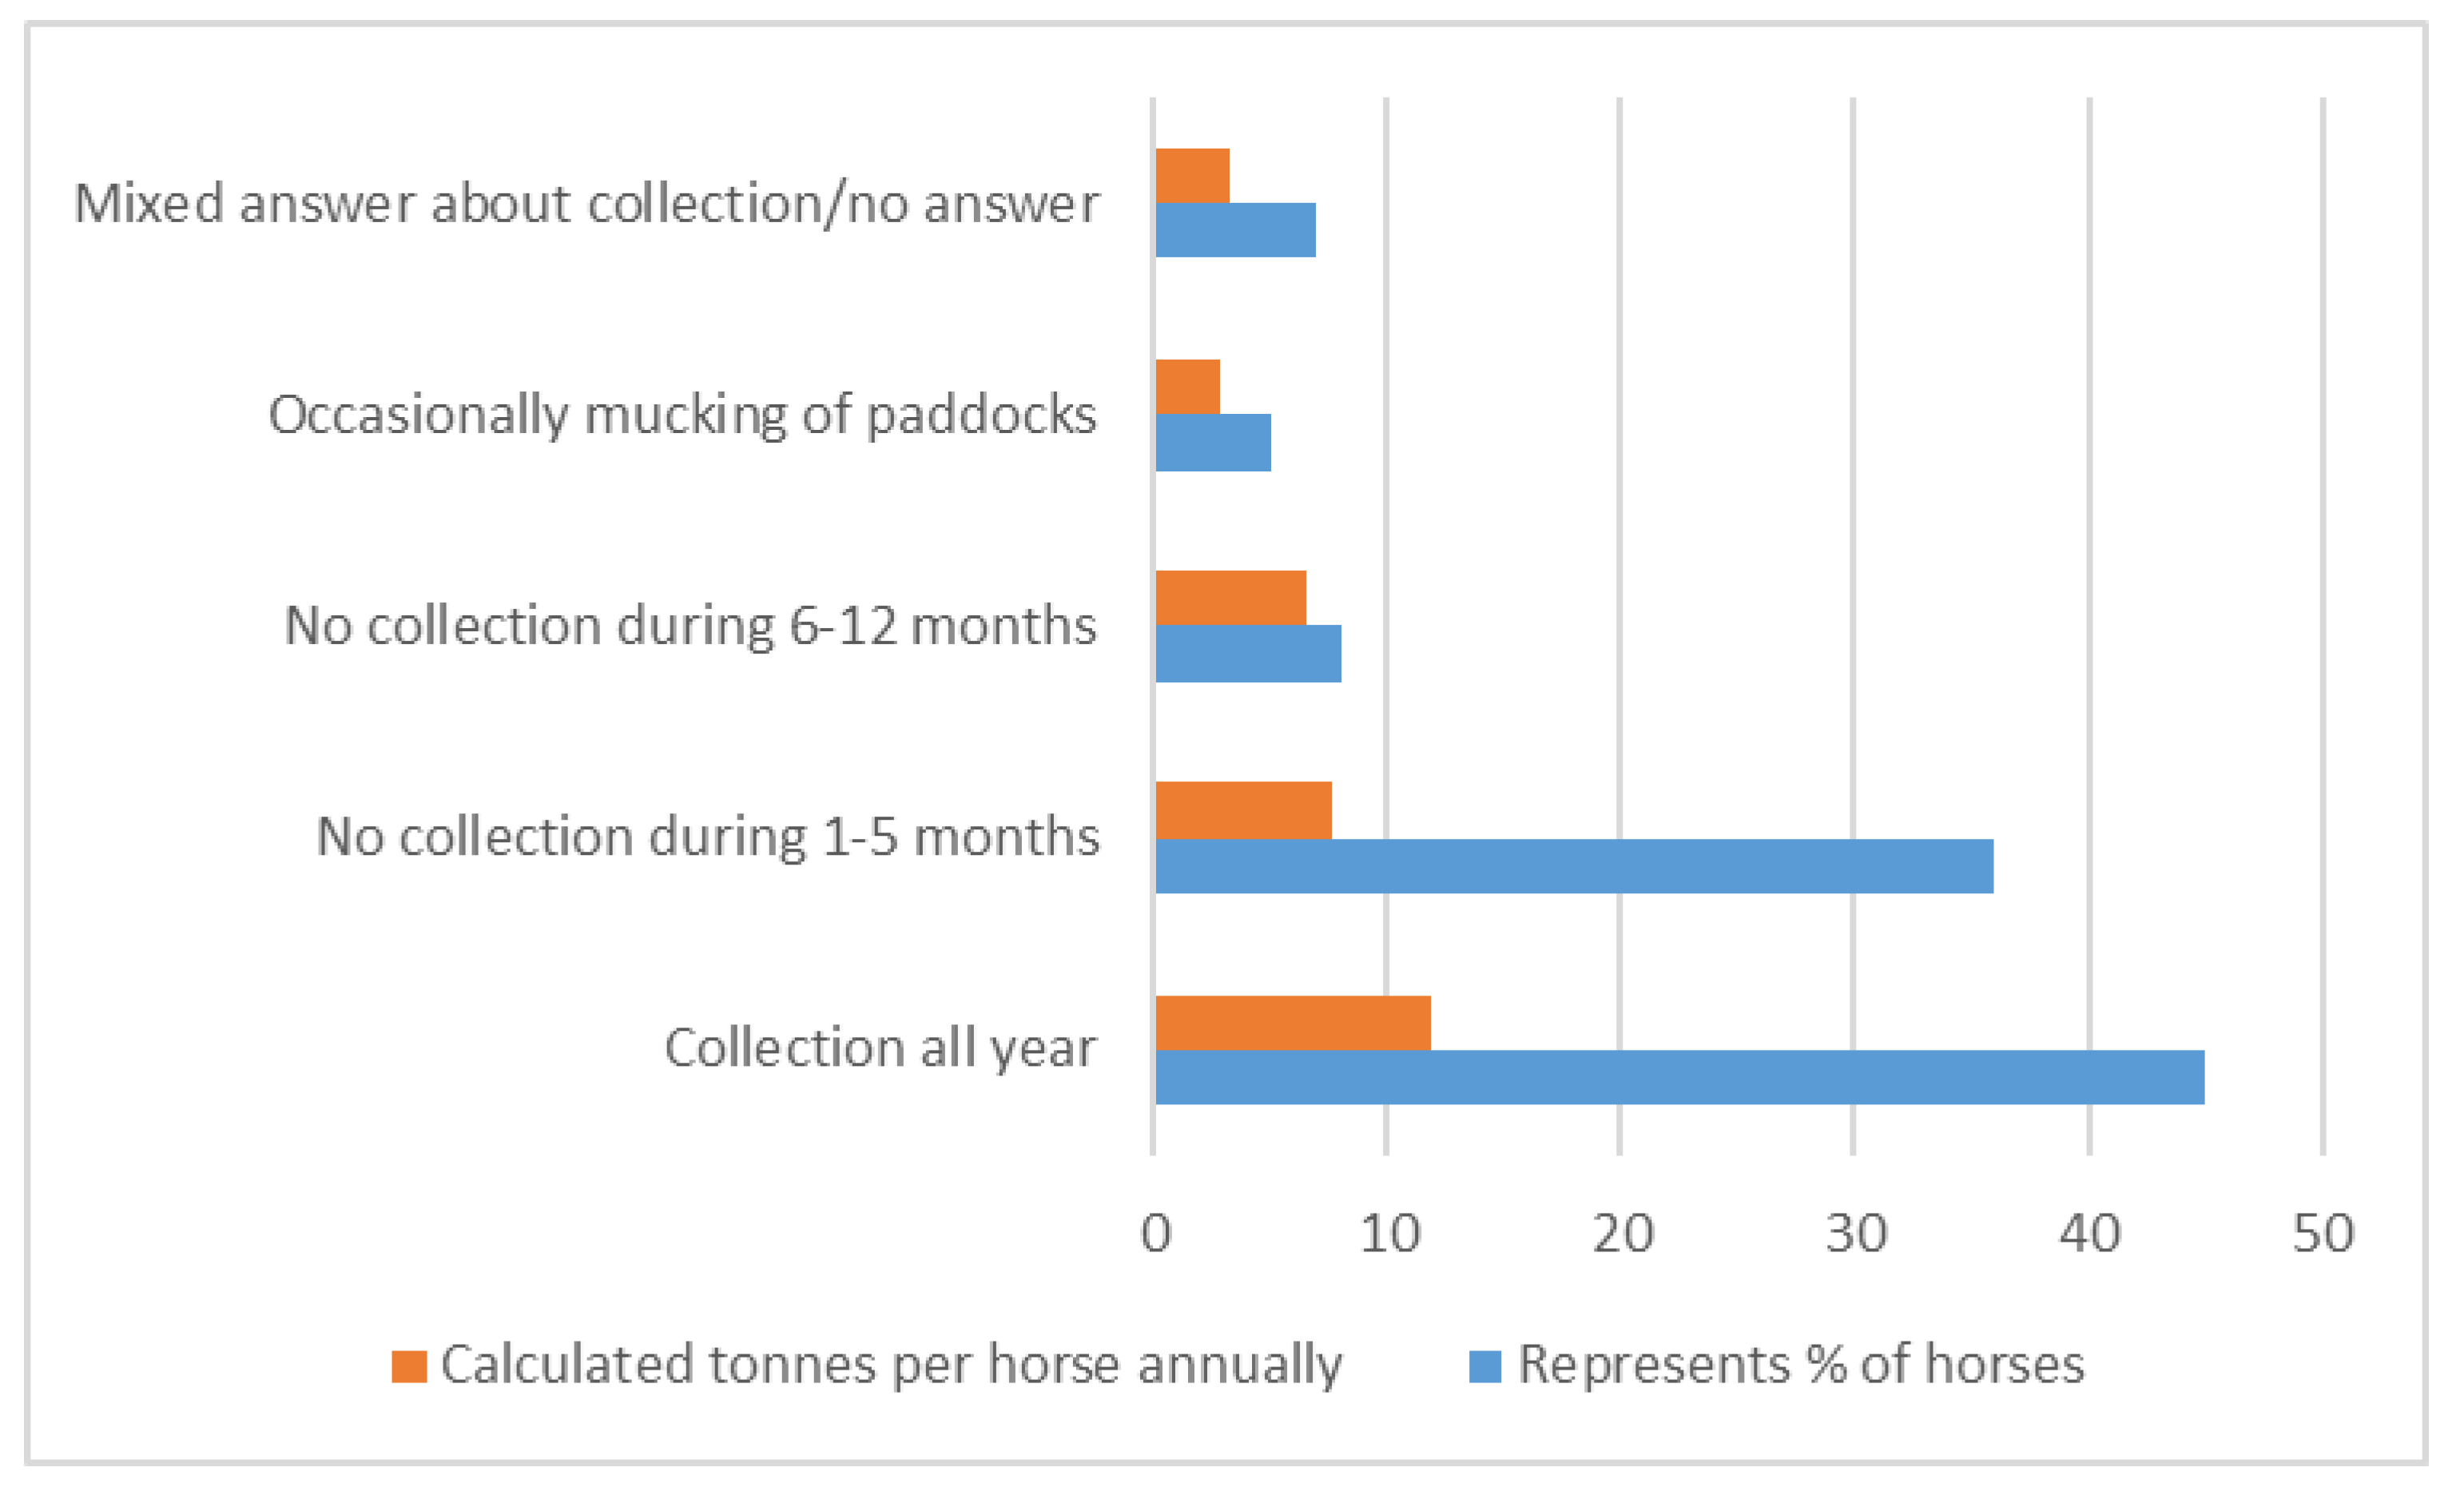
The type of housing affects the possibility of collecting horse manure and the amount of bedding. Most horse keepers in this study (69%) keep horses in stables, 15% use loose housing in combination with stables, and 15% use loose housing exclusively. One horse keeper (1%) uses paddocks to a great extent. The amount of manure collected was derived from the estimated (by the horse keepers) amount and calculated (by the authors); the range was between 2 tonnes per horse and year for loose housing, while for horses held in stables the estimated output is an average of 11 tonnes per horse and year. This difference is explained by (1) interpretation of horse keepers’ information on collected manure amount and (2) the fact that manure collection is easier and more often performed when horses are kept stabled. Results on mucking regime are displayed in Figure 2.
Figure 2 shows the percentage of horses in the case grouped into various time periods where horses are kept outside grazing/in pastures without collection of horse manure and calculations of corresponding total horse manure amount per horse and year. The results are compiled from 67 horse keepers with 502 horses. The annual amount of collected horse manure from the respondents was calculated to 3–12 tonnes per horse and year. Results indicate that most horse manure is collected year-round or most of the year, representing 74% of the total horse manure amount (Figure 2). Occasional mucking outdoors is performed for 6% of the horses, while 7% of the horses are kept by horse keepers that do not muck outdoors for 6–12 months. A mix of collection/no answer represent four of these horse keepers and 51 horses.
3.1.2. Bedding Material
Table 5 depicts the use of different bedding materials in the case study. Calculated amounts of bedding indicate softwood to be the most common bedding, closely followed by peat and mixed bedding types. Different types of pellets are rarely used (called “other” in Table 5).
Horse manure with softwood bedding adds up to 11 tonnes per horse and year, in comparison to 3 tonnes for a bedding mix (Table 5). The results should be interpreted to reflect the collected amount of horse manure (manure and used bedding), as opposed to the generated amount. The difference is related to the mucking regime and the separation ability of used bedding, fresh bedding and manure.
3.1.3. Manure Storage
Horse manure storage is characterized by facility designs for stockpiling on impervious surfaces like concrete storage slabs, containers or, for one respondent, storage in sacks. These storing facilities represent 78% of the horses and 73% of the horse keepers in the case (Table 6). There are 13 horse keepers in the case assigning manure stockpiling on site on ground, representing 16% of the horse keepers. Horse keepers with few horses most frequently use stockpiling on the ground, while only one horse keeper with 25 horses stores manure directly on the ground (Table 6).
3.1.4. Disposal of Composted Manure
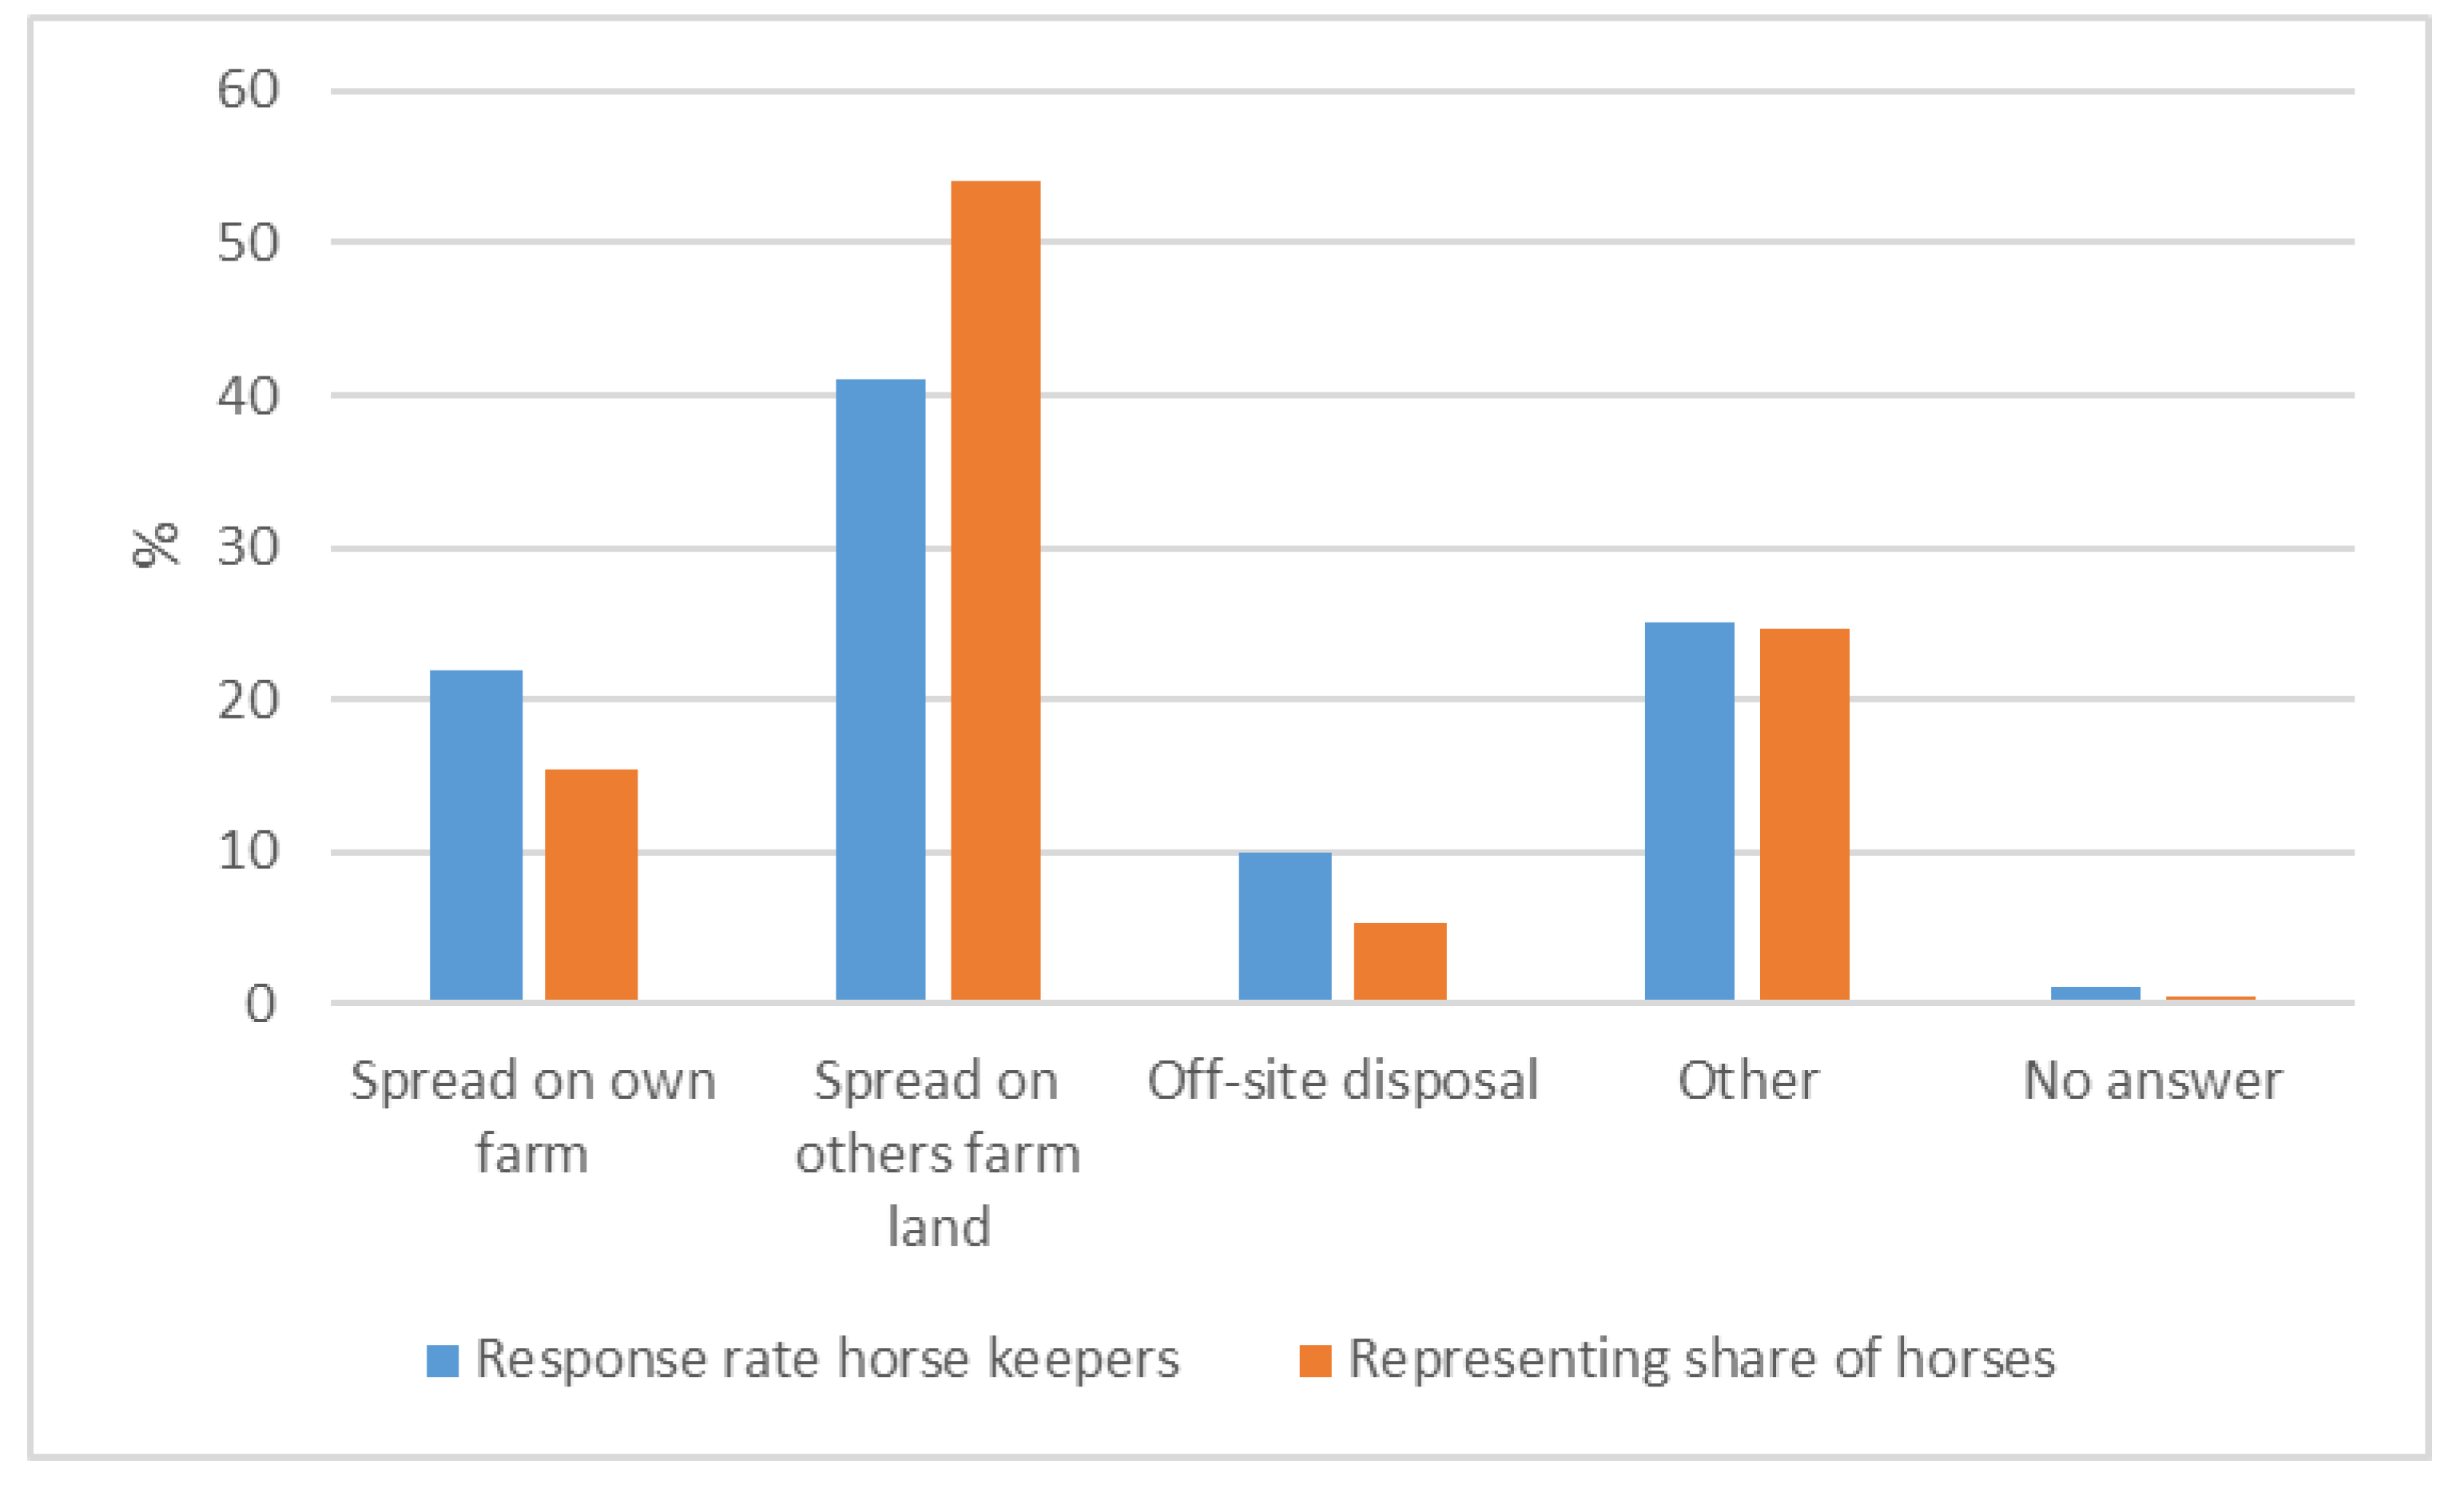
About 40% of horse keepers responded that the composted manure is subject to soil application on other people’s agricultural land (Figure 3). Other management practices are, for example, soil production or unknown destiny. About 20% of the respondents report application on the horse keeper’s own agricultural land (Figure 2). Manure disposal at an off-site disposal plant (hauling to a specific waste deposit plant) is reported by about 10% of the respondents. One horse keeper did not answer, representing three horses.
The results in Figure 3 have also been analyzed in relation to the size of the horse facility, i.e., intervals of the number of horses held, cf. Table 7. Soil application on other people’s agricultural land is frequent for all intervals (Table 7). One exception occurs in the horse keeper group with 6–10 horses, where other use (soil production and unknown use) is more common (60%). In the group with 1–2 horses, soil application is as common on own arable land as on other people’s arable land.
3.2. Environmental Impact
The material flow analysis shows the inflow and outflow of resources in the systems analysis, as amounts of used and produced resources (Table 8), followed by environmental impact assessment in Section 3.2.1, Section 3.2.2, Section 3.3.1, Section 3.3.2 and Section 3.3.3
3.2.1. Relative Impact from Transport
The relative impact from transport of horse manure to and biofertilizer from the biogas plant is shown in Table 9.
Transport’s relative contribution to acidification and eutrophication potential was minor, while transport’s contribution to CED was considerable. For GWP the relative impact exceeds 100% due to the system total accounting of arable land as a sink for carbon in digestate not being degraded after a 100-year period (Table 9).
3.2.2. Overall Results
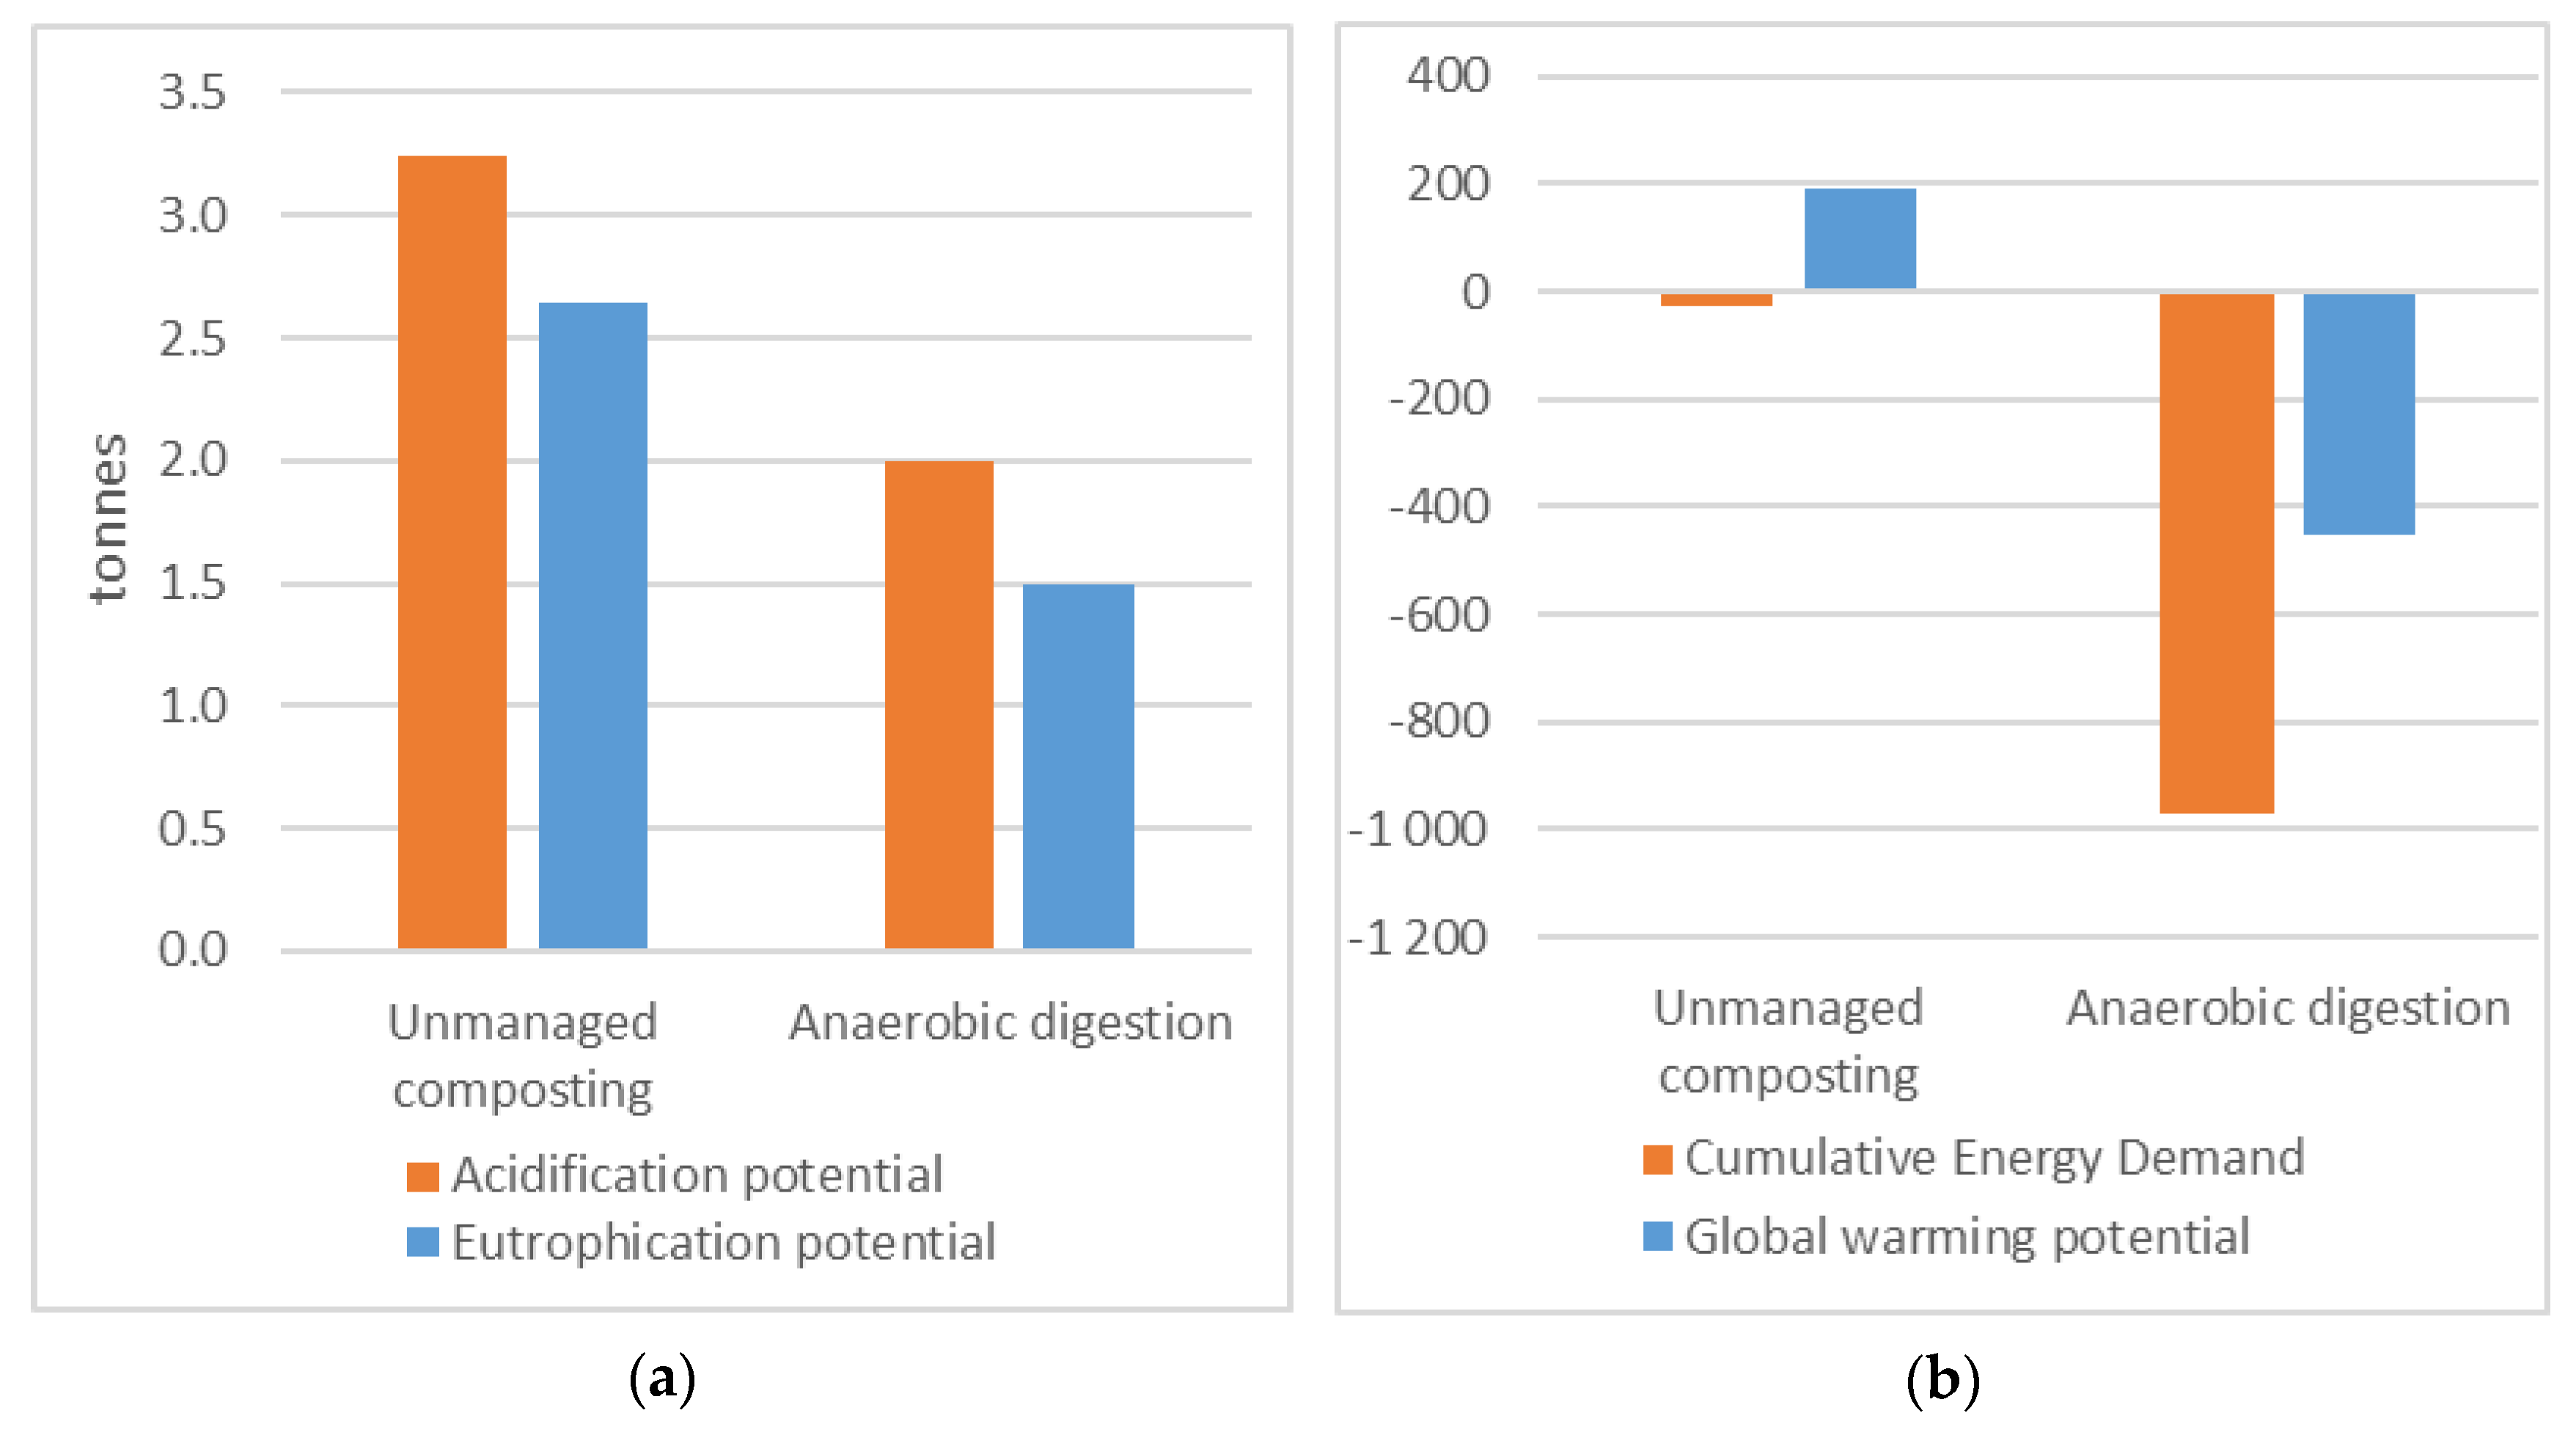
The environmental impacts for the two scenarios are summarized in Figure 4. Compared to unmanaged composting, anaerobic digestion results in lower environmental impact for all impact categories considered. In particular, GWP and CED are significantly lower for anaerobic digestion, resulting in net negative impact mainly due to avoided emissions when biogas substitutes for diesel in buses. In unmanaged composting horse manure decomposes in piles and is partly utilized as biofertilizer, and plant nutrients can to a higher degree be lost by surface run-off and as emissions to air, indicated a higher potential environmental impact from the compost process compared to the anaerobic digestion process.
The subsequent figures have been included to understand the underlying explanations of the results. In Figure 5, Figure 6, Figure 7 and Figure 8 the core system (waste management) is comprised of manure collection (present in Scenario 2), treatment (composting or anaerobic digestion including field application of organic fertilizer) and transport (vehicle gas from upgrading facility to filling station, digestate from anaerobic digestion plant (AD) to spreading area). The compensatory system consists of the avoided conventional production of chemical fertilizer and diesel fuel.
The trend in CED (Figure 5) is similar for the two scenarios, but the magnitudes are much higher for anaerobic digestion. The sum of collection and transport in Scenario 2 vastly exceeds the total values for the composting scenario, but as savings from using fertilizer and vehicle fuel are even higher, the anaerobic digestion scenario indicates the largest savings (a factor of 30).
In terms of global warming potential (Figure 6), unmanaged composting results in a net contribution to global warming potential from the composting process, mainly from methane formation in the compost process [40]. Some minor savings are accounted for due to the carbon sink in arable land (organic/biogenic carbon is sequestered in the soil after a period of at least 100 years). For the anaerobic digestion scenario, emissions from collection and transport are minor and treatment actually adds to the negative contribution due to the carbon sink. Savings when biogas replaces diesel are extremely high, indicating AD as the best option.
Figure 7 and Figure 8 show AP and EP for the scenarios, where AD performs better than composting due to lower NH3 emissions from the main treatment process. Almost all contributing emissions in the AD scenario are found for biofertilizer application, where the model calculates energy consumption and emissions from spreading residues on fields [40].
3.3. Sensitivity Analysis
In the sensitivity analysis the importance of parameters associated with high uncertainty or variation have been investigated: manure amount, bedding type, transport distance, vehicle size and fuel type.
3.3.1. Manure Amount
Based on respondents’ estimations, the average horse manure amount was calculated as 8.6 tonnes per horse and year. In the sensitivity analysis, the amount of horse manure produced was set to 3 or 12 tonnes per horse and year, based on reported variation in collected manure amounts at the case facilities. The change corresponded to 65% (2700 tonnes) less and 40% (1700 tonnes) more collected horse manure, respectively, compared to Scenario 2. These changes caused consequences for both transport and biogas production. Considering manure transport, the environmental impact decreased with less horse manure and increased for more. However, when also including treatment and substitution of fossil fuels for a lower amount of manure, EP and AP decreased while CED and GWP increased due to the lower amount of produced biogas to replace fossil fuels. For the higher amount of 12 tonnes per horse and year the results were the opposite, with increased acidification and eutrophication and decreased global warming potential and CED.
3.3.2. Bedding Type
The mix of softwood, straw, peat and other, which is constructed based on respondents’ estimations, resulted in 529 tonnes of bedding material. In simulations other bedding material was defined as wood (pellets of wood), straw (pellets of straw) and waste paper (paper pellets or paper cuttings). In a sensitivity analysis, simulations were performed with softwood, straw, peat, and waste paper, one at a time. Results for cumulative energy demand are depicted in Figure 9.
The CED is negative (i.e., savings of primary energy), independent of bedding material. Softwood bedding is just slightly better than the bedding mix in Scenario 2 due to the high share of softwood in the bedding mix. Using waste paper as bedding leads to the highest savings of energy resources, while peat has poor performance—worse than the baseline scenario but still with net savings. The results confirm the results of a previous study on methane potential [15], where the most positive energy balance was indicated for waste paper, followed by straw, softwood and peat.
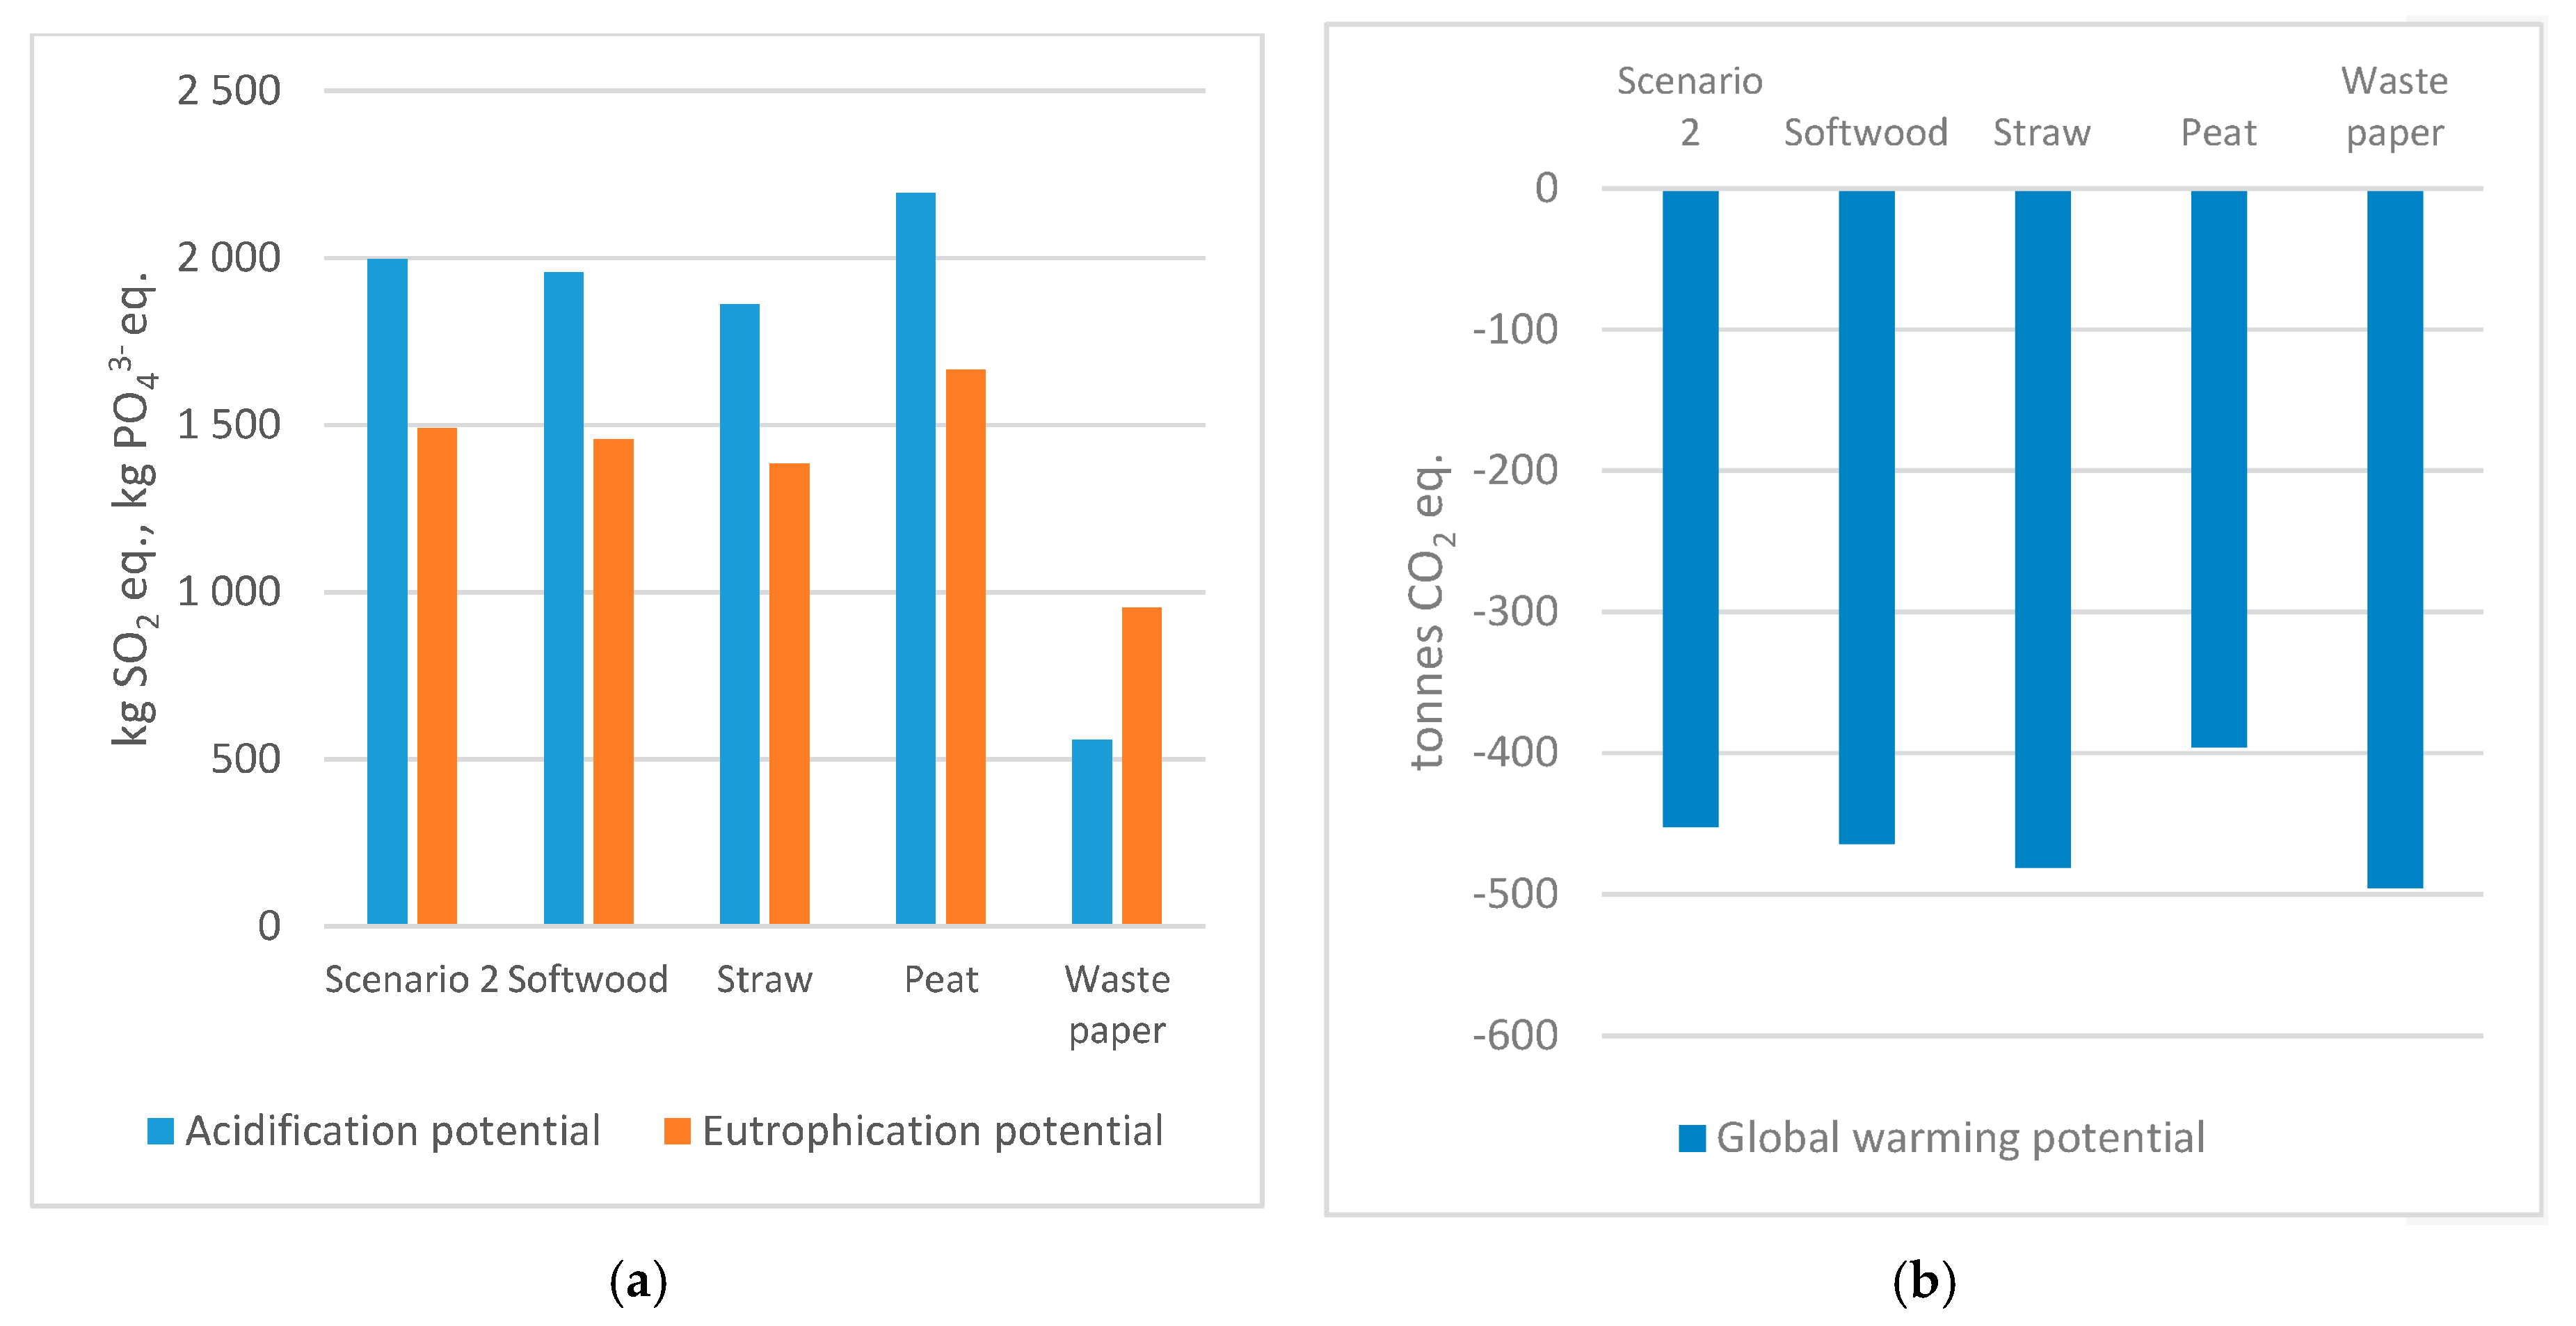
Air emissions contributing to AP and EP for various beddings are displayed in Figure 10a. The lowest impact is found when waste paper is used as the sole bedding material, whereas a change in any of the other bedding materials does not change much compared to Scenario 2. The global warming potential (Figure 10b) does not differ much in simulations of the different beddings, with values varying by approximately 10% compared to Scenario 2.
Simulations with single bedding materials for Scenario 1 (unmanaged composting) indicated a negative cumulative energy demand for all bedding types, ranging between −22 MWh for waste paper and −33 MWh for peat, to be compared with the bedding mix with −29. Furthermore, simulations indicated that AP and EP increased for unmanaged composting when the bedding material was 100% peat, while waste paper, straw and softwood resulted in a lower potential environmental impact than for the bedding mix. Again, using 100% softwood bedding does not alter the baseline results much as it was a high share of the bedding mix. The composting sensitivity analysis indicated the highest GWP for waste paper, almost no change for softwood and lower for straw and peat, in comparison to the case bedding mix.
3.3.3. Transport Distance, Vehicle Size, and Fuel Type
In Scenario 2, the respondents’ locations in relation to an expected anaerobic digestion plant resulted in a total distance of 1679 km. In the sensitivity analysis, the distance changed by ±10%. The results then varied by ±2 tonnes for GWP, ±1 kg for EP, ±4 kg for AP, and ±8 MWh for CED. These are all minor changes. An additional analysis of the results shows that, in the case of anaerobic digestion and adjoining transport, the total transport distance could increase by 40 times before the same level of global warming potential would be reached as for unmanaged composting. This is well beyond the level of uncertainty regarding transport distance.
In the next sensitivity analysis, manure transport was assumed to be performed by smaller trucks (rigid truck, 7.5–12 tonnes). Using smaller trucks should increase transport work and thus environmental impact. When looking just at the potential environmental impact from transport, GWP emissions and CED increased by about 90%, whereas AP and EP emissions increased by 105% compared to Scenario 2 transport. When calculations were based solely on the larger truck type (truck with trailer, 28–34 tonnes), the potential environmental impact instead decreased by 10% for GWP and cumulative energy demand, and 16% and 18% for AP and EP, respectively.
In Scenario 2 European diesel B5 was used as the vehicle fuel for transporting manure to the plant (Table 8). In a sensitivity analysis the fuel was changed to HVO made from either waste cooking oil or palm oil, using data from [47]. The sensitivity analysis only comprised CED and GWP due to data scarcity. The analysis indicated that if waste cooking oil HVO is used, GWP from transport is reduced by 90% and CED is reduced by 86%. The use of palm oil HVO reduced GWP by 59% and CED by 4%.
3.4. Economic Assessment
The combined assessment also includes an economic assessment of horse manure treatments, based on the costs for the horse owner. The cost analysis was performed in a very simplistic way through an inventory of costs associated with (1) storage and composting on-site and (2) storage, collection and transport to an anaerobic digester. For the composting scenario, the manure is stored on a concrete plate in the vicinity of where the horses are held, and local farmers or private persons retrieve the compost. It is assumed that there are no associated costs with this baseline option, as the municipality places restrictions on the safe storage of manure and the utilization of compost means no cost for the horse owner. In a systems perspective these omitted costs are “hidden” costs but it is reasonable to exclude these if drivers and barriers for the horse owners are the focus. The biogas scenario comprises costs associated with a container solution for storage and collection/transport of the manure to the treatment facility and the reception fee at the AD plant. As container sizes of 10 or 22 m3 seem to dominate the market, costs are presented for both these options and for the whole case where these sizes have been applied. These containers are loaded with 5 and 10 tonnes of manure, respectively, which in combination with the annual manure amount determines how often manure is being collected. The reception fee is supposed to reflect the costs (investment, running and maintenance costs) of the main process and utilization of biofertilizer and biogas. In a systems perspective, either revenues for biogas and biofertilizer or avoided costs for fossil vehicle fuel and mineral fertilizer should be included. These are excluded using the horse owner perspective but is still indicated to show the societal benefits. The cost inventory is found in Table 10 and the costs for Scenario 2 are found in Table 11.
Renting a 22 m3 container is more expensive than a 10 m3 container when calculated per volume and month or per tonne and month (maximum loads are 5 and 10 tonnes, respectively) [48]. The rent presented in [49] probably refers to a 10 m3 container. Costs for collection vary vastly between different references. This may be due to the fact that container services to minor customers/private persons can be considered minor isolated markets with few stakeholders. This also holds for treatment where reception fees vary a lot; in one study the gate fee is calculated to vary from −100 SEK/ton to 500 SEK/ton depending on financial support and sanitation requirements [52].
In Table 11 two examples are shown, 18 and 64 annual metric tonnes, respectively, which—using 8.6 tonnes manure/horse, year (found in the case study)—correspond to two or seven horses. The lower figure reflects the median amount in the case, whereas the higher figure is the average value. Calculations are made based on data from Table 10 following references in Table 11.
Choosing the 10 m3 alternative means a moderate cost for storing, but with a smaller container the manure has to be collected more often, leading to a higher collection cost. The 22 m3 alternative is the other way round. For small horse facilities with two horses, the total cost varies considerably between the two container solutions. For the seven-horse case, the total cost is independent of container size.
From a horse owner’s perspective the cost per horse and year could be seen in relation to the cost for fodder, which is roughly 7000–10,000 SEK/year (own calculations). From a societal perspective, this cost should be seen in relation to the benefit created, i.e., vehicle fuel and plant nutrients. With a vehicle gas price of 19 SEK/kg, the market value of biogas is approximately 2 MSEK. The value of the biofertilizer is somewhat more complicated to determine as some is mixed into plant soil, some is used by farmers for soil improvement where the market value is hard to determine, and some may be sold to private persons. One way to assess the value of biofertilizer is to account for the content of NPK and the avoided cost for mineral fertilizer. According to our estimations, the market value of the nitrogen and phosphorous content is approximately 0.1 MSEK.
Supply chain costs for horse manure in Sweden have been calculated by Svanberg et al. [31]. The case study results in Table 11 have been translated into euros, and compared to Svanberg et al. in Table 12. The costs in the case study are much higher than in Svanberg et al., mainly due to higher costs for container rent.
4. Discussion
4.1. On Site Manure Management
Methane production is different depending on the type of bedding material. Methane potential is crucial as the more methane that is produced, the more fossil fuels can be replaced by biogas. The best material to digest according to the simulations is waste paper, which has the lowest environmental impact; straw is also competitive, having the lowest CED.
Treatment of horse manure away from horse keeping sites requires manure collection both outdoors and indoors and storage in containers, or on concrete slabs followed by loading in containers. In this exploratory case study, most horse keepers collect horse manure left outside all year or for parts of the year, which could coincide with a grazing period or time in paddocks. This mucking regime creates a good opportunity for energy utilization as it already involves collection before transportation to a biogas plant. It should, however, be noted that outdoor collection increases the amount of collected manure without bedding material but also increases the risk of solid impurities. Sensitivity analysis summarizing environmental impact from transport and AD process indicates a reduction of GWP and CED with increased amount of horse manure, while other environmental impact categories (AP and EP) increase with a higher amount of horse manure.
Despite storage on the ground being indicated, mostly by horse keepers with few horses, horse manure was mostly stored on impervious surfaces. Storage in containers and concrete slabs was apparent to a greater extent in the case municipality than in Swedish statistics [10].
4.2. Manure Transport
Treatment of horse manure in a central anaerobic digestion plant requires manure transport, which is facilitated by a container system. The proposed transport system was already familiar to several horse keepers in the case as manure is either directly collected in containers, or temporarily stored on concrete slabs and then removed. Transport is a prerequisite for anaerobic digestion of manure, which adds environmental impact to the AD system, but also increases the amount of substrate available for biogas production and fertilizer production. In terms of GWP, the emissions avoided when biogas replaces diesel and biofertilizer replaces fertilizer are about 10 times greater than the emissions from transporting the manure to the plant. The AD process, including biofertilizer application on arable land, makes a negative contribution to GWP as it works as a carbon sink. The GWP impact from digestate application is larger than that of spreading composted horse manure due to (1) the higher content of water in the digestate, causing higher emissions from digestate transport and (2) less carbon left in the residue as most of the carbon has been converted to biogas. The sensitivity analyses of manure transport show that the impact from transport can increase significantly before the total impact equals the impact from unmanaged composting. A sensitivity analysis of transport also reflects logistical strategic decisions like use of fuel and what trucks to use for transport [25]. The sensitivity analysis indicated a large decrease of environmental impact from transport if HVO replaced diesel, pointing at improvement potential in choice of fuel for the necessary transport for energy recovery. Furthermore, s lower environmental impact is obtained for transport with larger trucks, due to the higher cargo capacity. A positive effect on environmental impact from less frequent and larger transport is also presented by Aronsson and Brodin [25]. Choice of fuel and type of vehicle are aspects of the efficient collection of horse manure, and decisions about this are part of the planning that would have to take place if a transport system for horse manure was implemented. Choice of trucks comprises not only the loading capacity but also assessment of road viability for heavy trucks and loads, and therefore a mix of lighter and heavier trucks is more probable than sole use of the largest trucks.
4.3. Environmental Impact
Simulations indicated horse manure treatment in AD with associated transport to reduce environmental impact for all categories; while CED and GWP are decreased (net savings) in the anaerobic system, AP and EP still have a net contribution. In simulations, environmental impact from unmanaged composting was 70% higher for EP and 50% higher for AP. Unmanaged composting is resource-efficient as it only reaches 3% of the CED for AD. For GWP unmanaged composting has a net contribution, while AD leads to double the savings. Anaerobic digestion uses energy in the processes (for example upgrading, heating, and stirring), but contributes to the change from fossil fuels to renewable fuels for transport, thereby reducing the total potential environmental impact from the system according to simulations and calculations.
4.4. Biofertilizer Application and Nutrient Recycling
A change from compost to digestate in terms of application on arable land has some implications as solely solid manure is converted to a liquid digestate when using a liquid anaerobic digestion plant. This may affect where plant nutrients are being spread, depending on machinery and the need for plant nutrients in the area of an expected biogas plant. Most horse keepers use softwood for bedding, which corresponds to estimated Swedish statistics [10]. The use of softwood is also positive for low nitrogen leakage and run-off, which are also affected by turning and cover of compost [14,16]. Whether or not horse keepers turn or cover their manure piles was not investigated in this case, but it was noticed that turning of compost to facilitate degradability was mentioned by a couple of horse keepers. There seems to be a high level of nutrient recycling in the BAU scenario as most horse keepers in the case spread horse manure on others’ or their own arable land. There is a strengthened need for cooperation between farmers and horse keepers to close natural cycles of plant nutrients based on the findings in the case. Other recycling systems described in the case were horse manure turned into soil, composted, and collected by households for gardening. Nutrient recycling is beneficial for the business-as-usual scenario as scarce plant nutrients are currently recycled, but also for a future system where horse manure is subject to energy recovery before the biofertilizer is spread on arable land.
4.5. Cost Assessment
The major benefit of the cost assessment is that it puts expected manure management costs for the horse keeper in perspective against the other costs associated with horse keeping, and also in relation to the benefits for society. The major drawback of the present assessment is that it is incomplete; it does not sum up all costs for the life cycle of either unmanaged composting or anaerobic digestion, and it does not include environmental costs. Furthermore, it does not point to cash flow for different stakeholders in the value chain and thus cannot be used to make any predictions on effective policy instruments. Most horse keepers are private people with few horses, and their willingness to pay is uncertain. However, some of the horse facilities with many horses exist on a commercial basis and may have the ability to take on increased costs. Such differences in raw material supply must be addressed when improving the cost assessment. By expansion of the cost assessment, comprising a higher level of detail, different policy measures such as tighter regulations on environmental permits for horse keeping, subsidy for reduction of methane leakage, or producer responsibility on horse manure could be evaluated. Also, other measures would be of interest in order to affect the pricing of horse manure as a renewable resource. For example, increasing the demand for (and the price of) biogas could lead to lower reception fees at the biogas plant, and horse manure can also be made more attractive as a substrate by different measures in horse keeping, such as enhanced medicine control and optimization of bedding practices.
4.6. Uncertainties
Answers in the questionnaire have been the basis for calculations of total amounts of horse manure and collected amounts of horse manure. Interpretations of horse keeper answers were necessary and sometimes assumptions about amounts of bedding and horse manure were made. Even accounting for such uncertainty, the case illustrates horse manure characteristics and aspects of horse manure management of importance for energy recovery.
In a previous paper [4], potential factors of importance in horse manure management were identified. Examples of factors not included in the questionnaire were feeding practices, soil conditions, spreading method, and time of storage. Horse keeper estimations of horse manure amount are assumed to cover the fact that feeding affects the amount and content of produced horse manure. The aspects of spreading method and time of storage are taken into account in the ORWARE simulations as emissions to air and water from unmanaged composting and anaerobic digestion and emissions from application of compost and digestate on arable land.
In Scenario 1 (unmanaged composting) no transport of manure was included, as composting is assumed to be located at the horse keeping site, representing one of the differences between treatment methods identified in earlier studies and visualized in this study. A liquid anaerobic digestion process was used in simulations due to a lack of reliable data on a dry anaerobic process, thus a possible difference in processes is not investigated in this study.
5. Conclusions
The case study contributed with real data on horse manure management practices and related environmental and economic impact. Some of the major findings are:
- Horse manure management in the case is characterized by collection of horse manure most of the year and storage on concrete slabs or in containers followed by spreading on agricultural land;
- Bedding material, most often softwood, is a minor component of the manure mix;
- Anaerobic digestion reduces the potential environmental impact in comparison to unmanaged composting;
- Transport constitutes an increase in potential environmental impact that is lower than the reduced potential environmental impact to which anaerobic digestion contributes;
- Horse keeper costs for manure management will increase for anaerobic digestion as compared to unmanaged composting on site;
- The costs of manure management are of the same magnitude as feeding costs.
Due to the conclusion that environmental impact is reduced if horse manure is transported to an expected biogas plant, further research could address energy companies’ willingness to use horse manure as a biogas feedstock. Depending on their answers, continued research might consider horse keepers’ willingness to adapt to energy companies’ requests to, for example, change bedding or perform thorough sorting at the site to ensure good quality of feedstock.
Acknowledgments
Gilnaz Mirzajee, Antonia Jäderberg, Linus Svensson, and Niklas Jonsäll are acknowledged for performing telephone interviews with horse keepers. Officials at the County Administrative Board and in the municipality are acknowledged for their information about horse keepers. The University of Gävle is acknowledged for funding the study.
Author Contributions
Åsa Hadin conceived, designed, and analyzed the case study with support from Karl Hillman; All authors conceived the simulations. Ola Eriksson performed the simulations; Karl Hillman prepared for and Åsa Hadin performed calculations. Åsa Hadin analyzed data and wrote the paper with support from Karl Hillman and Ola Eriksson.
Conflicts of Interest
The authors declare no conflict of interest.
Appendix A
Figure A1.
Questions in the telephone questionnaire to horse keepers.

References
- European Commission. Report from the Commission to the European Parliament, the Council, the European Economic and Social Committee and The Committee of the Regions on the implementation of the Circular Economy Action Plan; European Commission: Brussels, Belgium, 2017. [Google Scholar]
- Pan, S.Y.; Du, M.A.; Huang, I.T.; Liu, I.H.; Chang, E.E.; Chiang, P.C. Strategies on implementation of waste-to-energy (WTE) supply chain for circular economy system: A review. J. Clean. Prod. 2014, 108, 409–421. [Google Scholar]
- Rockström, J.; Steffen, W.; Noone, K.; Persson, Å.; Chapin, F.S., III; Lambin, E.; Lenton, T.; Scheffer, M.; Folke, C.; Schellnhuber, H.J.; et al. Planetary boundaries: Exploring the safe operating space for humanity. Ecol. Soc. 2009, 14. [Google Scholar] [CrossRef]
- Hadin, Å.; Eriksson, O.; Hillman, K. A review of potential critical factors in horse keeping for anaerobic digestion of horse manure. Renew. Sustain. Energy Rev. 2016, 65, 432–442. [Google Scholar] [CrossRef]
- Elgåker, H.; Pinzke, S.; Lindholm, G.; Nilsson, C. Horse keeping in urban and peri-urban areas: New conditions for physical planning in Sweden. Geogr. Tidsskr. Dan. J. Geogr. 2010, 110, 81–98. [Google Scholar] [CrossRef]
- Elgåker, H.E. The new equine sector and its influence on multifunctional land use in peri-urban areas. GeoJournal 2012, 77, 591–613. [Google Scholar] [CrossRef]
- Parvage, M.M.; Ulén, B.; Kirchmann, H. Are horse paddocks threatening water quality through excess loading of nutrients? J. Environ. Manag. 2015, 147, 306–313. [Google Scholar] [CrossRef] [PubMed]
- Airaksinen, S.; Heiskanen, M.-L.; Heinonen-Tanski, H. Contamination of surface run-off water and soil in two horse paddocks. Bioresour. Technol. 2007, 98, 1762–1766. [Google Scholar] [CrossRef] [PubMed]
- Parvage, M.M.; Ulén, B.; Kirchmann, H. A survey of soil phosphorus (P) and nitrogen (N) in Swedish horse paddocks. Agric. Ecosyst. Environ. 2013, 178, 1–9. [Google Scholar] [CrossRef]
- Enhäll, J.; Nordgren, M.; Kättström, H. Hästhållning i Sverige 2010; Swedish Board Agriculture Report; Swedish Board of Agriculture: Jönköping, Sweden, 2012. [Google Scholar]
- Wartell, B.A.; Krumins, V.; Alt, J.; Kang, K.; Schwab, B.J.; Fennell, D.E. Methane production from horse manure and stall waste with softwood bedding. Bioresour. Technol. 2012, 112, 42–50. [Google Scholar] [CrossRef] [PubMed]
- Airaksinen, S.; Heinonen-Tanski, H.; Heiskanen, M.-L. Quality of different bedding materials and their influence on the compostability of horse manure. J. Equine Vet. Sci. 2001, 21, 125–130. [Google Scholar] [CrossRef]
- Mönch-Tegeder, M.; Lemmer, A.; Oechsner, H.; Jungbluth, T. Investigation of the methane potential of horse manure. Agric. Eng. Int. CIGR J. 2013, 15, 161–172. [Google Scholar]
- Komar, S.; Miskewitz, R.; Obropta, C.; Bamka, W.; Mickel, R. Evaluation of nutrient runoff from three equine stall waste storage systems. Appl. Eng. Agric. 2010, 26, 827–832. [Google Scholar] [CrossRef]
- Hadin, Å.; Eriksson, O. Horse manure as feedstock for anaerobic digestion. Waste Manag. 2016, 56, 506–518. [Google Scholar] [CrossRef] [PubMed]
- Steineck, S.; Svensson, L.; Tersmeden, M.; Åkerhielm, H.; Karlsson, S. Miljöanpassad Hantering av Hästgödsel; Institutet för jordbruks-och miljöteknik (JTI): Uppsala, Sweden, 2001. [Google Scholar]
- Lundgren, J.; Pettersson, E. Combustion of horse manure for heat production. Bioresour. Technol. 2009, 100, 3121–3126. [Google Scholar] [CrossRef] [PubMed]
- Ruile, S.; Schmitz, S.; Mönch-Tegeder, M.; Oechsner, H. Degradation efficiency of agricultural biogas plants—A full-scale study. Bioresour. Technol. 2015, 178, 341–349. [Google Scholar] [CrossRef] [PubMed]
- Baky, A. Life Cycle Inventory & Assessment Report: Combustion of Horse Manure with Heat Utilisation, Sweden; Baltic Manure: Jokioinen, Finland, 2013. [Google Scholar]
- Eriksson, O.; Hadin, Å.; Hennessy, J.; Jonsson, D. Life cycle assessment of horse manure treatment. Energies 2016, 9, 1011. [Google Scholar] [CrossRef]
- Berglund, M. Biogas Production from a Systems Analytical Perspective; Lund University: Lund, Sweden, 2006. [Google Scholar]
- Börjesson, P.; Berglund, M. Environmental systems analysis of biogas systems-Part II: The environmental impact of replacing various reference systems. Biomass Bioenergy 2007, 31, 326–344. [Google Scholar] [CrossRef]
- European Commission. Energy 2020. A Strategy for Competitive, Sustainable and Secure Energy; European Commission: Brussels, Belgium, 2010. [Google Scholar]
- European Commission. Roadmap to a Single European Transport Area—Towards a Competitive and Resource Efficient Transport System; European Commission: Brussels, Belgium, 2011. [Google Scholar]
- Aronsson, H.; Huge Brodin, M. The environmental impact of changing logistics structures. Int. J. Logist. Manag. 2006, 17, 394–415. [Google Scholar] [CrossRef]
- Kusch, S.; Oechsner, H.; Jungbluth, T. Biogas production with horse dung in solid-phase digestion systems. Bioresour. Technol. 2008, 99, 1280–1292. [Google Scholar] [CrossRef] [PubMed]
- Yang, L.; Huang, Y.; Zhao, M.; Huang, Z.; Miao, H.; Xu, Z.; Ruan, W. Enhancing biogas generation performance from food wastes by high-solids thermophilic anaerobic digestion: Effect of pH adjustment. Int. Biodeterior. Biodegrad. 2015, 105, 153–159. [Google Scholar] [CrossRef]
- Qiao, W.; Yan, X.; Ye, J.; Sun, Y.; Wang, W.; Zhang, Z. Evaluation of biogas production from different biomass wastes with/without hydrothermal pretreatment. Renew. Energy 2011, 36, 3313–3318. [Google Scholar] [CrossRef]
- Westendorf, M.L.; Joshua, T.; Komar, S.J.; Williams, C.; Govindasamy, R. Case study: Manure management practices on New Jersey equine farms. Prof. Anim. Sci. 2010, 26, 123–129. [Google Scholar] [CrossRef]
- Prokopy, L.S.; Perry-Hill, R.; Reimer, A.P. Equine Farm Operators: An Underserved Target Audience for Conservation Practice Outreach? J. Equine Vet. Sci. 2011, 31, 447–455. [Google Scholar] [CrossRef]
- Svanberg, M.; Finnsgård, C.; Flodén, J.; Lundgren, J. Analyzing animal waste-to-energy supply chains: The case of horse manure. Renew. Energy 2017. [Google Scholar] [CrossRef]
- Yin, R.K. Case Study Research Design and Methods, 3rd ed.; Sage Publications Inc.: Thousand Oaks, CA, USA, 2003; ISBN 0-7619-2552-X. [Google Scholar]
- Eriksson, O.; Frostell, B.; Björklund, A.; Assefa, G.; Sundqvist, J.-O.; Granath, J.; Carlsson, M.; Baky, A.; Thyselius, L. ORWARE—A simulation tool for waste management. Resour. Conserv. Recycl. 2002, 36, 287–307. [Google Scholar] [CrossRef]
- NTM NTM Calc 4.0. Network for Transport Measures. Stockhom, Sweden. Available online: https://www.transportmeasures.org/en/ (accessed on 5 April 2017).
- Hittapunktse AB Maps, Directions, Adresses Telephone Numbers. Available online: https://www.hitta.se/ (accessed on 15 March 2017).
- Assefa, G.; Björklund, A.; Eriksson, O.; Frostell, B. ORWARE: An aid to environmental technology chain assessment. J. Clean. Prod. 2005, 13, 265–274. [Google Scholar] [CrossRef]
- Eriksson, O.; Reich, M.C.; Frostell, B.; Björklund, A.; Assefa, G.; Sundqvist, J.O.; Granath, J.; Baky, A.; Thyselius, L. Municipal solid waste management from a systems perspective. J. Clean. Prod. 2005, 13, 241–252. [Google Scholar] [CrossRef]
- Eriksson, O.; Bisaillon, M.; Haraldsson, M.; Sundberg, J. Enhancement of biogas production from food waste and sewage sludge—Environmental and economic life cycle performance. J. Environ. Manag. 2016, 175, 33–39. [Google Scholar] [CrossRef] [PubMed]
- Gentil, E.C.; Damgaard, A.; Hauschild, M.; Finnveden, G.; Eriksson, O.; Thorneloe, S.; Kaplan, P.O.; Barlaz, M.; Muller, O.; Matsui, Y. Models for waste life cycle assessment: Review of technical assumptions. Waste Manag. 2010, 30, 2636–2648. [Google Scholar] [CrossRef] [PubMed]
- Dalemo, M. The ORWARE Simulation Model—Anaerobic Digestion and Sewage Plant Sub-Models; Swedish University of Agricultural Sciences: Uppsala, Sweden, 1996. [Google Scholar]
- Peter, A.; Lars, E. Kunskapssammanställning-EURO VI Stadsbussar; Ecotraffic: Stockholm, Sweden, 2015. [Google Scholar]
- Guinée, J.B.; Gorrée, M.; Heijungs, R.; Huppes, G.; Kleijn, R.; van Oers, L.; Wegener Sleeswijk, A.; Suh, S.; Udo de Haes, H.A.; de Bruijn, H.; et al. Life Cycle Assessment—An Operational Guide to the ISO Standards, Part 1, 2 and 3; Institute of Environmental Sciences (CML), Leiden University: Leiden, The Netherlands, 2001. [Google Scholar]
- Klöpffer, W.; Grahl, B. Life Cycle Assessment (LCA). A Guide to Best Practice; Weiley-VCH GmbH & Co: Weinheim, Germany, 2014; ISBN 978-3-527-32986-1. [Google Scholar]
- Swedish Board of Agriculture. Hästar och Anläggningar Med Häst 2016; Swedish Board of Agriculture: Jönköping, Sweden, 2017. [Google Scholar]
- Swedish Ordinance (1998:915) on Environmental Considerations in Agriculture; SFS (1998:915); Jordbruksdepartementet: Stockholm, Sweden, 1998.
- Westendorf, M.L.; Puduri, V.; Williams, C.A.; Joshua, T.; Govindasamy, R. Dietary and manure management practices on equine farms in two New Jersey watersheds. J. Equine Vet. Sci. 2013, 33, 601–606. [Google Scholar] [CrossRef]
- Edwards, R.; Hass, H.; Larivé, J.-F.; Lonza, L.; Mass, H.; Rickeard, D.; Larive, J.-F.; Rickeard, D.; Weindorf, W. Well-to-Wheels Analysis of Future Automotive Fuels and Powertrains in the European Context; WELL-TO-TANK (WTT) Report, Version 4; The Joint Research Centre, European Union: Ispra, Italy, 2013; pp. 1–133. [Google Scholar] [CrossRef]
- Customer Support; SUEZ, Gävle, Sweden. Personal communication, 2017.
- Henriksson, G.; Willquist, K.; Björkmalm, J.; Kjerstadius, H.; Johansson, I.; Hedenstedt, A. Benchmarking av Gödselsamrötning med Avloppsslam mot Förbränning av Häst-och Djurparksgödsel; SP Sveriges Tekniska Forskningsinstitut: Borås, Sweden, 2015. [Google Scholar]
- Mattsson, M.; Karlsson, N.; Nilsson, S.B. Biogas från Hästgödsel i Halland-från Kvittblivningsproblem till Ekonomisk och Miljömässig Resurs; Högskolan i Halmstad: Halmstad, Sweden, 2015. [Google Scholar]
- Hellström, J.; Ekogas, AB, Gävle, Sweden. Personal communication, 2017.
- Olsson, H.; Andersson, J.; Rogstrand, G.; Edström, M.; Persson, P.O.; Andersson, L.; Bobeck, S.; Assarsson, A.; Benjaminsson, A.; Jansson, A. Samrötning av Hästgödsel med Nötflytgödsel–Fullskaleförsök vid Naturbruksgymnasiet Sötåsen; JTI-Institutet för jordbruks- och miljöteknik: Uppsala, Sweden, 2014; Volume 51. [Google Scholar]
Figure 1.
System description. The core system is represented by the dashed line and the compensatory system by a dotted line.
Figure 1.
System description. The core system is represented by the dashed line and the compensatory system by a dotted line.

Figure 2.
Mucking regime.

Figure 3.
Distribution of respondents’ horse manure management practices and the share of horses the practices represent.
Figure 3.
Distribution of respondents’ horse manure management practices and the share of horses the practices represent.

Figure 4.
(a) Net acidification (tonnes SO2-eq.) and eutrophication potential (tonnes PO43− eq.) from manure treatment in unmanaged composting and anaerobic digestion; (b) net cumulative energy demand (MWh) and global warming potential (tonnes CO2-eq.) from manure treatment in unmanaged composting and anaerobic digestion.

Figure 5.
(a) Cumulative energy demand for Scenario 1 (unmanaged composting on site (no transport to treatment)); (b) cumulative energy demand for Scenario 2 (manure transport and anaerobic digestion).
Figure 5.
(a) Cumulative energy demand for Scenario 1 (unmanaged composting on site (no transport to treatment)); (b) cumulative energy demand for Scenario 2 (manure transport and anaerobic digestion).
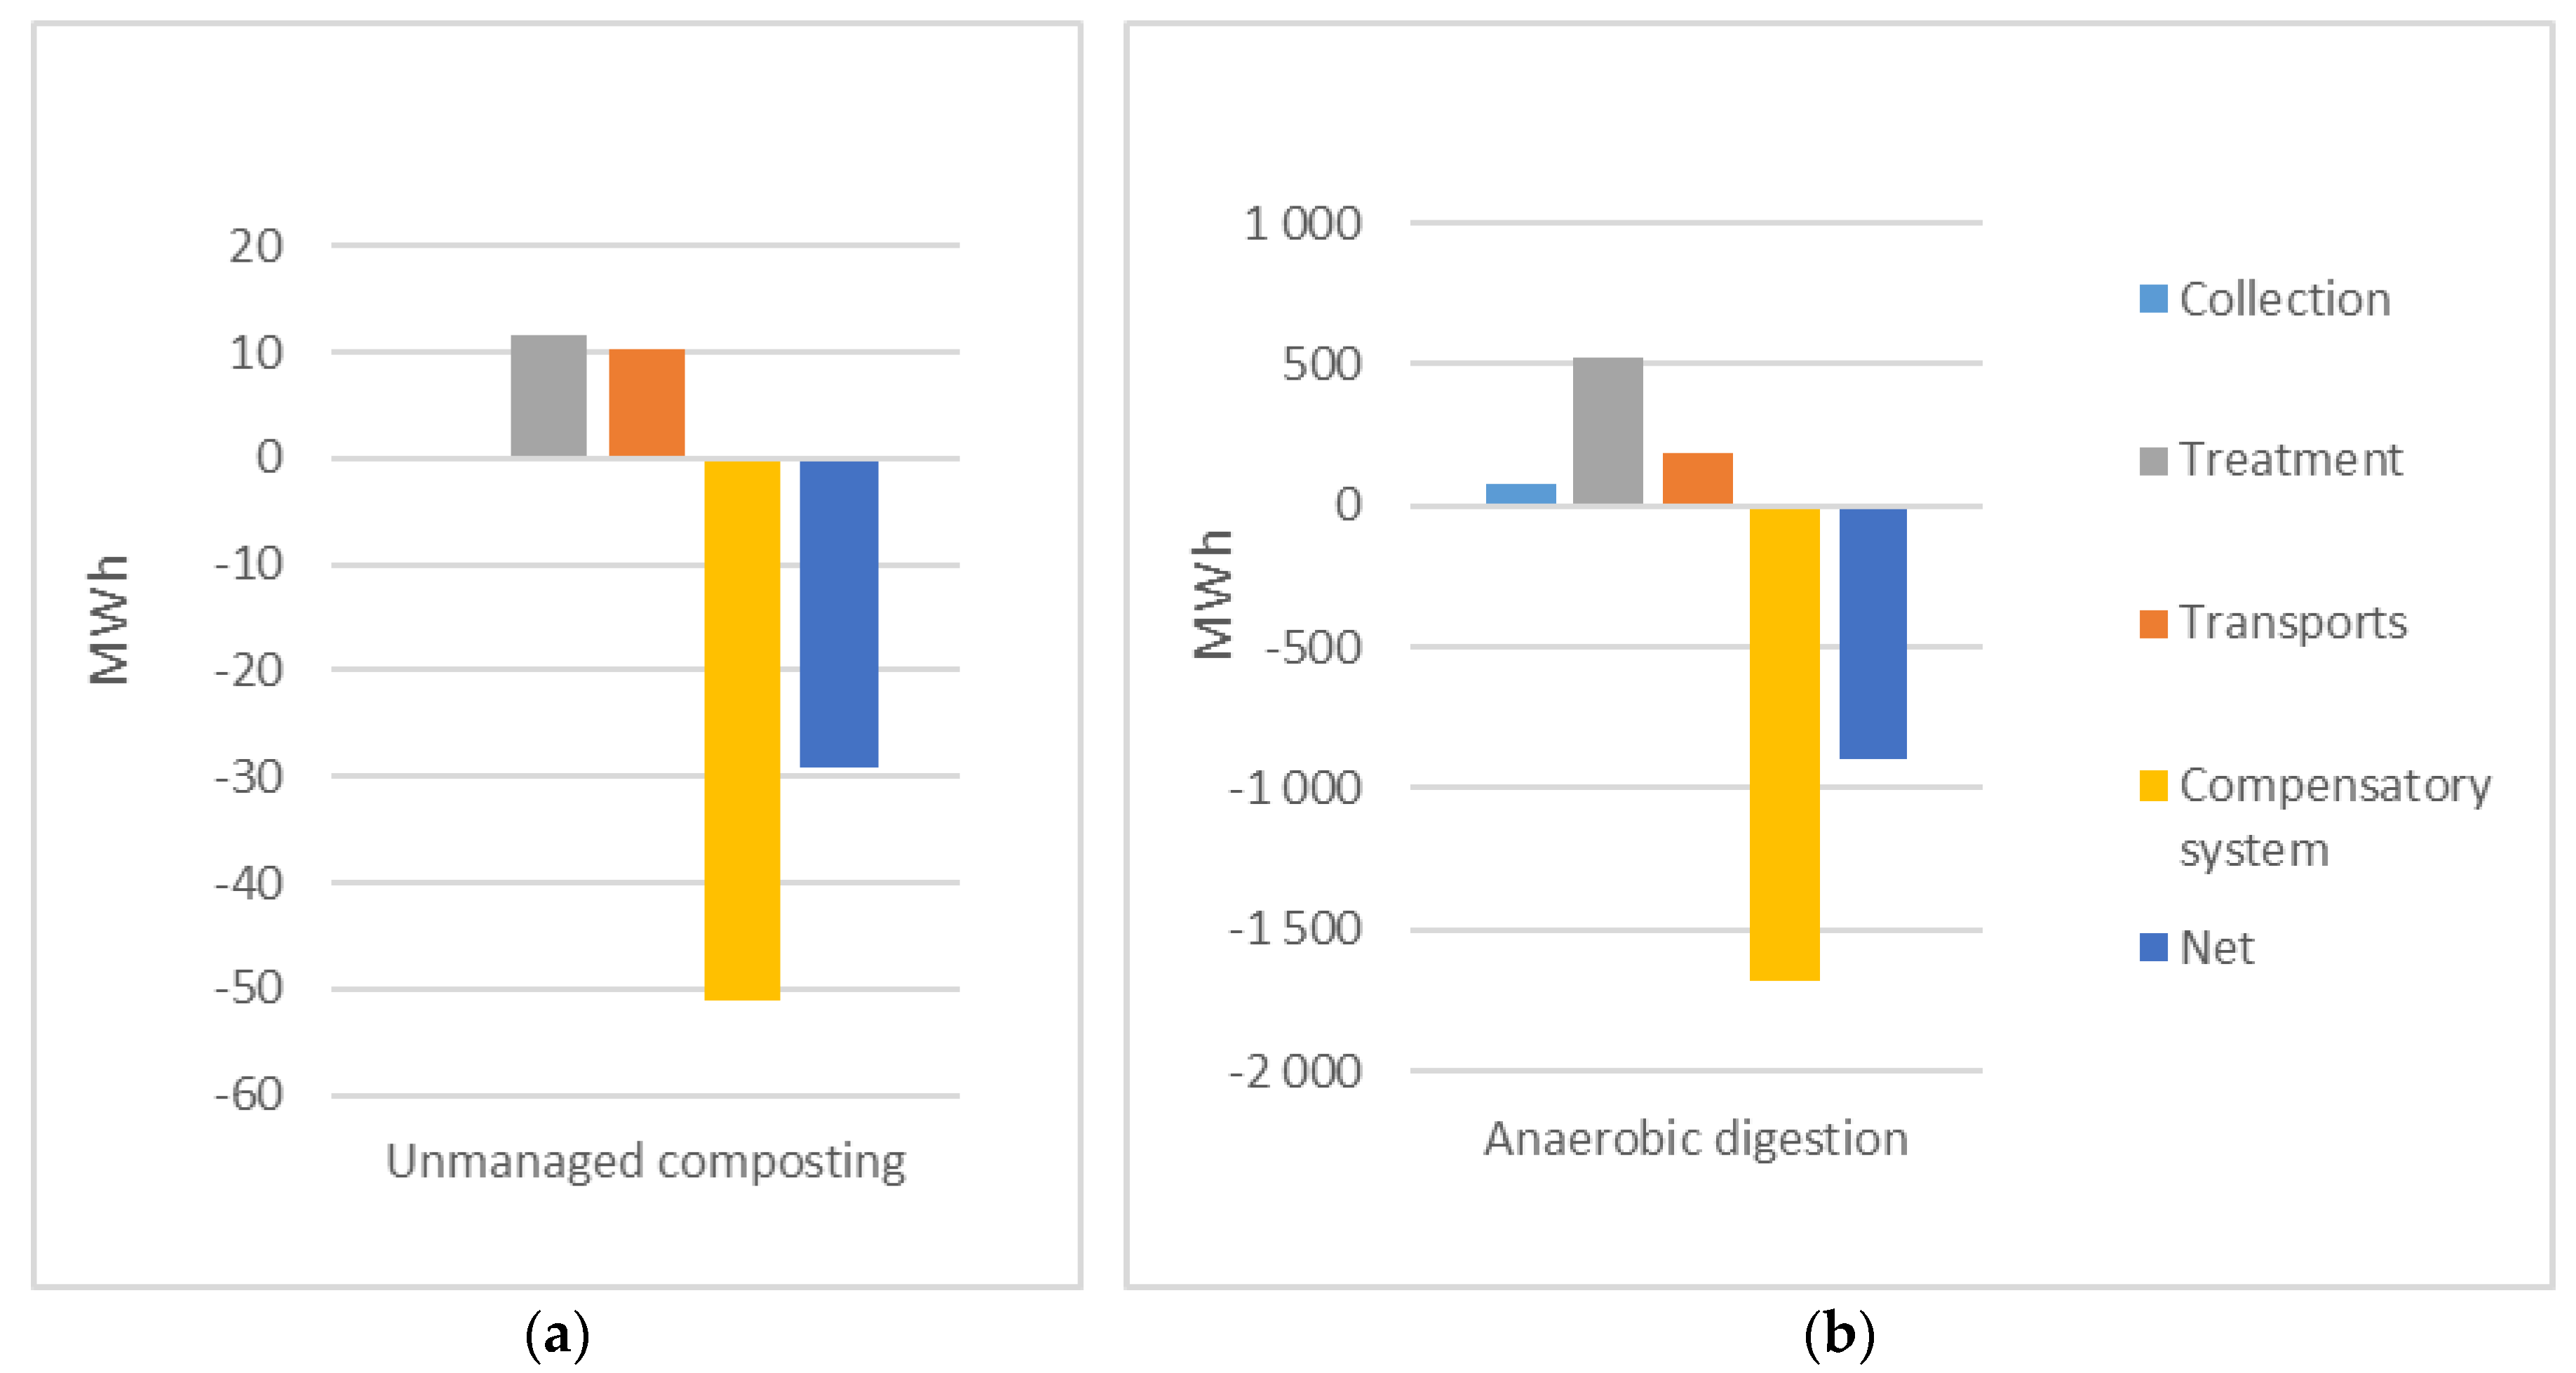
Figure 6.
Global warming potential (tonnes CO2-eq) of unmanaged composting (no transport to treatment) and anaerobic digestion with transport of the manure to the expected digestion plant.
Figure 6.
Global warming potential (tonnes CO2-eq) of unmanaged composting (no transport to treatment) and anaerobic digestion with transport of the manure to the expected digestion plant.
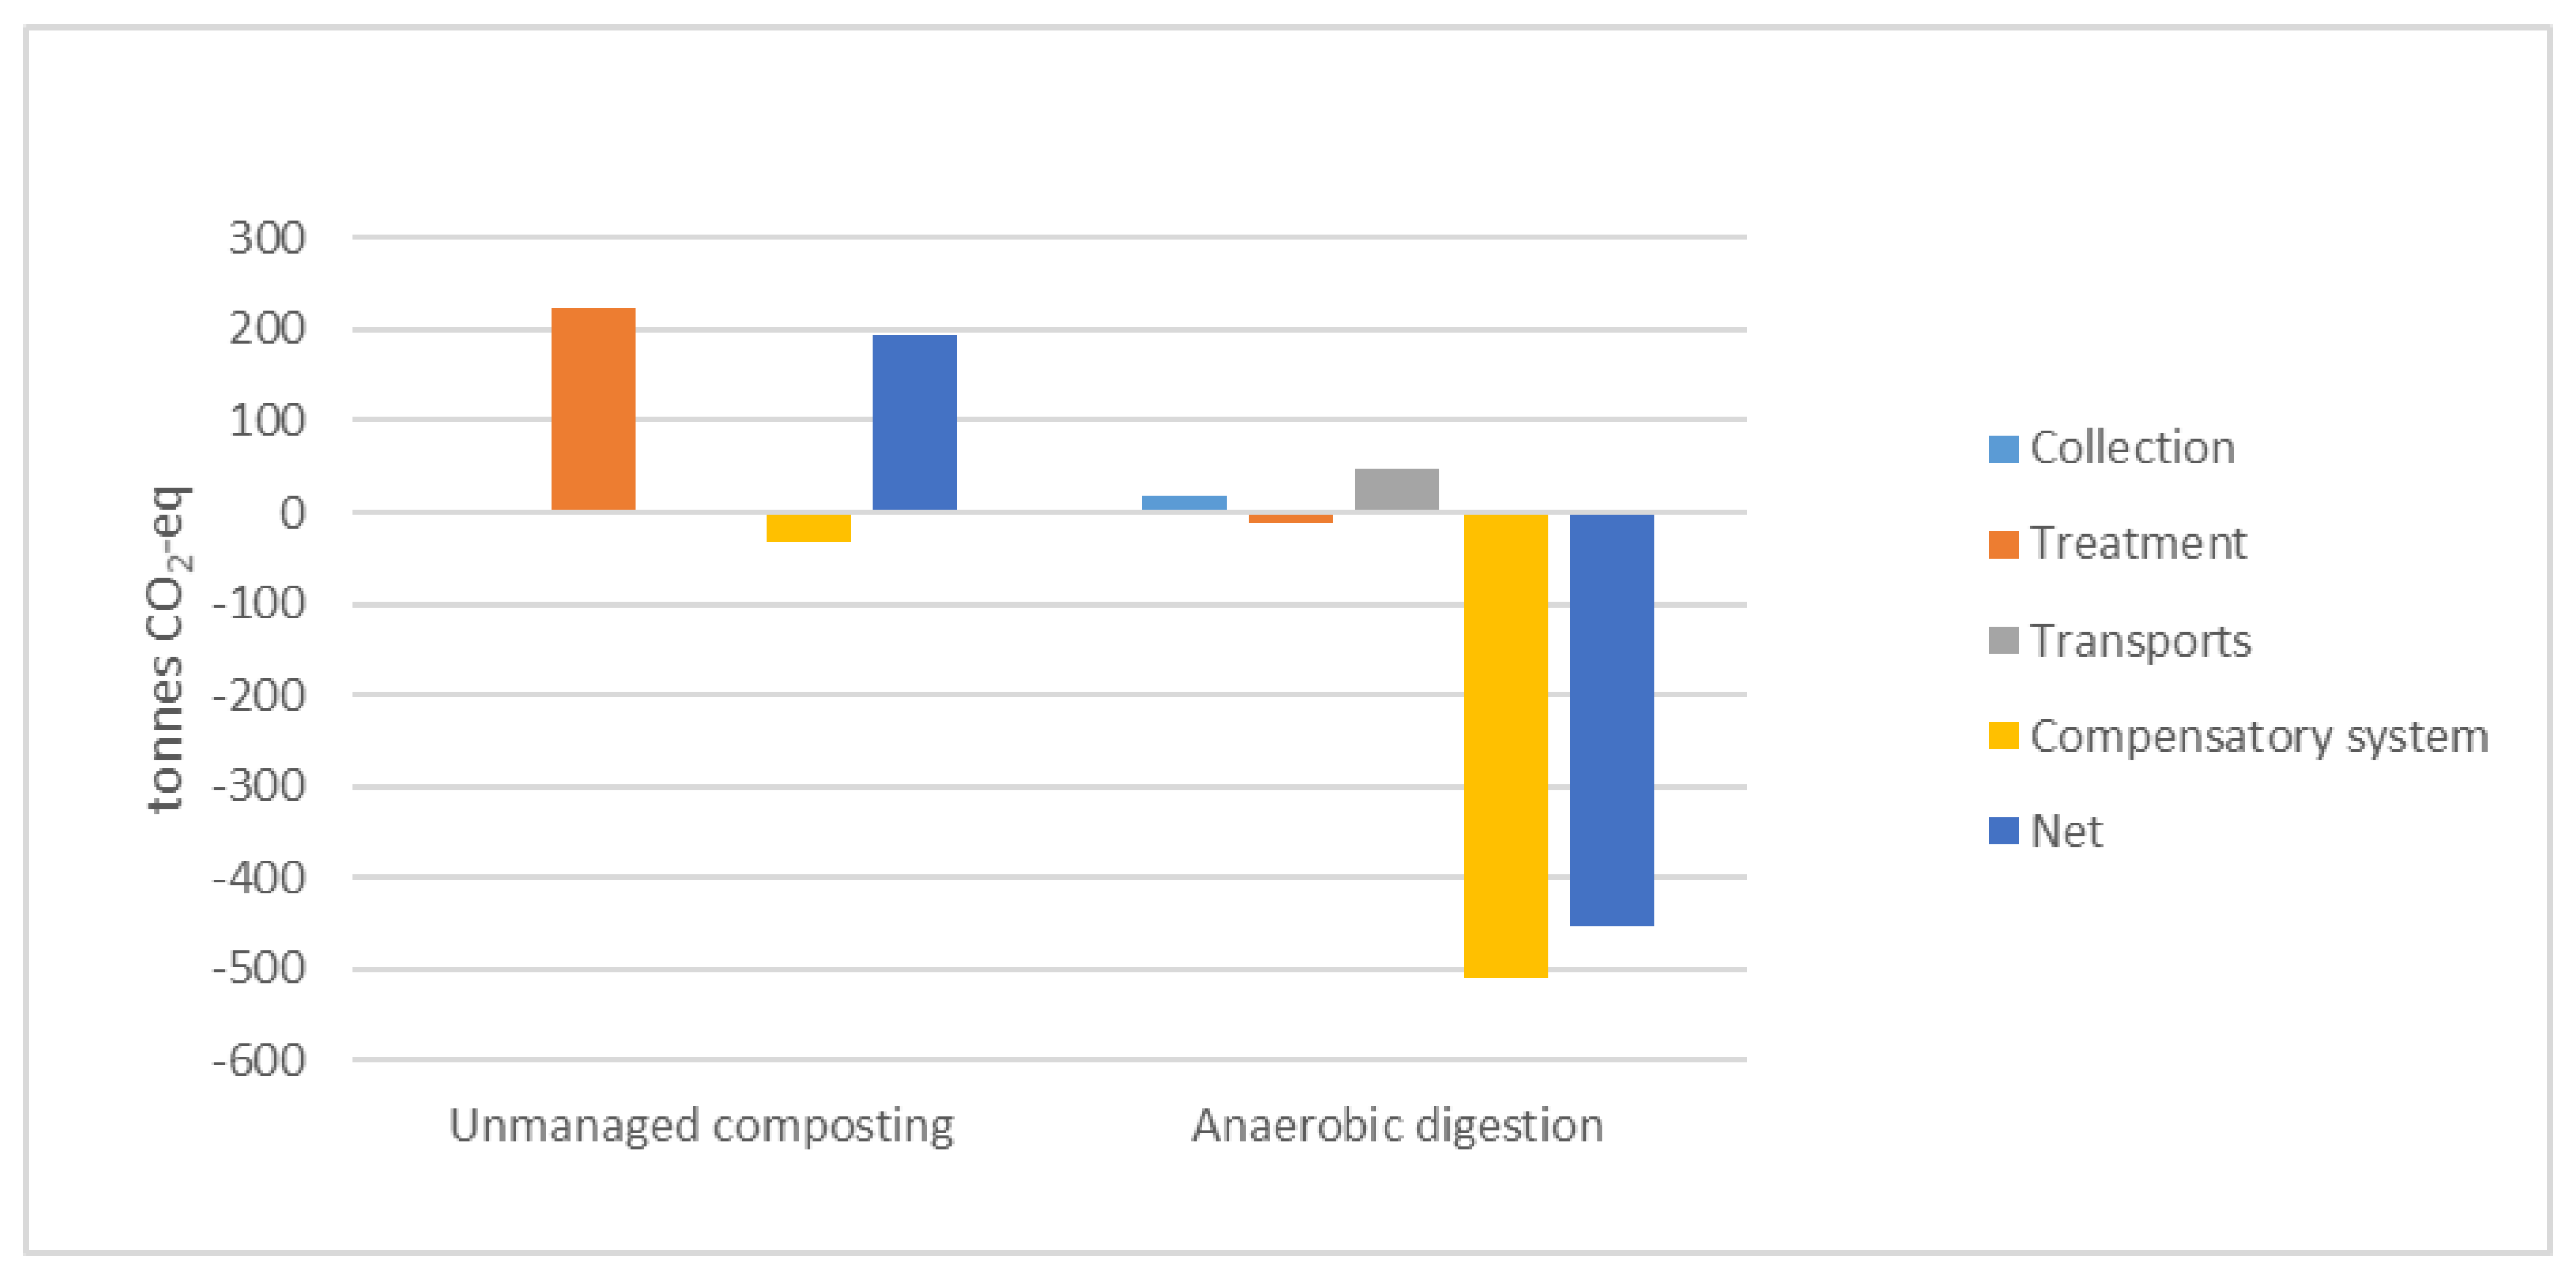
Figure 7.
Acidification potential for unmanaged composting and anaerobic digestion divided into the processes and the net potential environmental impact.
Figure 7.
Acidification potential for unmanaged composting and anaerobic digestion divided into the processes and the net potential environmental impact.
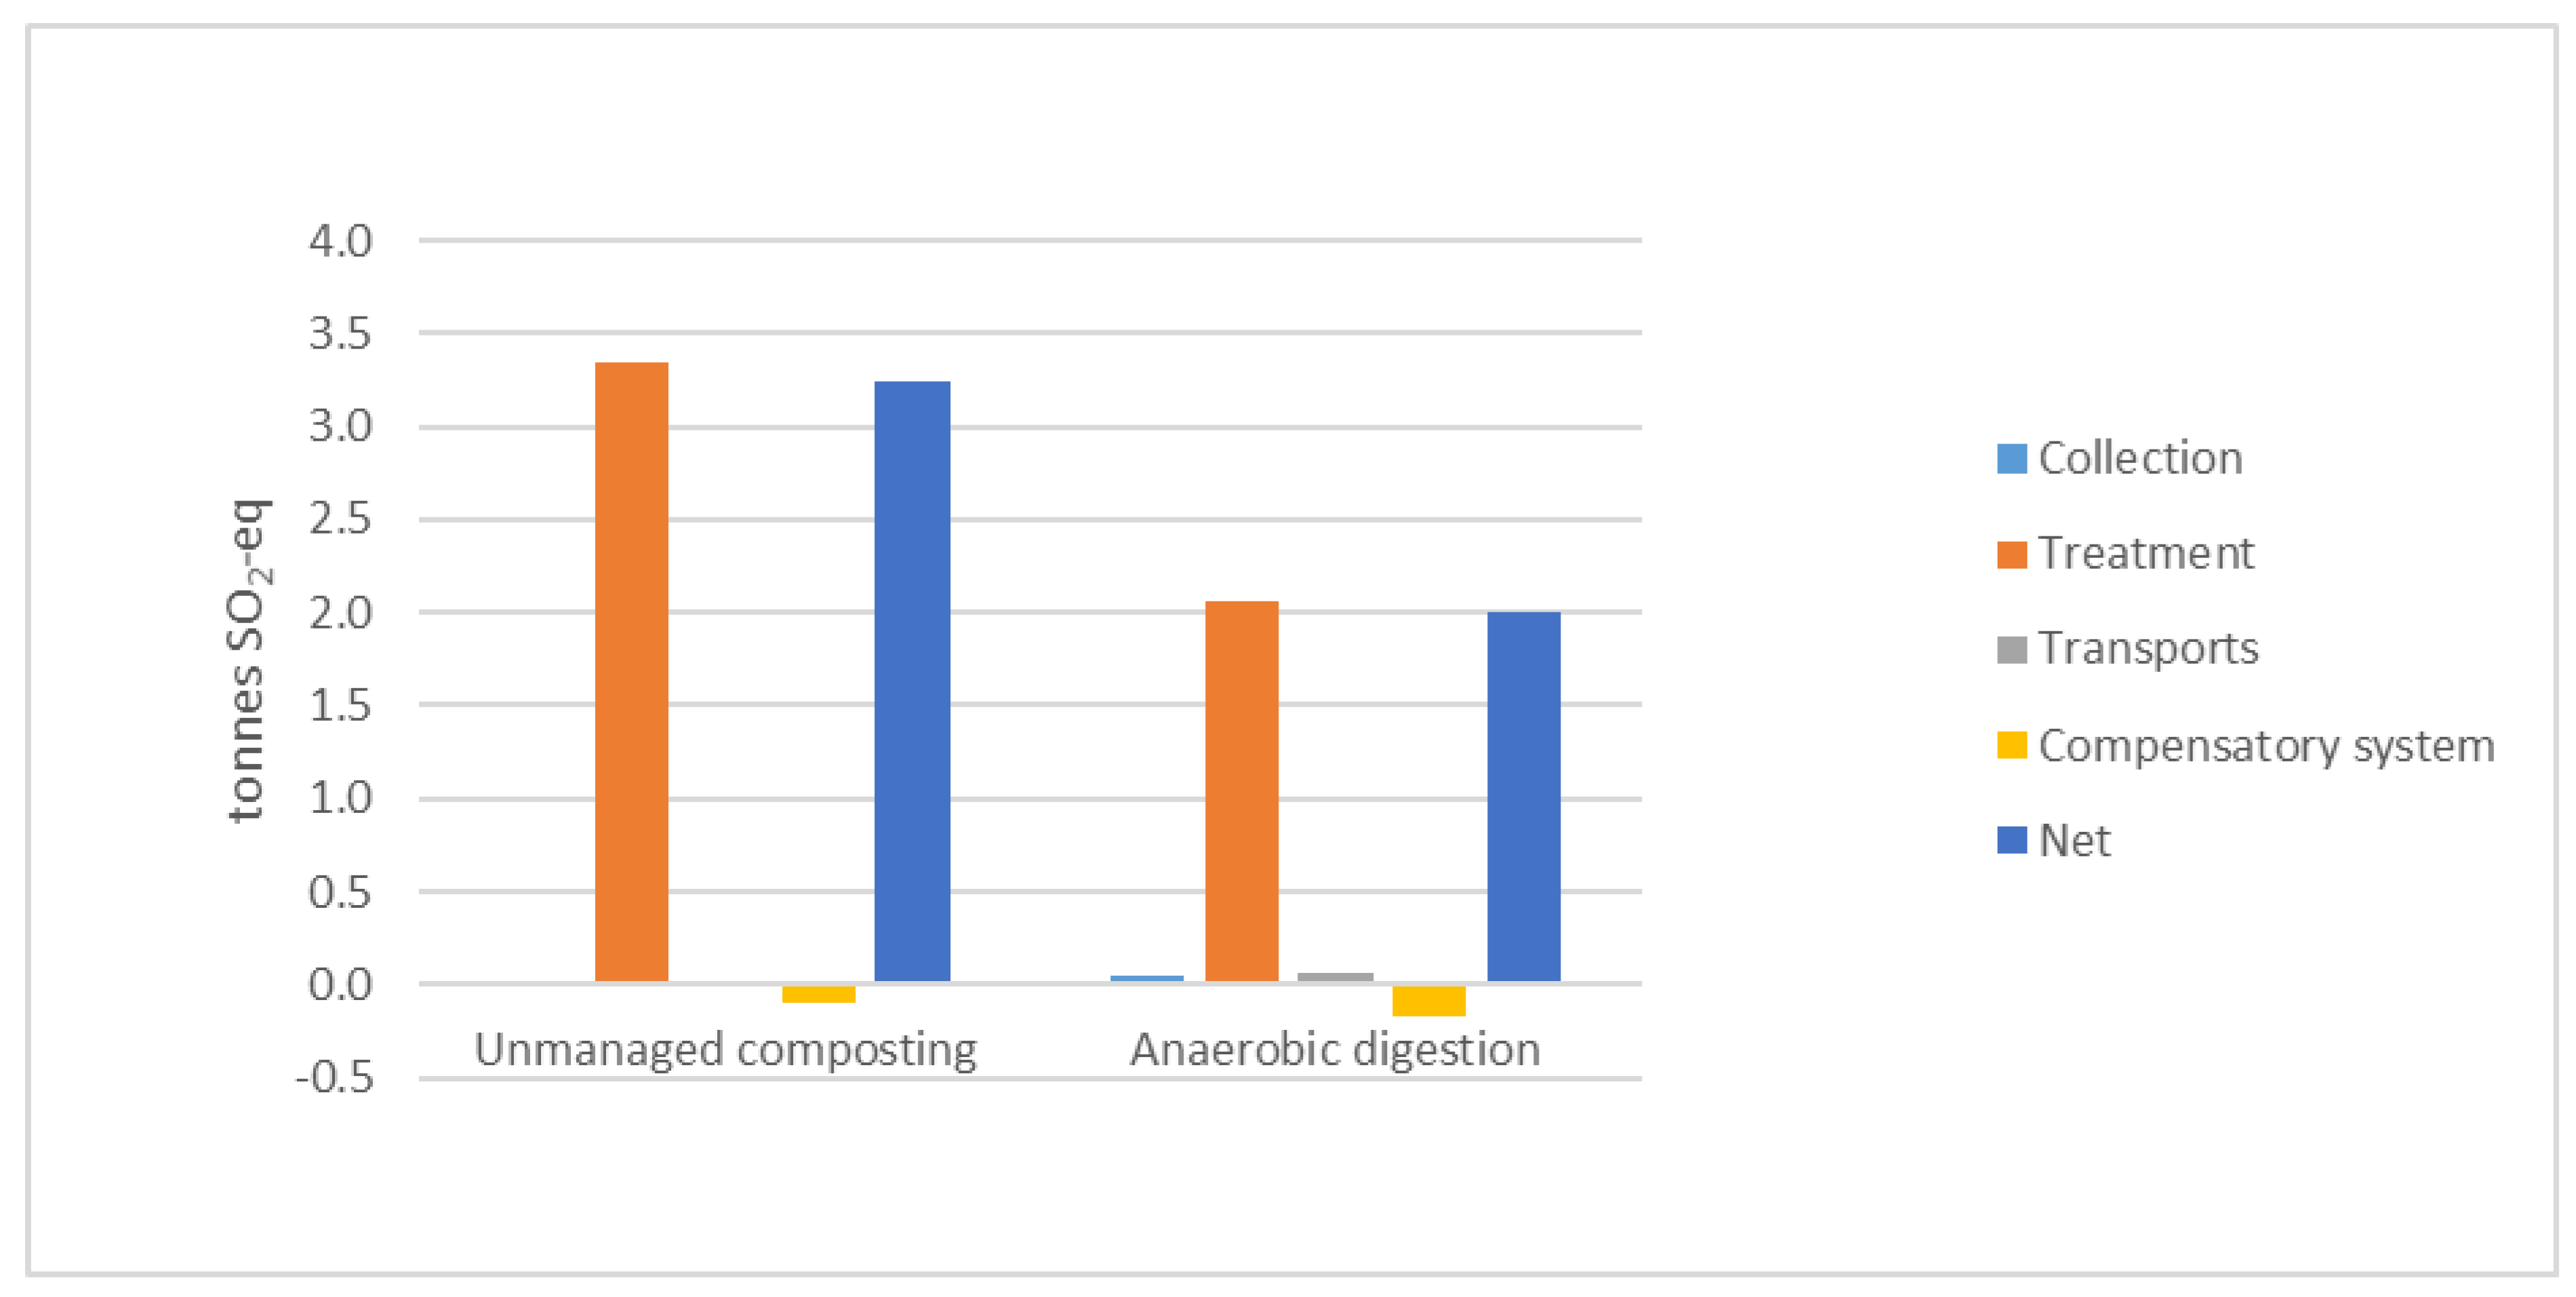
Figure 8.
Eutrophication potential for unmanaged composting and anaerobic digestion divided into the processes and the net potential environmental impact.
Figure 8.
Eutrophication potential for unmanaged composting and anaerobic digestion divided into the processes and the net potential environmental impact.
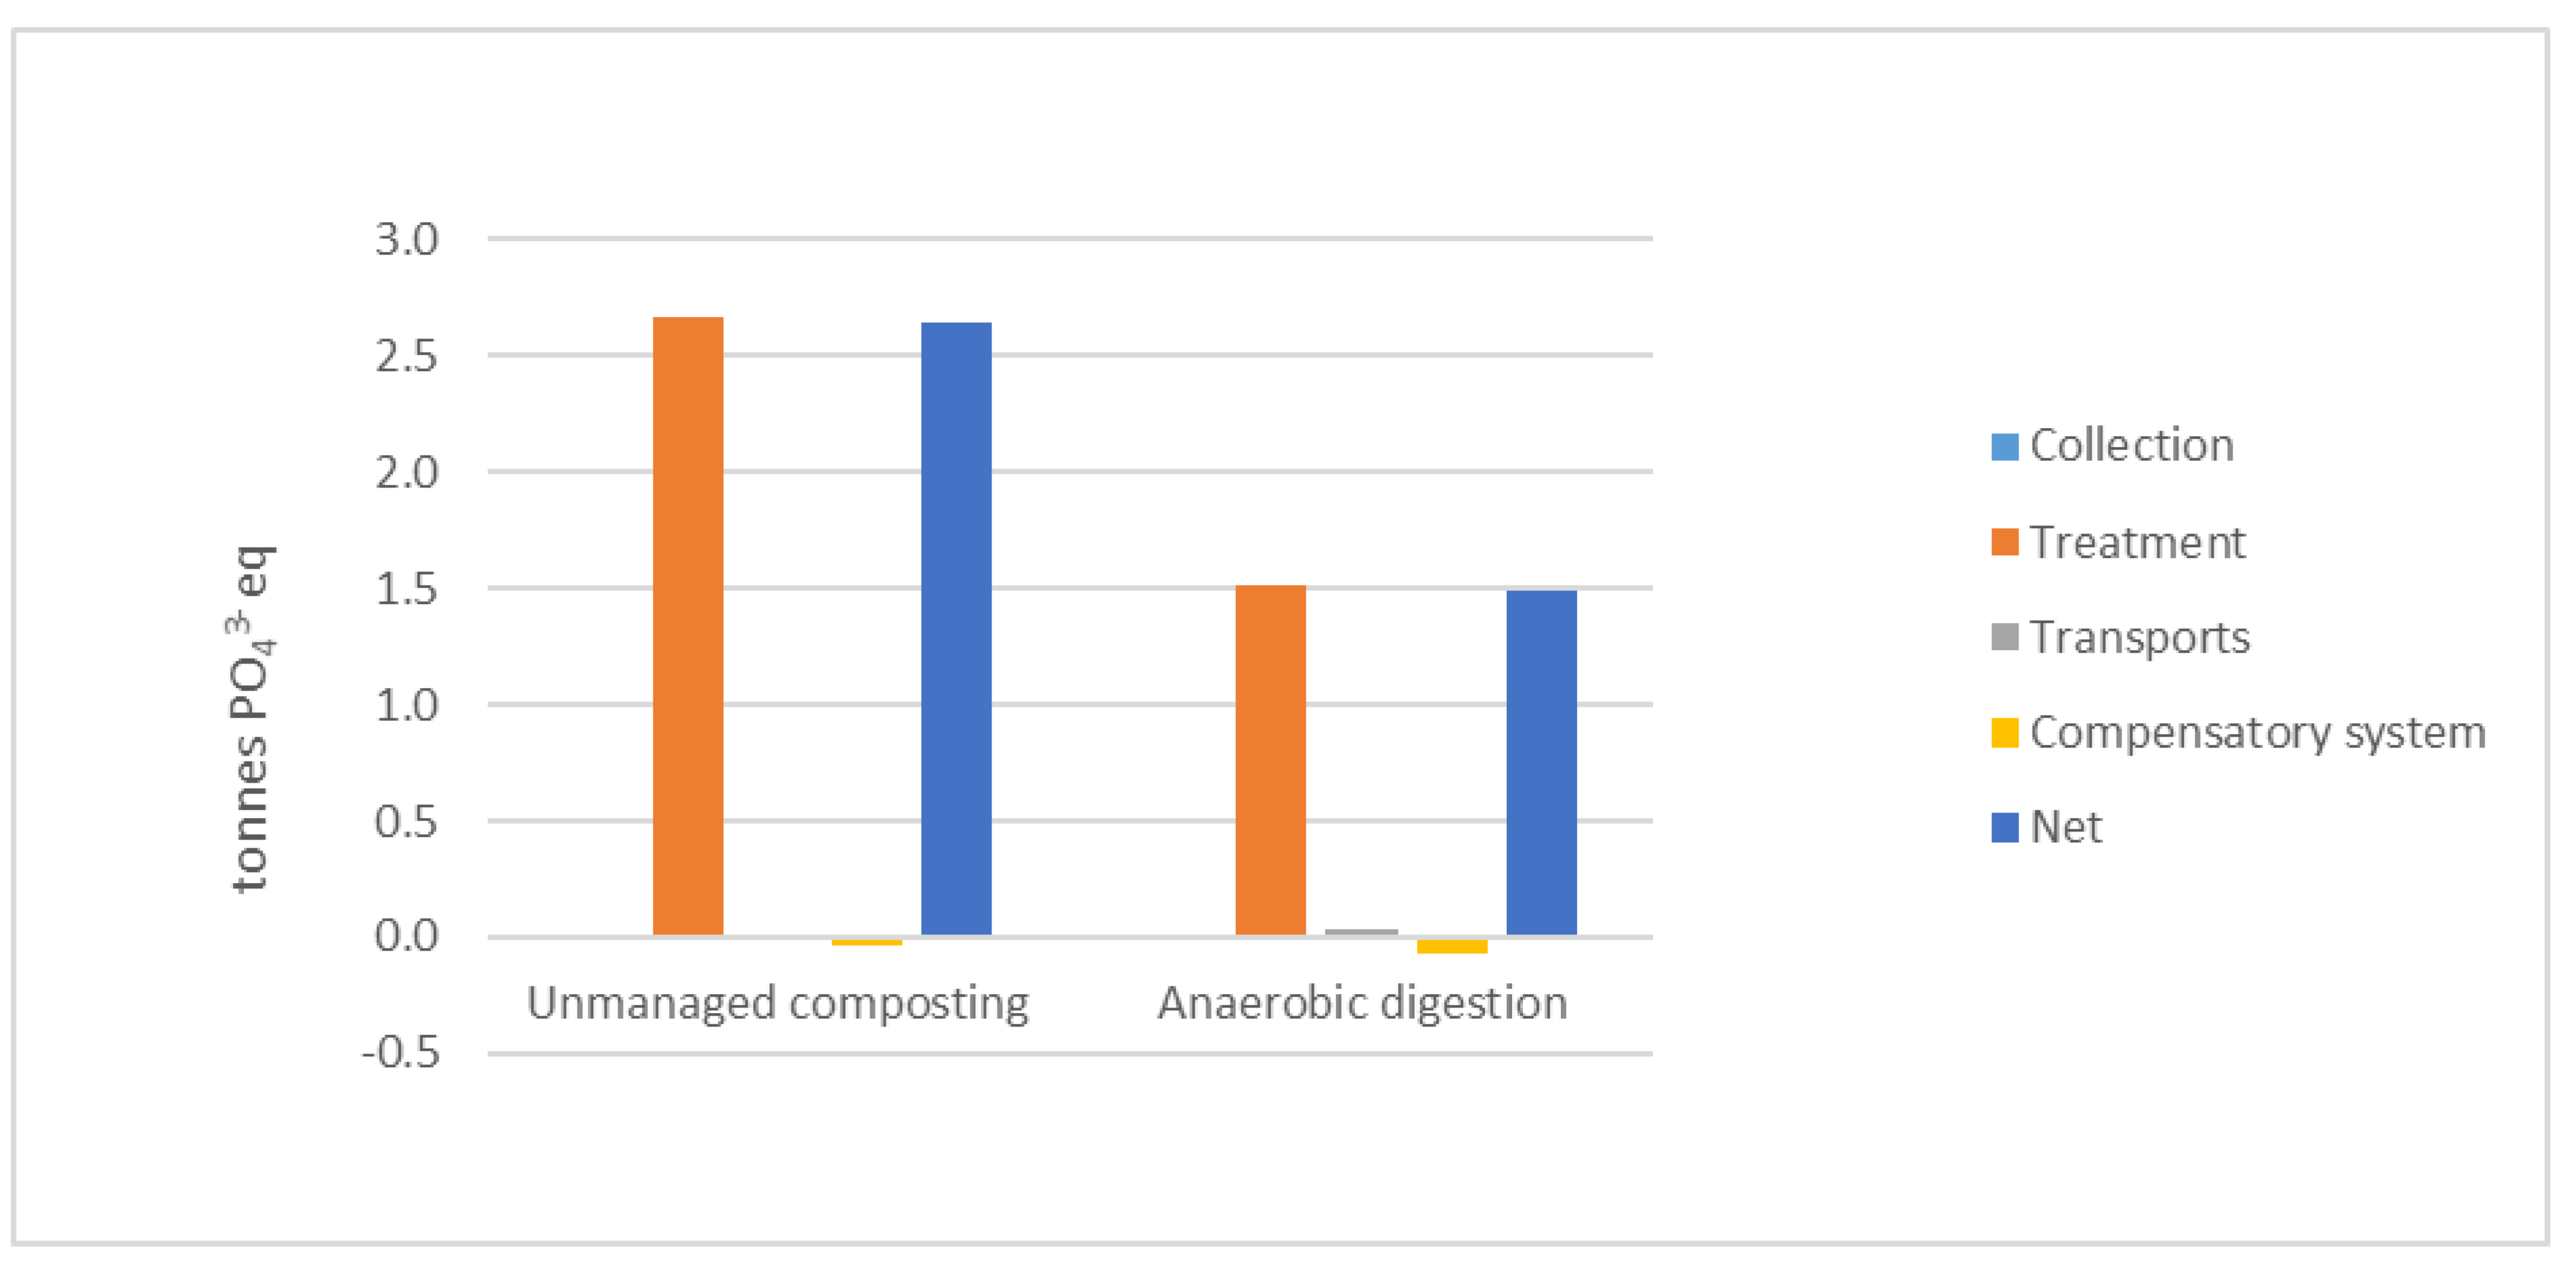
Figure 9.
Cumulative energy demand for Scenario 2 and various bedding types.
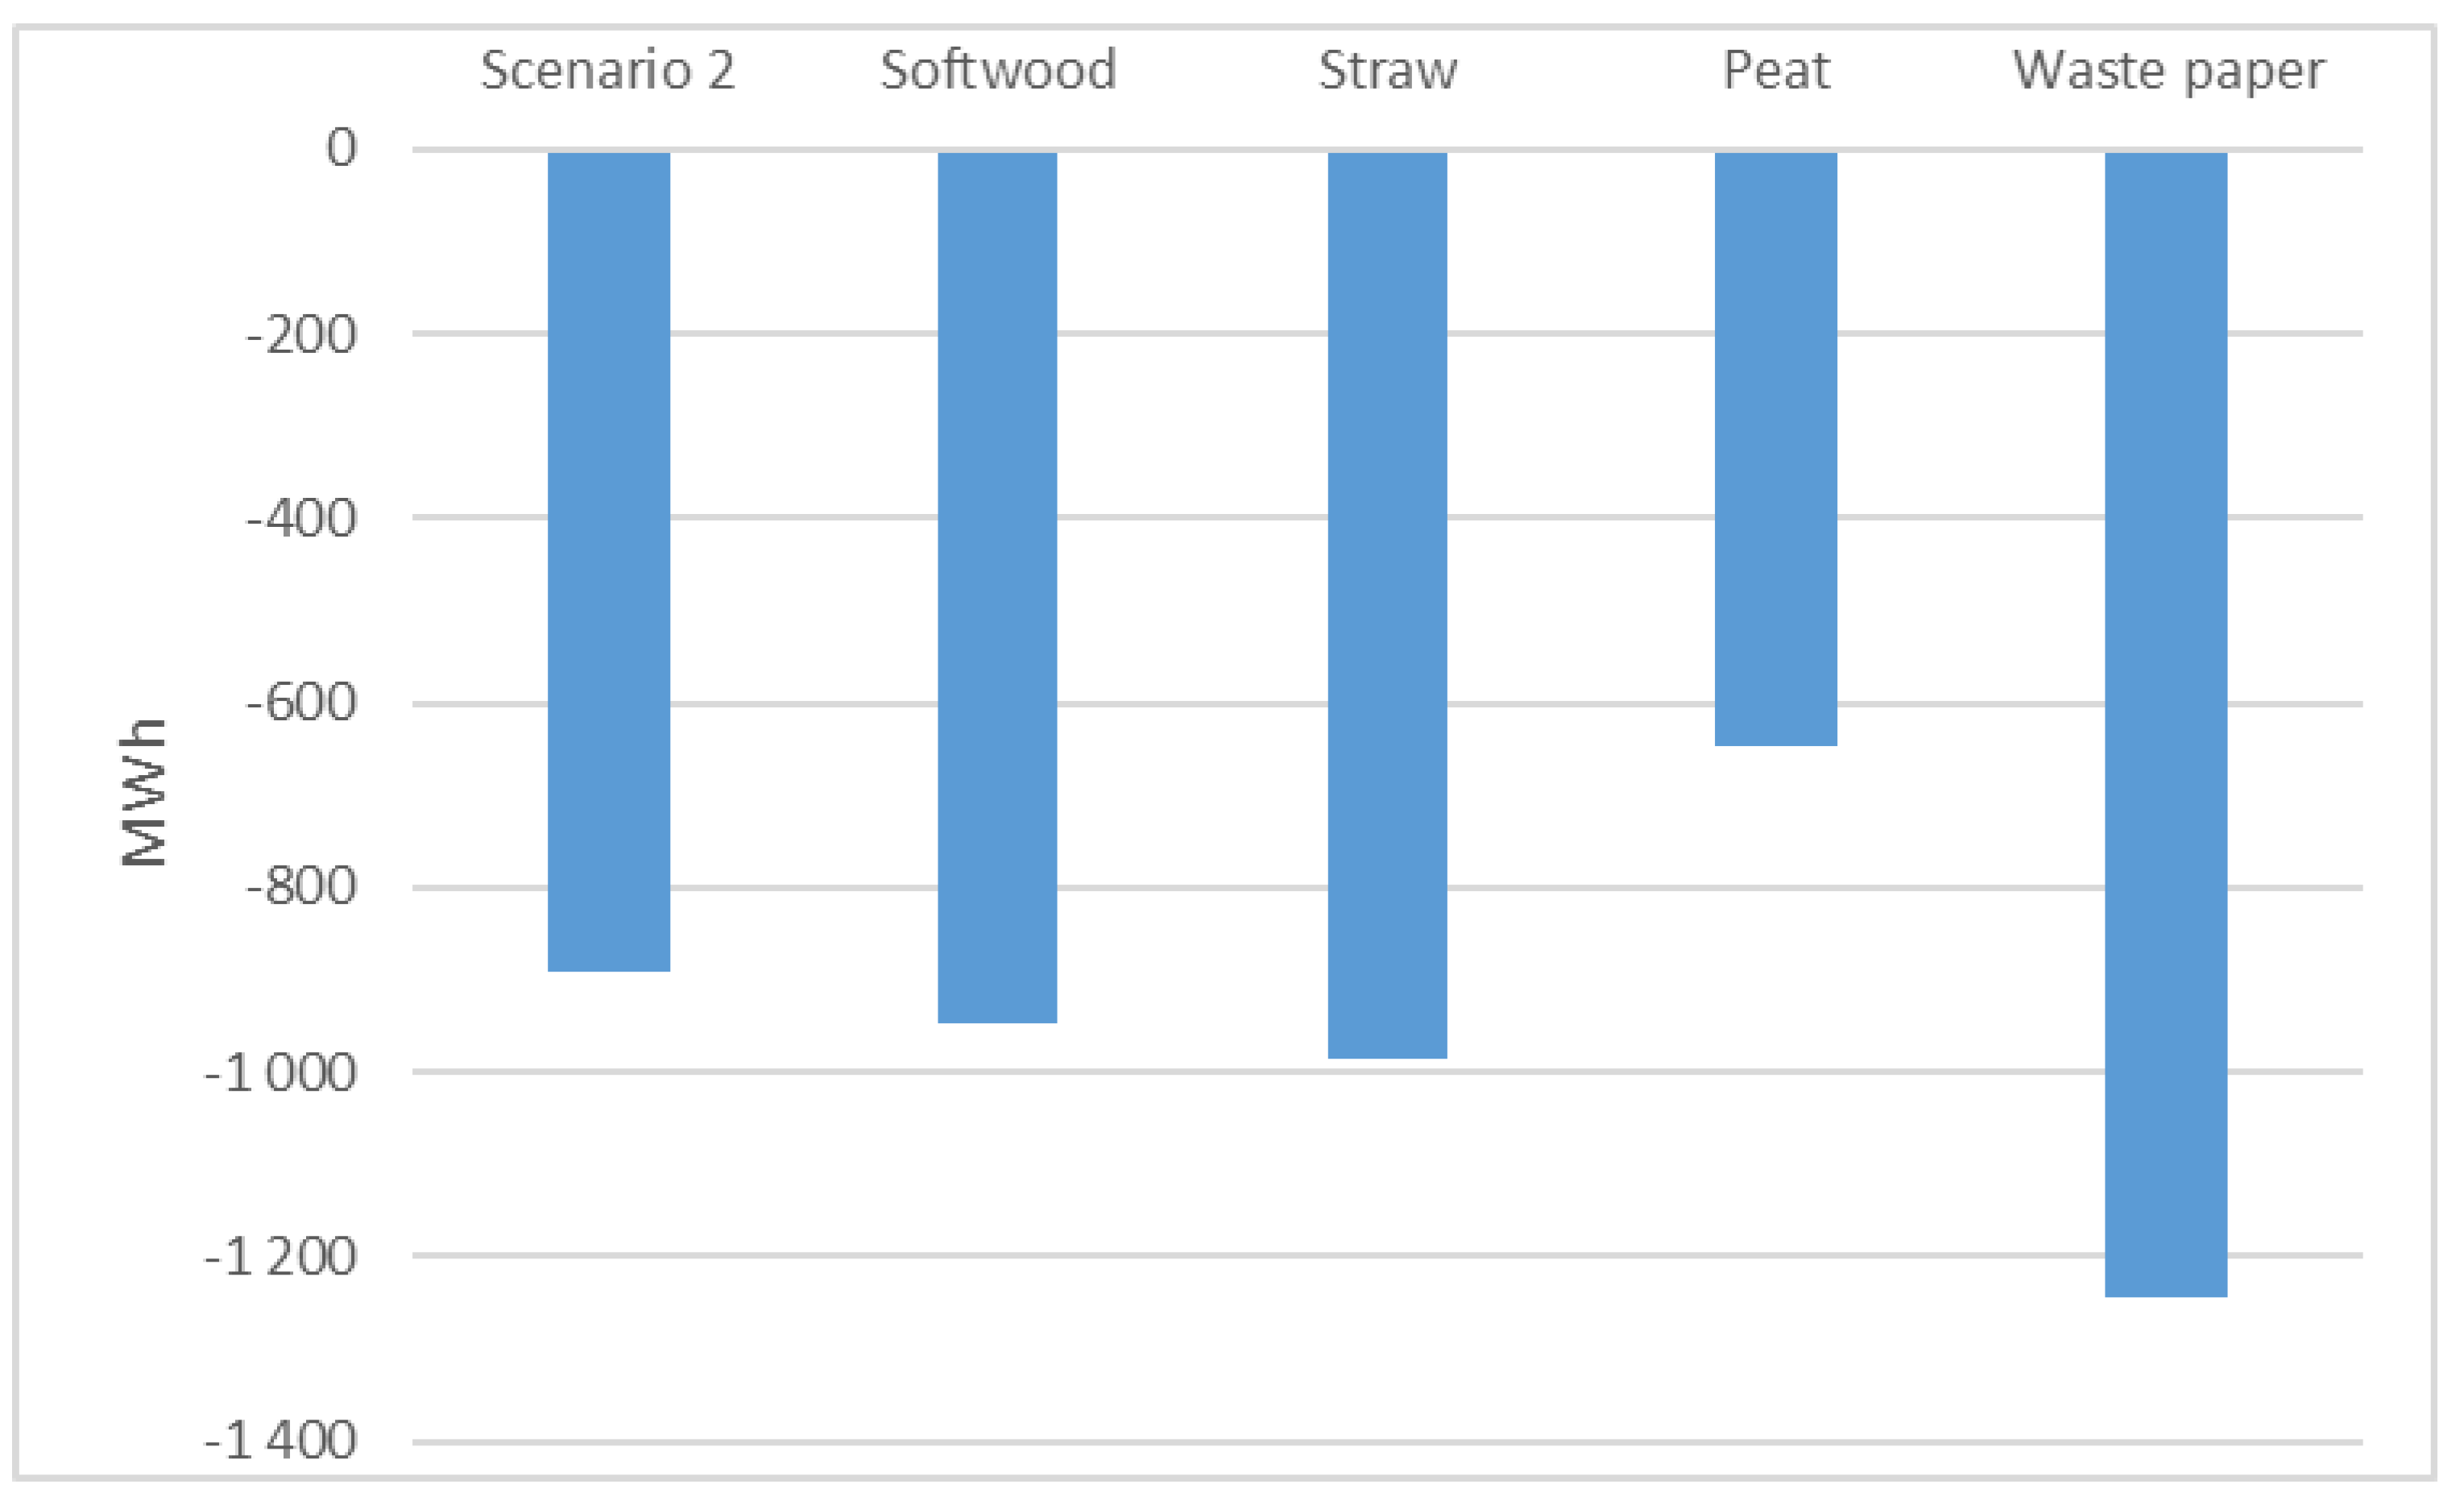
Figure 10.
(a) Acidification and eutrophication potential for Scenario 2 and various beddings; (b) global warming potential for Scenario 2 and various beddings.
Figure 10.
(a) Acidification and eutrophication potential for Scenario 2 and various beddings; (b) global warming potential for Scenario 2 and various beddings.


Table 1.
Data collection structure and methods for the study.
| Activities | Horse Keeping | Transport | Treatment |
|---|---|---|---|
| Inventory | Questionnaire Field observations | NTM emission data [34] Distances [35] | Data from [20] |
| Calculation | Compilation in Excel | Calculations in Excel | Simulations in ORWARE |
Table 2.
Constructed transport system in the systems analysis.
| Vehicle Type Characteristics | Rigid Truck 7.5–12 t | Rigid Truck 14–20 t | Truck with Trailer 28–34 t |
|---|---|---|---|
| Average load (tonnes) | 5 | 10 | 20 |
| Cargo carrier capacity (tonnes) | 6 | 12 | 22 |
| Fuel consumption (L/km) | 0.17 | 0.21 | 0.29 |
| Distribution (%) | 15 | 62 | 23 |
Table 3.
Distribution of horse manure respondents across calculated distance to an expected liquid anaerobic digestion plant (L-AD).
Table 3.
Distribution of horse manure respondents across calculated distance to an expected liquid anaerobic digestion plant (L-AD).
| Distance to Plant (km) | 1–10 | 11–20 | 21–30 | 31–40 | 41–50 | Sum |
|---|---|---|---|---|---|---|
| Number of horse keepers | 5 | 11 | 17 | 13 | 14 | 60 |
| Number of horses | 91 | 71 | 231 | 56 | 38 | 487 |
| Amount of manure (tonnes) | 603 | 285 | 2751 | 315 | 225 | 4179 |
Table 4.
Descriptive information about the survey.
| Number of Horses | 1–2 | 3–5 | 6–10 | 11–90 | Sum |
|---|---|---|---|---|---|
| Number of horse keepers | 29 | 34 | 5 | 13 | 81 |
| Response (%) | 36 | 42 | 6 | 16 | 100 |
| Number of horses | 57 | 117 | 36 | 410 | 623 |
Table 5.
Use of bedding materials.
| Bedding | Horse Keepers | Horses | Horses (%) | kg Bedding/Horse, Year | Tonnes of Horse Manure/Horse, Year |
|---|---|---|---|---|---|
| Peat | 19 | 64 | 10 | 892 | 8 |
| Softwood | 37 | 373 | 60 | 1228 | 11 |
| Straw | 3 | 7 | 1 | 1309 | 6 |
| Other (1) | 5 | 31 | 5 | 422 | 7 |
| Bedding mix (2) | 16 | 143 | 23 | 750 | 3 |
| No answer | 1 | 3 | 1 | - | - |
| Sum | 81 | 623 | 100 | - | - |
(1) Straw pellets, wood pellets (stable pellets), paper cuttings, paper pellets. (2) Different mixes mentioned, for example peat and softwood bedding, straw and softwood bedding, peat and straw and wood or straw pellets.
Table 6.
Different manure storage types distributed by groups of horses.
| Horse Manure Storage Facility | 1–2 | 3–5 | 6–10 | 11–90 | Horses (%) | Keepers (%) |
|---|---|---|---|---|---|---|
| Stockpiling on ground | 16 | 13 | 0 | 25 | 8.7 | 16 |
| Concrete slab | 24 | 48 | 21 | 275 | 59.1 | 46 |
| Container | 11 | 34 | 15 | 54 | 18.3 | 26 |
| Other | 4 | 22 | 0 | 56 | 13.2 | 10 |
| Sack | 2 | 0 | 0 | 0 | 0.3 | 1 |
| No answer | 0 | 3 | 0 | 0 | 0.5 | 1 |
| Sum | 57 | 120 | 36 | 410 | 100.0 | 100 |
Table 7.
Distribution of use of horse manure within horse groups.
| Spreading Practice (%) | 1–2 | 3–5 | 6–10 | 11–90 |
|---|---|---|---|---|
| Applied to own arable land | 36 | 16 | - | 19 |
| Applied to others’ arable land | 36 | 44 | 40 | 54 |
| Off-site disposal | 14 | 12 | - | 8 |
| Other | 14 | 25 | 60 | 19 |
| No answer | 0 | 3 | 0 | 0 |
| Sum | 100 | 100 | 100 | 100 |
Table 8.
Major material and energy flows in the scenarios.
| Material/Energy Flow | Scenario 1 (Unmanaged Composting) | Scenario 2 (Anaerobic Digestion) |
|---|---|---|
| Horse manure (tonnes) | 4179 | 4179 |
| Transport (tonne-km) | - | 179,505 |
| Compost (tonnes) | 501 | - |
| Biofertilizer (tonnes) | - | 8033 |
| Biogas (GJ) | - | 5952 |
Table 9.
Transport’s contribution to environmental impact in Scenario 2.
| Environmental Impact Category | Total | Transport | % |
|---|---|---|---|
| CED (MWh) | 788 | 264 | 34 |
| GWP (tonnes CO2-eq.) | 56 | 67 | 120 |
| AP (tonnes SO2-eq.) | 2.17 | 0.07 | 3 |
| EP (tonnes PO43− eq.) | 1.56 | 0.05 | 3 |
Table 10.
Cost inventory (1 € = 9.71 SEK).
| Cost Analysis | Composting | Anaerobic Digestion | Comment/Unit | Refs. |
|---|---|---|---|---|
| Storing on site | 0 | 371 | Rent of a 10 m3 container, SEK/month | [48] |
| 1061 | Rent of a 22 m3 container, SEK/month | [48] | ||
| 342 | Rent of a container, SEK/month | [49] | ||
| Transport | 0 | 1219 | SEK/container retrieved | [48] |
| 891 | SEK/tonne | [49] | ||
| 109 | SEK/tonne | [50] | ||
| Treatment | 379 | 350 | SEK/tonne | [48,51] |
| 183 | −100–550 | SEK/tonne | [50,52] | |
| Spreading | - | 95 | SEK/tonne | [50] |
Table 11.
Cost analysis for different container sizes and applied to case (1 € = 9.71 SEK).
| Cost Analysis | 10 m3 Container | 22 m3 Container | Case | Unit | Ref. |
|---|---|---|---|---|---|
| Storing on site | 4452 | 12,732 | 867,648 | SEK/annum | [48] |
| Transport | - | - | 513,077 | SEK/annum | [48] |
| Treatment | - | - | 1,562,650 | SEK/annum | [51] |
| Total | - | - | 2,843,375 | SEK/annum | |
| - | - | 681 | SEK/tonne | ||
| - | - | 5839 | SEK/horse | ||
| Transport, 18 tonnes | 4388 | 2194 | SEK/annum | ||
| Treatment, 18 tonnes | 6300 | 6300 | - | SEK/annum | |
| Total, 18 tonnes | 15,140 | 21,226 | - | SEK/annum | |
| 841 | 1179 | - | SEK/tonne | ||
| 7234 | 10,141 | - | SEK/horse | ||
| Transport, 64 tonnes | 15,603 | 7802 | SEK/annum | ||
| Treatment, 64 tonnes | 22,400 | 22,400 | - | SEK/annum | |
| Total, 64 tonnes | 42,455 | 42,934 | - | SEK/annum | |
| 663 | 671 | - | SEK/tonne | ||
| 5705 | 5769 | - | SEK/horse |
Table 12.
Comparison of results.
| Cost Analysis | Svanberg et al. [31] | Case Study | Unit |
|---|---|---|---|
| Container rent | 35–60 | 38–109 | € per month |
| Transport | 60–360 | 126 | € per transport |
| Reception fee | 25–40 | 36 | € per tonne |
| Total | 100–400 | 601 | € per horse, year |
| 12–47 | 70 | € per tonne |
© 2017 by the authors. Licensee MDPI, Basel, Switzerland. This article is an open access article distributed under the terms and conditions of the Creative Commons Attribution (CC BY) license (http://creativecommons.org/licenses/by/4.0/).
Share and Cite
MDPI and ACS Style
Hadin, Å.; Hillman, K.; Eriksson, O. Prospects for Increased Energy Recovery from Horse Manure—A Case Study of Management Practices, Environmental Impact and Costs. Energies 2017, 10, 1935. https://doi.org/10.3390/en10121935
AMA Style
Hadin Å, Hillman K, Eriksson O. Prospects for Increased Energy Recovery from Horse Manure—A Case Study of Management Practices, Environmental Impact and Costs. Energies. 2017; 10(12):1935. https://doi.org/10.3390/en10121935
Chicago/Turabian StyleHadin, Åsa, Karl Hillman, and Ola Eriksson. 2017. "Prospects for Increased Energy Recovery from Horse Manure—A Case Study of Management Practices, Environmental Impact and Costs" Energies 10, no. 12: 1935. https://doi.org/10.3390/en10121935
Note that from the first issue of 2016, this journal uses article numbers instead of page numbers. See further details here.