1. Introduction
Since the Francis turbine is large-scale fluid machinery, its hydraulic factors always turn out to be one of the main causes of vibration in the hydropower units. The hydraulic factors can be classified into three categories: the low-frequency pressure pulsation in the draft tube appeared under the condition of partial load; the pressure pulsation in the runner caused by channel vortex when the turbine deviate from the optimum working condition; and the high-frequency pressure pulsation discovered at the end of stay vanes, guide vanes and the runner blade, which is caused by Kármán vortex [
1]. The Kármán vortex refers to the two counter-rotating rows of swirls, which alternately fall off at the tail of the nonlinear object when fluid flows past [
2]. It can produce periodic forces on the object causing periodic vibration, especially when the vortex shedding frequency coincides with one of the natural frequencies of the vane, threatening resonance occurs, which will lead to more violent vibration and potentially initiating cracks [
3,
4]. The resonance induced by the Kármán vortex not only disturbs the downstream flow, resulting efficiency reduction and leading to channel vortex, but also causes serious damage to the unit components [
5,
6]. Therefore, it is very important to carry out theoretical research and an engineering investigation of the Kármán vortex resonance in a large-scale turbine, which is very meaningful for the antivibration and anticracking of a hydropower unit.
Numerical method is an effective means in turbulence phenomena study. For example, Viviano and Musumeci et al. [
7,
8,
9] proposed simplified numerical models, which simulate turbulence by means of eddy viscosity formulation, to study the mechanism of waves. But when it comes to optimal design, computational fluid dynamics (CFD) turns out to be a better choice because it is more practical and it can overcome the limitations of experimental conditions [
10,
11,
12,
13,
14,
15,
16,
17,
18]. For instance, Zhang et al. [
10] performed an investigation of two degrees of freedom on vortex-induced vibration under the wakes interference of an oscillating airfoil. By taking the advantage of the CFD technology, a variety of wakes generated by an oscillating airfoil at a different frequency and amplitude of the oscillation, including the Kármán wake, inverted Kármán wake, 2P wake, and the 2P+2S wake have been studied numerically. Thapa et al. [
11] proposed a CFD-based optimization method for the hydraulic design of the guide vane cascade instead of the costly physical model experiment. The performance of the guide vane cascade was improved without disturbing the flow condition of the runner inlet, and the results were validated with particle image velocimetry (PIV) method.
There are many studies that have investigated the vibration induced by vortex (VIV) of hydrofoil using CFD and experimental method. Zobeiri et al. [
19] focused on the VIV of the hydrofoil with oblique trailing edge at high Reynolds number, and concluded that the collision between upper and lower vortices and the resulting vorticity redistribution are the main reasons of the vibration reduction. Yao et al. [
20] carried out a research on the effect of trailing edge shape on hydrodynamic damping for a hydrofoil. Numerical simulations and experiments were performed on the hydrofoils with a Blunt trailing edge and a Donaldson trailing edge. As a typical hydrofoil, the stay vane in large-scale Francis turbine was designed slender in the direction normal to the flow and has a relatively thick trailing edge for the purpose of hydraulic efficiency. As a result, structural vibration is very likely to be excited by the Kármán vortex in the wake of stay vanes. Neto et al. [
21] studied the 2D flow around 13 kinds of similar stay vane profiles with different trailing edge geometries to investigate the main characteristics of the excitation forces for each one of them and their respective dynamic behaviors. Vu et al. [
22] presented a CFD methodology to predict the Kármán vortex shedding frequency of the turbine stay vane by means of 2D unsteady state computation. The accuracy of the method has been validated against experimental data obtained with model size from laboratory and with prototype size from site. It concluded that the frequency and amplitude of the VIV is highly dependent on the stream velocity and the trailing edge profile. Neto et al. [
23] performed an investigation aimed at eliminating the reoccurrence of cracks on the stay vanes without affecting the availability of the machine in the process. The performance of stay vane was improved by the modified geometry, which is based on previous experiences and references. However, the researchers did not have a systematic and comprehensive study on the effect of the trailing edge profile of the stay vane on VIV, nor proposed a scientific and rigorous remedy of reducing the vibration.
In this work, the stay vanes of a large hydropower unit are the investigated object, which encountered serious vibration and some of them even produced cracks during practical operation. Aiming to eliminate the resonance and reduce the vibration, an intelligent optimization method based on two-dimensional CFD simulations, artificial neural networks (ANN), and PSO was employed to improve the geometries of the stay vane. Site experimental tests were implemented to validate the CFD model, and to ensure the quality of results, the mechanical strength and fatigue life of optimal designs were also evaluated by 3-dimensional numerical simulations.
2. Methodology
The investigated object is a large-scale Francis turbine that has been put into operation for years. Penetrating cracks, which are usually considered as a consequence of the severe vibration brought by the Kármán vortex, were found on the stay vanes during the maintenance of this hydropower unit (
Table 1). To eliminate the violent vibration and improve the performance of the stay vane, an optimal process was undertaken. Firstly, a numerical model was established to study the mechanism of the vibration on stay vanes, which was validated with site experiments of the large hydropower unit. Secondly, an optimization process based on the CFD numerical model, ANN, and PSO was utilized to optimize the stay vane profile. Detailed explanations of this process are displayed in the following parts.
2.1. The Definition of Flow Simulation
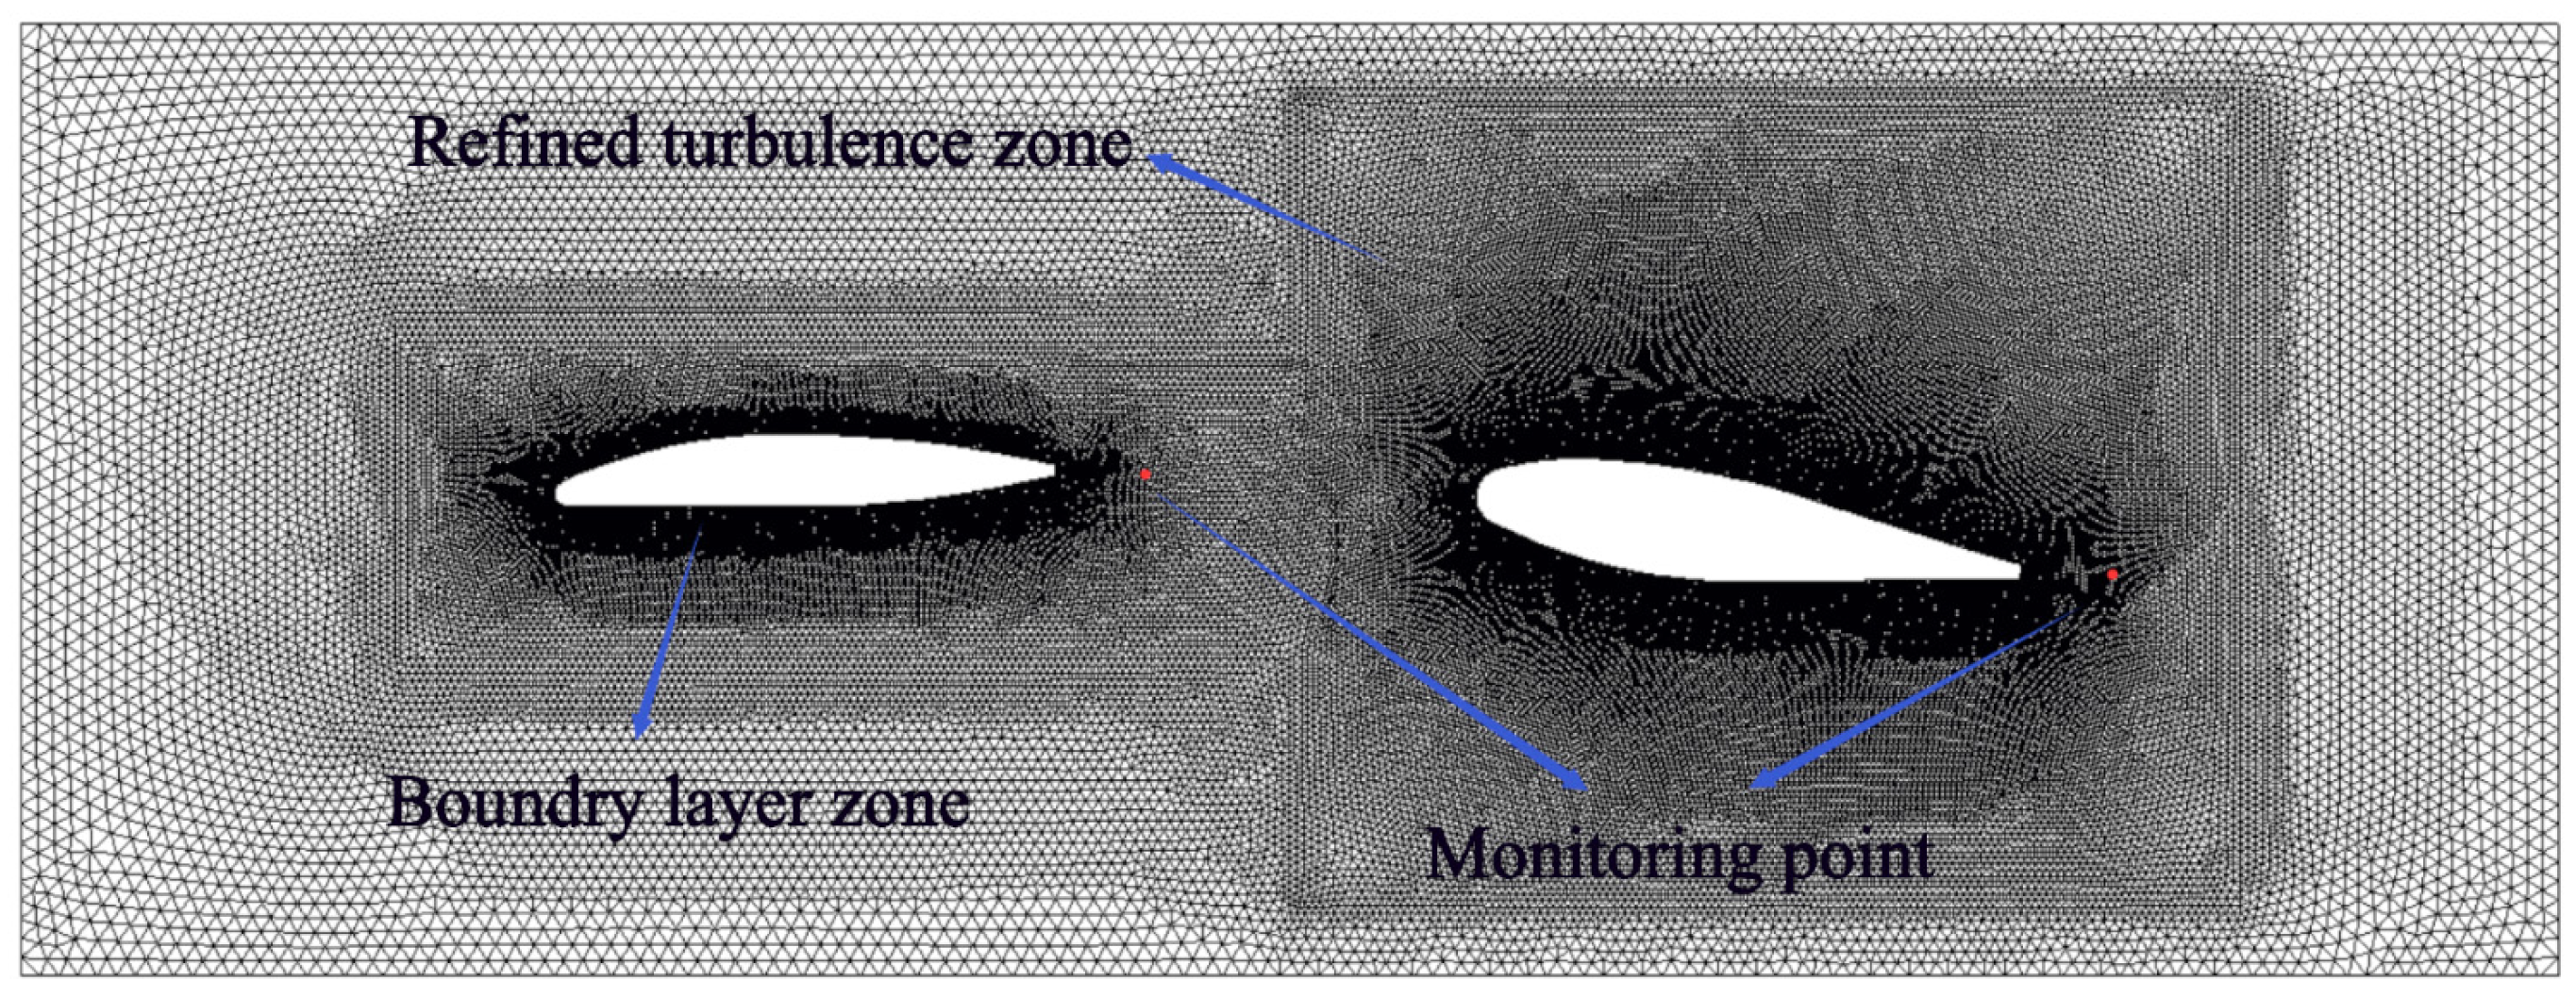
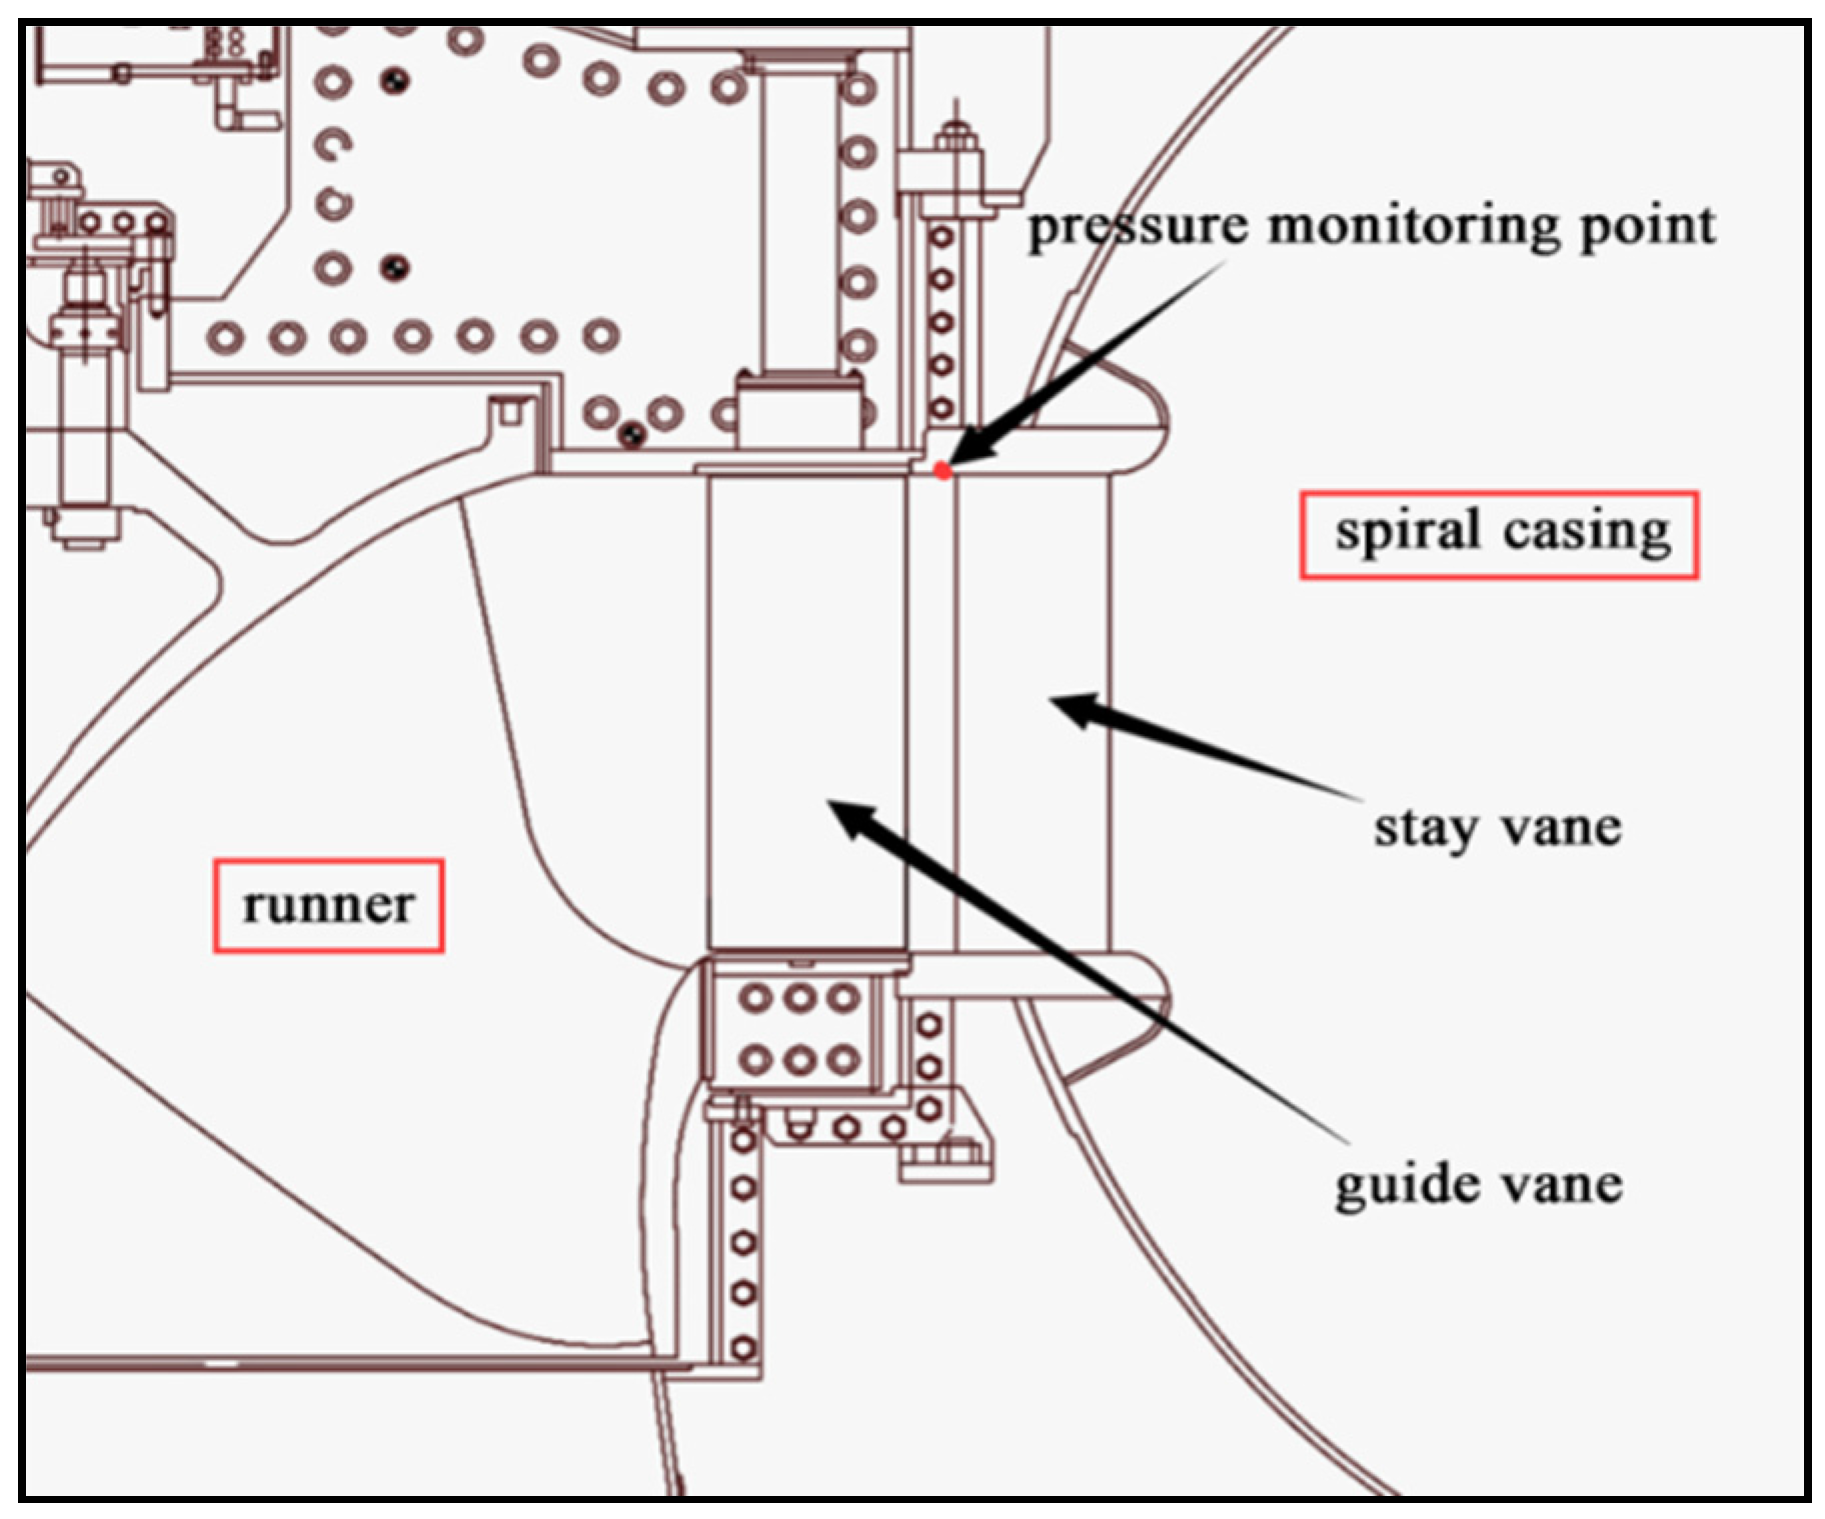
Since the most damaged stay vane were found in the Group 1, the simulation model was established according to the profile of stay vanes in Group 1. A high-quality mesh is required at the first place of flow simulation. The computational model was divided into the parts (the monitoring point, denoted in
Figure 1, is 200 mm behind the vanes), and each part was discretized by an unstructured mesh with triangular elements. The mesh of the turbulence zone and the boundary layer zone was refined in order to improve the accuracy and the numerical convergence of the analysis. Moreover, the automatic near-wall treatment approach was implemented to reduce the mesh sensitivity in the low Reynolds number zones.
To guarantee the mesh independence, six simulations were performed by taking the dynamic pressure behind the stay vane and guide vane as the reference variables (
Figure 2). It can be observed that the difference between the last three results is less than 4%. Hence, the mesh size with 269,672 elements was chosen in later analysis to cut down the computational cost since the computational time is positively correlated to the element number of mesh. The average value of y+ obtained in the regions of the vanes was 1.2, which is considered as an appropriate value [
24,
25].
The simulation was performed using the commercial software: ANSYS Fluent. Since the Kármán vortex-shedding phenomenon is significantly influenced by the thickness of boundary layer at the trailing edge, it is important to obtain a good boundary layer resolution for an accurate prediction. Two different turbulence models were employed in the simulations to approach the practical situation: The Shear Stress Transport
k-
w model (SST
k-
w), which retains the features of the original
k-
w model in the near wall area and uses
k-
w model away from the wall, is considered as a suitable turbulence model to investigate the flow separation phenomenon [
25], and the large eddy simulation model (LES), which can capture subtle movements under unsteady state and overcome the huge computational cost brought by the direct numerical simulations (DNS) at the same time, is considered to be the most promising turbulence numerical simulation development direction [
26]. Strictly speaking, the vortex shedding is a three-dimensional phenomenon [
21], but the adopted 2D approach at the design stage is considered competent for mechanism study.
The boundary conditions of inlet and outlet were set as velocity-inlet and outflow respectively, and time step Δt was set as 0.0005 s. The governing equation for flow was solved by the finite volume method (FVM) with the semi-implicit method for pressure-linked equations (SIMPLE) algorithm. In the discretization of the equations, a high-resolution MUSL (monotone upstream-centered schemes for conservation laws) for the advection terms and diffusion term was implemented. In order to avoid misconvergence and instability during the iteration process, the under-relaxation iteration technique is adopted, and the maximum residual error of the convergence condition is less than 0.001.
2.2. Improvement of the Trailing Edge
Considering that the resonance between the stay vane and the shedding vortex is the main cause of vibration and fatigue failure, the improvement of the trailing edge of the stay vane should be carried out from two aspects: change the frequency of shedding vortex and reduce the energy of the vortex street. The elementary improvement of trailing edge of the stay vane was based on three or four factors (shape, oblique angle, thickness, fillet radius, arc radius), which strongly influence the VIV. These factors can basically identify the configuration of trailing edge, and each factor was analyzed using control variate method. All the simulations were configured in the same way described in the former sections.
The original profile of the trailing edge is the so-called blunt trailing edge (
Figure 1). The profiles of three kinds of improved trailing edges are shown respectively in
Figure 3, where
α is the oblique angle,
T is the thickness, and
r and
R stand for fillet and arc radius respectively.
2.3. The Trailing Edge Optimization
Inspired by the work of [
25], an intelligent optimization model of the trailing edge of the stay vane was developed utilizing a new methodology combines CFD simulations, ANN and PSO optimization.
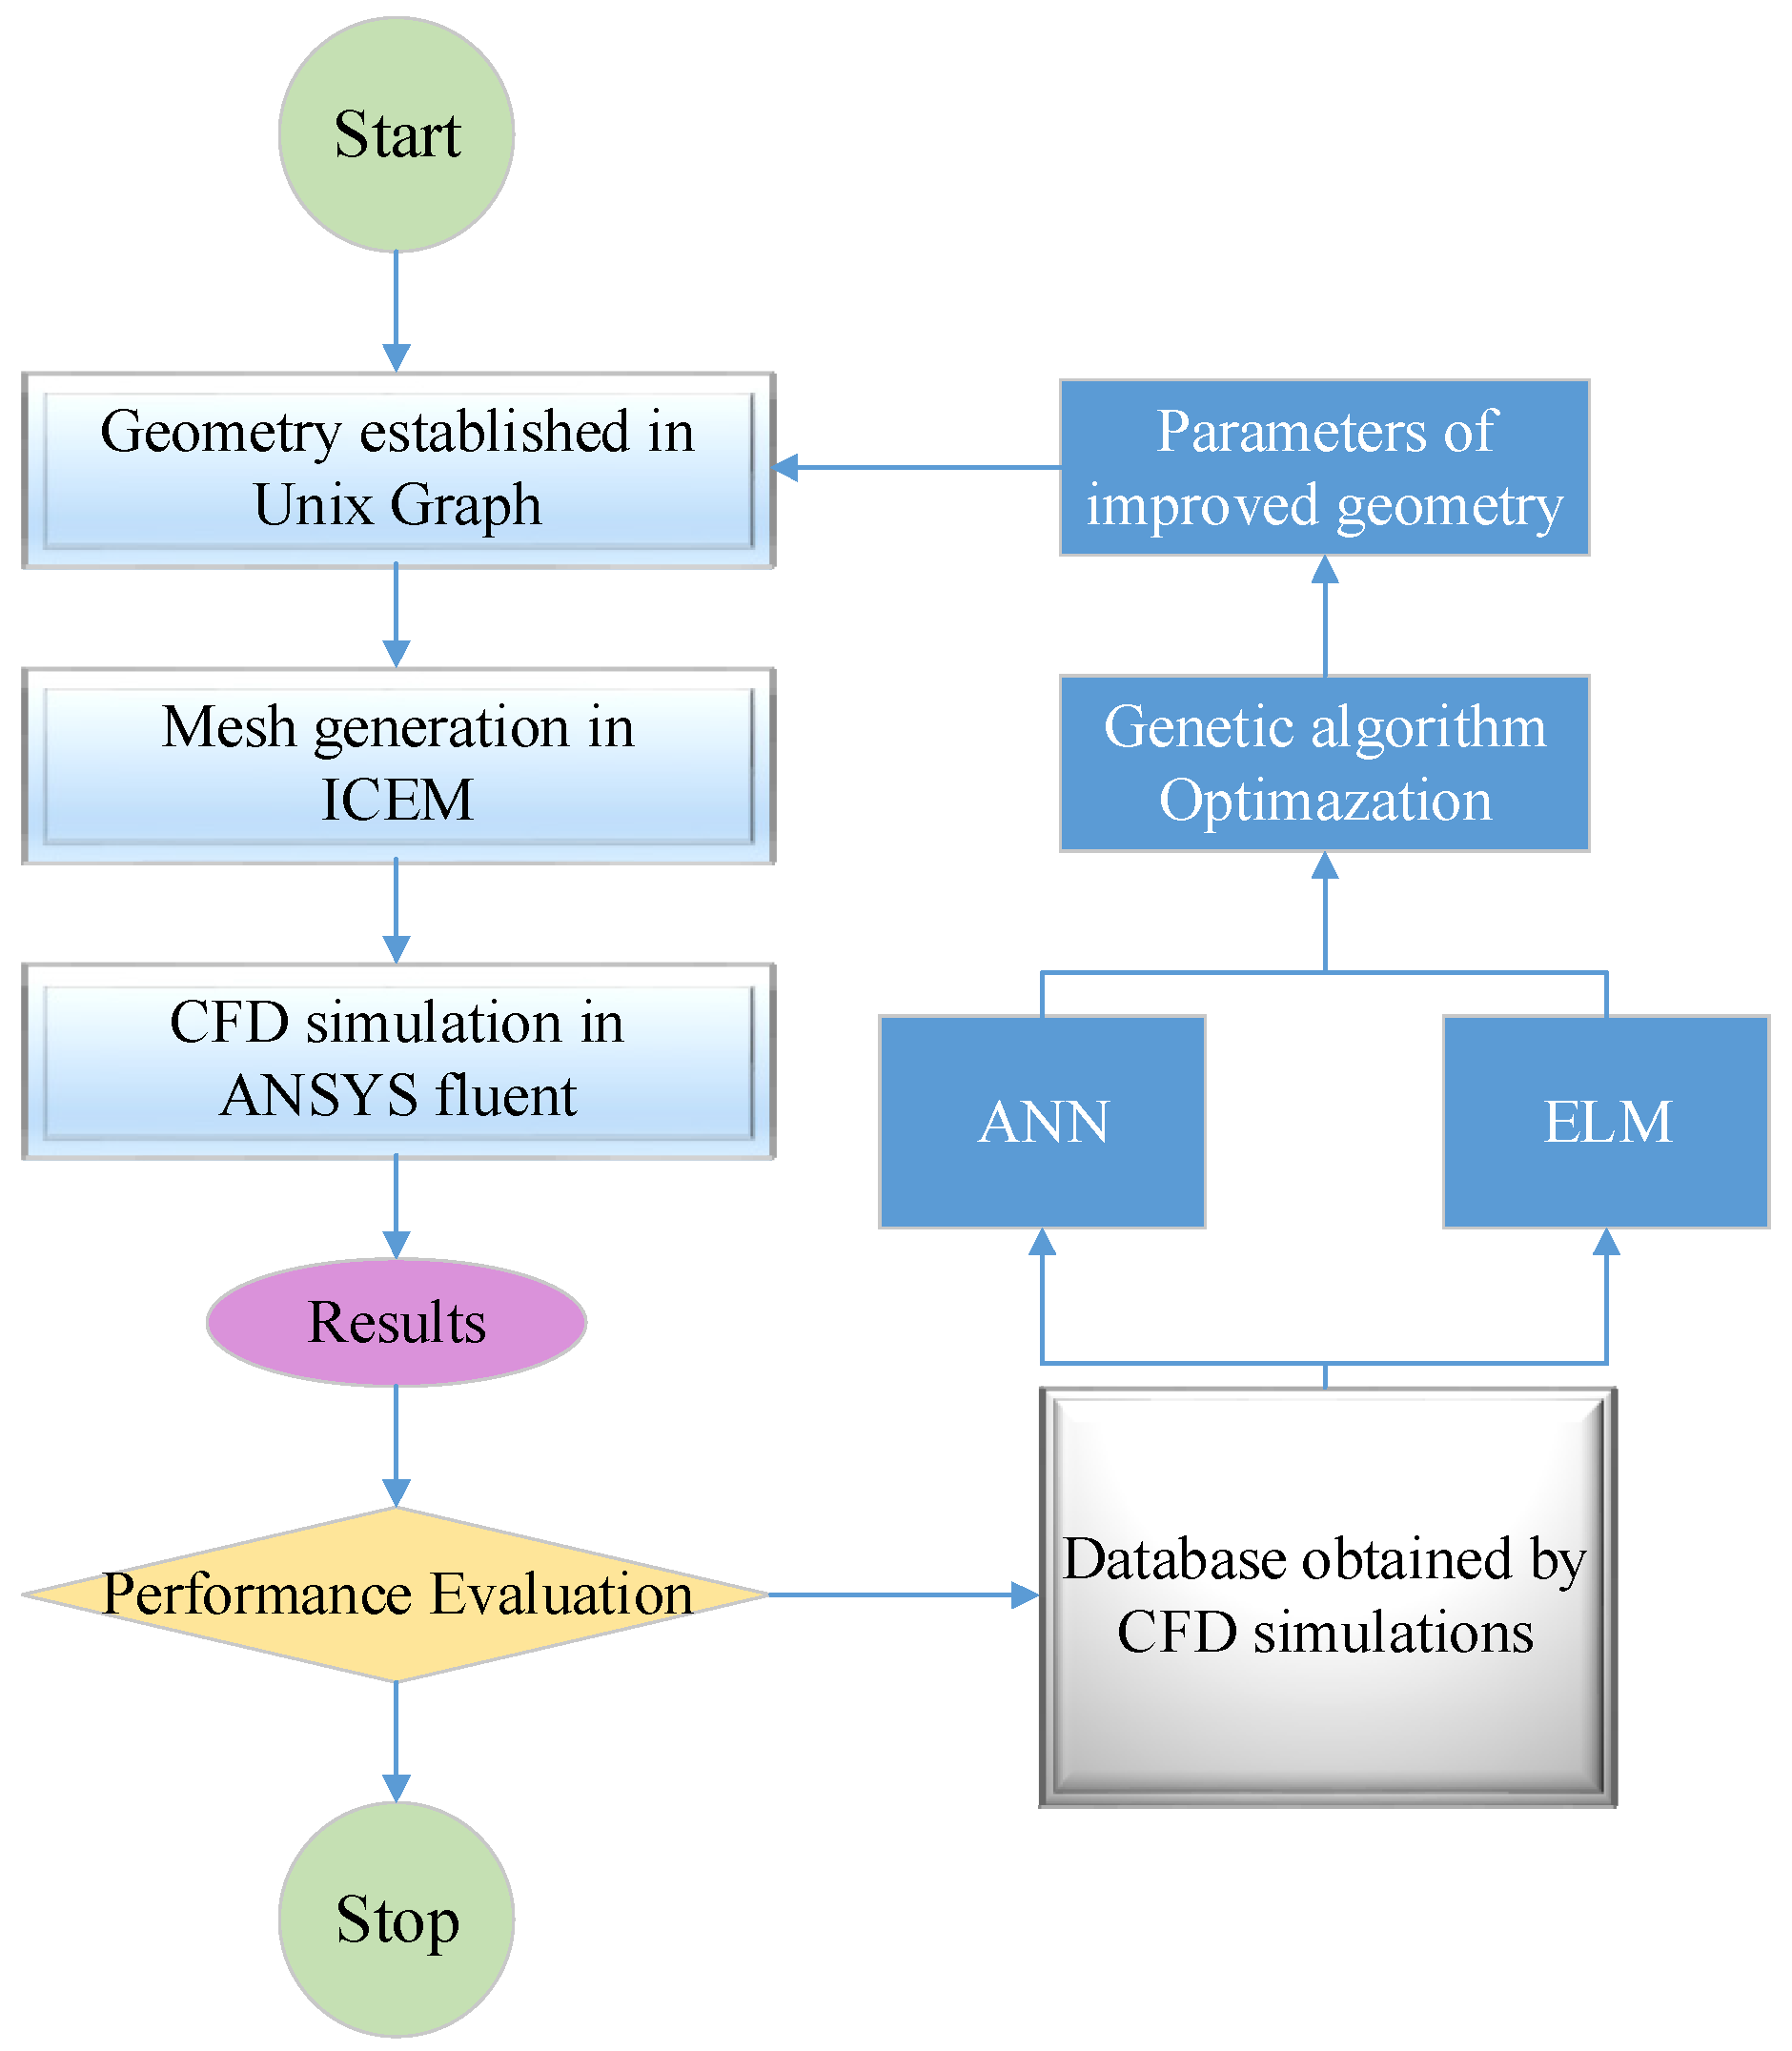
Figure 4 shows the schematic procedure of the optimization.
The process begins with the geometric model, which was parametrically modelled in the software Unigraphics NX (UG NX 10.0, Siemens PLM Software, Plano, TX, USA). The next step is mesh generation in ICEM and CFD simulation in ANSYS fluent. An objective function (OF) based on the requirements of vibration and other performance was defined to evaluate the performance of the profile of the stay vane. The original database was generated through the former factorial experiments based on the work of [
27], which were related to the four parameters that defined the trailing edge of the geometry (displayed in
Figure 3). If the requirements were not satisfied, the process was to continue with database generation. The information in the database was utilized in ANN’s training, which can predict the performance more efficiently than the time-consuming CFD simulations. Then PSO optimization was employed to seek for the parameters corresponded with better performance. The obtained results were used to generate new optimal geometry. If the optimal performance cannot fulfill the requirement, the geometry would be added to the database, and a new process with ANN training and PSO optimization began.
2.3.1. Objective Function (OF)
In order to seek for better profile of the stay vane, an OF was introduced to evaluate the performance of different geometries. At the design stage, the principal requirement is to avoid the resonance between the stay vane and the Kármán vortex, therefore, the difference between the natural frequency of the stay vane and the frequency of Kármán vortex is taken as the main target of the OF. However, the modification to increase the frequency difference could negatively affect the performance of the double row cascade. For example, it may increases the difference of frequency, while enlarge the amplitude of pressure pulsation and the hydraulic energy loss at the same time, which is unexpected. To overcome this problem, penalty terms were added. Firstly, energy loss penalty was added to cut down the hydraulic energy loss between the inlet and outlet caused by recirculation and vortex collision. Then, pressure penalty was brought in to lower the risk of cavitation. Moreover, it was necessary to add a length of Kármán vortex street penalty to prevent the vortex street disturbing the flow field of guide vane. The OF adopted in this paper is inspired by the work developed in [
28], which is given by the following expression.
where
p is the average dynamic pressure obtained from the monitoring point,
e stands the energy losses between the inlet and the outlet of the computational domain, which was defined in Equation (2), and
l is the length of wake behind the stay vane.
p0,
l0 and
e0 represent for the average dynamic pressure, wake length and energy losses of the original blunt profile respectively. The constants
wp wl and
we are weight factors of those variables that are set on values of 2, 1, 2 respectively.
where
Pin stands for the average pressure of the inlet, while
Pout is the average pressure of the outlet,
is the density of water,
Vin and
Vout represent the average velocity of the inlet and the outlet respectively.
In addition, an important constraint is added to the OF (Equation (3)) that the difference between frequency of the vortex shedding and the stay vane’s natural frequency must be greater than 20% to avoid the resonance.
where
f is the vortex shedding frequency obtained in CFD simulations,
fn1,
fn2,
fn3 represent the first three natural frequency of the studied stay vane (ignoring the small difference of frequency caused by geometry changes).
2.3.2. Artificial Neural Networks (ANN)
Considering the PSO optimization should evaluate a large number of geometries, and such a CFD simulation requires huge computational resources, the computational time of optimization process would be unacceptable. To overcome this problem, researchers such as Pierret [
29], Teran [
25] and Derakhshan [
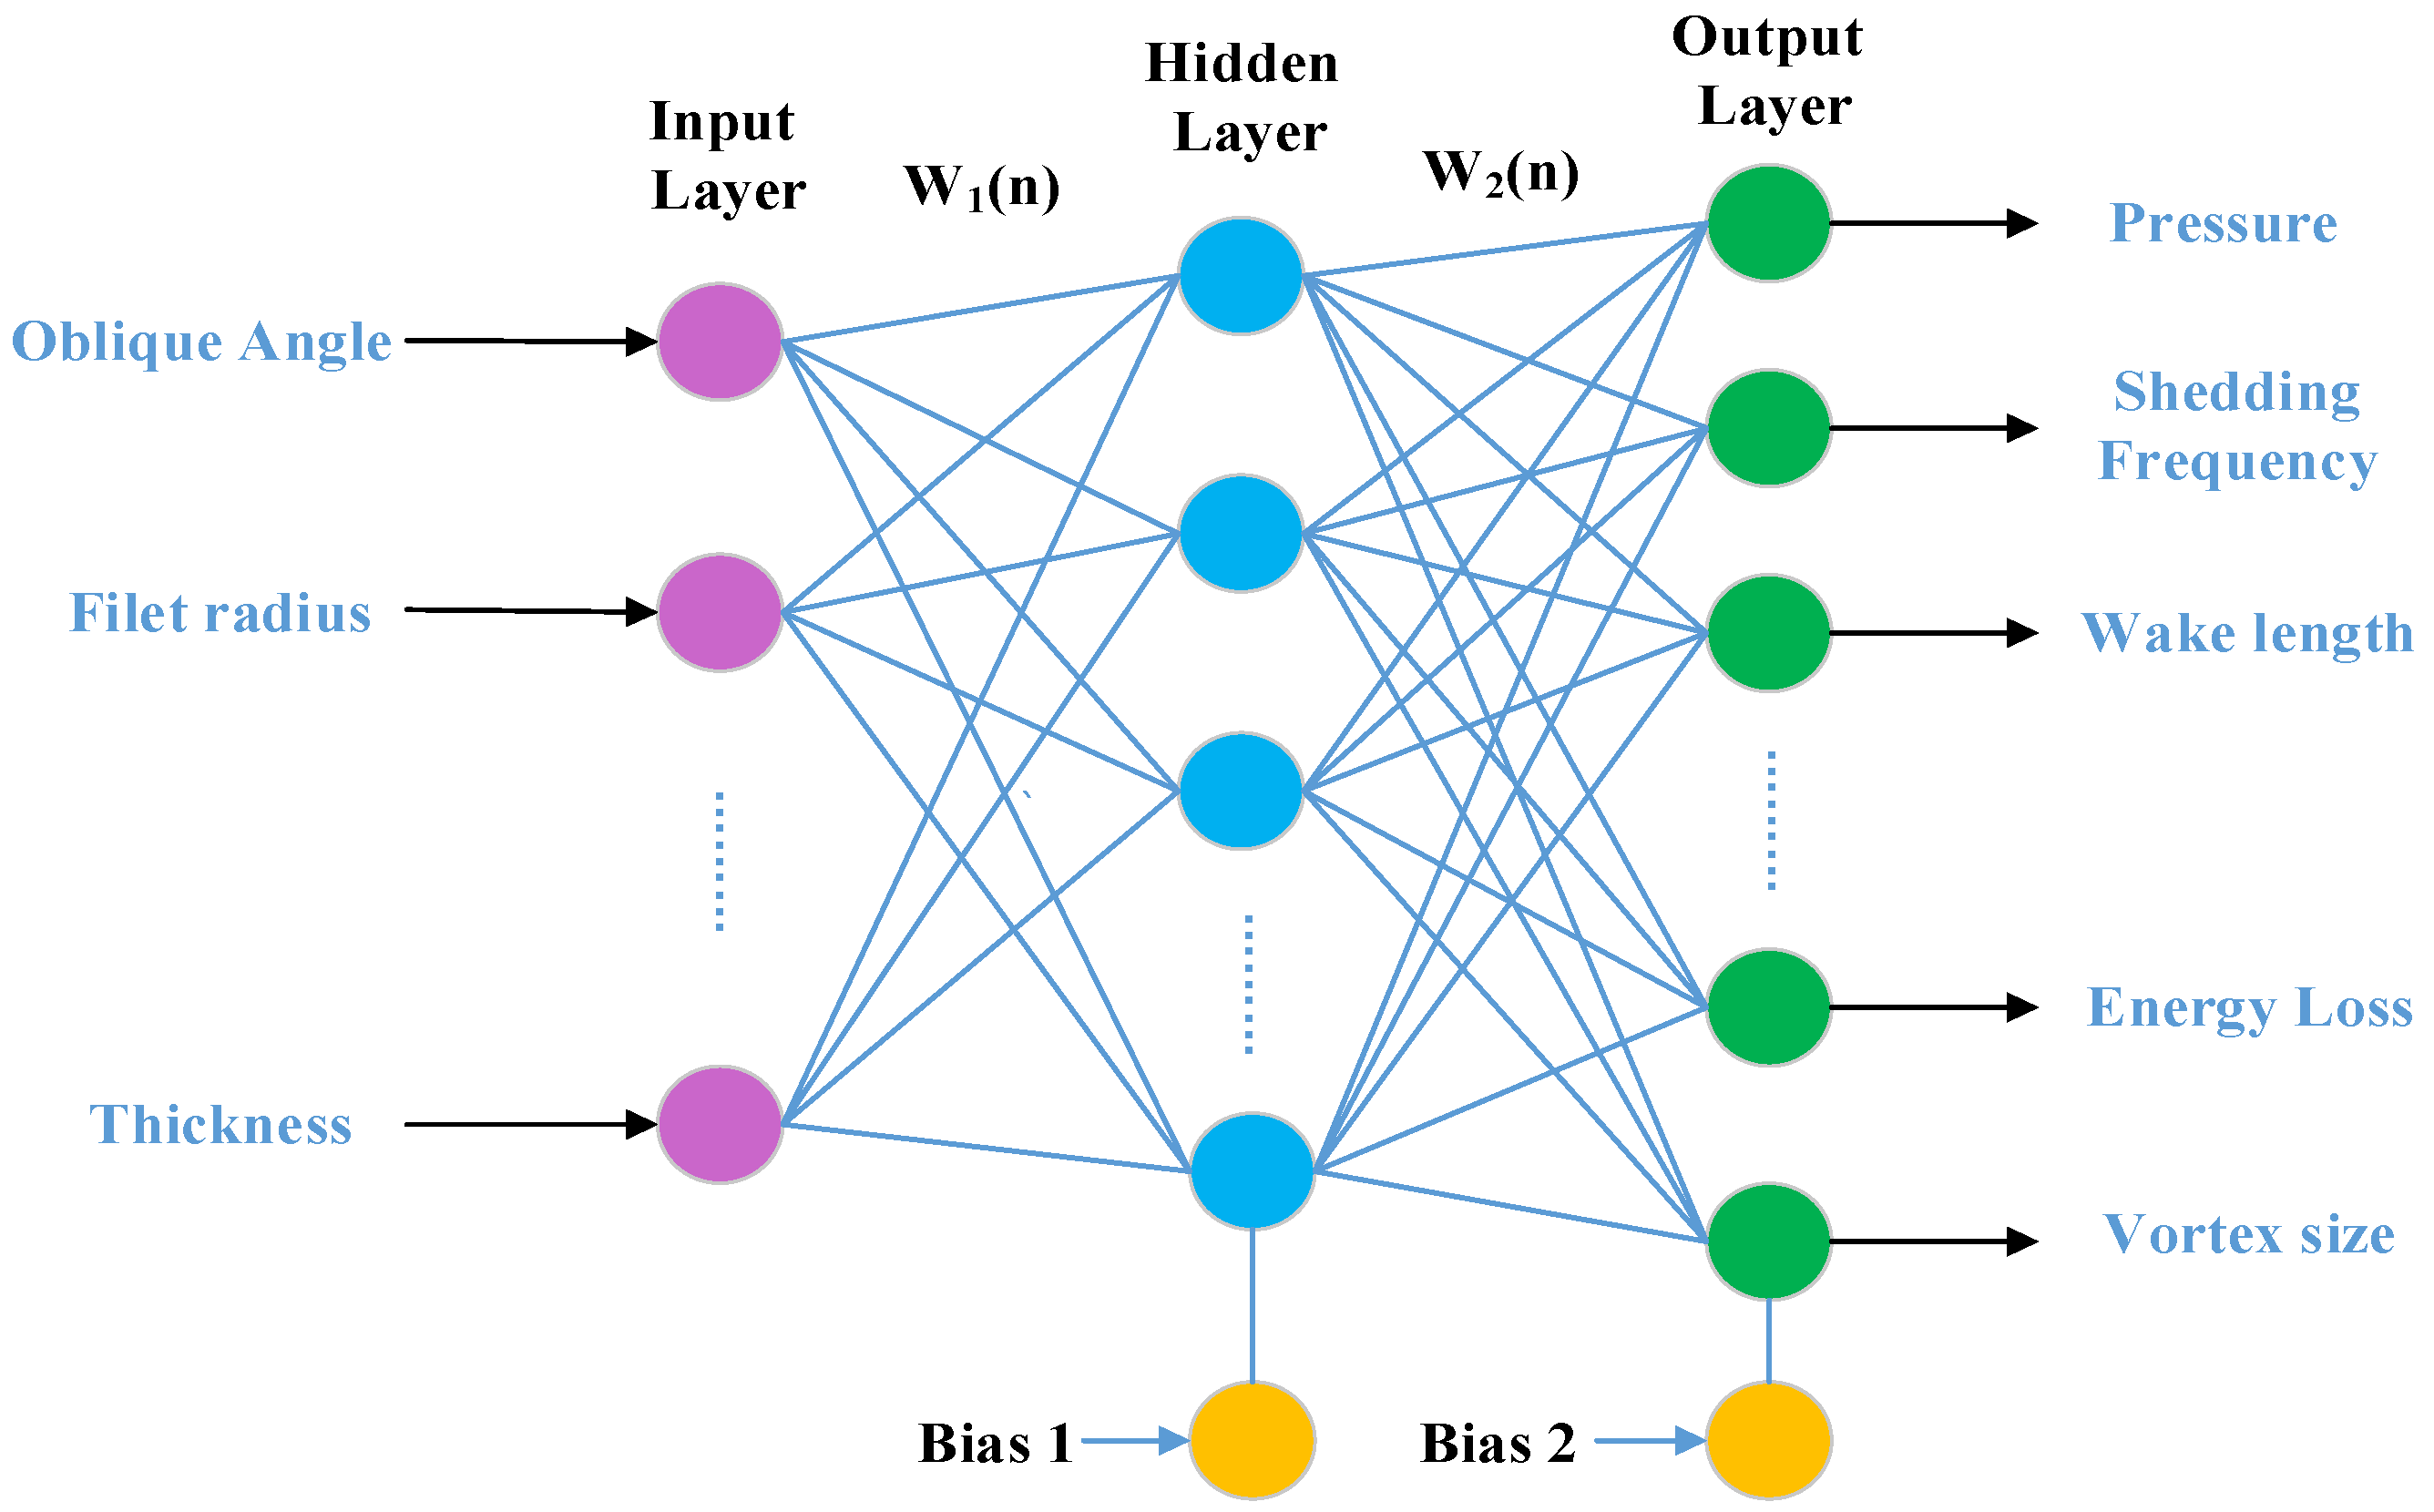
28] adopted the ANN method to obtain approximated solutions instead of the time-consuming numerical simulations. The ANN is a computational model that can imitate the learning capability of animal brain, which turns out to be very useful in function mappings that have multiple inlets and outlets. In this paper, the ANN is established to obtain the characteristics related to a geometry for calculating the OF and the original database obtained from CFD simulations in factorial experiment (60 sets of data for Donaldson trailing edge, 25 sets of data for Arc trailing edge and 25 sets of data for Dove trailing edge) was employed for the ANN’s training. Through this approach, the OF can be predicted as an output variable from the input parameters of the geometry, which significantly accelerates the optimization process method. The scheme of the ANN is demonstrated in
Figure 5.
2.3.3. Extreme Learning Machine (ELM)
The ELM, introduced by Huang et al. [
24], is a kind of single hidden layer feed-forward network (SLFN) with a higher learning speed than the traditional neural network. Unlike the traditional neural network learning algorithms (such as back propagation algorithms) need to set a large number of network training parameters, the input weights and hidden biases of ELM are randomly assigned and the output weights are calculated by simply applying generalized inverse operation to the hidden output matrix [
30].
Assuming there is a set of N samples: (
xi,
yi) for
i = 1, 2, …,
N, where
and
, then, the output of an ELM with
L hidden neurons can be expressed as:
where
is the input weight vector,
is the output weight vector, while
bi is the bias and
g(
x) is the activation function.
The above equation can be simplified as:
where
H is the output matrix of hidden layer,
β is the weight matrix of output, and
T is the matrix of expected output.
Once the input weights
wi and the hidden layer bias
βi are randomly assigned, the output matrix of the hidden layer is uniquely determined. The training of the neural network can be transformed into solving the following linear system equation:
Many researches indicate that ELM, compared to traditional ANN, has shown superiority in many aspects, such as learning speed, generalization performance and so on [
31,
32,
33]. Therefore, the ELM method was introduced in this paper, and comparative test between ELM and ANN was performed. The calculation results of characteristic indicators at the monitoring point by different methods are displayed in
Table 2. The results show that ELM has better ability for function mapping than ANN in this case.
4. Results and Discussion
4.1. Results of Factorial Experiments
In order to study the effect of each factor determining the trailing edge profile on the performance of stay vane, factorial experiments were conducted in CFD simulations. The results were demonstrated and discussed in the following parts.
Thickness: By cutting or extending the profile of trailing edge, a set of simulations was performed to investigate the influence of the trailing edge thickness. As shown in
Figure 10, the alternate vortexes detached from upper and lower corners of the trailing edge and encountered in the wakes behind the stay vane. It can be observed that the detach velocity is larger and the development space of the vortex is narrower in the case of thinner trailing edge, leading to a more violent collision between the vortexes and accelerating the decay process of the Kármán vortex street. Therefore, with the decrease of the thickness of the trailing edge, the vortex shedding frequency increases, while the amplitude of the pressure and the length of wake decrease.
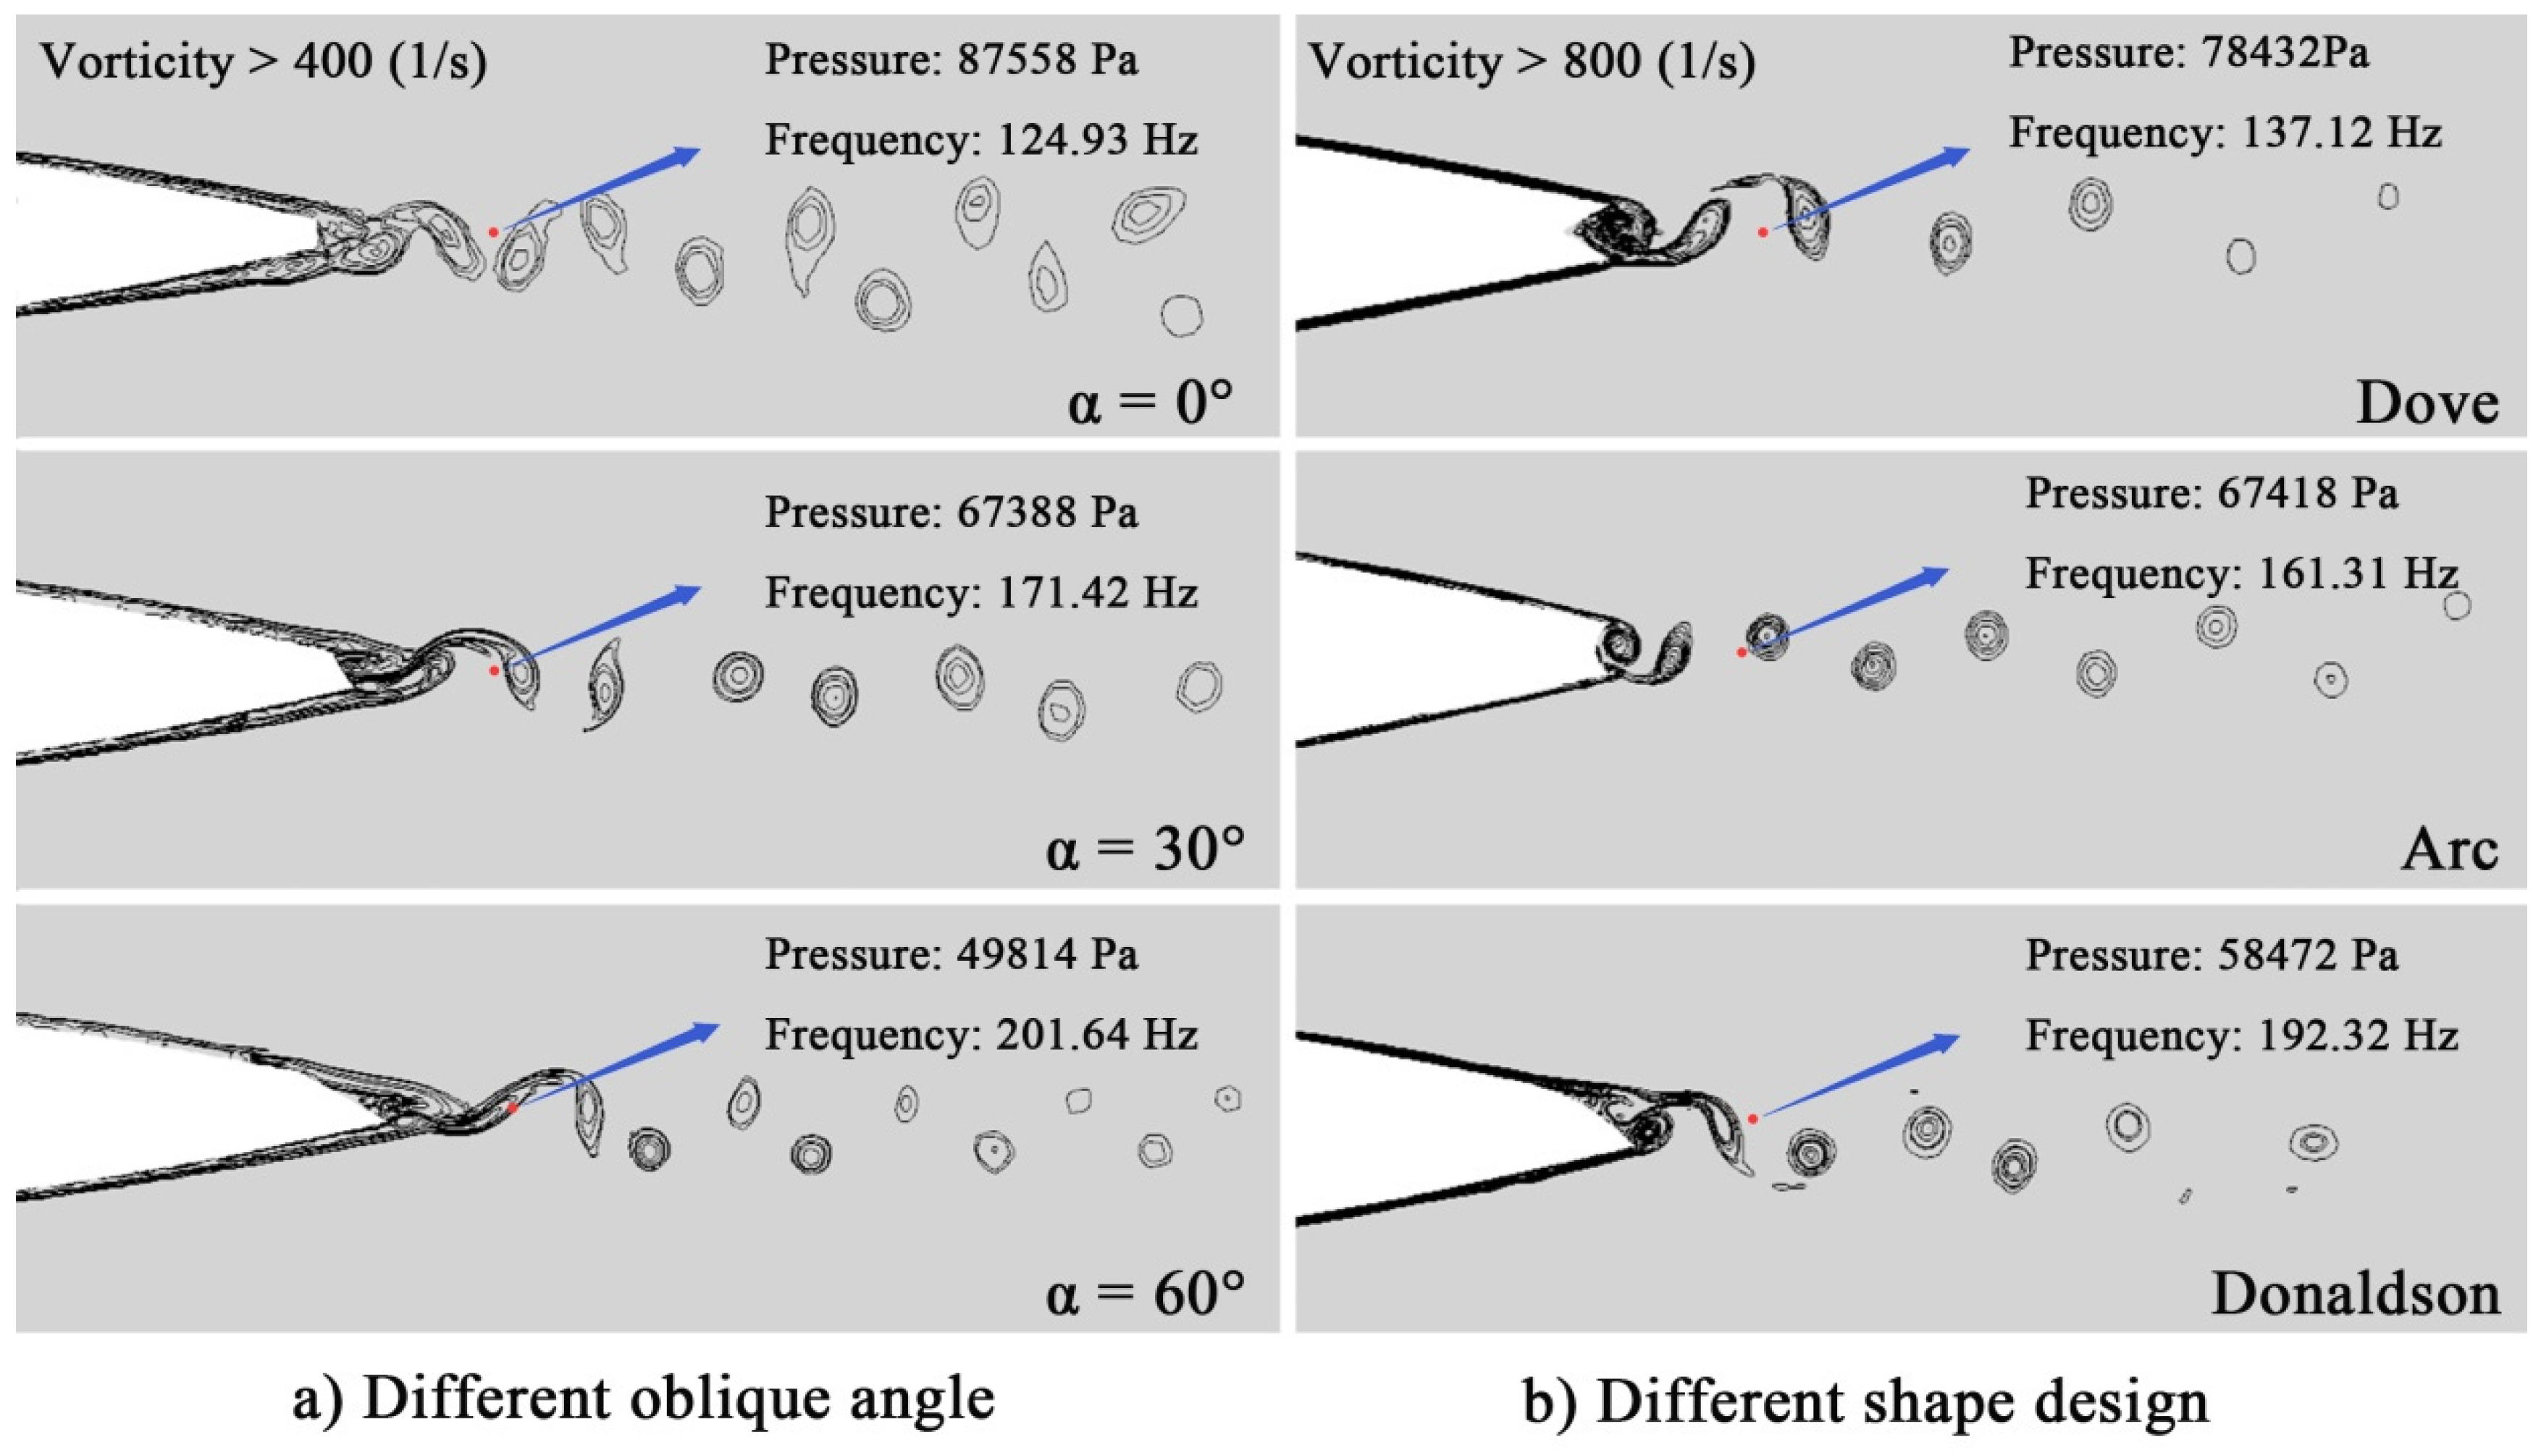
Oblique Angle: The oblique angle denoted in
Figure 3 is the angle between the upper and the lower sides of the trailing edge. With the increase of oblique angle, the difference of velocity between the flows from upper and lower sides increased, and the development space of vortex reduced which is equivalent to the effect of shortening the trailing edge thickness. It can be observed from
Figure 12a that the size of vortexes became smaller and the wakes are shorter with the increase of the oblique angle. Besides, a significant reduction of pressure pulsation and an increase of shedding frequency were found as well, which is in a good agreement with the research of Ref. [
15].
Fillet radius: It is found in the practical engineering applications that the VIV can be reduced to some extent after rounding at corners. The effect of corner smoothing at the upper side of the trailing edge is similar to the oblique trailing edge design with smaller hydraulic losses.
Shape: The comparison of different shapes is displayed in (
Figure 11b). In the Dove and Arc design, the vortexes were generated in the cavity of the trailing edge. The narrow space caused a violent collision of vortex, speeding up the process of the collapse of Kármán vortex. In the Donaldson design, the vortexes from the lower side roll up and encounter the vortexes from the upper side having a violent collision. In this way, the energy of the Kármán vortex street is cut down significantly while the shedding frequency increases at the same time.
It can be inferred from the results of the above factorial experiments that the shedding frequency and energy of the Karman vortex can be controlled by changing the trailing edge configuration of the stay vane profile to achieve better performance in the case of avoiding resonance.
4.2. Verification of Optimized Geometries
After the optimization process with ELM and PSO, three results were obtained from the three kinds of profiles of the stay vane. The first verification was carried out in CFD to evaluate the performance of these geometries. The profiles of the optimized trailing edge and corresponding characteristic calculated in CFD simulations are shown in
Table 5. With the application of the constraint in the OF, the shedding frequency of Kármán vortex was obviously increased and the difference between the vortex shedding frequency and the first three natural frequency was big enough to avoid resonance. It can be observed that with the decrease in the thickness of the trailing edge, all the indicators of vane performance are improved, therefore, the thickness of these three results are optimized to the minimum thickness of 10 mm.
The wakes length after the stay vane of Dove and Arc profiles is significantly shorter, which means that the Kármán vortex decays faster after the collision at the cavity of the tail. It is considered that the narrow cavity limits the growing space of vortex and intensifies the collision between the two counter-rotating rows of swirls, which would increase the hydraulic losses and accelerate the decays process. Since all the indicators of the performance of Donaldson trailing edge were improved, this kind of profile was considered as the best solution.
In order to evaluate the risk of fatigue damage under the circumstances of no resonance, the Goodman criterion was employed [
36]. The results of CFD simulations were imported in a structural simulation of the stay vane to calculate the distribution of Von Mises stress, which is demonstrated in
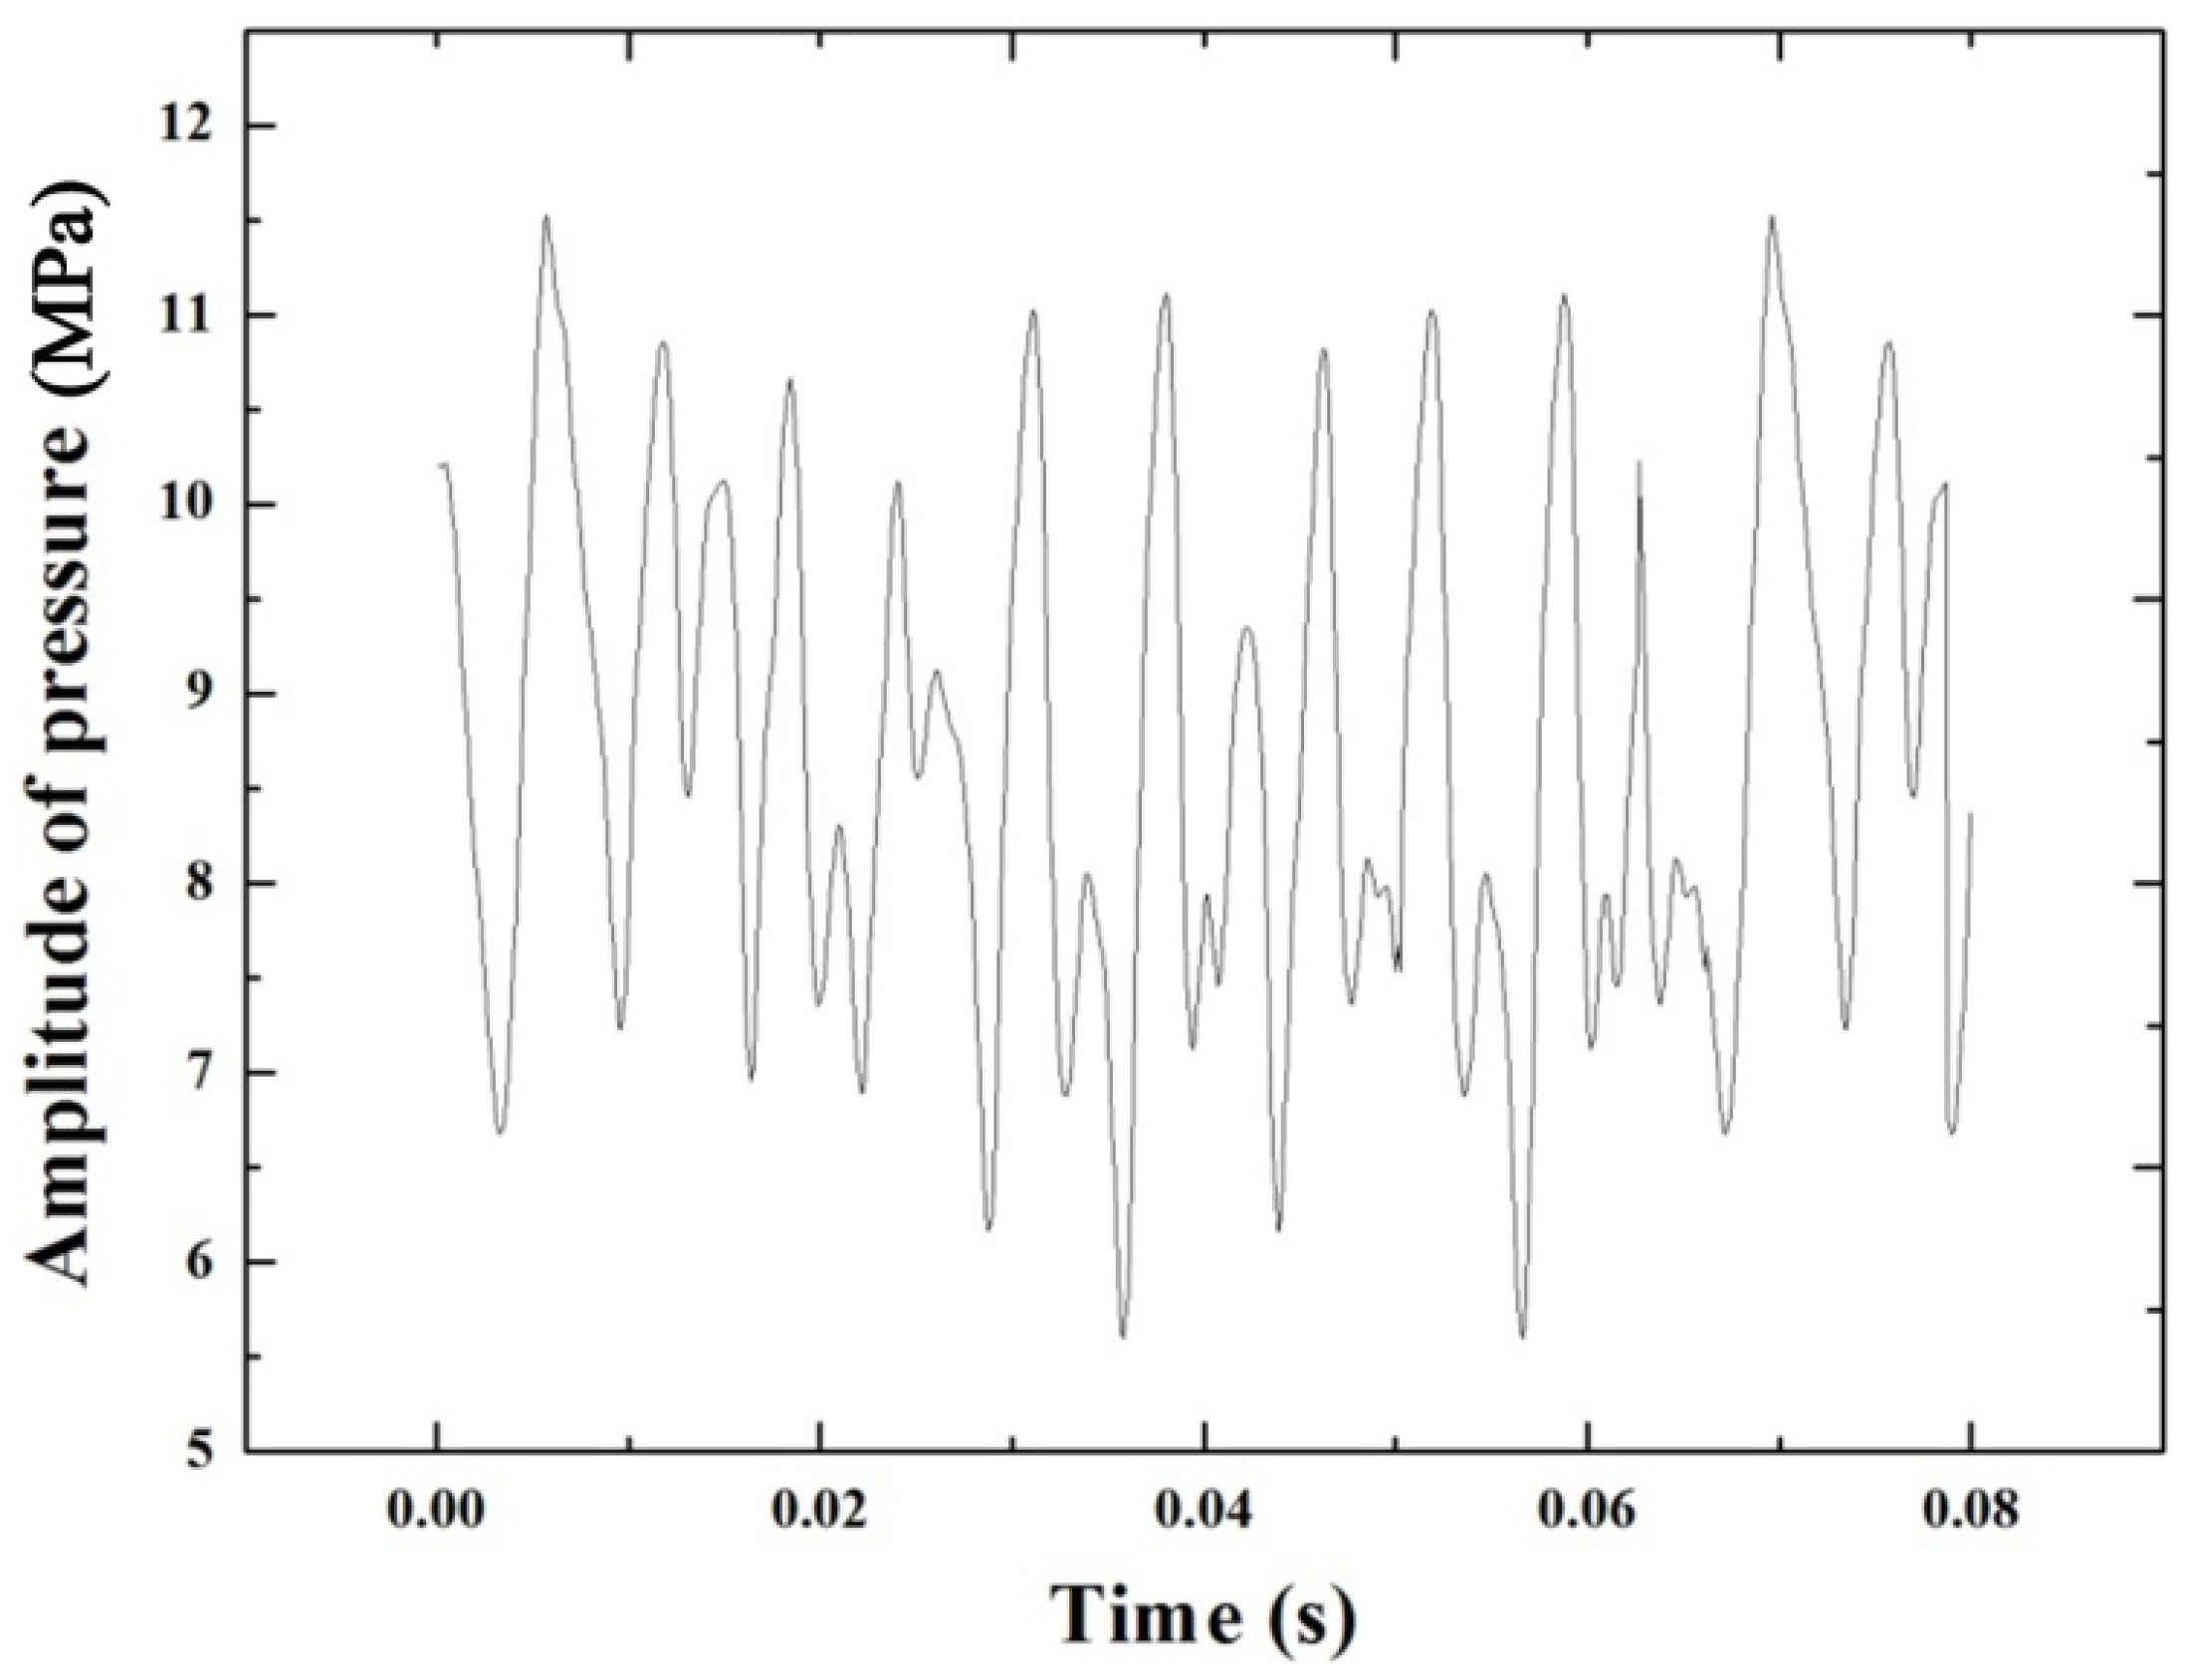
Figure 12, where the maximum stress is marked in places sensitive to fatigue damage, and this conclusion is coincided with the location where the crack appeared in the practical operation (The connection between the stay vane and the stay ring). The fluctuating dynamic pressure of the maximum point of the stress on the stay vane was found using CFD and structural coupled transient simulation (
Figure 13). The information (the peak value and the valley value) at the point of maximum stress was used to calculate the fatigue life. The stay vane material is Q235B; its fatigue properties are described in Ref. [
37].
The stress amplitude transformed from asymmetric stress to symmetrical stress is 6.2 Mpa. The stay vane’s fatigue damage coefficient was calculated as 0.023 when the survival rate is 99% and the unit annual utilization factor is 0.83. In the end, the obtained fatigue life was 43.5 years, which means the stay vane can provide good safety factor without resonance.
5. Conclusions
In this paper, an intelligent optimization method for the trailing edge profile of stay vane, which is based on CFD simulation, ELM and PSO, was proposed to reduce the undesired vibration and improve the performance of the stay vane. Four factors (thickness, oblique angle, fillet radius, shape) were introduced to define the profile of the stay vane trailing edge. Factorial experiments of these factors were performed and the results were used to establish a database for ELM training. At last, PSO was utilized to find the best solution under the given constraint in OF. Different from the traditional optimization method, it does not give an optimization scheme and then verify its superiority, but find the optimal solution considering the actual needs in all optimization programs. By using this method, the optimal geometry of the stay vane can be efficiently obtained considering practical engineering requirement, and the design costs can be reduced greatly.
In the end, an optimized profile of the stay vane with a Donaldson trailing edge was chosen as the best solution. The resonance between the shedding vortex and the stay vane was eliminated, while other indicators of performance were improved at the same time, such as the dynamic pressure at the tail of the vane was decreased by 11.7%, and the hydraulic energy losses was cut down by 17.9%. Verifications such as CFD simulations, structural analysis and fatigue analysis were carried out and the results allowed one to draw the conclusion that the optimized stay vane will perform well.

 ,
, 


