Modeling of Supersonic Combustion Systems for Sustained Hypersonic Flight

1
Aerospace Engineering Graduate, College of Engineering and Design, Brunel University London, Uxbridge UB8 3PN, UK
2
Metapulsion Engineering Ltd, 2C Eastbury Avenue, Northwood HA6 3LG, UK
*
Author to whom correspondence should be addressed.
Energies 2017, 10(11), 1900; https://doi.org/10.3390/en10111900
Submission received: 16 October 2017
/
Revised: 8 November 2017
/
Accepted: 9 November 2017
/
Published: 18 November 2017
Abstract
:Through Computational Fluid Dynamics and validation, an optimal scramjet combustor has been designed based on twin-strut Hydrogen injection to sustain flight at a desired speed of Mach 8. An investigation undertaken into the efficacy of supersonic combustion through various means of injection saw promising results for Hydrogen-based systems, whereby strut-style injectors were selected over transverse injectors based on their pressure recovery performance and combustive efficiency. The final configuration of twin-strut injectors provided robust combustion and a stable region of net thrust (1873 kN) in the nozzle. Using fixed combustor inlet parameters and injection equivalence ratio, the finalized injection method advanced to the early stages of two-dimensional (2-D) and three-dimensional (3-D) scramjet engine integration. The overall investigation provided a feasible supersonic combustion system, such that Mach 8 sustained cruise could be achieved by the aircraft concept in a computational design domain.
1. Introduction
Commercial air travel is an ever-expanding industry seeing strong year-on-year growth with International Air Transport Association’s (IATA) 2035 forecast estimating a doubling of the 7.2 billion passengers measured in 2016. Since the Concorde program retired in 2003, there is dispute over whether a gap in the market still exists for high-speed air travel and whether or not there is still demand for this convenience. Concorde was renowned for its ability to fly above Mach 1. Hypersonic transport has potential to be the next general mode of air transport, with speeds of over Mach 5. Such a concept could traverse the Heathrow to JFK route in half of Concorde’s 4-h flight time, but would be faced with demanding engineering challenges in order to meet strict regulatory laws.
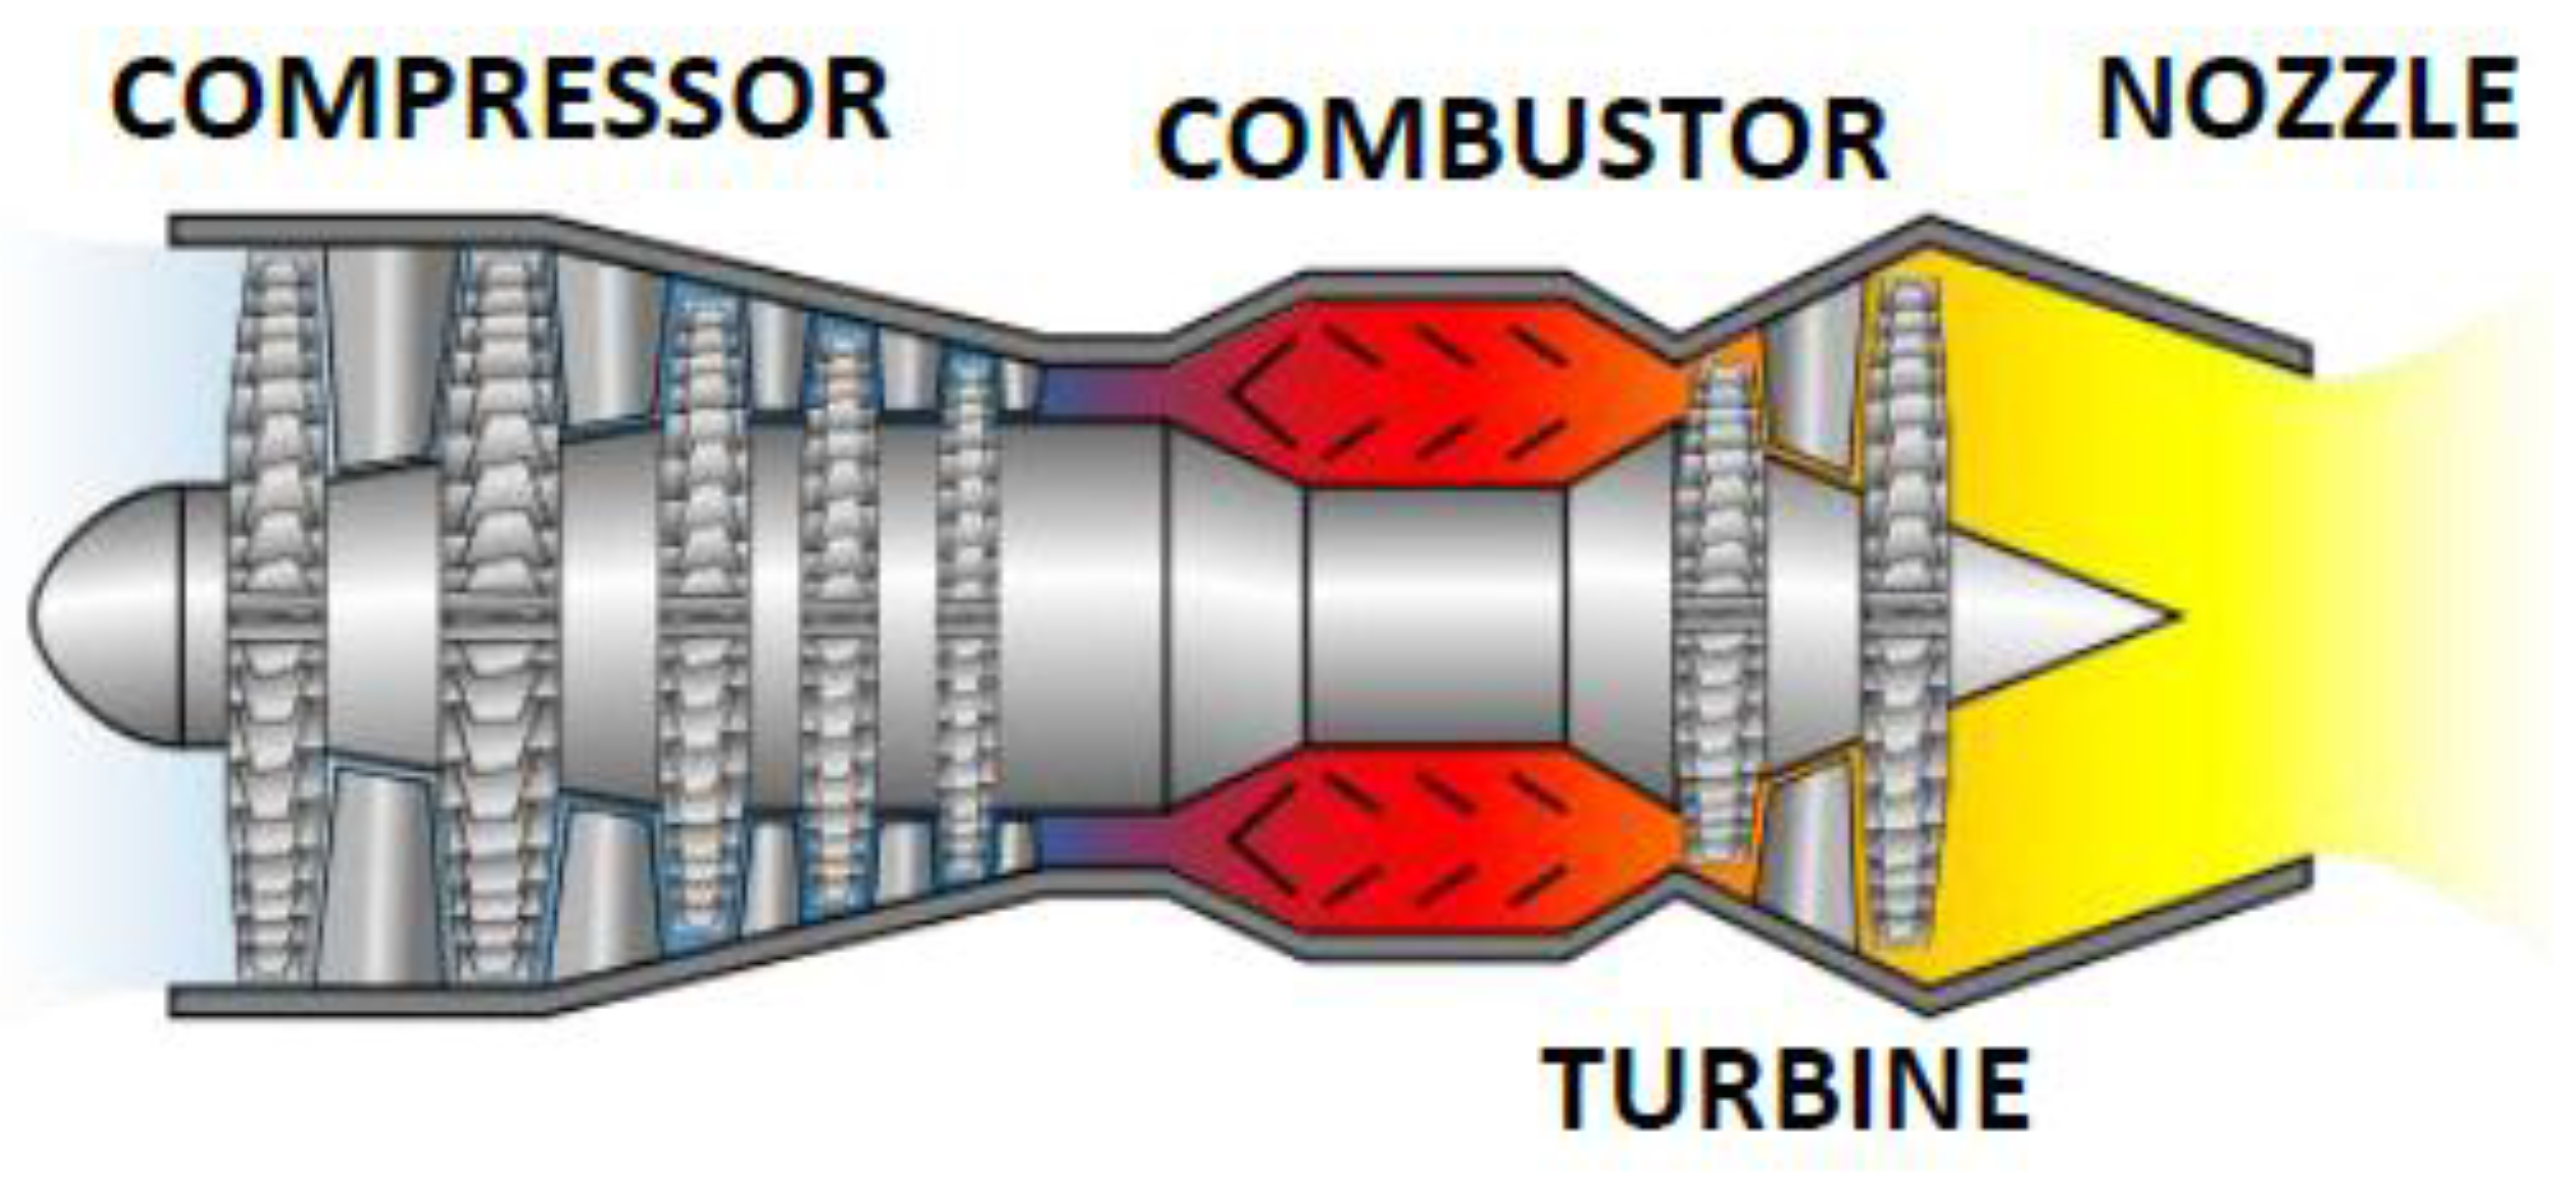
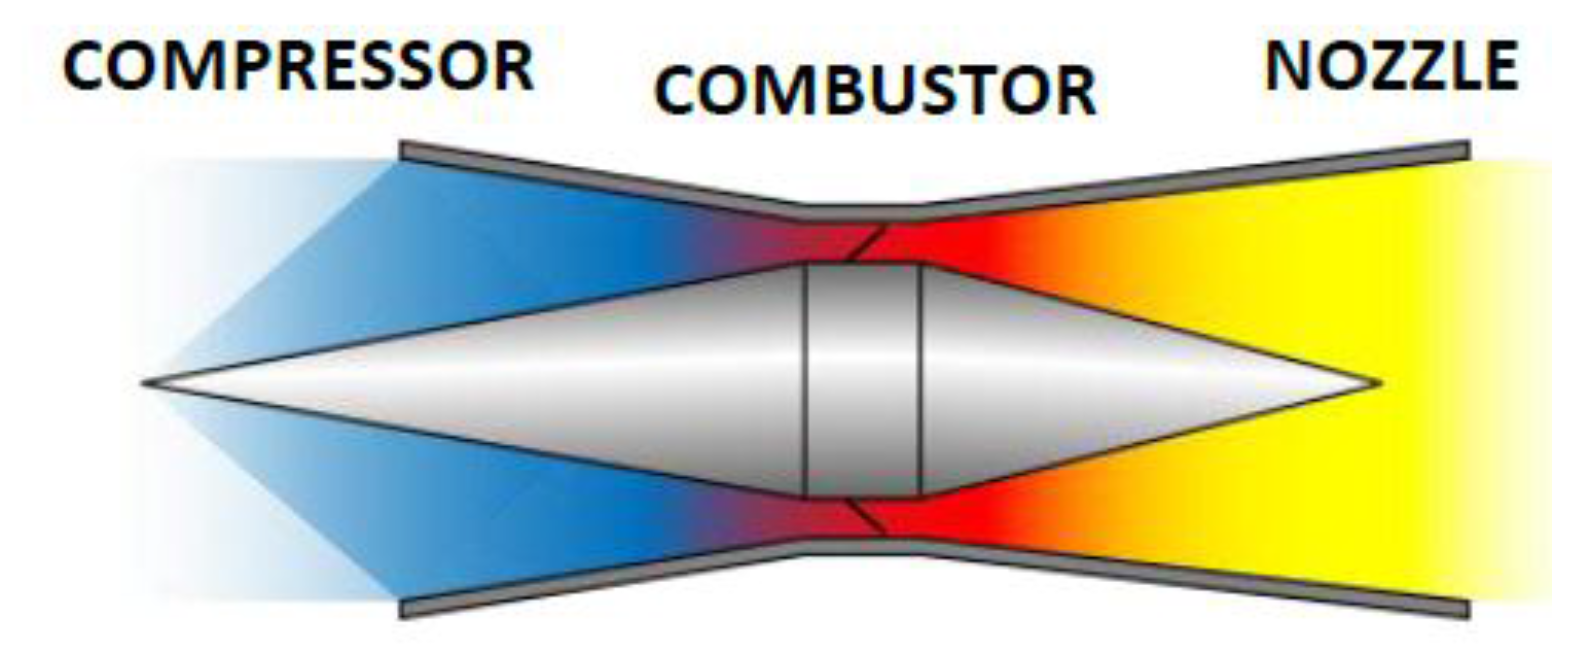
Conventional air-breathing engines, such as those associated with the present commercial aircraft (Figure 1), rely on rotational components for both starting and continued generation of thrust. Sustained hypersonic flight is associated with severe thermal, aerodynamic, and stress-related loading factors that hinder a turbine engine’s ability to operate. Utilizing the ‘ram’ effect, by exploiting high speeds and dynamic air pressure, allows ramjet and scramjet engines (Figure 2) to compress intake air without the necessity of rotational components. The downside of this, however, leaves them unable to perform standing starts.
Where ramjet engines have an operational regime of approximately Mach 2.5–Mach 5, relying on sub-sonic flow behavior throughout the engine, a scramjet can operate in excess of Mach 5 by allowing the flow to remain super-sonic within the engine.
With any engineering challenge of this sensitivity and complexity, there are a multitude of challenges associated with sustained hypersonic flight and achieving robust combustion in fairly severe operating conditions. The largest of these challenges is the residence time and interaction (mixing) of fuel and air particles within the combustion chamber.
The primary objective of this particular investigation is the development of a feasible supersonic combustion system for integration with a dual-engine-mode hypersonic transport aircraft concept. Through computational modeling, the aircraft concept is designed for an operational cruising Mach number of 8, at which conditions necessitate the usage of a scramjet engine, the requirements of which are to provide robust sustained combustion. Such sustained operation would facilitate the geographical requirements of a long distance commercial transport aircraft.
2. Supersonic Combustion Systems
This section provides a concise and precise description of the experimental results, their interpretation, as well as the experimental conclusions that can be drawn.
2.1. Injection Method
Transverse injectors introduce fuel perpendicular to the flow direction, following the regime of JICF (Jet in Cross Flow). The flow separation at the source causes a bow shock, reducing downstream velocity and total pressure. The recirculation of the oncoming fluid and fuel in the lower wall initiates the mixing and combines further in the downstream turbulent mixing zone. Studies such as those conducted in Figure 3 demonstrate a typical distribution of H2 fuel for transverse injection methods. Typically, transverse injections induce a bow shock following the angle of the initial jet, followed by significant total pressure loss across this shock. Fuel-air mixing is carried out downstream of the jet during the recirculation and reattachment of the flow.
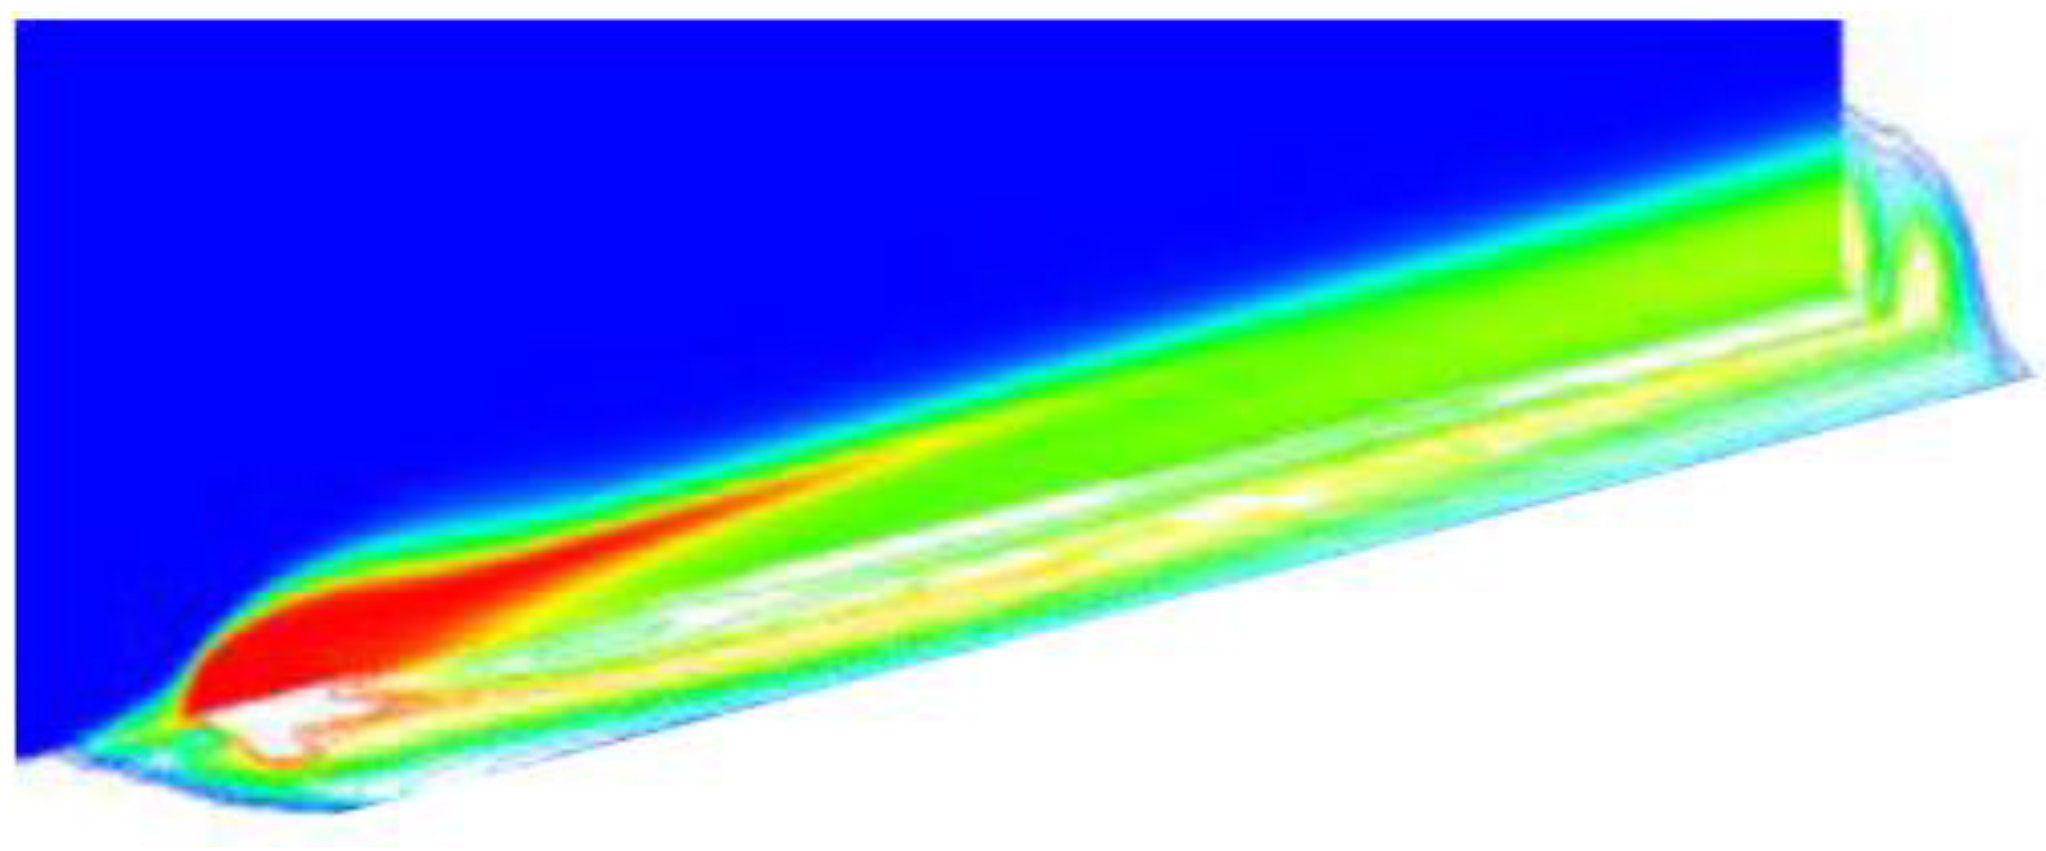
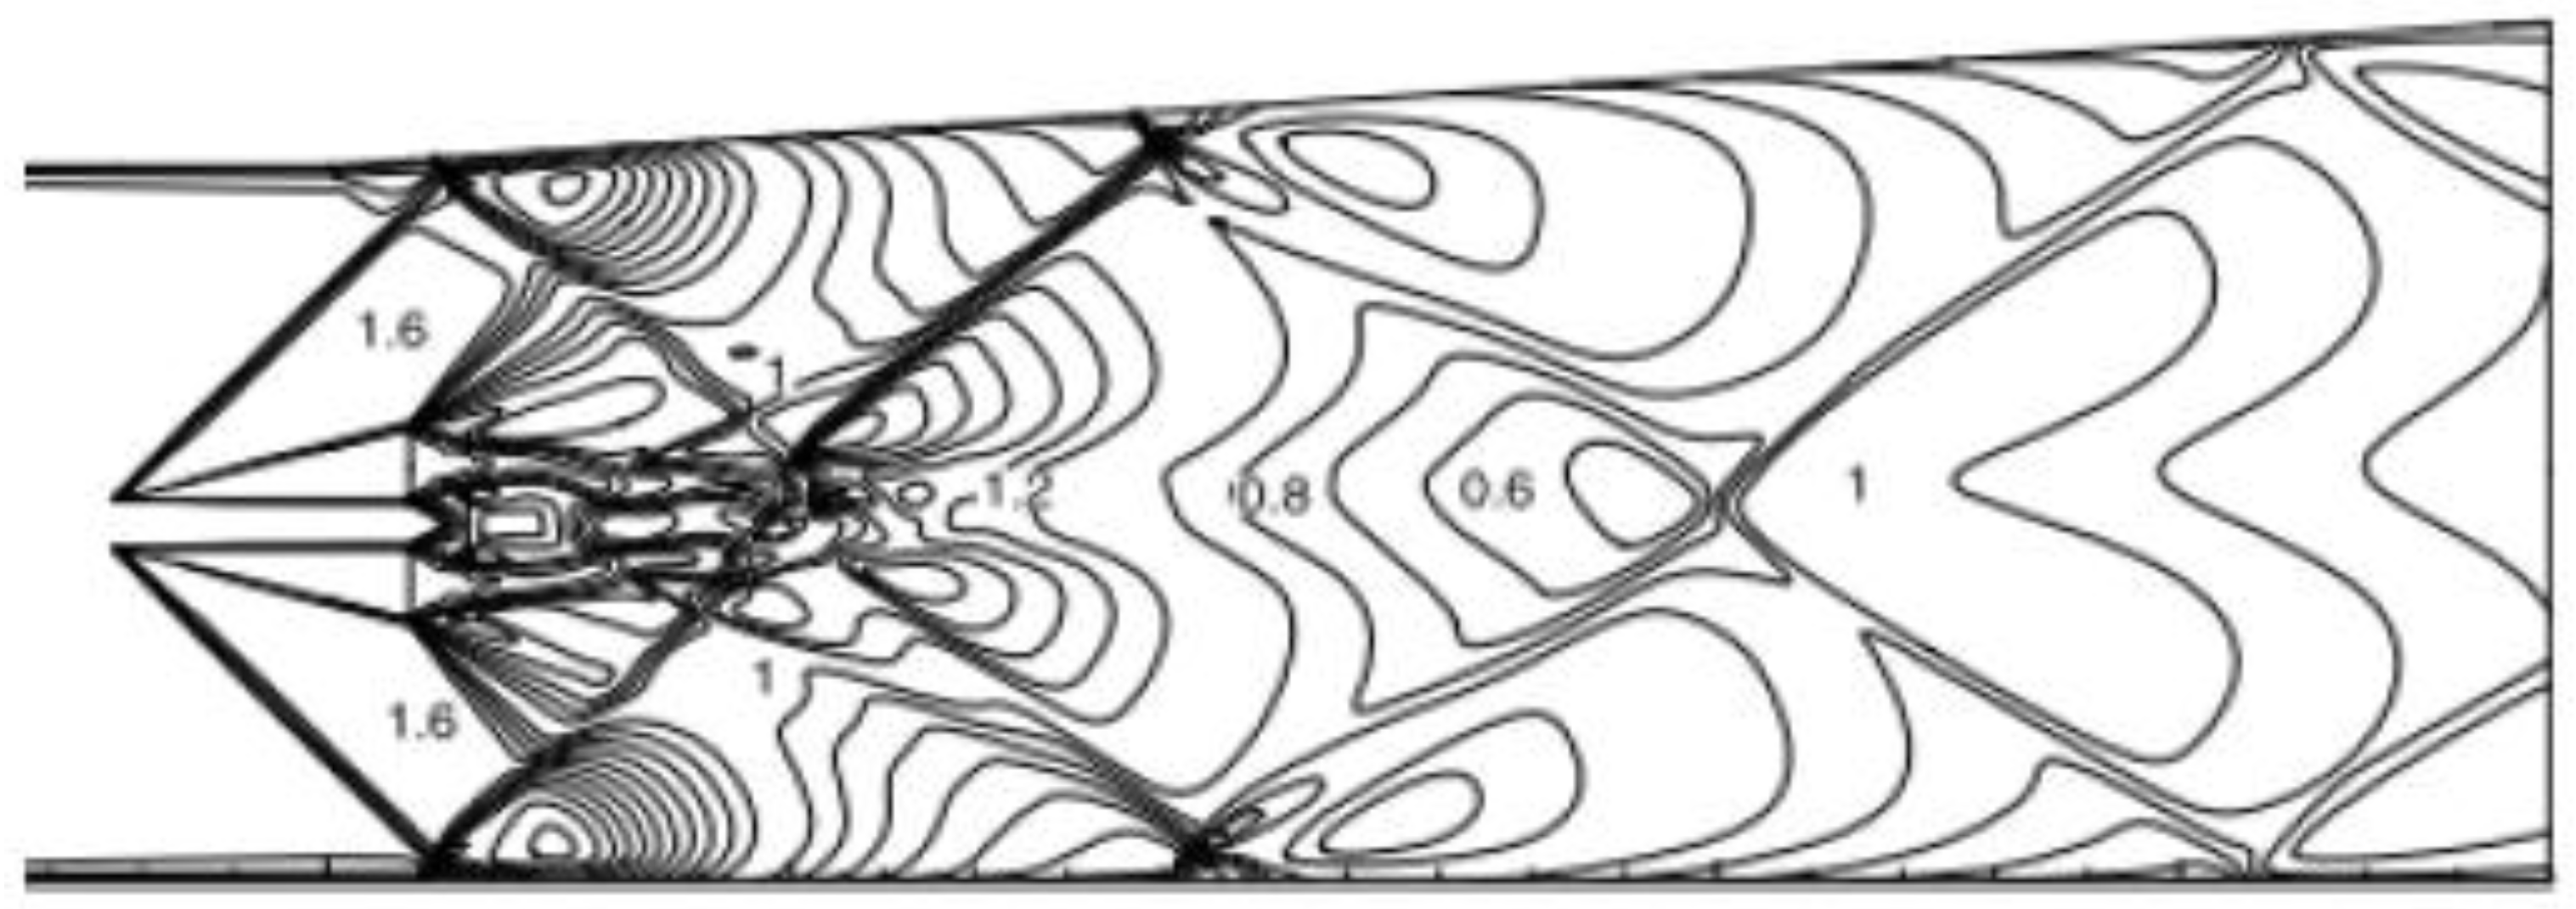
Strut injectors are characterized by their obstruction to the flow direction and oblique shockwave generation (Figure 4), injecting fuel consistent with the direction of the entry flow. While injecting fuel through this method leads to total pressure loss and potential cooling requirements, their application for supersonic flows has generally shown better fuel-air mixing [2]. The recirculation behind the strut assists in holding the flame (Figure 5) while the combustion occurs within the shear layers, where the fuel and oxidizer mixing efficiency is greatest. The shear layers are dominated by Richtmyer-Meshkov instabilities, due to the varying species densities [2].
2.2. Injector Geometry and Arrangement
Injector geometry is defined around the desired mass-flow rate of Hydrogen into the combustion chamber. Maintaining constant mass-flow requires Hydrogen storage under pressure to maintain a positive pressure gradient into the combustion chamber. A system of fast-actuating valves controlled by solenoids is how the M12 REST experiments controlled fuel injection testing [5].
Data for injector geometry was sourced from an advanced study into specific injector properties by Reference [6], concluding that polygonal-shaped injectors generally provide the best mixing performance (Figure 6).
It is generally understood that increased fuel jet penetration leads to greater total pressure loss; this assumption is investigated specifically for the concept design in the following section.
The arrangement of injectors consists of the parallel and perpendicular distance between neighboring orifices to produce the most effective fuel-air mixing efficiency (Figure 7).
A study of injector arrangement conducted in Reference [6] revealed staggered injector profiles caused interactions of counter-rotating vortex pairs around the jet peripheries. The increased vorticity produced by the rear injector develops further downstream, improving transverse mixing where the axial distance (X/D) between staggered injectors is 30. The jet penetration height correlation for this particular study is based on the relationships in Reference [6].
2.3. Injector Location
Injector location is dependent on the nature of the compression system, the axial space available for combustion, and the type of fuel used.
Injector location, other than that of struts, can be pre-isolator and even on inlet ramps if space-saving is desired in the combustor. For inlet injection specifically, a challenge is presented in ensuring that the combustion is held within the engine, thus preventing inlet unstart. Initial research into the viability of upstream injection is provided in [7], concluding that for any study optimizing the location of fuel injection in general plays a significant role in overall efficiency.
However, inlet injection specifically is not well suited to low Mach number operation and can present some real-world problems with regard to unstable shock trains leading to thermal choking. This phenomenon is due to the Mach number decreasing below 1 with increasing temperature, while the fluid remains at the same velocity.
The feasibility research of inlet injection is continued by the authors of Reference [8], who denote its potential for high speed flight; however, fuelling above Ф = 0.92 caused inlet unstart. Further tests by the authors of Reference [9] confirmed these findings; however, there appears to be no way of precluding early combustion (signified by OH radical production) due to the temperature produced in hypersonic compression.
Given the remaining uncertainty around the overall feasibility of upstream injection, coupled with the available space owing to the large nature of the proposed concept aircraft, inlet injection was avoided. In addition, the scramjet compression design was a task undertaken by a separate investigation, and adding inlet injection would have required a complete redesign of the ramps to accommodate the boundary layer effects.
2.4. Concept Aircraft Introduction
The investigation is based around a self-sustained concept aircraft to achieve a full commercial-style flight profile for passenger transport. An example outline of the desired profile is given in Table 1.
In order to remain self-sustained, the profile is attained by the combined operation of turbojet, ramjet, and scramjet engines.
A feasible combination of a dual-mode ramjet-scramjet is given by Figure 8, such that during high-altitude scramjet flight the ramjet inlets are sealed to prevent excessive drag induced by shockwaves on the ramjet forebody.
The combustive aspect of this investigation studies the sustained Mach 8 cruise segment for the scramjet engine, scrutinizing various methods and arrangements of injection to satisfy the requirement of robust supersonic combustion.
3. Scramjet Design
3.1. Inlet Compression
As hypersonic flow parallel to a surface encounters a concave corner, an oblique shock wave is produced at an angle relative to the incident upstream flow. The turning of the flow induces a compressive effect and a thin region where the fluid thermodynamic properties are changed (Figure 9).
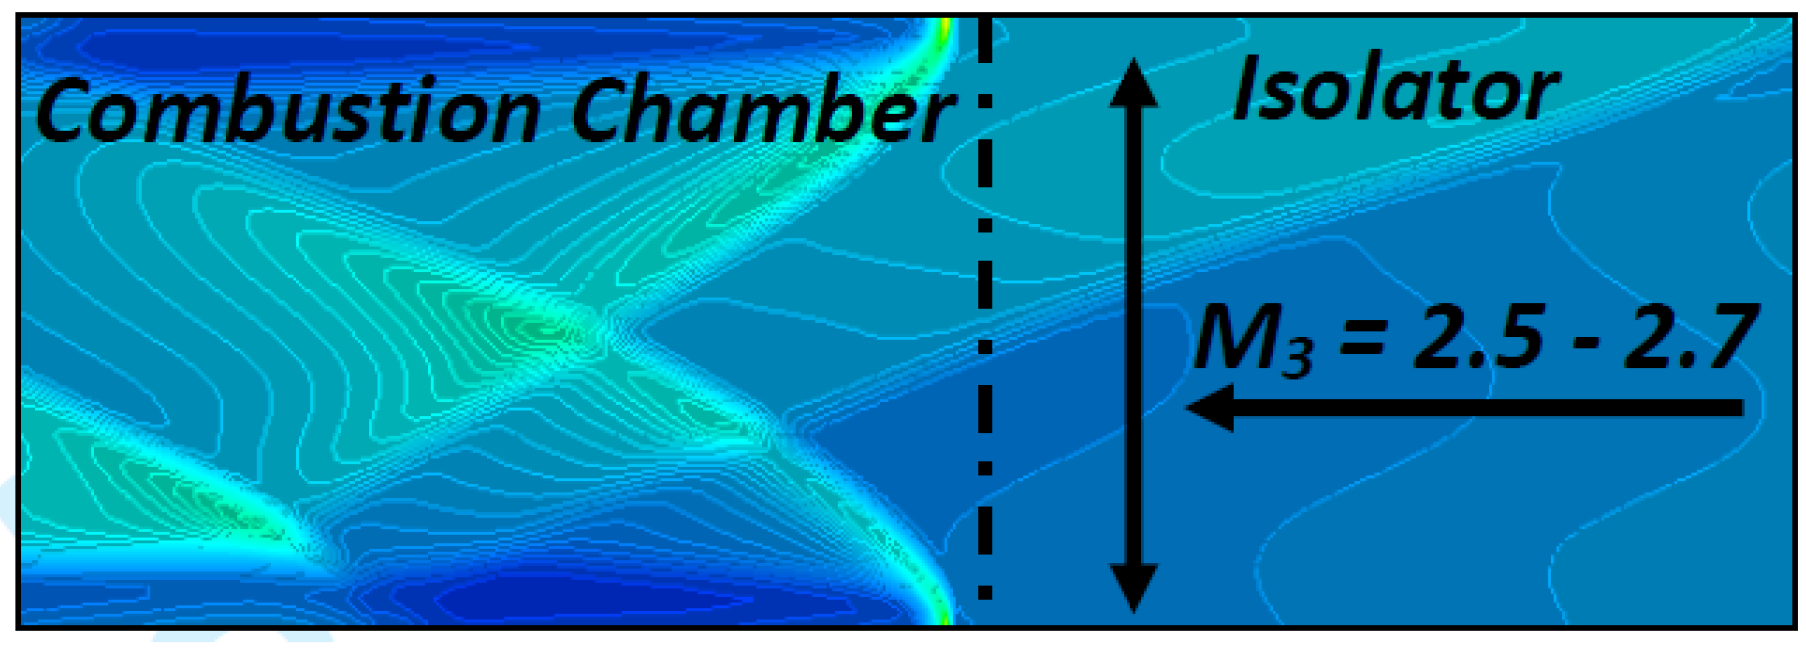
Scramjet compression is achieved externally through forebody ramps to induce multiple oblique shockwaves. The selected compression system is designed to decelerate the operating Mach 8 flow to Mach 2.5, where the boundary conditions used for the combustion chamber testing are based on the concept aircraft scramjet engine design (Table 2). High Mach number entry flow is investigated further in Reference [10] in recent research.
The scramjet inlet was designed using methodology from studies carried out at Queensland University [11].
3.2. Nozzle Expansion
When the residence time of particles within the combustor is short, the mixing, ignition, and combustion process continues into the nozzle. The concept aircraft scramjet expansion process is based on the combustive performance ascertained by this particular investigation. A Single-Expansion Ramp Nozzle (SERN) is used to accelerate the flow and achieve the parameters listed in Table 3. Nozzle design methodology followed an iterative approach of modifying ramp angles to obtain the most optimum thrust, based on a nozzle entry Mach number of 2.5.
4. Computational Methodology
4.1. Software and Processing
ANSYS FLUENT is the selected software platform for conducting pre-processing and solving of Computational Fluid Dynamics (CFD) tasks, with post-processing conducted within ANSYS CFD-Post, Excel, and MATLAB.
4.2. Grid Independency
To determine grid independency, a residual is selected for monitoring at a particular surface or volume. Figure 10 displays the average mass flow rate at the domain outlet as the solution progresses through 750 iterations for four meshes of varying density.
The Reynonolds-Averaged Navier-Stokes (RANS) simulation initializes with a reference estimate of the mass flow rate across the domain, and as the flow develops the actual measured mass flow rate changes until there is convergence with respect to the Root Mean Square (RMS) of past residuals. The courant number was initiated at 0.5 and climbed to 10 at 600 iterations, where signs of convergence were seen.
Convergence data from 600 iterations onwards showed that there was a 0.01% difference in converged mass flow rate between refinement passes 3 and 4. Given that Mesh 4 has a finer grid size yet only yields marginally different results, the best course of action is to use Mesh 3.
4.3. Computational Validation
The first CFD task is a replication of the German Aerospace Centre (DLR) scramjet, for which there is a multitude of literature, including computational and experimental results.
Figure 11 shows the cold flow comparison of DLR (Deutsches Zentrum für Luft- und Raumfahrt or German Aerospace Centre) Schlieren imaging against the replicated test conditions under CFD simulation in FLUENT. Furthermore, the reacting flow case comparison is given below in Figure 12. While the RANS simulation fails to pick up small-scale turbulent entities, the comparison shows clear replication of the strut-induced shocks and flame structure. Details of the validation CFD setup can be found in Appendix B Table A3.
The computational simulation is preceded by validation of the discretization environment. Where experimental testing was not conducted, the process is based on data sourced from literature and other available data.
4.4. Solution Setup
Validation of the discretization and boundary conditions against experimental data led to the following table of parameters used to perform the investigation’s CFD simulation and analysis, based around ANSYS FLUENT.
Finite-Rate combustion chemistry is based purely on the understood chemical-kinetic expressions by Arrhénius. This method omits the effects of turbulence on the structure of flames. Turbulent flame conditions occur with non-linear properties; where the rate of the reaction with finite-rate models are mathematically strict, turbulent combustion is poorly approximated. For a pre-mixed supersonic jet combustion, this particular scheme would produce accurate results as the turbulent fluctuations associated with combustion are negligible. Finite-Rate chemistry is fairly well suited where there is an absence of Turbulent Kinetic Energy (TKE), such that the rate of reaction is independent of the dissipation of turbulent vortices (Table 4).
Given the comparison to experimental data in the supersonic flow regime, the setup as described will be observed throughout the remaining CFD testing. Governing equations essential to the computational models utilized can be found in Appendix C. The Mach number at combustion entry was set at 2.5, based on the work conducted in the compression system design study. This corresponds to a stagnation pressure of 170,000 Pa and static pressure of 9877 Pa, at a static temperature between 600 and 700 K.
4.5. CFD Case Details
Having reviewed the injection methods available, a computational test plan was devised with the objective of obtaining the best injection technique for the Mach 8 Scramjet concept.
For continuity, the tests were conducted under the same solution setup, with injector configurations that maintain a constant equivalence ratio. Hydrogen, as the primary fuel, follows a single-step finite-rate reaction, as shown in Equation (1) below.
Single-step reaction mechanics were selected to minimalize the required computational exertion in CFD processing. As the available computational capacity was limited, this aspect of the modeling was simplified to allow for the grid resolution to remain satisfactory and thus independent of the solution.
The following cases (Table 5) of computational simulation were then undertaken, with details of freestream values and computation setup that can be found in Appendix A and Appendix B.
4.6. Requirement for Three-Dimensional (3-D) Transverse Design
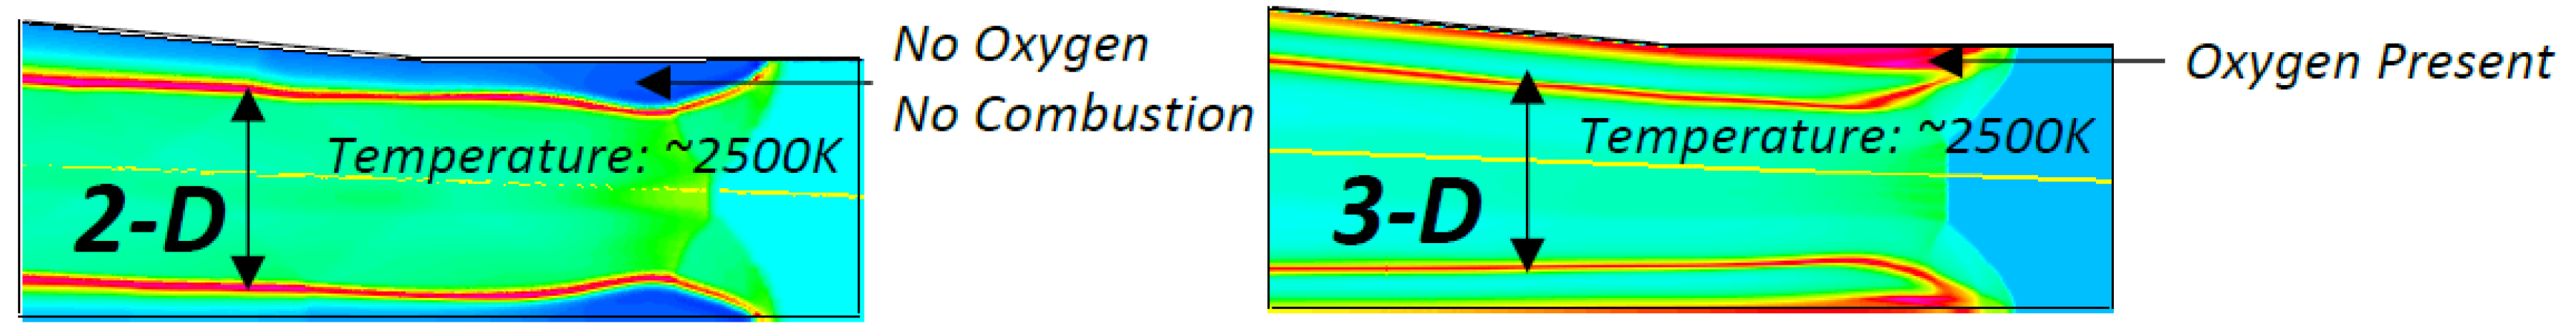
Strut injection methods feature all core flow components in the same direction, parallel to the combustion chamber. Where JICF is concerned, the mixing of Hydrogen and Oxygen is highly three-dimensional, as displayed on the right.
When creating two-dimensional (2-D) models in CFD, FLUENT and CFX apply a pseudo-depth to the surface body, hence restricting Oxygen to the downstream wall of the injection and producing a Hydrogen-rich layer (Figure 13). The presence of this region restricts the overall mixing efficiency and necessitates 3-D flow structure modeling for the transverse injection designs.
5. Computational Results
5.1. Transverse Injector Design Studies
5.1.1. Geometry: Polygonal vs. Circular (Case 1)
With a single injector of D = 2 mm and a domain inlet spacing of X = 5D, it is visually clear from both Figure 14 and Figure 15 that the polygonal injector penetrates further into the crossflow. The total/static pressure boundary conditions of the circular injector were modified slightly to represent a constant mass flow over the marginally smaller cross-sectional area. However, the required difference in pressure offset was less than 10%.
Upon closer examination, the extent of the mixing fraction portrayed by the first two plots below illustrates the polygonal injector’s ability to penetrate further into the crossflow, designated by greater distribution of H2 over the axial range Y/D.
For a JICF injection system, there is a distinct lack of oxygen at the walls, and as such it is important to note the overall wall distribution of Hydrogen, given by Figure 16a, whereby the polygonal injector performs marginally better. Figure 16b compares the transverse fuel-air mixing efficiency at various locations (X/D) downstream of the injector. The polygonal injector type displays better performance by a clear margin, and as such the geometry is further utilized to compare injector arrangement (Case 2).
5.1.2. Arrangement: Aligned vs. Staggered (Case 2)
Maintaining a constant injector aspect ratio and size, a second study was constructed to observe the same injector performance for a triple staggered and twin aligned arrangement (Figure 17). It has been theorized by the authors in Reference [6] that consecutive arrangement of injectors produces vorticity in the longitudinal plane, thus forcing the fuel further into the crossflow.
The Case 3 injector size and inlet stagnation/static conditions were kept constant, while at the injector boundary, conditions were modified to ensure both cases observed an equivalence ratio of 0.6.
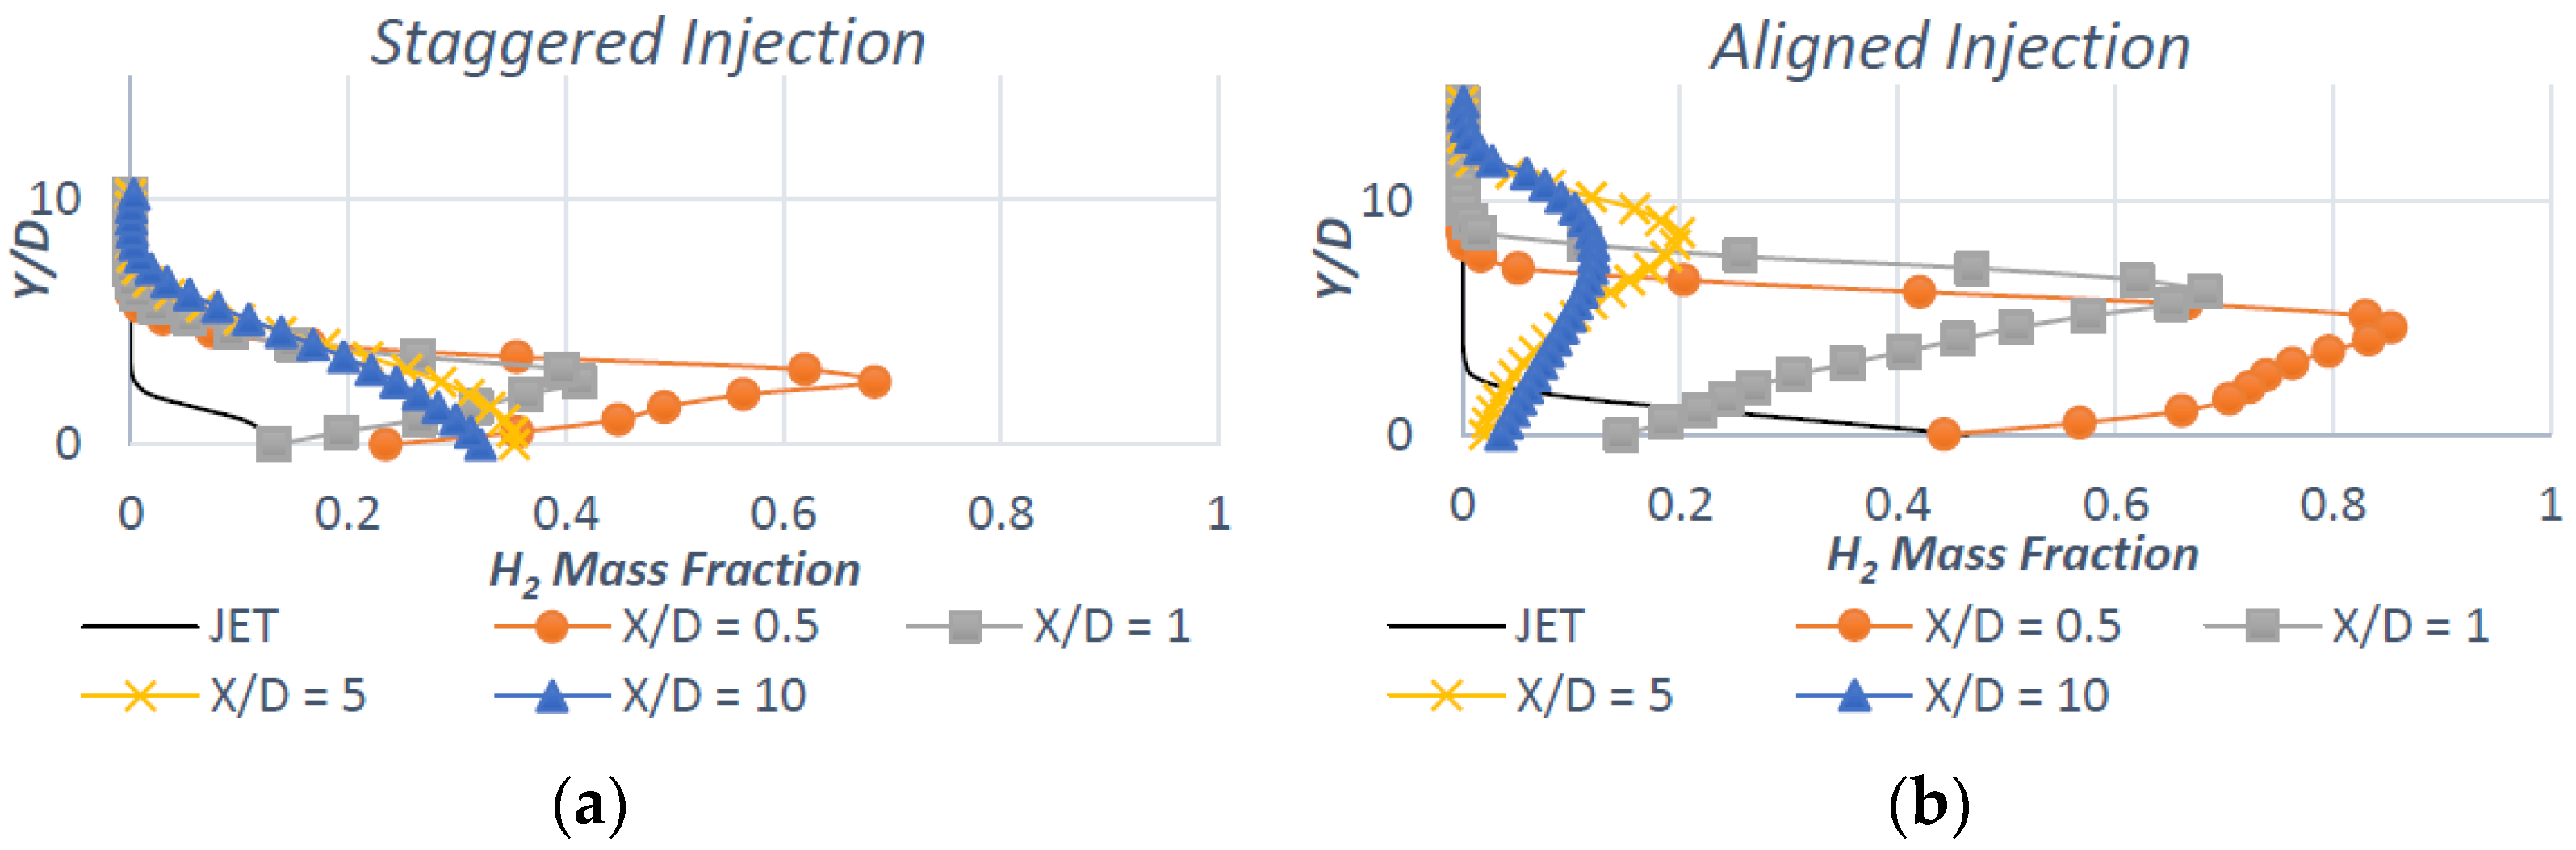
The contour plots above display the distribution of H2 at downstream transverse and adjacent views to the walls. The aligned case appears at first glance to propel the fuel further into the chamber. Y/D is determined by the point at which the mass fraction of H2 is exhausted to 1%. The close arrangement of staggered injection becomes adversarial to the overall mixing efficiency, due to the interaction of lateral vorticity.
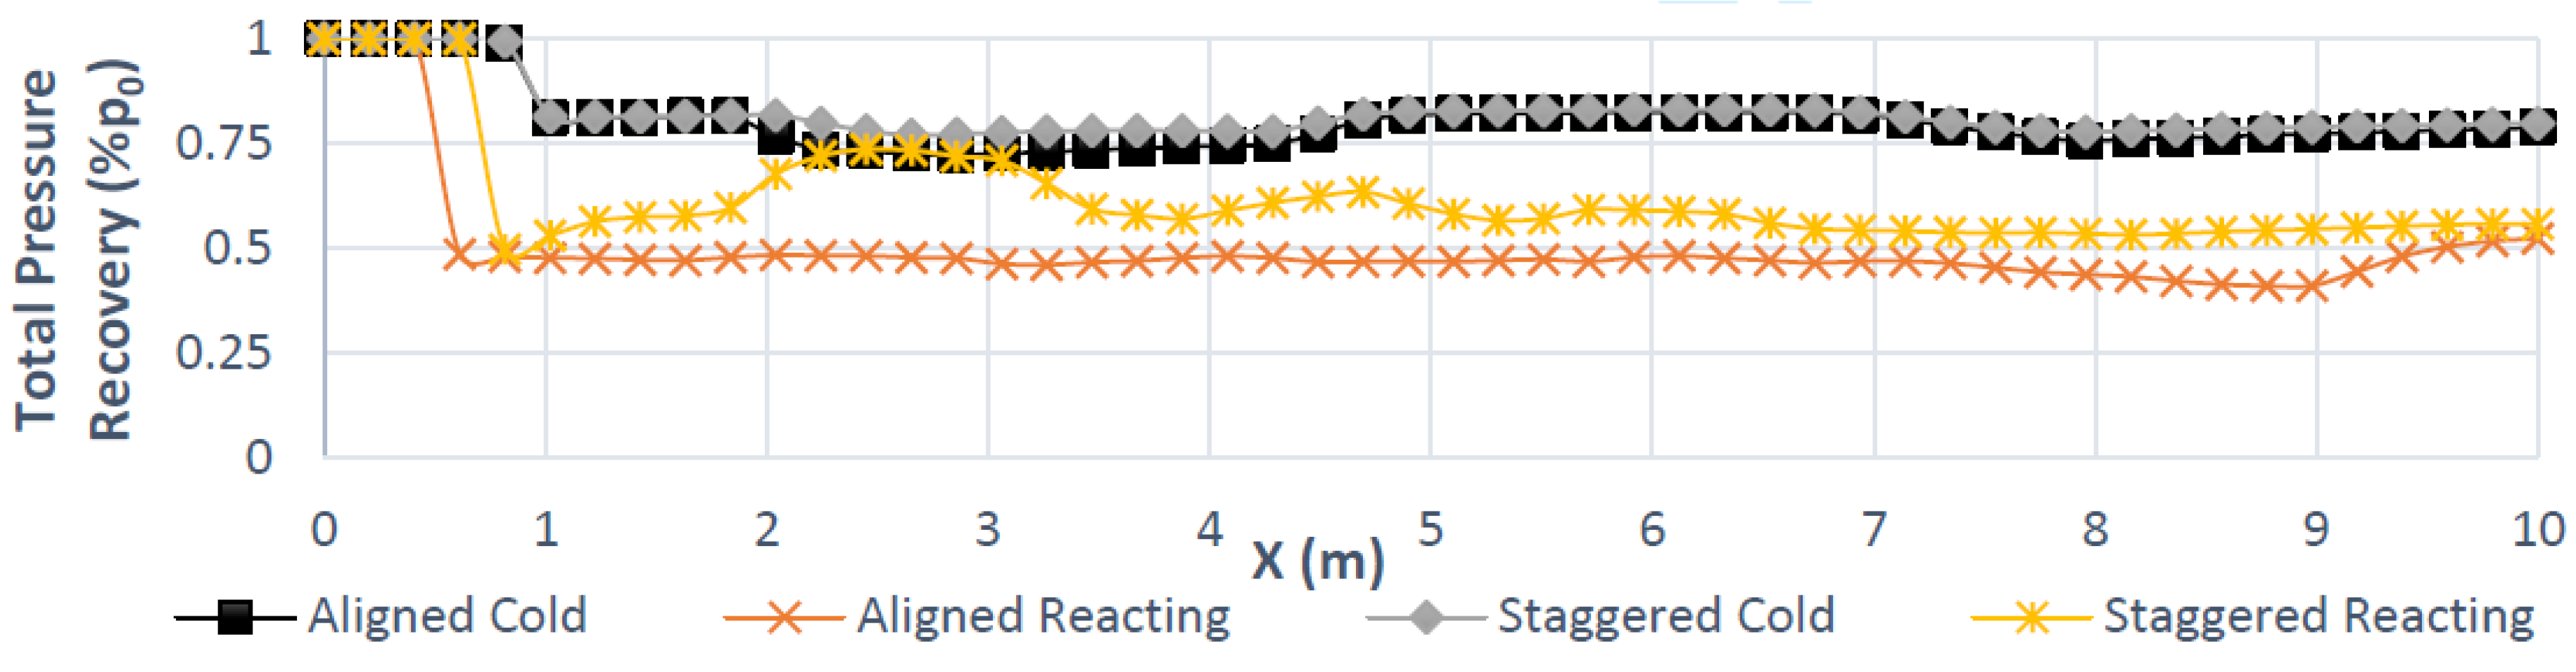
As seen above, the staggered injector forces a considerable amount of H2 towards the walls, as opposed to the crossflow. Since the pressure of the staggered injectors is reduced by a factor of two thirds compared to the aligned arrangement, the bow shock induced by the initial interaction is reduced. This characteristic is favorable, as it reduces the total pressure loss across the combustor centerline (Figure 18).
The trade-off between the negative effects of a bow shock downstream (total pressure recovery and Mach number) are generally outweighed by the increased mixing efficiency.
The total pressure loss is clearly higher for the aligned case (Figure 19); however, the jet penetration height and therefore the extent to which the Hydrogen mixes and combusts is greater.
Confirming the contour plot data, Figure 20 shows the increased H2 remaining at the wall for both cold and reacting cases, with the aligned system showing negligible fuel remaining at the wall. As anticipated, the mixing efficiency of the aligned case is on average around 5% greater, given the total height of the combustion chamber (Figure 20).
Additionally, the data for the transverse jet penetration height was included (Figure 21), reinforcing the conclusion that the aligned injector arrangement performs better.
This concludes the transverse injection investigation, with the aligned polygonal jet configuration selected for comparison against the subsequent strut injector study.
5.2. Combustion Chamber Design Study
5.2.1. Single Strut Injection (Case 4)
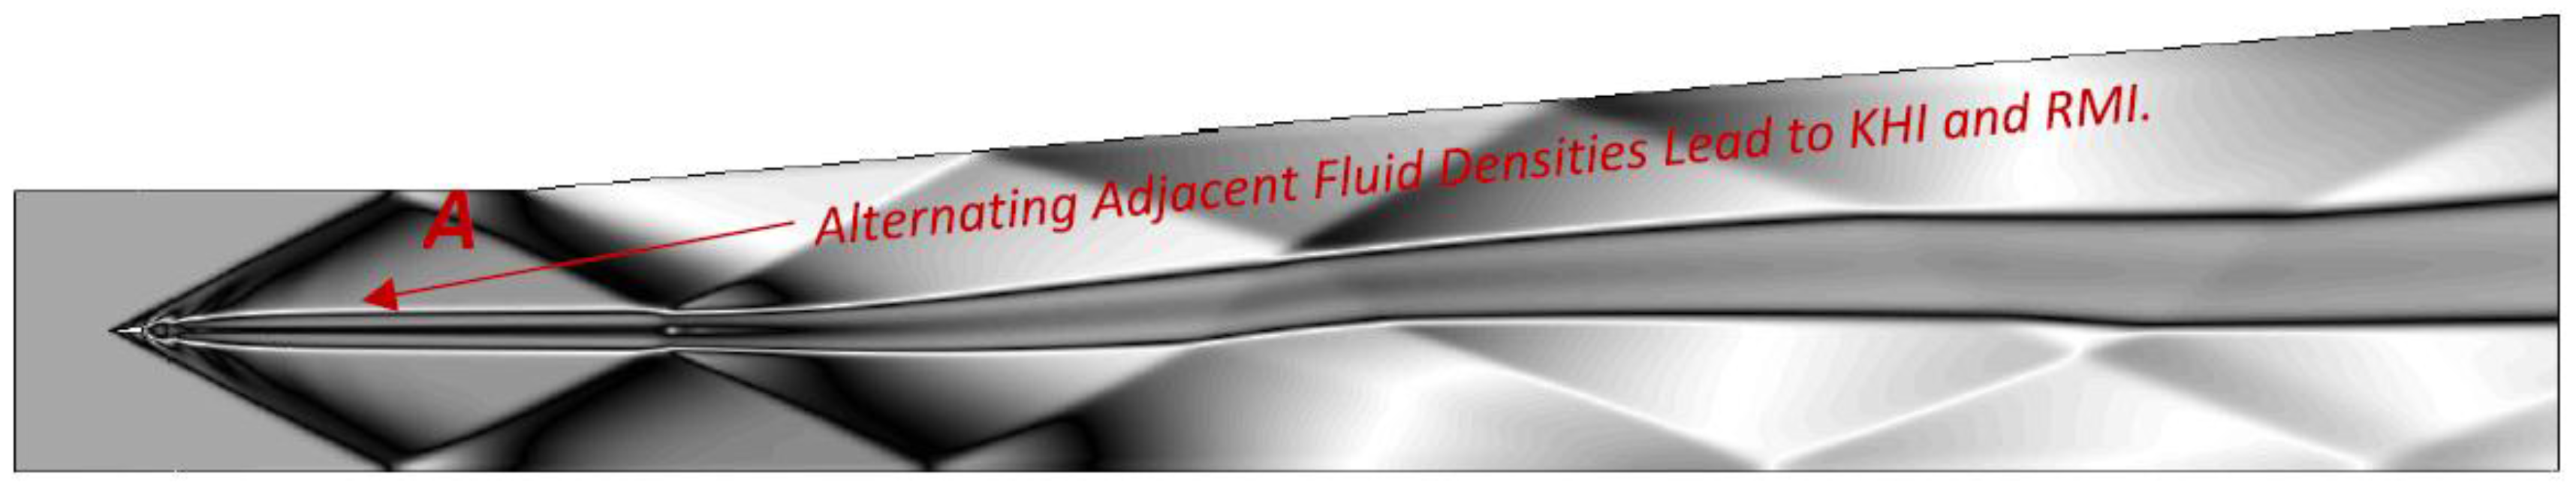
The presence of the strut within the flow field causes the generation and propogation of oblique shockwaves downstream. The Richtmyer-Meshkov instability (RMI) and Kelvin-Helmholtz Instability (KHI) within the shear layers enhances the mixing process and the instabilities’ turbulent flow causes oblique shockwave reflections to reduce as the flow progresses.
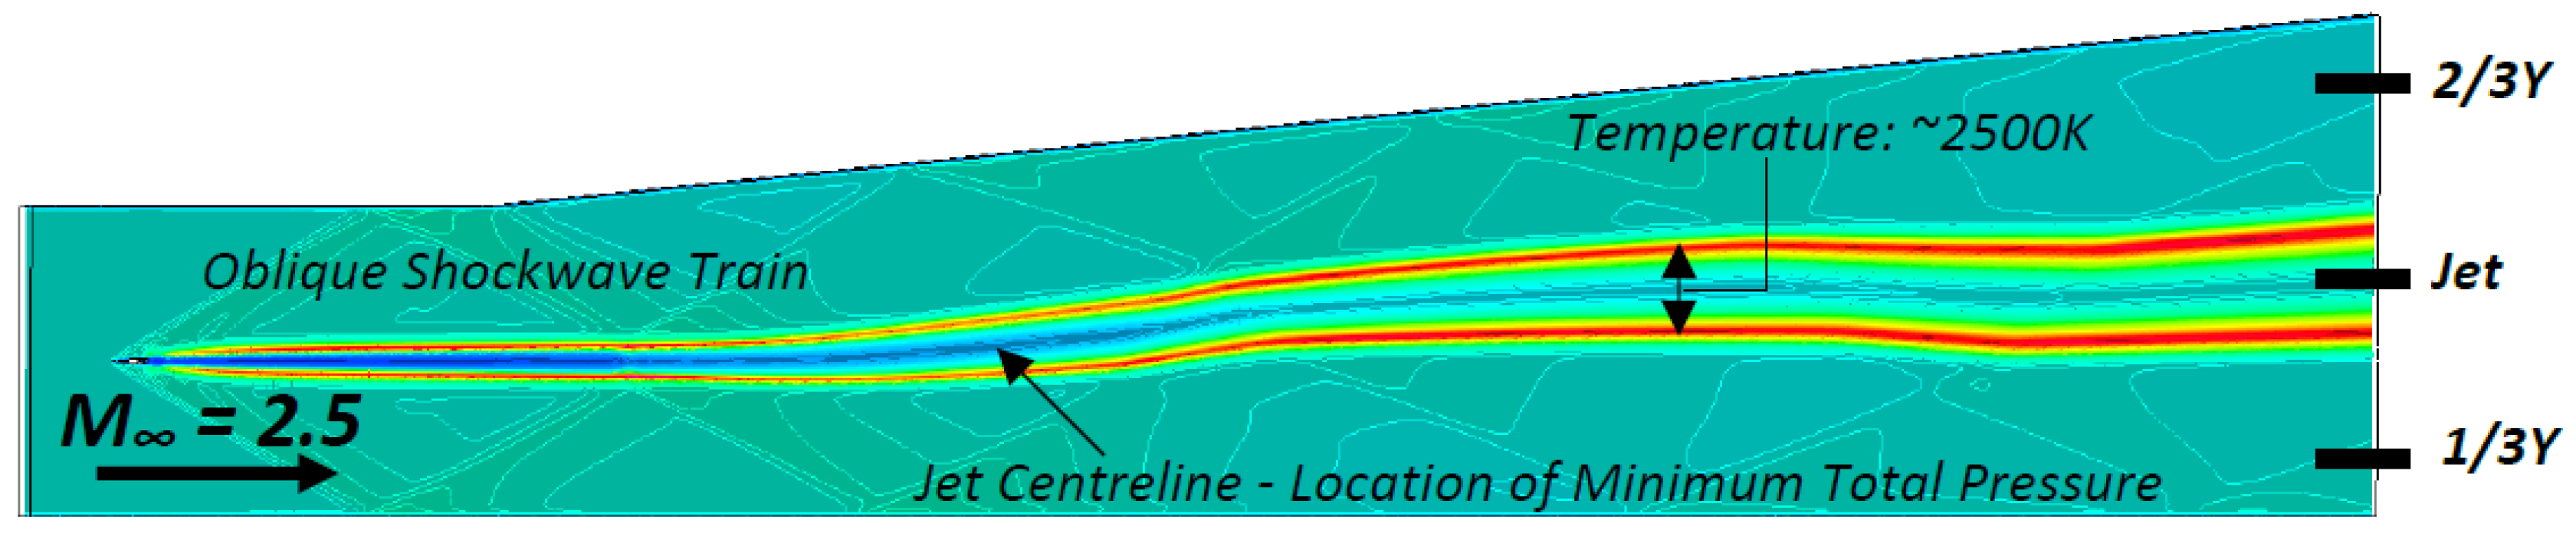
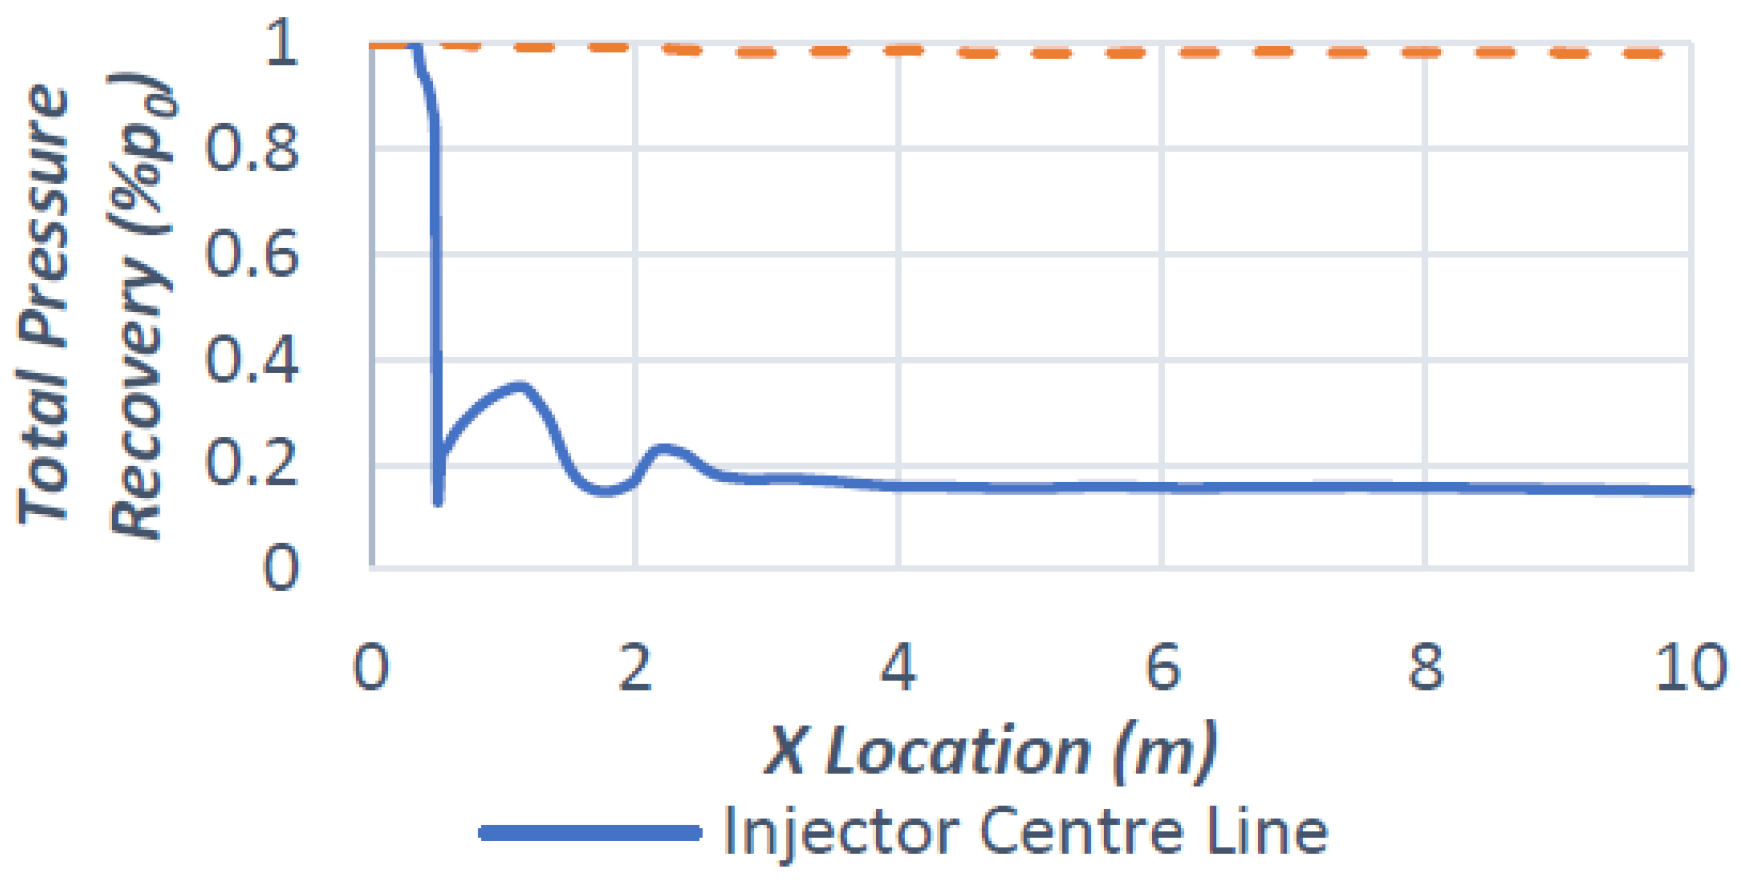
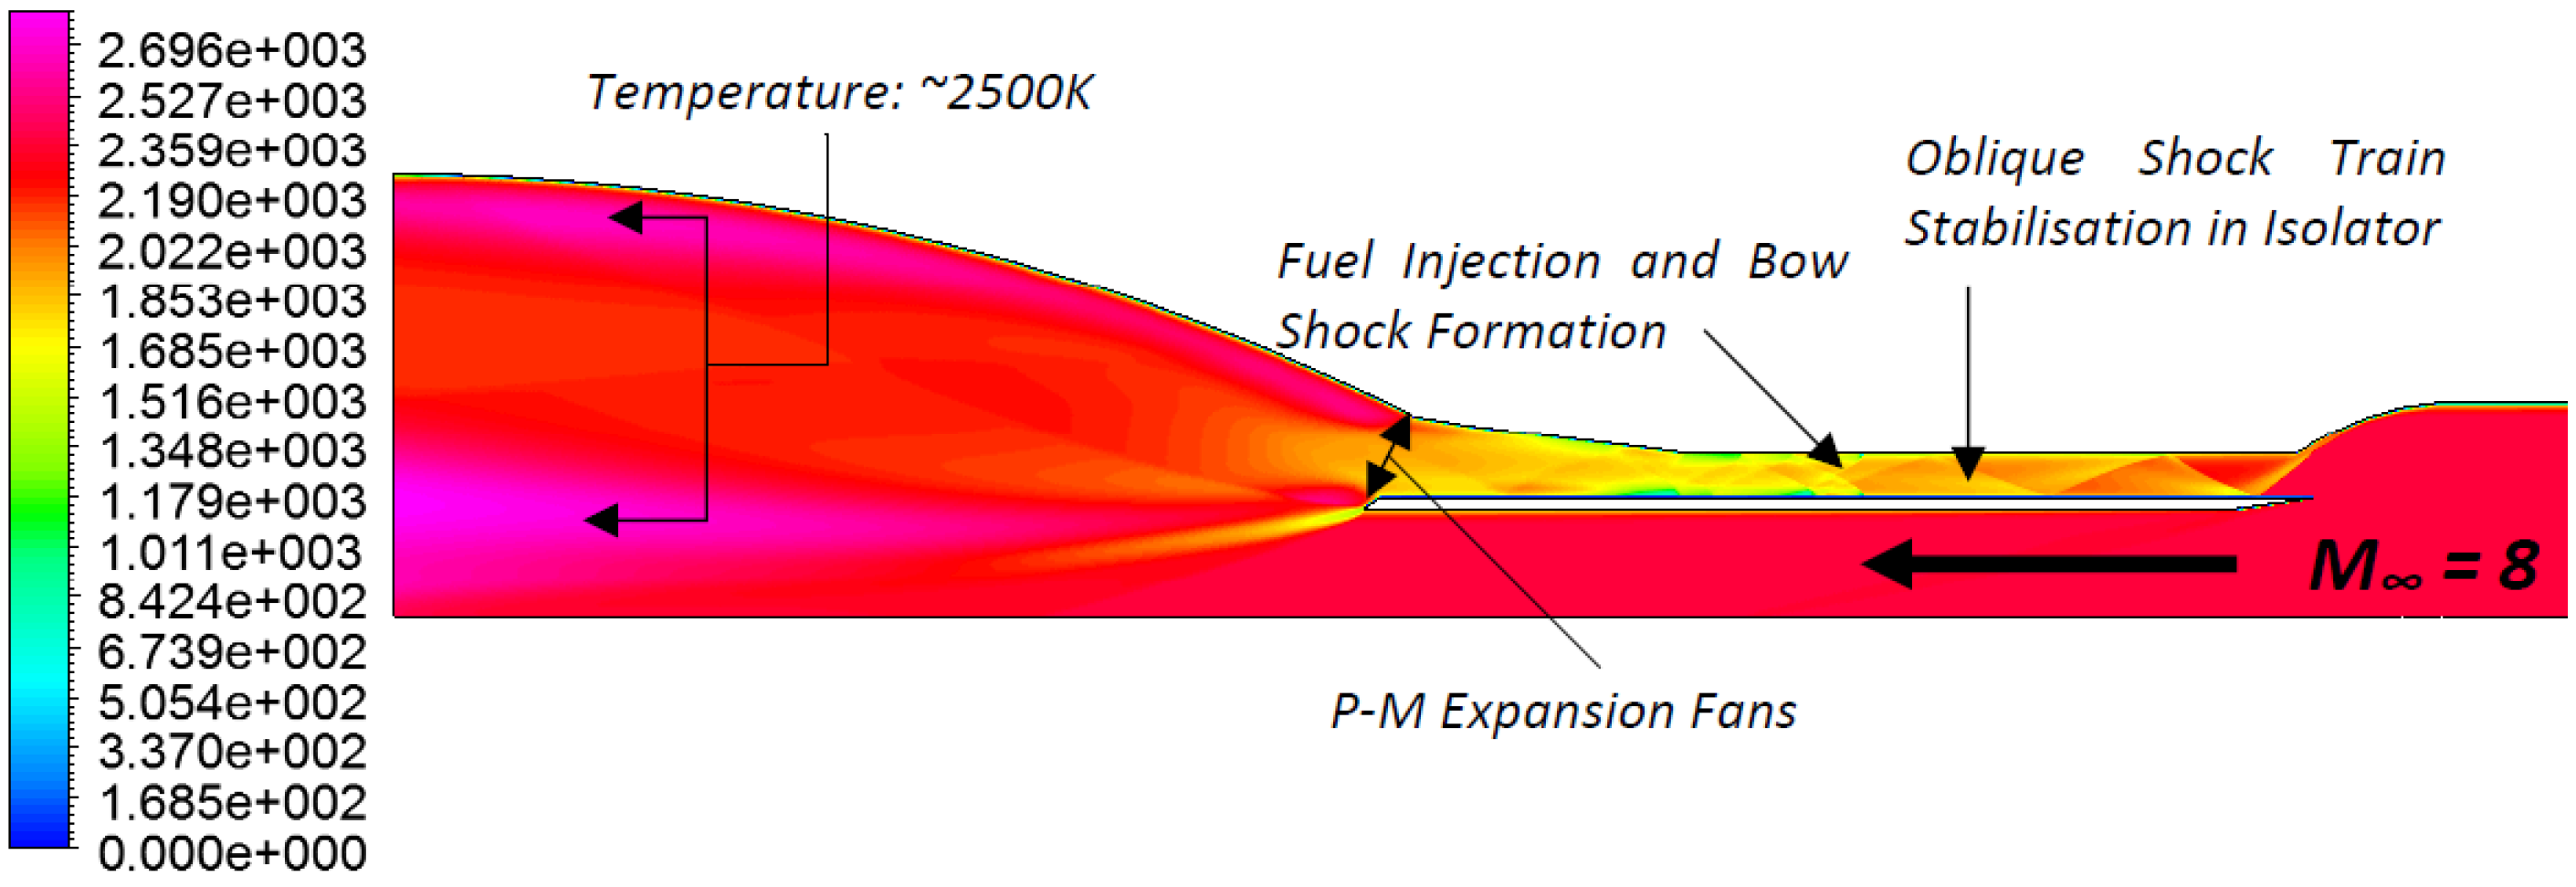
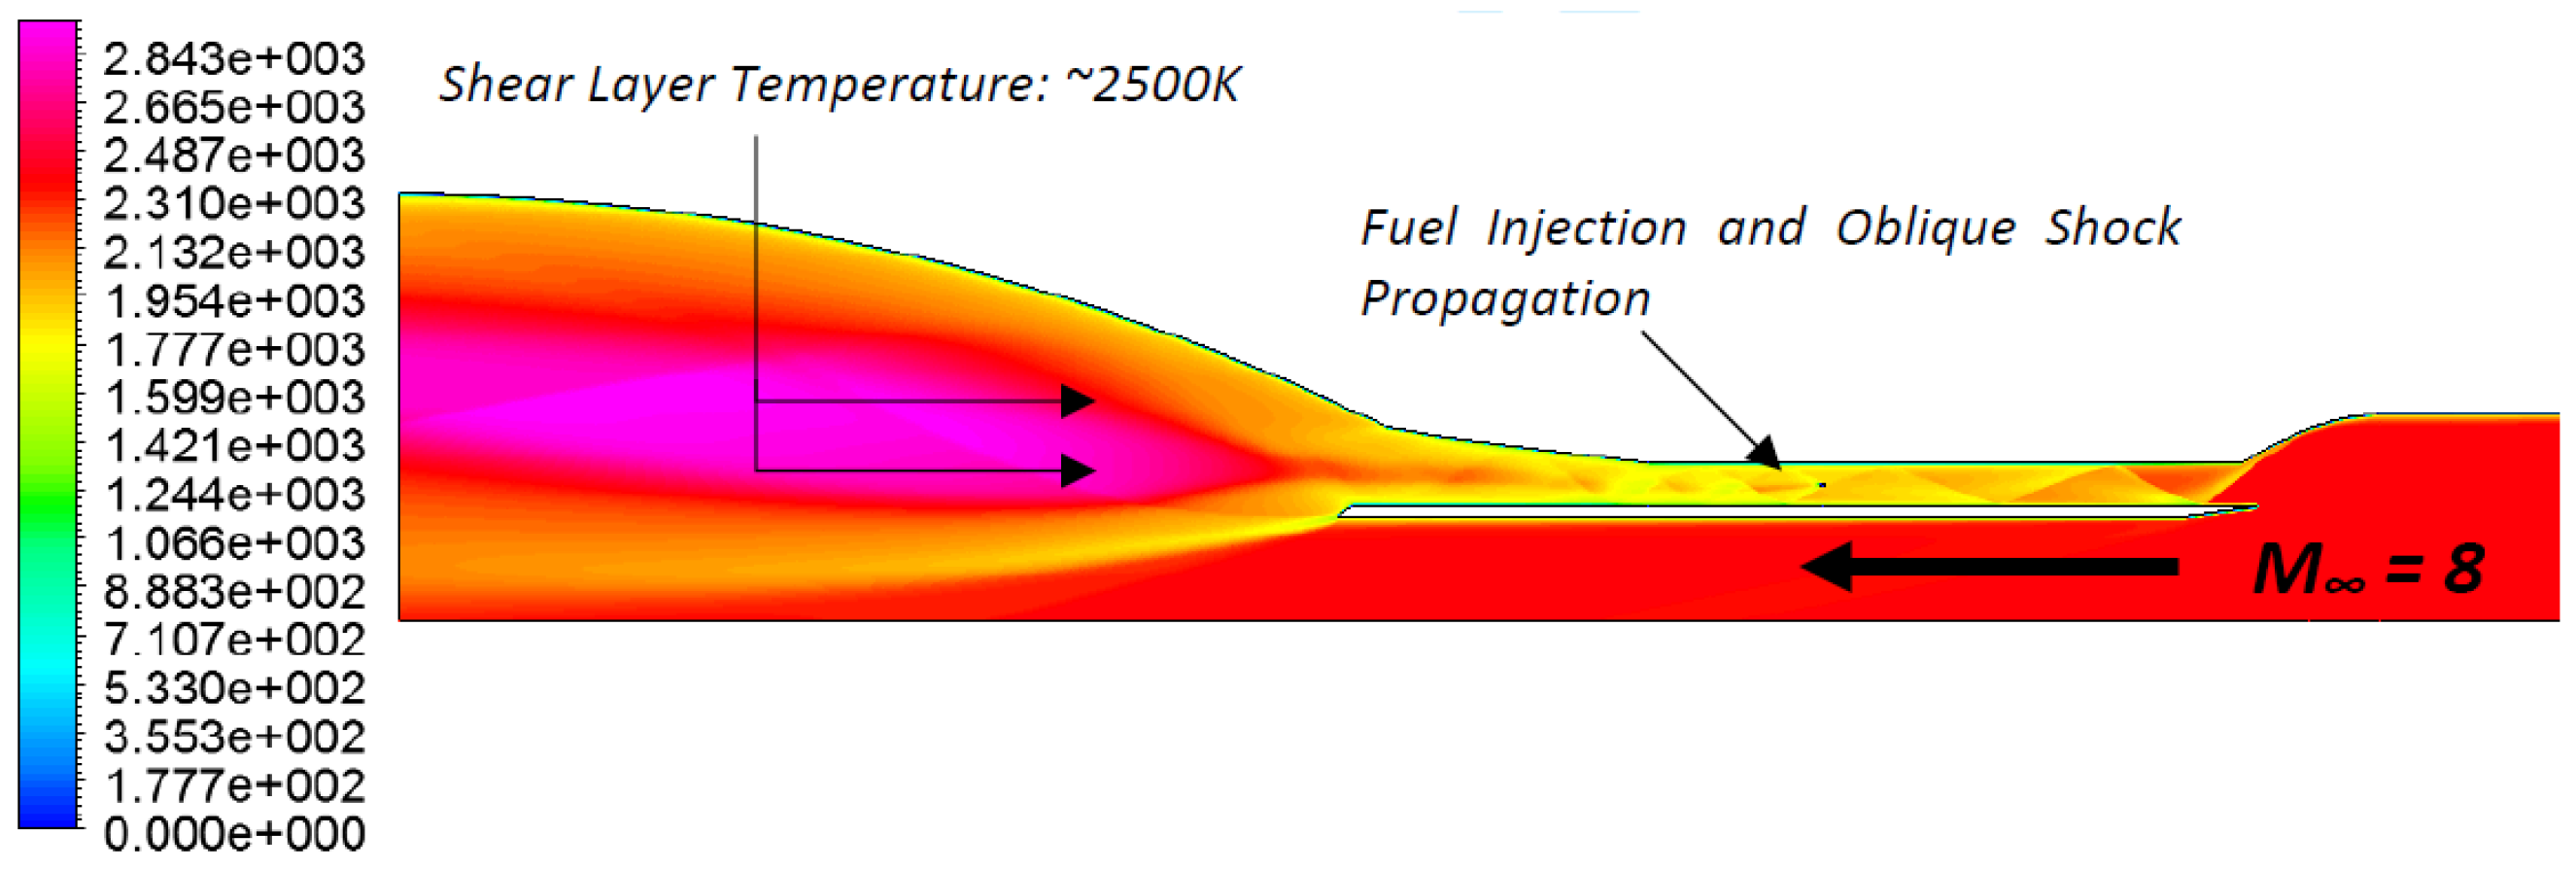
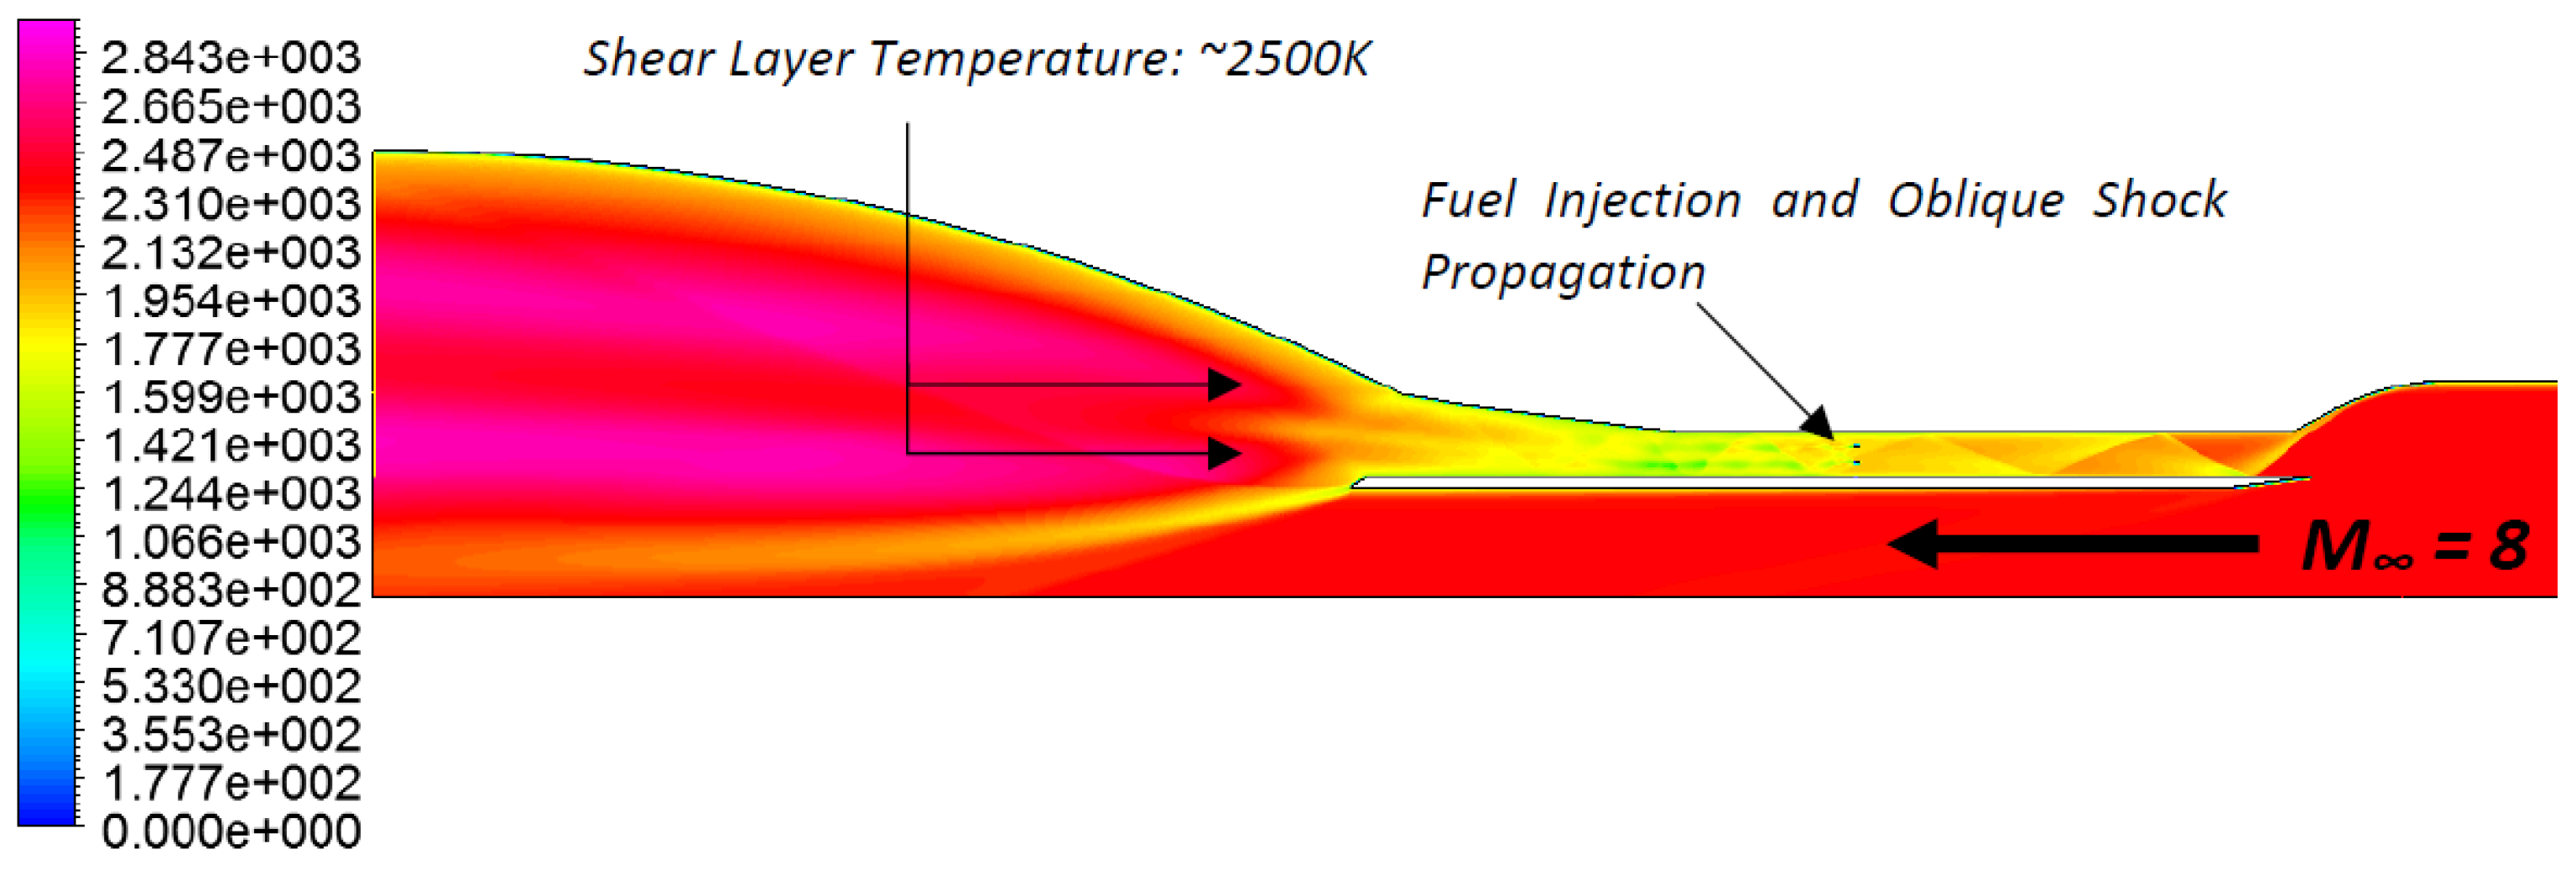
As with previous simulations, the combustive temperature of Hydrogen peaks at around 2500 K (Figure 22). However, in the case of struts, the location of the maximum total pressure loss follows the centerline of the injection. The overall performance of the single strut combustion chamber is supported by the extremely high-pressure recovery displayed in Figure 23 by the line plot at 1/3Y and 2/3Y. The total pressure recovery allows the strut concept to maintain a high Mach number throughout the combustive process.
Plotting the density contour (Figure 24) better exemplifies the propagation of the shockwave train downstream. As the total pressure is maintained to a level of 97% in the side flow regions, the Mach number begins to increase as the flow turns the convex corner (A) and effects of supersonic flow expansion are visible, although the Prandtl-Meyer (P-M) expansion fan is overshadowed by the existing shockwave profile. The single strut injector achieves an overall combustion efficiency of 75%.
5.2.2. Twin Strut Injection (Case 5)
The single strut achieves good combustive effiency and particularly good total pressure loss; however, the distribution of temperature in the combustion chamber is relatively poor. The addition of a second strut, giving injector locations of 1/3Y and 2/3Y, was implemented with the expectation of widening the combustion process while attempting to maintain total pressure. Given that there are now twice the injectors in the domain, the mass-flow rate for each was halved to maintain a constant equivalence ratio of 0.6. Theoretically, this change in relative velocity between the two adjacent fluids would increase the KHI and thus increase the expansion of the mixing shear layer.
The net performance of the twin strut arrangement is very similar to Case 4, where the average total pressure recovery in the side flow regions is maintained at 96%, while an fuel injector velocity decease causes the total pressure recovery on jet centerlines to drop to an average of 16%, as opposed to 19% in the single strut (Figure 25).
The combustion efficiency of the twin strut arrangement actually drops slightly to 72%. This is due to the smaller mixing shear layers, signifying that the theoretical increase of KHI by reducing the fluid velocity difference did not enhance the downstream mixing.
Oblique shockwave profiles take on a more complex form, given there are now four strut-induced shockwaves demonstrated by the density contour in Figure 26. The additional shockwaves do not appear to have any effect on the mixing performance of the system and their intensity appears to diminish faster than in the single strut case.
The twin strut configuration was successful in better distributing the combustion and therefore temperature transversely throughout the chamber. As expected, the increase in area affected by combustion causes a reduced total pressure recovery and the mixing performance of twin stuts vs. a single strut (at constant overall Ф) is marginally worse.
5.2.3. Combustion Chamber Design Summary
Three CFD cases of combustion chamber design based around transverse, single strut, and twin strut injector configurations were undertaken.
Transverse injection was able to achieve the highest overall combustion efficiency at 76% with a total peak H2 mass fraction of 0.24, due to the strong counter-rotating vortices produced through JICF. However, the transverse injection system suffered highly from total pressure loss due to the intersection of two bow shock profiles from the upper and lower walls.
The strut injector configurations both performed similarly, with single and twin struts achieving an overall combustion efficiency of 75% and 72% at a remaining H2 mass fraction of 0.25 and 0.28, respectively (Figure 27).
The final injector configuration selected for the integrated scramjet was the twin strut arrangement. It was determined that the expansion phase in the nozzle would benefit more from a distribution of temperature, and the decrease in combustion efficiency would be negligible given that combustion is permitted to continue as the flow enters the nozzle. The transverse configuration, while achieving higher combustion efficiency, was a not significant enough trade-off against the poor pressure recovery. Equations (A5) and (A6) in Appendix C outline the mathematical procedure in obtaining both mixture and combustion efficiency. Table 6 provides a brief comparison of the injector test case results conducted.
5.3. Scramjet Integrated Studies (Case 6)
The scramjet design phase now proceeds with the integration of parts to simulate and validate their cooperative performance. Given that the combustor has only been tested with the absence of an inlet and nozzle, it was elected that all three injector configurations be subjected to 2-D integrated testing in order to validate the decision of proceeding with a twin strut injector configuration.
The equivalence ratio was lowered to 0.2 for the integrated scramjet tests, to help visualize the complex flow structures around the injector.
5.3.1. 2-D Scramjet Simulations
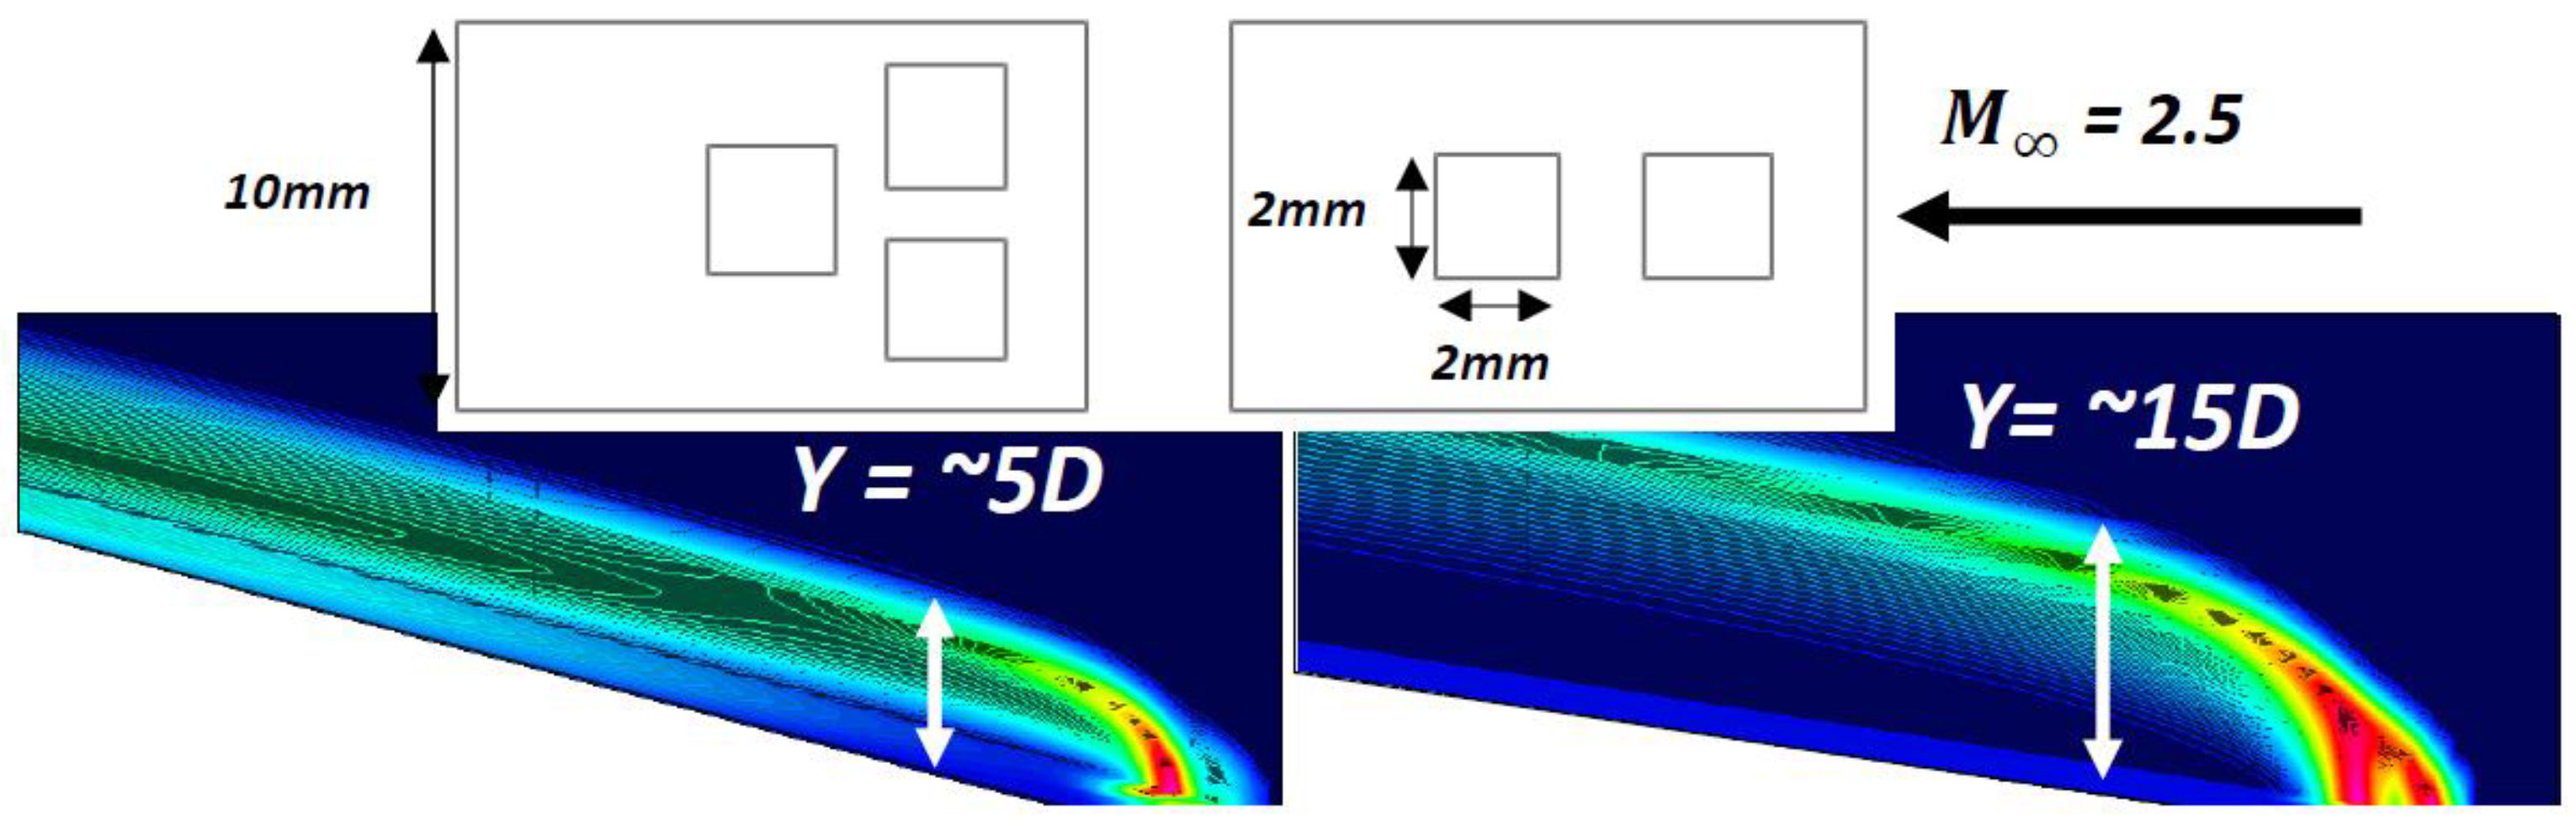
While the transverse injection method was not expected to perform particularly well, the results show feasibility for the Mach 8 concept, with peak velocities reaching 2700 m/s localized towards the wall (Figure 28). However, the distribution of temperature remains weaker than the individual testing due to the neglect of 3-D JICF components.
This particular test, while demonstrating the successful operation of the engine concept, does not account for the peripheral crossflow around the wall injectors. Given the knowledge of this transverse injection system from the previous studies, modeling this engine in 3-D would merely allow the fuel jet to further penetrate into the crossflow, thus reducing engine performance.
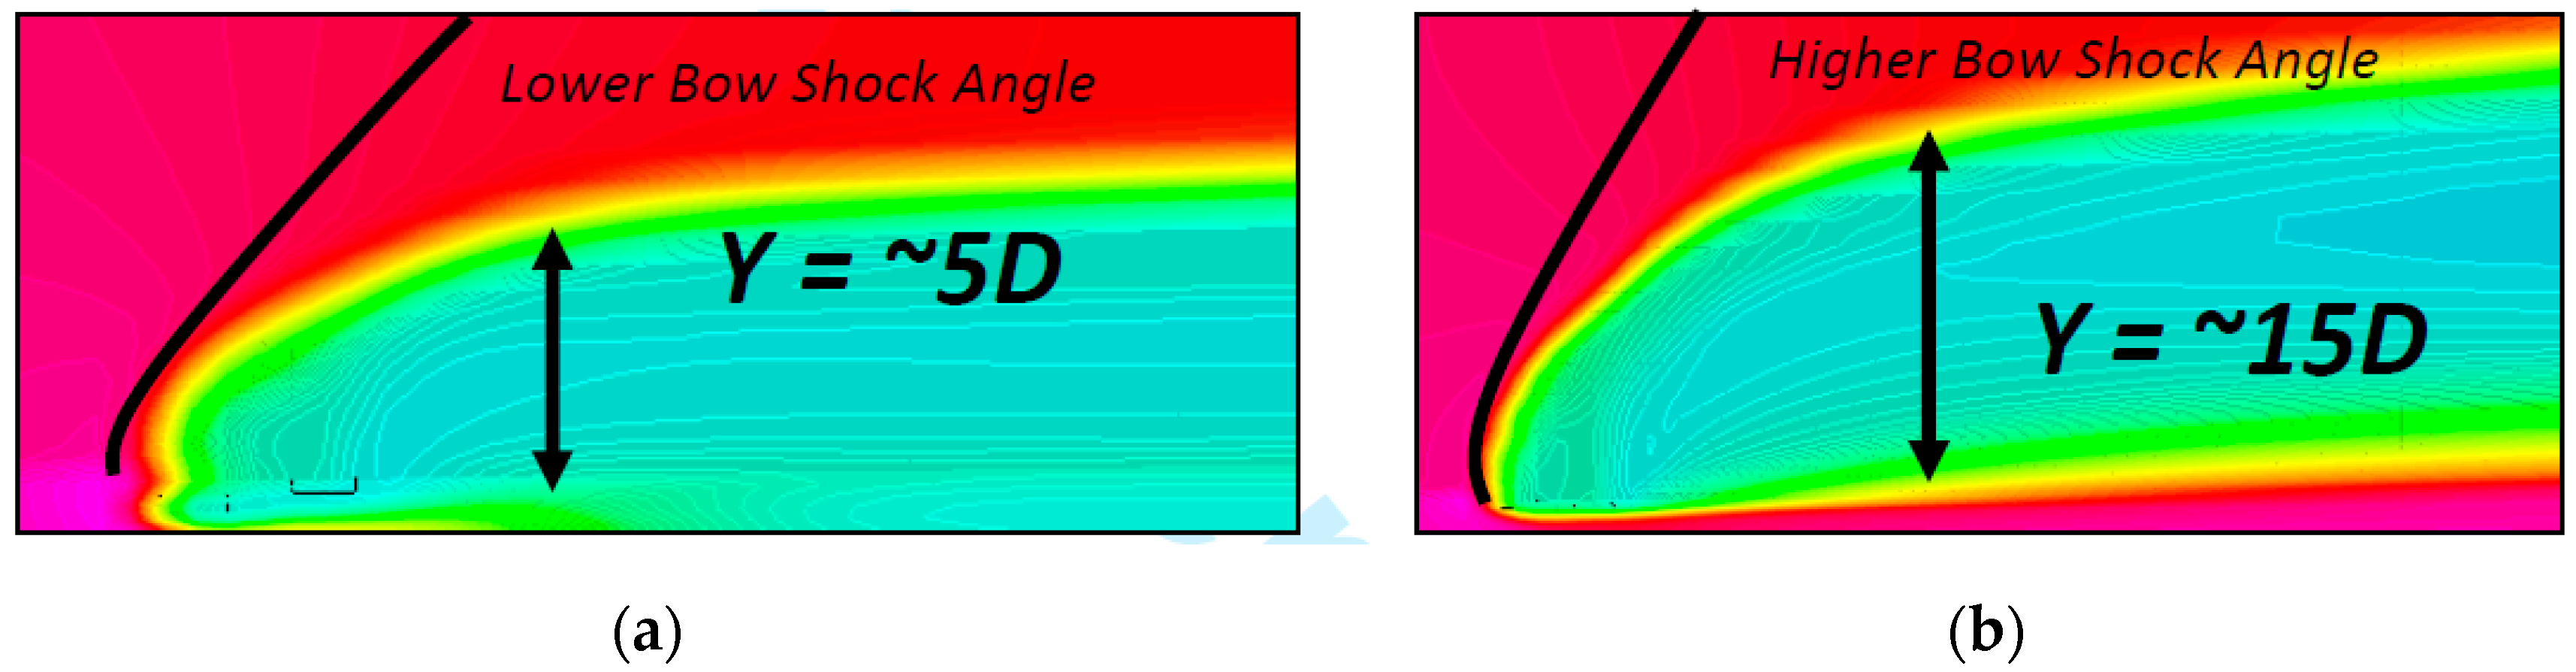
Had the transverse injection system been utilized for the final concept, an investigation into better placement of the injectors with respect to this interaction would have been undertaken, with the objective of preventing the extent of the bow shocks (Figure 29).
5.3.2. 2-D Scramjet Integration Summary
The single strut injector localized high temperature and velocity towards the centerline of the engine, and the drag appeared to increase at the wall boundaries owing to reduced pressure due to a lack due to a transverse exhaustion of combustable species (Figure 30).
The position of the strut injector is such that the oncoming oblique shock is absorbed at the same angle by the strut-induced shock, thus preventing complicated reflective shock structures (Figure 31).
While these may assist the mixing, the analysis of such structures becomes complicated and would likely require a parametric study of performance against strut position. The single strut performs as expected, with the requirement of better transverse temperature distribution still relevant.
5.3.3. 2-D Scramjet: Twin Strut Injection
As indicated by the significantly wider cone of thrust in Figure 32, the expansion of flow is far better distributed with the addition of a second strut. Given that this is only the preliminary integration of engine components, the contour clearly shows a peak nozzle velocity of in the range of 500 m/s to be greater than freestream. This data provides a good scope for the feasibility of the scramjet concept.
Three 2-D scramjet cases were conducted to validate the individual combustor performance of transverse, single strut, and twin strut injection configurations.
The initial scramjet performance achieved peak nozzle velocities of approximately 700 m/s for transverse and approximately 2850 m/s for the strut injector cases. The transverse combustion results were less reliable due to the lack of consideration of the 3-D JICF vortices; however, the bow shock, as expected, caused severe total pressure loss (Figure 33).
The decision to proceed with a twin strut configuration was validated by its superior transverse distribution of thrust while maintaining high pressure recovery. Also, as given by Table 7, the combustion efficiency of Hydrogen was particularly high, exhausting 98% of the injected species.
5.4. 3-D Scramjet Integration (Case 7—3D)
The final stage of simulation involved the extrusion of the 2-D scramjet model and the assignment of a final injector profile and 3-D scramjet mesh. The estimated through the engine was given as 672 kg/s, maintaining an equivalence ratio of 0.2, which gives an of 9.2 kg/s, which would be achieved by a fuel plenum stagnation pressure of 3.0 MPa at 250 K, corresponding to sonic (M = 1) injection (Table 8).
The setup was scrutinized from the start, as the 3-D combustion chamber for 0.1 m depth required at least 3 million elements to achieve the resolution required for grid independency. The entire domain was approximately 10 times in size compared just the combustion chamber domain, which was not possible to mesh/solve with the available resources.
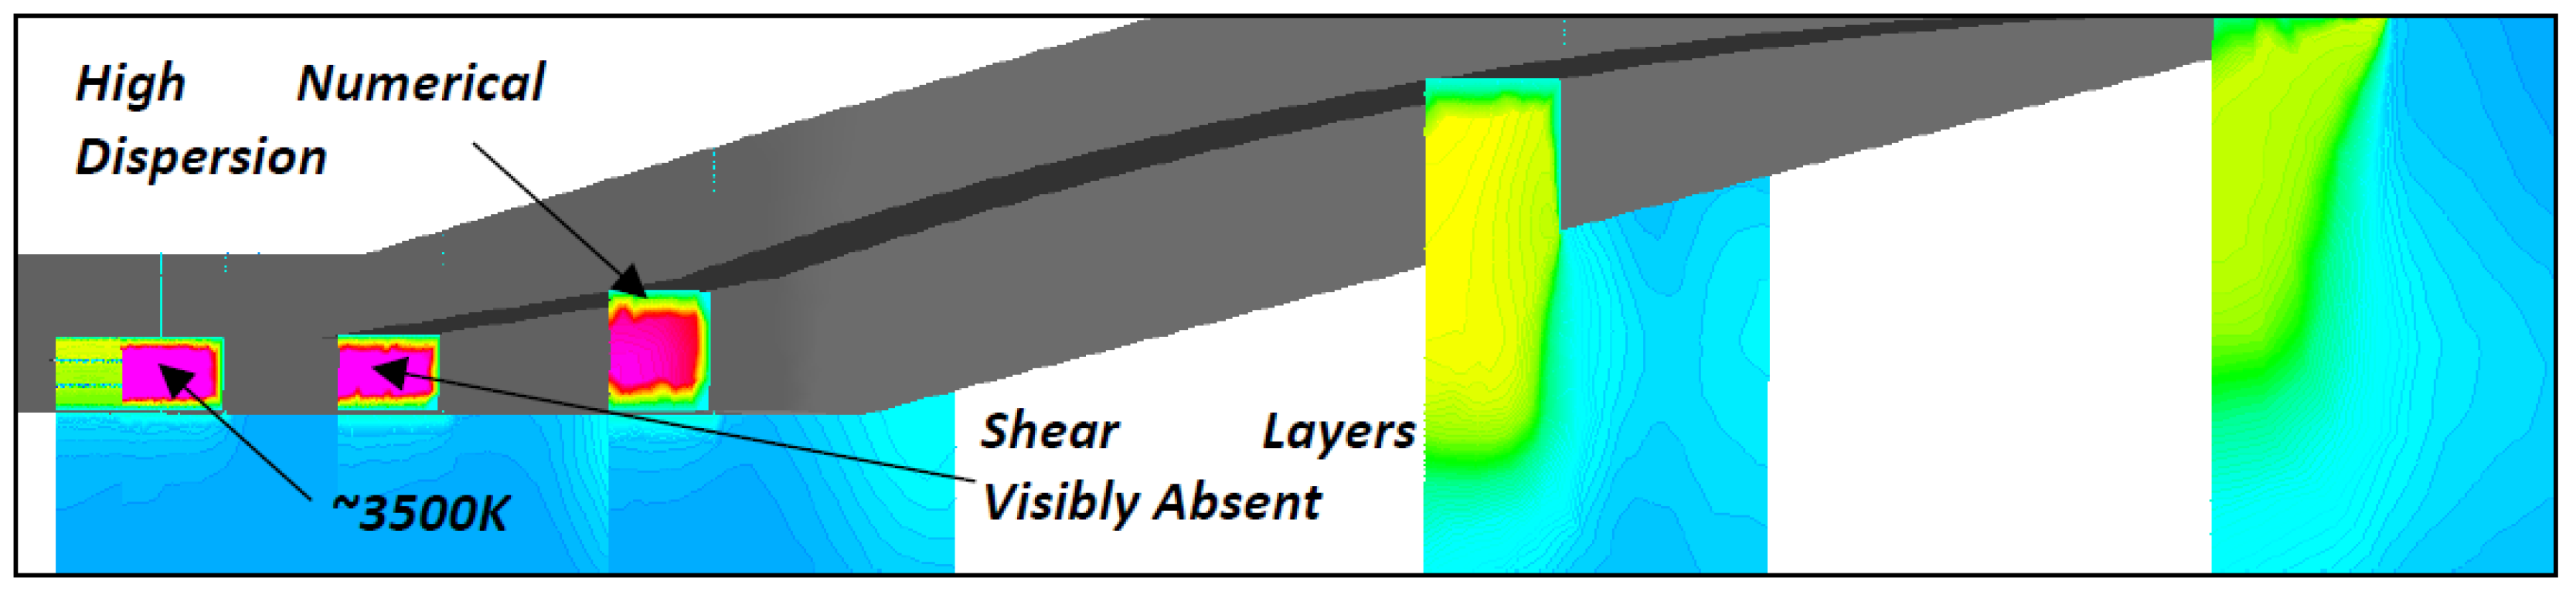
As expected, the 3-D integration produced fairly poor numerical results owing to the insufficient grid resolution. The consequences are labeled in Figure 34, whereby the contours are extended from the walls in a coarse manner, and the presence of the expected shear layers (such as those in the 2-D tests) are replaced with blended data. Perhaps the most significant effect is the peak temperature of 3500 K, as in reality the flow particles would dissociate and ionize.
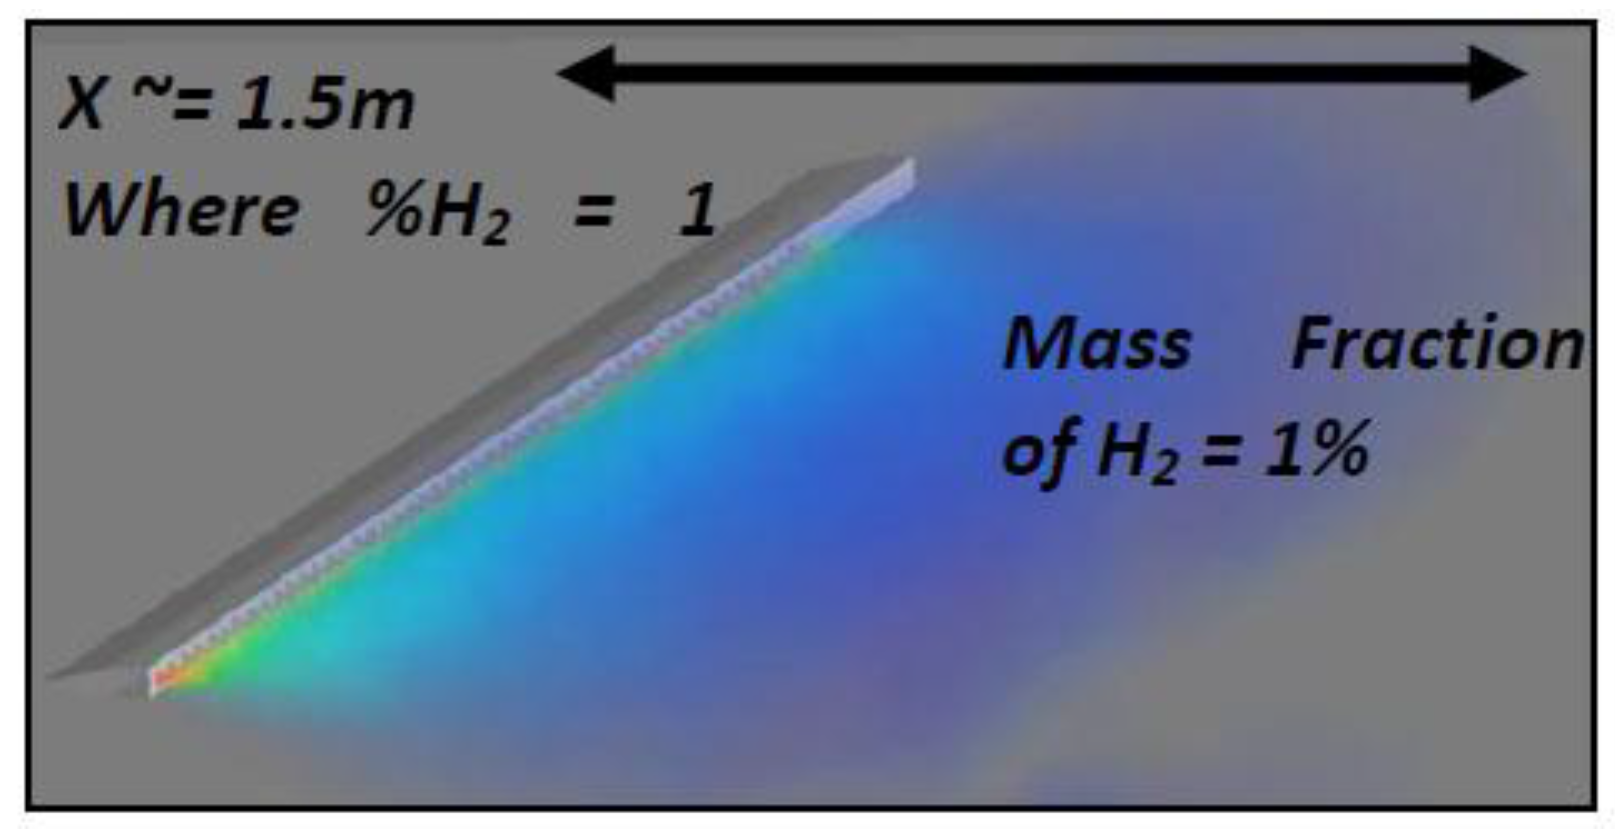
The high temperature is explained by the finite-element solver approximating the dissipation of Hydrogen over larger element sizes. The fine scales are not modeled and therefore Hydrogen is assumed to dissipate much faster (to 1% in <1.5 m, see Figure 35), causing rapid and extremely intense combustion downstream of the injectors.
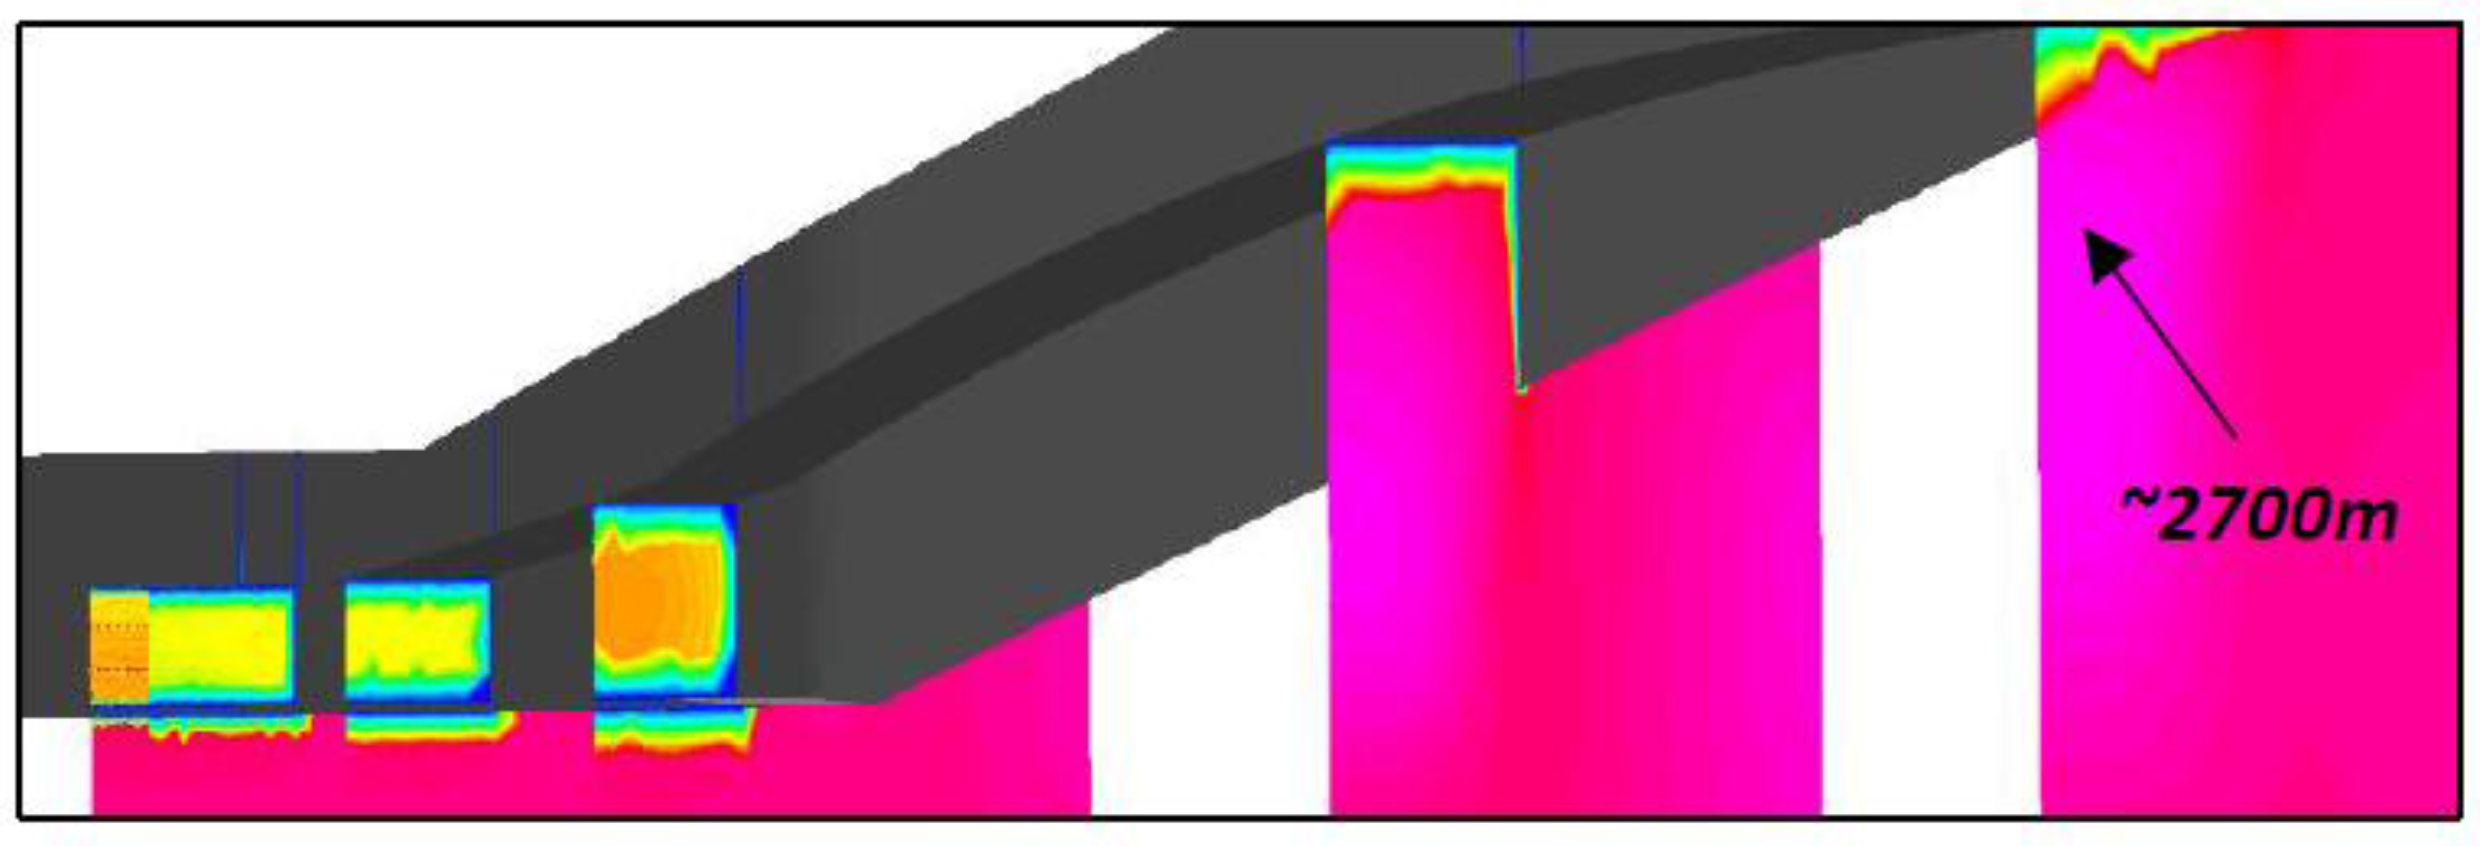
The absence of the shear layers and the intensity of the numerical dispersion caused results such as total pressure recovery to be erroneous and unable to be displayed. However, the contour plot of velocity in Figure 36 shows that the nozzle still produces a net thrust, given by the region of velocity exceeding freestream.
6. Conclusions
The concept of combustion for sustained hypersonic flight has been investigated through the design and computational fluid dynamics of a supersonic combustion chamber. The objective of this model was to integrate the design into a novel dual-mode scram-ramjet for a Mach 8 cruise hypersonic transport aircraft.
Computational simulation was validated against DLR (German Aerospace Centre) experimental results, to verify the solution methodology. Initial testing consisted of varying injector geometry and arrangement in transverse injection techniques, continuing on to strut injection methods with the objective of selecting the most optimum design to be implemented in the scramjet concept.
Simulation test conditions were fixed at Mach 2.5 at the combustor entrance and an equivalence ratio of 0.6 through a series of sonic Hydrogen fuel injectors. The interaction of fuel and air was analyzed based on parameters such as the transverse mixing efficiency, combustion efficiency, and overall population of species through post-processing in ANSYS, Excel, and MATLAB.
In agreement with previous research in the areas of interest, polygonal injectors generally perform better than circular geometries ( 88% vs. 85%). Where total pressure loss is concerned, the usage of strut injectors increases the pressure recovery compared to transverse injection at the slight expense of mixing efficiency and percentage fuel exhaustion (~90% vs. ~75%). The most optimum combustor configuration was selected as a twin strut arrangement, producing the most distributed profile of thrust across the scramjet nozzle, and achieving net thrust results of 1873 kN at a peak velocity of 2850 m/s. Scaling the combustion chamber in three dimensions produced promising results, and with future work in mind, it would be beneficial to simulate all cases with increased mesh density and to replicate these cases experimentally where possible.
The results described contribute to the overall conclusion that there is potential for robust Hydrogen combustion at sustained Mach 8 flight. With validated CFD data becoming more reliable, there is clear capability for replicating past physical testing. However, as mentioned, the next phase in this study should consist of experimental replication for further validation purposes.
Author Contributions
Apostolos Pesyridis conceived the project and the layout of the investigations and checked the outcome of the resultant configuration calculations and subsequent discussion. Stephen Neill was the research student that conducted the detailed study and wrote the first draft of this paper.
Conflicts of Interest
The authors declare no conflict of interest.
Appendix A. Computational Test Cases

Table A1.
CFD cases.
| CFD Case Name Identifiers (FS—Full Scale) | |||
|---|---|---|---|
| 1 | Elliptical vs. Polygonal Injectors (3D) | 5 | Twin Strut (FS Chamber 3D) |
| 2a | Aligned Injectors (3D) | 6a | Scramjet Transverse (FS 2D) |
| 2b | Staggered Injectors (3D) | 6b | Scramjet Single Strut (FS 2D) |
| 3 | Final Transverse Design (FS Chamber 3D) | 6c | Scramjet Twin Strut (FS 2D) |
| 4 | Single Strut (FS Chamber 3D) | 7 | Final Twin Strut Scramjet Design (FS 3D) |
Appendix B. Computational Fluid Dynamic Setup
Table A2.
Grid resolution and quality.
| Grid Resolution and Quality | |||||||||||
|---|---|---|---|---|---|---|---|---|---|---|---|
| Case: | 1 | 2 | 3a | 3b | 3c | 4 | 5 | 6a | 6b | 6c | 6d |
| Element Number (m—million, k—thousand) | 150 k | 147 k | 150 k | 3.9 m | 2.6 m | 2.7 m | 377 k | 369 k | 388 k | 4.5 m | |
| Minimum Quality (Average Quality) | 0.90 (0.99) | 0.24 (0.95) | 0.43 (0.81) | 0.41 (0.64) | 0.37 (0.68) | 0.25 (0.69) | 0.59 (0.99) | 0.23 (0.76) | 0.27 (0.78) | 0.16 (0.82) | |
Table A3.
Inlet Boundary Conditions—Cases 1–7.
| Inlet Boundary Conditions—Validation Study Case 1 | |||
| Static Pressure | 100 kPa | Mach Number | 2.0 |
| Stagnation Pressure | 776 kPa | k | 10 |
| Stagnation Temperature (Static Temp) | 585 K (340 K) | epsilon | 650 |
| Inlet Boundary Conditions—Injector Study Cases 2–5 | |||
| Static Pressure | 9.877 kPa | Mach Number | 2.5 |
| Stagnation Pressure | 170 kPa | Turbulent Intensity | 5% |
| Stagnation Temperature (Static Temp) | 1350 K (656 K) | Turbulent Viscosity Ratio | 10 |
| Far-Field Boundary Conditions—2D/3D Scramjet Integration Cases 6–7 | |||
| Static Pressure | 1.09 kPa | Turbulent Intensity | 5% |
| Static Temperature | 227 K | Turbulent Viscosity Ratio | 10 |
| Mach Number | 8 | ||
Table A4.
Injector Boundary Conditions—Cases 1–7.
| Injector Boundary Conditions: Cases 1–5 | |||||||
| Case: | 1 | 2a | 2b | 3 | 4 | 5 | |
| Units↓ | Elliptic/Polygon | Aligned | Stagg | Final Transverse | Single Strut | Twin Strut | |
| Number of Injectors | - | 4 | 2 | 3 | 8 | 2 | 4 |
| Static Pressure | kPa | 320 | 160 | 106.6 | 375 | 1500 | 750 |
| Stag Pressure | kPa | 600 | 300 | 200 | 750 | 3000 | 1500 |
| Stag Temperature (Static Temp) | K (K) | 300(250) | |||||
| Mach Number | - | 1 | |||||
| Equivalence Ratio | - | 0.6 | |||||
| Turbulent Intensity (k) | - | 5% | |||||
| Turbulent Viscosity Ratio (epsilon) | - | 10 | |||||
| Injector Boundary Conditions: Cases 6–7 | |||||||
| Case: | 6a | 6b | 6c | 7 | |||
| Units↓ | 2D Transverse | 2D Single Strut | 2D Twin Strut | 3D Twin Strut | |||
| Number of Injectors | - | 4 | 1 | 2 | 100 | ||
| Static Pressure | kPa | 145 | 580 | 290 | 1600 | ||
| Stag Pressure | kPa | 275 | 1100 | 550 | 3000 | ||
| Stag Temperature (Static Temp) | K (K) | 300(250) | |||||
| Mach Number | - | 1 | |||||
| Equivalence Ratio | - | 0.2 | |||||
| Turbulent Intensity (k) | - | 5% | |||||
| Turbulent Viscosity Ratio (epsilon) | - | 10 | |||||
Appendix C. Governing Equations
Appendix C.1. Turbulent kinetic energy (k—Equation (A1)) and rate of dissipation (ε–Equation (A2)), k-epsilon RANS FLUENT Model
Gk—Velocity Gradients, Gb—Buoyanc, YM—Fluctuating Dilatation, C—Constants, —Turbulent Prandtl Numbers, S—Source Terms.
Appendix C.2. Arrhénius Rate of Reaction Law
k—Rate Constant, T—Temperature, A—Pre-exp factor, Ea—Activation Energy, R—Gas Constant.
Appendix C.3. Laminar Finite-Rate Model
Appendix C.4. Conservation of Species (Species Transport Model)
Y—Local Species Mass Fraction, J—Diffusive Flux Term, —Convective Term (Transport due to Velocity), R—Rate of Species Production, S—Rate of Additional Creation (Discrete phase modeling (DPM) etc.).
Appendix C.5. Transverse Mixing Efficiency (Equation (A5)) and Combustion (Equation (A6)) Efficiency
m—Mass Fraction of Hydrogen, αs—Stoichiometric Mass Fraction of Hydrogen.
—Mass Flux of Mixed Hydrogen, —Total Mass Flux of Hydrogen.
For injection parallel to the flow field, mixing efficiencies are point values (non-integrated) denoted by the cold flow ratio of mixed fuel to overall injected fuel.
where 0.1119 refers to the stoichiometric constant for the single-step reaction.
References
- Musielak, D.E. Fuel Injection and Combustion Study for Mach 10–12 Scramjet. AIAA J. 2015, 53, 2907–2919. [Google Scholar]
- Yang, Q.; Chang, J.; Bao, W. Richtmyer-Meshkov Instability Induced Mixing Enhancement in the Scramjet Combustor with a Central Strut. Adv. Mech. Eng. 2015, 1–7. [Google Scholar] [CrossRef]
- Reddy, P.N.; Venkatasubbaiah, K. Numerical Investigations on Development of Scramjet Combustor. J. Aerosp. Eng. 2015, 28. [Google Scholar] [CrossRef]
- Génin, F.; Menon, S. Simulation of Turbulent Mixing Behind a Strut Injector in Supersonic Flow. AIAA J. 2010, 48, 526–539. [Google Scholar] [CrossRef]
- Wise, D.J.; Smart, M.K. Experimental Investigation of a Three Dimensional Scramjet Engine at Mach 12. In Proceedings of the 20th AIAA International Space Planes and Hypersonic Systems and Technologies Conference, Glasgow, UK, 6–9 July 2014. [Google Scholar] [CrossRef]
- Ogawa, H. Effects of Injection Angle and Pressure on Mixing Performance of Fuel Injection via Various Geometries for Upstream-Fuel-Injected Scramjets. Acta Astronaut. 2016, 128, 485–498. [Google Scholar] [CrossRef]
- Savino, R.; Pezzella, G. Numerical Analysis of Supersonic Combustion Ramjet with Upstream Fuel Injection. Int. J. Numer. Methods Fluids 2003, 43, 165–181. [Google Scholar] [CrossRef]
- Turner, J.C.; Smart, M.K. Application of Inlet Injection to a Three-Dimensional Scramjet at Mach 8. AIAA J. 2010, 48, 829–838. [Google Scholar] [CrossRef]
- Barth, J.E.; Wheatley, V.; Smart, M.K. Effects of Hydrogen Fuel Injection in a Mach 12 Scramjet Inlet. AIAA J. 2015, 53, 2907–2919. [Google Scholar] [CrossRef]
- Barth, J.E. Mixing and Combustion Enhancement in a Mach 12 Shape-Transitioning Scramjet Engine. Ph.D. Thesis, School of Mechanical and Mining Engineering, The University of Queensland, Brisbane, Australia, 2014. [Google Scholar]
- Smart, M. Scramjet Inlets; Centre for Hypersonics Queensland University: Brisbane, Australia, 2010. [Google Scholar]
- Oevermann, M. Numerical Investigation of Turbulent Hydrogen Combustion in a SCRAMJET Using Flamelet Modeling. Aerosp. Sci. Technol. 2000, 4, 463–480. [Google Scholar] [CrossRef]
Figure 1.
Turbojet engine schematic.

Figure 2.
Scramjet engine schematic.

Figure 3.
Transverse injection mixing study of H2 reported in [1], red-to-blue denoting the percentage of H2 species in the domain.
Figure 3.
Transverse injection mixing study of H2 reported in [1], red-to-blue denoting the percentage of H2 species in the domain.

Figure 4.
Shock interaction on cold flow mixing for a single strut (left) and a twin strut (right). Study reported in Reference [3] (copyright ASCE library, 2015).
Figure 4.
Shock interaction on cold flow mixing for a single strut (left) and a twin strut (right). Study reported in Reference [3] (copyright ASCE library, 2015).

Figure 5.
Strut injection study of temperature field and velocity vectors reported in Reference [4].
Figure 5.
Strut injection study of temperature field and velocity vectors reported in Reference [4].

Figure 6.
Mixing efficiency study for varied injector geometries [6] (graph of mixing efficiency ηm vs. Downstream Location Xm ).
Figure 6.
Mixing efficiency study for varied injector geometries [6] (graph of mixing efficiency ηm vs. Downstream Location Xm ).

Figure 7.
H2 jet penetration (Y/D) of staggered and aligned injector arrangements [6].
Figure 7.
H2 jet penetration (Y/D) of staggered and aligned injector arrangements [6].
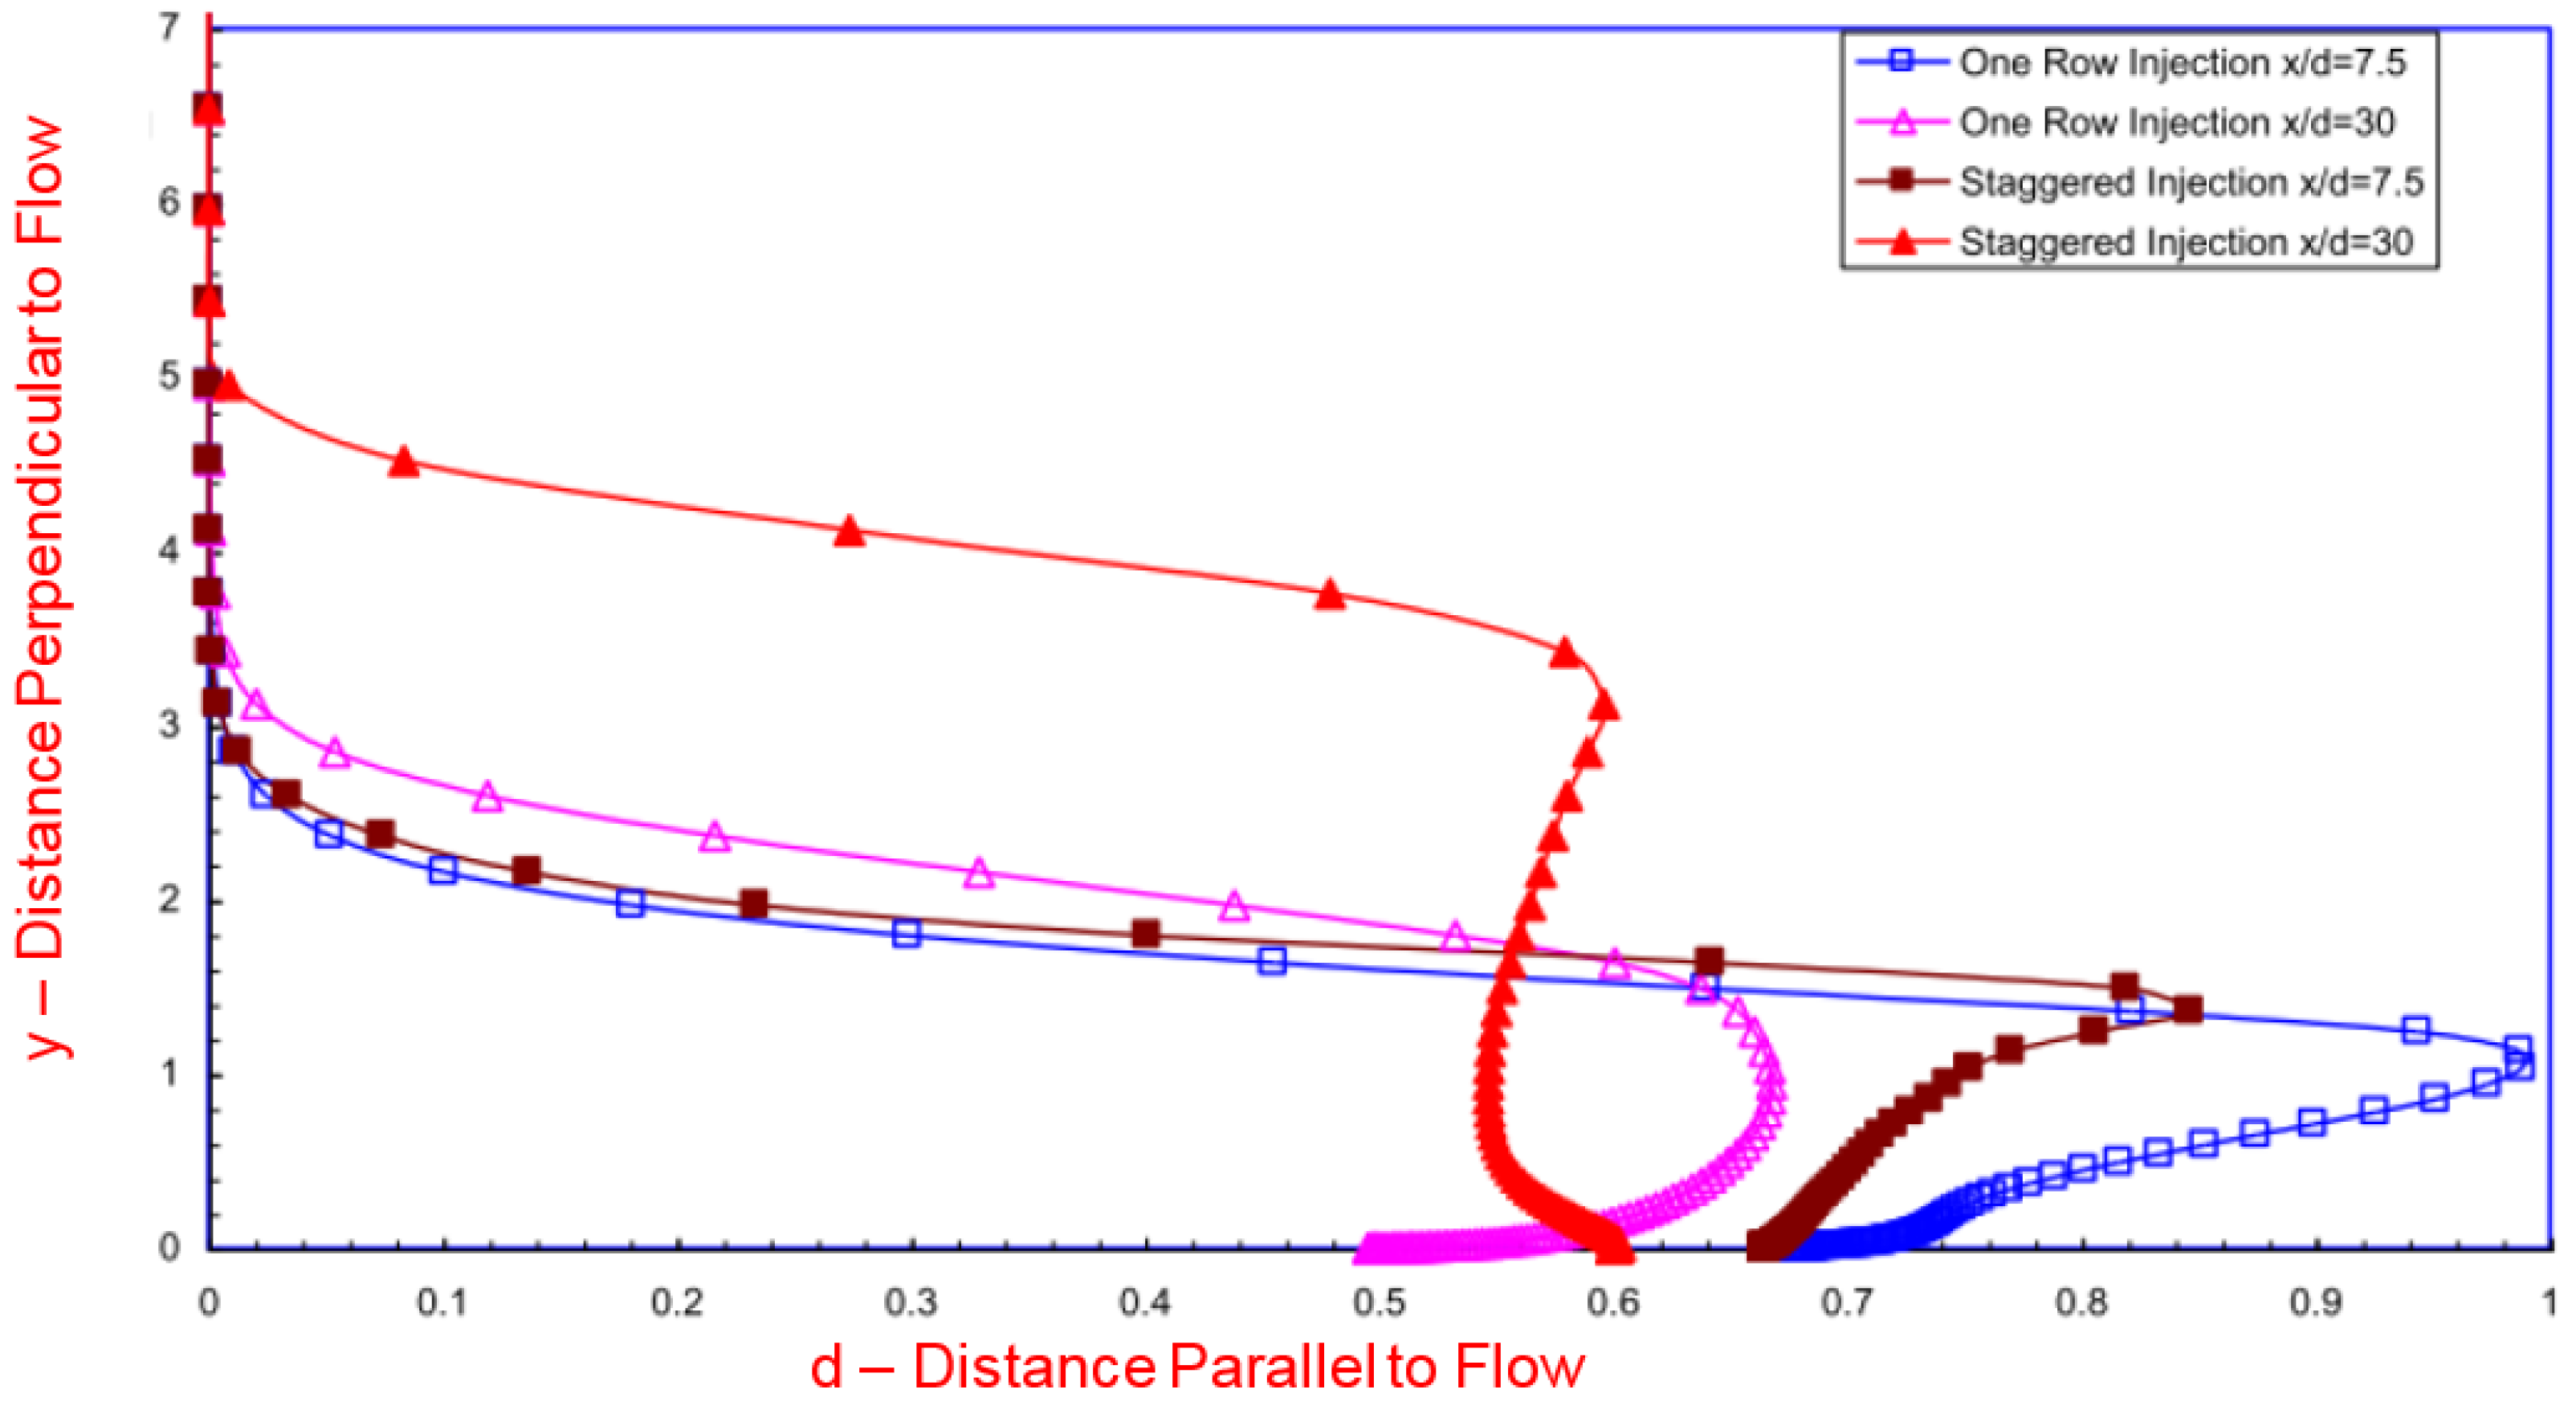
Figure 8.
Concept hypersonic aircraft.

Figure 9.
Hypersonic inlet forebody and shock train.

Figure 10.
Mass flow rate convergence graph.
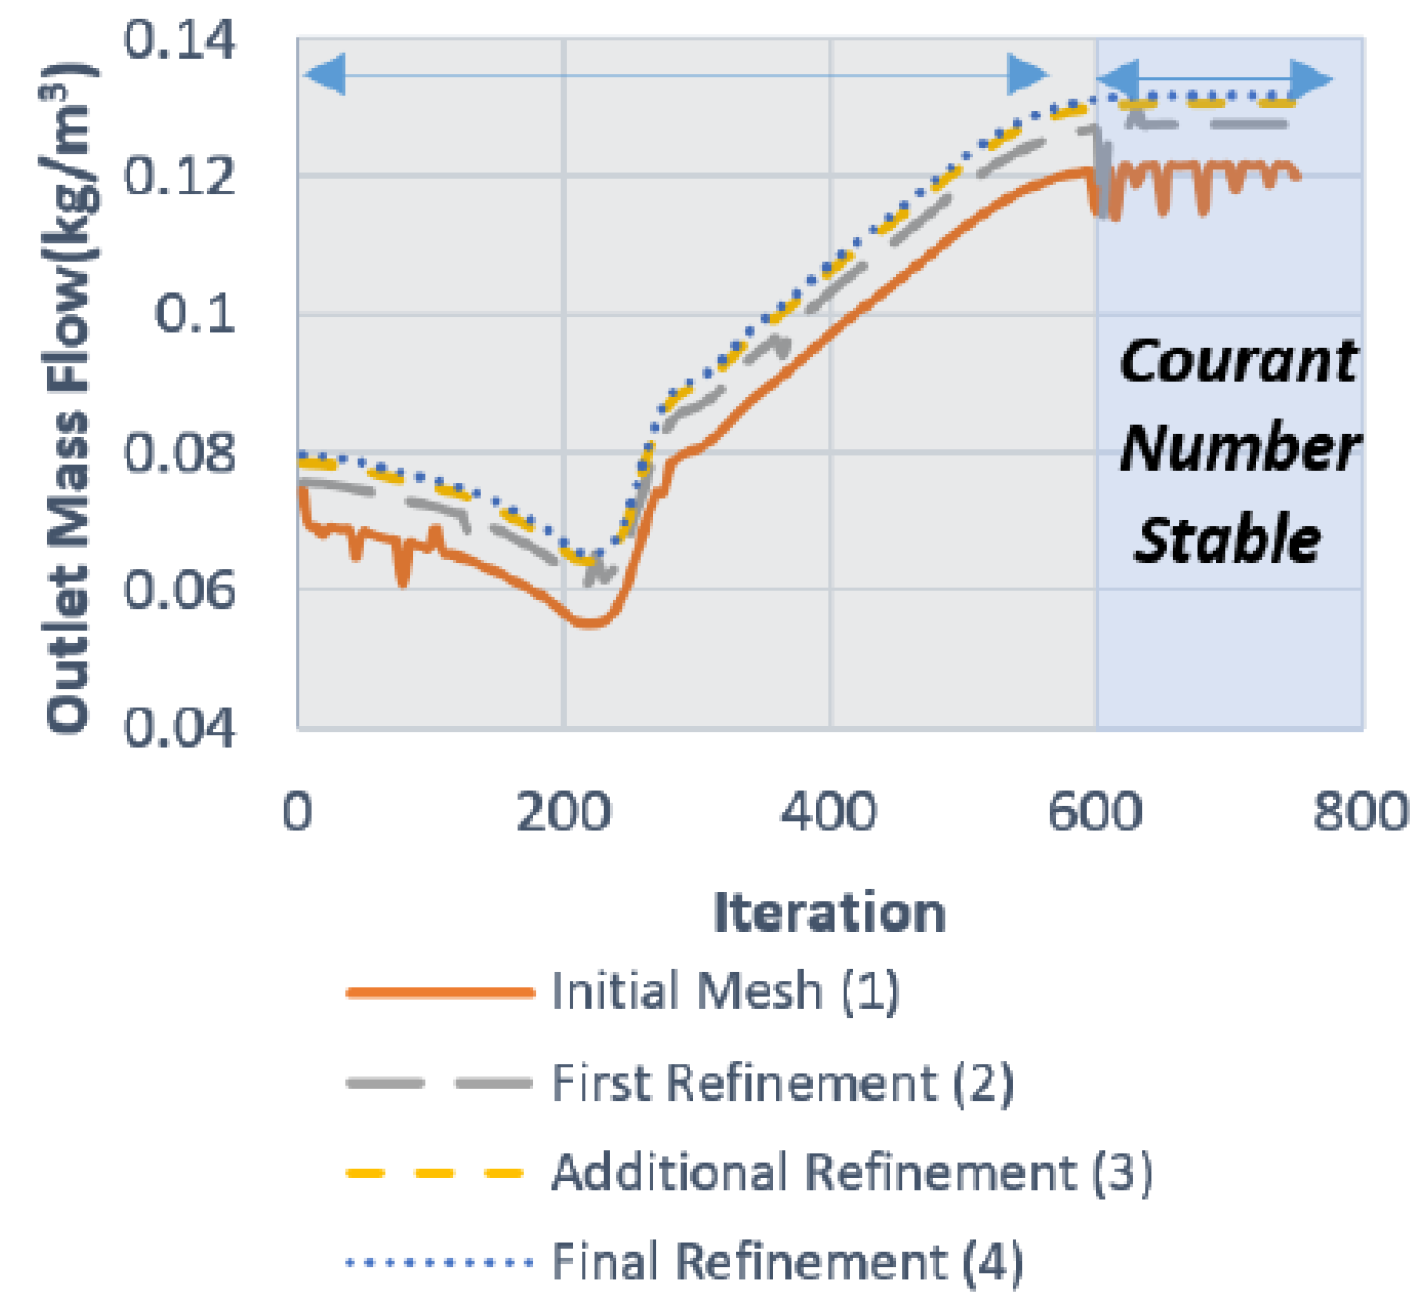
Figure 11.
Cold flow comparison of DLR scramjet [12] Schlieren (a) to CFD test replication (b).
Figure 11.
Cold flow comparison of DLR scramjet [12] Schlieren (a) to CFD test replication (b).
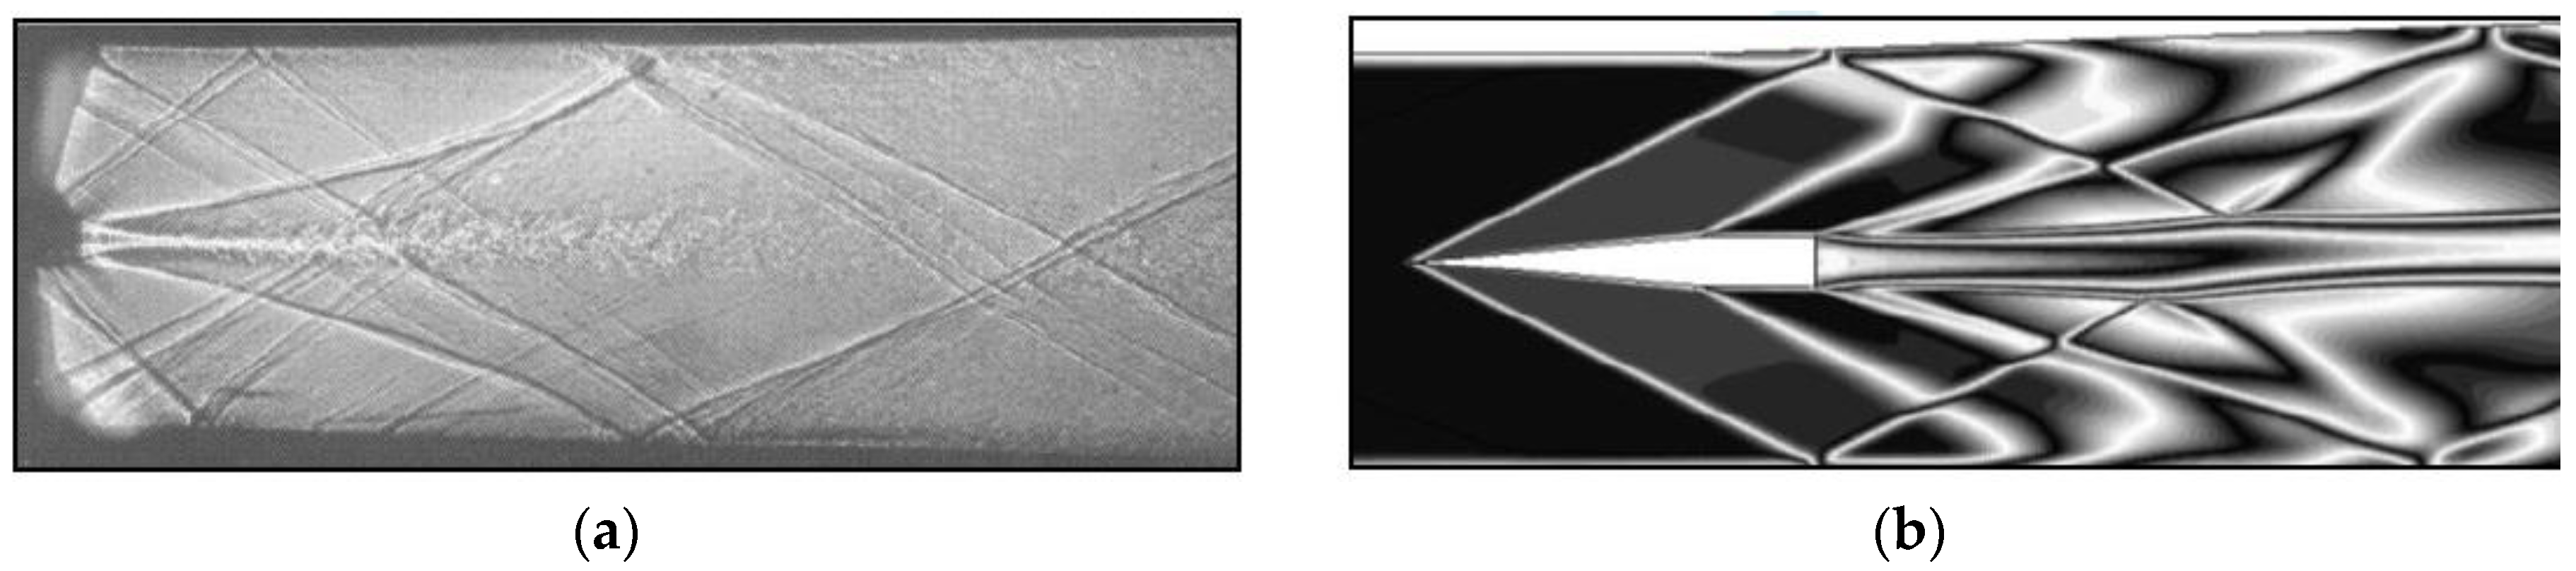
Figure 12.
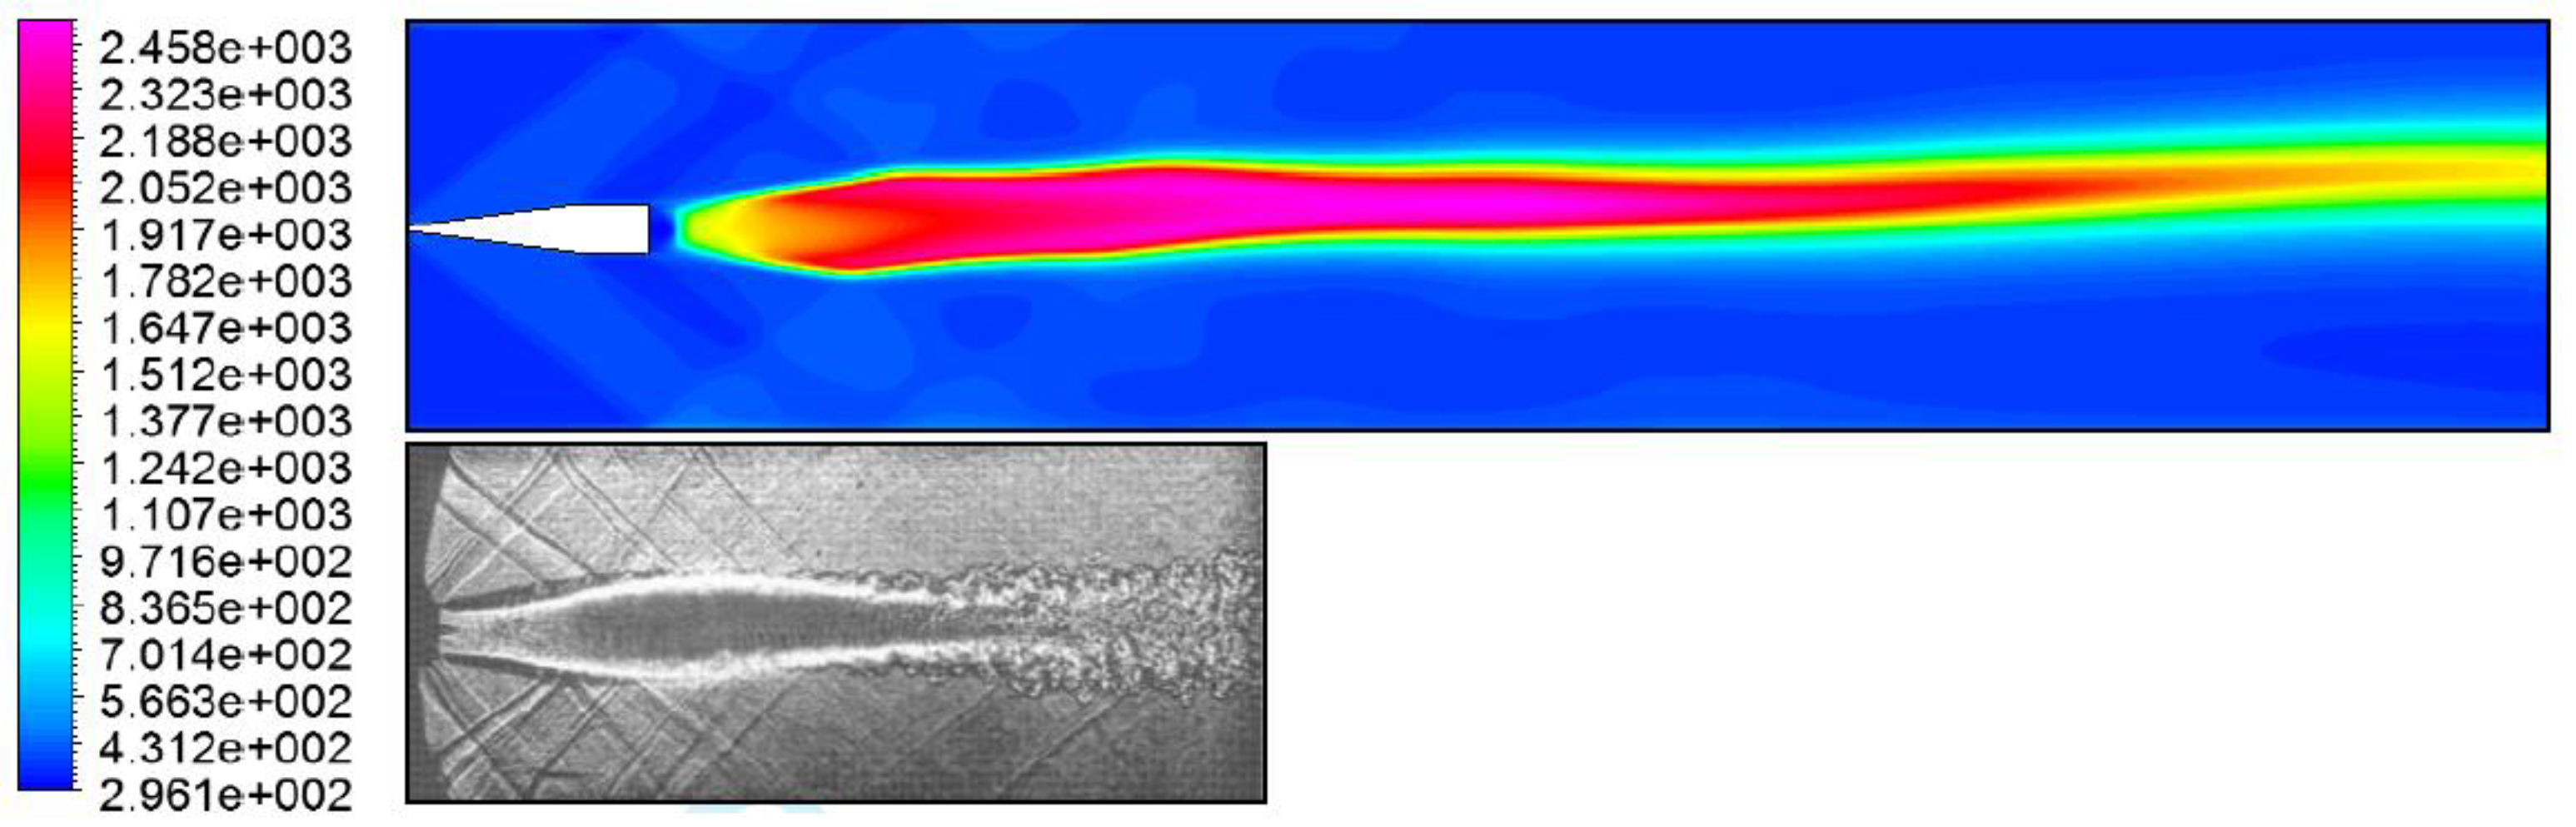
Reacting case comparison of DLR scramjet shadowgraph [12] (bottom) to CFD replicated flame temperature (K) (top).
Figure 12.
Reacting case comparison of DLR scramjet shadowgraph [12] (bottom) to CFD replicated flame temperature (K) (top).

Figure 13.
Two-dimensional (2-D) vs. three-dimensional (3-D) jet into crossflow, temperature contours (K).
Figure 13.
Two-dimensional (2-D) vs. three-dimensional (3-D) jet into crossflow, temperature contours (K).

Figure 14.
Cold flow injector performance in terms of Hydrogen mass fraction (%H Mass).
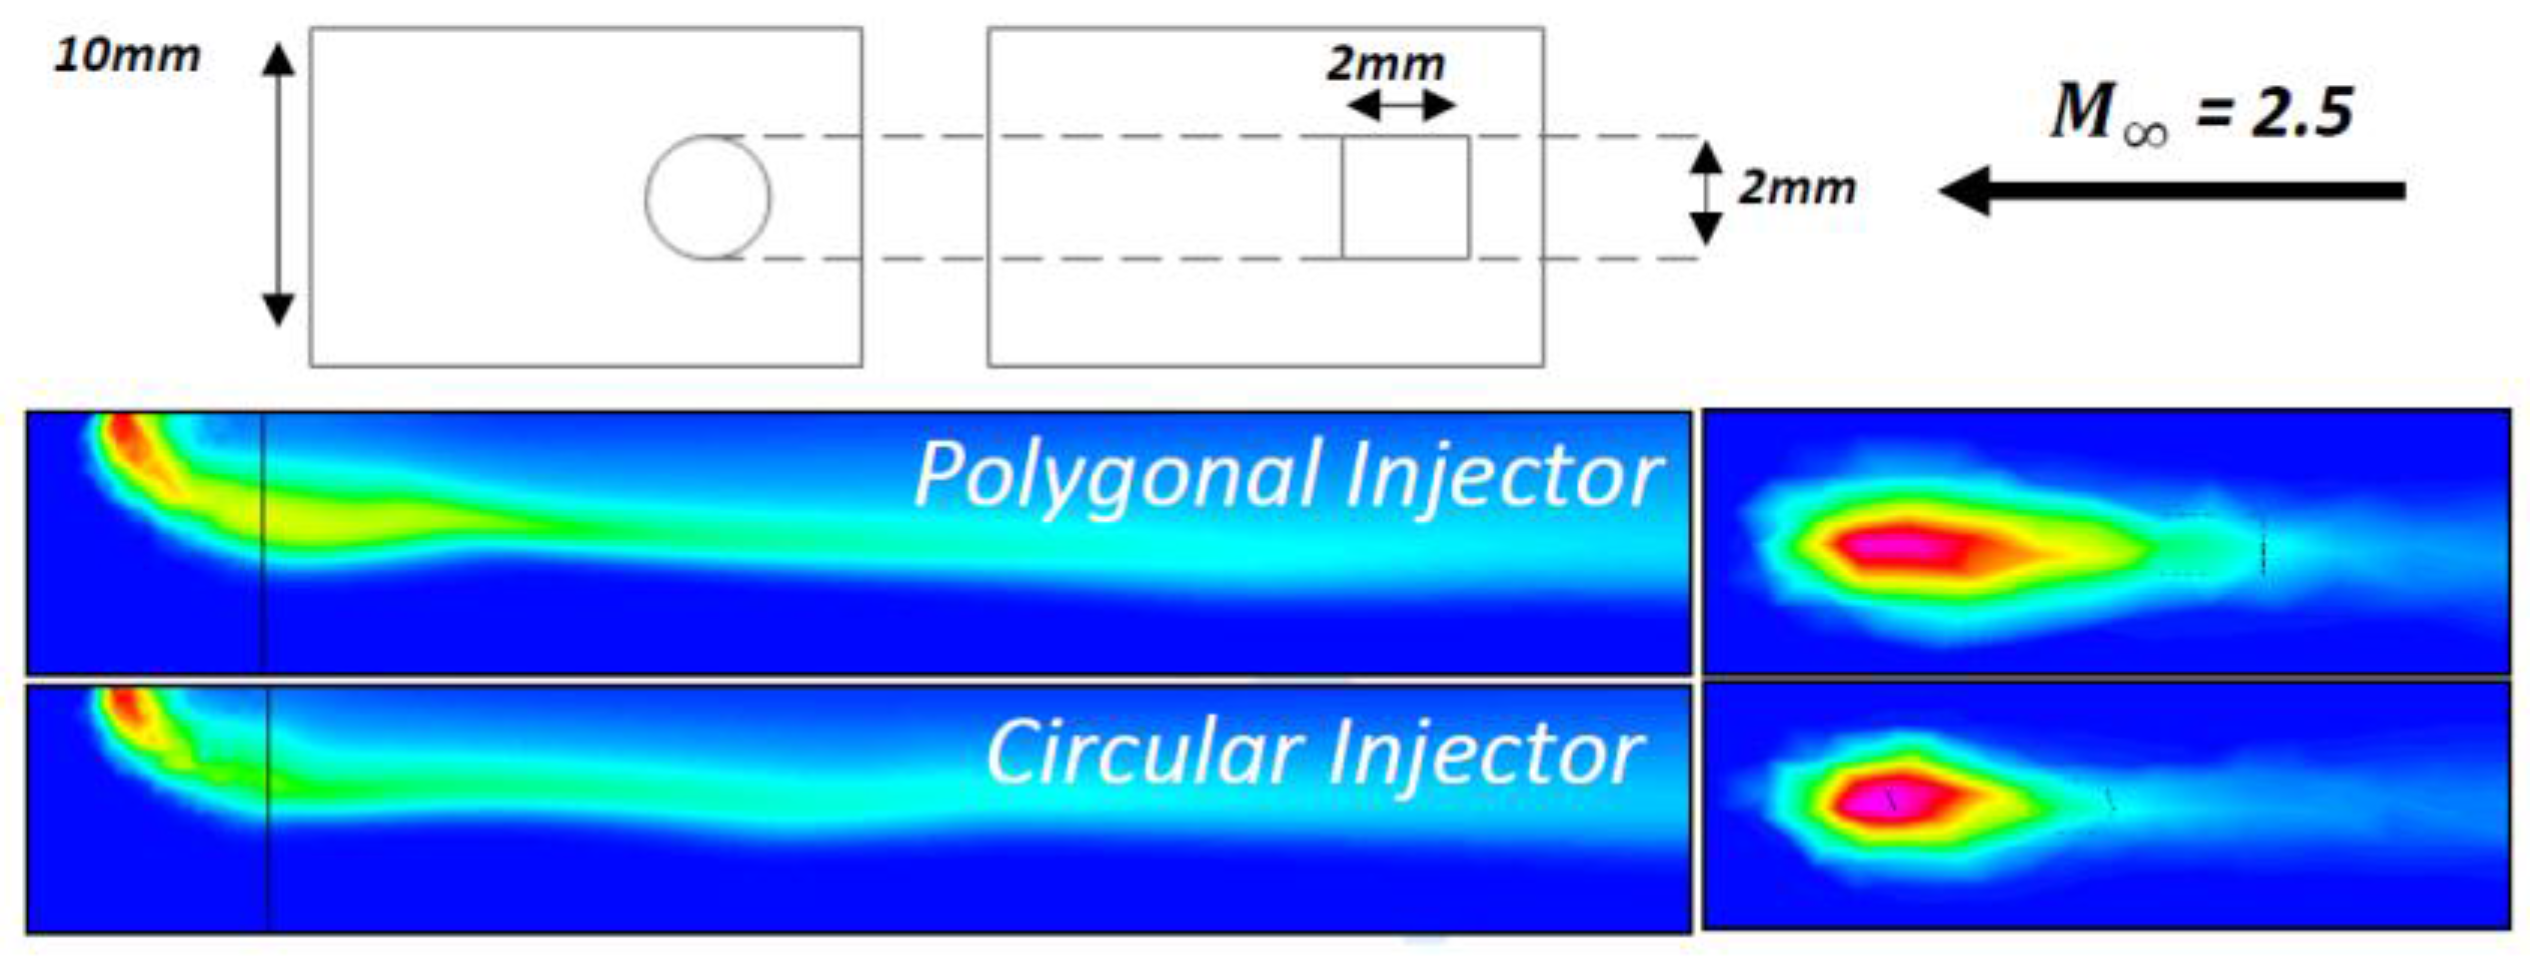
Figure 15.
(a) Polygonal jet penetration height; (b) Elliptical jet penetration height.
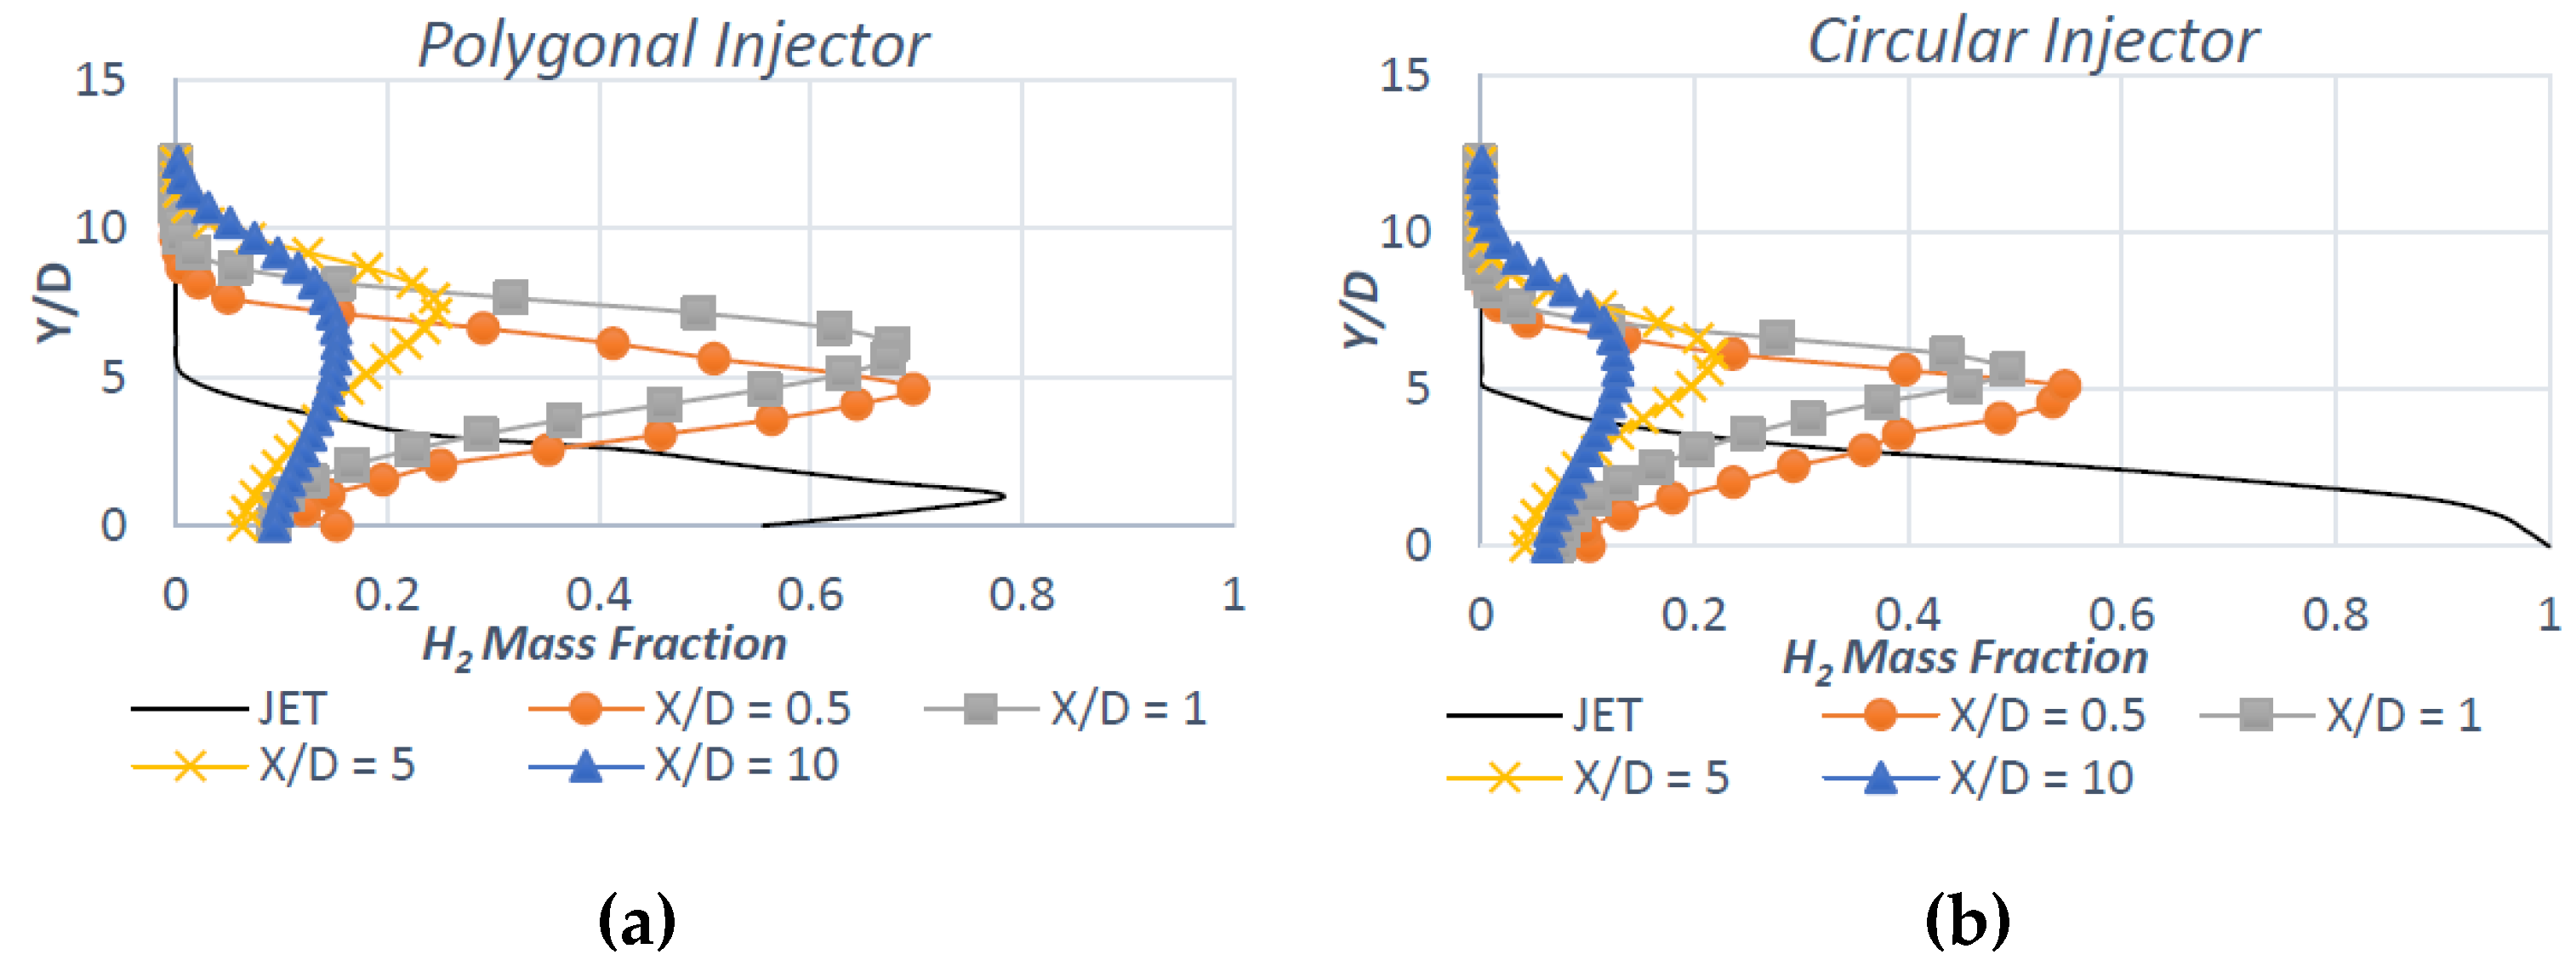
Figure 16.
(a) H2 wall distribution; (b) Transverse mixing efficiency. Elliptical vs. polygonal injectors.
Figure 16.
(a) H2 wall distribution; (b) Transverse mixing efficiency. Elliptical vs. polygonal injectors.
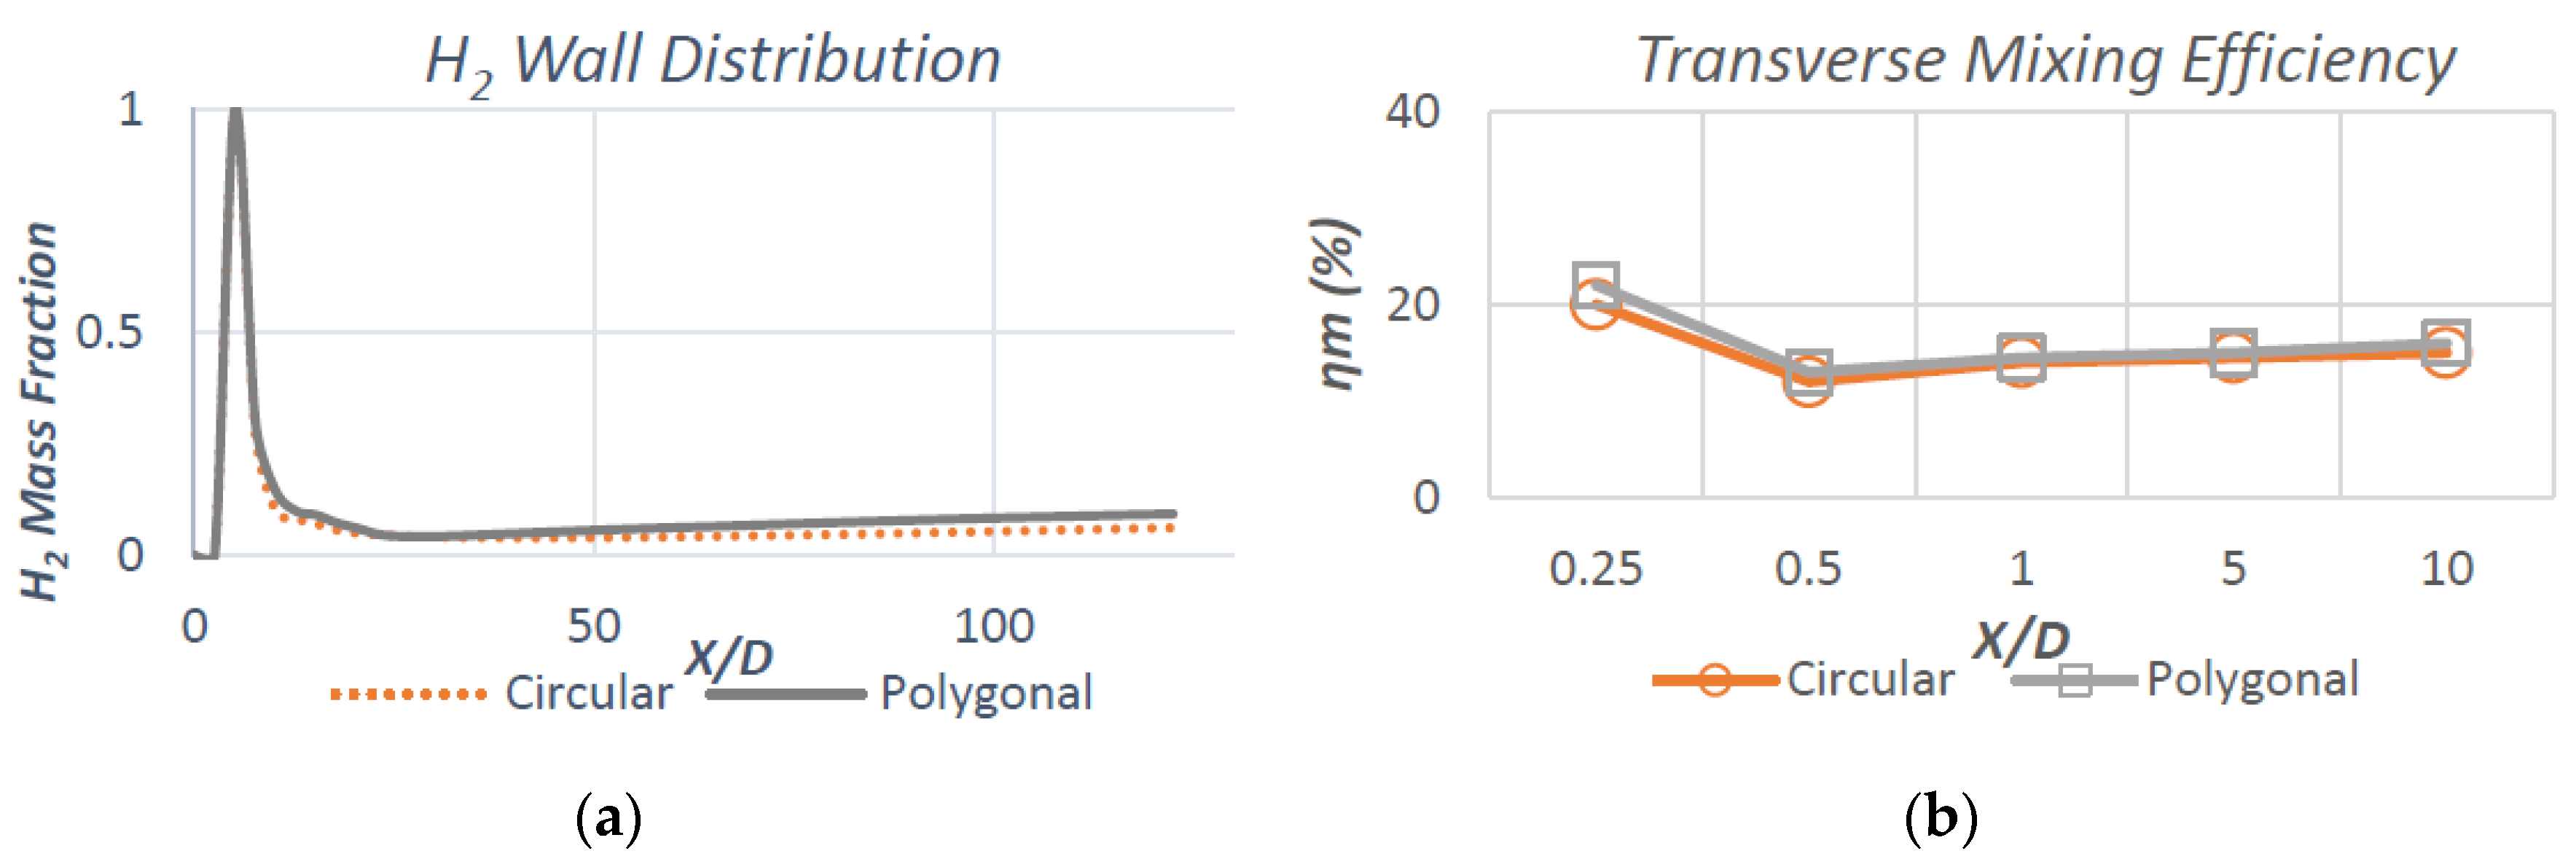
Figure 17.
Case 2: Transverse jet penetration and wall distribution in terms of H2 mass fraction (%H Mass).
Figure 17.
Case 2: Transverse jet penetration and wall distribution in terms of H2 mass fraction (%H Mass).

Figure 18.
Bow shock extent in terms of flow field density (kg/m3). (a) Staggered; (b) Aligned.

Figure 19.
Total pressure loss comparison of aligned and staggered injector arrangement.

Figure 20.
(a) H2 wall distribution; (b) Transverse mixing efficiency.
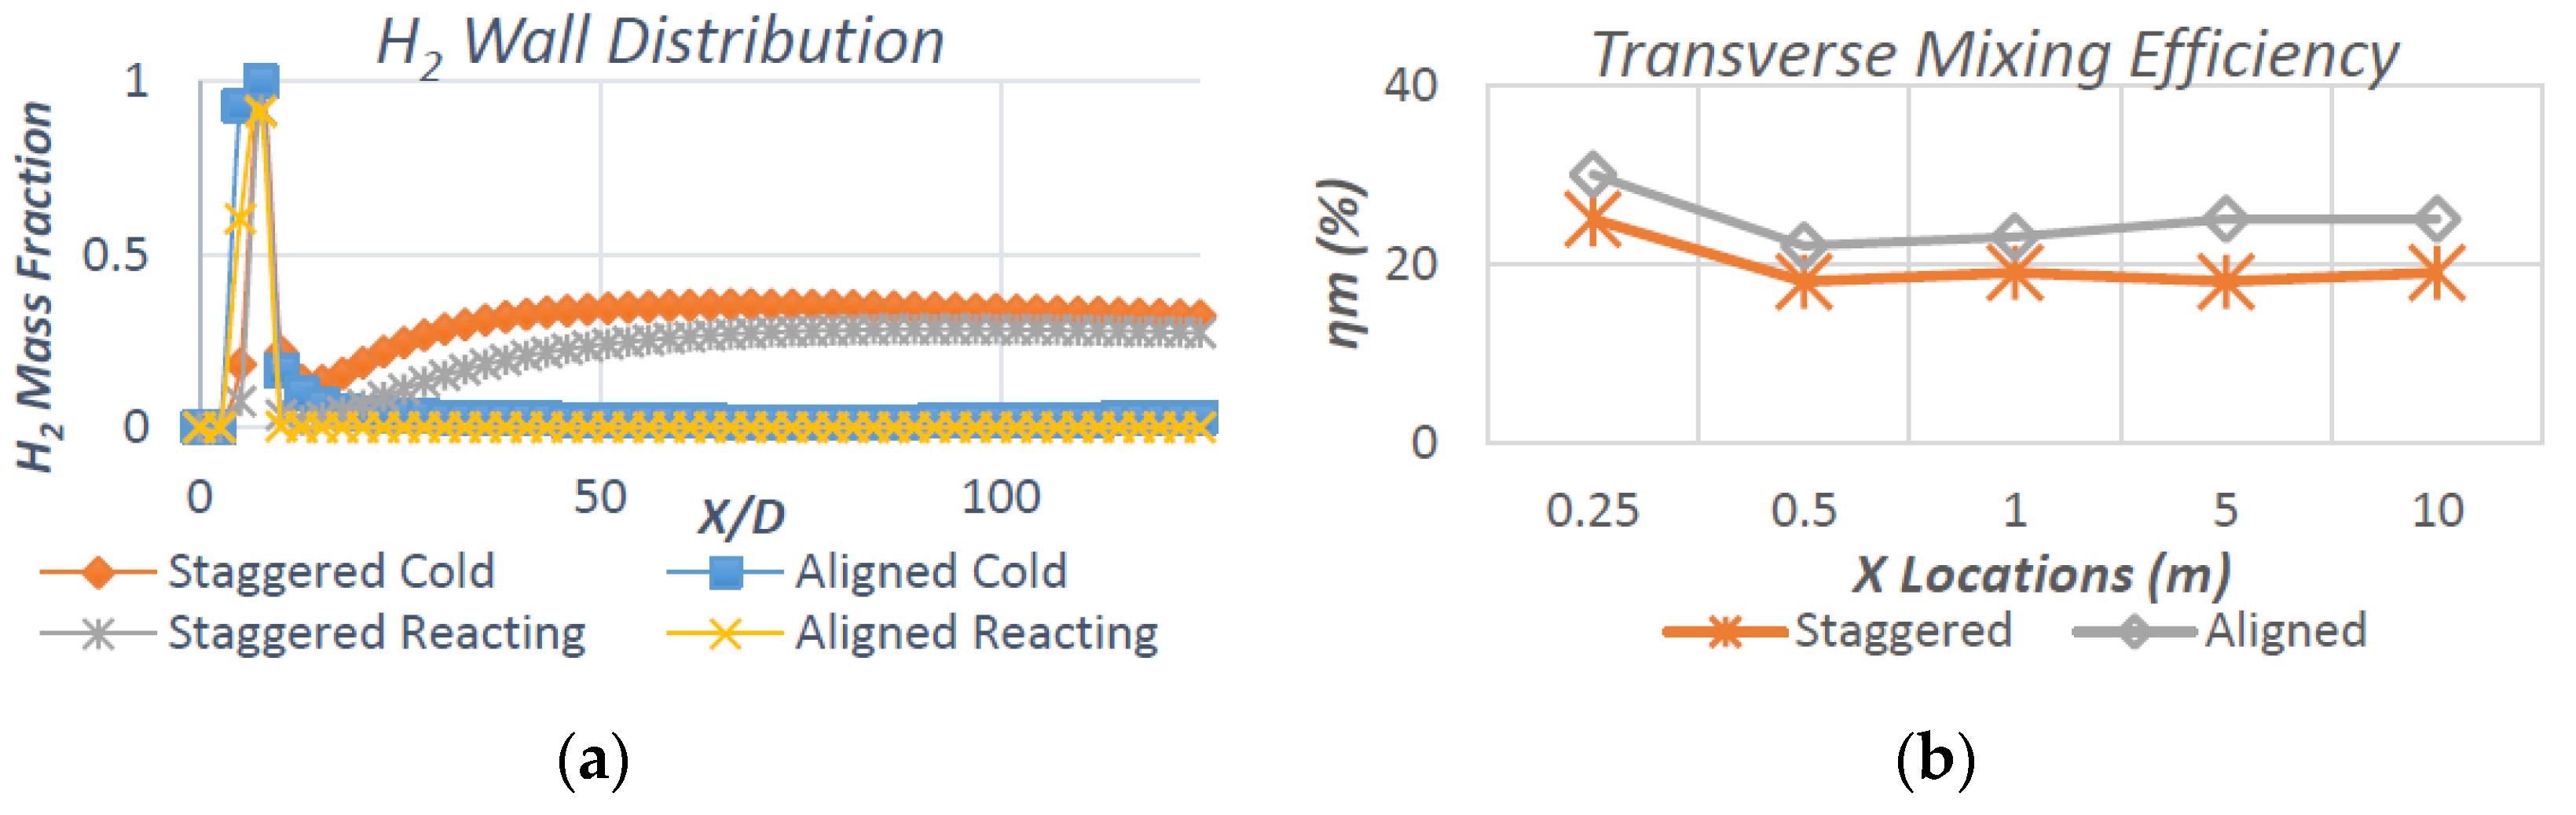
Figure 21.
(a) Staggered jet penetration height; (b) Aligned jet penetration height.

Figure 22.
Flame structure of a single strut combustor in terms of static temperature (K).

Figure 23.
Total pressure loss across a single strut injection combustor.
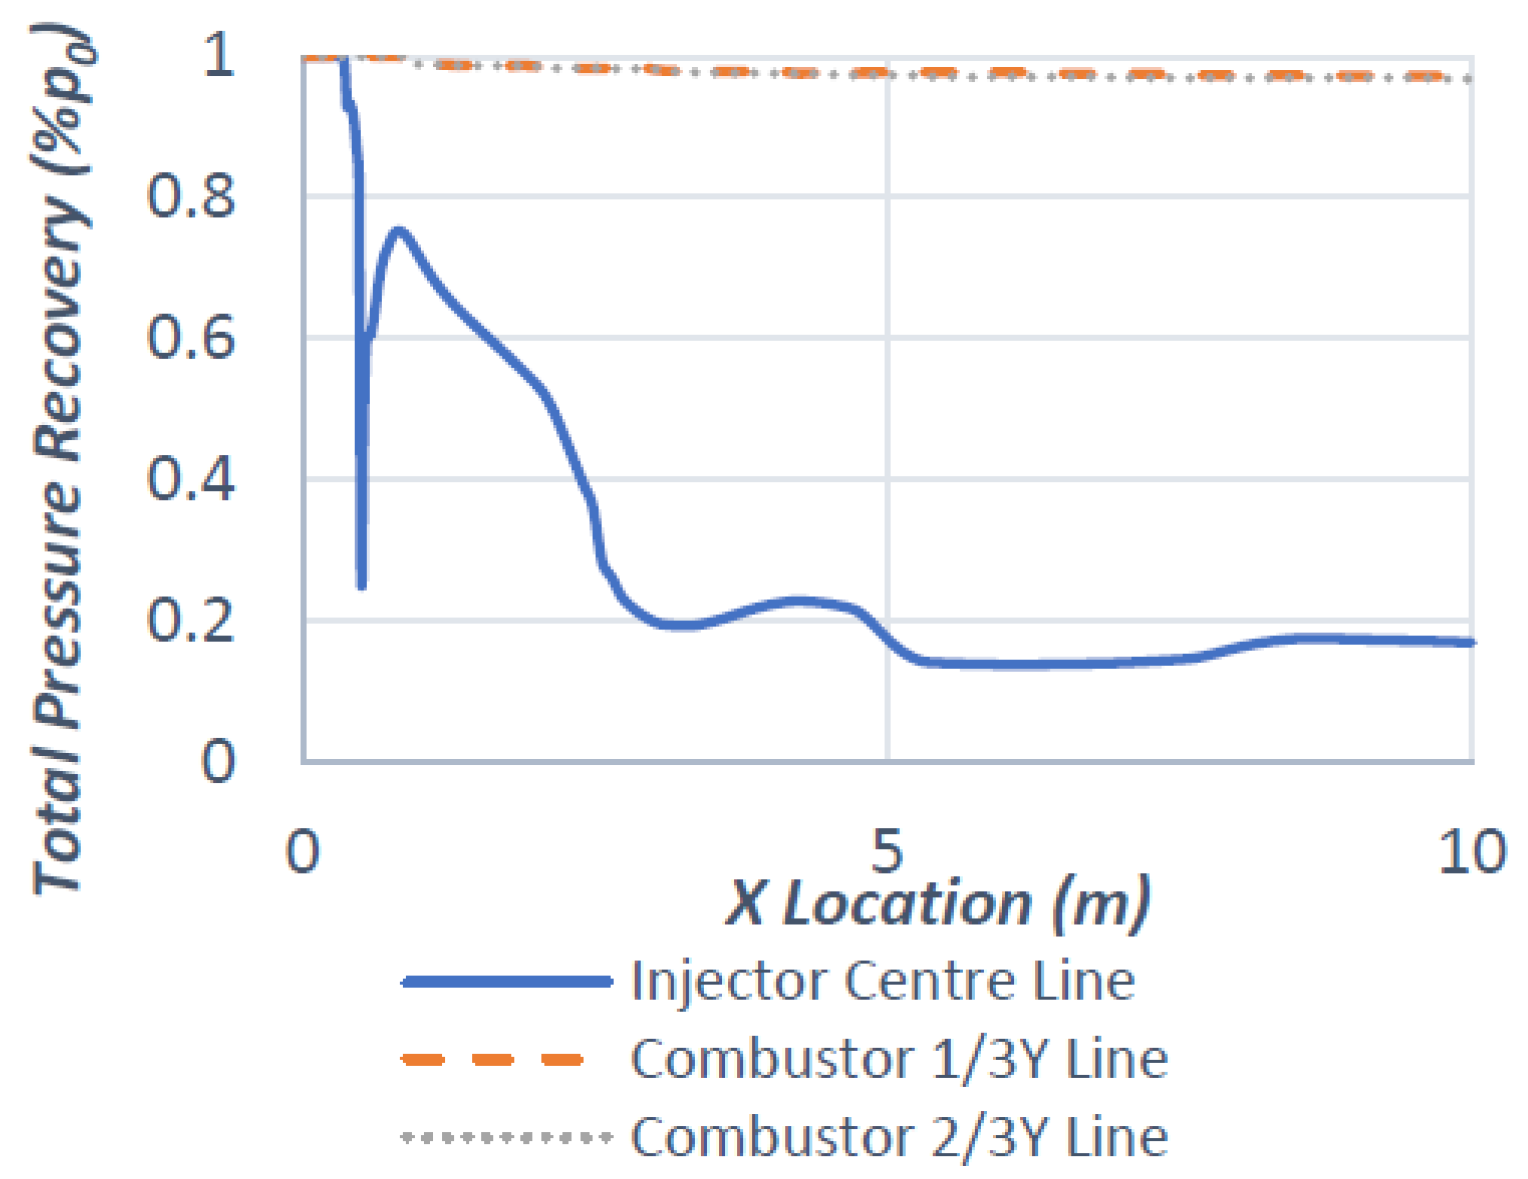
Figure 24.
Shock train visualization for a single strut combustor in terms of density (kg/m3).

Figure 25.
Total pressure loss across a twin strut injection combustor.

Figure 26.
Shock train visualization for twin strut combustor in terms of density (kg/m3).
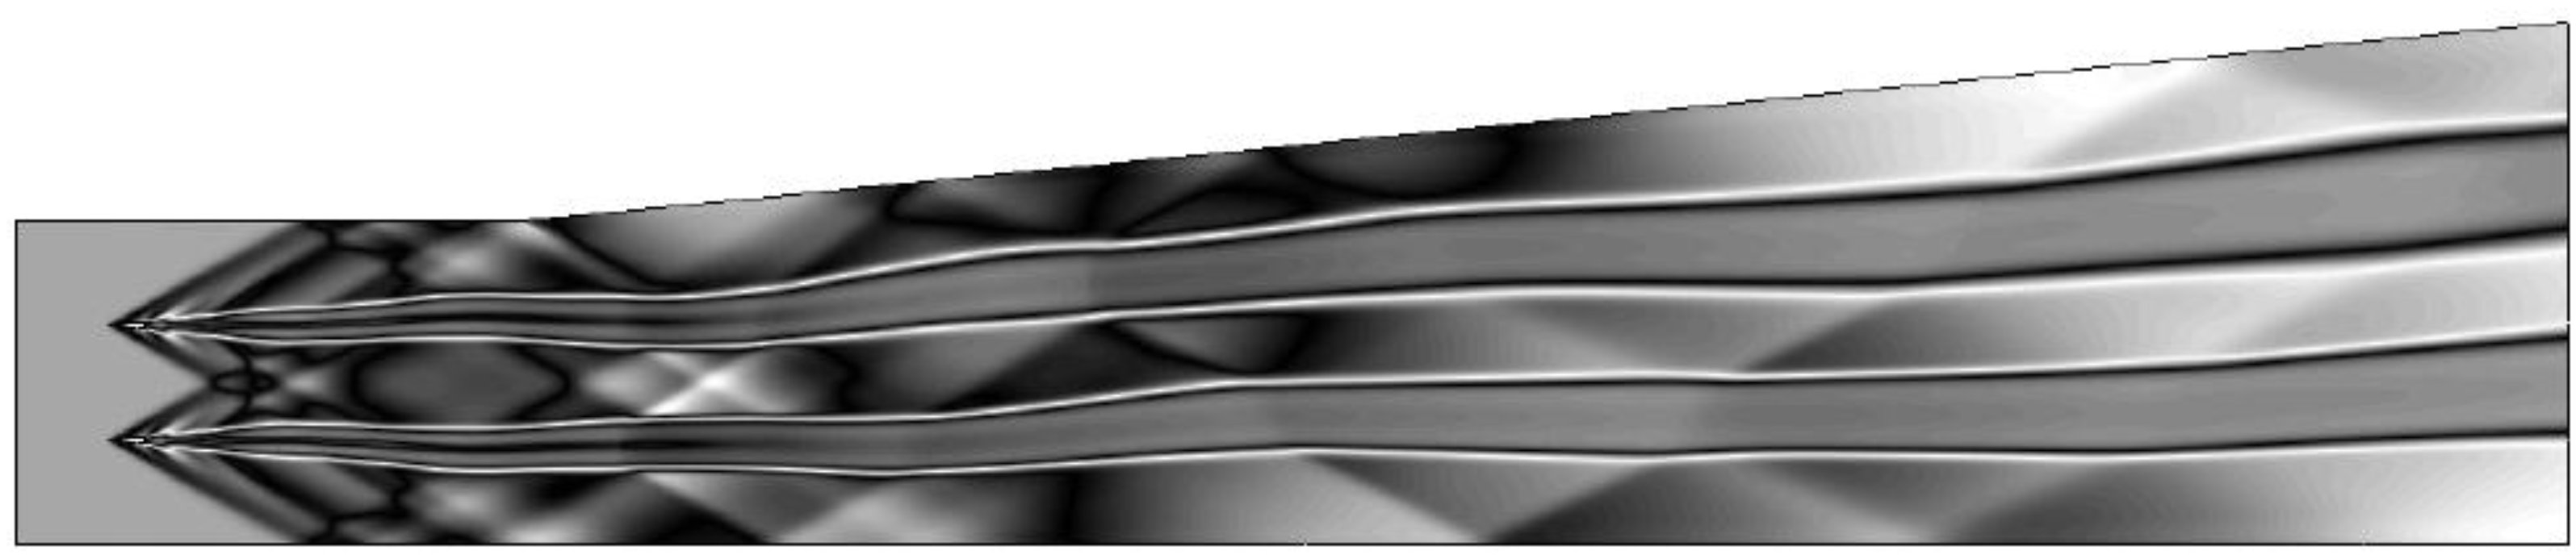
Figure 27.
(a) Combustor total pressure loss; (b) Mass fraction of H2 remaining at outlet.
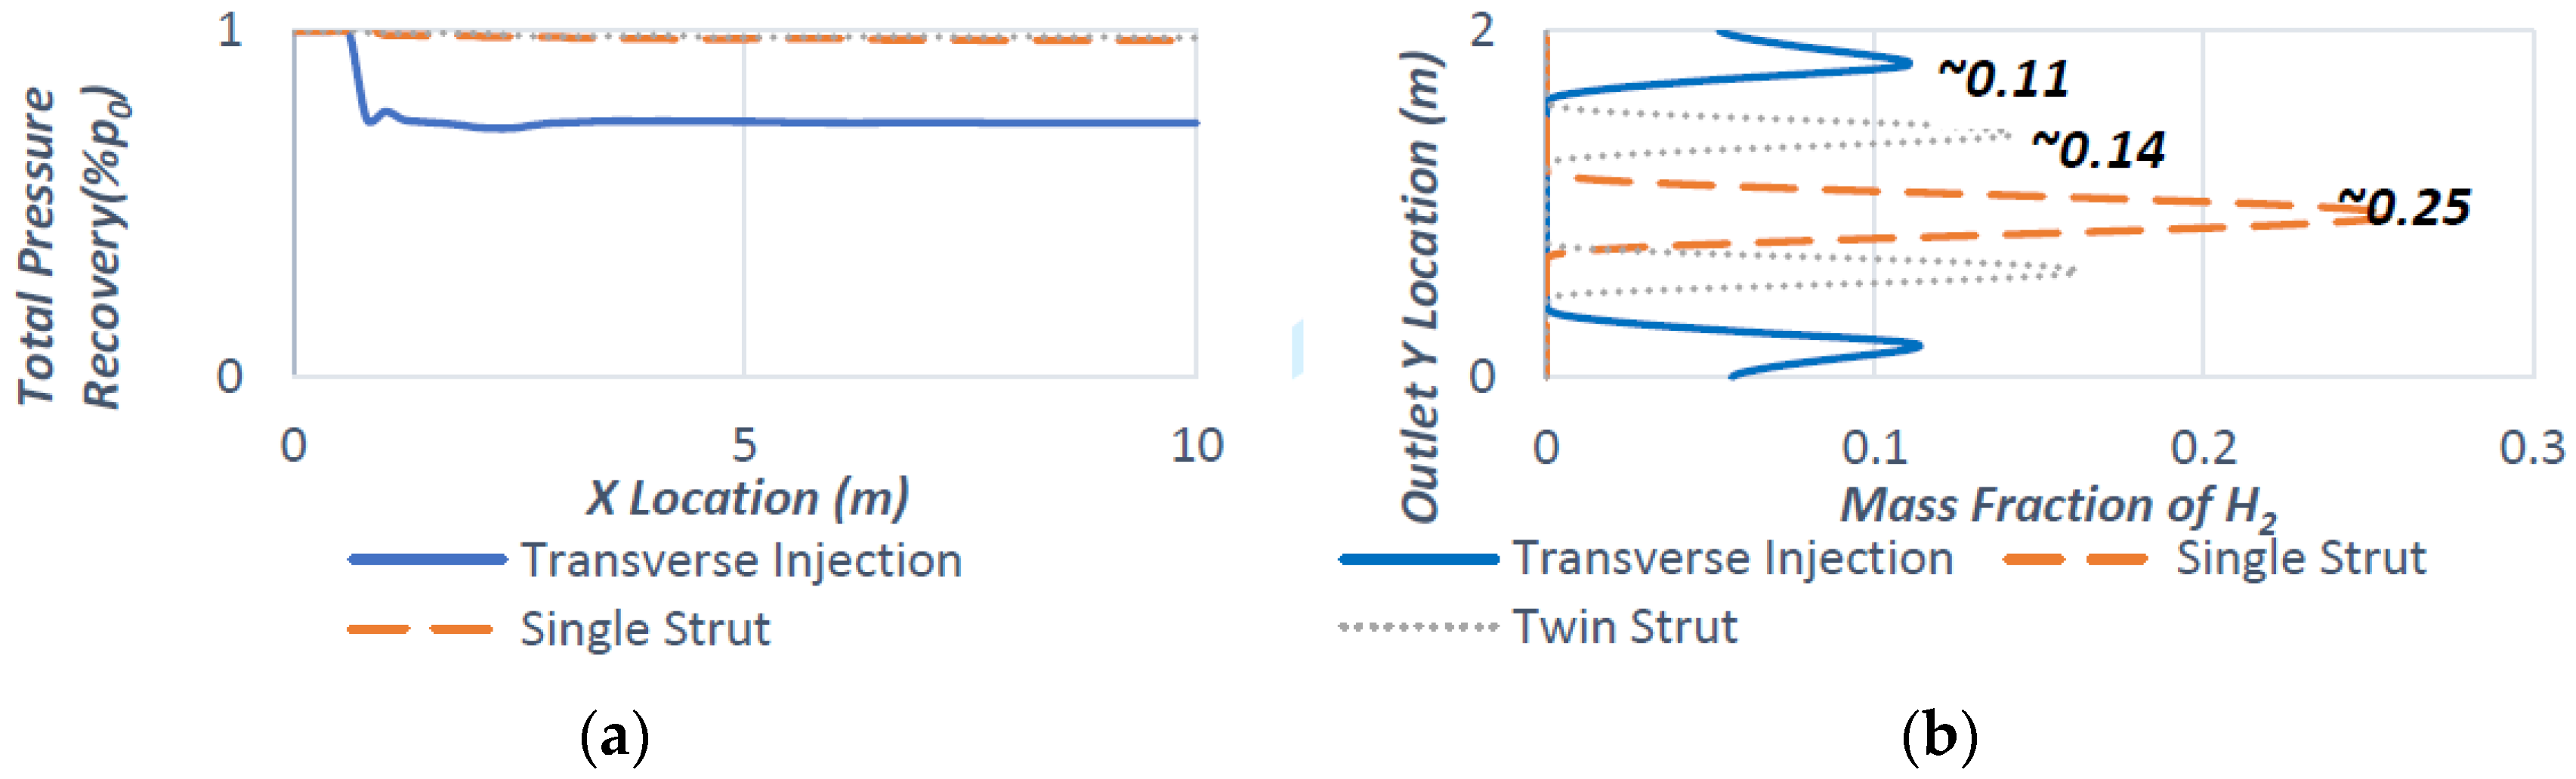
Figure 28.
Velocity (in m/s) contour for transverse injection of a full scramjet engine in 2-D.

Figure 29.
Isolator-injector shockwave interaction.

Figure 30.
Velocity (in m/s) contour for single strut injection of a full scramjet engine in 2-D.

Figure 31.
Isolator-injector shockwave interaction.
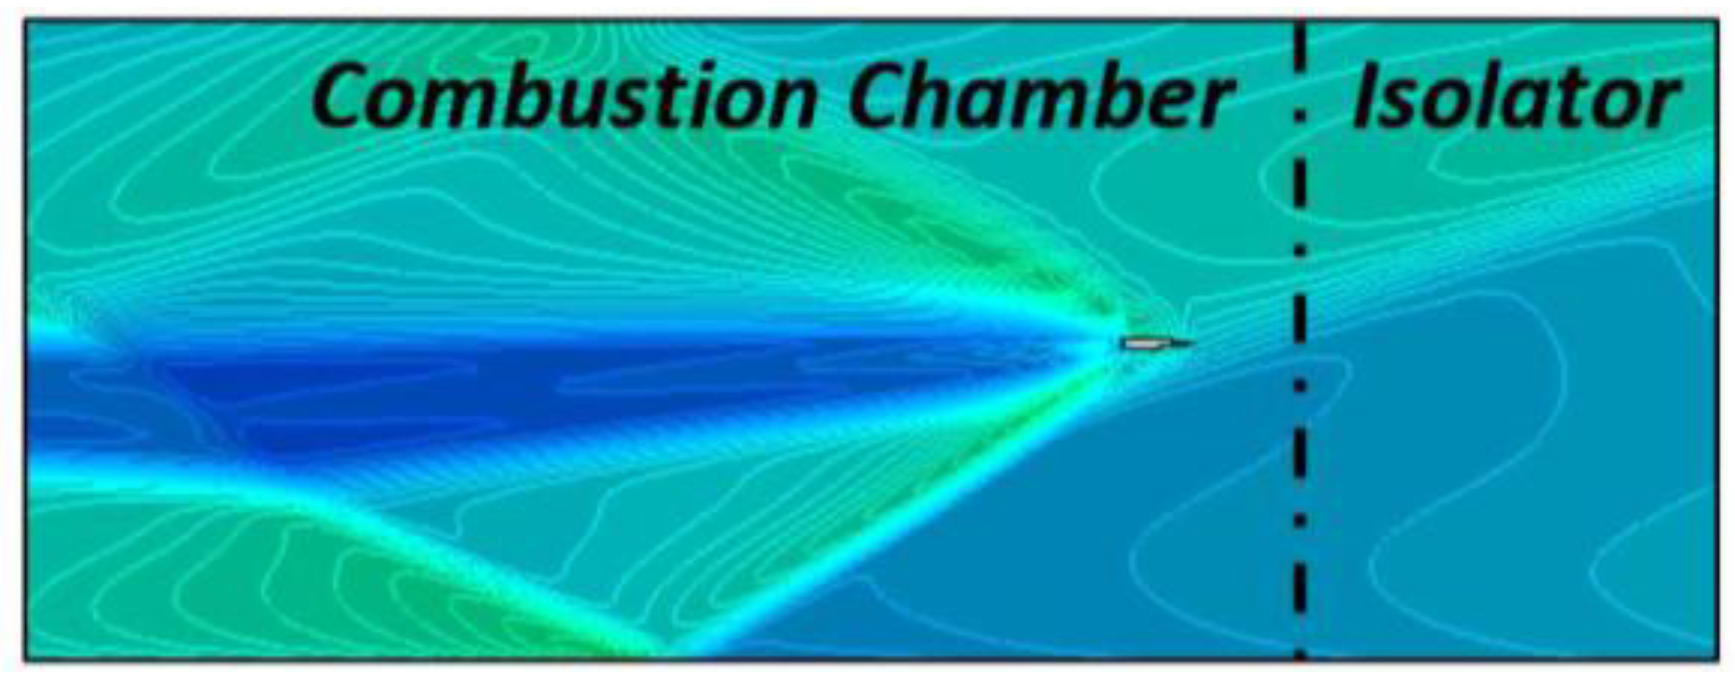
Figure 32.
Velocity ( in m/s) contours for twin strut injection of a full scramjet engine in 2-D.

Figure 33.
(a) Total pressure across combustor; (b) Remaining H2 mass fraction across outlet.
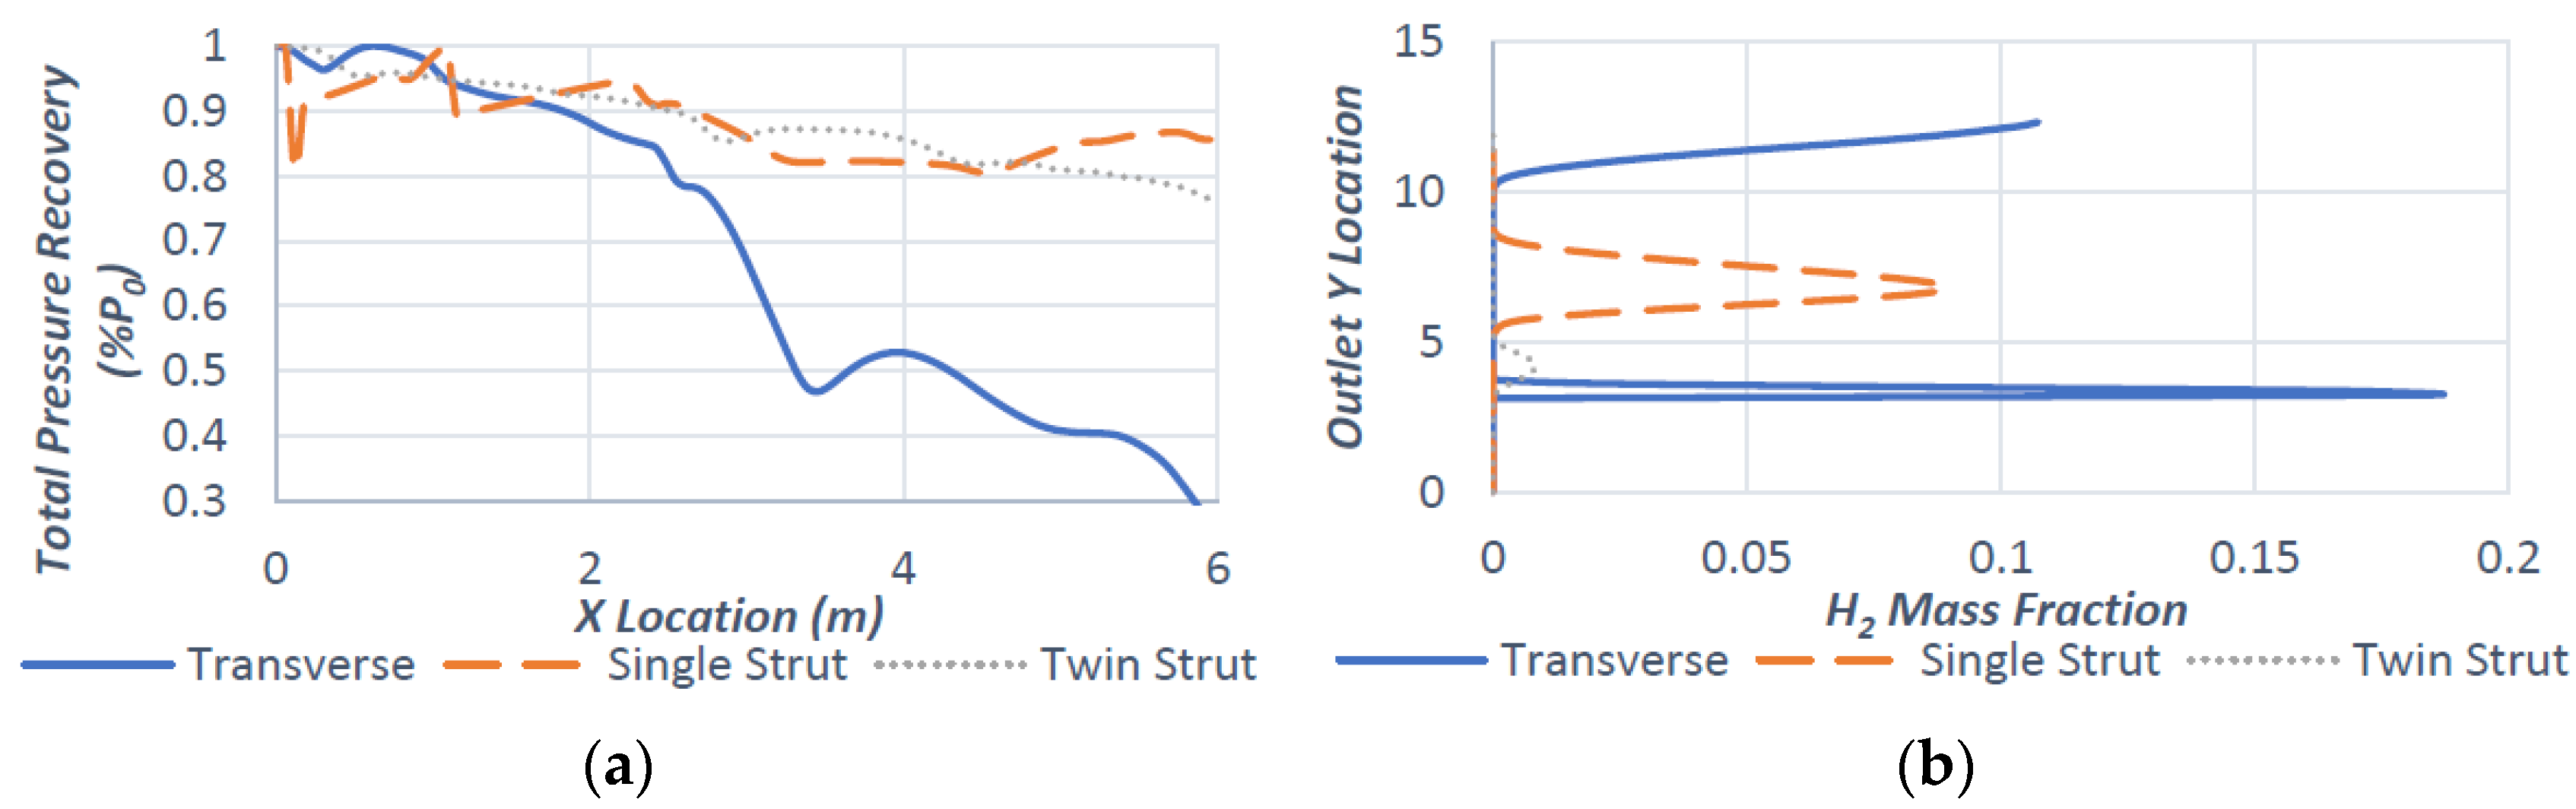
Figure 34.
Integrated 3-D scramjet, temperature (K) contour planes.

Figure 35.
Integrated 3-D scramjet, H2 injector render.

Figure 36.
Integrated 3-D scramjet, velocity contour (m/s) planes.

Table 1.
Concept aircraft fundamental flight profile.
| Phase | Altitude (ft) | Mach | Turbojet | Ramjet | Scramjet | |||||
|---|---|---|---|---|---|---|---|---|---|---|
| Take-off and Initial Climb | 0–1500 | 0–1 | ||||||||
| Climb 1 | 1500–40,000 | 1–2 | ||||||||
| Climb 2 | 40,000–60,000 | 2–4 | ||||||||
| Climb 3 | 60,000–100,000 | 4–7 | ||||||||
| Cruise | 100,000 | 8 | ||||||||
| Single Operation | Dual Operation | No Operation | ||||||||
Table 2.
Scramjet inlet performance data.
| Scramjet Inlet Performance | |
|---|---|
| Length | 4m (Ramps) 10 m (Isolator) |
| Area Ratio | 0.5 |
| Compression Ratio | 50 (Inlet) 26 (Isolator) |
| Exit Mach No. | 2.5 |
Table 3.
Scramjet nozzle performance data.
| Scramjet Nozzle Performance | |
|---|---|
| Length | 30 m |
| Area Ratio | 4.5 |
| Expansion Pressure Ratio | 4.5 |
| Expected Entry Mach No. | 2.5–3.0 |
Table 4.
CFD solution methods and boundary conditions.
| Solution Methods | Boundary Conditions | ||
|---|---|---|---|
| Turbulence Model | k-ε Standard with Compressibility | Combustor Entrance | Pressure Inlet (Fixed Total/Static/Mach Number) |
| Chemistry | Species Transport-Volumetric Finite-Rate Reaction | Combustor Exit | Pressure Outlet |
| Discretisation | Implicit Density-based | Injector | Pressure Inlet (Fixed Total/Static/Mach Number) |
| Courant-Friedrich’s | Solution Steering, FMG Initialisation | Wall | Simulation of Final Injection Isothermal |
Table 5.
Injection system cases investigated.
| Injection System Investigation for Mach 8 Fuelled Scramjet Combustor | |||
|---|---|---|---|
| Validation | Replication of DLR Experimental Testing for CFD Configuration Validation | Case 4 | Performance of Single Strut Injection |
| Case 1 | Performance of Elliptical vs. Polygonal Injector Geometries | Case 5 | Performance of Twin Strut Injection |
| Case 2 | Performance of Staggered vs. Aligned Injector Arrangement | Case 6 | Simulaton of Integrated Scramjet Combustion |
| Case 3 | Performance of Final Transverse Method | Case 7 | Simulation of Final Injection Configuration Scramjet Integration |
| Repeated for both 2-D and 3-D | |||
Table 6.
Injector case performance data.
| TRANSVERSE | |||||
|---|---|---|---|---|---|
| Case | H2 Outlet | Y/D | |||
| Elliptical | / | 0.12 | 0.88 | 0.15 | 5 |
| Polygonal | / | 0.15 | 0.85 | 0.16 | 6 |
| Aligned | 70 | 0.22 | 0.76 | 0.25 | 15 |
| Staggered | 75 | 0.42 | 0.58 | 0.20 | 5 |
| Single Strut | 97 | 0.25 | 0.75 | N/A | |
| Twin Strut | 96 | 0.28 | 0.72 | ||
Table 7.
2-D scramjet performance data for varied injector configurations.
| Case | H2 Outlet | Peak u (m/s) | Peak Thrust (kN) | ||
|---|---|---|---|---|---|
| Transverse | ~67 | 0.26 | 0.74 | ||
| Single Strut | ~87 | 0.08 | 0.92 | ||
| Twin Strut | ~80 | 0.02 | 0.98 | 2850 | 1873 |
Table 8.
3-D scramjet integration final setup.
| Struts | Injectors | Injector Diameter (mm) | Injector Spacing (mm) | Equivalence Ratio | Mesh Elements (mil) |
|---|---|---|---|---|---|
| 2 | 100 | 5 | 50 | 0.6 | 4.5 |
© 2017 by the authors. Licensee MDPI, Basel, Switzerland. This article is an open access article distributed under the terms and conditions of the Creative Commons Attribution (CC BY) license (http://creativecommons.org/licenses/by/4.0/).
Share and Cite
MDPI and ACS Style
Neill, S.M.; Pesyridis, A. Modeling of Supersonic Combustion Systems for Sustained Hypersonic Flight. Energies 2017, 10, 1900. https://doi.org/10.3390/en10111900
AMA Style
Neill SM, Pesyridis A. Modeling of Supersonic Combustion Systems for Sustained Hypersonic Flight. Energies. 2017; 10(11):1900. https://doi.org/10.3390/en10111900
Chicago/Turabian StyleNeill, Stephen M., and Apostolos Pesyridis. 2017. "Modeling of Supersonic Combustion Systems for Sustained Hypersonic Flight" Energies 10, no. 11: 1900. https://doi.org/10.3390/en10111900
Note that from the first issue of 2016, this journal uses article numbers instead of page numbers. See further details here.