Development Patterns of Fractured Water-Conducting Zones in Longwall Mining of Thick Coal Seams—A Case Study on Safe Mining Under the Zhuozhang River


1
School of Energy Science and Engineering, Henan Polytechnic University, Jiaozuo 454000, China
2
The State Key Laboratory of Coal Resources and Safe Mining, China University of Mining and Technology, Xuzhou 221116, China
3
The State Key Laboratory for Geomechanics and Deep Underground Engineering, China University of Mining and Technology, Xuzhou 221116, China
4
Key Laboratory of Deep Coal Resource Mining, School of Mines, China University of Mining and Technology, Xuzhou 221116, China
*
Author to whom correspondence should be addressed.
Energies 2017, 10(11), 1856; https://doi.org/10.3390/en10111856
Submission received: 8 October 2017
/
Revised: 8 November 2017
/
Accepted: 9 November 2017
/
Published: 13 November 2017
Abstract
:The key to the safe mining of thick coal seams under rivers is understanding the development patterns of fractured water-conducting zones (FWCZ) when various mining methods are used. To solve this problem, we employed numerical simulation to investigate FWCZ when slice mining and longwall caving mining are performed. When slice mining was carried out, the maximum height of the FWCZ in the higher slice was 88 m. When the lower slice was mined, the maximum height became 95 m, and the ratio of the fracture height to the coal seam thickness was 15.8. For longwall caving mining, the height of the FWCZ reached 126 m, which was 31 m more than that of slice mining, and the ratio of the fracture height to the coal seam thickness was 21. Through field measurements, the height of the FWCZ during longwall caving mining of thick coal seams was verified. The measured height was 108.87–112.57 m, and the measured ratio was 19.08–19.28. Under the same stratigraphic conditions, changes in the bulking factor and structural stability of key strata were the dominant factors that determined how mining methods affected the height of the FWCZ. These development patterns can provide significant theoretical insights for effectively preventing water hazards on mine roofs.
1. Introduction
In China, conflicts between coal seam mining and environmental auth-conservation have been increasing. Intense coal mining leads to environmental issues, such as ground subsidence, drying up of rivers, and vegetation loss. Meanwhile, coal mining is severely threatened by overlying water bodies such as rivers, lakes, and reservoirs. Sudden floods have occurred in many mine shafts when mining is carried out under water bodies [1,2,3].
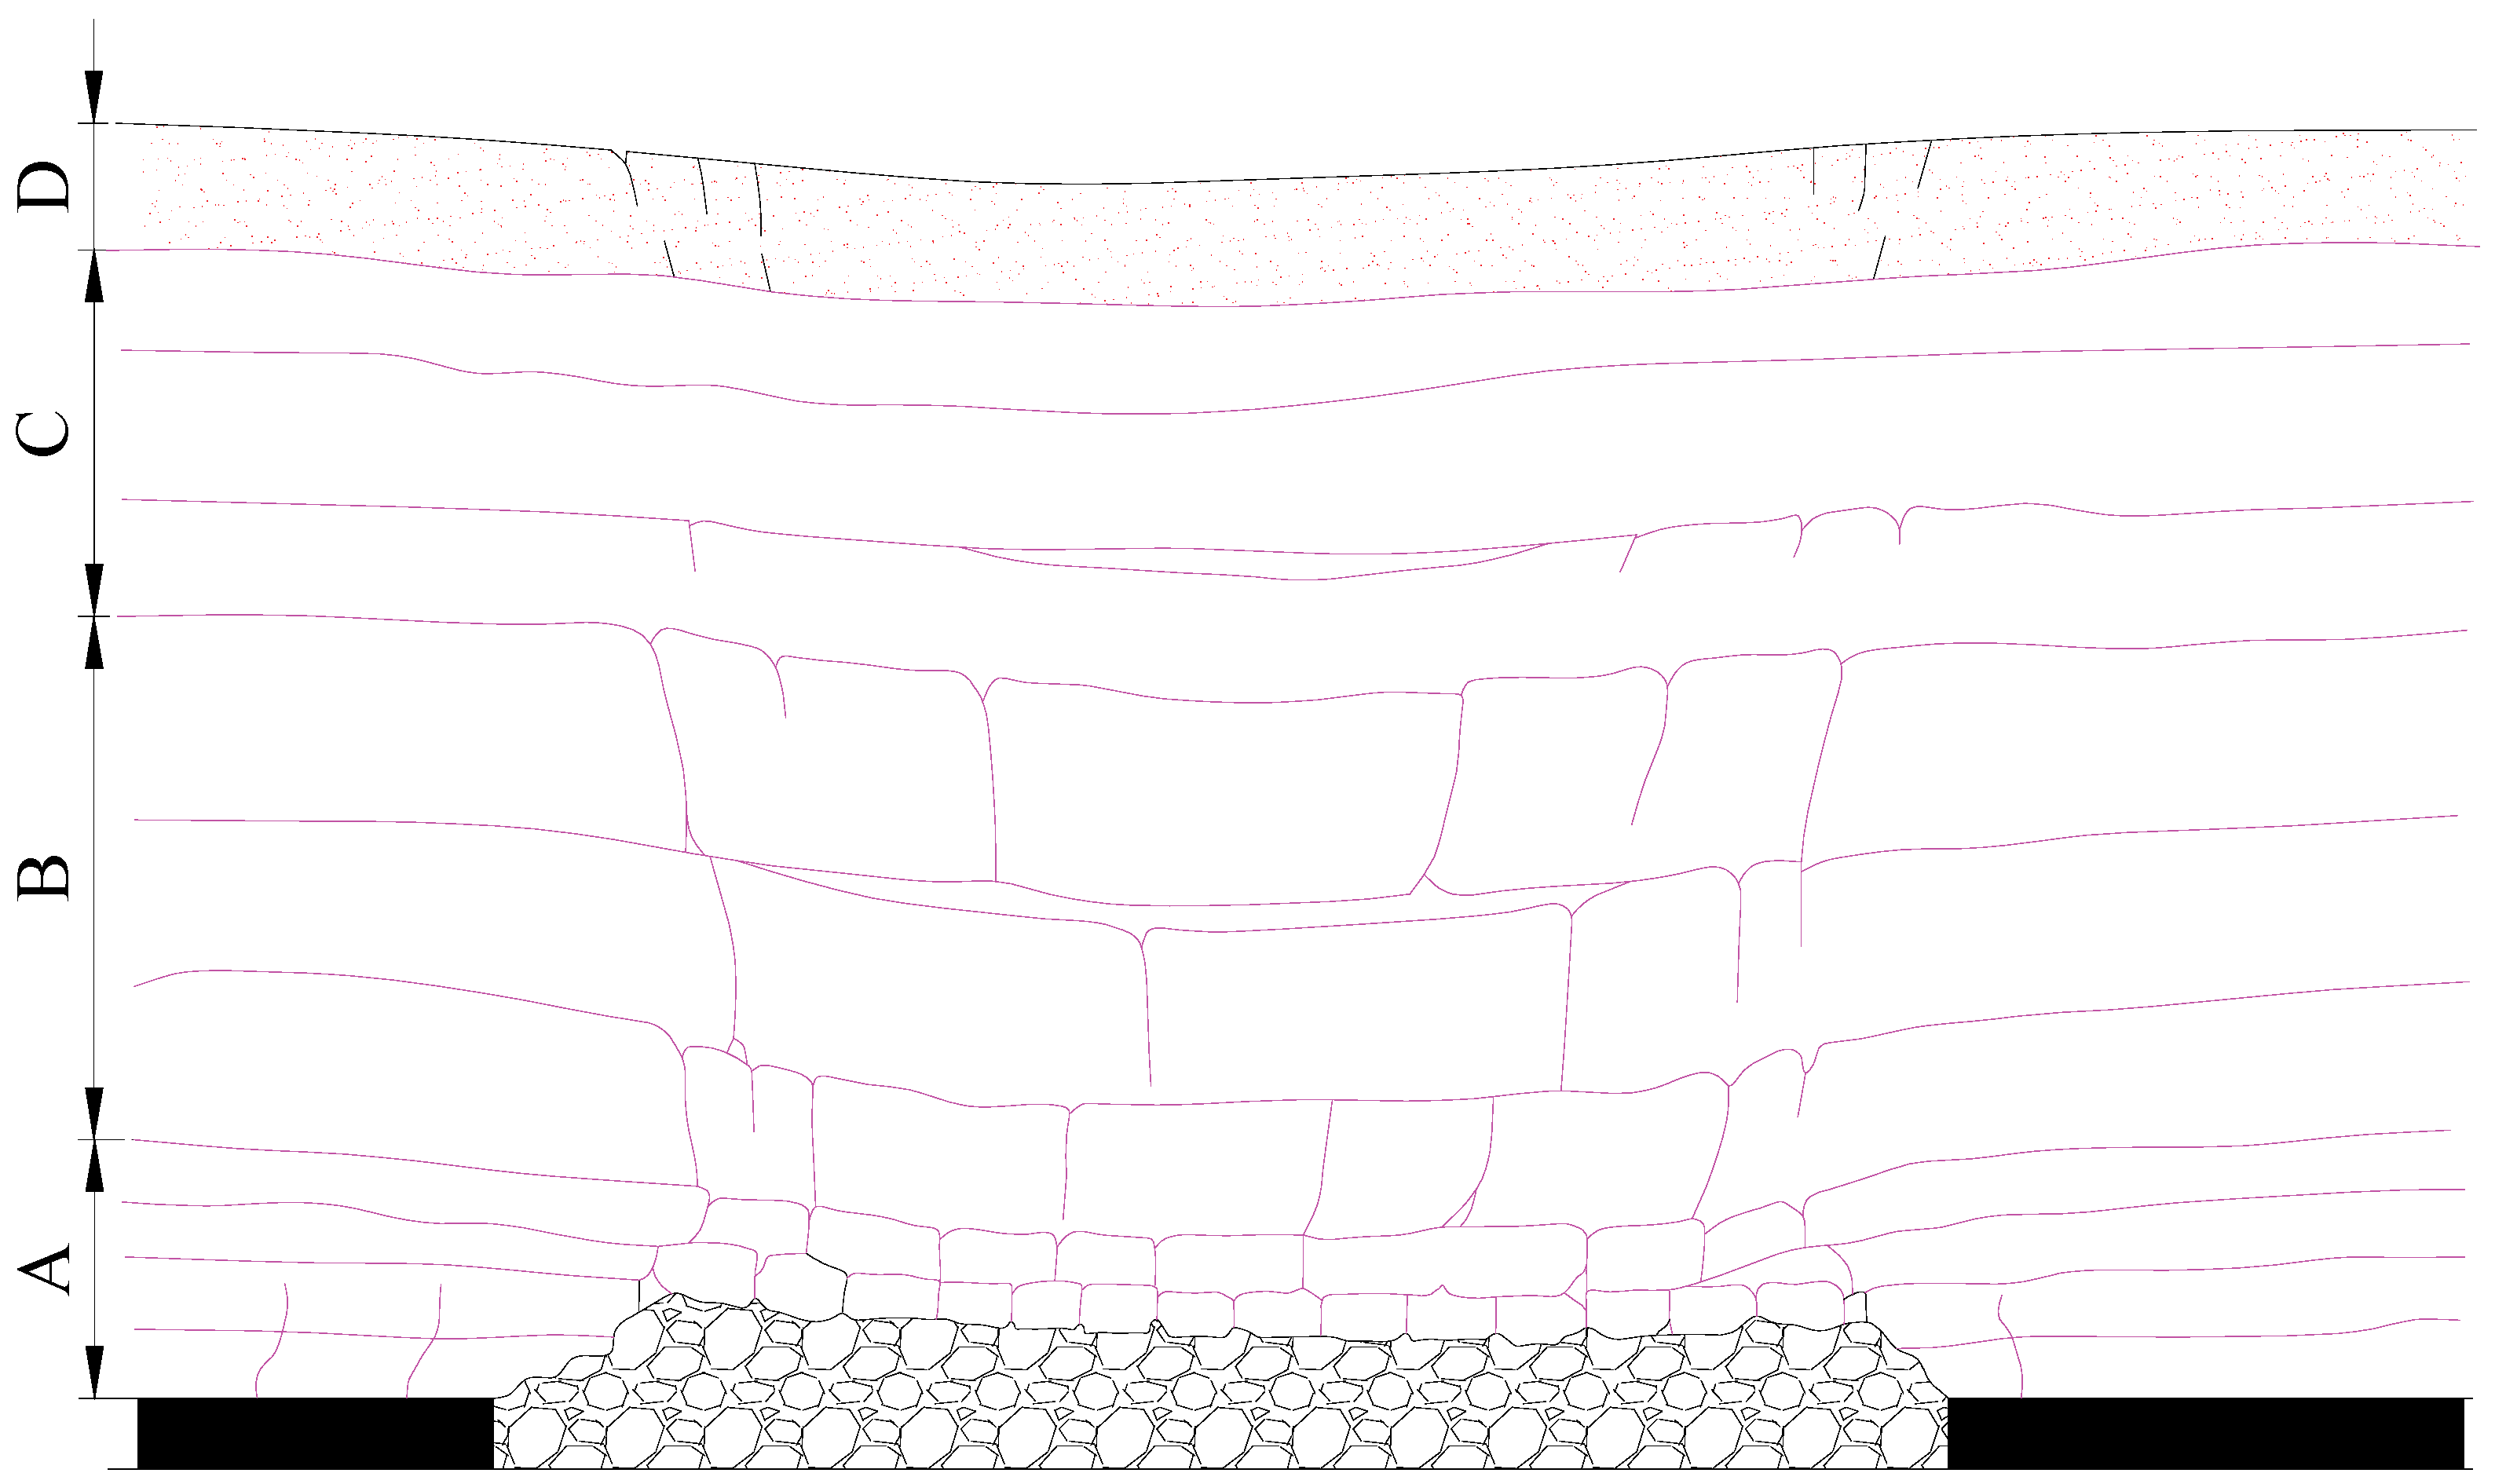
The major focus of coal mining under water bodies is to thoroughly understand the development patterns of FWCZ when various mining methods are performed. Many researchers have been looking into the topic and obtained numerous theoretical results [4,5,6]. Based on the movement characteristics of the overburden during longwall caving mining, Peng divided the overburden movement into four sections from the bottom to the top: caved zone (A), fractured zone (B), continuous deformation zone (C) and topsoil fractured zone (D), as illustrated in Figure 1 [7]. Peng also studied the heights of FWCZ in the Pittsburgh Coal Seam and discovered that when the mining height reaches 2.0–2.4 m, the heights of FWCZ are 99.4–122 m [8]. Dahl and Von Schonfeldt suggested that the range of fractured zone height is 30–60 times the mining height [9].
Palchik has found that there are three distinct zones (caved zone, fracture zone and continuous deformation zone) of disturbance in the overburden strata in response to longwall caving mining. According to Palchik, the thickness of the fractured zone varies greatly from 20 to 100 times the seam thickness. The zone above the fractured zone is the continuous deformation zone where there are no major fractures. The extent of the zones of rock movement over longwall caving mining may vary significantly [10,11,12,13,14].
Through numerous field test measurements, Liu further divided the water flowing fractured zone into three sections: slightly fractured, moderately fractured, and severely fractured zones. Based on different lithologies, mining heights, and dip angles, the author proposed a formula to predict the height of a FWCZ [15], the basic form of which is:
where hf is the maximum height of the FWCZ evaluated from the immediate roof of the seam, in meters (m); M is the thickness of the extracted seam, m; a and b are the coefficients depending upon the strata lithology; and σ is the mean square deviation.
Using numerical calculations and a similar simulation, Hu et al., examined the heights of FWCZ during coal mining under sea with weak overburden. They found that when the mining heights are 3 m and 6 m, the heights of the FWCZ become 26 m and 48.2–55.0 m, respectively [16]. Sun et al. used numerical stimulation and field measurements to determine the heights of FWCZ corresponding to different mining heights, and achieved safe coal mining under the Xiaolangdi Dam [17]. Gao et al., adopted the Trigon approach in the universal distinct element code (UDEC) software to investigate the failure characteristics of the overburden during longwall caving mining [18]. Lai et al., used a borehole TV viewer system, electrical logging, and monitoring of flushing fluid leakage to study development patterns of FWCZ and eventually achieved safe mining under the Xitian river [19]. Liu et al., studied the heights of FWCZ under different working face length and mining thickness by the software of FLAC3D, the results show that the height of FWCZ increases with both the face length and mining thickness [20]. Moreover, Dong et al. [21] and Wu et al. [22] also researched in the FWCZ and forecasted the water inrush disaster from the aspect of hydrogeology.
Owing to continuous advances in mining techniques, longwall top coal caving is widely employed in China [23,24]. It allows the excavation of relatively thick coal seams at one time, so the area of overburden failure substantially increases and FWCZ develop in a manner different from the pattern previously obtained from slice mining. In China, there are no uniform standards to predict heights of FWCZ during longwall top coal mining of thick coal seams. According to the mechanical strength and thickness of the overburden, Qian et al., proposed the key stratum (KS) theory of rock formation control. The authors suggested that some thick hard rock layers play a dominant role in controlling the movement of the overburden over a mining site. The KS theory provides new insights into issues such as water hazard management and ground subsidence [25]. Based on this theory, Mou et al., pointed out that the traditional formula for FWCZ height prediction is only applicable when each mining layer is less than 3 m thick and the cumulative mining height is less than 15 m. The movement of key strata significantly affects the development of FWCZ when the mining height of a single layer exceeds 3 m during thick coal seam exploitation [26]. Xu et al., and Ju et al., examined how the location of overburden’s KS influences the heights of FWCZ, and suggested that the critical distance for water-conducting fracture height calculation is 7–10 times of the mining height at the location of the main KS [27,28]. Consequently, Wang et al., looked into how instability forms of main key strata affect evolution of FWCZ, and pointed out that, if the main key strata undergo sliding, then FWCZ in the upper part of the main key strata will hardly close or disappear after their formation [29].
Although we have recognized that structures of key strata in the overburden control the development of FWCZ, we have to further study their relationships when different caving methods, namely sublevel and longwall caving, are employed under identical geological conditions, such as seam thickness and overburden structures. This research was carried out at the 7802 longwall face of the Wuyang coal mine in the Lu’an mining area under the Zhuozhang River. Based on the KS theory on overburden movement, it looks into the relationships between movement of key strata and heights of FWCZ when different mining methods are employed. It aims to provide theoretical insights for safe mining under the Zhuozhang River.
2. Background
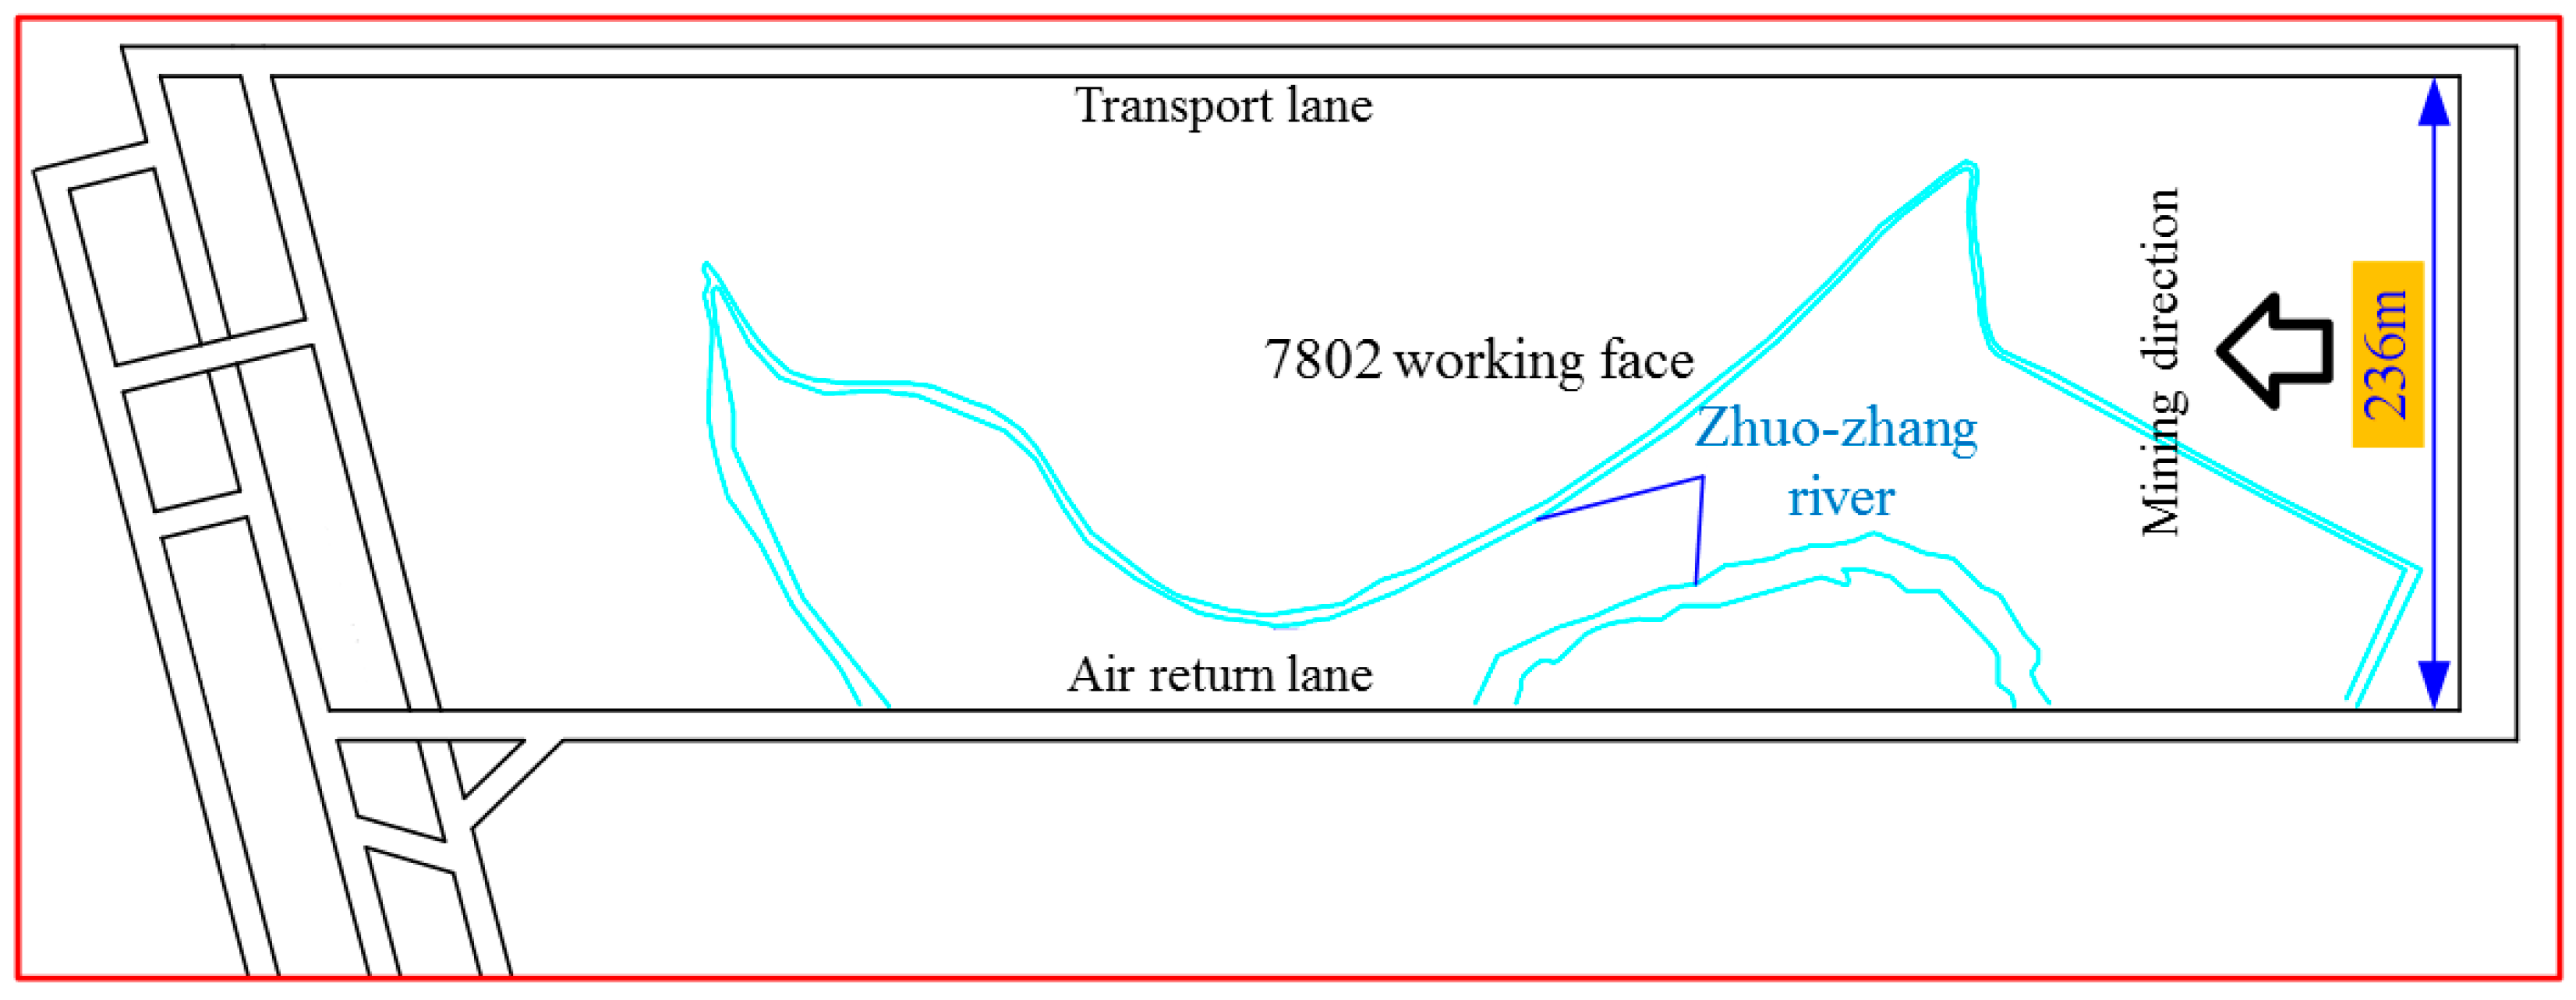
The main coal mining layer of the 7802 face, the Wuyang coal mine, the Lu’an mining area is the 3# coal seam. The coal thickness is 5.5–6.80 m, with an average of around 6 m. The dip angle is 6–8°. The lengths of working face and advancing are 236 m and 839 m, respectively. The immediate roof of the 3# coal seam is middle thick layered black mudstone and sandy mudstone, with an average thickness of 4.30 m. The main roof consists of thick layered medium sandstone, which is 7.50 m thick on average. The immediate floor is black mudstone and sandy mudstone, and it is 8.50 m thick on average. Samples from roof rock layers of the 3# coal seam were tested and the overall strength of overburden was found to be greater than 40 MPa, indicating strong to semi-strong strata. Right above this coalface is the largest river in the region, the Zhuozhang River, as shown in Figure 2, the average discharge of which is 13.28 m3/s. The average vertical distance between the river and the coal seam is approximately 300 m. Because the coal seam is relatively thick, if longwall top-coal caving is employed, a relatively thick coal layer will be excavated at one time, and the area of overburden failure will substantially increase. According to the research by Dahl, the resulting FWCZ may be 180–360 m high [9]. These fractures may be connected to the surface river, leading to sudden floods. Therefore, through different methods of analysis, such as numerical calculations and field measurements, this study examines the development patterns of FWCZ when various caving techniques are employed.
3. Numerical Modeling
3.1. Numerical Calculation Models
3.1.1. Geometric Model
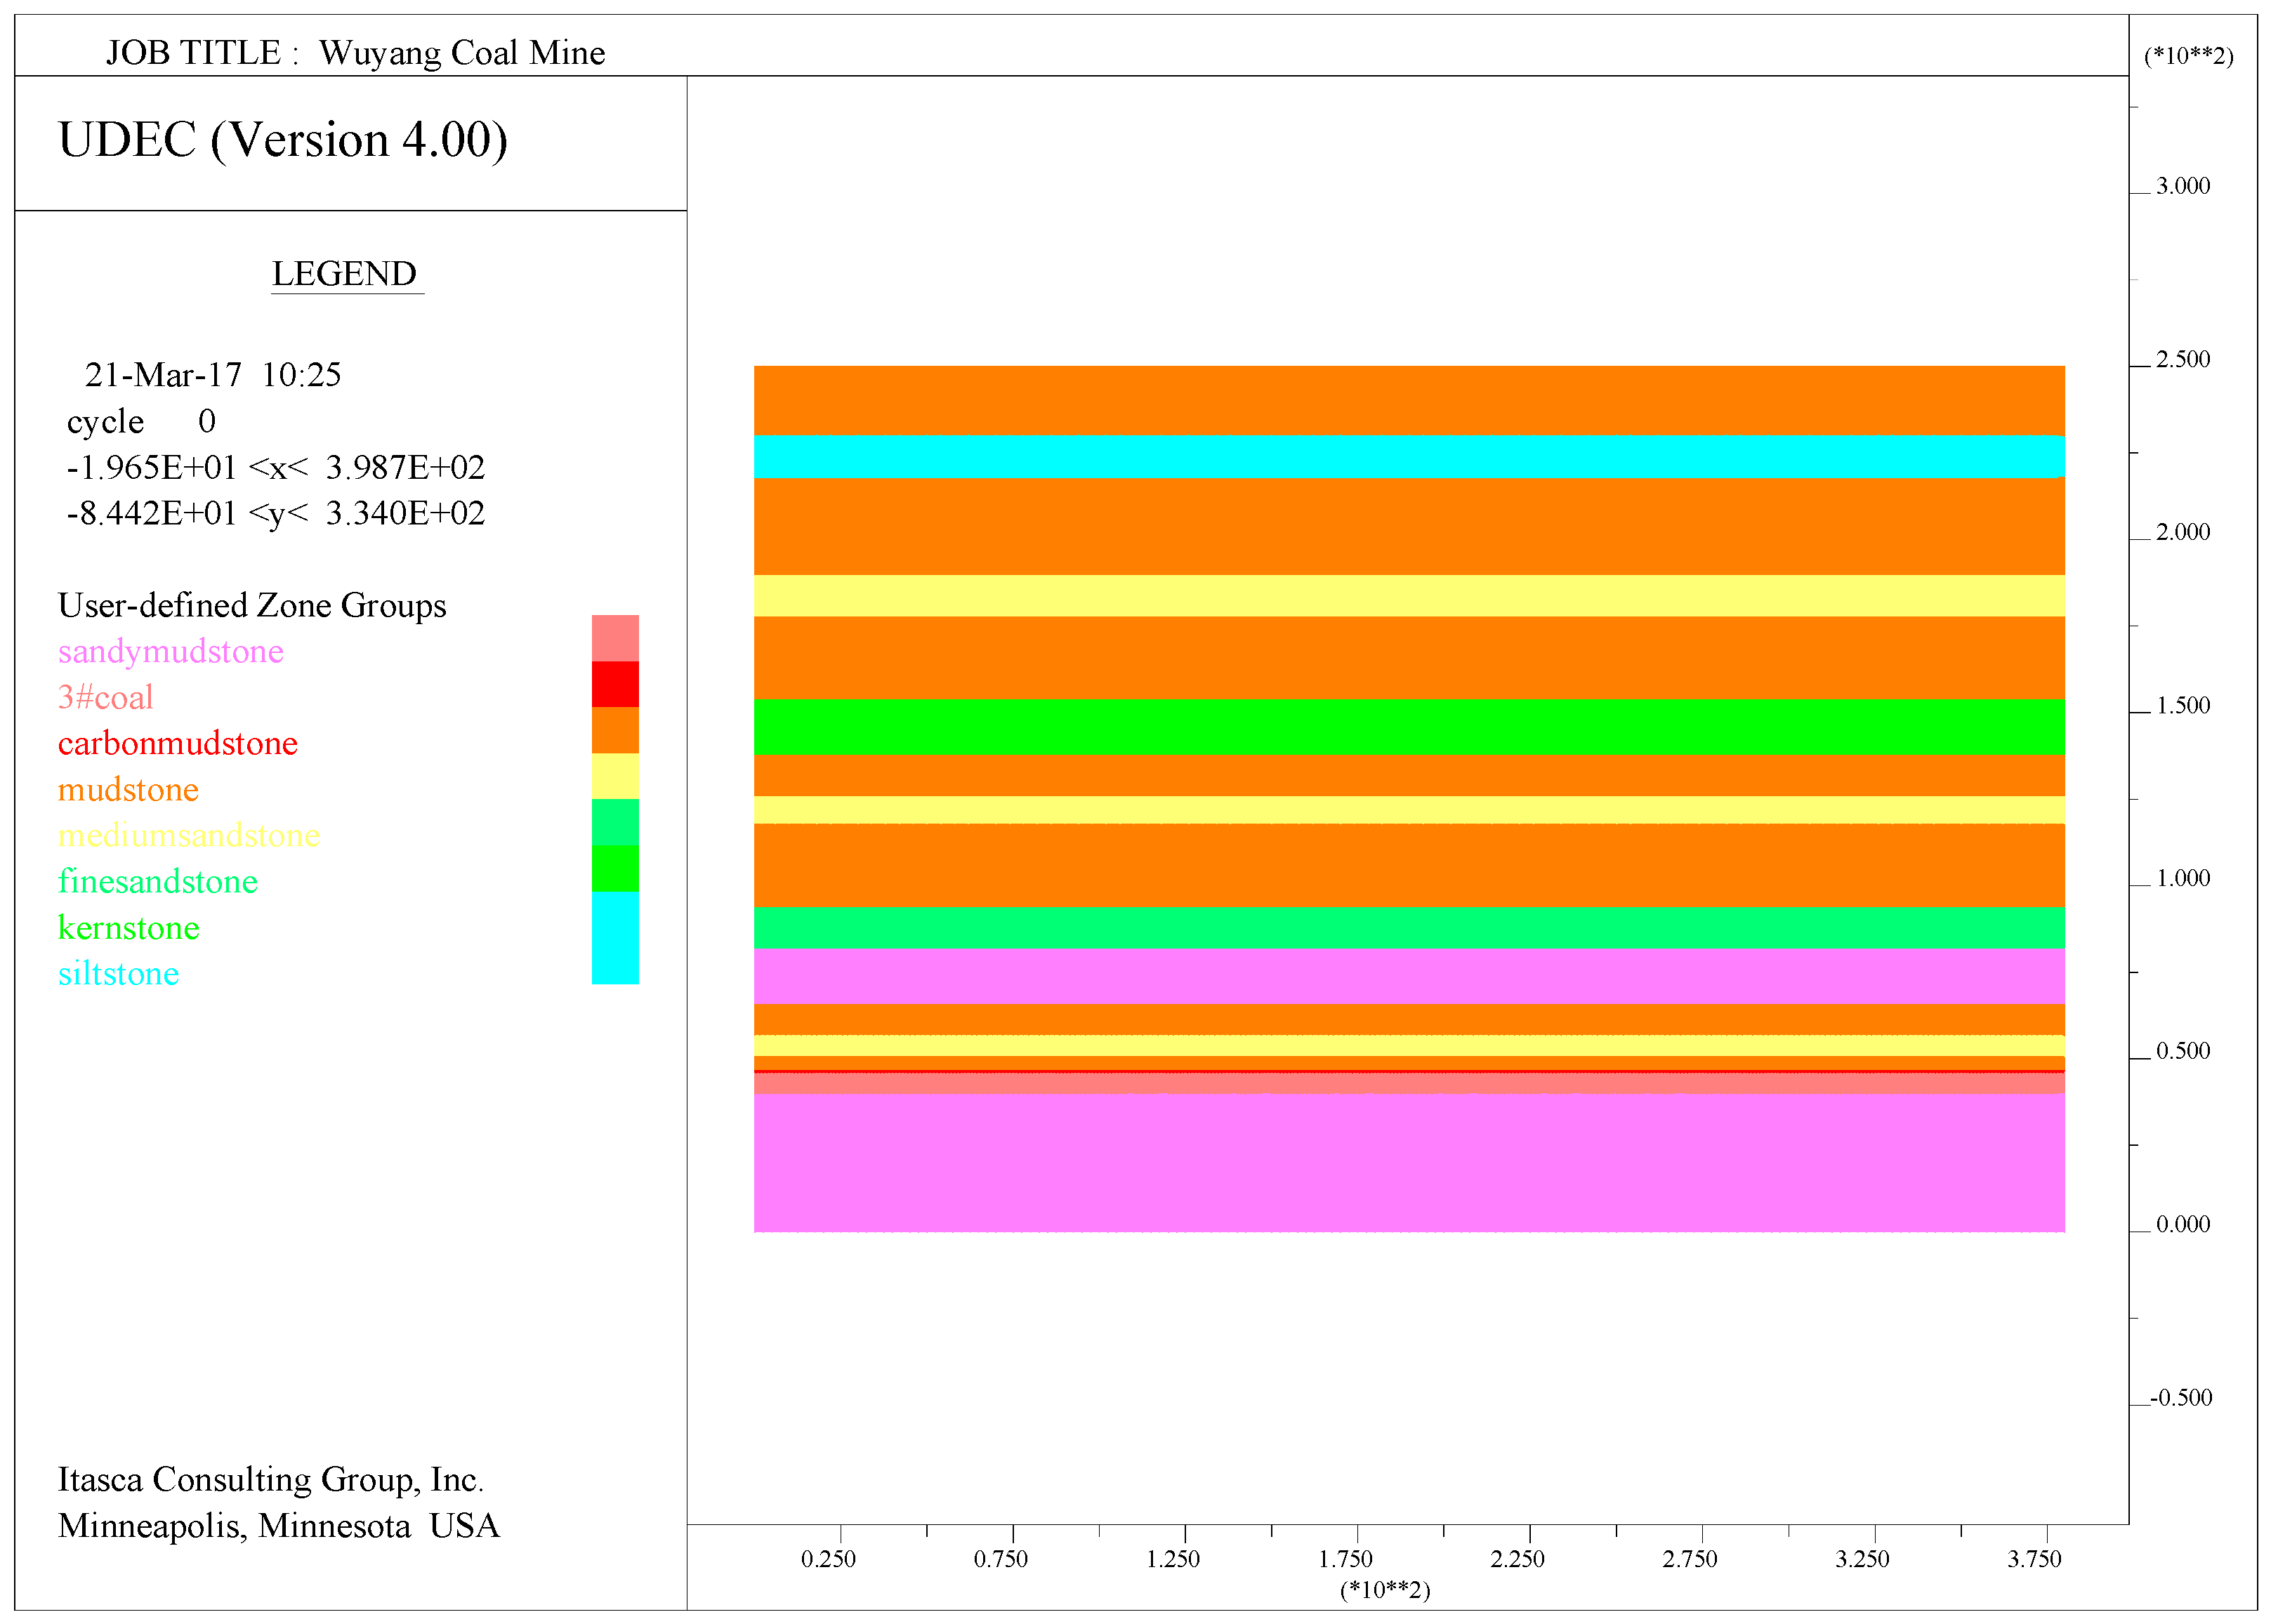
In order to study the development patterns of FWCZ when various caving techniques are employed, according to the geological conditions of the 7802 face in the Wuyang coal mine, a UDEC numerical calculation model is constructed, as shown in Figure 3. According to previous studies on flood patterns in mine shafts, the first weighting during face advancement and the first few weighting cycles are the relatively dangerous regions. In these regions, FWCZ will first develop up to their maximum heights. If they are connected to the overlying water bodies, floods will occur. Hence, both research and computation efficiency requirements are considered to establish a 380 × 250 m (length × height) numerical calculation model with a 6-m coal seam. The geometric model is illustrated in Figure 3, and Table 1 lists the physical and mechanical properties of each stratum. Meanwhile, according to the classification scheme of KS [25], the locations of KS relatively close to the coal seam are recognized and listed in Table 1.
3.1.2. Boundary Conditions
Boundary conditions on displacements are as follows:
① At the left and right boundaries, u = 0, v ≠ 0 (u and v denote displacements at x- and y-directions, respectively). These are one-sided constraint boundaries.
② At the bottom boundary, u = v = 0. It is a full constraint boundary.
Boundary conditions on stresses are as follows:
① The stress on the roof: In the model, strata overlying on the roof up to 204 m are simulated, and the remaining strata are added to the top of the model by equivalent uniform distributed loading. The loading is p = γh = 2600 × 9.8 × (300 − 204) = 2.45 MPa.
② The horizontal stress of the model was automatically calculated by UDEC.
3.1.3. Excavation Processes
To avoid the effects on calculation results by model boundary deformation during excavation, a 100-m coal pillar is placed at each side of the model. Excavation is carried out for 5 m each time, and the model calculation ended when the cumulative excavation reaches 180 m. When the maximal unbalanced force calculated in each step reaches 1e-5, the model proceeds to the next step.
3.1.4. Numerical Calculation Scheme
Currently, slice mining and longwall caving are two commonly employed techniques in mining thick coal seam longwall faces. Hence, the numerical calculation schemes are as follows. ① The thick coal seam is divided into upper and lower mining slice. The excavation thickness of each is 3.0 m. The upper slice is first mined, followed by the lower one. The development patterns of FWCZ during slice mining are studied. ② Longwall top coal caving is used, and a 6.0-m coal seam is mined at one time. The mechanism through which FWCZ develop during longwall caving is investigated.
3.1.5. Classification Criteria for the Water Flowing Fractured Zone
The model assumes that rock failures follow the Mohr–Coulomb failure criterion. As rocks are brittle, they become plastic once failures occur. Brittle fractures generally take place. The integrity of the stratum is severely damaged. The pre-existing fractures in the stratum further propagate and new fractures developed. These fractures become water-conducting channels. Therefore, the extent of plastic failures is usually one of the primary criterions used to classify FWCZ. According to the research by Gui et al. [30], after excavation, the strata in fractured zones often experience plastic failures, while those overlying fracture zones are elastic. At the edges of caving zones, owing to the coal pillars, rock masses are under tensile and compressive stresses, so fractures can fully develop, and they reach their maximum heights here.
It is worth noting that, according to the standards for plastic zone indices of block failures in UDEC, initial plastic flow often occurs at the beginning of a simulation, but subsequent stress redistribution unloads the yielding elements so that their stresses no longer satisfy the yield criterion (“yielded in past”). Only the actively yielding elements (“at yield surface”) are important for the detection of a failure mechanism. In the model, “×”and “*”denote status “yielded in past” and “at yield surface”, respectively.
3.2. Simulation Results and Analysis
3.2.1. Development Patterns of FWCZ during Slice Mining
When the upper slice is mined up to 30 m, as shown in Figure 4a, fractures in the overburden reach the main roof stratum (KS IV) and are in the form of a 20-m-high trapezoid. At the same time, at the sides of the failed strata, plastic deformation takes place in some strata, forming some fractures. This is because the strata reach the critical state of plastic failures at these points and experience plastic formation. These areas, however, are not connected to the lower continuous plastic deformation zone, so they will not lead to effective water-conducting channels. They are not counted as the region of the water flowing fractured zone.
When excavation in the upper slice reaches 120 m, overburden failures occur at the bottom of KS II. Figure 4b shows that KS II is yielded in past whereas some localities show tensile failure, demonstrating that the KS can still effectively block the water from above. Some localities in the mudstone in the upper part of KS II are yielded in past because they attain the critical state of plastic failures during model calculation, but regain their water-blocking properties after the model stabilizes. The mudstone in the lower part of KS II is at yield surface, indicating that FWCZ develop up to 88 m from the coal seam roof. Their development peaks. The fractures at the two mining boundaries are higher than those in the middle, resulting in a saddle-shaped pattern. This is consistent with the field measurements in previous studies [15].
When the upper slice is excavated up to 180 m, as illustrated in Figure 4c, the caving zone in the gob is compacted gradually, and the strata originally at yield surface are gradually compacted also and change to be yielded in past. Tensile failures take place only at some individual localities. This suggests that these strata gradually regain their water-blocking properties. The heights of fractures in the middle of the caving zone substantially reduce. The strata at the sides of the face are still at yield surface, and their roof boundary is 88 m from the coal seam roof.
The development patterns of FWCZ in the lower mining slice are similar to those in its upper counterpart. When the lower layer is mined up to 30 m, as shown in Figure 5a, the strata at the outer open-off cut sides are again at yield surface, and their heights rapidly recover back to 84 m. This indicates that under repeated mining conditions, strata are affected by a single excavation episode, and their strength reduces correspondingly. The heights of FWCZ increase sharply in this region.
From Figure 5b, when the excavation reaches 90 m in the lower slice, the lower middle part of KS II experiences tensile failures. It is connected to the failure zone in the mudstone in the bottom part, forming effective water-conducting channels. Therefore, it is determined that the FWCZ have developed into KS II, with heights of 95 m. At this point, the fractures have developed to their maximum heights. Nevertheless, owing to the small rotational deformation space in the bottom part of KS II, the KS maintains its integrity, and the fractures do not propagate further into the mudstone in the upper part.
When the lower layer is excavated up to 180 m, the middle part of the caving zone is gradually compacted, and the overlying overburden retrieves its water-blocking property, as illustrated in Figure 5c. At the open-off cut sides and the stop line of the model, the FWCZ reduce, to a certain extent. Although tensile failures take place in some strata of the KS II, they are not connected to the failure zone in the bottom mudstone. Hence, the FWCZ stop developing at 84 m.
3.2.2. Development Patterns of FWCZ during Longwall Caving
When the coal seam is mined up to 30 m by longwall caving, as shown in Figure 6a, the main roof stratum (KS IV) experiences the first fracturing, and the fractures are in the form of a 25-m-high trapezoid. The height is similar to that when the upper slice is mined during slice mining.
From Figure 6b, when the excavation reaches 110 m, KS II undergoes tensile failure, and the overlying mudstone experiences failures. The FWCZ attain their maximum heights by developing up to 126 m from the coal seam.
When the coal seam is excavated up to 180 m, as illustrated in Figure 6c, the development patterns of FWCZ are identical to those observed during slice mining. The middle part of the caving zone is compacted. The FWCZ in the overburden close gradually and the overburden partially regains its water-blocking property. The FWCZ at the open-off cut sides and the stop line are relatively high and become permanent water flowing fractured zones. They become stable in the mudstone in the top part of KS II at 126 m.
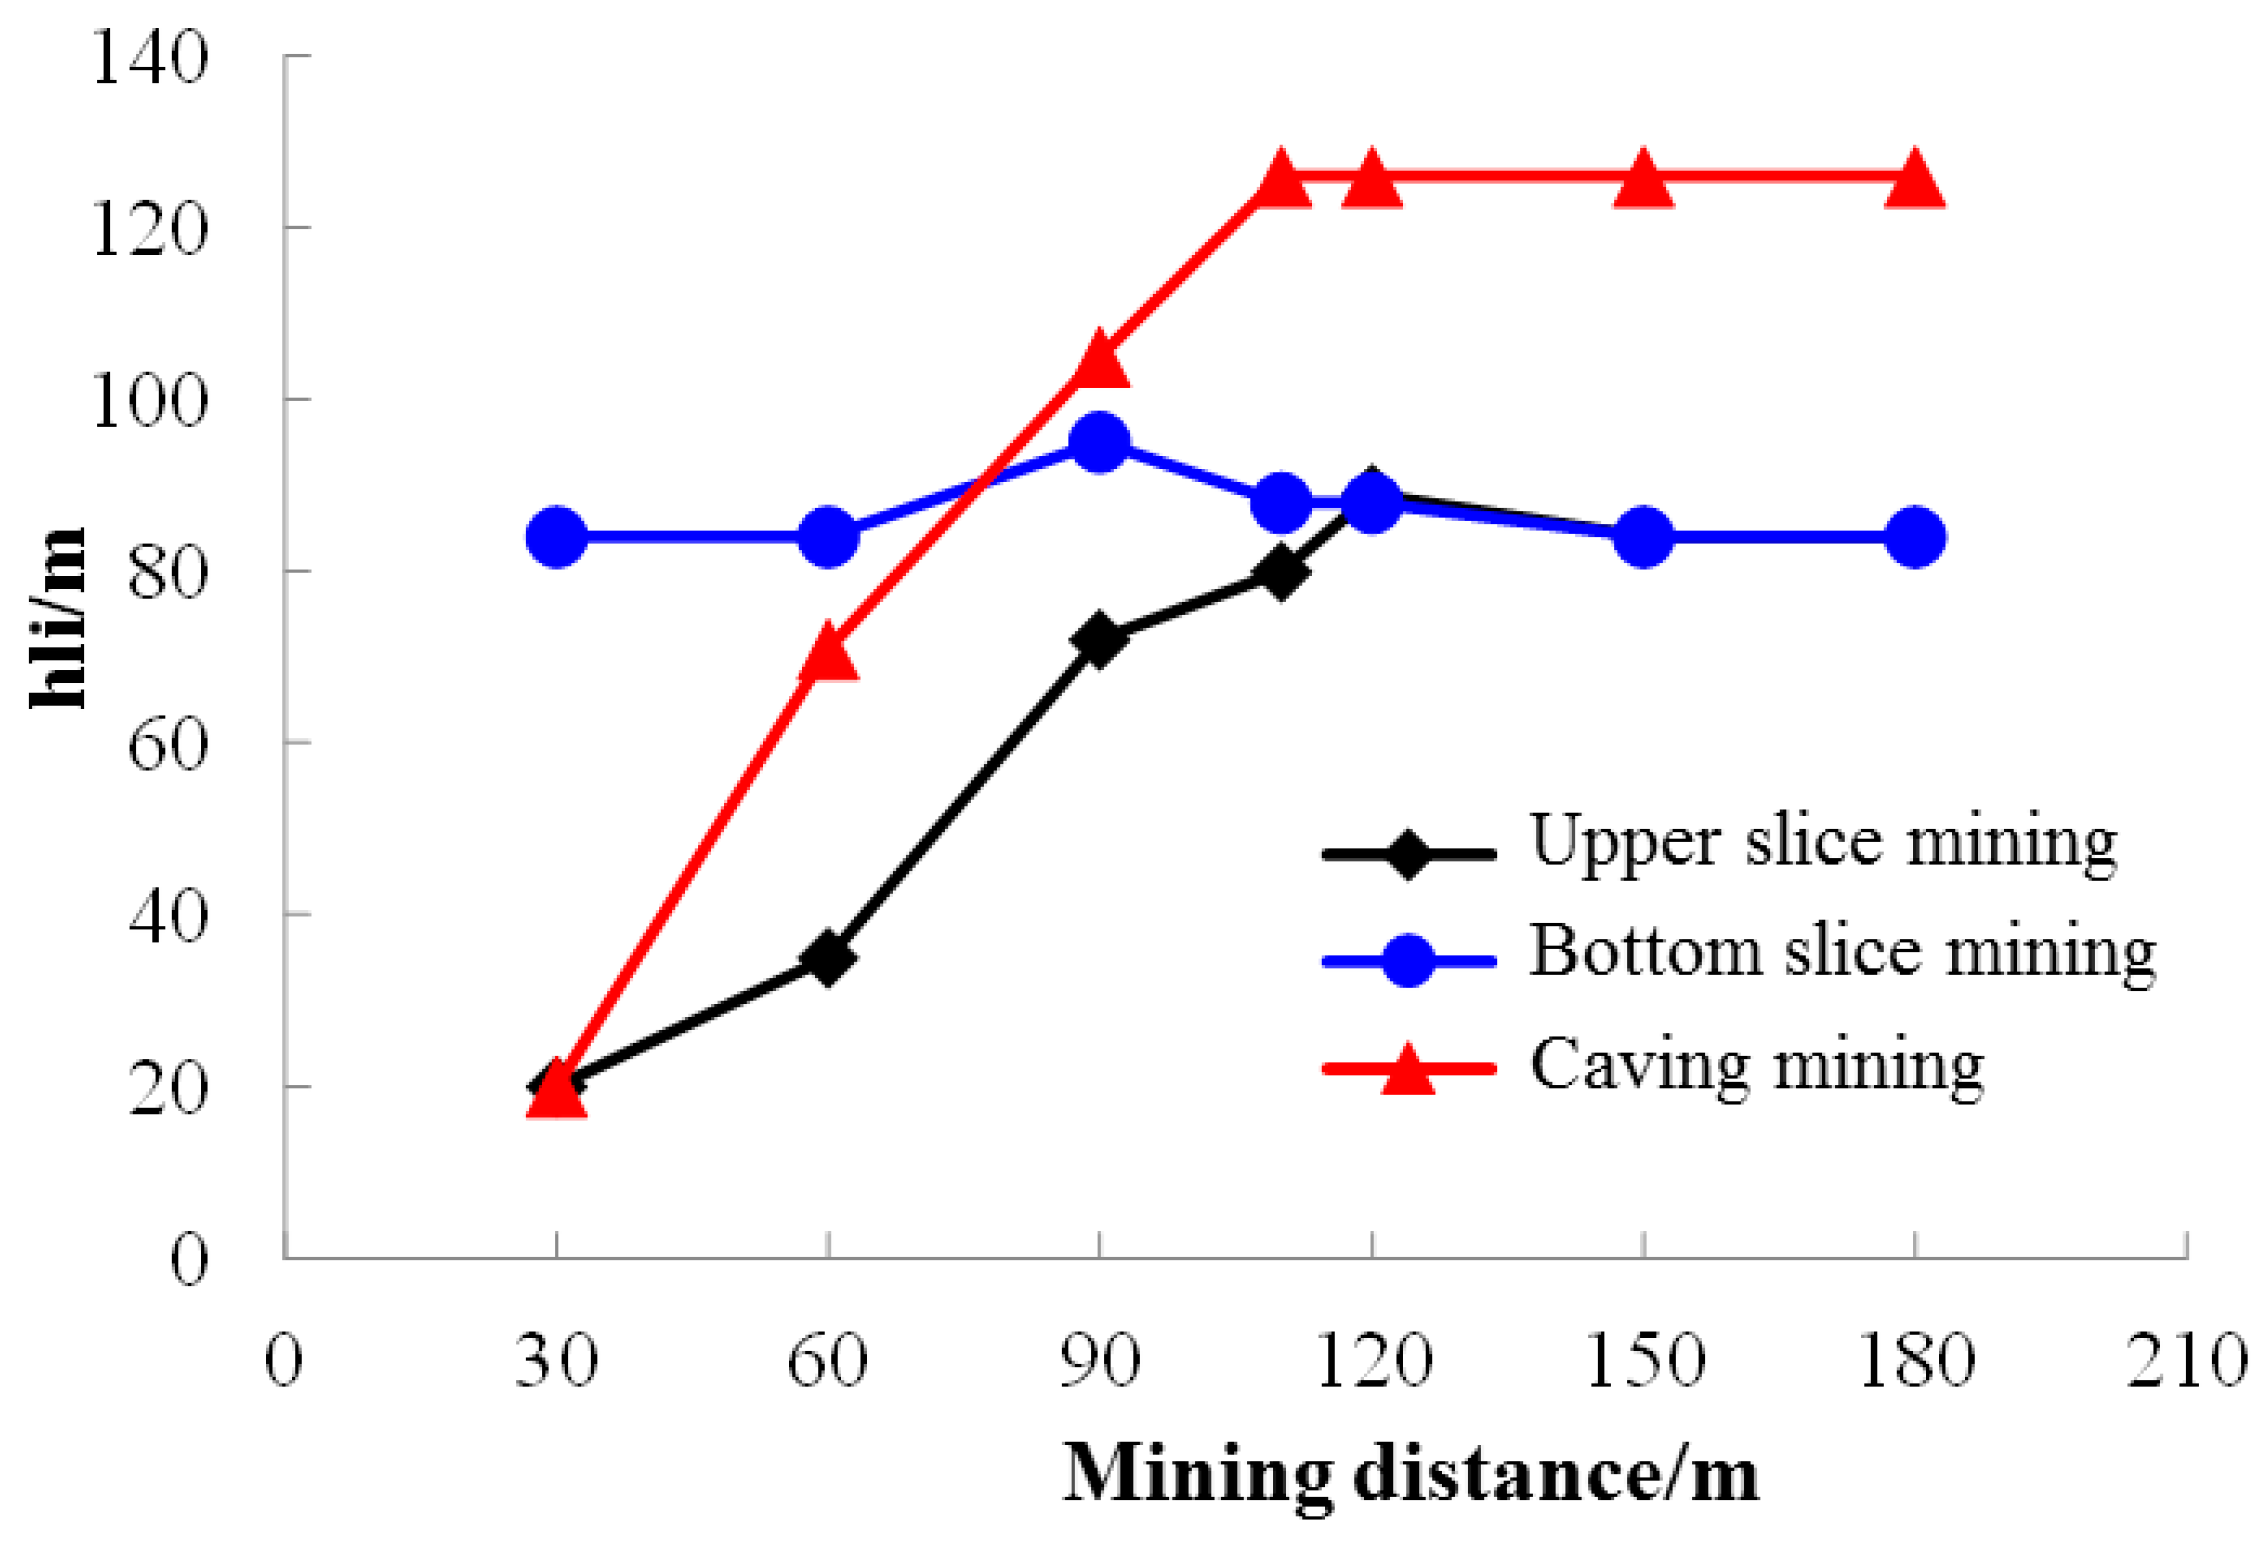
The height variations of the FWCZ under different caving methods are summarized and plotted in Figure 7. It is observed that, during slice mining, when the face reaches 120 m in the upper slice, the heights of FWCZ attain their maximum value of 88 m. When the face reaches 90 m in the lower mining slice, the FWCZ are fully developed, up to 95 m. The maximum height of fractures in the lower layer is 12 m greater than its upper counterpart. The fracture height-to-caving thickness ratio is 15.8. When longwall caving is employed, the fractures are fully developed, up to 126 m, when the face is at 110 m. The fracture height-to-caving thickness ratio is 21. The height of the water flowing fractured zone significantly increases by 26 m under longwall caving.
4. Field Measurements on Heights of FWCZ
4.1. Locations of Monitoring Holes
To investigate the development of FWCZ in the overburden during caving, three monitoring holes were installed at the 7802 longwall face. They are Z1, Z2, and Z3, which are located at 445 m, 584 m, and 540 m from the open-off cut sides, respectively. In particular, Z1 and Z3 are located near the air return lane and the transport lane, respectively, whereas Z2 is in the middle of the face. Figure 8 shows the layout of Z1, Z2, and Z3. The corresponding mining depths of the coal seam roofs are 295.9 m, 297.3 m, and 295.9 m, whilst the corresponding effective mining heights of the coal seams are 5.9 m, 5.2 m and 5.7 m, respectively. The heights of FWCZ are mainly determined by the water levels during hole drilling, flushing fluid consumption, and water injection test results of related layers.
4.2. Analysis of Field Measurements
The water levels, flush fluid consumption, water injection consumption during hole drilling of Z1, Z2, and Z3 are summarized in Figure 9a–c, respectively.
The depth of Z1 hole is 229.34 m. At 156.84 m, the water level, flushing fluid consumption, and water injection rate are 86.0 m, 0.06 m3/h, and 0.0075 m3/h, respectively. Although the water level drops to 86 m, the flushing fluid consumption and water injection rates are remarkably low, indicating extremely poor permeability. There are no water flowing fractured zones. At 181.23 m, the water level rises to 21 m, and the flushing fluid consumption rate remains at 0.06 m3/h, whilst the water injection rate increases to 0.2 m3/h, demonstrating a small increase in permeability in the stratum. When Z1 reaches 185.43 m, the water level suddenly drops to 52 m; however the flushing fluid consumption and water injection rates increase to 2.25 m3/h and 3.8 m3/h, respectively. The permeability surges considerably. The flushing fluid consumption rate abruptly grows by 2.19 m3/h, suggesting that a water flowing fractured zone may have been propagated into the stratum. At 190.03 m, the water level further declines to 82 m, and the flushing fluid consumption rate is 12.6 m3/h, indicating that all flushing fluid has been lost. The water injection volume is 6.6 m3/h, signifying a further increase in permeability. This verifies that at Z1, the upper boundary of water-conducting fracture development h1 is at 181.23–185.43 m. Given that the coal seam buried depth h is 295.9 m, the heights of FWCZ are hli = h − h1 = 110.47 − 114.67 m, with an average of 112.57 m. The effective mining thickness is 5.9 m, so the fracture height-to-caving thickness ratio is 19.08.
Figure 9 illustrates the variations in water levels, flushing fluid consumption rates, and water injection rates during drilling at Z2. At 195.03 m, the water level remains at around 23 m, and the flushing fluid consumption and water injection rates are 0.09 m3/h and 2.93 m3/h, respectively. This is indicative of relatively high permeability in the stratum. The water level suddenly drops to 89.70 m at 199.03 m. The flushing fluid consumption rate reaches 10.5 m3/h, indicating that basically all flushing fluid has been lost. Meanwhile, the water injection rate becomes 15 m3/h, signifying a sharp increase in permeability in the stratum. This demonstrates that the upper boundary of water-conducting fracture development h1 is at 195.03–199.03 m at Z2. Given that the coal seam depth h is 297.3 m, the heights of FWCZ are hli = h − h1 = 98.27 − 102.27 m, with an average of 100.27 m. At Z2, the effective mining thickness of the coal seam is 5.2 m, and the fracture height-to-caving thickness ratio is 19.28.
The variations in water levels, flushing fluid consumption rates, and water injection rates during drilling at Z3 are plotted in Figure 9. At 181.03 m, the water level reduces to 27 m, while the flushing fluid consumption and water injection rates are 0.432 m3/h and 0.32 m3/h, respectively. When Z3 reaches 185.03 m, the water level abruptly drops to 112 m, and the flushing fluid consumption and water injection rates become 0.292 m3/h and 3 m3/h, respectively. Meanwhile, the drilling rig suddenly falls by 0.20 m, suggesting that detaching has occurred in the stratum. At 189.03 m, the water level increases to 80 m, probably because the fractures in the mudstone gradually close. The flushing fluid consumption rate rises to 2.592 m3/h, and the water injection rate is 2.06 m3/h, signifying that at Z3, the upper boundary of water-conducting fracture development h1 is at 185.03–189.03 m. Provided that the local coal seam depth h is 295.9 m, the heights of FWCZ are hli = h − h1 = 106.87 − 110.87 m, and the average is 108.87 m. At Z3, the effective mining thickness of the coal seam is 5.7 m, and the fracture height-to-caving thickness ratio is 19.1.
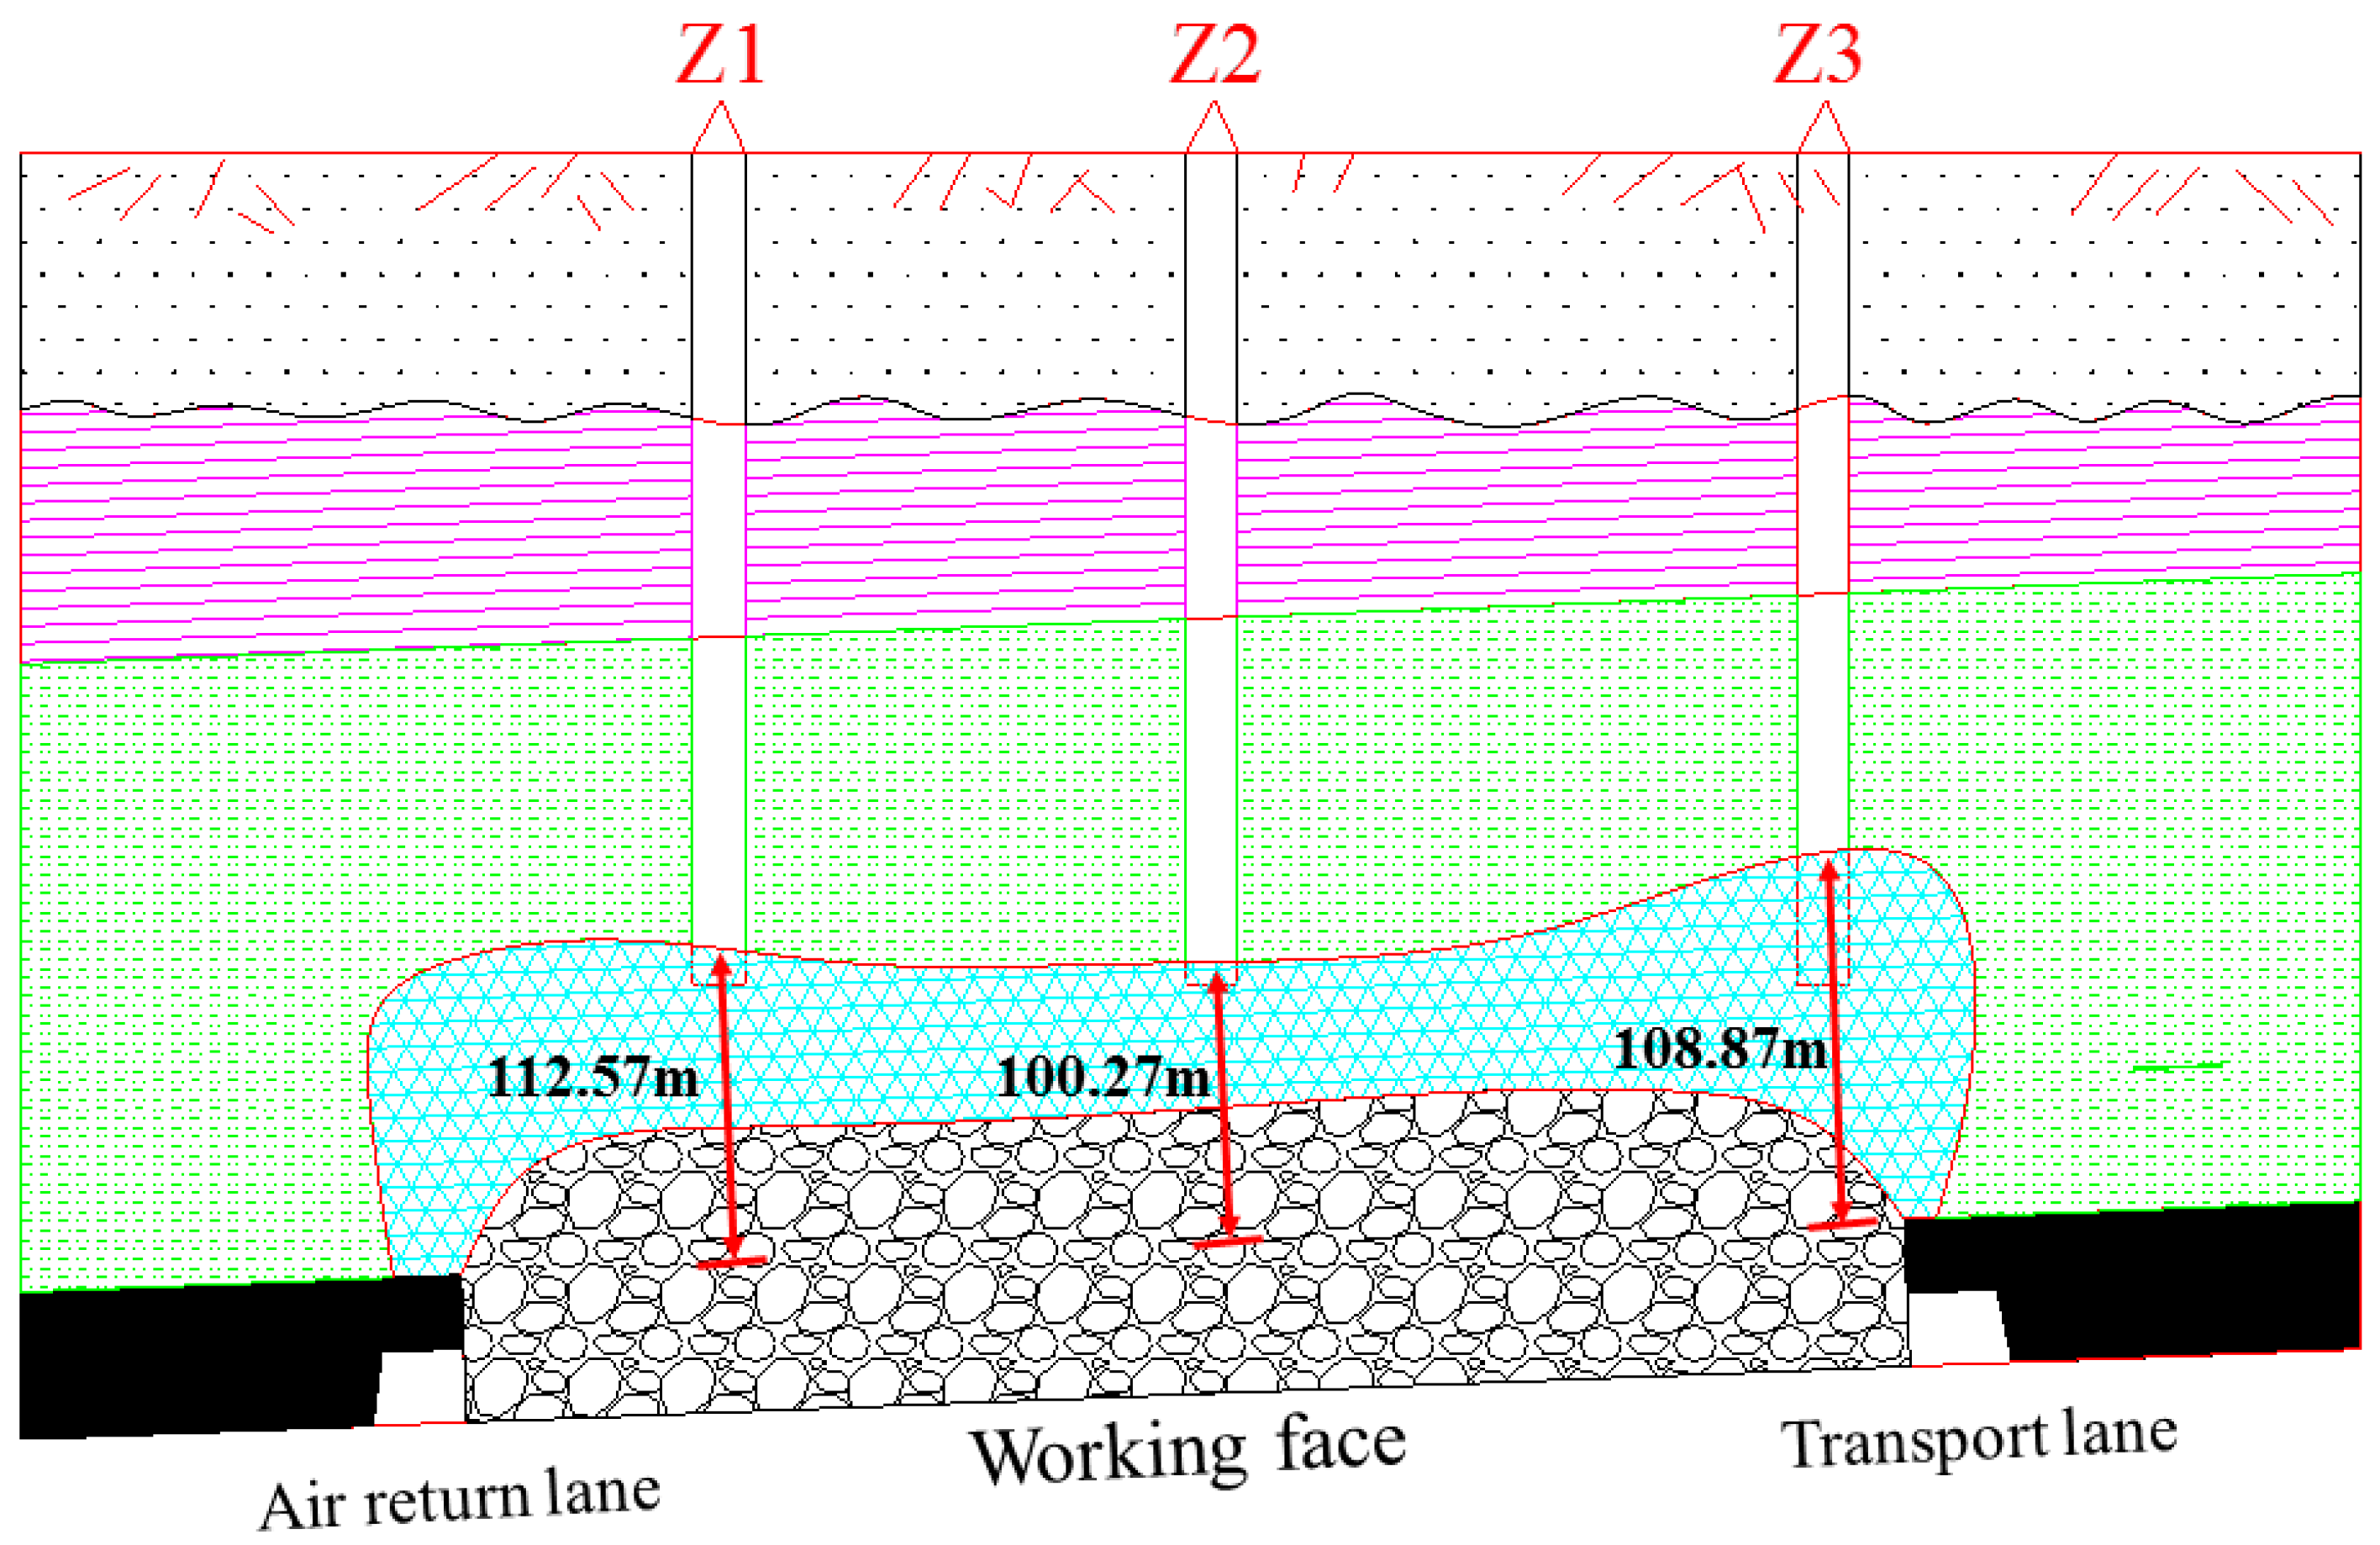
According to the results from the above three monitoring holes, the development pattern of FWCZ after caving at the 7802 face is visualized. It is saddle-shaped with highs at the ends, and a trough in the middle. This is consistent with the numerical calculation results, as shown in Figure 10.
5. Analyses and Discussion
All the aforementioned results suggest that different caving methods impose significant effects on the heights of FWCZ, and this is closely related to two contributing factors.
5.1. Bulking Factor Variations
Peng [8] pointed out that, if the fallen rock pieces follow an orderly caving, then the bulking factor is very small. However, for rock pieces that do not follow an orderly caving or caving repeatedly, the bulking factor is high. For fallen rock pieces following an orderly caving, as relatively large rock fragments form, the bulking factors for hard rocks are small. Nevertheless, weak and loose strata will form tiny rock fragments, and consequently, the bulking factors are large. Using slice mining, when the upper coal seam slice is mined, the immediate roof strata instantly fall. The main roof strata experience periodic fracturing, and their mechanical strength substantially decreases. When the lower slice is mined, the fallen immediate roof strata and some parts of the main roof strata become more fragmented owing to reduced mechanical strength. The bulking factor of gangue in the caving zone kp further increases. During longwall caving mining, the overlying strata are subjected to the effects of excavation once, so the fragment rocks are relatively complete, and the bulking factor is relatively small.
5.2. Structural Stability of Key Strata
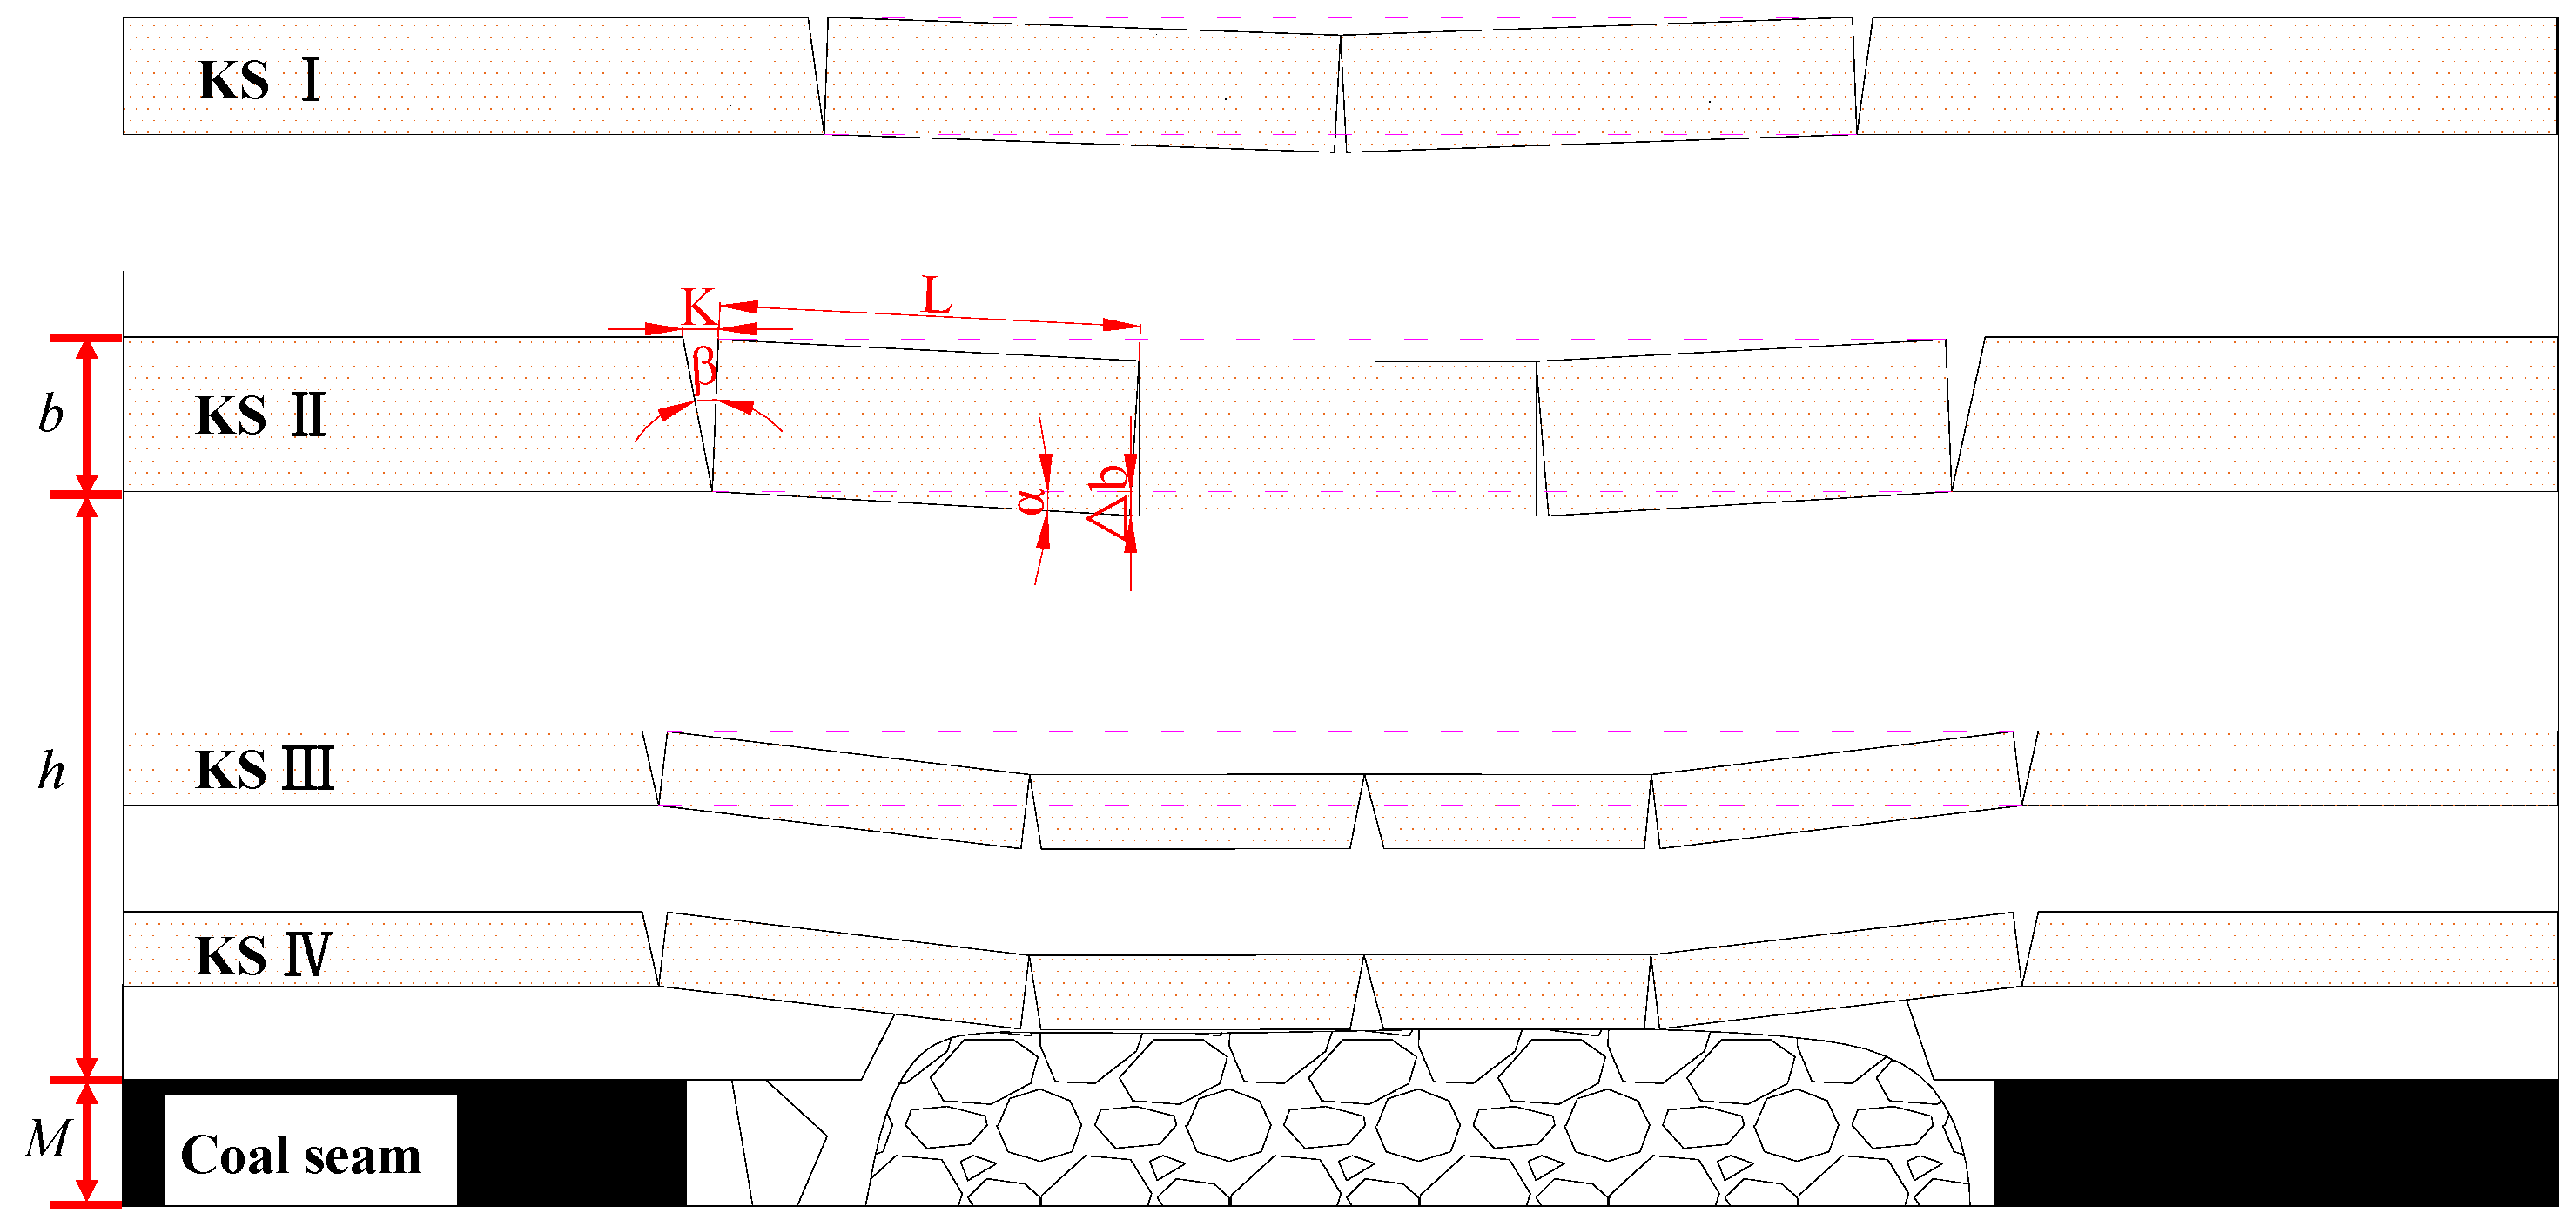
If the structures of key strata remain complete, upward development of fractures can be hindered effectively. With slice mining, the bulking factor kp of the caving strata rises, resulting in a relatively small compressible space ∆b under KS II. The amounts of subsidence, rotation, and fracturing aperture of structural blocks during fracturing are relatively small. Therefore, the heights of FWCZ are limited thanks to the relative stability of KS II. When longwall caving is employed, excavation covering the entire coal thickness is carried out at once. Owing to the large one-time mining thickness, the mechanical strength of the overburden is higher than that when the lower slice is mined during slice mining. The immediate roof is relatively complete after falling, and the bulking factor kp of gangue in the caving zone is lower than that of slice mining. As a result, the compressible rotational space ∆b under KS II is relatively large. The amounts of subsidence, rotation, and fracturing aperture K of structural blocks during strata fracturing increase. FWCZ are present in the mudstone controlled by KS II, and they continue developing until they reach the bottom of KS I. As the compressible rotational deformation at the bottom of KS I is very limited, the propagation of a water-conducting fracture is eventually prohibited, as shown in Figure 11.
Hence, under identical geological conditions, different caving methods cause variations in the bulking factor of fallen gangue in the caving zone, and thereby different variation characteristics in fracturing apertures of KS. Eventually, the development of FWCZ is affected.
The results demonstrate that different caving methods significantly influence the heights of water flowing fractured zones. To ensure efficient and safe mining of thick coal seams beneath water bodies, suitable mining methods should be selected to increase the energy output and ensure mining safety. For example, as the heights of FWCZ of both mining methods can’t reach to the overlying water body, it is better to adopt the method of caving mining for its lower costs and higher efficiency. Otherwise, the method of slice mining should been used to ensure a safety mining environment. The results are of significant importance to both the safe mining of thick coal seams under water bodies and conservation and utilization of water resources in coal mine.
6. Conclusions
- Under the same stratigraphic conditions, mining methods significantly affect the heights of water flowing fractured zones. The numerical results by UDEC indicate that, when slice mining is adopted, the maximum height of the FWCZ in the upper slice is 88 m, while that in the lower slice is 7 m higher, reaching 95 m. The fracture height-to-caving thickness ratio is 15.8. For longwall caving, the maximum height is 126 m, and the ratio is 21. The FWCZ in longwall caving is 31 m higher than those in slice mining.
- The heights of the FWCZ can be accurately obtained by monitoring wells. Monitoring wells Z1, Z2, and Z3 were installed at the 7802 face to analyze variation patterns in water levels, flushing fluid consumption rates, and water injection rates. The heights of the FWCZ were 112.57 m, 110.27 m, and 108.87 m at Z1, Z2, and Z3, respectively (coal thickness M: 5.9 m, 5.2 m, and 5.7 m, respectively). The fracture height-to-caving thickness ratios at Z1, Z2, and Z3 were 19.08, 19.28 and 19.1, respectively.
- Both numerical results and field measurements demonstrate that, with the face advancement, the FWCZ finally shows a saddle-shaped pattern, in which the fractures are higher at the open-off cut sides and lower in the middle.
- Mining methods influence the heights of FWCZ primarily through variations in the bulking factor and the structural stability of KS. When slice mining is employed, as the strata experience excavation twice, they are more fragmented, and the bulking factor is, therefore, relatively larger. Compressible rotational spaces in the lower parts of KS are limited, and the strata are more stable, prohibiting the development of FWCZ. During longwall caving, the fragmented blocks are relatively large and complete, so the bulking factor is relatively small. There are more compressible rotational spaces in the lower parts of KS, and the strata are more prone to fracturing deformation. This causes the controlling weak strata above to fracture at the same time, facilitating the development of fractures.
Acknowledgments
This paper was funded by the Research Fund of The State Key Laboratory of Coal Resources and safe Mining, CUMT (13KF02); the National Natural Science Foundation of China(51704095 and 51774110); the Research Fund of The State Key Laboratory of Water Resources Protection and Utilization in Coal Mining, Shenhua Group(SHJT-16-30.11); the Research Fund of The State Key Laboratory for Geomechanics and Deep Underground Engineering, CUMT(SKLGDUEK1310); the research fund of Henan Key Laboratory for Green and Efficient Mining & Comprehensive Utilization of Mineral Resources (Henan Polytechnic University) (S201619); the Key Project of Science and Technology of Department of Education of Henan Province (No.14A440001).
Author Contributions
Feng Du conceived and designed the numerical simulations and wrote the paper; Rui Gao contributed in conducting the engineering measurements.
Conflicts of Interest
The authors declare no conflict of interest.
References
- Zhang, J.; Shen, B. Coal mining aquifers in China: A case study. Int. J. Rock Mech. Min. Sci. 2004, 41, 629–639. [Google Scholar] [CrossRef]
- Wu, Q.; Wang, M.; Wu, X. Investigations of groundwater bursting into coal mine seam floors from fault zones. Int. J. Rock Mech. Min. Sci. 2004, 41, 557–571. [Google Scholar] [CrossRef]
- Wang, J.-A.; Park, H.D. Coal mining above a confined aquifer. Int. J. Rock Mech. Min. Sci. 2003, 40, 537–551. [Google Scholar] [CrossRef]
- Wang, G.; Wu, M.; Wang, R.; Xu, H.; Song, X. Height of the mining-induced fractured fractured zone above a coal face. Eng. Geol. 2017, 216, 140–152. [Google Scholar] [CrossRef]
- Feng, S.; Sun, S.; Lv, Y.; Lv, J. Research on the height of water flowing fractured zone of fully mechanized caving mining in extra-thick coal seam. Procedia Eng. 2011, 26, 466–471. [Google Scholar]
- Zhang, D.; Fan, G.; Ma, L.; Wang, X. Aquifer protection during longwall caving mining of shallow coal seams: A case study in the Shendong Coalfield of China. Int. J. Coal Geol. 2011, 86, 190–196. [Google Scholar] [CrossRef]
- Peng, S.S. Surface Subsidence Engineering; SME: New York, NY, USA, 1992. [Google Scholar]
- Peng, S.S. Coal Mine Ground Control, 2nd ed.; Wiley: New York, NY, USA, 1986. [Google Scholar]
- Dahl, H.D.; Von schonfeldt, H.A. Rock Mechanics Elements of Coal Mine Design. In Proceedings of the 17th U.S. Symposium on Rock Mechanics (USRMS), Snow Bird, UT, USA, 25–27 August 1976; pp. 31–39. [Google Scholar]
- Palchik, V. Analytical and empirical prognosis of rock foliation in rock masses. J. Coal Ukr. 1989, 7, 45–46. [Google Scholar]
- Palchik, V. Influence of physical characteristics of weak rock mass on height of caved zone over abandoned subsurface coal mines. Environ. Geol. 2002, 42, 92–101. [Google Scholar] [CrossRef]
- Palchik, V. Formation of fractured zones in overburden due to longwall mining. Environ. Geol. 2003, 44, 28–38. [Google Scholar]
- Palchik, V. Location of mining-induced horizontal fractures along rock layer interfaces in overburden: Field measurements and prediction. Environ. Geol. 2005, 48, 68–80. [Google Scholar] [CrossRef]
- Palchik, V. Experimental investigation of apertures of mining-induced horizontal fractures. Int. J. Rock Mech. Min. Sci. 2010, 47, 502–508. [Google Scholar] [CrossRef]
- Liu, T.Q. Surface Movements, Overburden Failure and Its Application; Coal Industry Press: Beijing, China, 1981. (In Chinese) [Google Scholar]
- Hu, W.; Xu, Z.; Wang, W.; Xing, C. Research on development of water flowing fractures in soft overlying strata for coal mining under sea. J. China Coal Soc. 2013, 38, 1338–1344. [Google Scholar]
- Sun, Y.; Xu, Z.; Dong, Q. Monitoring and simulation research on development of water flowing fractures for coal mining under Xiao Langdi reservoir. Chin. J. Rock Mech. Eng. 2009, 28, 238–245. [Google Scholar]
- Gao, F.; Stead, D.; Coggan, J. Evaluation of coal longwall caving charateristics using an innovative UDEC Trigon approach. Comput. Geotech. 2014, 55, 448–460. [Google Scholar] [CrossRef] [Green Version]
- Lai, X.; Cai, M.; Ren, F.; Xie, M.; Esaki, T. Assessment of rock mass characteristics and the excavation disturbed zone in the Lingxin Coal Mine beneath the Xitian river, China. Int. J. Rock Mech. Min. Sci. 2006, 44, 572–581. [Google Scholar] [CrossRef]
- Liu, X.S.; Tan, Y.L.; Ning, J.G. The height of water-conducting fractured zones in longwall mining of shallow coal seams. Geotech. Geol. Eng. 2015, 33, 693–700. [Google Scholar] [CrossRef]
- Dong, D.L.; Lin, G.; Lin, Y.F.; Zhao, M.D.; Li, K. Evaluating induced fractures between a large artificial lack and an aquifer-coal seam system: A case study in Tangshan coal mine, China. Mine Water Environ. 2016, 35, 253–260. [Google Scholar] [CrossRef]
- Wu, Q.; Fan, Z.L.; Zhang, Z.W.; Zhou, W.F. Evaluation and zoning of groundwater hazards in Pingshuo No.1 underground coal mine, Shanxi Province, China. Hydrogeol. J. 2014, 22, 1693–1705. [Google Scholar] [CrossRef]
- Wang, J.; Zhang, J.; Li, Z. A new research system for caving mechanism analysis and its application to sublevel top-coal caving mining. Int. J. Rock Mech. Min. Sci. 2016, 88, 273–285. [Google Scholar] [CrossRef]
- Yu, B.; Zhao, J.; Kuang, T.; Meng, X. In situ investigations into overburden failures of a super-thick coal seam for longwall top coal caving. Int. J. Rock Mech. Min. Sci. 2015, 78, 155–162. [Google Scholar] [CrossRef]
- Minggao, Q.; Xiexing, M.; Jialin, X. Theoretical Study of Key Stratum in Ground Control. J. China Coal Soc. 1996, 21, 225–230. [Google Scholar]
- Miao, X.; Cui, X.; Wang, J.; Xu, J. The Height of fractured Water-conducting zone in undermined rock strata. Eng. Geol. 2011, 120, 32–39. [Google Scholar] [CrossRef]
- Xu, J.; Wang, X.; Liu, W.; Wang, Z. Effects of primary key stratum location on height of water flowing fracture zone. Chin. J. Rock Mech. Eng. 2009, 28, 380–385. [Google Scholar]
- Ju, J.; Xu, J. Surface stepped subsidence related to top-coal caving longwall caving mining of extremely thick coal seam under shallow cover. Int. J. Rock Mech. Min. Sci. 2015, 78, 27–35. [Google Scholar] [CrossRef]
- Wang, X.; Xu, J.; Zhu, W. Influence of primary key stratum structure stability on evolution of water flowing fracture. J. China Coal Soc. 2012, 37, 606–612. [Google Scholar]
- Gui, H.; Zhou, Q.; Liao, D.; Kang, Q.; Fan, Z.; Zou, H. Prediction of maximum height of the fractured zone by stressing method for sub-level caving mining. J. China Coal Soc. 1997, 22, 375–379. [Google Scholar]
Figure 1.
Four zone of strata movement above a longwall panel.

Figure 2.
Schematic plan of the 7802 face.

Figure 3.
Numerical calculation model.

Figure 4.
Development patterns of FWCZ in the overburden when the upper coal seam is mined.
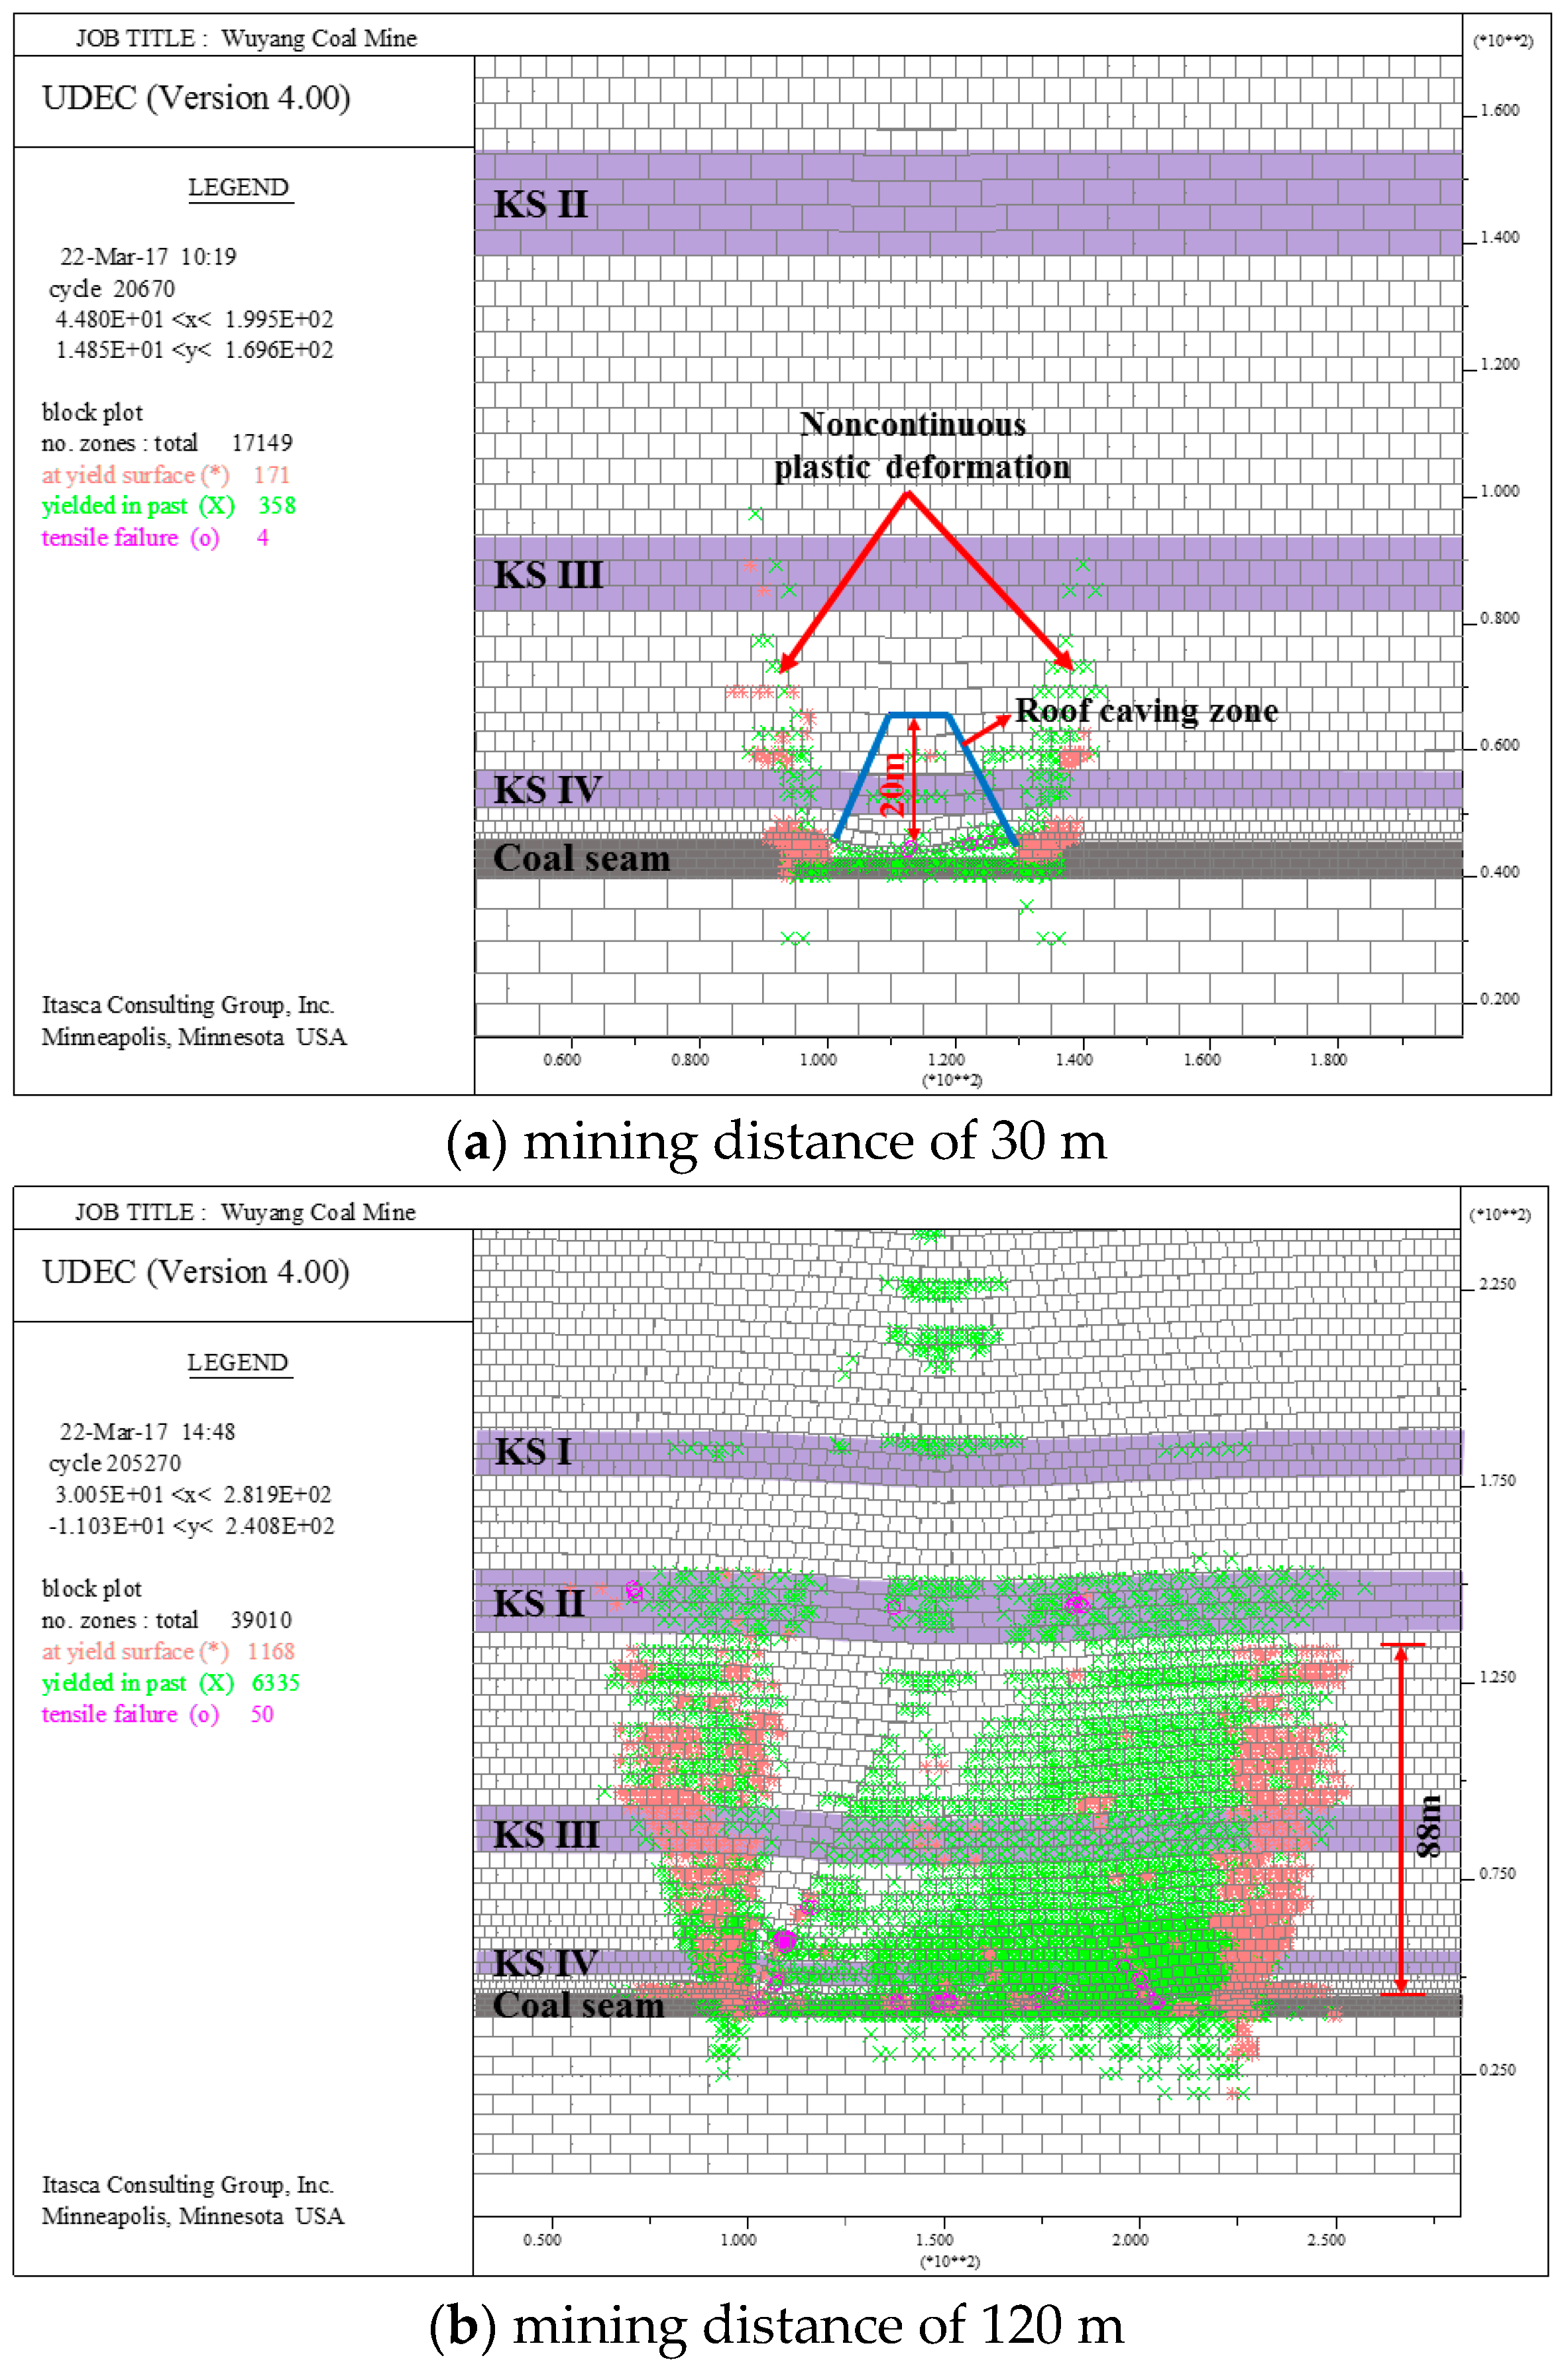
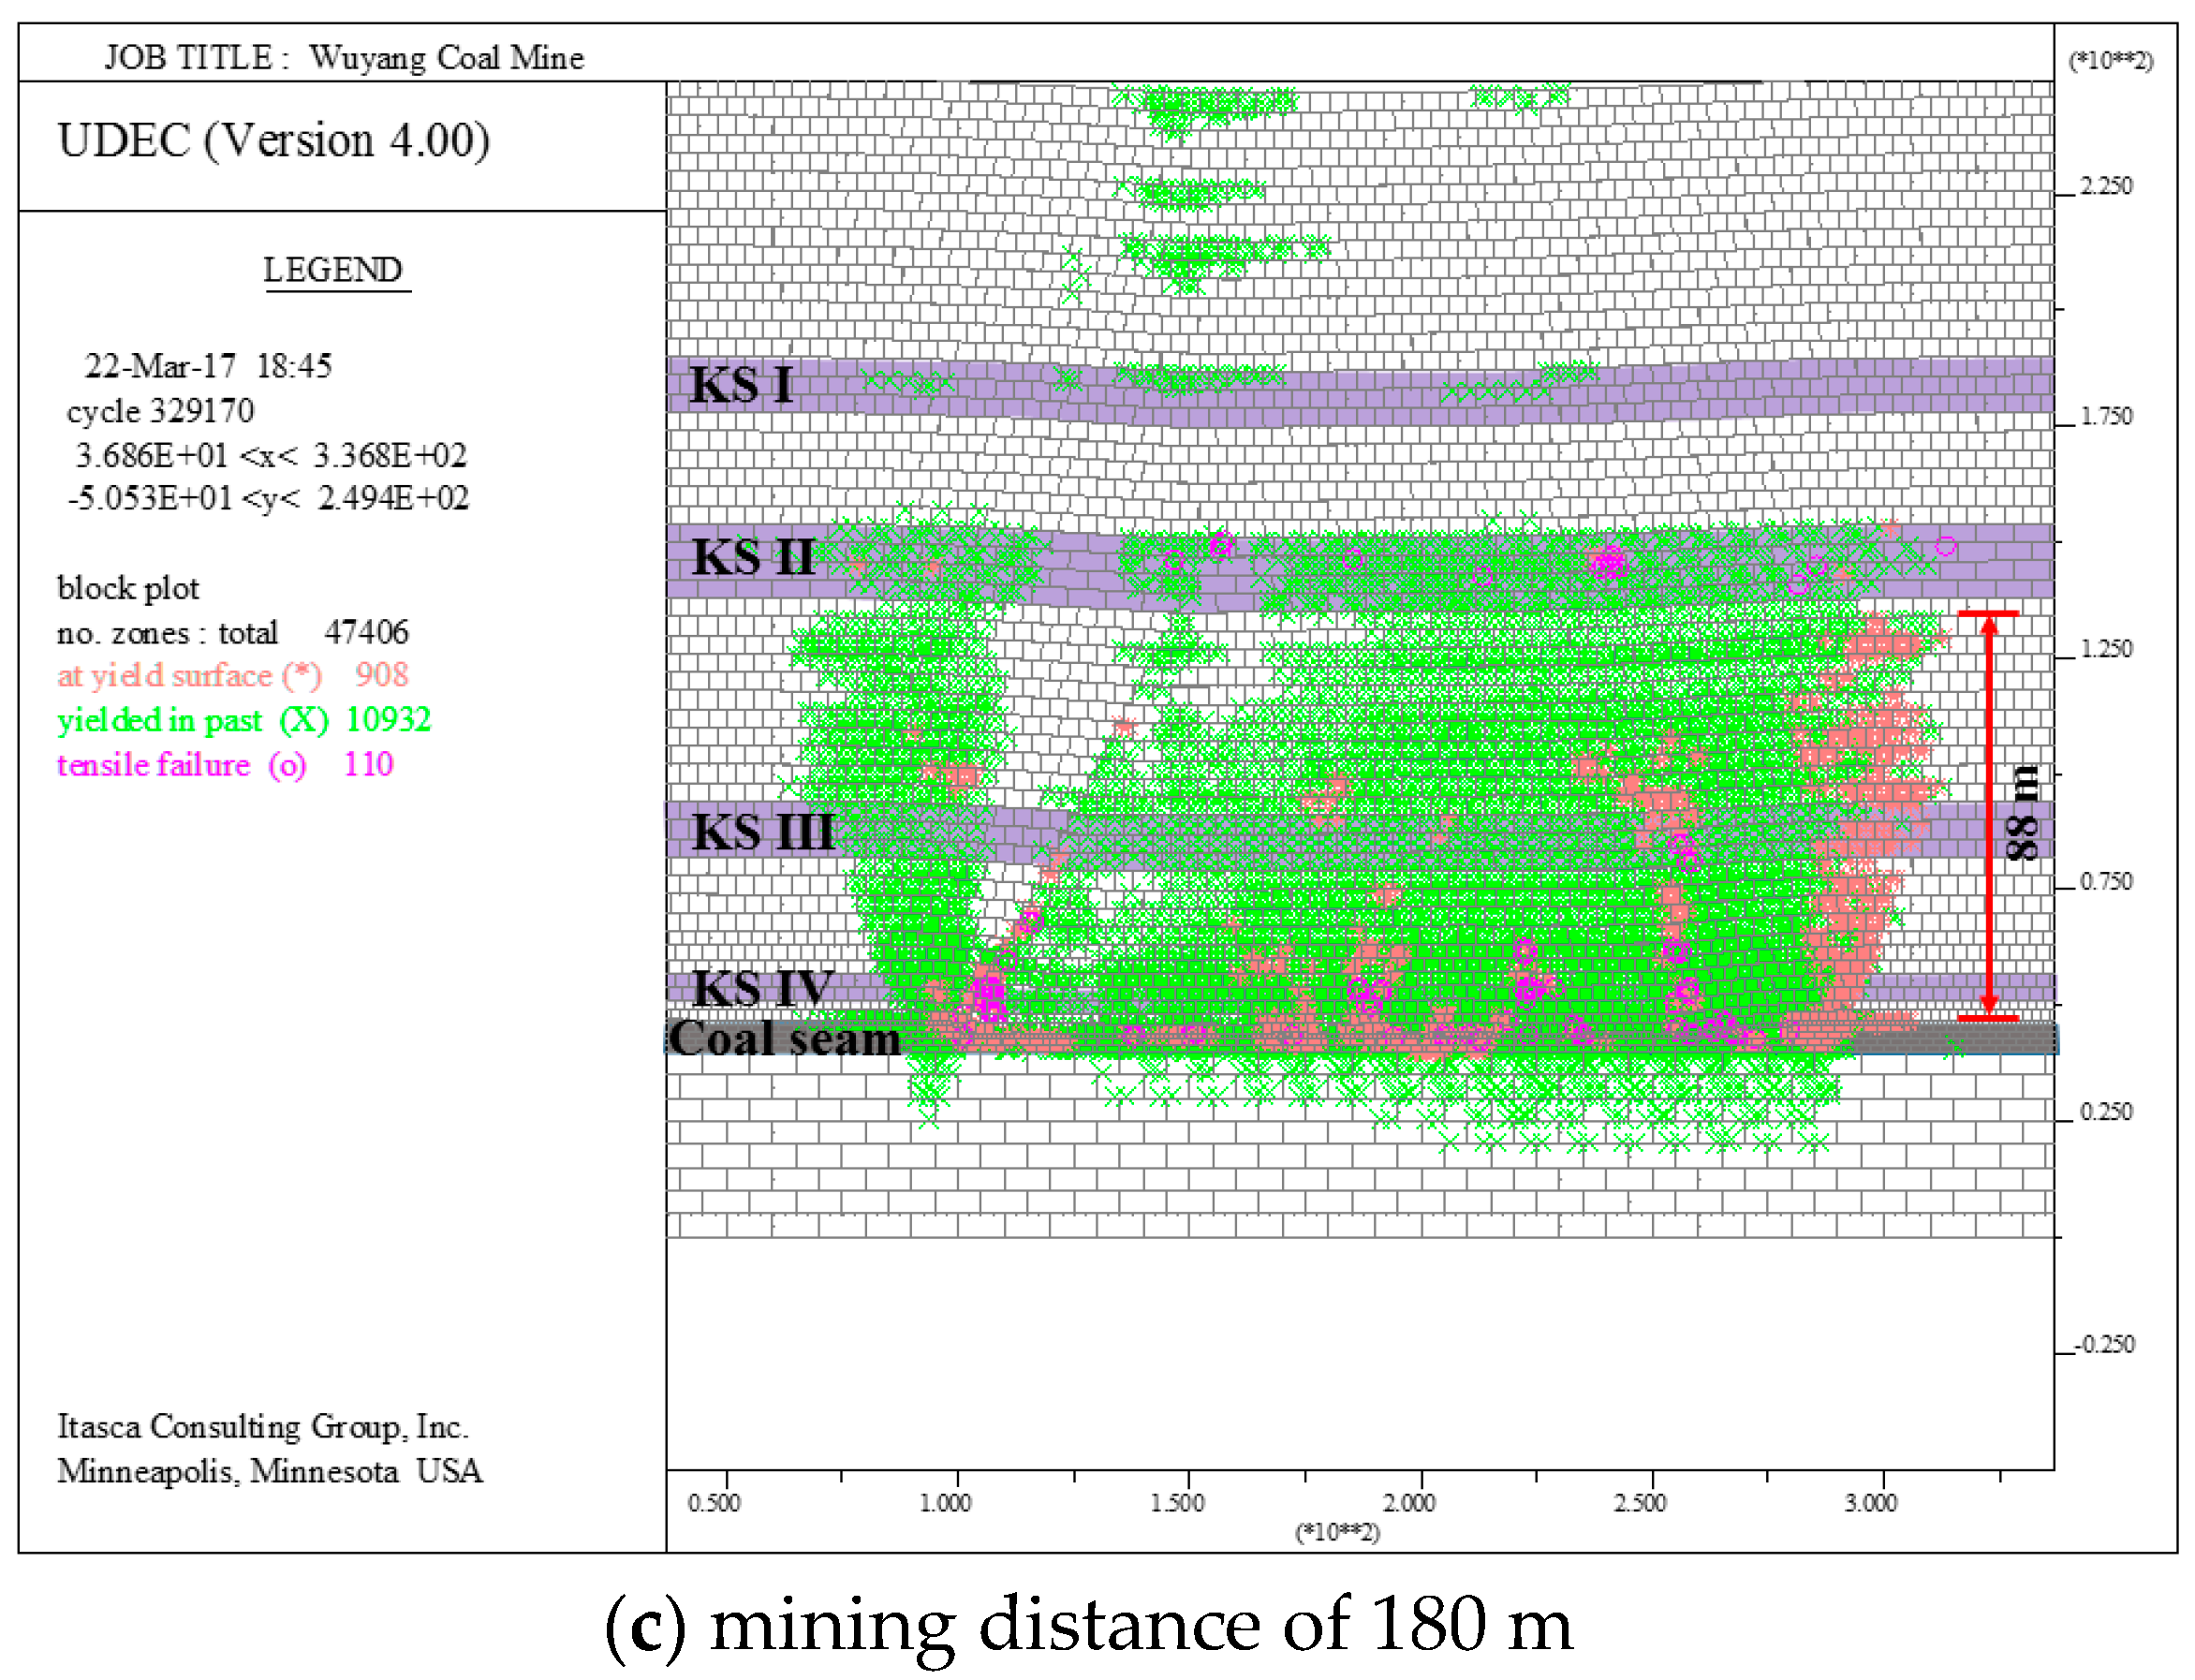
Figure 5.
Development patterns of FWCZ in the overburden when the lower coal seam is mined.
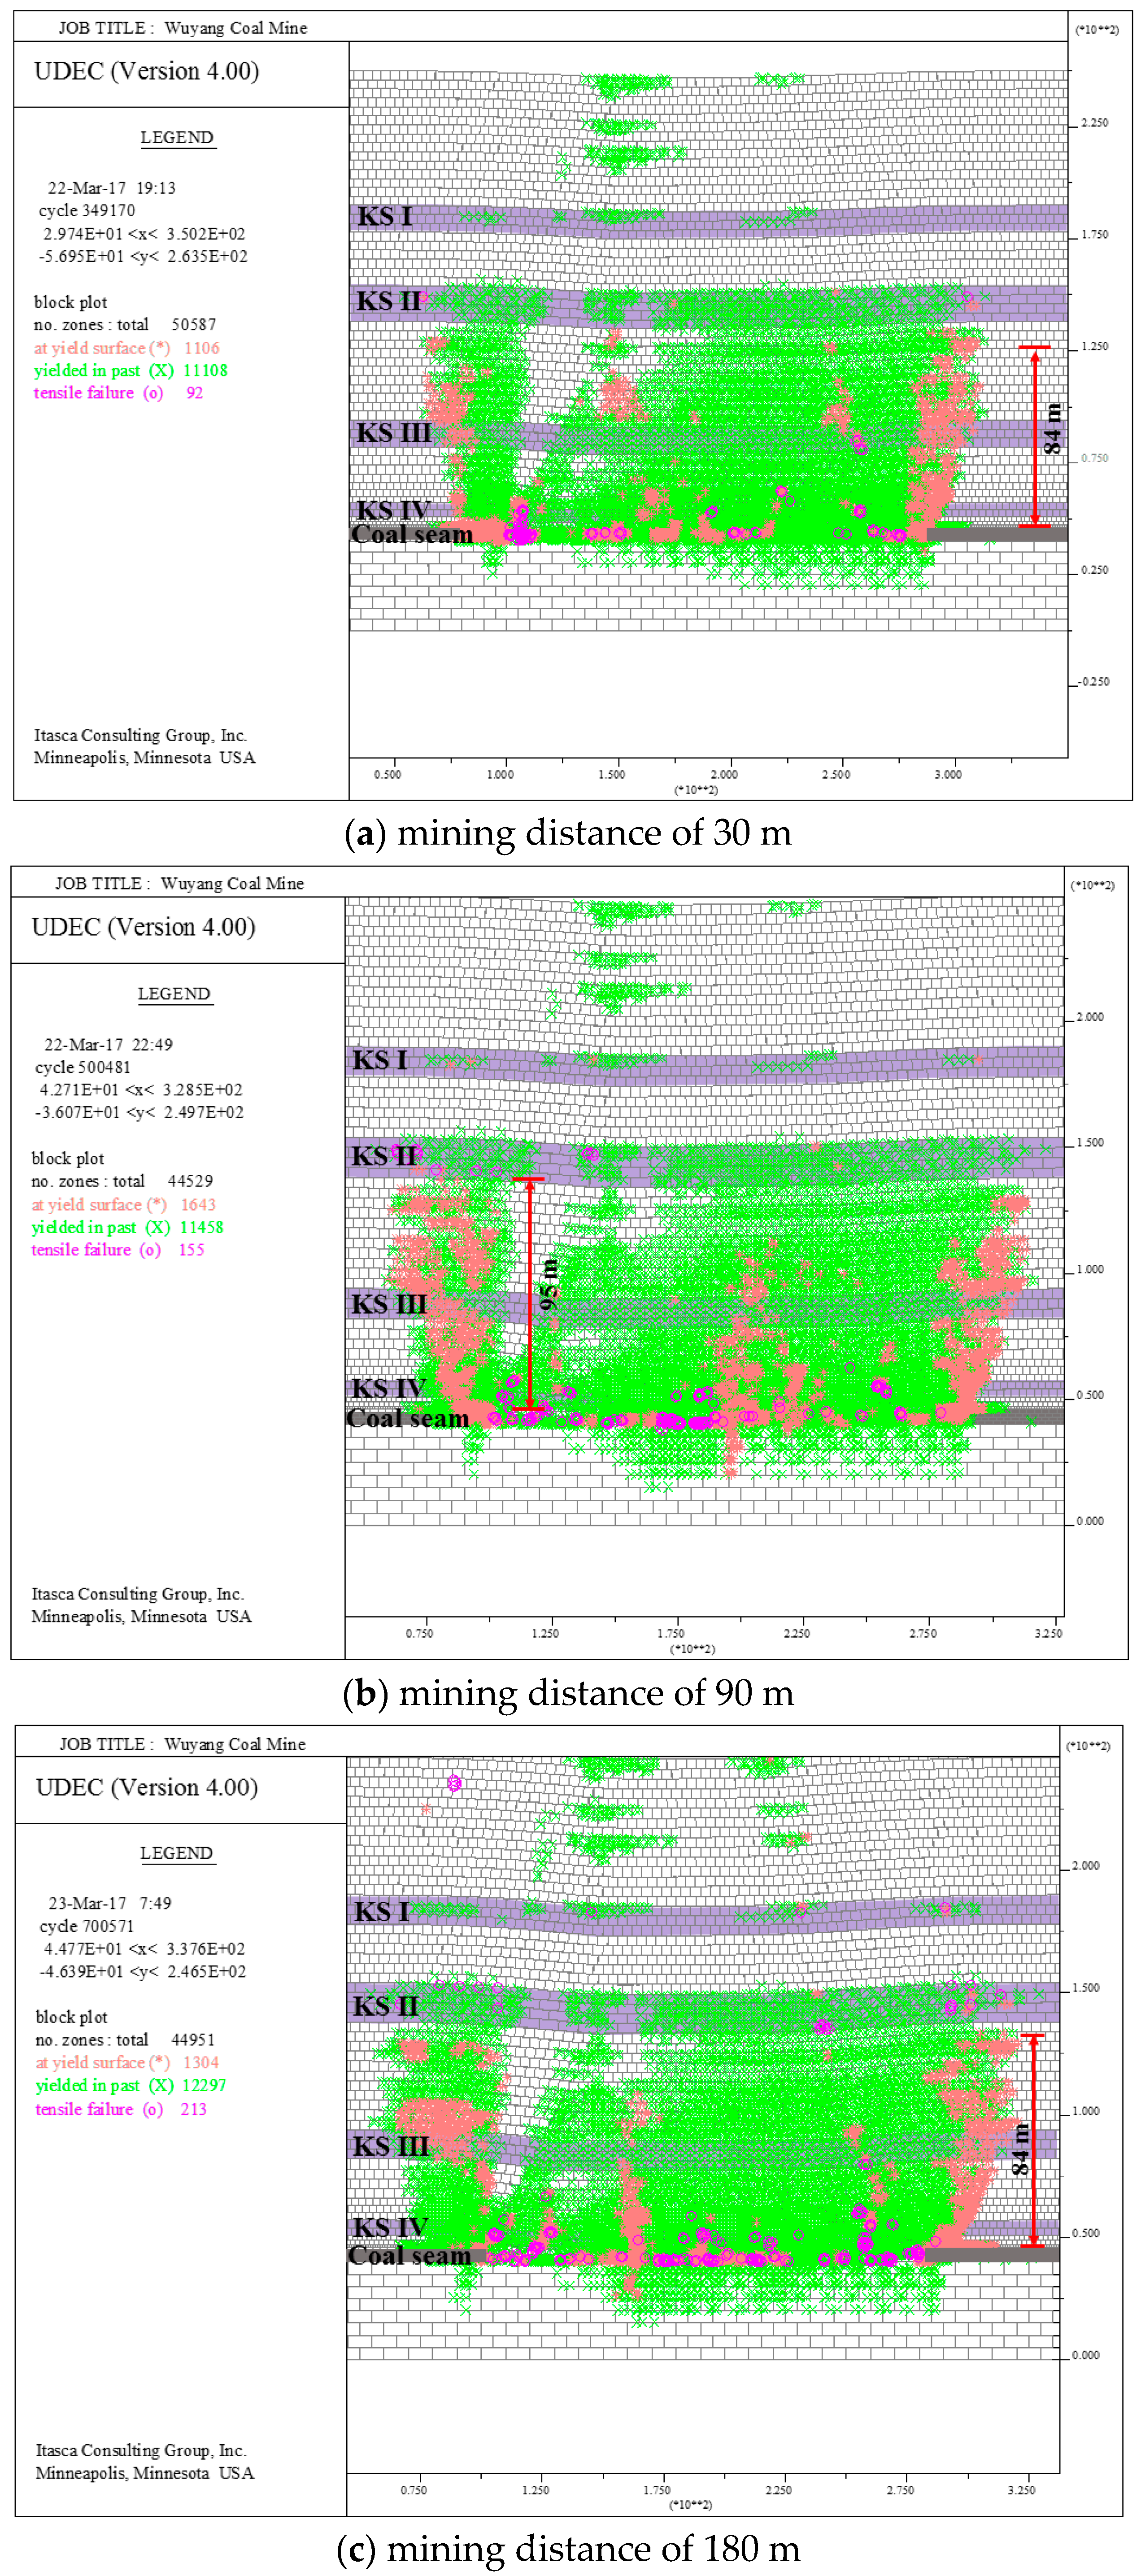
Figure 6.
Development patterns of FWCZ in the overburden when longwall caving is employed.
Figure 7.
Variations in heights of FWCZ under different caving methods.

Figure 8.
Location map of monitoring holes.
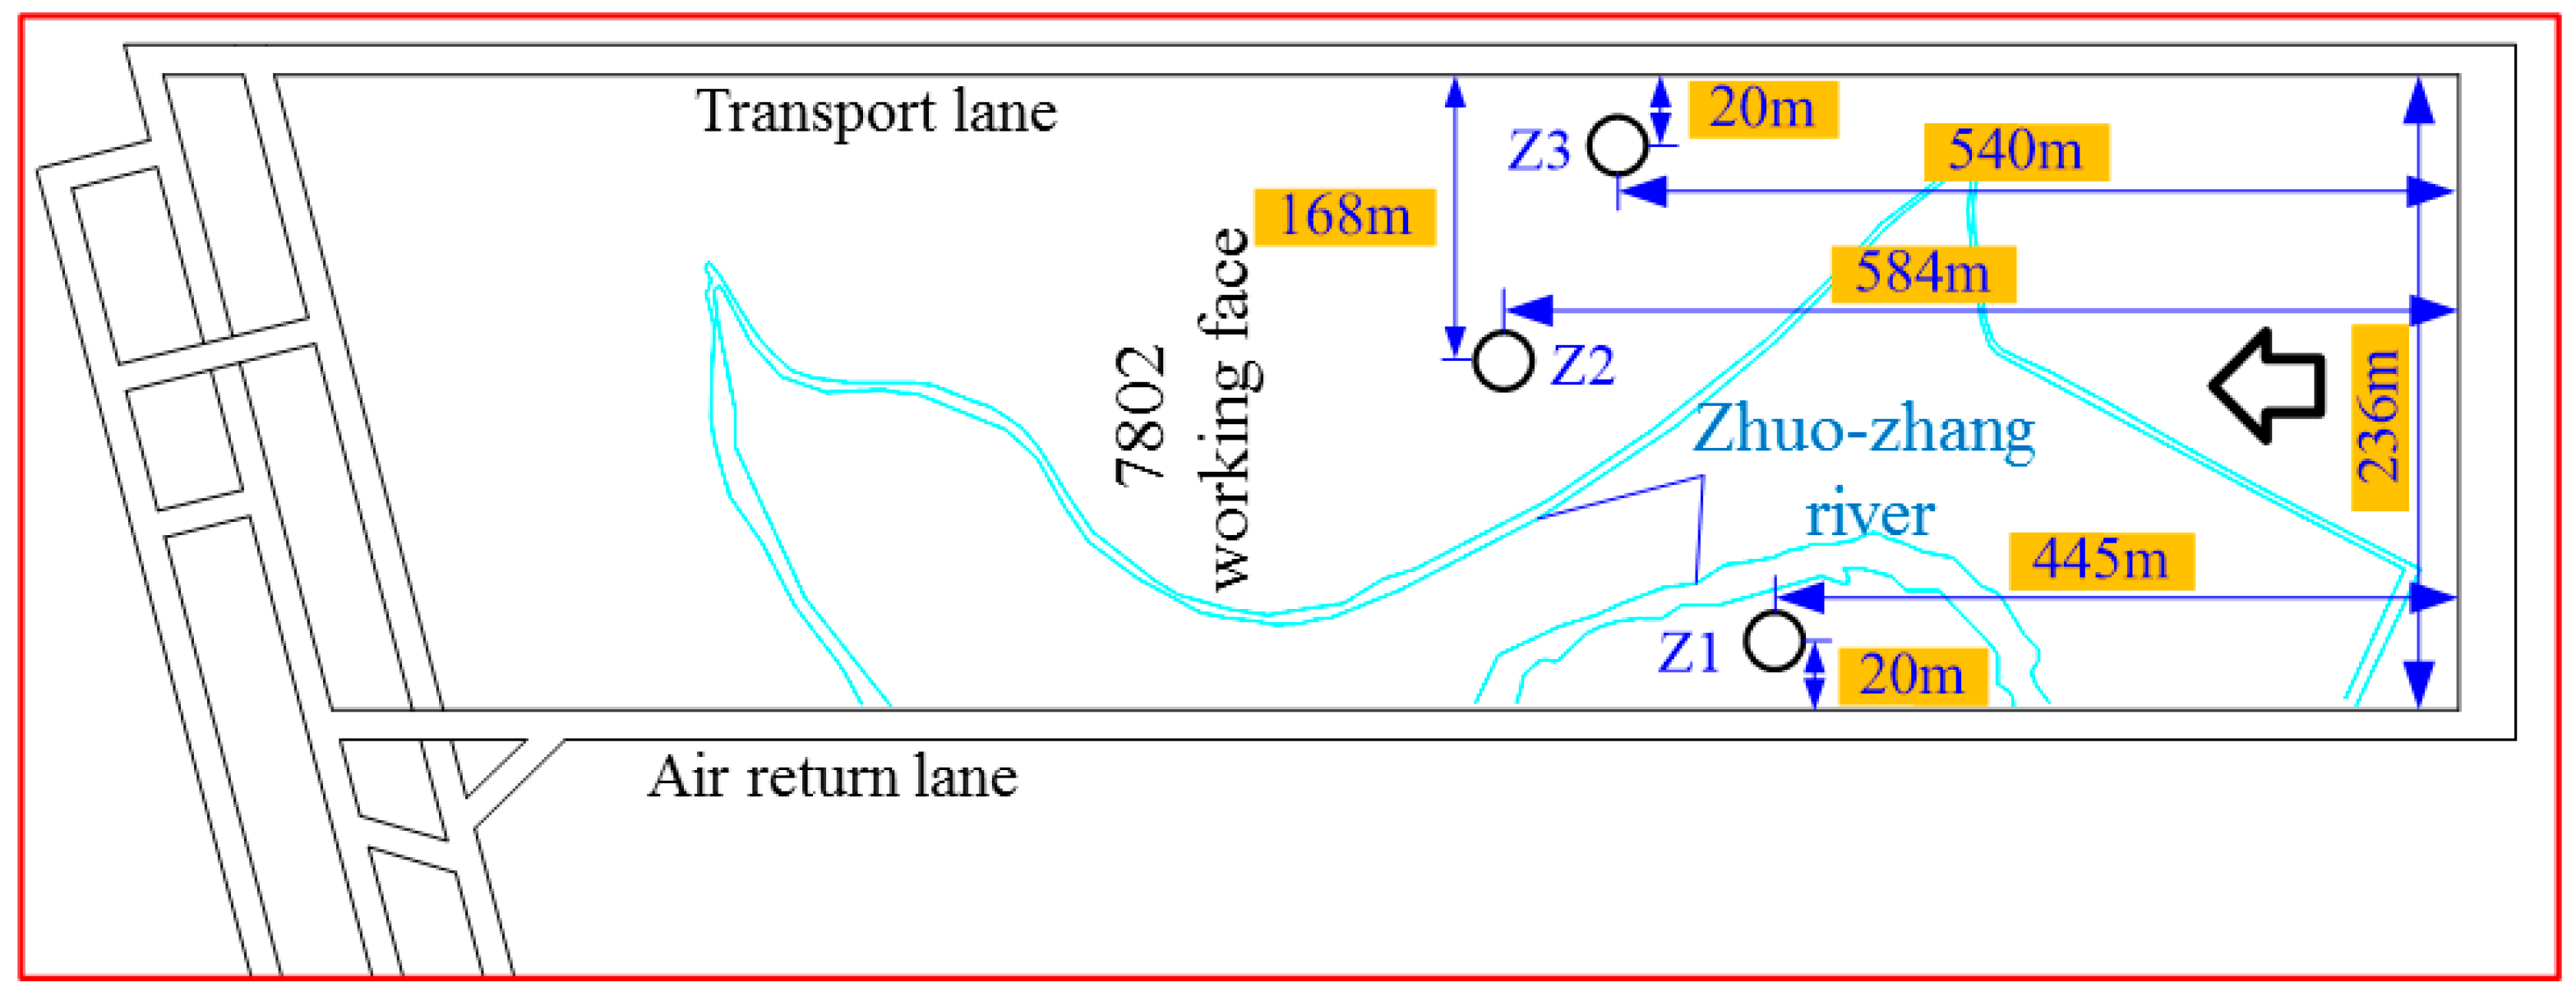
Figure 9.
Variations in water levels, flushing fluid consumption, and water injection at Z1, Z2, and Z3.
Figure 9.
Variations in water levels, flushing fluid consumption, and water injection at Z1, Z2, and Z3.
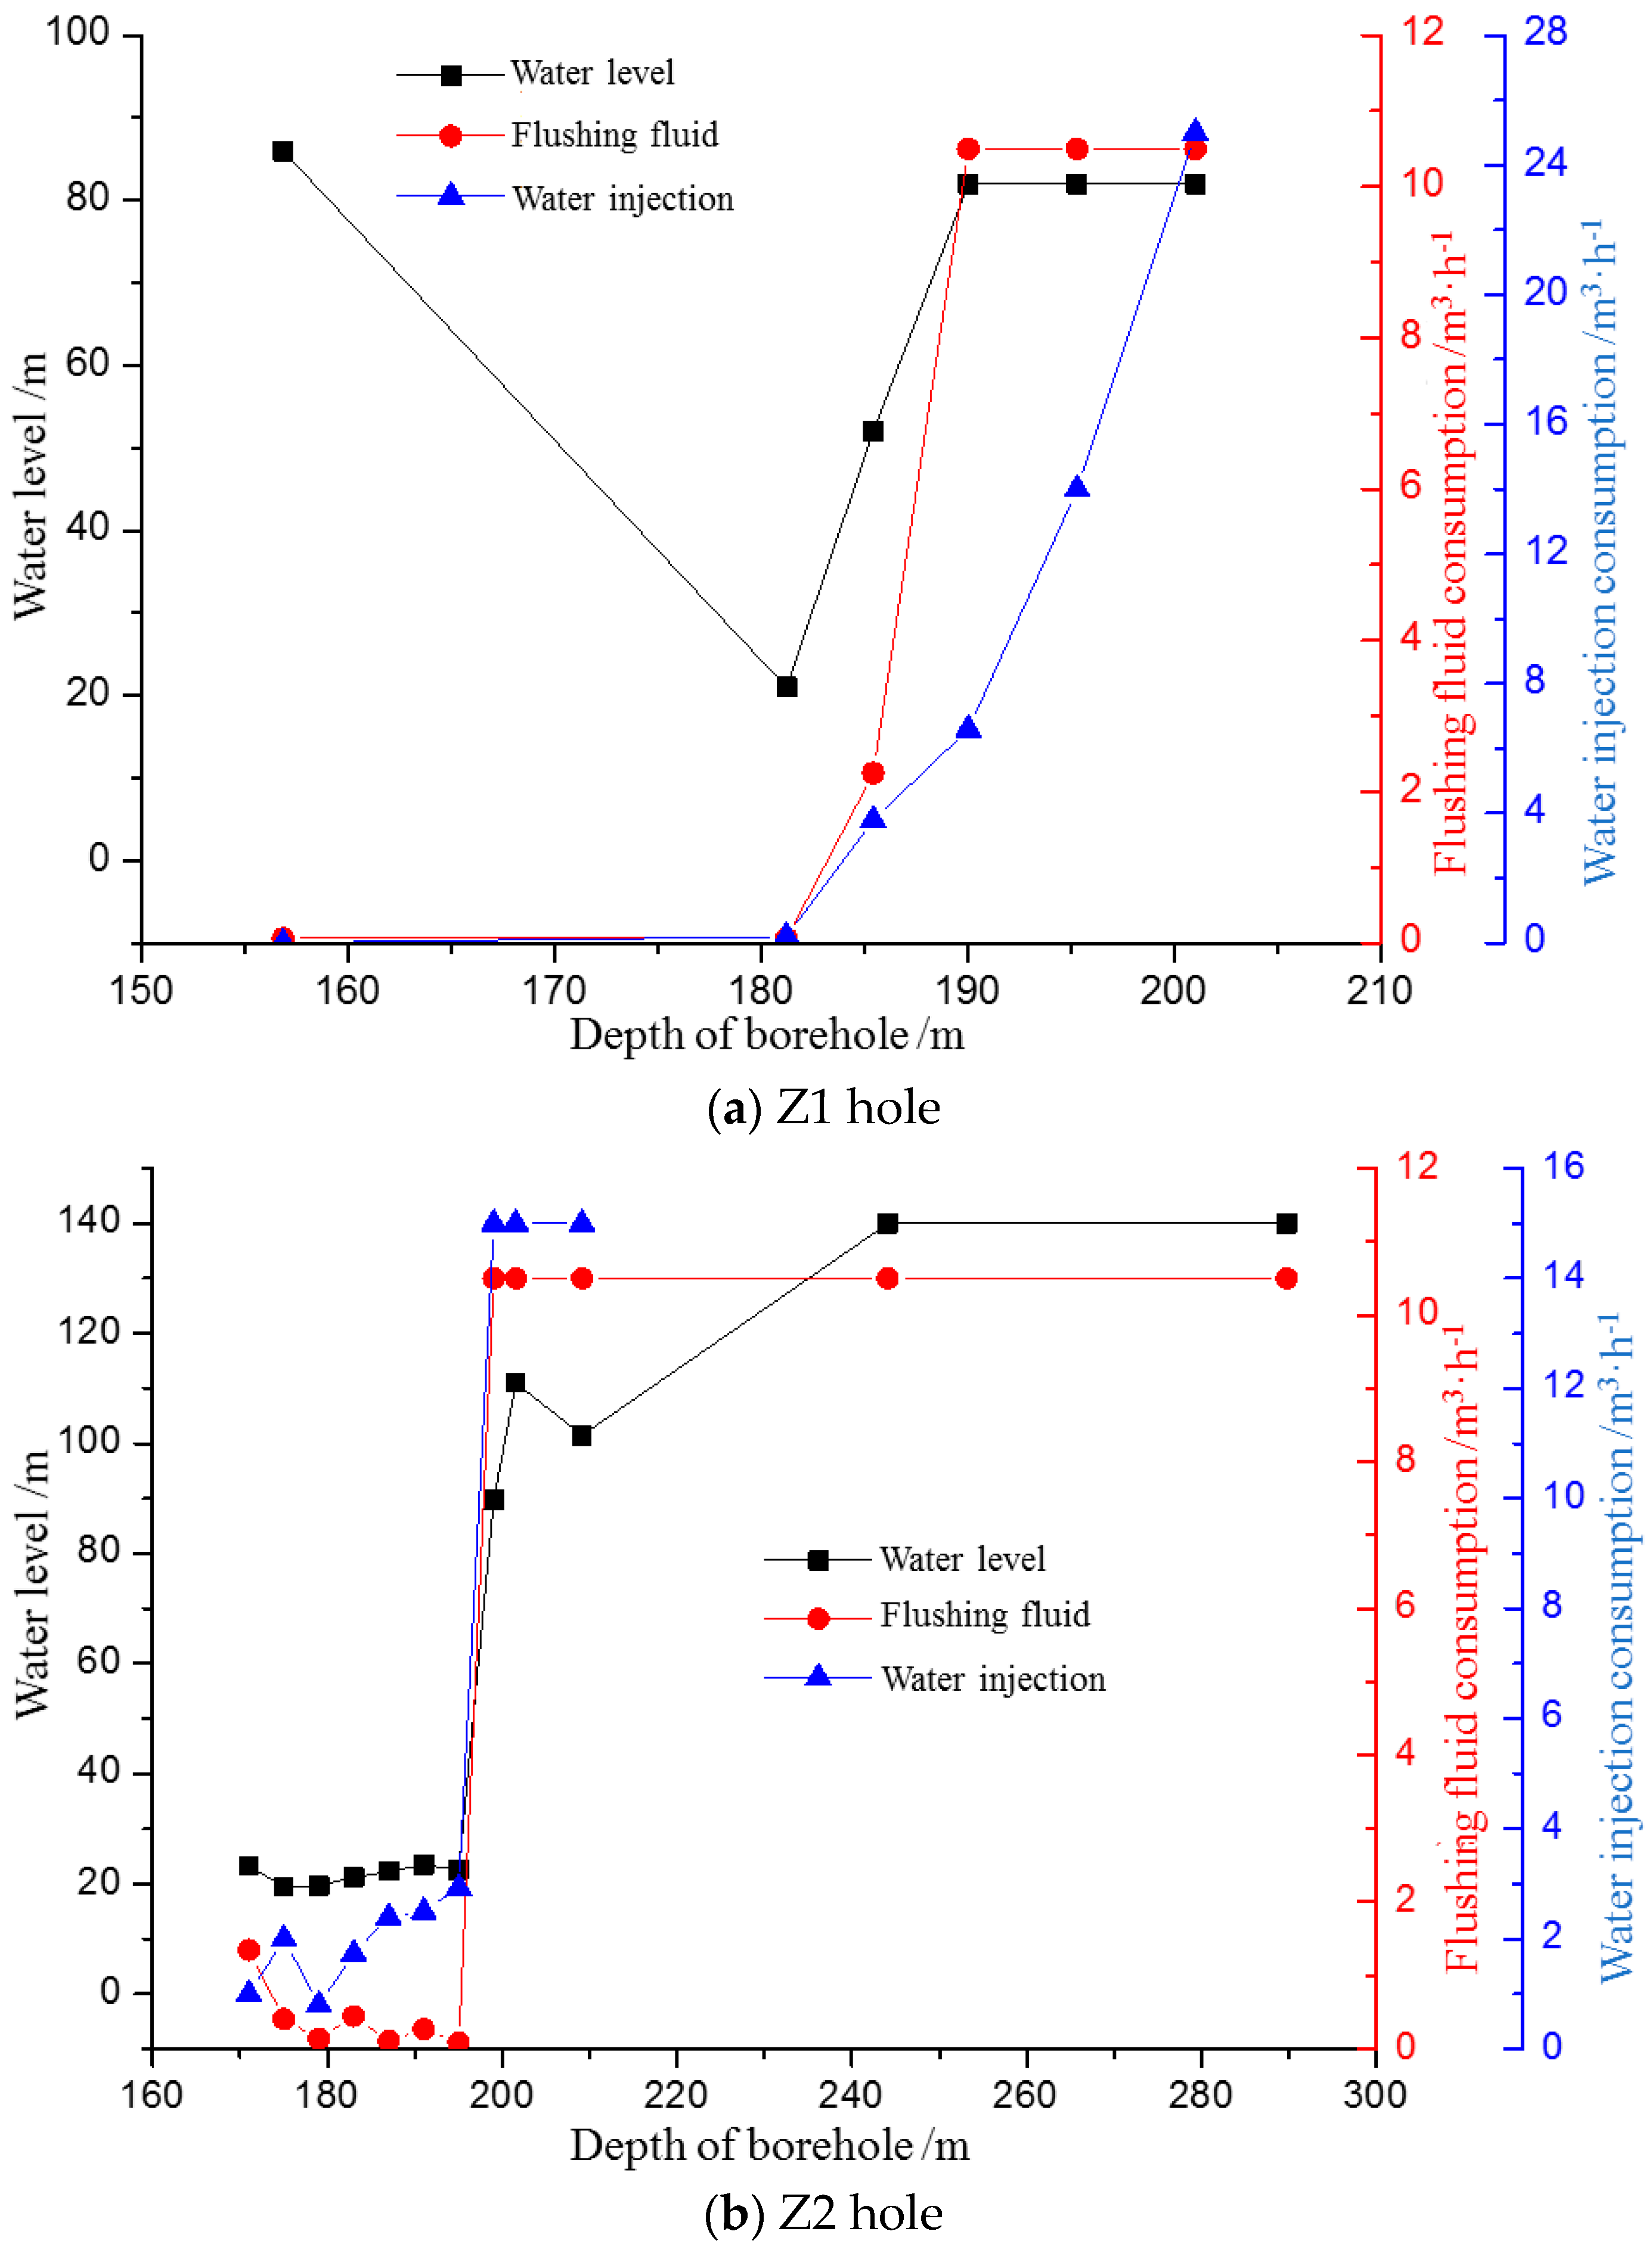
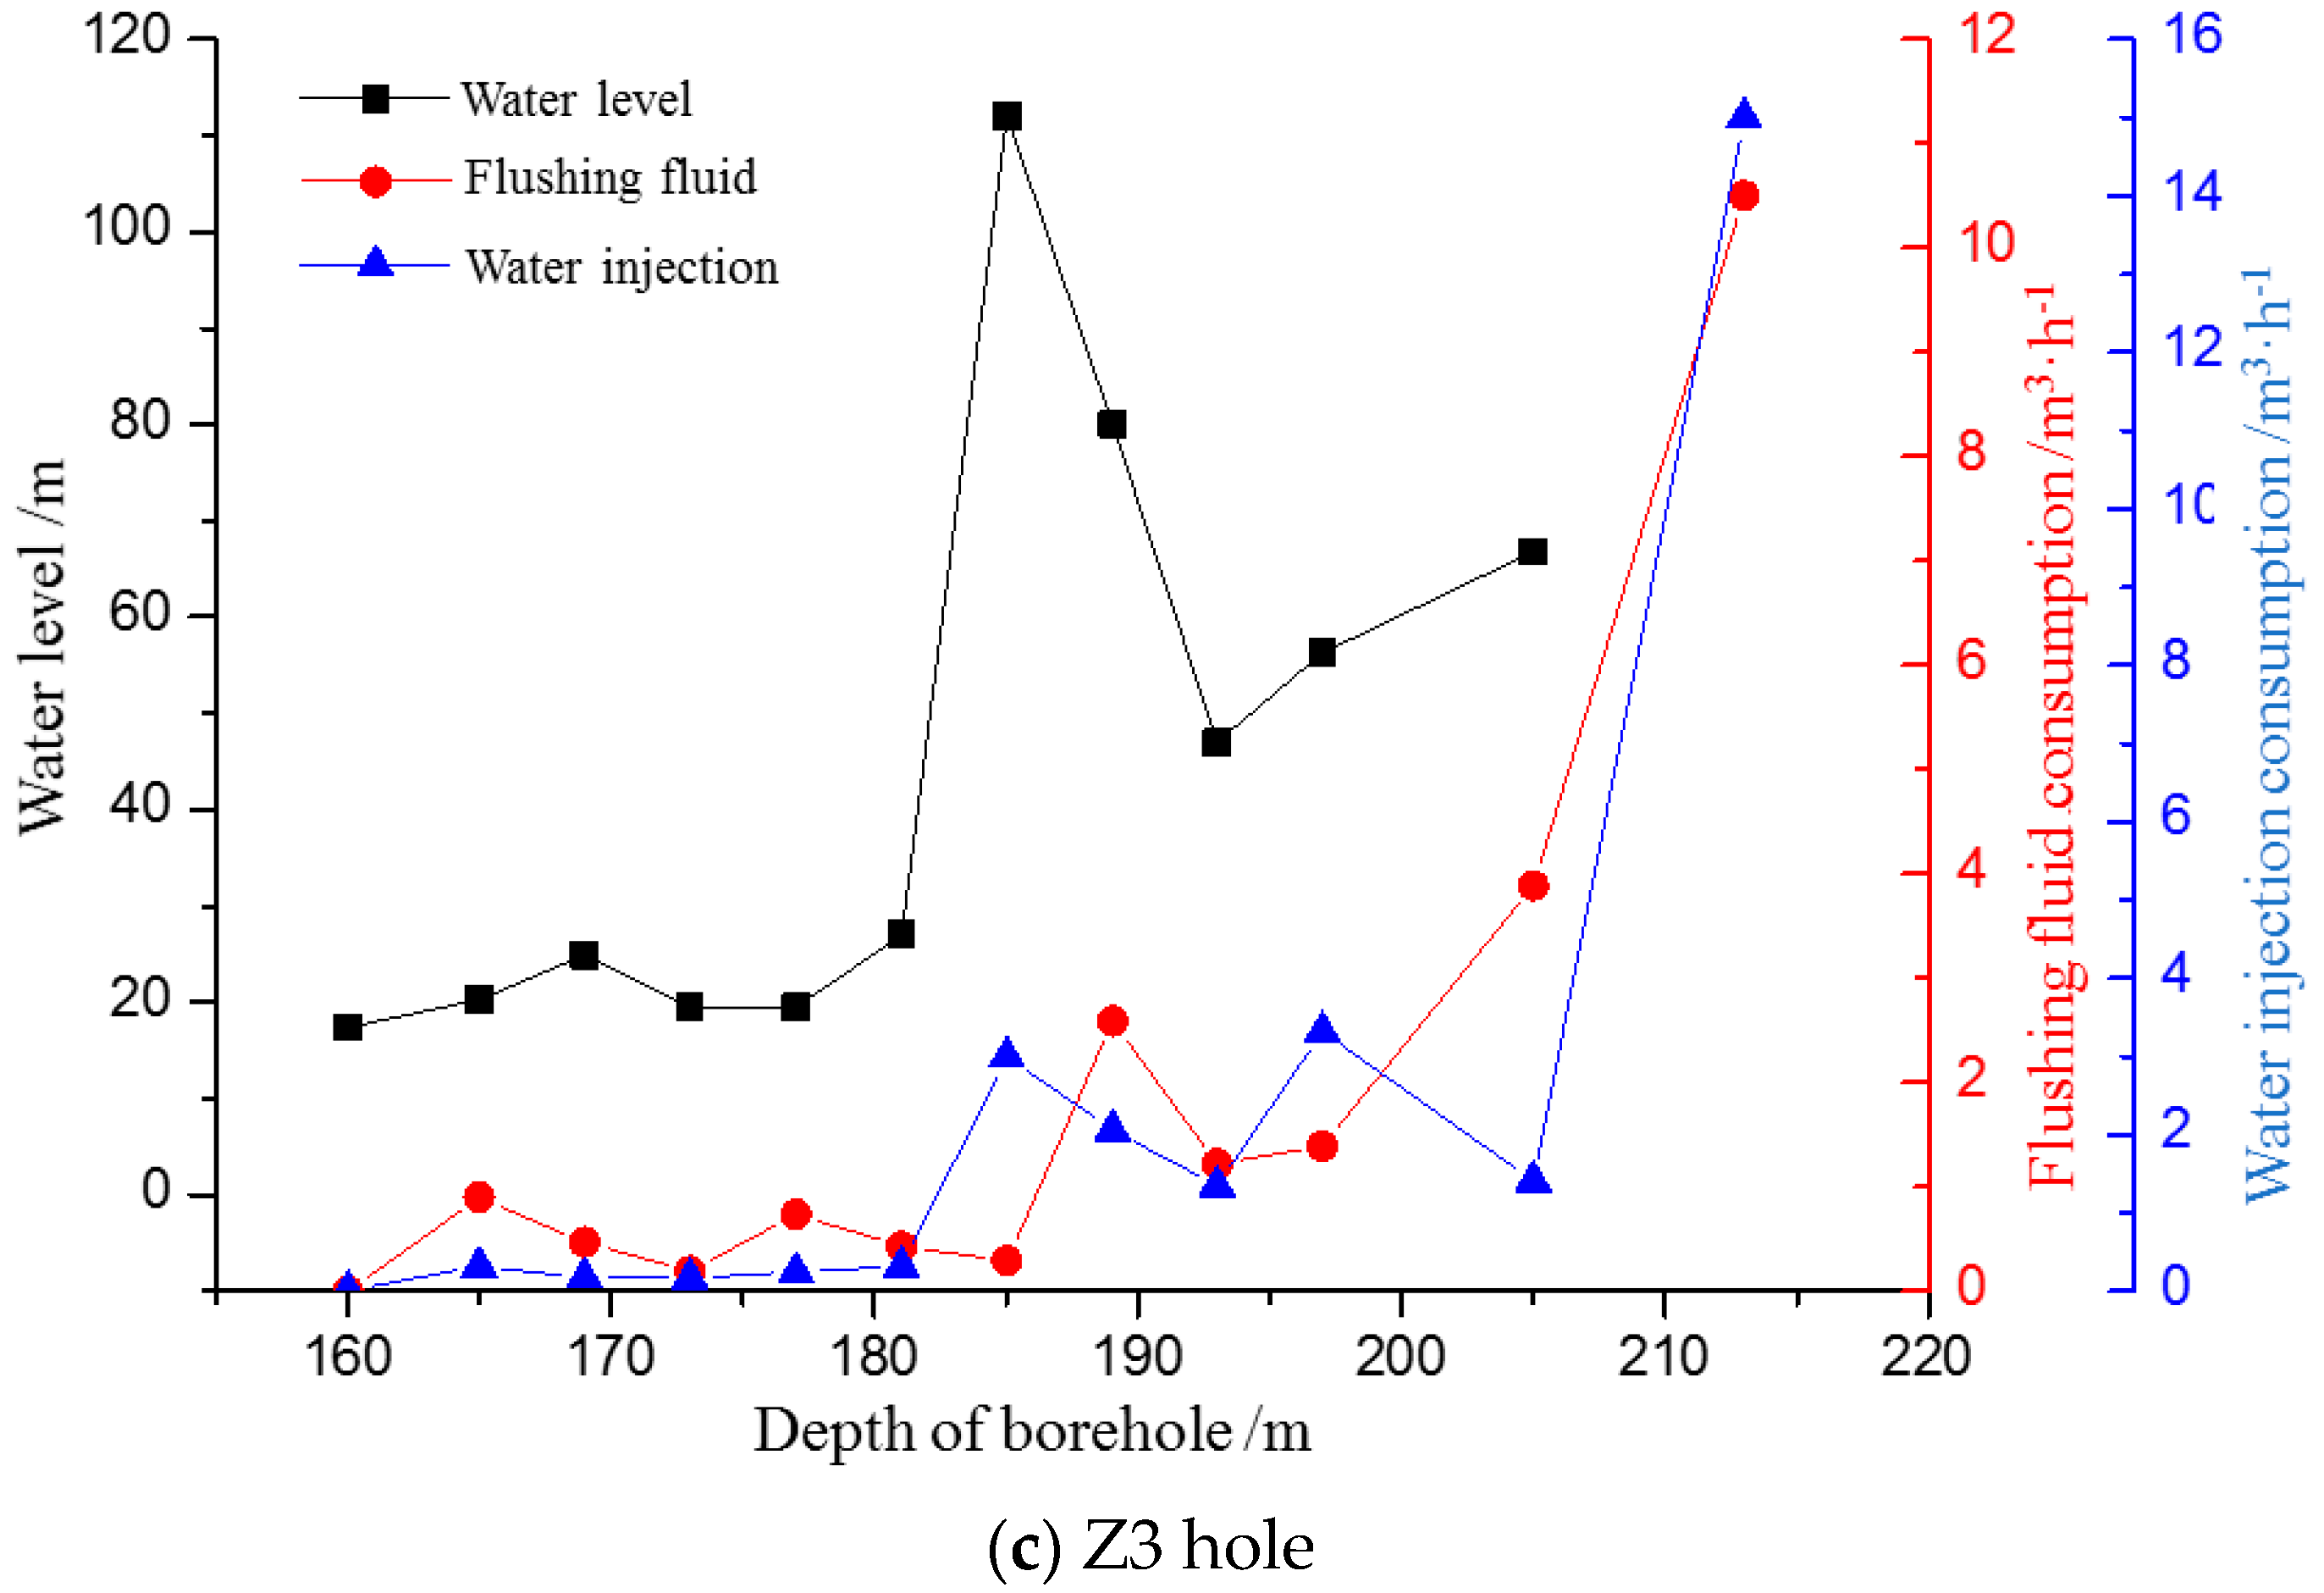
Figure 10.
Development pattern of water flowing fractured zone after caving at the 7802 face.

Figure 11.
Model on KS fracturing and fracturing apertures.


Table 1.
Physical and mechanical parameters of strata.
| Lithology | Thickness/m | Density/kg/m3 | Elastic Modulus/GPa | Poisson’s Ratio | Tensile Strength/MPa | Cohesive Force/MPa | Angle of Internal Friction/° | Key Stratum Location |
|---|---|---|---|---|---|---|---|---|
| Mudstone | 24 | 2500 | 12 | 0.30 | 1.2 | 4.8 | 28 | |
| Siltstone | 12 | 2570 | 14 | 0.28 | 1.4 | 5.0 | 33 | |
| Mudstone | 28 | 2500 | 12 | 0.30 | 1.2 | 4.8 | 28 | |
| Medium Sandstone | 12 | 2700 | 22 | 0.25 | 2.8 | 8.7 | 38 | KS I |
| Mudstone | 24 | 2500 | 12 | 0.30 | 1.2 | 4.8 | 28 | |
| Coarse Sandstone | 16 | 2750 | 24 | 0.26 | 2.6 | 8.4 | 36 | KS II |
| Mudstone | 12 | 2500 | 12 | 0.30 | 1.2 | 4.8 | 28 | |
| Medium Sandstone | 8 | 2700 | 22 | 0.25 | 2.8 | 8.7 | 38 | |
| Mudstone | 24 | 2500 | 14 | 0.30 | 1.2 | 4.8 | 28 | |
| Fine Sandstone | 12 | 2650 | 20 | 0.24 | 3.0 | 9.2 | 34 | KS III |
| Sandy Mudstone | 16 | 2560 | 14 | 0.28 | 1.4 | 5.0 | 30 | |
| Mudstone | 9 | 2500 | 12 | 0.30 | 1.2 | 4.8 | 28 | |
| Medium Standstone | 6 | 2700 | 22 | 0.25 | 2.8 | 8.7 | 28 | KS IV |
| Mudstone | 4 | 2500 | 12 | 0.30 | 1.1 | 4.8 | 23 | |
| Carbonaceous Mudstone | 1 | 2500 | 12 | 0.32 | 1.0 | 2.3 | 23 | |
| 3 Coal | 6 | 1300 | 3 | 0.35 | 0.15 | 1.0 | 28 | |
| Sandy Mudstone | 40 | 2560 | 14 | 0.28 | 1.4 | 5.0 | 35 |
© 2017 by the authors. Licensee MDPI, Basel, Switzerland. This article is an open access article distributed under the terms and conditions of the Creative Commons Attribution (CC BY) license (http://creativecommons.org/licenses/by/4.0/).
Share and Cite
MDPI and ACS Style
Du, F.; Gao, R. Development Patterns of Fractured Water-Conducting Zones in Longwall Mining of Thick Coal Seams—A Case Study on Safe Mining Under the Zhuozhang River. Energies 2017, 10, 1856. https://doi.org/10.3390/en10111856
AMA Style
Du F, Gao R. Development Patterns of Fractured Water-Conducting Zones in Longwall Mining of Thick Coal Seams—A Case Study on Safe Mining Under the Zhuozhang River. Energies. 2017; 10(11):1856. https://doi.org/10.3390/en10111856
Chicago/Turabian StyleDu, Feng, and Rui Gao. 2017. "Development Patterns of Fractured Water-Conducting Zones in Longwall Mining of Thick Coal Seams—A Case Study on Safe Mining Under the Zhuozhang River" Energies 10, no. 11: 1856. https://doi.org/10.3390/en10111856
Note that from the first issue of 2016, this journal uses article numbers instead of page numbers. See further details here.