Coal Supply Chains: A Whole-Process-Based Measurement of Carbon Emissions in a Mining City of China

1
School of Land Science and Technology, China University of Geosciences, Beijing 100083, China
2
China Three Gorges Corporation Chongqing Branch, Chongqing 401147, China
3
Key Laboratory of Land Consolidation and Rehabilitation, Ministry of Land and Resources, Beijing 100083, China
4
Land Consolidation and Rehabilitation Center, Ministry of Land and Resources, Beijing 100035, China
*
Author to whom correspondence should be addressed.
Energies 2017, 10(11), 1855; https://doi.org/10.3390/en10111855
Submission received: 10 October 2017
/
Revised: 7 November 2017
/
Accepted: 9 November 2017
/
Published: 13 November 2017
(This article belongs to the Special Issue Selected Papers from the 8th Annual Conference of Energy Economics and Management)
Abstract
:The purpose of the study is to understand the carbon emissions in the coal supply chains of a mining city. The paper employed a conceptual methodology for the estimation of carbon emissions in the four processes of coal mining, selection and washing, transportation and consumption. The results show that the total carbon emission of the coal supply chain in Wu’an is up to 3.51 × 10¹⁰ kg and is mainly sourced from the coal mining and consumption, respectively accounting for 13.10% and 84.62%, which indicates that deep coal processing plays a more critical determinant in coal production and consumption. Among the pillar industries, the carbon emissions from the steel industry accounts for 85.41% of the total in the coal consumption process, which indicates that the structure of carbon emissions is dependent on the local industrial structure. Additionally, the carbon directly from CO2 accounts for 89.46%. Our study is not only to be able to supply references for the formulation strategy of a low carbon city, but also to provide a new approach to urban development patterns with a new view for coal resource management.
1. Introduction
Over the recent decades, global carbon emissions have been experiencing a rapid increase owing to continued incredible economic growth and soaring carbon-intensive fossil-fuel consumption [1,2,3]. Such a significant increment of carbon emissions may induce climate change, sea level rise, and global temperature increases and shoreline erosion, which bring environmental impacts [4,5]. The IPCC (Intergovernmental Panel on Climate Change) affirms that greenhouse gases (GHG), in particular carbon emissions, from human activities has been the dominant reason for the observed global warming since the mid-20th century [6]. As one manifestation generated by industrialization, the loss of coal reserves has become one cause of man-made environmental liabilities [7], and its production concerns the mitigation of climate change [8]. Currently, coal provides about 30% of global primary energy needs, and remains a key primary energy resource globally [9,10], which consequently creates a big source of greenhouse gas emissions [11]. Environmentally, the country inventories of greenhouse gas emission sources and sinks are requested and commenced with the carbon emission of fossil fuels [12,13]. Crossing the national scale, like the US and Australia [14,15], to the local scale, like the Northwest of the UK [16], Beijing [17], etc., the calculation of carbon emissions generated by the consumption of fossil fuels has been treated as a key governmental task and is the concern of international scientific communities [18].
As a commodity, coal is experiencing the whole process from its production to consumption. The process in this cycle requires inputs and produces outputs, which include both materials and energy, and it transforms and dissipates energy in different ways [19]. To generate energy, the operation phase is extended to the mining and transportation of coal (upstream processes) as well as waste disposal and the recovery of land (downstream processes) [20]. However, at the same time, the various unfavorable environmental effects are simultaneously produced [21], including carbon emissions and their induced disasters [22]. Responding to the whole process of coal exploration and utilization, the carbon footprint is traced and measured by coal supply chains from mining, selection and washing, transportation, distribution and consumption [23,24], especially in the process of power generation [25,26]. Besides, the research into carbon emissions from energy consumption lists is gradually transited to the side view of product consumption [27,28,29], and the relevant method for carbon emissions is adopted to estimate the emission coefficient of each stage in the coal-extracted and -fired process [30,31]. Clearly, the carbon emissions associated with the coal industry completely follow the whole process from production to consumption [32].
The measure method, material balance method and discharge coefficient method are the three major adopted ways to estimate the carbon emissions from coal and other energy sources [33]. In general, there are two methods to calculate the coal bed methane emissions in the coal mining procedure: one is the IPCC guidelines for national greenhouse gas inventories, which combines the coal bed methane with the coal production [34], and the other is the measure method, including the gas concentration–depth relationship method, mine gas emission method and analogy method [35]. Accordingly, the model analysis method becomes the most effective method due to the complexity of research that carbon emission sources are related to all aspects of human production and living [36,37,38,39]. Provably, the framework of carbon emissions in coal power generation, which is composed of coal mining, coal transporting, coal combustion and waste disposal, has been modeled and examined [40].
As reported, it can be argued that the perspectives and objects of these researchers are mainly focused on a single aspect, such as coal-fired electricity or the steel industry chain rather than all industrial sectors which use coal as the main energy power [20,41,42,43,44]. Currently, many countries are involved in this research field, including China [45]. In the process of industrialization and urbanization in China, coal consumption accounts for 70% of energy consumption [46], and a characteristic significance exists in that it concentrates on the electricity, steel, cement and chemical industries. Moreover, in the foreseeable future, the coal will remain the dominating fuel and there is a great potential that its demand will be set to increase [47]. Therefore, understanding the carbon flows within the human–environment nexus will help to promote human well-being while protecting the earth’s living systems [48]; besides, the carbon emissions in coal supply chains is of great importance for climate change mitigation and associated policy-making in developing countries. Based on these research gaps and possible contributions to urban sustainability, we choose Wu’an, a typical Chinese mining city, as a study case, and attempt to (1) establish the link of carbon emissions and coal supply chains; (2) measure and quantify the carbon emission in coal supply chains from coal mining, selection and washing, transportation, and consumption; and (3) create an understanding of land use changes in mitigating carbon emissions in the process of coal transportation. Our study, which regards the four main coal consumption sectors as a whole object in the coal consumption link, can improve the accuracy and rationality of the coal supply chain system.
2. Materials and Methods
2.1. General Situation of the Study Area
Wu’an, a mining city, belonging to the Hebei Province of China, lies at the eastern foot of the Taihang Mountains, and is located at 113°45′–114°22′ E, 36°28′–37°02′ N (Figure 1), which has a surface area of 1819 km2. Wu’an is rich in mineral resources, such as coal, iron, cobalt, aluminum. The total coal reserve is up to 2.3 × 10⁹ t, pig iron is as high as 1.61 × 10⁷ t, crude steel is 1.66 × 10⁷ t, and cement is 1.85 × 10⁷ t. The rapid industrial development increases the demand for coal resources and results in environmental deterioration.
2.2. Data Sources
The data in this study is categorized into three types. The first type is statistical data, including the consumption of coal, cement, electric power, steel, fertilizer production in various industries for the estimation of carbon emissions and local meteorological data for the correction of carbon density. The second type is raster data, including multi-phase remote sensing images, which are used to extract land use types for estimating the underlying indirect carbon emissions from coal transportation. Another type is retrieved from the IPCC guideline for national GHG inventories, including carbon emission coefficients, low calorific values, carbon coefficients of fossil energy, etc. [34].
2.3. Research Methods
2.3.1. Trace of Coal Supply Chains
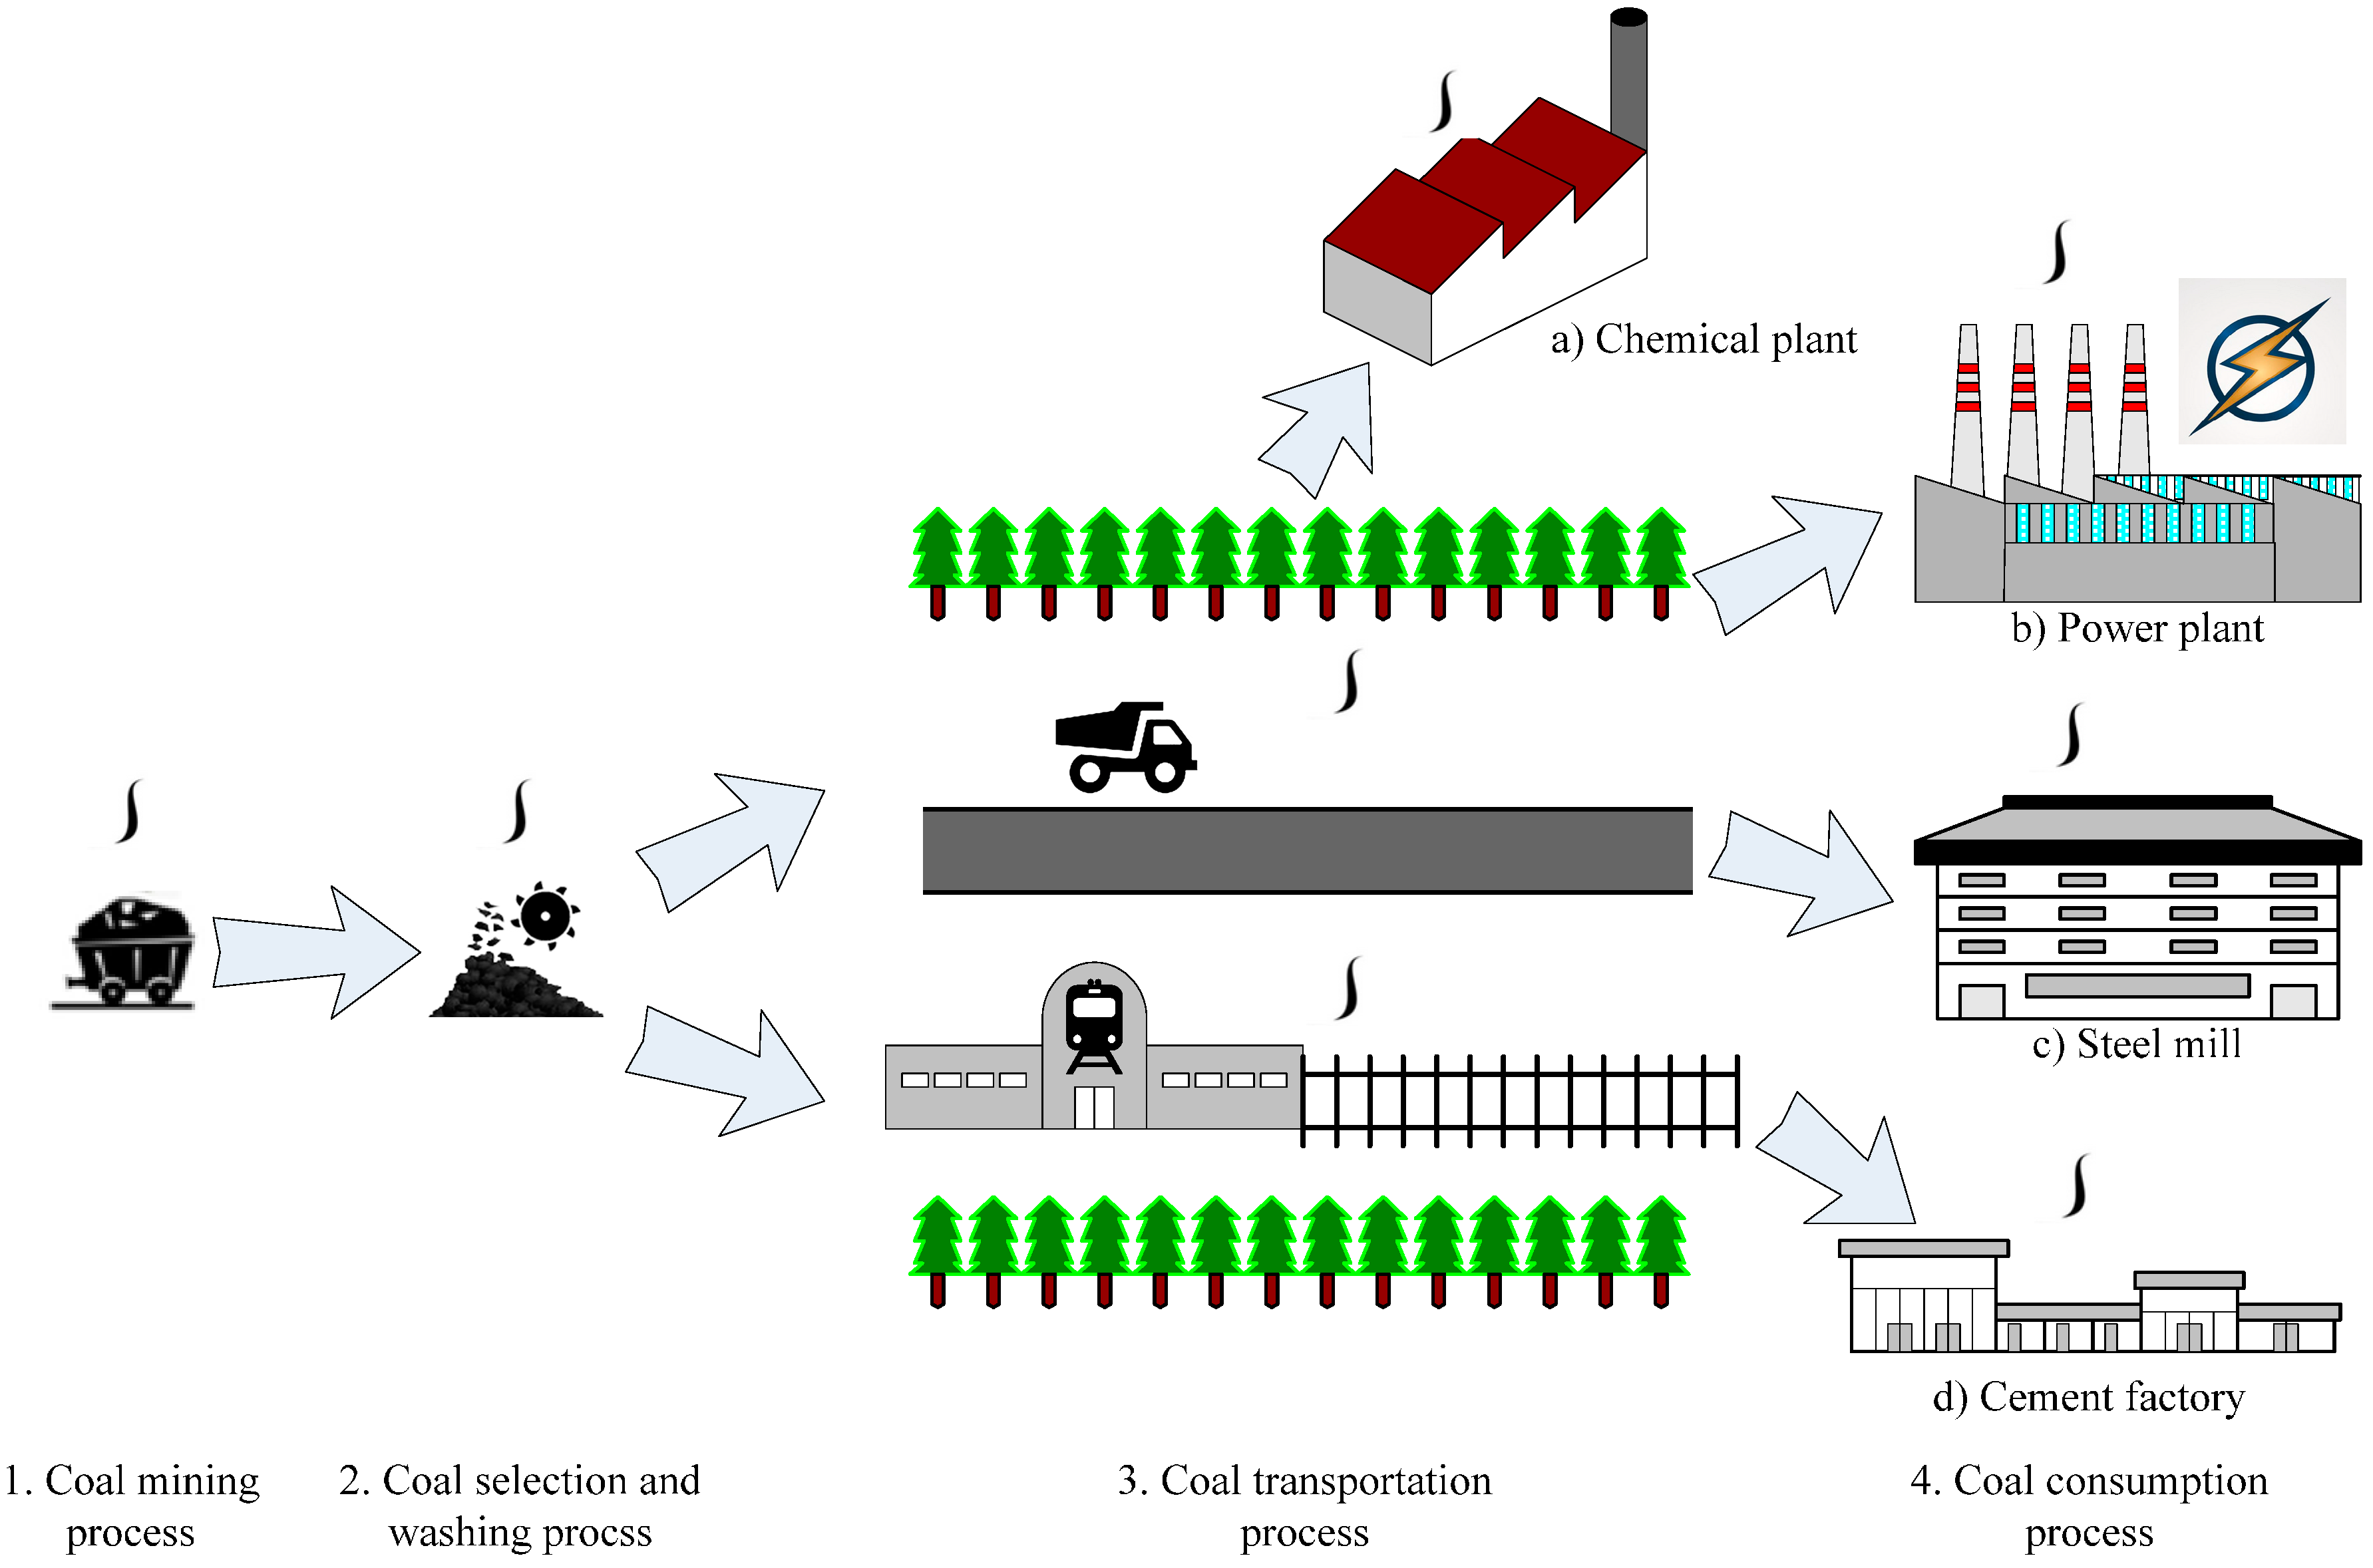
In a mining city, the whole process of coal production and utilization is actually tied to a supply chain, which in our study is composed of the complete activities, including coal mining, coal selection and washing, coal transportation and finally delivered users or enterprises to finish the final consumption of coal products according to the consumer requirements. The electricity, steel, cement and chemical industries were selected as the four main coal consumers in Wu’an according to a local industrial structure and field investigation. Accordingly, the illustration of carbon emission accounts and sources in the coal supply chains of Wu’an mainly follow the whole process from coal production to consumption (Figure 2). The estimate of CO2, N2O and CH4 emissions is involved in the process. Thus, our study is to make it clear that where the greenhouse gases come from, what role the whole process of coal production and utilization plays and which process is the determinant for carbon emissions in a mining city.
The exploitation method, transportation path, and consumption type are the important sectors that affect carbon emissions in the complete coal supply chain. In the process of coal mining and selection and washing, the main carbon sources are from coal, electricity and energy consumption, and also include coalbed methane released in the mining process [45]. The carbon emissions in the coal transportation process mainly come from energy consumption and carbon sequestration by vegetation loss, as the construction of transport networks used by coal transportation has caused damage to the surrounding vegetation. In the coal consumption section, the carbon resources are mainly from fossil energy consumption, power consumption and chemical reaction to raw material production.
As shown in Figure 2, there are four main carbon-emitting processes in the coal supply chain of Wu’an: coal mining, coal selection and washing, coal transportation, and coal consumption. The carbon emissions in the coal supply chain are measured and summed by the carbon emissions of these four processes (Equation (1)).
where Etc is the total carbon emissions in coal supply chains, Em is the carbon emissions in the mining process, Esw is the carbon emissions in the coal selection and washing process, Et is the carbon emissions in the coal transportation process, and Ec is the carbon emissions in the coal consumption process.
2.3.2. Inventory of Carbon Emissions in Coal Supply Chains
Carbon Emissions in the Coal Mining Process
The carbon in the coal mining process is emitted from a coalbed carbon leak, energy consumption and motive power for machinery. The total carbon emissions in this process are calculated by Equation (2).
where Em is the total carbon emissions in mining process, Ecl is the coalbed carbon leak in this process, Eec is the carbon emissions caused by energy consumption, Eep is the carbon emissions caused by electricity consumption which provides motive power for running machinery.
(1) Coalbed carbon leaks in the coal mining process
According to the IPCC guideline for national greenhouse gas inventories [34], the coalbed methane emissions in the coal mining process is calculated by the Equation (3).
where Ecl is the energy consumed in the extraction of coal in the mining process, Pc is the amount of coal production, EFj is the emission factor of greenhouse gas j (Table 1), TFj is the transfer factor of greenhouse gas j under 20 °C and standard atmospheric pressure, GWPj is the ratio of the greenhouse effect of a unit weight of greenhouse gas j emission (Table 2), named global warming potential of greenhouse gas j emission. The GWP value is used in the Kyoto Protocol of the United Nations Framework Convention on Climate Change as a metric for weighing the climatic effect of the emission of different GHGs.
(2) Carbon emissions caused by energy consumption
Underground mining is the main approach in Wu’an. The extraction of coal resources generally depends on energy consumption, including direct energy consumption such as the burning of fossil fuels for boilers [49] and the indirect electricity consumption for mining equipment [30]. They are estimated by Equations (4) and (5).
where DEec is the direct carbon emission caused by energy consumption in the coal mining process, cffi is the amount of combusted fossil fuel i, NHVi is the net heating value of combusted fossil fuel i, cci is the carbon content of combusted fossil fuel i, ori is the oxidation ratio of fossil fuel i, rc is the conversion ratio between CO2 and C (44/12). This paper extracts the parameters from the “2006 IPCC Guidelines for National Greenhouse Gas Inventories” [34,50] (Table 3).
where IEec is the indirect carbon emission caused by energy consumption in coal mining process, Ce is the electricity consumption, Pc is the coal equivalent consumption for 1 kWh power, Li is the emission coefficient of greenhouse gases. The emission coefficient of CO2 is 840.1914 g CO2/kWh, and that of N2O is 0.053352 g CO2/kWh [30].
Carbon Emissions in the Coal Selection and Washing Process
Coal spontaneous combustion to a certain degree happens in the process of coal selection and washing [31], besides, electricity consumption also drives the equipment operations in that process, which both induce carbon emissions [43]. Similarly, the carbon is sourced from the two sources of direct and indirect emissions. The Equations (4) and (5) are similarly referenced for the calculation.
Carbon Emissions in the Coal Transportation Process
Mining and land use activities within the transport network are associated with energy consumption and carbon emissions. The sources are mainly from the combustion of fossil fuels for driving transport vehicles and the reduction of carbon sequestration capacity caused by vegetation loss along transportation lines, respectively regarded as direct and indirect carbon emissions.
(1) Direct carbon emissions in the coal transportation process
The calculation of direct carbon emissions is based on the coal transport modes and their corresponding consumption of fossil fuels for driving vehicles. The main means of coal transportation are railway and road in Wu’an and diesel fuels are combusted in the process of railway transport, while the road transport generally uses medium-duty trucks, which also provide the momentum by diesel fuels. The direct carbon emissions in coal transportation are calculated by Equation (6).
where DEct is the direct carbon emission in the coal transportation process, Pc is the amount of coal production, pi is the proportion of the transport capacity of mode i to the total, li is the average transport length of mode i, fci is the fuel consumption of mode i, NHVi is the net heating value of diesel fuels consumed by mode i, cci is the carbon content of diesel fuels consumed by mode i, and ori is the oxidation ratio of diesel fuels consumed by mode i.
According to the local survey, the ratio of transport volumes by railway and road is 1:3. The transport lengths of railways and roads are 164.78 km and 386.22 km, respectively, which were extracted from the transport network maps. The NHV of diesel fuels is 42,652 kJ/kg (Table 3). The fuel consumption of a diesel locomotive is 24.6 kg/(104 t·km) [30]. In general, the fuel consumption of road transport trucks is around 500–700 kg/(104 t·km) [51], and the value in this study is 650 kg/(104 t·km) according to local transport and vehicle conditions. The carbon content of diesel fuels is 20.2 kg/GJ (Table 3). The oxidation ratio is assumed as 100% (default value).
(2) Indirect carbon emissions in the coal transportation process
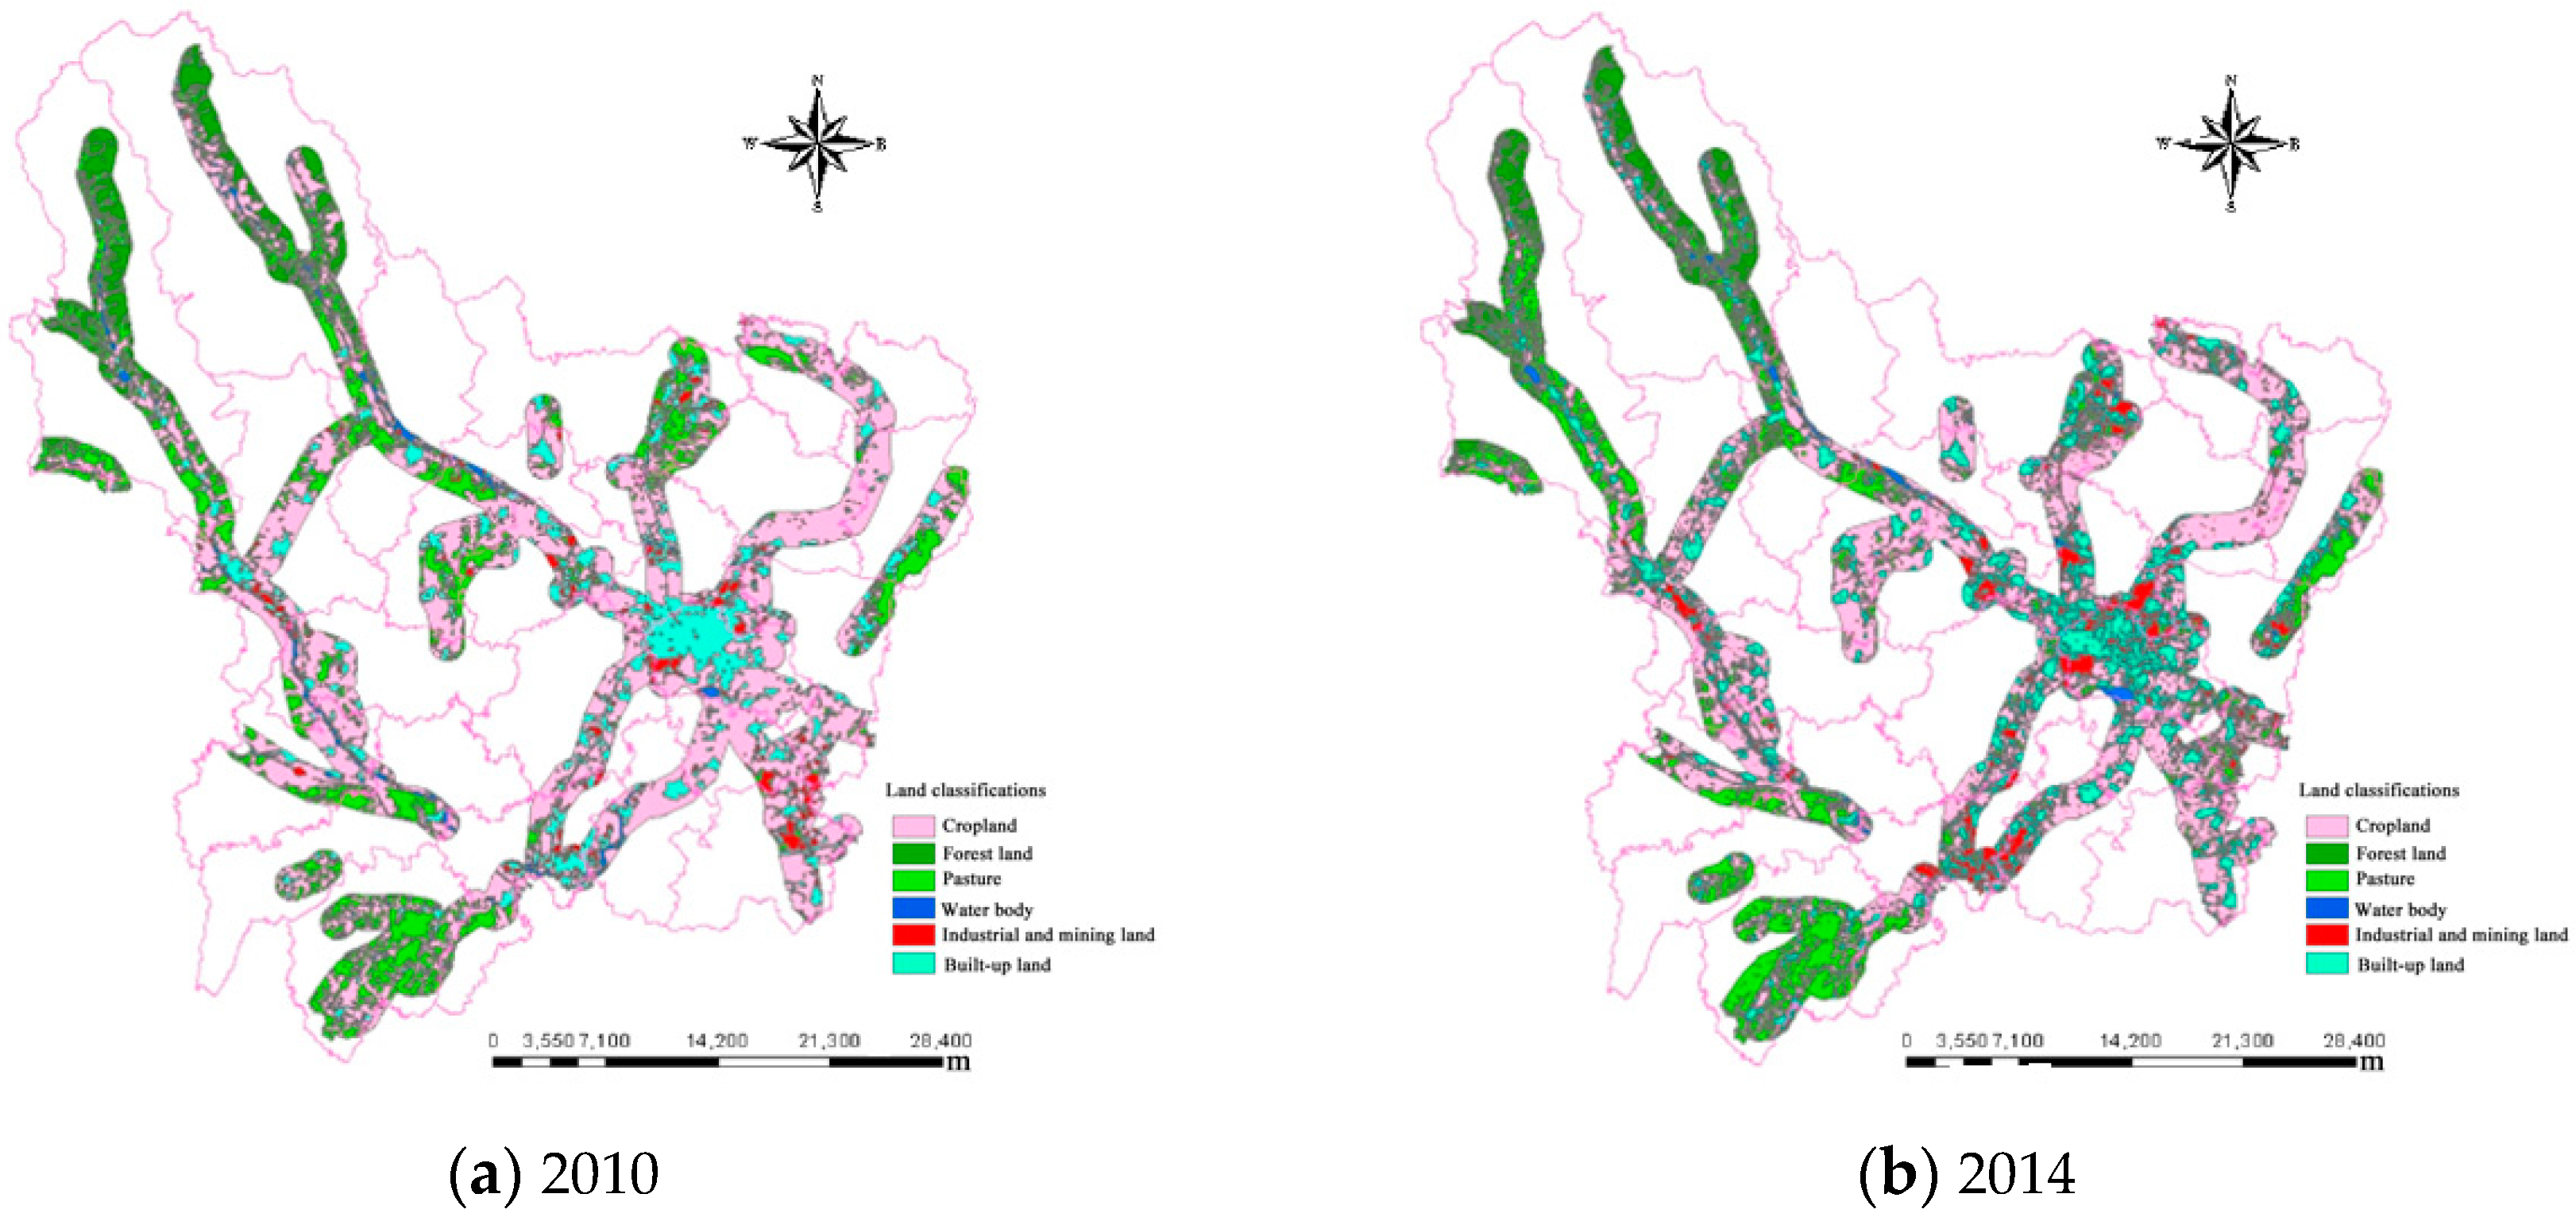
The carbon emissions caused by ground vegetation destruction has a profound impact on carbon fluxes [52]. The carbon sequestration capacity of vegetation is lost owing to the land use conversion within coal transport networks [53]. Clearly, land use change is a massive source of carbon emissions and a significant contributor to carbon emissions [54,55,56]. In Wu’an, long-term coal transportation accelerates the conversion of vegetative cover to bare land, which results in reducing the original vegetation carbon sequestration capacity. Thus, the calculation of carbon sequestration reduction relies on the land transfer matrix, followed by the steps [57]: (1) classify land use types by remote sensing images; (2) extract the transport networks from land use maps; (3) treat railway and road as the center and select 1000 m as the buffer distance acting on the surrounding land types to obtain the land transfer matrix (Figure 3 and Figure 4). The loss of carbon sequestration by land use change along coal transport lines is measured by Equation (7).
Lcs is the loss of carbon sequestration in coal transportation process, ∆Ai−j is the total area of land use type i that is converted to all other land use types j, k is the carbon density of corresponding land type. For cropland subjected to a cycle of planting to harvest within one year, the substantial carbon accumulation by vegetative cover is ignored. Additionally, water bodies play an insignificant role in carbon sequestration, so this part is also ignored. Thus, the carbon densities of forest and pasture are substantially needed, which are determined by the local context (temperature, precipitation, light intensity, etc.) and reported literatures [58,59,60].
Carbon Emissions in the Coal Consumption Process
According to the Wu’an context, the electricity, steel, cement and chemical industries were selected as the coal consumption objects for further study. To avoid double counting, the carbon emissions caused by power consumption in these non-electricity industries will no longer be calculated separately, and the electricity industry is treated as a separate object. The calculation of carbon emissions in different industries are delineated as follows:
(1) Electricity industry
The electricity industry is currently the major driver of coal demand in China. The carbon emission is sourced from the two aspects of coal combustion for power generation and residue disposal. In our study, the estimate of carbon emissions similarly follows Equations (4) and (5).
(2) Steel industry
According to a variety of carbon sources in the steel industry, the carbon emissions come from the combustion of fossil fuels, chemical reactions in the production process, and electricity consumption for driving production. The estimate of the first carbon source is calculated by Equation (4), and raw coal, cleaned coal, coke, diesel fuel and gasoline are involved in the process. The estimate of the third carbon source is included in the calculation of the electricity industry, so this part is ignored. The estimate of the second carbon source is estimated by the reduction reaction for generating carbon dioxide. In general, 70% of consumed coal is used for coking, and 75% of coke is for combustion, and the rest (25%) is regarded as the reducing agent. The reduction reaction [43] and carbon emissions follow Equations (8) and (9)
where Esi is the carbon emission by the reduction reaction in steel production process, Mra is the mass of reducing agent (25% of coke consumption), and EF is the emission factor (here it is 3.1 [12]).
(3) Cement industry
The carbon emissions in the cement industry are sourced from the decomposition of limestone, the combustion of fossil fuels, and electricity consumption for driving production. The estimate of the first carbon source is calculated by Equation (10) [61], and the estimate of the second carbon source is estimated by Equation (4) (raw coal and diesel fuel involved), and the last source is estimated in the electricity industry.
Eci is the carbon emission by the decomposition of limestone in cement industry, Pcm is the production of cement, pck is the proportion of clinker in limestone (here it is 61%), pl is the proportion of lime in the clinker (here it is 68% [61]), and rc is the conversion ratio between CO2 and lime (44/56).
(4) Chemical industry
In our study, the carbon emissions in the chemical industry are sourced from the consumption of fertilizers and electricity consumption for driving production. Similarly, the estimate of electricity consumption is involved in the electricity industry, and the use of fertilizers generates carbon in the steps of production and transportation, expressed by Equation (11).
Echi is the carbon emission caused by the consumption of fertilizers in the chemical industry, Cf is the consumption of fertilizers, and kf is the summed coefficient of carbon emissions in the steps of production and transportation (here it is 857.54 g/kg [62]).
2.3.3. Analysis and Interpretation
To cater for the research objectives, we employed the comparative analysis method and the statistical analysis method to recognize the critical devotion(s) to carbon emissions in the coal supply chains. This study conducted three layers for comparative and statistical analyses of separate process types, industrial types and greenhouse gas types. The results are mainly characterized by the structure of carbon emissions in these layers, and the possible causes and effects are analyzed to link the coal supply chain.
3. Results and Analysis
3.1. Calculation of Carbon Emissions in Coal Supply Chains
3.1.1. Carbon Emissions in the Coal Mining Process
According to the carbon sources in coal mining, the carbon emissions were calculated from coalbed carbon leaks and energy consumption.
(1) By coalbed carbon leak
The coal mining process generally leaks CH4 and CO2. In 2014, the production of coal in Wu’an was 9.44 million tons, and the mining depth was more than 400 m. According to the Equation (3), the emissions of CH4 and CO2 are estimated as follows:
- CH4: 9.44 × 106 × 25 × 0.67 = 1.58 × 10⁸ kg CH4 = 1.58 × 108 × 23 kg CO2 = 3.64 × 10⁹ kg CO2
- CO2: 9.44 × 106 × 25 × 0.8 = 1.89 × 10⁸ kg CO2
- Total: 3.64 × 10⁹ + 1.89 × 108 = 3.83 × 10⁹ kg CO2
(2) By energy consumption
As analyzed above, the energy consumption in the coal mining process mainly comes from two sources: coal consumption for heating boilers in the mining area and electricity consumption for the mining equipment [45]. The two categories of carbon emissions are calculated by Equations (4) and (5).
- Coal consumption for heating boilers:CO2: 27.2 × 9.44 × 106 × 20,908 × 25.8 × 10−6 × 44/12 = 5.08 × 10⁸ kg CO2
- Electricity consumption for mining equipment:CO2: 33.7 × 9.44 × 106 × 840.1914 × 10−3 = 2.67 × 10⁸ kg CO2N2O: 33.7 × 9.44 × 106 × 0.053352 × 10−3 = 1.70 × 10⁴ kg N2O = 1.70 × 104 × 296 kg CO2 = 5.03 × 10⁶ kg CO2Total: 2.67 × 10⁸ + 5.03 × 106 = 2.72 × 10⁸ kg CO2
- Total:CO2: 5.08 × 10⁸ + 2.72 × 108 = 7.80 × 10⁸ kg CO2
(3) Total carbon emissions in the coal mining process
The total carbon emission in coal mining process is summed by the emissions caused by coalbed carbon leaks and energy consumption.
CO2: 3.83 × 10⁹ + 7.80 × 108 = 4.61 × 10⁹ kg CO2
3.1.2. Carbon Emissions in the Coal Selection and Washing Process
In coal selection and washing, the source of carbon emissions is from electricity consumption by equipment and spontaneous coal combustion. It is estimated that, at the present stage in China, the energy consumption per ton of raw coal for the selection and washing processes is approximately 3 kWh, and the spontaneous loss rate is approximately 1%. Therefore, the carbon emissions in this process include:
- By coal combustion:CO2: 9.44 × 109 × 1% × 20,908 × 25.8 × 10−6 × 44/12 = 1.87 × 10⁸ kg CO2
- By electricity consumption:CO2: 9.44 × 106 × 3 × 840.1914 × 10−3 = 2.38 × 10⁷ kg CO2N2O: 9.44 × 106 × 3 × 0.053352 × 10−3 = 1.51 × 10³ kg CO2 = 1.51 × 103 × 296 kg CO2 = 4.50 × 10⁵ kg CO2Total: 2.38 × 10⁷ + 4.50 × 105 = 2.43 × 10⁷ kg CO2
- Total carbon emission in coal selection and washing process:CO2: 1.87 × 10⁸ + 2.43 × 107 = 2.11 × 10⁸ kg CO2
3.1.3. Carbon Emissions in Coal Transportation Process
(1) Direct carbon emissions in coal transportation
- By railway transport:CO2: 944 × 25% × 24.6 × 164.78 × 42,652 × 20.2 × 10−6 × 44/12 = 3.02 × 10⁶ kg CO2
- By road transport:CO2: 944 × 75% × 650 × 386.22 × 42,652 × 20.2 × 10−6 × 44/12 = 5.61 × 10⁸ kg CO2
- Total:CO2: 3.02 × 10⁶ + 5.61 × 108 = 5.64 × 10⁸ kg CO2
(2) Indirect carbon emissions in coal transportation
As mentioned above, the 1000 m buffer zones were made along transport lines, and the transfer matrix of land use within buffer zones was extracted through the geographic information system (GIS) (Table 4). It is clear that, before and after intensified mining activities, a lot of cropland, forest, pasture and water bodies are encroached on by industrial and mining land as well as associated built-up land.
According to the Equation (7), the carbon emissions by the reduction of vegetative cover are:
- By forest:CO2: 0.09 × 73.24 × 103 × 44/12 = 2.42 × 10⁴ kg CO2
- By pasture:CO2: (2.26 + 1.09 + 3.32 + 0.91) × 6.20 × 103 × 44/12 = 1.72 × 10⁵ kg CO2
- Total:CO2: 2.42 × 10⁴ + 1.72 × 105 = 1.96 × 10⁵ kg CO2
(3) Total carbon emissions in the coal transportation process
The total carbon emissions in the coal transportation process are summed by direct and indirect carbon emissions.
CO2: 5.64 × 10⁸ + 1.96 × 105 = 5.64 × 10⁸ kg CO2
3.1.4. Carbon Emissions in the Coal Consumption Process
(1) Electricity industry
The electricity consumption of Wu’an in 2014 was 346,028 × 104 kWh. Therefore, the carbon emissions of the electricity industry are measured by:
CO2: 346,028 × 104 × 840.1914 × 10−3 = 2.91 × 10⁹ kg CO2
N2O: 346,028 × 104 × 0.053352 × 10−3 = 1.85 × 10⁵ kg N2O = 1.85 × 105 × 296 kg CO2 = 5.48 × 10⁷ kg CO2
Total: 2.91 × 10⁹ + 5.48 × 107 = 2.96 × 10⁹ kg CO2
(2) Steel industry
- By the combustion of fossil fuels:
- Raw coal:CO2: 41.70 × 107 × 20,908 × 25.8 × 10−6 × 44/12 = 8.25 × 10⁸ kg CO2
- Cleaned coal:CO2: 233.26 × 107 × 26,344 × 26.209 × 10−6 × 44/12 = 5.90 × 10⁹ kg CO2
- Coke:CO2: 610.19 × 107 × 28,435 × 29.2 × 10−6 × 75% × 44/12 = 1.39 × 10¹⁰ kg CO2
- Diesel fuel:CO2: 1.08 × 107 × 42,652 × 20.2 × 10−6 × 44/12 = 3.41 × 10⁷ kg CO2
- Gasoline:CO2: 0.00476 × 107 × 43,070 × 18.9 × 10−6 × 44/12 = 1.42 × 10⁵ kg CO2Total: 8.25 × 10⁸ + 5.90 × 10⁹ + 1.39 × 10¹⁰ + 3.41 × 10⁷ + 1.42 × 105 = 2.07 × 10¹⁰ kg CO2
- By chemical reactionCO2: 610.19 × 107 × 25% × 3.1 = 4.73 × 10⁹ kg CO2
- Total carbon emissions in the steel industry (electricity consumption not included)CO2: 2.07 × 10¹⁰ + 4.73 × 109 = 2.54 × 10¹⁰ kg CO2
(3) Cement industry
- By the combustion of fossil fuels
- Raw coal:CO2: 17.04 × 107 × 20,908 × 25.8 × 10−6 × 44/12 = 3.37 × 10⁸ kg CO2
- Diesel fuel:CO2: 0.0179 × 107 × 42,652 × 20.2 × 10−6 × 44/12 = 5.65 × 10⁵ kg CO2Total: 3.37 × 10⁸ + 5.65 × 105 = 3.38 × 10⁸ kg CO2
- By the decomposition of limestoneCO2: 313.10 × 107 × 68% × 61% × 44/56 = 1.02 × 10⁹ kg CO2
- Total carbon emissions in the cement industry (electricity consumption not included)CO2: 3.38 × 10⁸ + 1.02 × 109 = 1.36 × 10⁹ kg CO2
(4) Chemical industry
The consumption of fertilizers in Wu’an in 2014 was 1.84 × 10⁴ t. Therefore, the carbon emissions of the chemical industry are measured by:
CO2: 1.84 × 107 × 836.08 × 10−3 = 1.54 × 10⁷ kg CO2
(5) Total carbon emissions in the coal consumption process
CO2: 2.96 × 10⁹ + 2.54 × 10¹⁰ + 1.36 × 10⁹ + 1.54 × 107 = 2.97 × 10¹⁰ kg CO2
3.2. Inventory of Carbon Emissions in Coal Supply Chains
According to the measurement model of carbon emissions in coal supply chains, the carbon emissions in different processes can be calculated and compared by using the normalized CO2 equivalents, and thereby the total and subtotal carbon emissions are obtained (Table 5).
3.3. Analysis and Interpretation
3.3.1. Analysis by Different Processes
Based on the streamlined assessment methodology above, it can be concluded that the total carbon emissions of the coal supply chains in Wu’an is up to 3.51 × 10¹⁰ kg. Clearly, the carbon emissions in the coal supply chains are mainly sourced from coal mining and consumption, respectively accounting for 13.10% and 84.62% of the total (Table 6). That is to say, the end consumption of coal resources is the greatest contributor to the carbon emissions of a mining city, which can be the entry point to mitigate the negative effects. Besides, it was found that deep coal processing accelerates the conversion and release of carbon contained in coal resources.
3.3.2. Analysis by Different Industrial Types
Among the industries, the carbon emissions from the steel industry accounts for 85.41% of the total in the coal consumption process, which indicates that the local pillar industry plays a critical role in carbon emissions, see Table 7. Due to the support of the electricity industry for all production operations, coal-fired power also plays a critical role in carbon emissions, and it may even last in Wu’an for the long term. The structure of carbon emissions in different industries is characterized by industrial and economic structures. If the carbon emissions from the electricity consumption in non-consumption processes is categorized as the inventory of the “electricity industry”, the total carbon emissions in this industry can reach 3.26 × 10⁹ kg CO2 (mining process—2.72 × 10⁸ kg, selecting and washing process—2.43 × 10⁷ kg and consumption process—2.96 × 10⁹ kg) accounting for 10.85% (with an increase of about 1%). Even in that case, the steel industry is still the biggest source among the pillar industries in Wu’an, accounting for near 85%. Even so, the carbon emission generated by the steel industry is sourced by the combustion of fossil fuels in the production, rather than the steel itself. Clearly, the industrial structure in a mining city basically determines the structure of carbon emissions.
3.3.3. Analysis by Different Greenhouse Gas Types
In Wu’an, the coal supply chain generally generates three main types of greenhouse gases, including CH4, N2O and CO2. The carbon from CO2 accounts for 89.46% of the total, and the equivalent CO2 converted from CH4 is also an important source for carbon emissions (Table 8). The majority of these emissions results from direct coal combustion. Clearly, the direct carbon emissions are sourced from carbon-related greenhouse gases.
4. Conclusions and Discussion
4.1. Main Achievements
In China, the emergence and development of mining cities mainly depends on coal supply chains, which furnish the energy and economic momentum. Therefore, to achieve a low carbon economy in coal supply chains is the emphasis of sustainable development in mining cities. This study employed a conceptual methodology for the estimation of the whole process-based carbon emissions in a Chinese mining city. The coal supply chain was established from the four processes of coal mining, selection and washing, transportation and consumption. Furthermore, a more comprehensive coal consumption system was established, and the coal consumers in our study were extended to the steel, cement and chemical industries, rather than the simply calculation of coal-fired power plants. The research results show that the end consumption of coal resources is the greatest contributor to the carbon emission of Wu’an, and the local pillar industry plays a critical role.
Human requirements and activities determine land use [63,64], while land use is one of the impact factors of key underlying carbon emissions in coal transportation. Especially in our study, land use change and its impacts on carbon sequestration from coal transportation were considered in the measurement. The analysis of the impact of transport networks on carbon sequestration capacity is the difficulty of the research, but it is also the breakthrough and innovation which relies on the correct interpretation of remote sensing images. We attempted to employ the land use transfer matrix within transport network buffers through remote sensing (RS) and geographic information system (GIS) platforms. Energy consumption is considered an important step to support regional carbon emission mitigation policies. For the coal supply chain, the biggest carbon emissions contributor to a mining city, understanding the carbon flows in the supply chain becomes a precondition for the mitigation of greenhouse gas emissions and for providing systematic regulation and management by the government conveniently.
4.2. Limitations and Uncertainties
The research on the carbon emissions in the coal supply chain is mainly sourced from the whole coal-extracted and -fired process, which determines the carbon emission system of a mining city. As reported, city carbon emissions mainly can be divided into the four types of direct emissions, responsible emissions, indirect emissions and logistic emissions [65]. Based on the comparative analysis, it was found that the coal supply chain also has the same four types of carbon emissions. Direct emissions are represented as carbon emissions caused by local coal production and consumption. Indirect emissions are the consumption of other products that are introduced into the supply chain. At the same time, the coal production not only provides their own energy needs, but a part is delivered to the surrounding towns for energy support, which is regarded as responsible emissions. Moreover, there is also the logistics emission mainly reflected in the transit of coal freight services. Our study adopts a relatively independent objective perspective to study the carbon emissions of a coal supply chain that strips the responsible emissions and logistic emissions, and regards the direct emissions and indirect emissions as the study objects from the entire range independently. This is an innovation point of the article but also the limitation in a sense, a further study needs to pay close attention to the two types of carbon emissions.
After our field investigation in the coal-related industries, it was found that the power supply for most of the large- and medium-scale industries is mostly sourced from themselves (self-generating electricity). In order to know the entirety of carbon emissions in each process of coal supply chains, this paper basically followed the original way of power generation in these industries. Thus, the understanding of carbon emissions in the consumption process deserves further debate. However, the analysis in Section 3.3.2 indicates that the structure of carbon emissions in our study is dependent on the local industrial structure. In addition, as the data cannot be acquired, the coefficients in coal mining and processing were estimated according to the relevant literatures. This may result in a certain deviation in the calculation. Therefore, a further study needs to conduct investigations into the actual production process of urban industries and local factors of the study area to improve the accuracy and precision.
4.3. Implications for Environmental Management
With growing concerns over anthropogenic climate change, an appropriate understanding of the carbon emission characteristics of coal supply chains from an environmental perspective is required. Our study provided the results of carbon emissions in coal supply chains, from coal mining, selection and washing, transportation to consumption, analyzed the carbon resources of each section and sought reduction directions, which provides a basis for evaluating the clean production and consumption of coal resources in a mining city.
In addition, China is the largest coal producer and consumer in the world and also the biggest carbon emission country, caused by coal production and consumption. The coal field focused on production is not only the main energy manufacturing unit, but also the energy consumption unit. Coal production, processing and utilization generates a lot of GHGs that place a severe burden on the environment, and the coal utilization problems of low efficiency and serious environmental destruction become a great challenge for the coal industry and even the whole society. Environmentally, future mineral extraction should be targeted at mineral production efficiency, and the coal supply chain should be focused on unit GDP energy consumption and energy efficiency. Local government also has to pay attention to the ecological damage and restoration of mineral extractions [66]. The accurate calculation of carbon emissions in the each process of coal supply chains is an important indicator for understanding the effect of coal-fired industries on global warming. Therefore, our study is not only able to supply references for the formulation strategy of a low carbon city, but also to provide a new approach to urban development patterns with a new view for coal resource management.
Acknowledgments
This article is supported by National Natural Science Foundation of China (Grant Nos.: 41571507, 41101531) and the Fundamental Research Funds for the Central Universities the China. Also, authors gratefully acknowledge the colleagues and friends in the Land Resources Bureau of Wu’an for providing the basic data and relevant information.
Author Contributions
Guangfang Luo analyzed the data and wrote the manuscript. Jianjun Zhang designed the research framework and wrote the manuscript. Yongheng Rao, Xiaolei Zhu and Yiqiang Guo collected and analyzed the data.
Conflicts of Interest
All the authors declare no competing financial interests.
References
- Sheinbaum, C.; Ruíz, B.J.; Ozawa, L.; Nebra, S.A.; De Oliveira, S., Jr.; Bazzo, E. Energy consumption and related CO2 emissions in five latin american countries: Changes from 1990 to 2006 and perspectives. Energy 2011, 36, 3629–3638. [Google Scholar] [CrossRef]
- Chen, Z.M.; Chen, G.Q.; Chen, B. Embodied carbon dioxide emission by the globalized economy: A systems ecological input-output simulation. J. Environ. Inform. 2013, 21, 35–44. [Google Scholar] [CrossRef]
- Zhou, Y.; Li, Y.P.; Huang, G.H. Planning sustainable electric-power system with carbon emission abatement through cdm under uncertainty. Appl. Energy 2015, 140, 350–364. [Google Scholar] [CrossRef]
- Eissa, A.E.; Zaki, M.M. The impact of global climatic changes on the aquatic environment. Procedia Environ. Sci. 2011, 4, 251–259. [Google Scholar] [CrossRef]
- Ghommem, M.; Hajj, M.R.; Puri, I.K. Influence of natural and anthropogenic carbon dioxide sequestration on global warming. Ecol. Model. 2012, 235–236, 1–7. [Google Scholar] [CrossRef]
- Intergovernmental Panel on Climate Change (IPCC). Climate Change 2001: The Scientific Basis. Third Assessment Report of the Intergovernmental Panel Onclimate Change; Cambridge University Press: Cambridge, UK, 2001. [Google Scholar]
- Cardoso, A. Behind the life cycle of coal: Socio-environmental liabilities of coal mining in Cesar, Colombia. Ecol. Econ. 2015, 120, 71–82. [Google Scholar] [CrossRef]
- Ou, Y.; Zhai, H.; Rubin, E.S. Life cycle water use of coal- and natural-gas-fired power plants with and without carbon capture and storage. Int. J. Greenh. Gas Control 2016, 44, 249–261. [Google Scholar] [CrossRef]
- Goto, K.; Yogo, K.; Higashii, T. A review of efficiency penalty in a coal-fired power plant with post-combustion CO2 capture. Appl. Energy 2013, 111, 710–720. [Google Scholar] [CrossRef]
- Dai, C.; Cai, X.H.; Cai, Y.P.; Huang, G.H. A simulation-based fuzzy possibilistic programming model for coal blending management with consideration of human health risk under uncertainty. Appl. Energy 2014, 133, 1–13. [Google Scholar] [CrossRef]
- Sharifzadeh, M.; Bumb, P.; Shah, N. Carbon capture from pulverized coal power plant (pcpp): Solvent performance comparison at an industrial scale. Appl. Energy 2016, 163, 423–435. [Google Scholar] [CrossRef]
- Intergovernmental Panel on Climate Change (IPCC). Climate change 2007: Impacts, Adaptation and Vulnerability; Contribution of Working Group II to the Fourth Assessment Report of the Intergovernmental Panel on Climate Change; IPCC: Geneva, Switzerland, 2007. [Google Scholar]
- Zhao, Y.; Yuan, S.; Yun, W.; Guan, W.; Liu, H. Monitoring-assessing-prewarning system for agricultural land resources security. Trans. Chin. Soc. Agric. Eng. 2007, 23, 77–81. [Google Scholar]
- Zhu, S. Good practices in australia for greenhouse gas inventory development. Adv. Clim. Chang. Res. 2011, 7, 204–209. [Google Scholar]
- US DOE. Carbon Dioxide Emissions From the Generation of Electric Power in the United States; Department of Energy and Environmental Protection Agency: Washington, DC, USA, 2000. [Google Scholar]
- Carney, S.; Shackley, S. The greenhouse gas regional inventory project (grip): Designing and employing a regional greenhouse gas measurement tool for stakeholder use. Energy Policy 2009, 37, 4293–4302. [Google Scholar] [CrossRef]
- Xing, F.F.; Ouyang, Z.Y.; Wang, X.K.; Duan, X.N.; Zheng, H.; Miao, H. Inventory of final energy-carbon consumption and its structure in beijing; Abstracts of Ecosummit 2007—Ecological Complexity and Sustainability—Challenges & Opportunities for Century’s Ecology. Huanjing Kexue 2007, 28, 1918–1923. [Google Scholar] [PubMed]
- Benetto, E.; Rousseaux, P.; Blondin, J. Life cycle assessment of coal by-products based electric power production scenarios. Fuel 2004, 83, 957–970. [Google Scholar] [CrossRef]
- Branco, D.A.C.; Moura, M.C.P.; Szklo, A.; Schaeffer, R. Emissions reduction potential from CO2 capture: A life-cycle assessment of a brazilian coal-fired power plant. Energy Policy 2013, 61, 1221–1235. [Google Scholar] [CrossRef]
- Odeh, N.A.; Cockerill, T.T. Life cycle analysis of uk coal fired power plants. Energy Convers. Manag. 2008, 49, 212–220. [Google Scholar] [CrossRef]
- Stanek, W.; Czarnowska, L.; Pikoń, K.; Bogacka, M. Thermo-ecological cost of hard coal with inclusion of the whole life cycle chain. Energy 2015, 92, 341–348. [Google Scholar] [CrossRef]
- Díaz, E.; Fernández, J.; Ordóñez, S.; Canto, N.; González, A. Carbon and ecological footprints as tools for evaluating the environmental impact of coal mine ventilation air. Ecol. Indic. 2012, 18, 126–130. [Google Scholar] [CrossRef]
- Nease, J.; Ii, T.A.A. Comparative life cycle analyses of bulk-scale coal-fueled solid oxide fuel cell power plants. Appl. Energy 2015, 150, 161–175. [Google Scholar] [CrossRef]
- Qin, Z.; Zhai, G.; Wu, X.; Yu, Y.; Zhang, Z. Carbon footprint evaluation of coal-to-methanol chain with the hierarchical attribution management and life cycle assessment. Energy Convers. Manag. 2016, 124, 168–179. [Google Scholar] [CrossRef]
- Restrepo, Á.; Bazzo, E.; Miyake, R. A life cycle assessment of the brazilian coal used for electric power generation. J. Clean. Prod. 2014, 92, 179–186. [Google Scholar] [CrossRef]
- Andrić, I.; Jamali-Zghal, N.; Santarelli, M.; Lacarrière, B.; Corre, O.L. Environmental performance assessment of retrofitting existing coal fired power plants to co-firing with biomass: Carbon footprint and emergy approach. J. Clean. Prod. 2015, 103, 13–27. [Google Scholar] [CrossRef]
- Peters, G.P. From production-based to consumption-based national emission inventories. Ecol. Econ. 2008, 65, 13–23. [Google Scholar] [CrossRef]
- Gavrilova, O.; Vilu, R. Production-based and consumption-based national greenhouse gas inventories: An implication for estonia. Ecol. Econ. 2012, 75, 161–173. [Google Scholar] [CrossRef]
- Mózner, Z.V. A consumption-based approach to carbon emission accounting—Sectoral differences and environmental benefits. J. Clean. Prod. 2013, 42, 83–95. [Google Scholar] [CrossRef] [Green Version]
- Xia, D.; Ren, Y.; Shi, L. Measurement of life-cycle carbon equivalent emissions of coal-energy chain. Stat. Res. 2010, 8, 13. [Google Scholar]
- Xiao, B.; Zhang, A.L.; Chen, G.F. Life cycle inventory of clean coal-fired power generation in China. Clean Coal Technol. 2005, 11, 1–4. [Google Scholar]
- Troy, S.; Schreiber, A.; Zapp, P. Life cycle assessment of membrane-based carbon capture and storage. Clean Technol. Environ. Policy 2016, 18, 1641–1654. [Google Scholar] [CrossRef]
- Zhang, D. A Study on Estimation Method of Carbon Emission in Industry Branch; Beijing Forestry University: Beijing, China, 2005. [Google Scholar]
- Lubetsky, J.; Steiner, B.A.; Lanza, R. 2006 Intergovernmental Panel on Climate Change (IPCC) Guidelines for National Greenhouse Gas Inventories; IPCC: Geneva, Switzerland, 2006. [Google Scholar]
- Jiang, G.Q. Research on the Process and Measurement of Electric-Coalsupply Chain Carbon Emissions; Beijing Jiaotong University: Beijing, China, 2013. [Google Scholar]
- Du, Q.; Chen, Q.; Yang, R. Forecast carbon emissions of provinces in China based on logistic model. Resour. Environ. Yangtze Basin 2013, 22, 143–151. [Google Scholar]
- Hamilton, L.D.; Goldstein, G.A.; Lee, J.; Marcuse, W.; Morris, S.C.; Manne, A.S.; Wene, C.O. Markal-Macro: An Overview; Brookhaven National Lab.: Upton, NY, USA, 1992. [Google Scholar]
- Qiu, S.M.; Gu, P.L.; Hao, H. Study on increase and control of carbon dioxide emission from energy consumption. J. China Coal Soc. 2002, 27, 412–416. [Google Scholar]
- Wang, X.N.; Gu, K.P. Present condition of estimate method of carbon emission in China. Environ. Sci. Manag. 2006, 31, 78–80. [Google Scholar]
- Bin, Y.E.; Qiang, L.U.; Ji, L.I.; Chang, K. Coal power ghg emission intensity model and its application. J. Harbin Univ. Sci. Technol. 2011, 5, 27. [Google Scholar]
- Weisser, D. A guide to life-cycle greenhouse gas (ghg) emissions from electric supply technologies. Energy 2007, 32, 1543–1559. [Google Scholar] [CrossRef]
- Pehnt, M.; Henkel, J. Life cycle assessment of carbon dioxide capture and storage from lignite power plants. Int. J. Greenh. Gas Control 2009, 3, 49–66. [Google Scholar] [CrossRef]
- Hou, Y.; Liang, C.; Tian, X.; Pan, D. Study on chinese steel industry carbon footprint analysis and emission reduction countermeasures. Ecol. Econ. 2012, 12, 22. [Google Scholar]
- Hondo, H. Life cycle ghg emission analysis of power generation systems: Japanese case. Energy 2014, 30, 2042–2056. [Google Scholar] [CrossRef]
- Yu, S.; Wei, Y.M.; Guo, H.; Ding, L. Carbon emission coefficient measurement of the coal-to-power energy chain in China. Appl. Energy 2014, 114, 290–300. [Google Scholar] [CrossRef]
- Review, B.P.S.; June, W.E. Bp Statistical Review of World Energy June 2011; Bp España: London, UK, 2011. [Google Scholar]
- You, C.F.; Xu, X.C. Coal combustion and its pollution control in China. Energy 2010, 35, 4467–4472. [Google Scholar] [CrossRef]
- Liu, Z.; Feng, K.; Hubacek, K.; Liang, S.; Anadon, L.D.; Zhang, C.; Guan, D. Four system boundaries for carbon accounts. Ecol. Model. 2015, 318, 118–125. [Google Scholar] [CrossRef]
- Geng, Y. Quantification and Characteristics of Provincial-Level Carbon Emission from Energy Consumption in China; China University of Geosciences: Wuhan, China, 2011. [Google Scholar]
- Zhao, R. A Study on Carbon Cycle and Land Control in Urban System; Nanjing University Press: Nanjing, Chian, 2012. [Google Scholar]
- Xia, D. The Research on Life Cycle Carbon Emissions Measurement of Electric Power Generation Side Based on the Scenario Analysis Method; Chongqing University: Chongqing, China, 2010. [Google Scholar]
- Ge, Q.S.; Dai, J.H.; He, F.N.; Yuan, P.; Wang, M.M. Land use changes and their relations with carbon cycles over the past 300 a in China. Sci. China Earth Sci. 2008, 51, 871–884. [Google Scholar] [CrossRef]
- Zhang, Y.; Yan, J.; Liu, L.; Bai, W.; Li, S.; Zheng, D. Impact of qinghai-xizang highway on land use and landscape pattern change: From golmud to tanggulashan pass. Acta Geogr. Sin. 2002, 57, 253–266. [Google Scholar]
- Watson, R.T. Land Use, Land-Use Change, and Forestry : A Special Report of the IPCC; Cambridge University: Cambridge, UK, 2000. [Google Scholar]
- Canadell, J.G.; Le Quéré, C.; Raupach, M.R.; Field, C.B.; Buitenhuis, E.T.; Ciais, P.; Conway, T.J.; Gillett, N.P.; Houghton, R.A.; Marland, G. Contributions to accelerating atmospheric CO2 growth from economic activity, carbon intensity, and efficiency of natural sinks. Proc. Natl. Acad. Sci. USA 2007, 104, 18866–18870. [Google Scholar] [CrossRef] [PubMed]
- Gullison, R.E.; Frumhoff, P.C.; Canadell, J.G.; Field, C.B.; Nepstad, D.C.; Hayhoe, K.; Avissar, R.; Curran, L.M.; Friedlingstein, P.; Jones, C.D. Tropical forests and climate policy: New science underscores the value of a climate policy initiative to reduce emissions from tropical deforestation. Environment 2007, 316, 985. [Google Scholar]
- Lv, M. Impact Studies of Tourism Development on Land Use Pattern in Jilin Changbai Mountain National Nature Reserve; Northeast Normal University: Changchun, China, 2010. [Google Scholar]
- Kerang, L.I.; Wang, S.; Cao, M. Vegetation and soil carbon storage in China. Sci. China Ser. 2004, 47, 49–57. [Google Scholar]
- Fang, J.; Liu, G.; Xu, S. Soil carbon pool in China and its global significance. J. Environ. Sci. 1996, 23, 249–254. [Google Scholar]
- Fang, J.; Chen, A.; Peng, C.; Zhao, S.; Ci, L. Changes in forest biomass carbon storage in China between 1949 and 1998. Science 2001, 292, 2320–2322. [Google Scholar] [CrossRef] [PubMed]
- Tong, H.F.; Cui, Y.S.; Wei-Shuang, Q.U.; Liu, Y. System dynamic scenarios analysis of CO2 emissions of China’s cement industry. China Soft Sci. 2010, 3, 40–50. [Google Scholar]
- West, T.O.; Marland, G. A synthesis of carbon sequestration, carbon emissions, and net carbon flux in agriculture: Comparing tillage practices in the United States. Agric. Ecosyst. Environ. 2002, 91, 217–232. [Google Scholar] [CrossRef]
- Bacon, P.J.; Cain, J.D.; Howard, D.C. Belief network models of land manager decisions and land use change. J. Environ. Manag. 2002, 65, 1–23. [Google Scholar] [CrossRef]
- Mohamed, A.A.; Sharifi, M.A.; Keulen, H.V. An integrated agro-economic and agro-ecological methodology for land use planning and policy analysis. Int. J. Appl. Earth Obs. Geoinform. 2000, 2, 87–103. [Google Scholar] [CrossRef]
- Lebel, L.; Garden, P.; Banaticla, M.R.N.; Lasco, R.D.; Contreras, A.; Mitra, A.P.; Sharma, C.; Nguyen, H.T.; Ooi, G.L.; Sari, A. Management into the development strategies of urbanizing regions in asia: Implications of urban function, form, and role. J. Ind. Ecol. 2007, 11, 61–81. [Google Scholar] [CrossRef]
- Zhang, J.; Fu, M.; Tao, J.; Huang, Y.; Hassani, F.P.; Bai, Z. Response of ecological storage and conservation to land use transformation: A case study of a mining town in China. Ecol. Model. 2010, 221, 1427–1439. [Google Scholar] [CrossRef]
Figure 1.
Location of Wu’an in the Hebei Province of China.
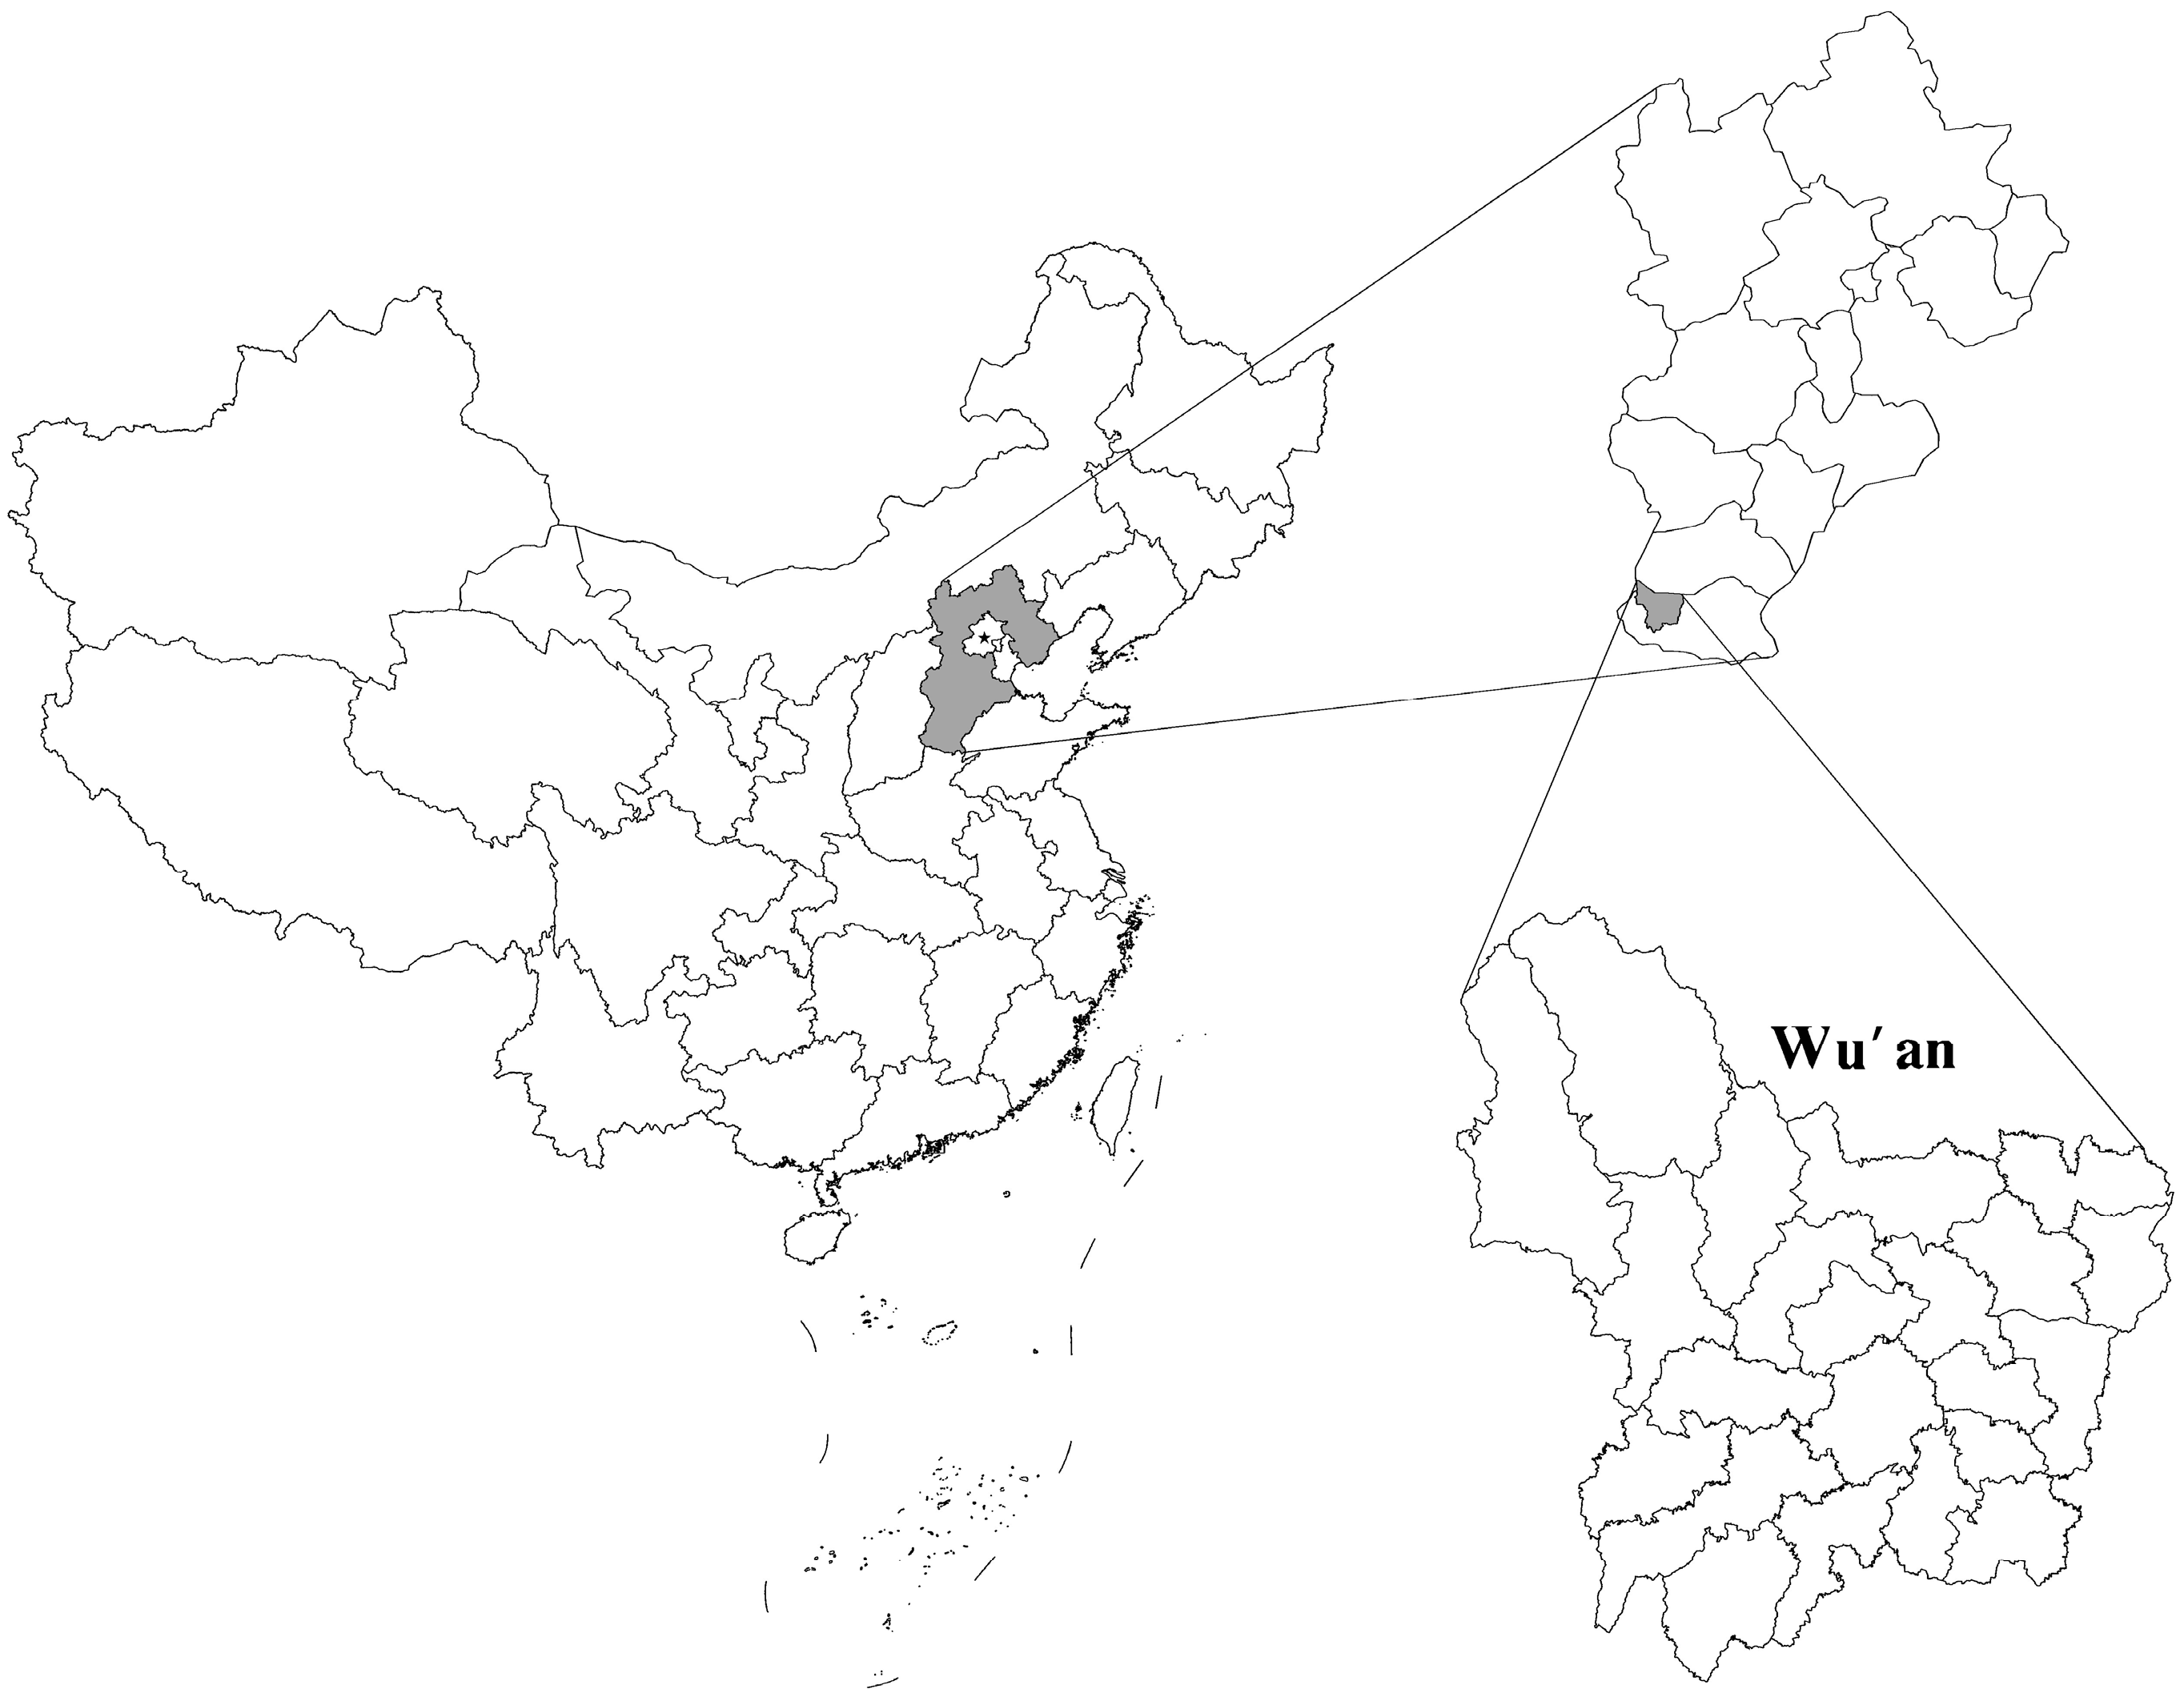
Figure 2.
Coal supply chains in Wu’an.

Figure 3.
Land use within buffer zones along the railways of Wu’an in (a) 2010 and (b) 2014.
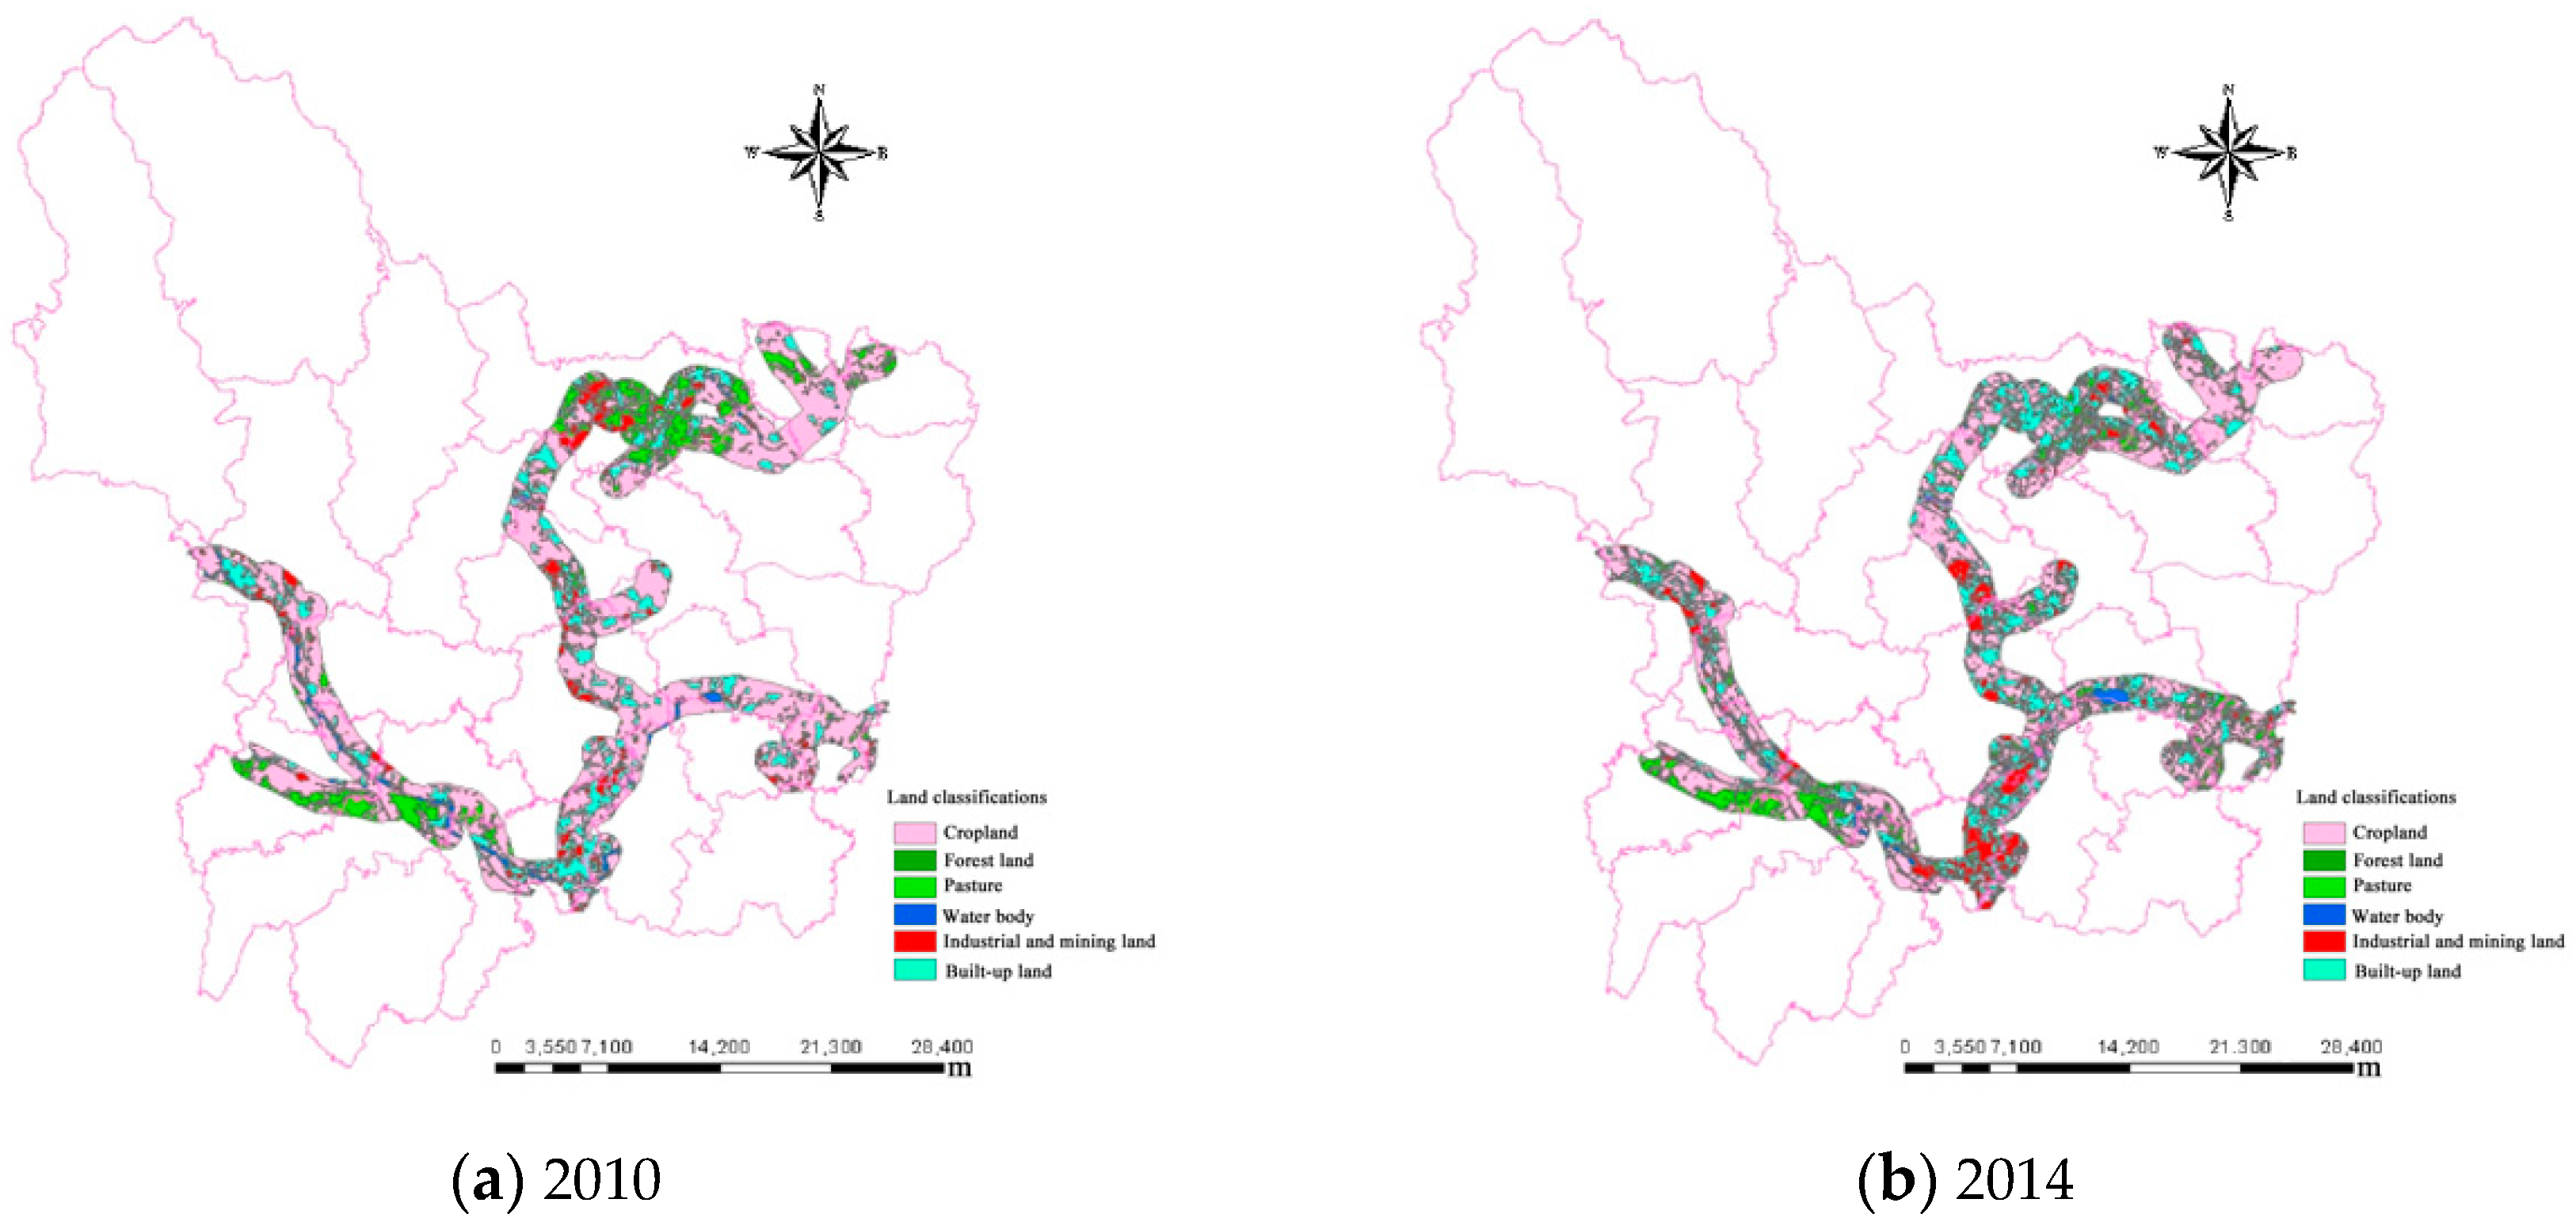
Figure 4.
Land use within buffer zones along the roads of Wu’an in (a) 2010 and (b) 2014.

Table 1.
The factors influencing carbon emissions in coal production.
| Mining Type | Mining Depth (m) | Emission Factors (m3/t) |
|---|---|---|
| Underground coal mine | <200 | 10 |
| <400 | 18 | |
| >400 | 25 | |
| Open strip mines | <25 | 0.3 |
| <50 | 1.2 | |
| >50 | 2 |
Table 2.
GWP values of greenhouse gases. *
| GHG | GWP Default Values (g CO2 Equivalent/g GHG) |
|---|---|
| CO2 | 1 |
| CH4 | 23 |
| N2O | 296 |
* The data was retrieved from the Third Assessment Report of the Intergovernmental Panel On climate Change [6].
Table 3.
Net heating values and carbon contents of combusted fossil fuels.
| Type | Lower Calorific Value (kJ/kg kJ/m3) | Carbon Content (kg/GJ) |
|---|---|---|
| Raw coal | 20,908 | 25.8 |
| Coke | 28,435 | 29.2 |
| Washed coal | 26,344 | 26.2 |
| Crude oil | 41,816 | 20 |
| Gasoline | 43,070 | 18.9 |
| Kerosene | 43,070 | 19.6 |
| Diesel fuel | 42,652 | 20.2 |
| Natural gas | 38,931 | 15.3 |
Table 4.
Railway/road buffer transfer matrix of land use.
| Land Use Type | Built-Up Land (ha) | Industrial and Mining Land (ha) |
|---|---|---|
| Cropland | 6.12/8.00 | 0.63/0.61 |
| Forest | 0/0.09 | 0/0 |
| Pasture | 2.26/3.32 | 1.09/0.91 |
| Water body | 0.54/0.99 | 0.06/0.12 |
| Built-up land | 20.16/37.77 | 3.19/3.03 |
Table 5.
Carbon emissions in the coal supply chains of Wu’an.
| Process | GHG Type | GHG Emission (kg) | CO2 Equivalent (kg) | Subtotal (kg) | Subtotal’ (kg) | Total (kg) | ||
|---|---|---|---|---|---|---|---|---|
| Mining | Coalbed carbon leak | CO2 | 1.89 × 10⁸ | 1.89 × 10⁸ | 3.83 × 10⁹ | 4.61 × 10⁹ | 3.51 × 10¹⁰ | |
| CH4 | 1.58 × 10⁸ | 3.64 × 10⁹ | ||||||
| Energy consumption | CO2 | 7.75 × 10⁸ | 7.75 × 10⁸ | 7.80 × 10⁸ | ||||
| N2O | 1.70 × 10⁴ | 5.03 × 10⁶ | ||||||
| Selecting and washing | Coal combustion | CO2 | 1.87 × 10⁸ | 1.87 × 10⁸ | 1.87 × 10⁸ | 2.11 × 10⁸ | ||
| Electricity consumption | CO2 | 2.38 × 10⁷ | 2.38 × 10⁷ | 2.43 × 10⁷ | ||||
| N2O | 1.51 × 10³ | 4.50 × 10⁵ | ||||||
| Transportation | Direct emission | CO2 | 5.64 × 10⁸ | 5.64 × 10⁸ | 5.64 × 10⁸ | 5.64 × 10⁸ | ||
| Indirect emission | CO2 | 1.96 × 10⁵ | 1.96 × 10⁵ | 1.96 × 10⁵ | ||||
| Consumption | Electricity industry | CO2 | 2.91 × 10⁹ | 2.91 × 10⁹ | 2.96 × 10⁹ | 2.97 × 10¹⁰ | ||
| N2O | 1.85 × 10⁵ | 5.48 × 10⁷ | ||||||
| Steel industry | Combustion of fossil fuels | CO2 | 2.07 × 10¹⁰ | 2.07 × 10¹⁰ | 2.54 × 10¹⁰ | |||
| Chemical reaction | CO2 | 4.73 × 10⁹ | 4.73 × 10⁹ | |||||
| Cement industry | Combustion of fossil fuels | CO2 | 3.38 × 10⁸ | 3.38 × 10⁸ | 1.36 × 10⁹ | |||
| Decomposition of limestone | CO2 | 1.02 × 10⁹ | 1.02 × 10⁹ | |||||
| Chemical industry | CO2 | 1.54 × 10⁷ | 1.54 × 10⁷ | 1.54 × 10⁷ | ||||
Table 6.
Structure of carbon emissions in different processes.
| Processes | Carbon Emission (1010 kg) | Proportion (%) |
|---|---|---|
| Mining | 0.46 | 13.10 |
| Selecting and washing | 0.02 | 0.57 |
| Transportation | 0.06 | 1.71 |
| Consumption | 2.97 | 84.62 |
| Total | 3.51 | 100 |
Table 7.
Structure of carbon emissions in different industry types.
| Industrial Types | Carbon Emission (1010 kg) | Proportion (%) |
|---|---|---|
| Electricity industry | 0.296 | 9.95 |
| Steel industry | 2.540 | 85.41 |
| Cement industry | 0.136 | 4.57 |
| Chemical industry | 0.002 | 0.07 |
| Total | 2.974 | 100 |
Table 8.
Structure of emitted greenhouse gases in the coal supply chains.
| Greenhouse Gases | Equivalent Carbon Emission (1010 kg) | Proportion (%) |
|---|---|---|
| CO2 | 3.14 | 89.46 |
| N2O | 0.01 | 0.28 |
| CH4 | 0.36 | 10.26 |
| Total | 3.51 | 100 |
© 2017 by the authors. Licensee MDPI, Basel, Switzerland. This article is an open access article distributed under the terms and conditions of the Creative Commons Attribution (CC BY) license (http://creativecommons.org/licenses/by/4.0/).
Share and Cite
MDPI and ACS Style
Luo, G.; Zhang, J.; Rao, Y.; Zhu, X.; Guo, Y. Coal Supply Chains: A Whole-Process-Based Measurement of Carbon Emissions in a Mining City of China. Energies 2017, 10, 1855. https://doi.org/10.3390/en10111855
AMA Style
Luo G, Zhang J, Rao Y, Zhu X, Guo Y. Coal Supply Chains: A Whole-Process-Based Measurement of Carbon Emissions in a Mining City of China. Energies. 2017; 10(11):1855. https://doi.org/10.3390/en10111855
Chicago/Turabian StyleLuo, Guangfang, Jianjun Zhang, Yongheng Rao, Xiaolei Zhu, and Yiqiang Guo. 2017. "Coal Supply Chains: A Whole-Process-Based Measurement of Carbon Emissions in a Mining City of China" Energies 10, no. 11: 1855. https://doi.org/10.3390/en10111855
Note that from the first issue of 2016, this journal uses article numbers instead of page numbers. See further details here.