Electrolyzers Enhancing Flexibility in Electric Grids
by
 , ,
, ,
Manish Mohanpurkar
1,* ,
,
Yusheng Luo
1,
Danny Terlip
2,
Fernando Dias
1,
Kevin Harrison
2,
Joshua Eichman
2,
Rob Hovsapian
1 and
Jennifer Kurtz
2 1
Idaho National Laboratory, 2525 Fremont Ave, Idaho Falls, ID 83402, USA
2
National Renewable Energy Laboratory, 15013 Denver W Pkwy, Golden, CO 80401, USA
*
Author to whom correspondence should be addressed.
Energies 2017, 10(11), 1836; https://doi.org/10.3390/en10111836
Submission received: 20 September 2017
/
Revised: 16 October 2017
/
Accepted: 2 November 2017
/
Published: 10 November 2017
Abstract
:This paper presents a real-time simulation with a hardware-in-the-loop (HIL)-based approach for verifying the performance of electrolyzer systems in providing grid support. Hydrogen refueling stations may use electrolyzer systems to generate hydrogen and are proposed to have the potential of becoming smarter loads that can proactively provide grid services. On the basis of experimental findings, electrolyzer systems with balance of plant are observed to have a high level of controllability and hence can add flexibility to the grid from the demand side. A generic front end controller (FEC) is proposed, which enables an optimal operation of the load on the basis of market and grid conditions. This controller has been simulated and tested in a real-time environment with electrolyzer hardware for a performance assessment. It can optimize the operation of electrolyzer systems on the basis of the information collected by a communication module. Real-time simulation tests are performed to verify the performance of the FEC-driven electrolyzers to provide grid support that enables flexibility, greater economic revenue, and grid support for hydrogen producers under dynamic conditions. The FEC proposed in this paper is tested with electrolyzers, however, it is proposed as a generic control topology that is applicable to any load.
1. Introduction
The widespread adoption and deployment of distributed energy resources (DERs) is one of the most dynamic features of the modern-day electric grid. Consequently, numerous changes are occurring within the planning, operation, and business models of electric utilities. The Electric Power Research Institute defines a DER as, “smaller power sources that can be aggregated to provide power necessary to meet regular demand” [1]. The increasing DER penetration is due to numerous factors harnessing local resources, reliability, resilience, renewable energy portfolios, targets, and so forth. A significant challenge with increasing the penetration of DERs is a very limited observability of energy penetration within the distribution networks. Utility operators can face numerous challenges when active power sources such as DERs do not provide observability and controls. The observability and controls can become quite involved on the basis of the type, ownership, operational characteristics, and so forth of the DER. Another complicating trend in the changing landscape of the electric grid is the increasing penetration of renewable energy sources, such as solar and wind power plants, at the transmission or subtransmission levels of the electric grid [2]. Utility-scale renewables pose challenges; however, utilities tend to have a higher level of observability and even controllability of the feeds from such large renewable energy plants. The increase in the penetration of DERs is fuelled by the reduction of costs and efficiency improvements in technologies such as solar photovoltaics, wind, fuel cells, battery storage, and so forth. Overhauls in utility business models and supporting regulatory framework, as well as increased social acceptance, are non-technical factors that are supporting increased DER penetration. A detailed report [3] discusses the types of DER, an assessment of benefits, and coordination with utility operation and markets for the United States. The report also points out the ways that DER penetration and adoption can lead to an increased global benefit in financial markets. However, there is still a significant amount of work that needs to happen with research, implementation, policy, business models, and regulatory framework. Globally, an increase in the electricity production from renewable energy resources is being observed. In the European Union, electricity production from renewable energy resources doubled from 500 TWh in 2005 to almost 1000 TWh in 2015 [4], and in the United States, this increased from approximately 350 billion kWh in 2005 to 520 billion kWh in 2015 [5]. To support the increasing levels of DER penetration, the electric grid also needs greater levels of flexibility and stability at the distribution network level.
DERs introduce peculiar challenges depending on the location of their connection to the power grid. Within distribution networks, DER-related challenges are bidirectional flows, maintenance, protection system settings, back-feed of faults, and so forth. For DERs that are spatially dispersed within distribution networks, additional challenges arise as a result of the inherent variability and stochasticity of input resources. For large-scale renewable energy plants, the necessary flexibility in the grid can be ensured by optimally managing their dispatching and other key controllable sources such as hydropower [6]. With smaller and spatially dispersed DERs at significant penetration levels, utilities have to look beyond the traditional techniques of managing uncertainty. Community-based aggregators, energy storage, and controllable loads are deemed as key enablers of a higher penetration of DERs. These technologies can significantly add flexibility and stability in distribution networks, as they can be spatially dispersed and are also controllable.
DERs co-located and integrated with energy storage can augment reliability and resiliency of electric grids on a local scale as well as for critical loads [7,8,9]. Loads can be effective in mitigating congestion issues that occur when the capacity of some distribution lines are overloaded [10]. This type of contingency may happen far from the typically centralized grid operator controls. Local, active load-side curtailment has the potential to support peak demand reduction, transient mitigation, and fault ride-through events [11]. For example, consumers can enroll in demand response programs for monetary compensation, which allows the utility to curtail their power consumption during certain high peak hours of the day. As a result, the grid operator can ensure the balance of power and energy without violating operational constraints. However, load-side management is expected to play an important role in supporting grid operation; thus the idea of smarter loads is gaining attention. Smarter loads have a more flexible and intelligent control strategy so that power adjustment can be more timely and accurate. Smarter loads as a fleet can bid a greater cumulative power capacity to the wholesale power markets. Therefore, loads with a wide operation range and low life cycle impact due to variable operation can be considered as potential candidates for smarter loads.
Hydrogen is considered an attractive and versatile alternative energy carrier [12], mainly for its high calorific value [13] and low environmental impact [14,15]. One of the main factors that hinders its widespread adoption is its low specific energy density at ambient pressure and temperature [16]. Compression and transportation at higher pressures and lower temperatures of hydrogen are the main reasons for high cost within hydrogen delivery systems [17]; hence distributed rather than centralized hydrogen production is favored [18]. Electrolyzers are one of the techniques used to produce hydrogen and can also be optimized by co-location to enhance integration with renewable resources [19,20]. There are two main types of low-temperature electrolyzers, namely, alkaline technology that uses liquid electrolyte and proton exchange membrane (PEM), which replaces the liquid electrolyte with a solid polymer electrolyte. The typical efficiency range of PEM electrolyzers is between 82% and 97% [21]. In general, electrolyzers for hydrogen generation in transportation and industrial processes can be connected to either transmission or distribution networks. The size of the electrolysis plant, rating, hydrogen requirement, and so forth are the factors that determine the interconnection of the electrolyzers into the power grid. This paper focuses on demonstrating the applications of centralized and distributed electrolysis to add flexibility to the grid via real-time simulation.
As summarized previously, a key trend in the distribution networks is a greater deployment of DERs, which leads to variability and uncertainty of power generation. The variability of generation as a result of DERs can be characterized on spatial and temporal bases. Conventionally, the necessary flexibility to account for and assimilate this variability and uncertainty was produced by the ramping of centralized, conventional generators connected to the transmission networks. With the large-scale penetration of DERs, the flexibility provided by the ramping of conventional generation is insufficient, leading to critical grid management issues. There are two ways to provide flexibility in a spatial and temporal basis, namely, energy storage and load management. The advantage of deploying energy storage and flexible loads is that these can be co-located or proximally located to the DERs and hence provide a potentially more effective solution. In this paper, we elaborate upon and demonstrate the capabilities of an electrolyzer based on real-time simulation and hardware-in-the-loop (HIL). The choice of electrolyzers for demonstrating flexibility addition to the grid is based on the increasing hydrogen demand for transportation and its inherent controllability at a subsecond-level time resolution. This describes the ultimate objective of adding flexibility via loads from the distribution network. Following are the key technical contributions of the paper:
- A generic front end controller (FEC) that can coordinate the operation of any load with the requirements of the grid and power markets.
- Characterization of a 120 and 250 kW electrolyzer system that is used for hydrogen refueling on the basis of real-time simulations and HIL.
- Application of the FEC to the electrolyzer stack and demonstrating the response of functionalities to grid variations and price signals.
- Performance of electrolyzers on the basis of typical demand response program signals for revenue enhancement.
The paper is organized into the following sections: Section 1 provides background information related to the need of smarter loads providing flexibility to the grid; Section 2 describes the FEC, which enables controllability of loads such as eletrolyzer systems used in hydrogen refueling stations; Section 3 details the description of the 120 and 250 kW PEM electrolyzer stack; Section 4 discusses the real-time simulations with controllable hydrogen refueling stations providing grid support; and Section 5 concludes the research findings of the paper.
2. Front End Controller
In order to provide flexibility to grids, smarter loads must be capable of adjusting their power consumption according to the market and grid conditions. Complementary adjustments of power consumption by loads can add flexibility to the grid. At suitable intervals of time, the grid and market requirements need to be communicated and interpreted to the load in order to determine complementary consumption. Nevertheless, the participation by controlled loads into such power markets should not affect their basic functionalities and purpose. A generic FEC is proposed in this paper to address all these missing gaps in the functionalities of lower-level controllers of any load. The FEC is expected to seamlessly integrate with existing Lower Level Controllers (LLCs) and evolve to form a single-device controller for the next-generation loads. The proposed FEC and its interaction with the rest of the power grid, management systems, and load is shown in Figure 1.
2.1. Modules in the Front End Controller
As shown in Figure 2, the proposed FEC comprises three main modules—communication, interpretation, and optimization. These modules provide all the essential functionalities that are necessary to generate real-time complementary load profiles.
- Communication module: The communication module in the FEC is designed to communicate with a higher-level grid management system including load aggregators, which are being widely adopted. The communication module is Internet-based and ensures interoperability between the underlying device and grid management systems. In many power markets around the world, smarter loads are expected to enroll in multiple service markets [22,23], and hence there is a need for a broad set of communication protocols. The types and details of services requested by the grid management systems must be accurately recognized by the controller on the basis of the signals received and must respond accordingly.
- Optimization module: In addition to responding to price signals, controllers should spontaneously generate an optimal power adjustment value in response to grid events such as voltage and frequency transients. On the basis of the information measured at its terminals, smarter load controllers need to have an optimization module that can determine and compute the desired power consumption. To simultaneously provide responses to market and grid signals, two types of optimization are categorized, namely, fast and slow loops. Optimization focused on market participation is called slow-loop optimization, whereas optimization in response to grid events is called fast-loop optimization. The proposed time resolution of the slow and fast loops correspond to the market resolution and milliseconds, respectively. The optimization module returns a load adjustment value that can benefit the load owner by providing a response to a market signal and a grid event. This load adjustment as a reference power value needs to be communicated to the LLC.
- Interpretation module: Typically, LLCs of any load comprise the closed loop controls that require an input reference value in the form of an equivalent value of current or voltage. Hence, there is a need for interpretation between the power set point determined by the optimization module and the requirement of the input by the LLC of the load. The interpretation module also contains an accurate model of the controlled load, to ensure normal and safe operation of the load within prescribed limits.
In this paper, a generic FEC integrating the aforementioned three modules has been developed for the purpose of driving a smarter load. The feasibility of the FEC has been proved by digital real-time simulation (DRTS). As referred to previously, the ultimate objective of the development and demonstration of the FEC in DRTS is that it will become a part of the LLC as a single controller.
2.2. Front End Controller Operation and Customization for Electrolyzers
The optimization module as explained above has primarily fast and slow loops. In distribution networks, the ratio between line reactance and resistance is much lower than in transmission networks. Additionally, real and reactive power are not fully coupled with voltage and frequency, respectively. Hence, we can utilize real power adjustment to mitigate both voltage and frequency distortions. This task is fulfilled by fast-loop optimization, which generates the reference load values on the basis of Equations (1) and (2), considering the largest deviation between voltage or frequency:
Here is the frequency error between reference and the f measurement, is the voltage error between reference and the V measurement, P is the current power consumption, and is the power reference for the electrolyzer calculated by adding P and the computed adjustment . R is the droop rate, which is customized on the basis of the tuning of controls.
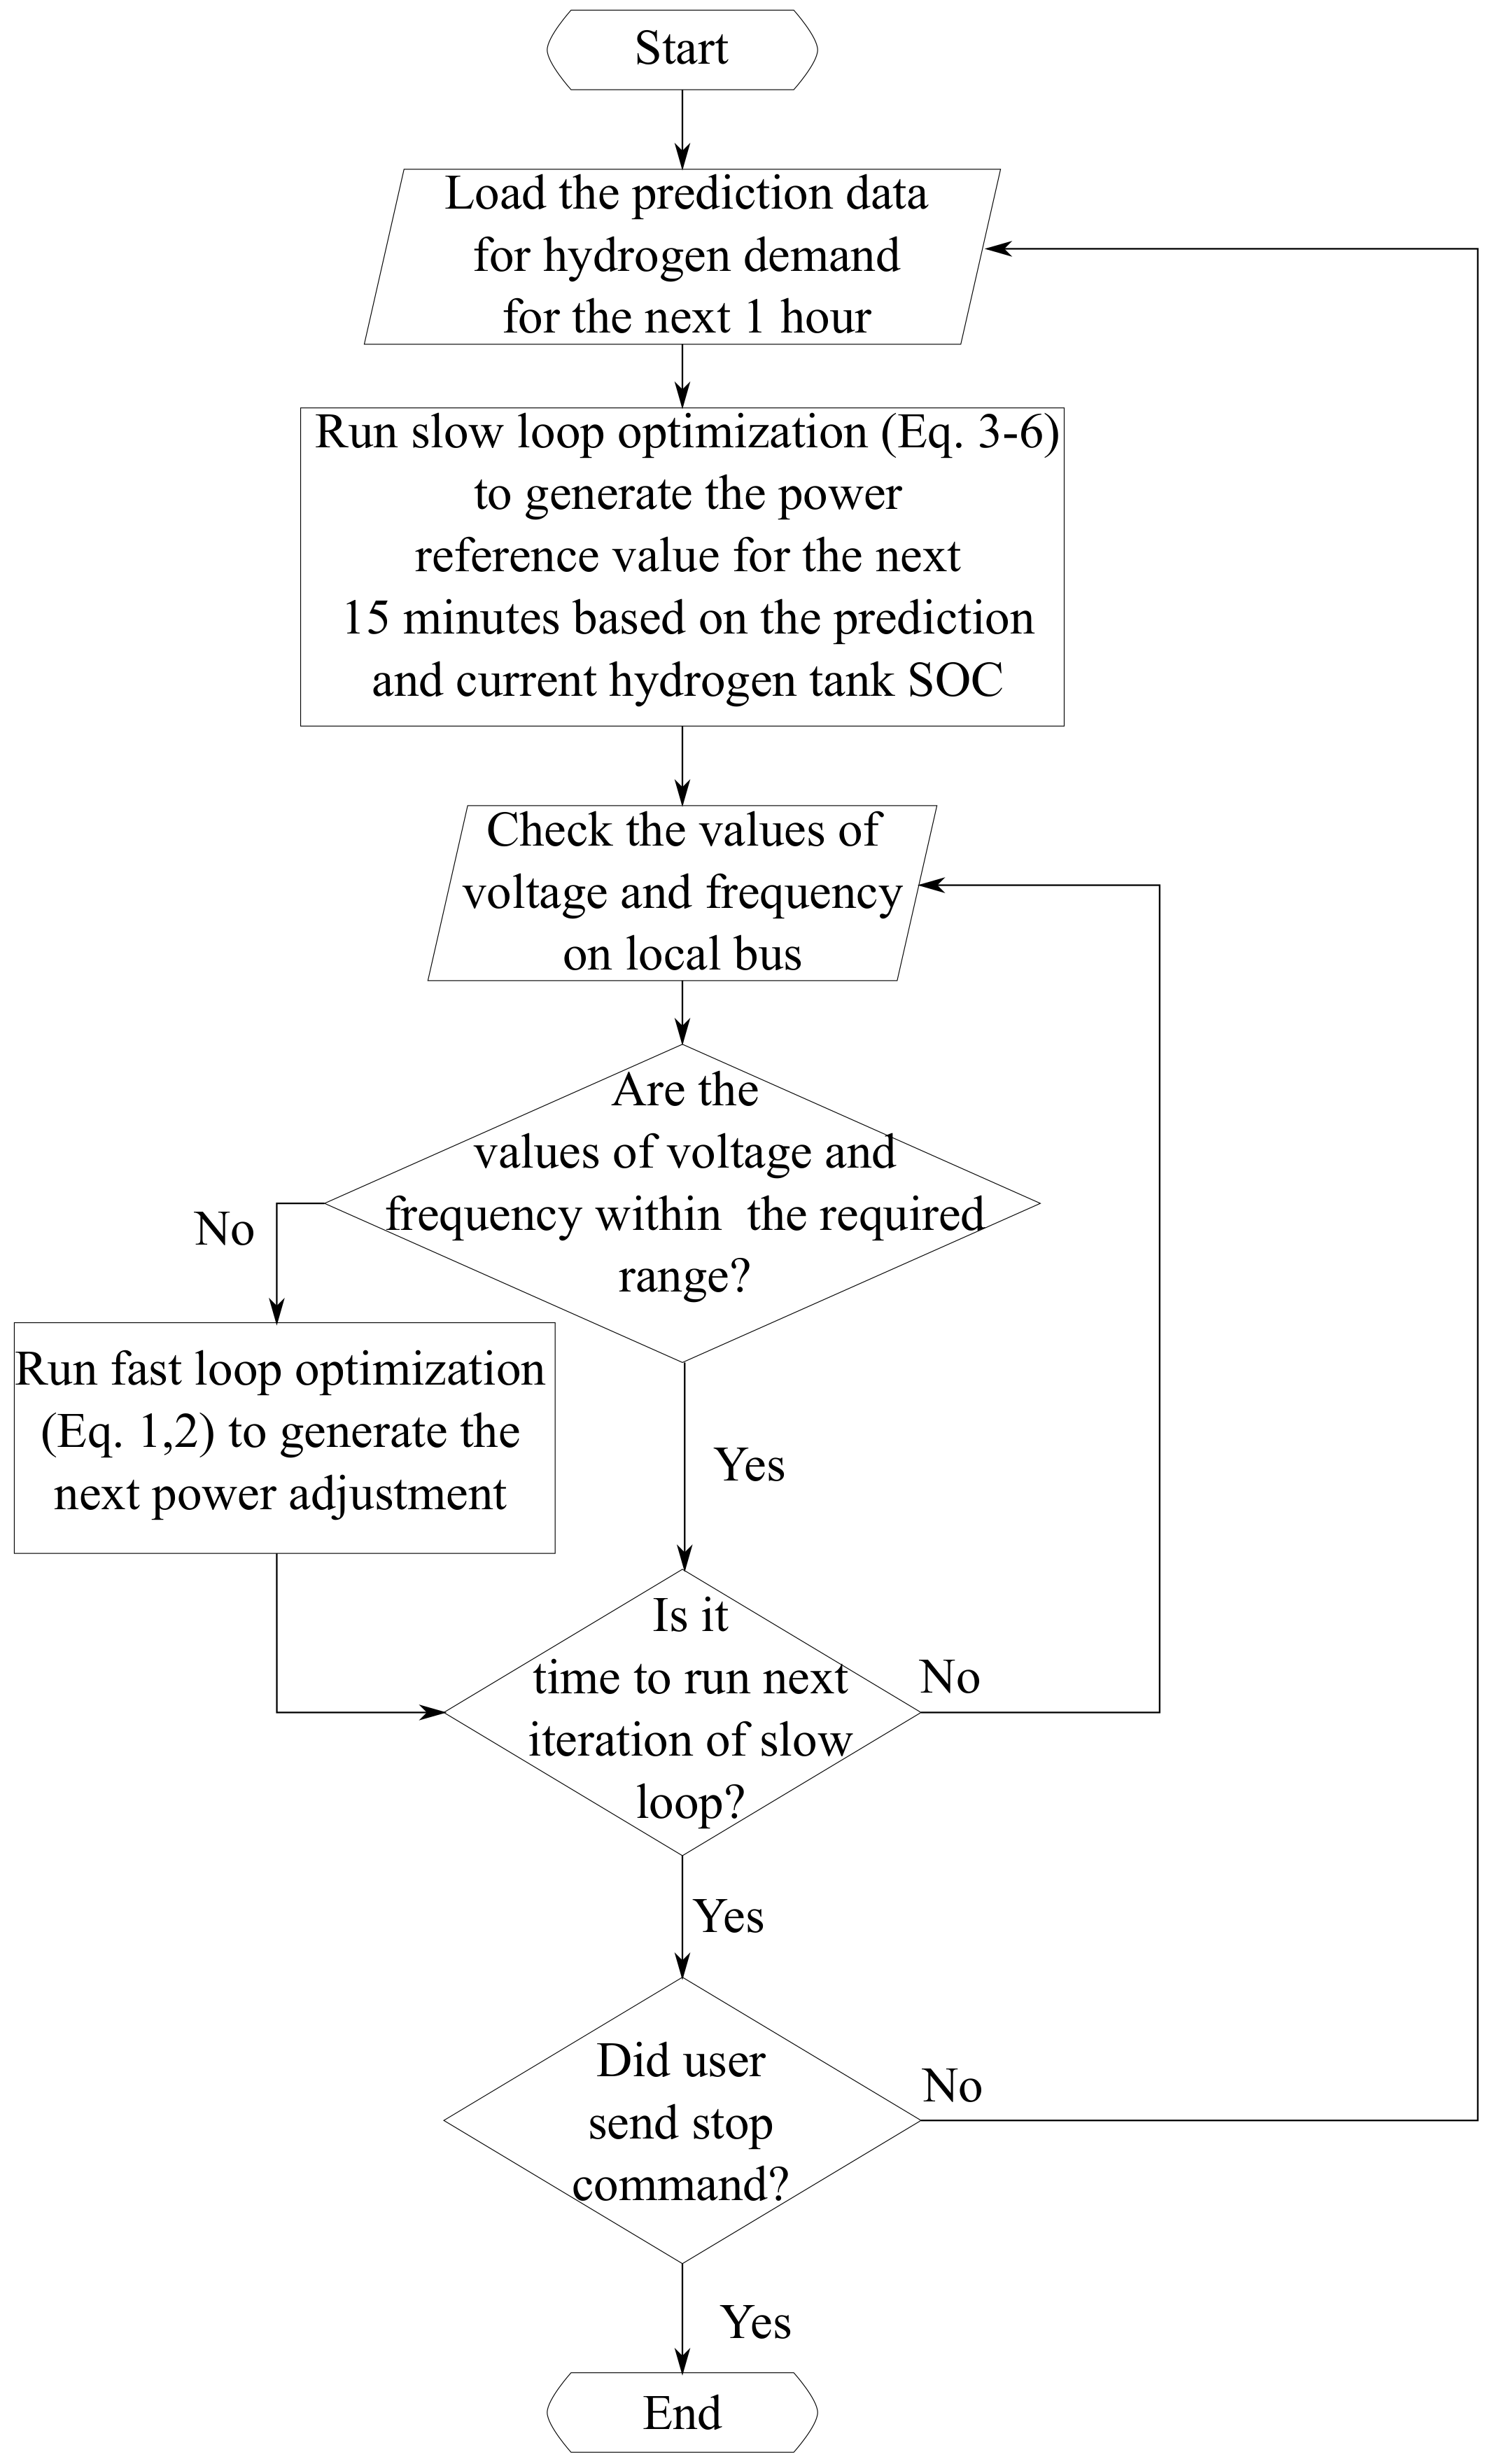
In the slow loop, we demonstrate the functionality of response to pricing signals on the basis of peak and off-peak pricing of electricity. However, this optimization can be as complex as needed to accommodate power purchase agreements between utilities and consumers. Because the off-peak price is always more attractive than the peak price, the key rule followed by the slow-loop optimization is always to produce as much hydrogen as possible during the off-peak price period. The slow loop has to ensure that the hydrogen storage at any time is sufficient to provide the demand, which is considered as the expected operation. Every 15 min, it will estimate the hydrogen sales for the next hour and determine the proper amount of power consumption to satisfy this requirement. Although the power set point is decided for the next hour, this is reexamined every 15 min. After 15 min, a new optimization cycle is performed to account for unforeseen high demands. The slow loop uses a receding optimization strategy, and it also mitigates the influence of prediction error. The slow-loop optimization is summarized as follows:
If it is off-peak between and :
else
end.
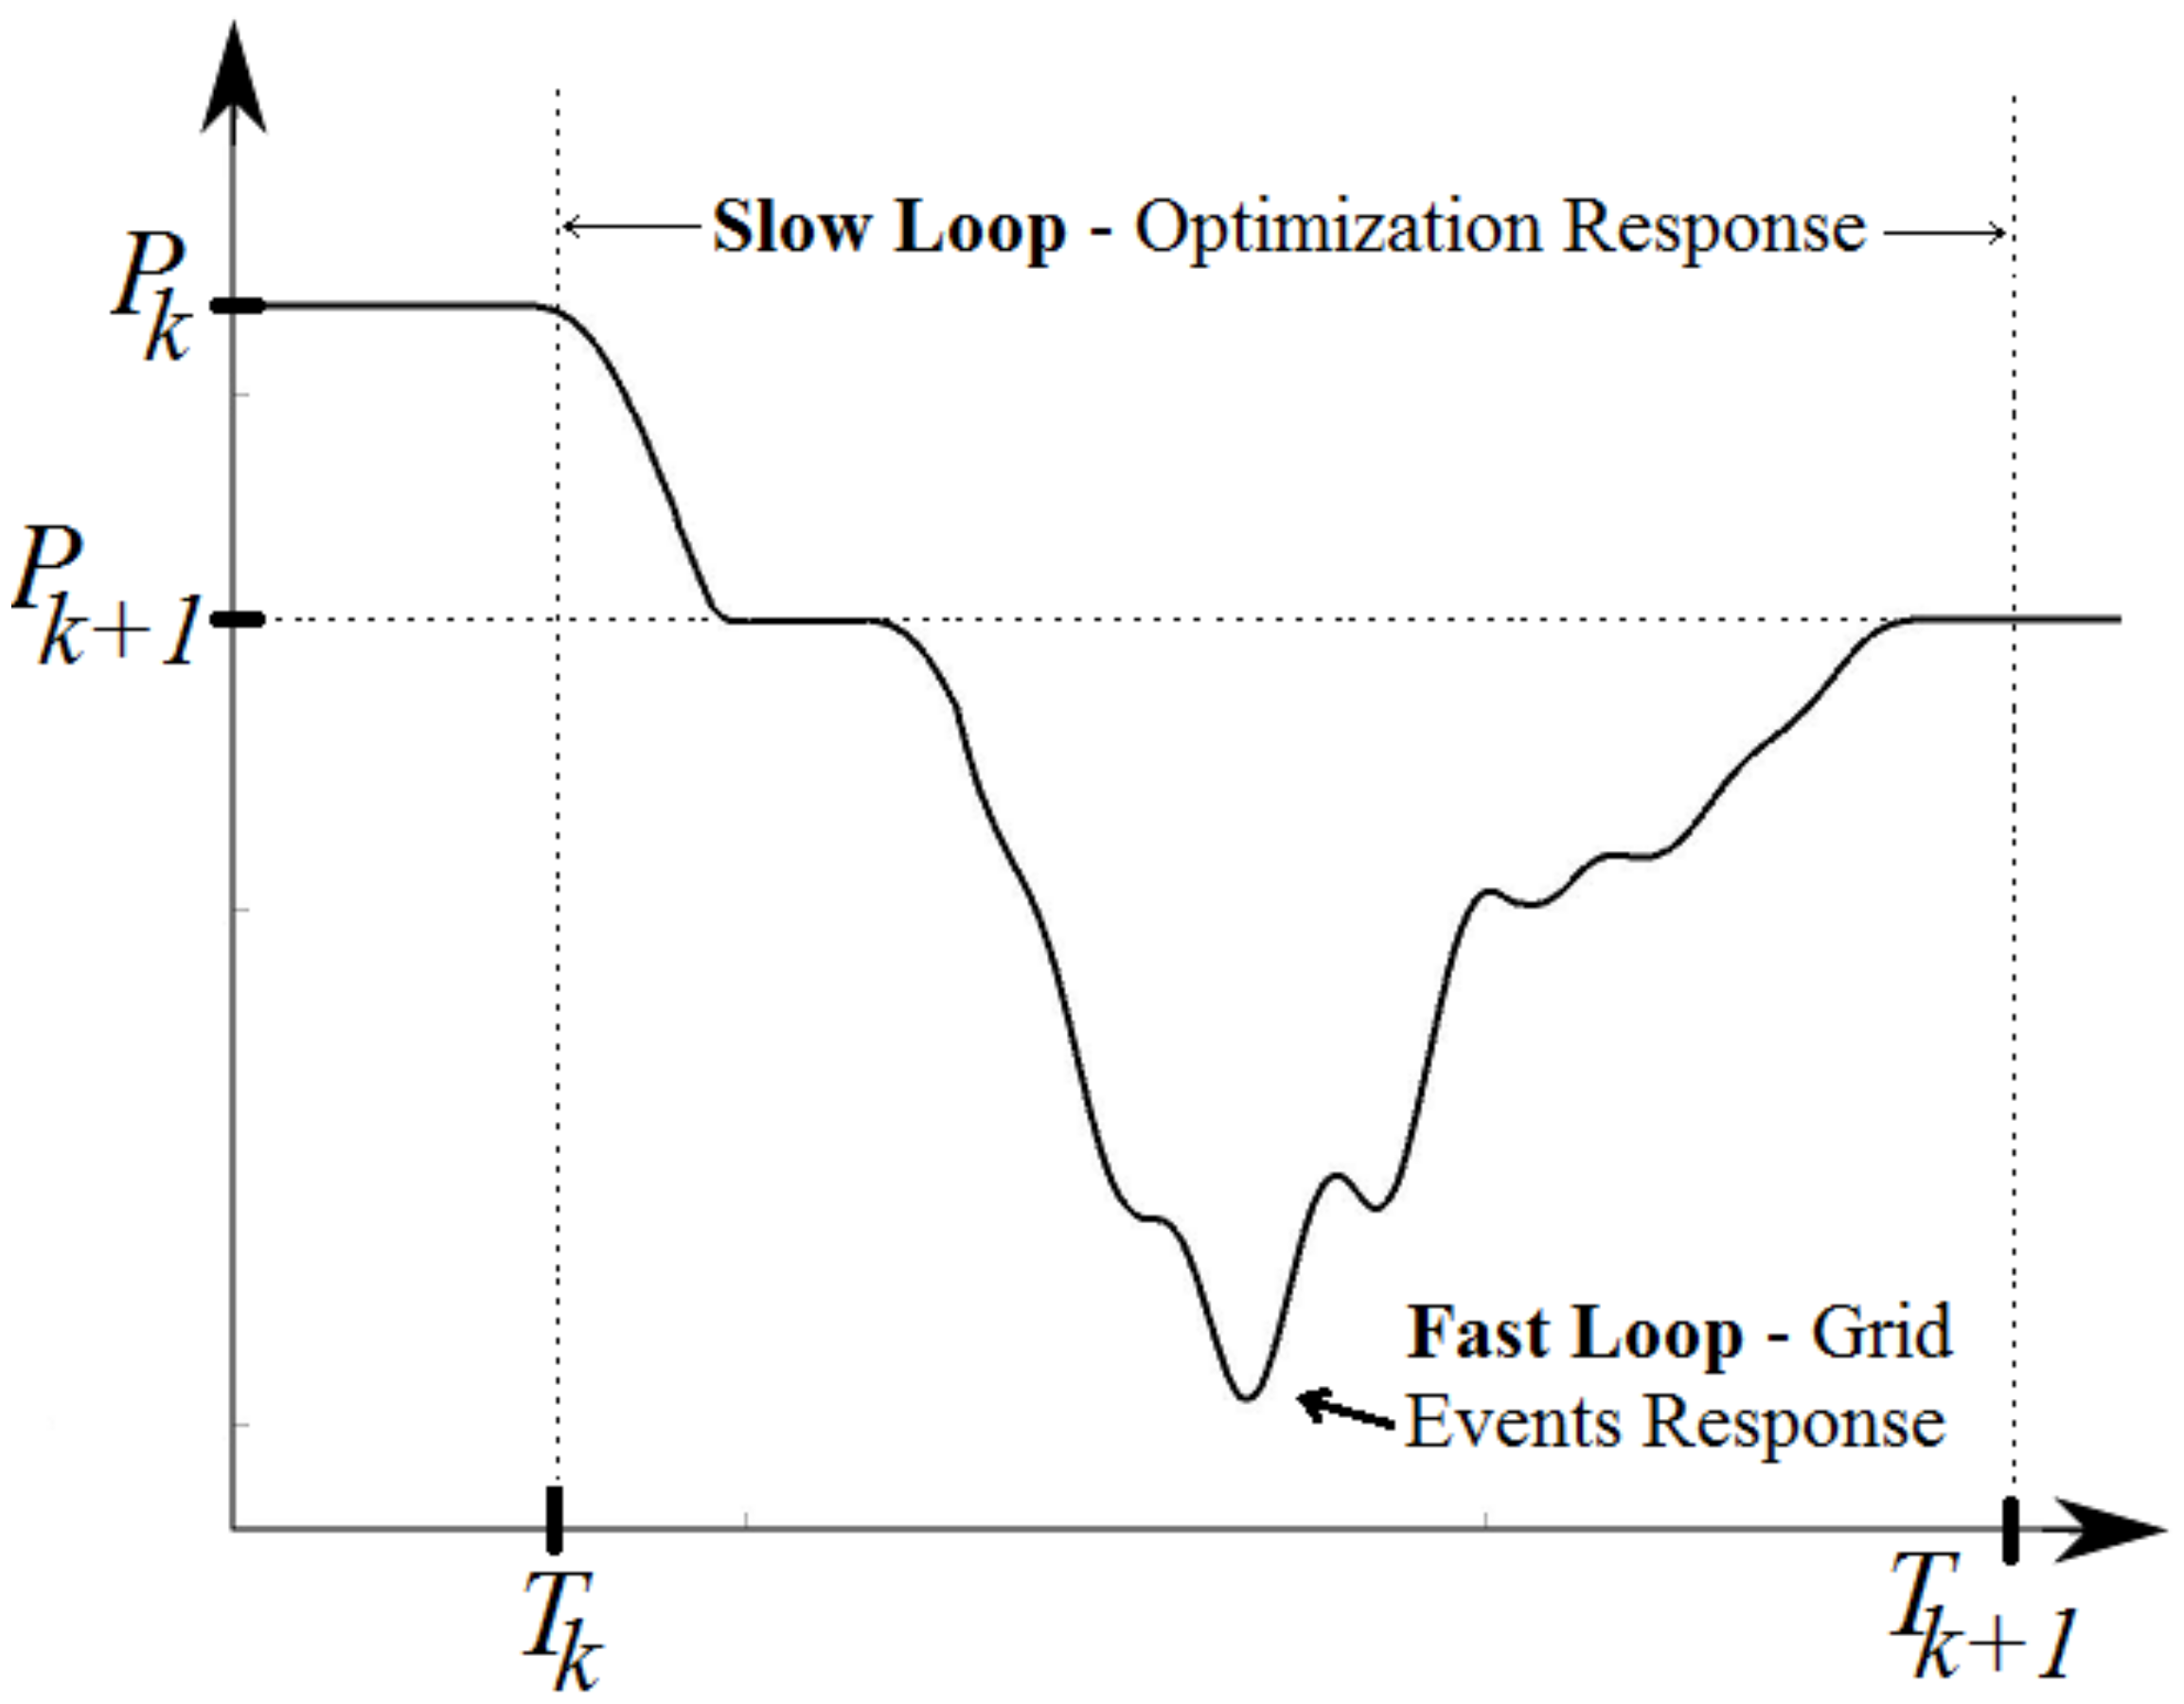
is the hydrogen stored at time k, is the maximum storage possible, is the minimum hydrogen requirement at all times, is the power of the electrolyzer at time k, is the maximum allowed power consumption, and is the minimum required power consumption. G is the conversion coefficient between power (kW) and hydrogen (kg). is the hydrogen sales prediction between and , where h, implying that the slow loop time resolution is 15 min. It is assumed that the fast loop does not activate between the iterations of slow loop optimization, as shown in Figure 3. A flowchart depicting the overall operation of the FEC, including both fast and slow loops, is shown in Figure 4. In other words, fast-loop adjustments to the real power consumption only happen inside an iteration of the slow loop. The overall power reference value is computed as follows ( is from the slow loop and is from fast loop):
3. Characterization of the Electrolyzer Stack
Electrolyzers require a balance of the plant to manage the electrical, fluid, pressure, and temperature aspects of operation and hydrogen storage. For electrolyzers to provide a response to grid and market signals, the response time and controllable range of power consumption are critical parameters. The commercially available electrolyzer systems are not designed for quick responses, but rather, for long-duration hydrogen production. Therefore, they are typically sold as a complete system that restricts the custom control of individual components. Under normal operation, the user only sends a start or stop signal to control the electrolyzer power consumption and hence hydrogen production. This level of control does not reflect the full capability of electrolyzers to respond to large power-change requests quickly.
Researchers at the National Renewable Energy Laboratory (NREL) have developed the Stack Test Bed (STB) research facility, where each component of the electrolyzer balance of a plant can be controlled. The custom control system for the STB allows the demonstration of the full capability of electrolyzers and components that constitute the balance of the plant. The STB includes a de-ionized water system, heat exchangers, power rectifiers, pumps, phase separators, desiccant beds, and process connections for both hydrogen and oxygen. Various transducers are also installed throughout the STB to measure the pressure, temperature, dew point, flow and hydrogen content. The current test articles are two PEM electrolyzers—a 50 cell of 120 kW (930 Standard Cubic Feet per Hour (SCFH)) and a 100 cell of 250 kW (1989 SCFH). These are supplied by two rectifiers rated to 250 V and 1000 A each. The 250 kW stack is considered by the manufacturer to be the building block for megawatt-scale systems that are penetrating the market for large-scale energy storage. The 250 kW STB at the NREL (which was at 120 kW prior to upgrades during the study period) was used to generate the results presented in this paper.
Past research has demonstrated the subsecond response of PEM electrolyzers [24], but this demonstration considered electrolyzers already consuming power at steady state. Electrolyzers starting from a “cold start” (i.e., no power to any balance of plant components) exhibit a longer response time. The start-up time is largely due to the speed at which water is supplied to the stack. The electrolyzers used for this study required an adequate supply (>50 gpm) of high-purity water (<1 M-cm) for electrolysis and to remove heat. Thus, experiments must wait for the pump to start and flow to reach the minimum level before consuming electricity with the stack. An alternative option is to operate the stack in a low-power, steady-state mode when production is not needed. Then, quick responses can be obtained, and hydrogen waste is minimized. The performance of the electrolyzer systems under various load profiles was measured and is presented. The electrolyzer system was operated on different load profiles, including a ramp, known patterns, and random values that included changing the power set point from 10% to 100% in 1 s through the FEC programming. In all cases, the electrolyzer accurately followed the control signals that were generated by the FEC and also preprogrammed scripts used for testing. The results for the 120 kW stack are summarized in Table 1.
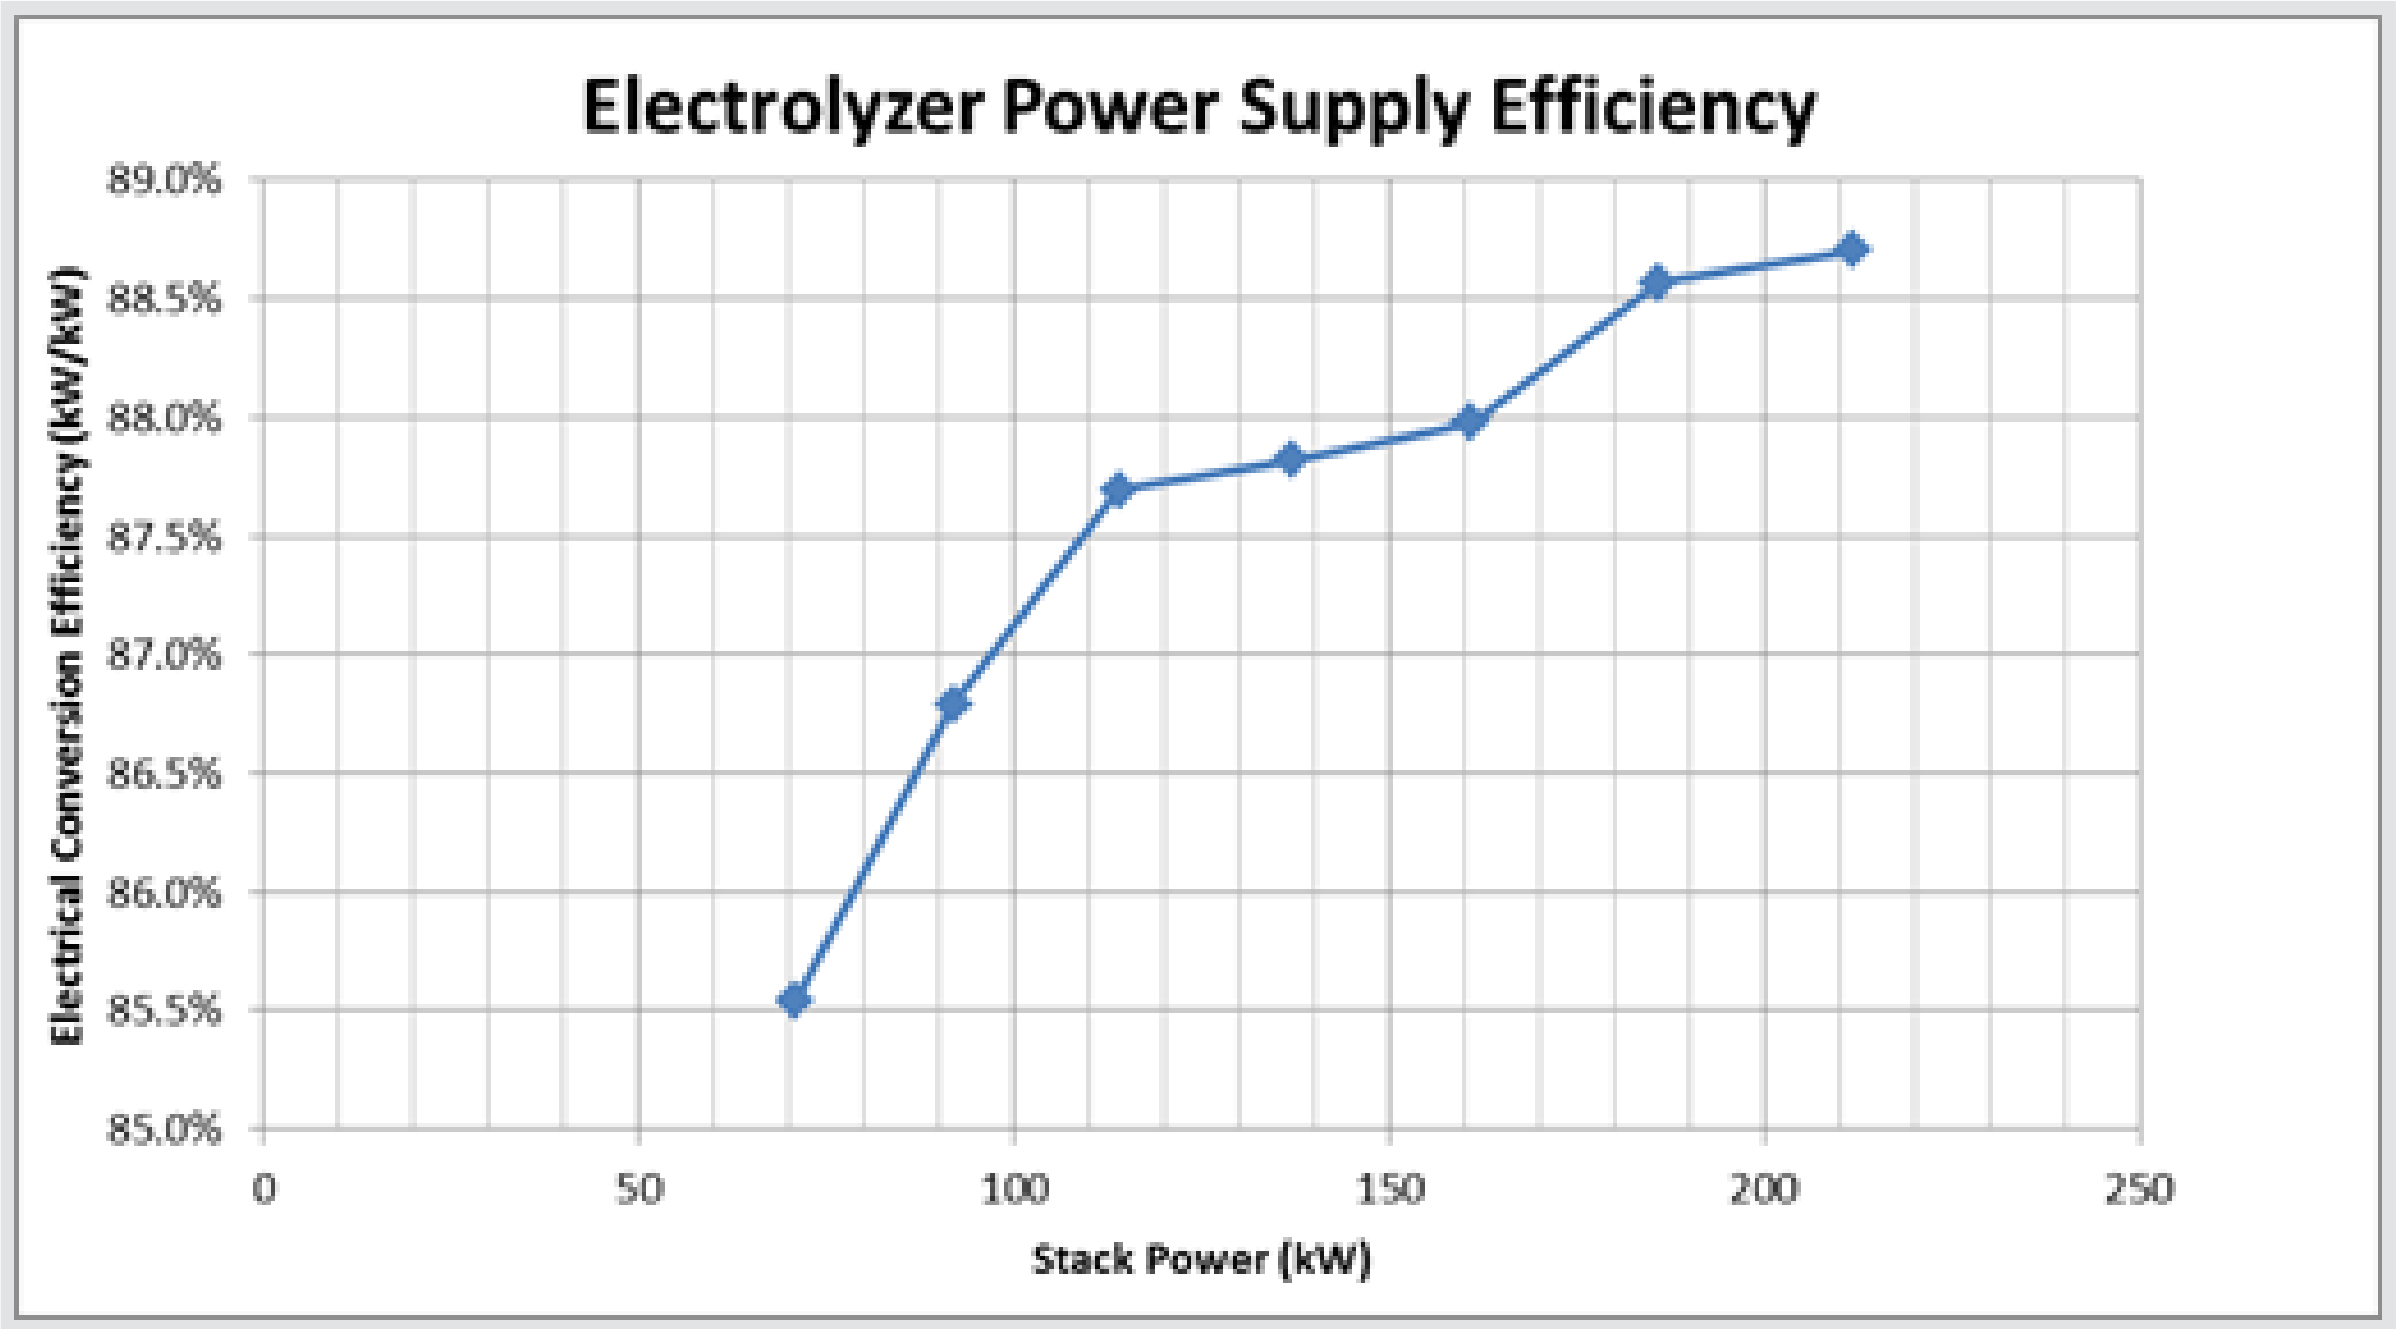
The efficiency of the electrolyzer system decreases with an increasing current and increases with a decreasing temperature of the stack. Thus, users should consider efficiency penalties when operating under various load profiles. The efficiency of stacks and power supplies was also measured at various power and temperature levels. Hydrogen production efficiency for the 250 kW stack is given with respect to the higher heating value of hydrogen (HHV) in Figure 5; power supply efficiency is given in terms of the fraction of DC power rectified from the input AC power is shown in Figure 6.
4. Real-Time Simulations and Test Results
4.1. Test Approach
Real-time simulations were performed to assess the functionalities of the FEC with all the three modules integrated under dynamic market and grid conditions, as shown in Figure 7. The electrolyzer STB with the Supervisory Controls and Data Acquisition (SCADA) system was interfaced with the DRTS via analog signals to provide a real-time connectivity. The FEC was simulated as a real-time control system block that receives inputs from either the SCADA measurements of the STB or the real-time model of the electrolyzer. The input and output signals needed by the FEC to control the electrolyzer are as shown in Figure 8. The standard IEEE 34 feeder distribution system was used to perform dynamic simulations and is widely utilized for DER integration tests [22], as shown in Figure 9. The detailed specifications of the IEEE 34 feeder distribution feeder system are also provided in [22]. The simulations conducted for DRTS could precisely simulate the real-time dynamics of electric grids and have been solved at a 300 s time-step. For the fast-loop testing, the simulation comprised a DRTS with a model of the electrolyzer on the basis of characterized data recorded during the stack testing [24]. For these tests, it was expected that the FEC could drive the electrolyzer power consumption such that it would provide support to the voltage and frequency stability. The input measurements for the fast-loop testing were local and were obtained via current and voltage transformers at the interconnection of the electrolyzer and grid. In the slow-loop testing, it was expected that the FEC could drive the electrolyzer to produce the cheapest hydrogen possible. For the slow-loop testing, the electrolyzer hardware as HIL driven by the FEC signals in DRTS was used.
4.2. Tests for Fast-Loop Optimization
For testing the fast-loop functionalities, the support from a centralized, large hydrogen refueling station (105 MW) and a distributed, small hydrogen refueling station (1.05 MW) were assessed separately. These two cases resemble the two main types of electrolyzer system deployments in electric grids, namely, centralized and distributed. The electrolyzers for both the cases were physically connected to bus no. 802, as shown in Figure 9. The droop coefficient of the fast loop in FEC was set to −100 for both the assessments.
4.2.1. Electrolyzers Providing Frequency Support
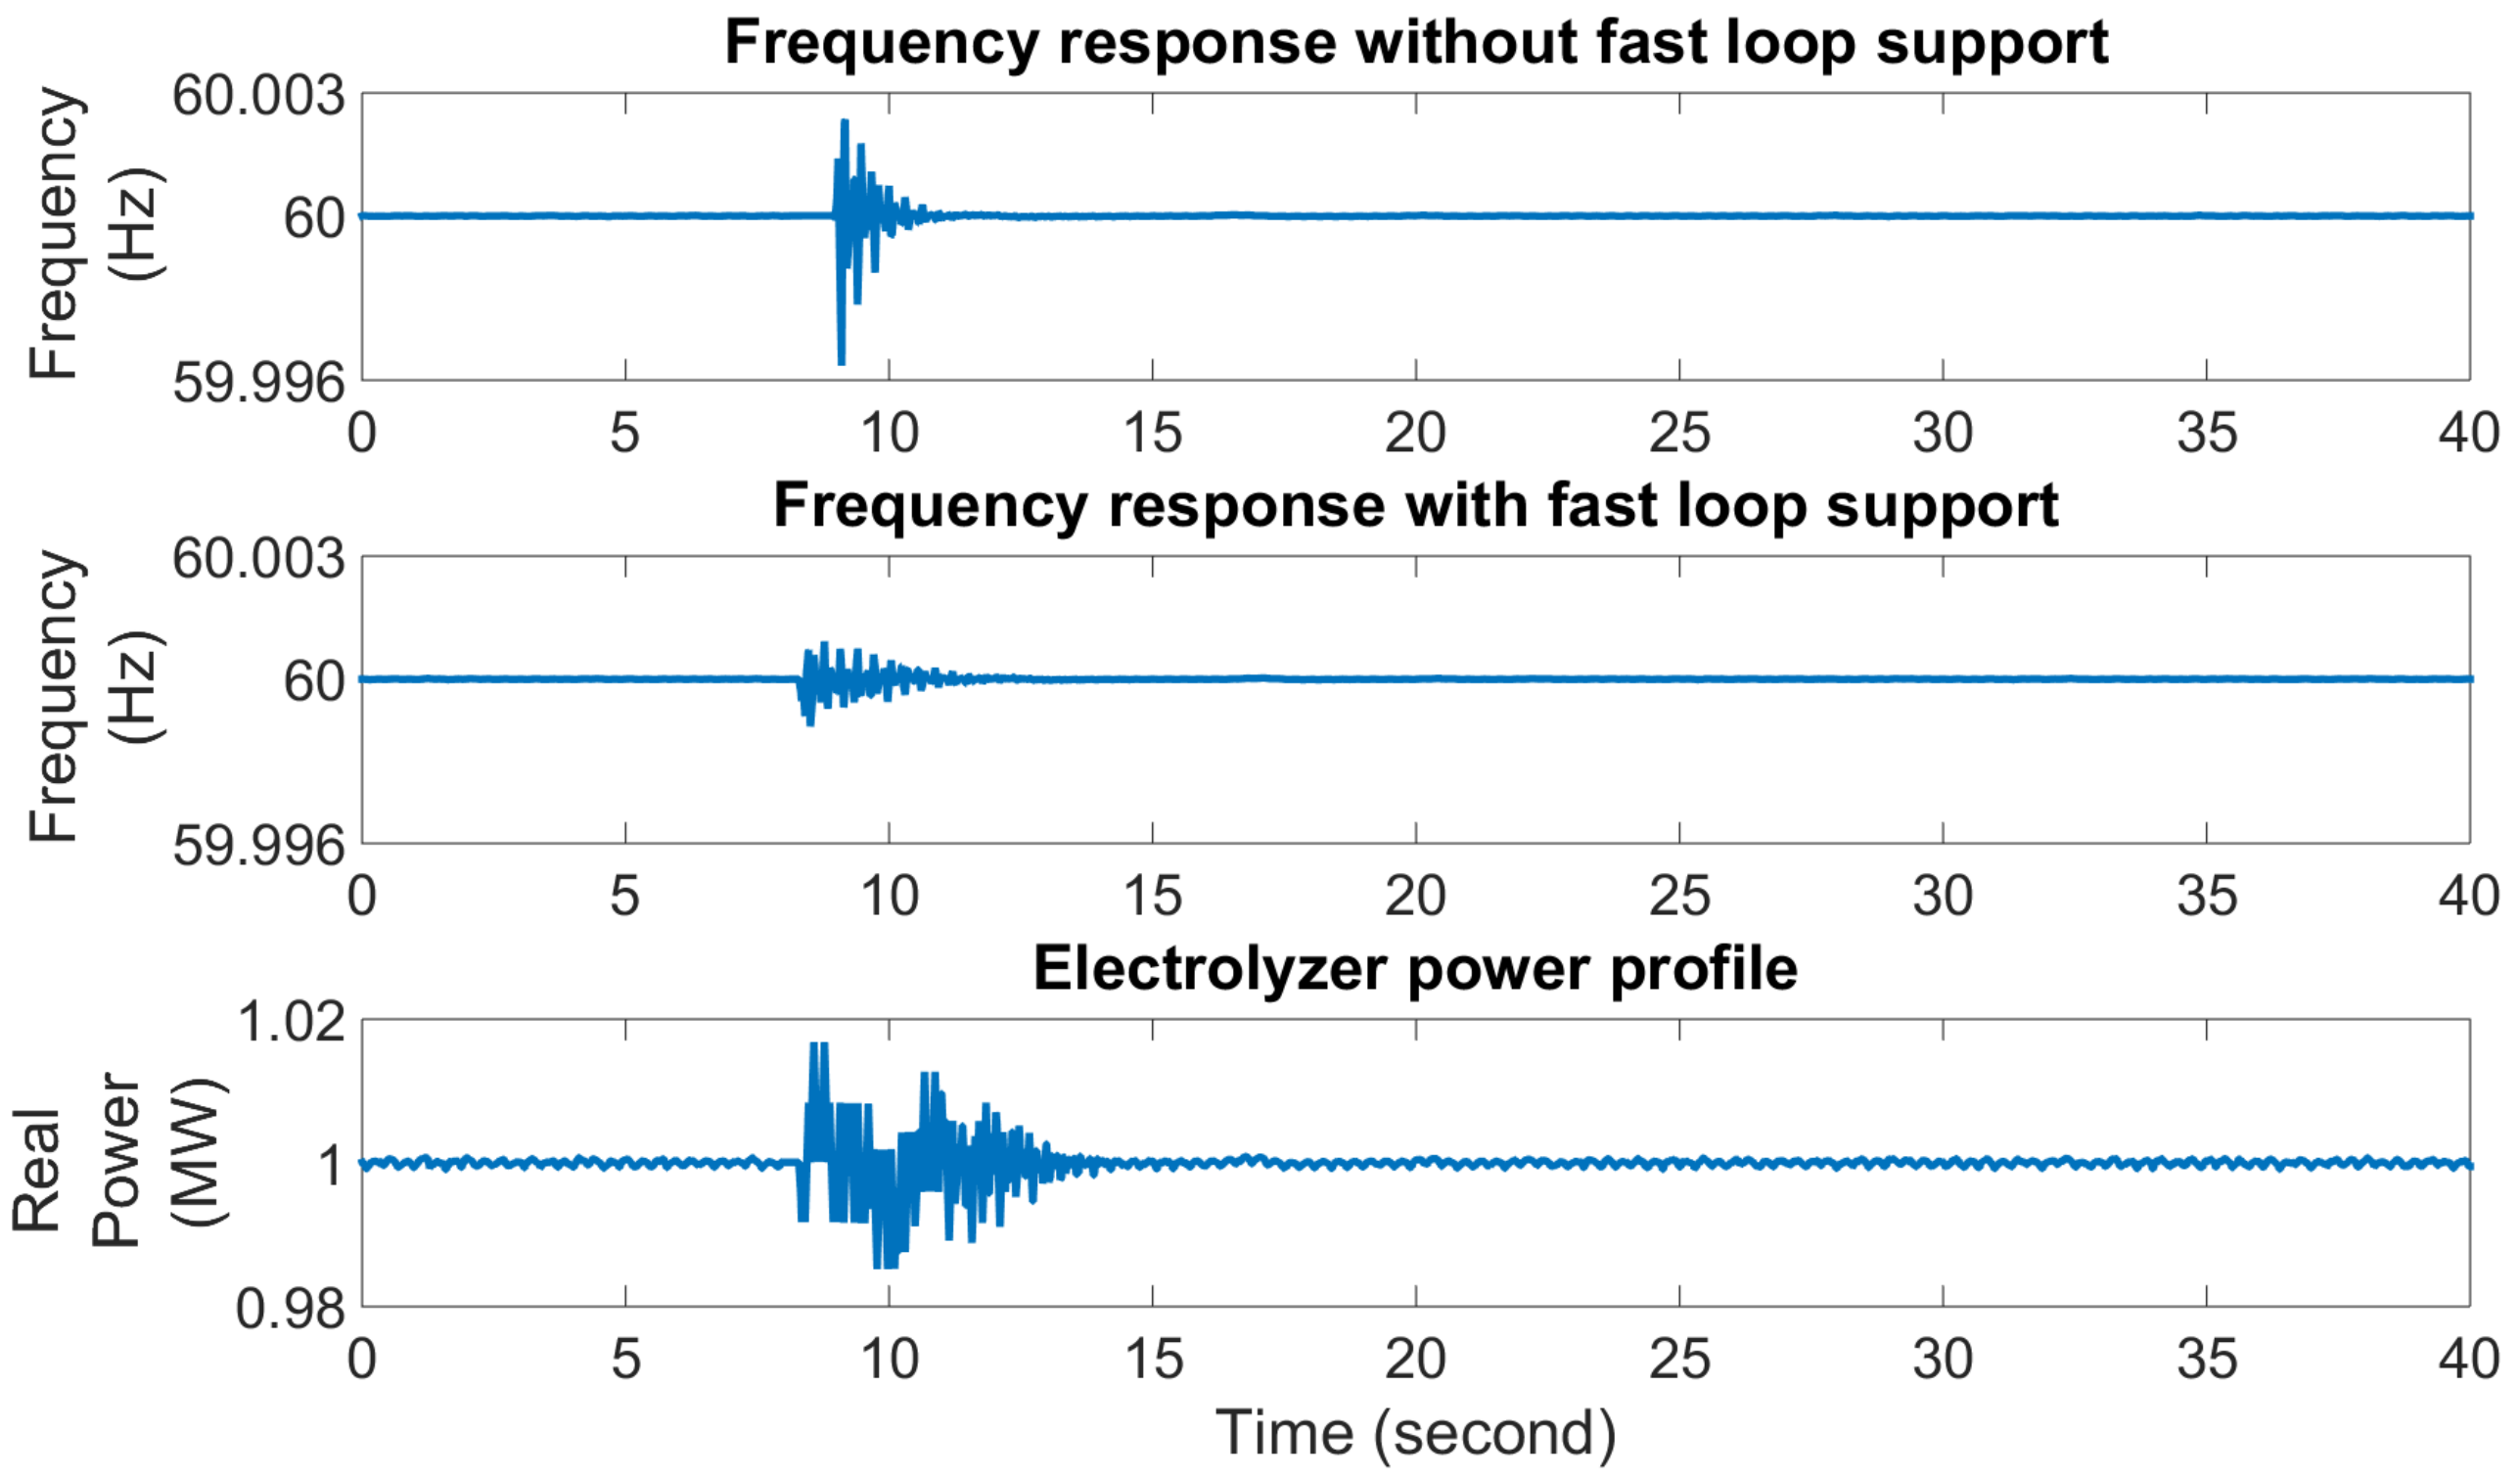
A 20-cycle three-phase balance fault was simulated at bus no. 802 to create frequency transients, and the response of the large electrolyzer was observed. Figure 10 shows the frequency support from the large-scale electrolyzer with and without the FEC. It shows that with FEC control, the frequency deviation could be reduced from 0.02 to 0.01 Hz. The third plot in Figure 10 shows the adjustment of the electrolyzer power on the basis of the computation of FEC to help provide frequency support. Figure 11 presents the frequency support from the small-scale electrolyzer with and without FEC. In this set of tests, a one-cycle three-phase balance fault was simulated at bus no. 802. This showed that, with FEC control, frequency deviation is reduced from 0.003 to 0.001 Hz. The smaller electrolyzer provides relatively lower support, as expected; however, for this type of deployment, there will be numerous other electrolyzers connected in the system.
4.2.2. Electrolyzers Providing Voltage Support
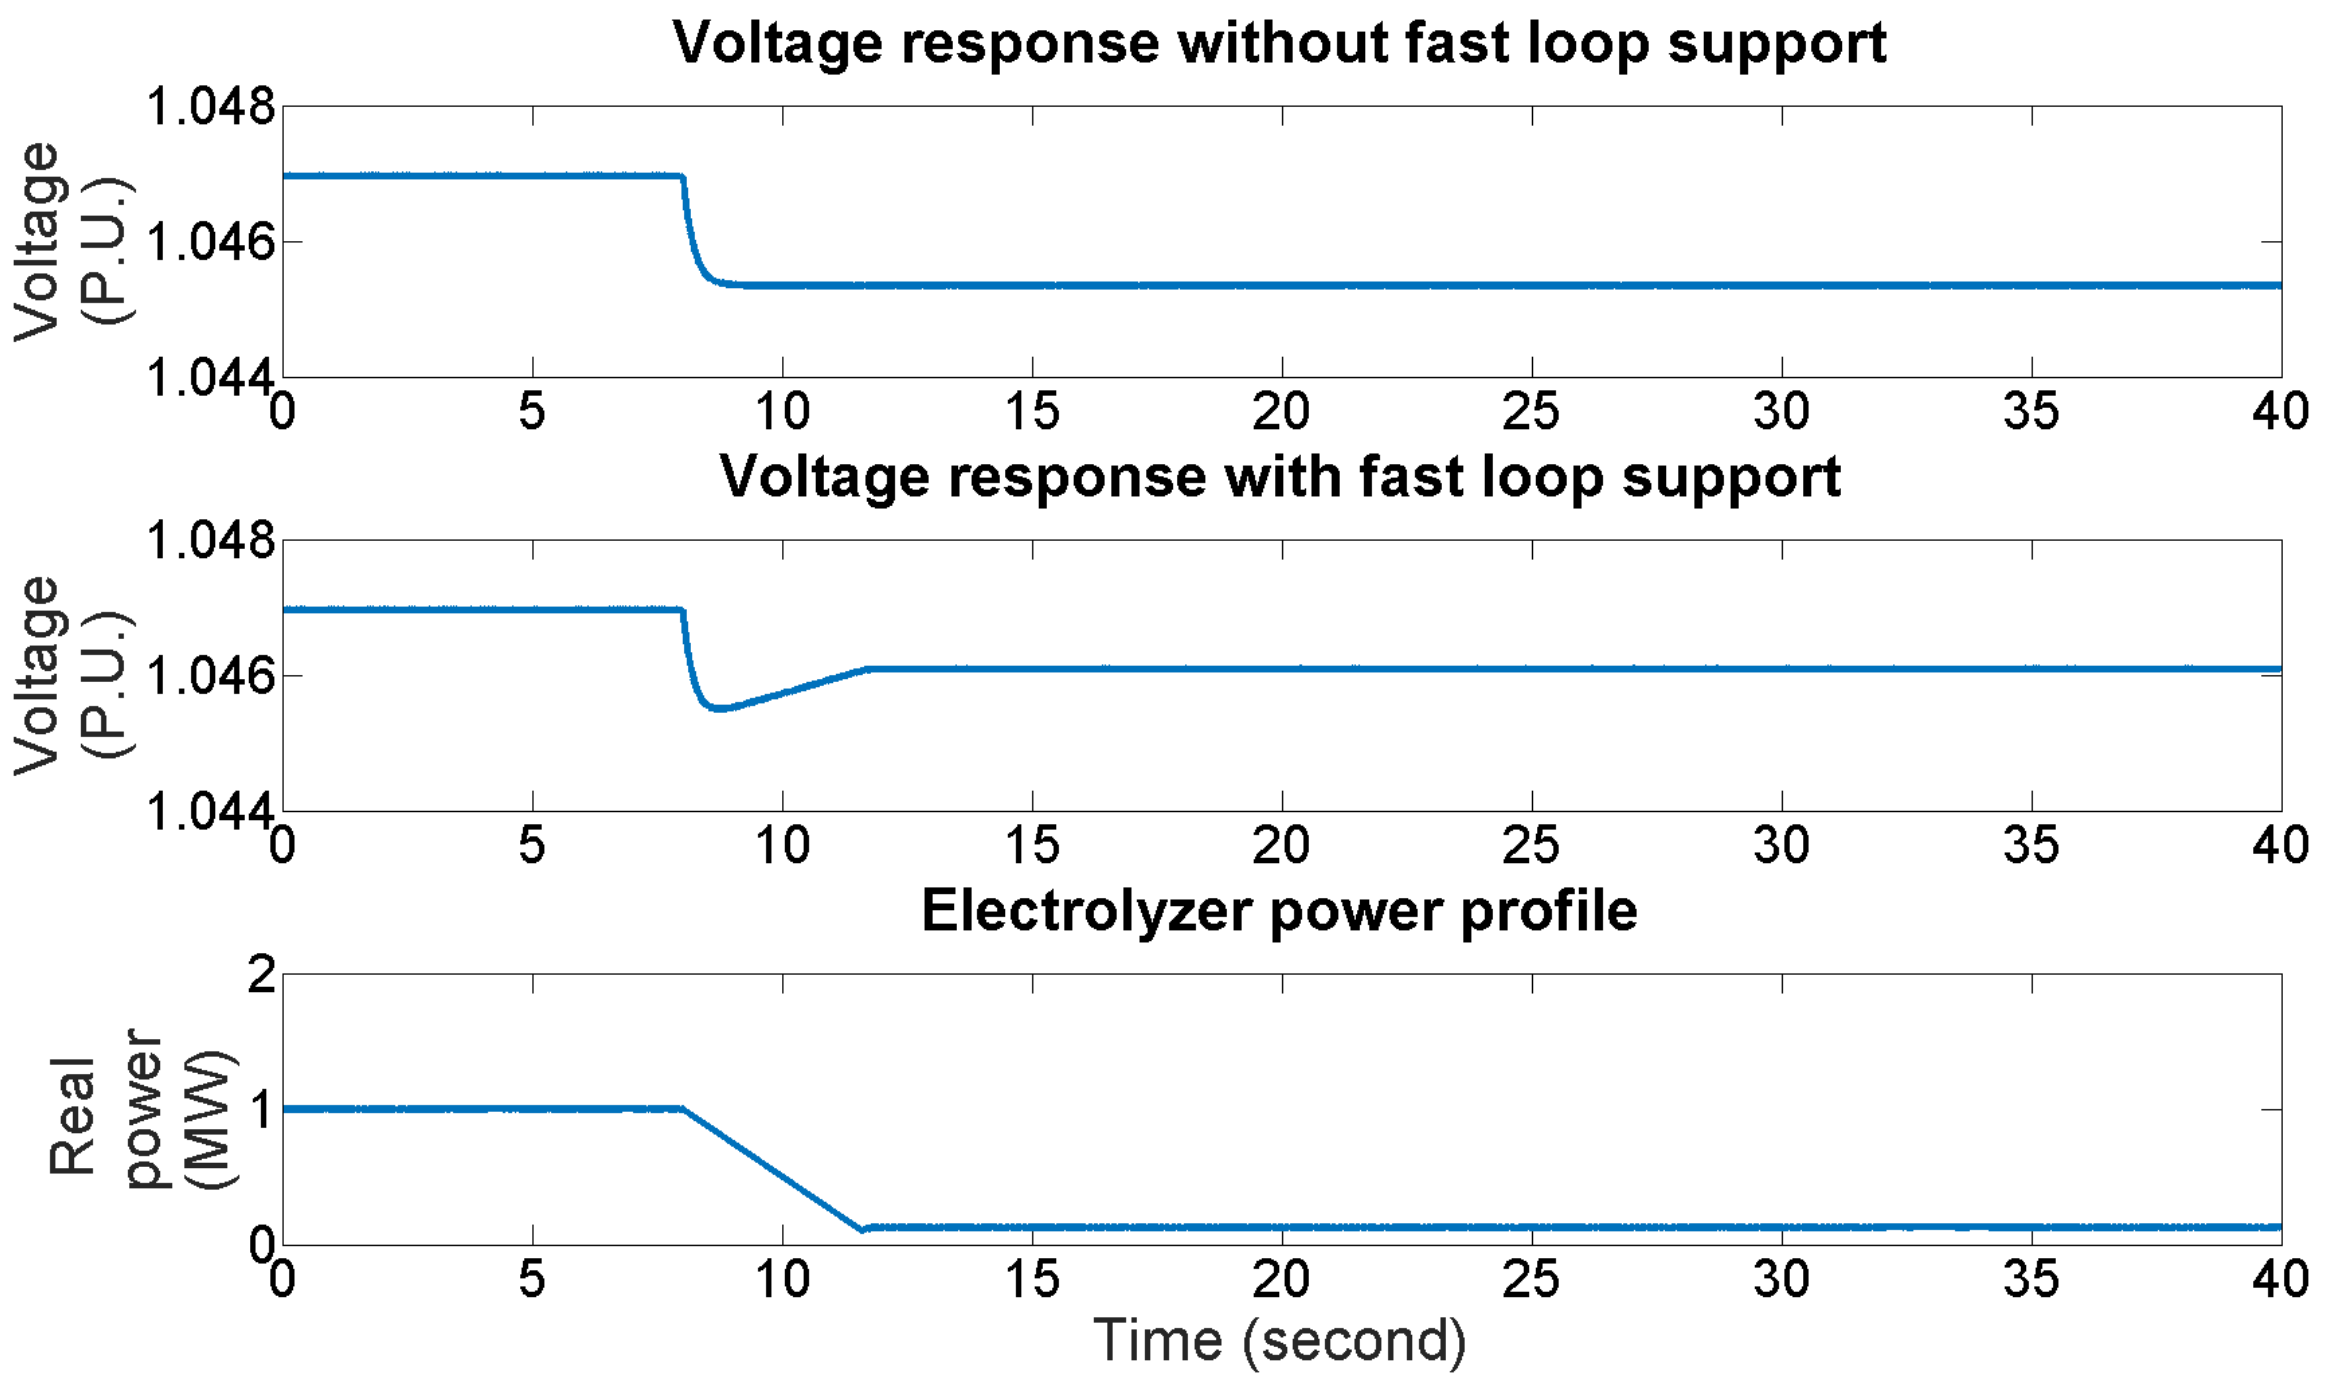
A 50 MW load was added to bus no. 802 as a step load to simulate a voltage transient, and the response of the large electrolyzer was observed. In Figure 12, the difference in the voltage response to a sudden load change with and without the control of FEC on a large-scale electrolyzer is shown. Without the FEC controlling the electrolyzer, the voltage can drop from 0.95 to 0.88 p.u., but with FEC control, the lowest voltage value is 0.89 p.u. which improves to 0.94 p.u. on the basis of the curtailment. Figure 13 demonstrates the response of the FEC-driven small-scale electrolyzer to an abrupt 2 MW load change. The first plot shows that without FEC control, the voltage drops to 0.015 p.u, but with FEC control, the voltage drop is less than 0.001 p.u.
4.3. Tests for Slow-Loop Optimization
There are two main demand patterns that the slow loop has to consider—electricity pricing and hydrogen fuel demand. In the slow-loop testing, the optimization performance according to the peak- and off-peak-time price difference of electricity was assessed and hydrogen was produced at the best possible price for a 24 h cycle. However it is expected that prior to the high fuel demand period, State Of Charge (SOC) can be maximized to ensure hydrogen demand is met, whereas for the low fuel demand period, the SOC must be maintained above the specified minimum value and eventually increased as needed. In any case, the priority of producing hydrogen in case of unexpected demands is the highest.
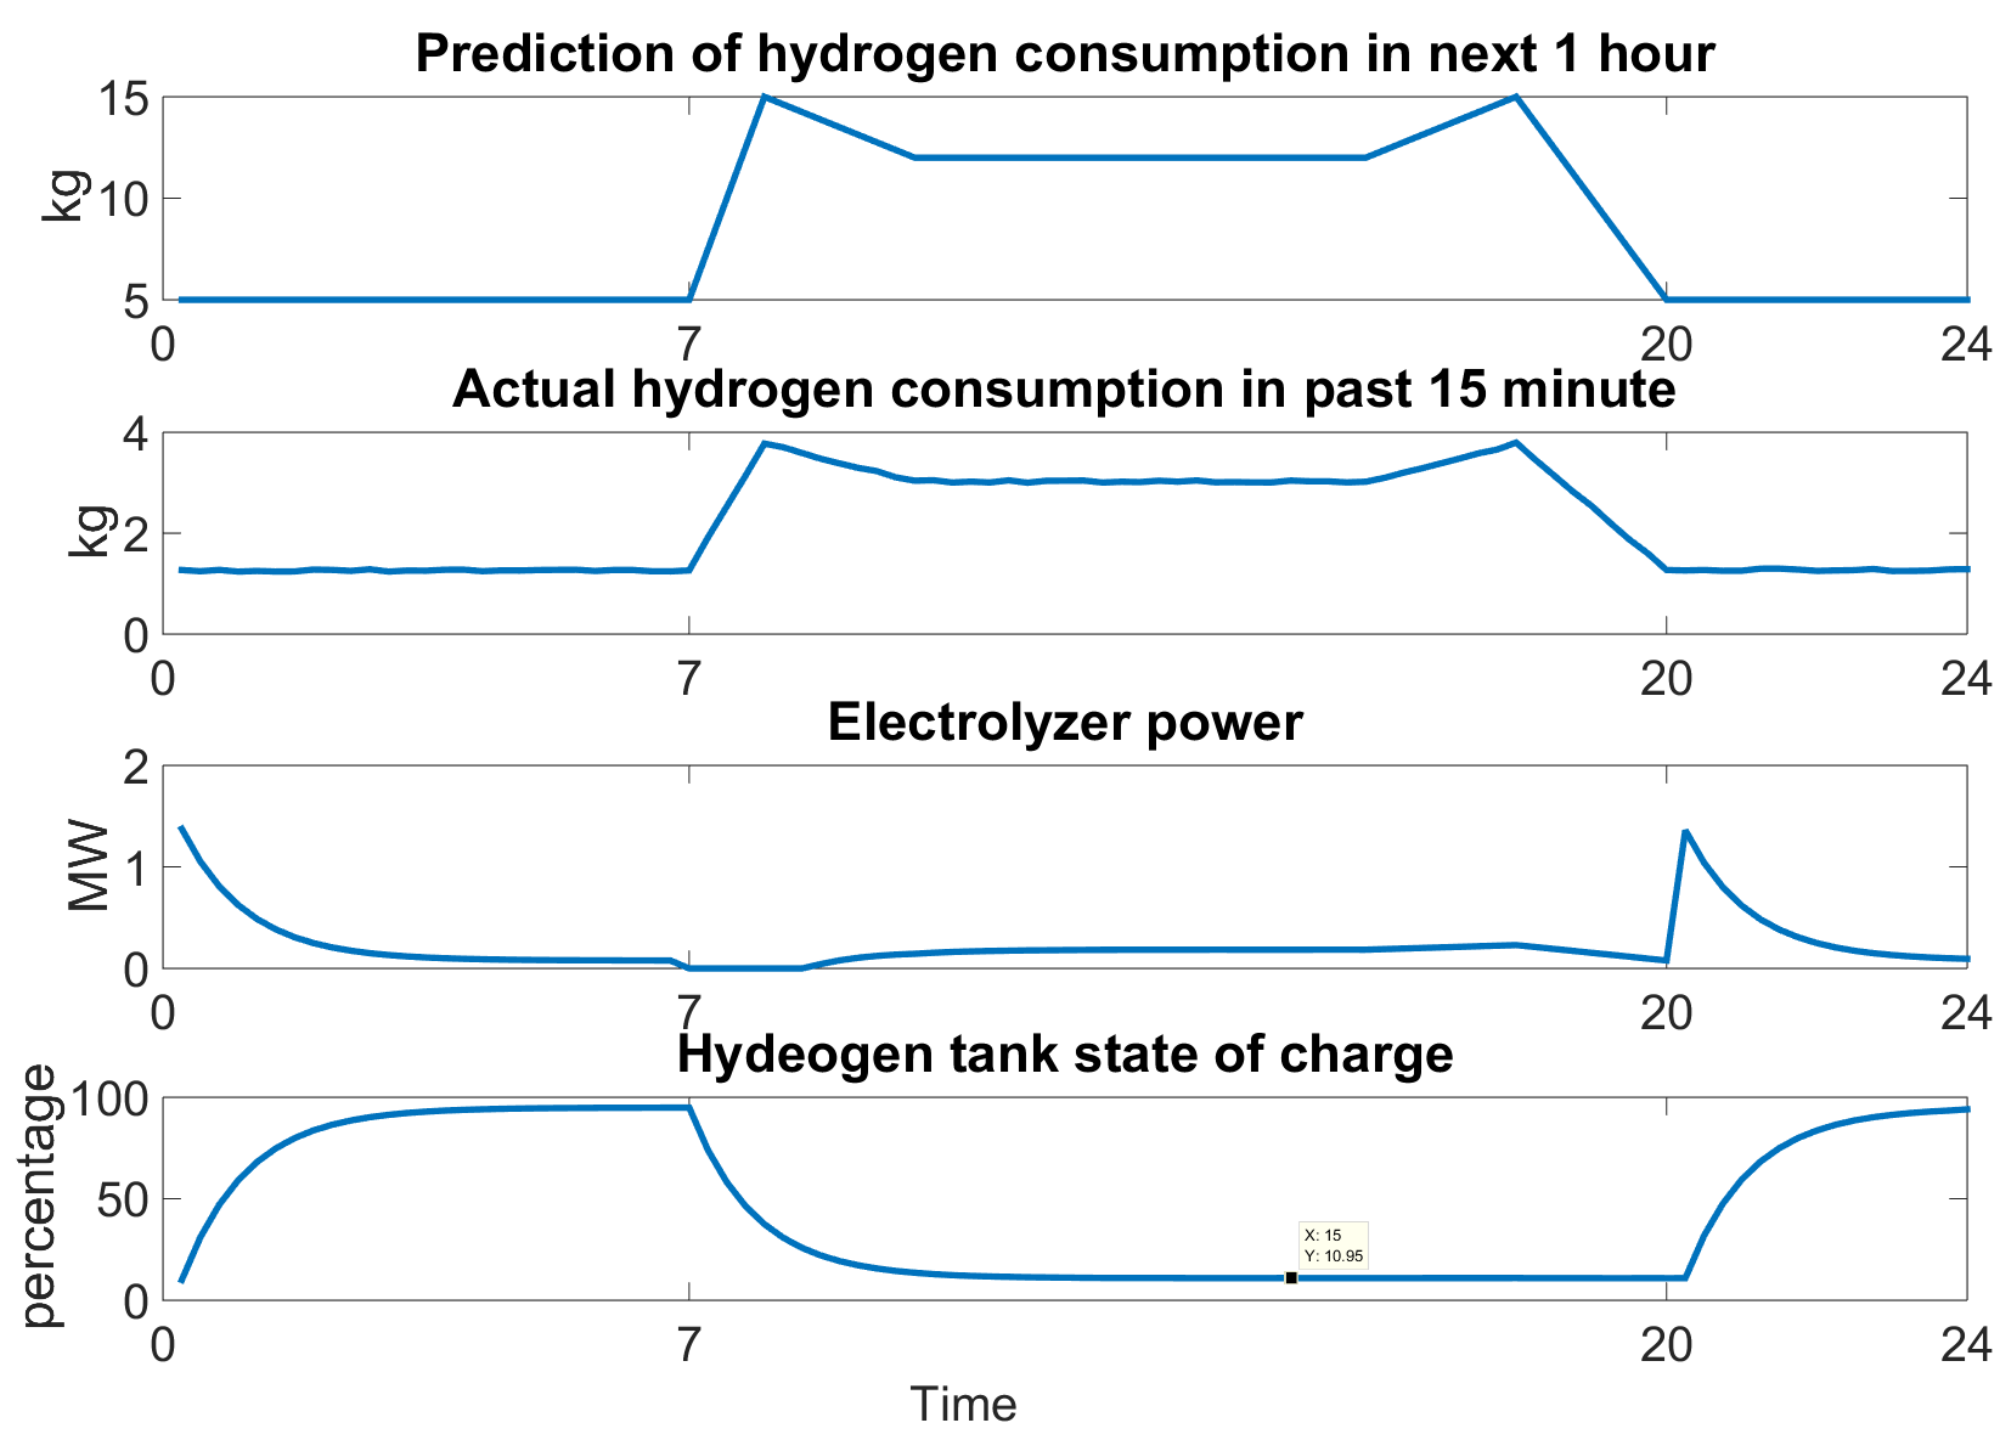
Figure 14 shows the test result when the initial SOC was set at 10% while the minimum SOC was set at 10% for an average-sized hydrogen refueling station with a maximum rating of 5 MW. The off-peak time for electricity pricing was set between 8 p.m. and 7 a.m. the next day, while the rest of the time was set as the peak price time. The test result shows that during the off-peak time, the SOC was charged to the preset maximum value of 95%. After processing a typical fuel demand profile, the minimum SOC observed was 10.95%. The power consumption of the electrolyzer during the peak time was maintained at a minimum, and during the off-peak time with a low SOC, the electrolyzer power consumption was maximized in order to produce cheap hydrogen. More complex optimization could be introduced in this case to match the contractual pricing mechanisms between the electrolyzer operator and utility to reduce the cost of hydrogen.
4.4. Demonstrating Demand Response Participation
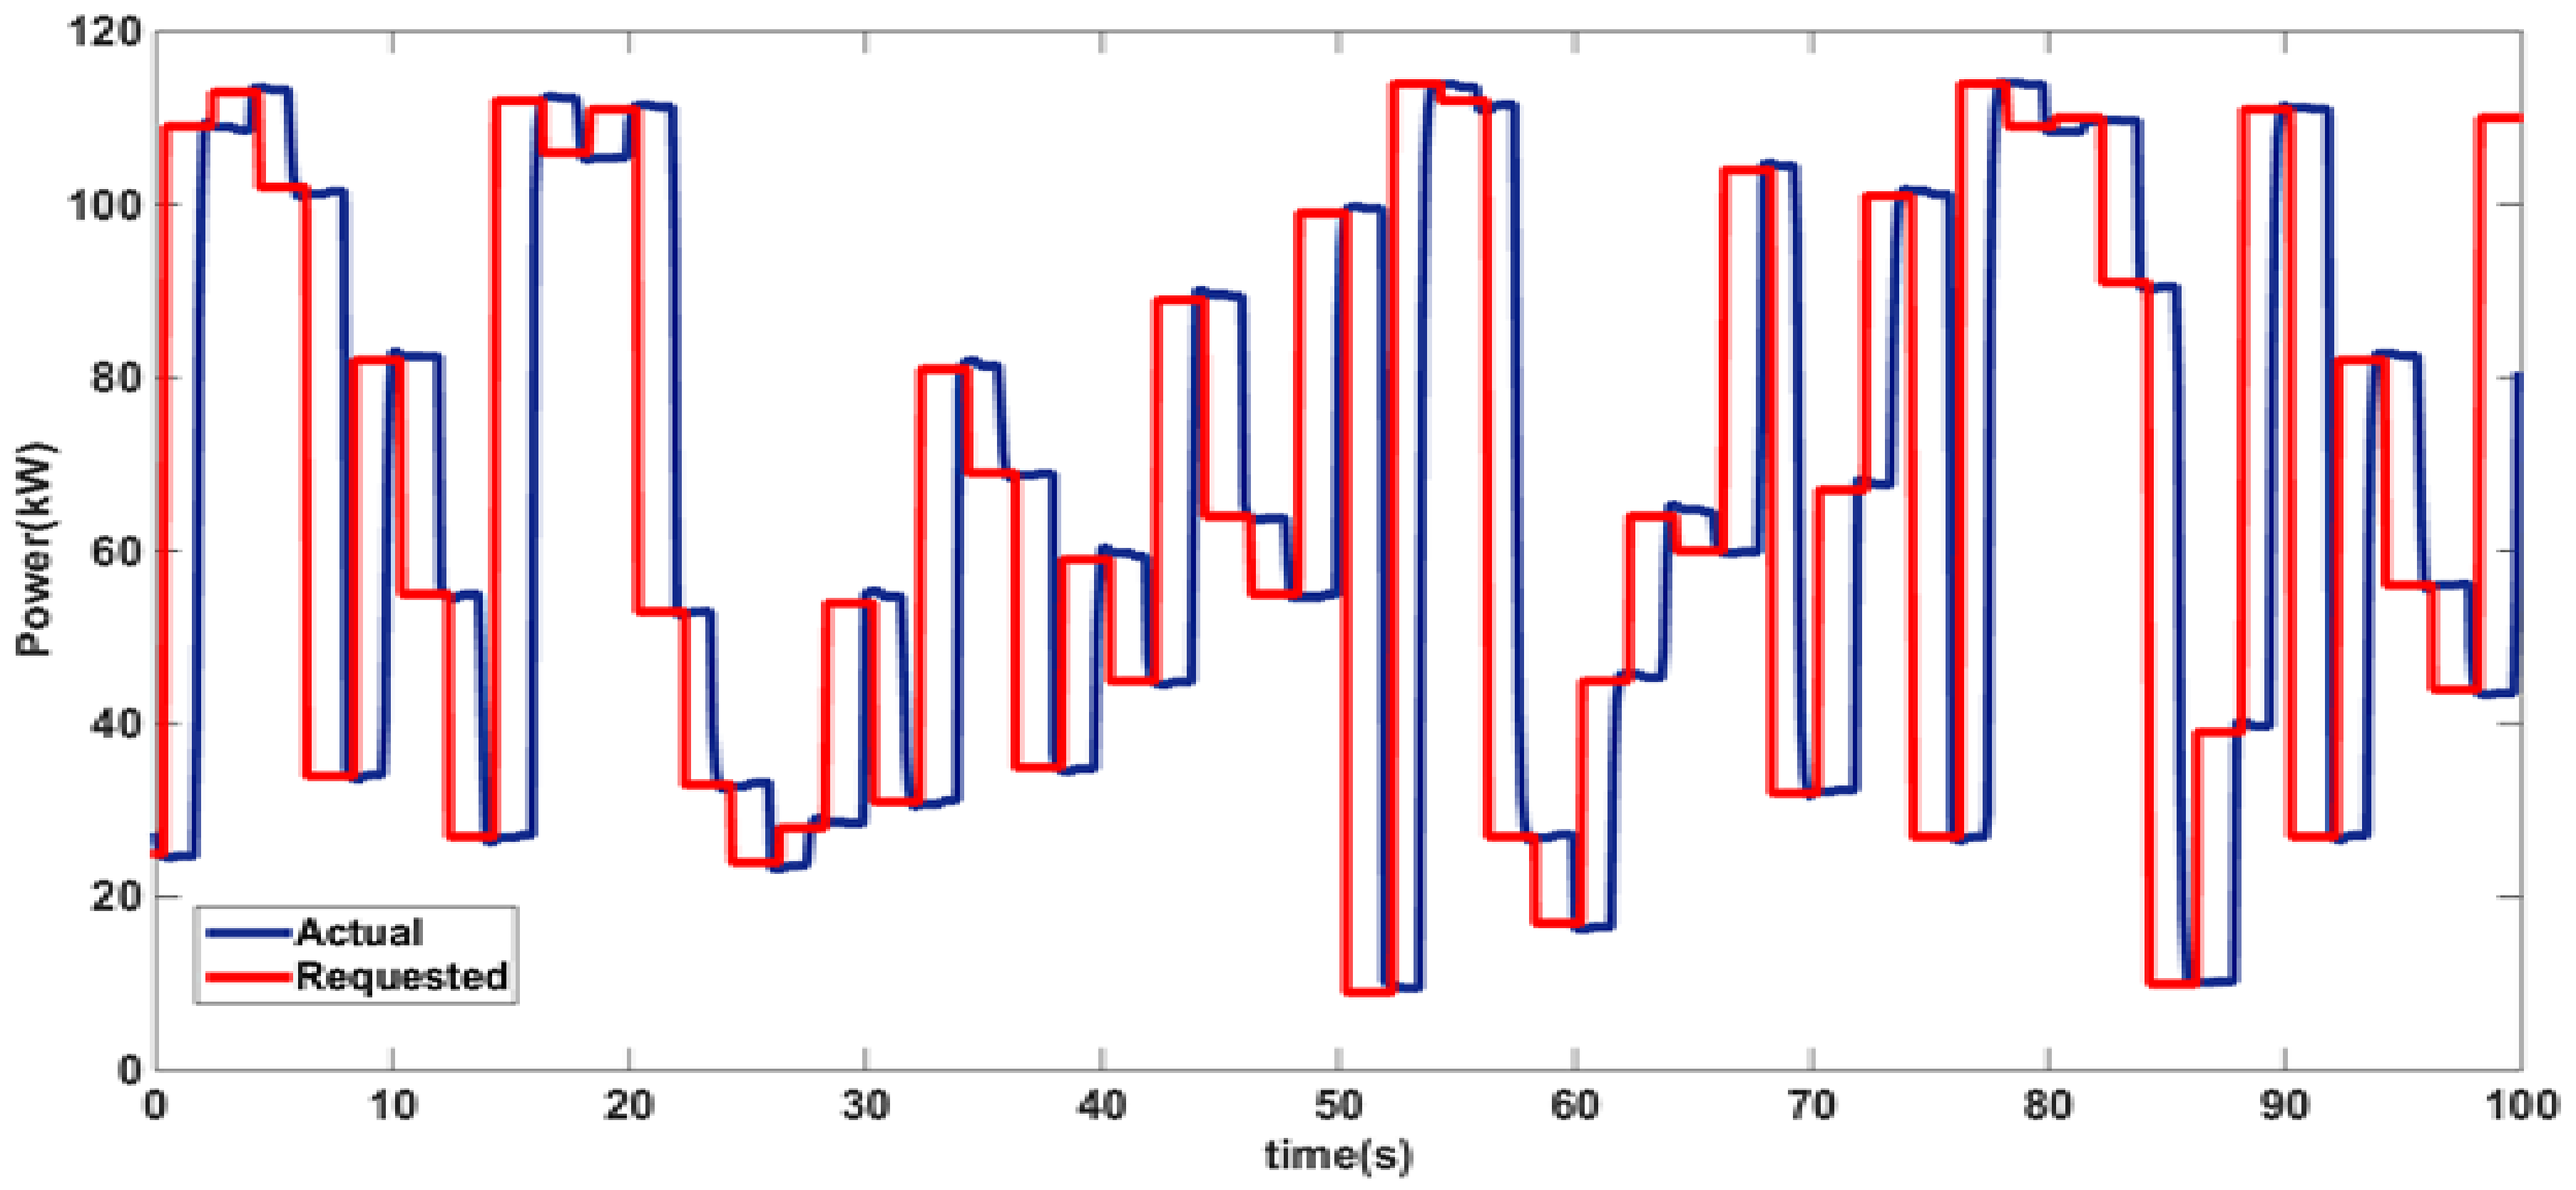
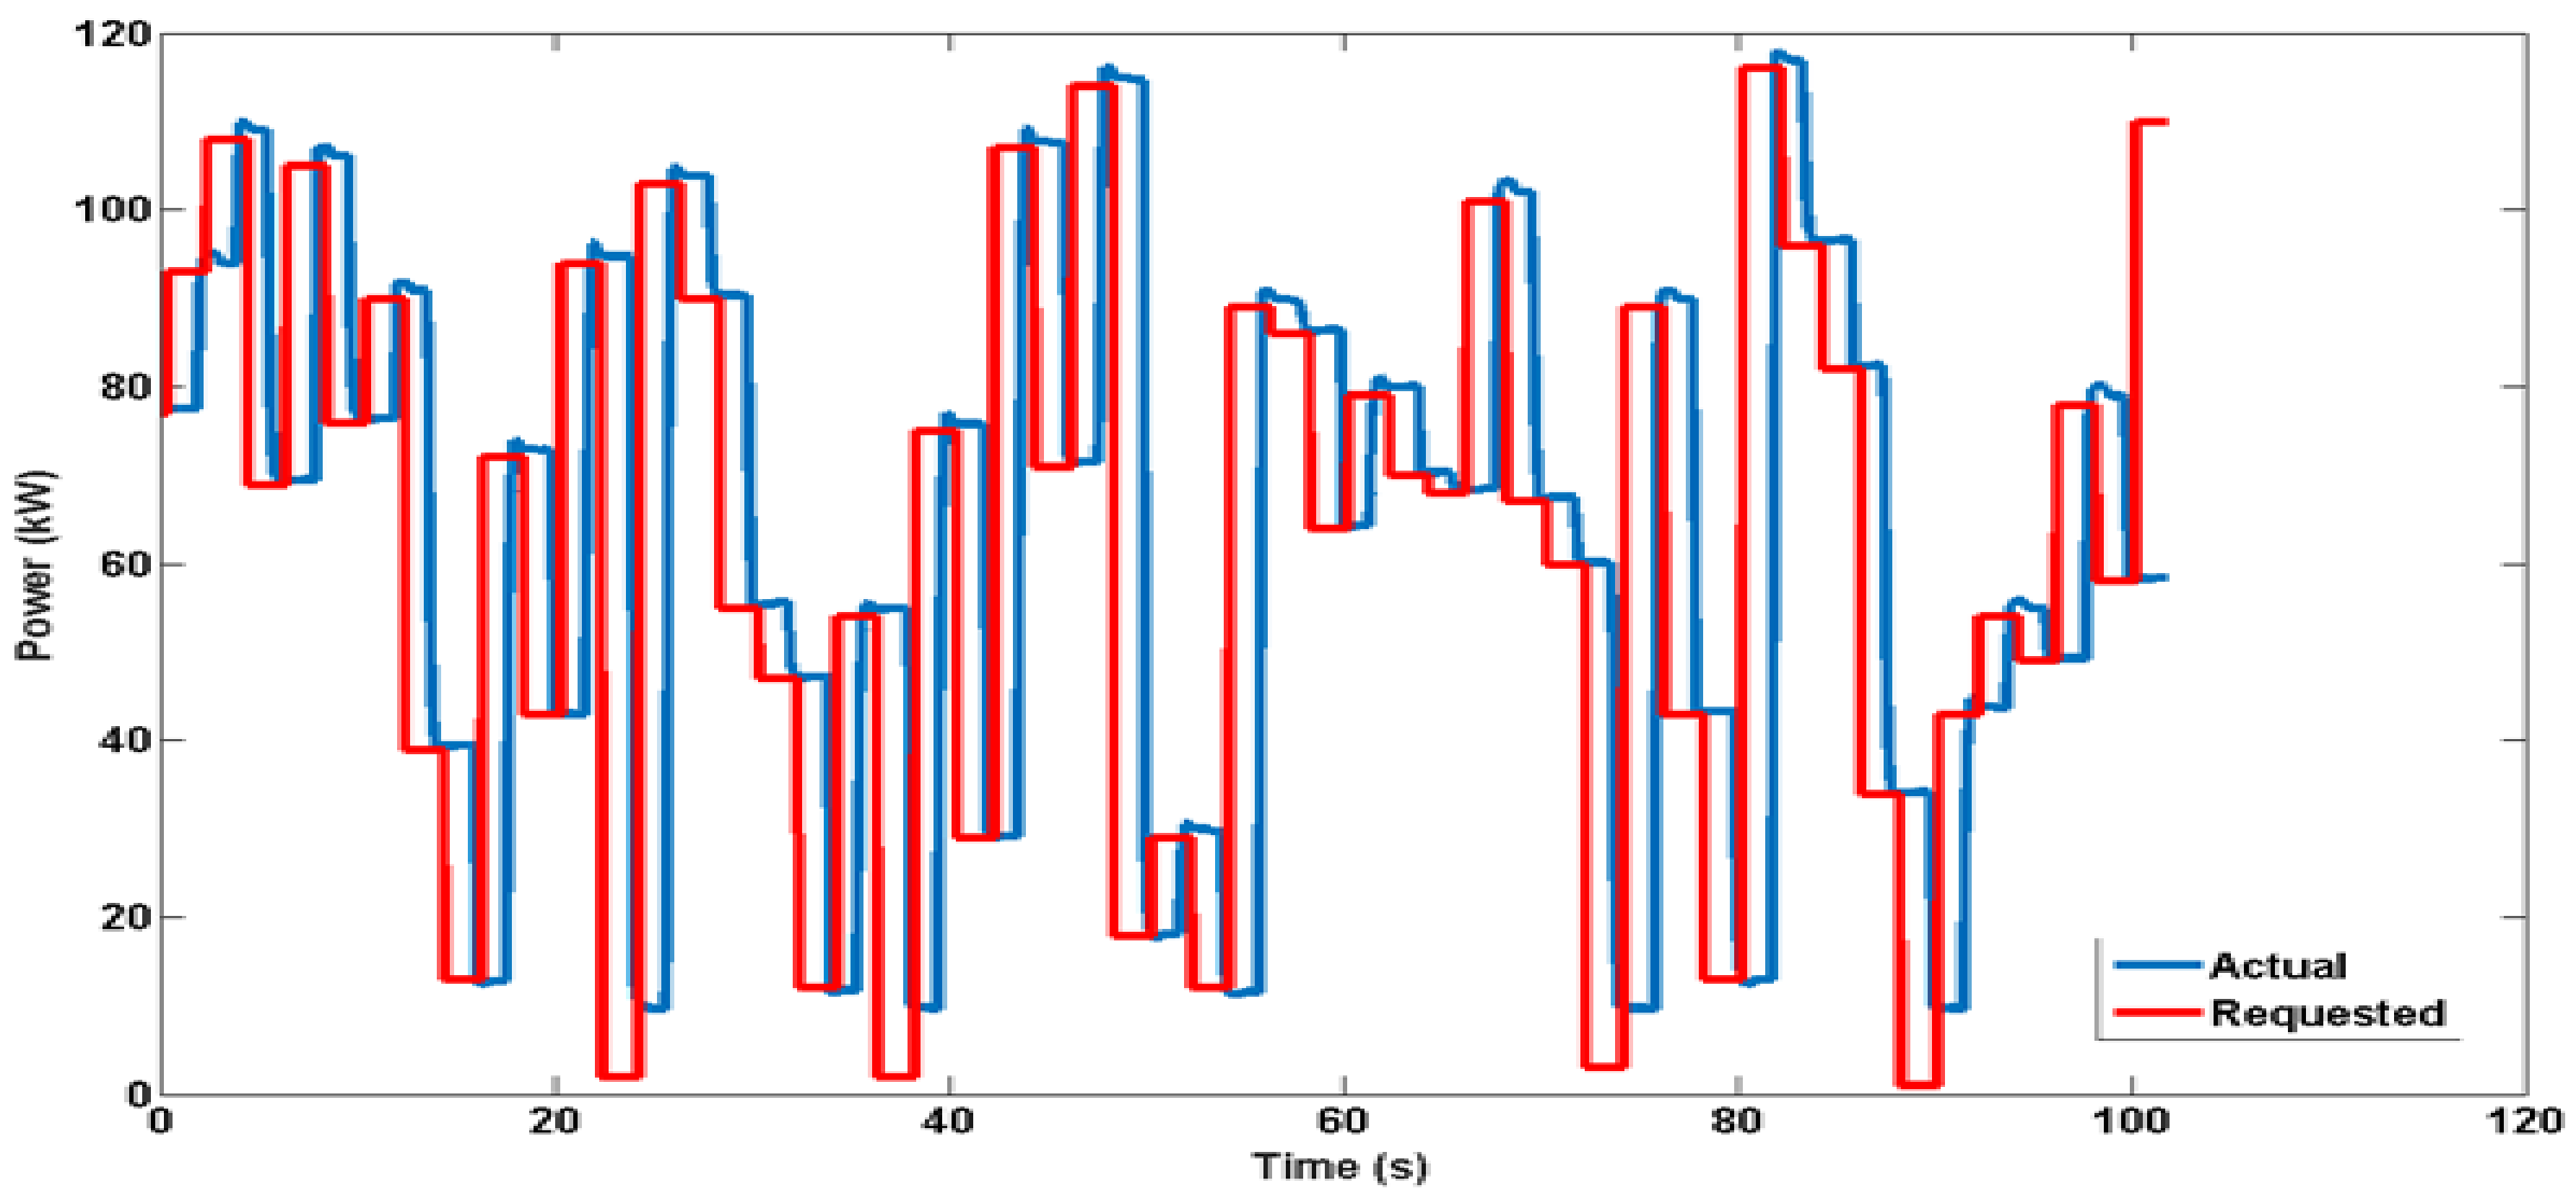
On the basis of the slow loop described above, the FEC can easily facilitate the participation of electrolyzers in demand response programs for enhanced revenue. Hydrogen refueling stations, which are essentially electrolyzers similar to the STB, are increasingly being deployed in the San Fransisco Bay Area, Southern California, and northeastern metropolitan cities such as Washington D.C. The configurations and ratings adopted for deploying hydrogen refueling stations are diverse and are transitioning to becoming a substantial load. The centralized large electrolyzer station is typically connected at subtransmission levels and requires hydrogen to be transported to the refueling stations. For the distributed small electrolyzer plants, hydrogen is produced on-site, stored, and then dispensed based on demand. In any case, hydrogen generation through electrolysis can be a unique candidate for participating in demand response programs. Sample demand response program-based profiles from the Pacific Gas and Electric (PG&E) utility under the “Peak Day Pricing” are used to operate the STB at the NREL using the FEC [25]. The two sample profiles E-19 and E-20 are used to operate the STB at the NREL with real-time signals, and the results are shown in Figure 15 and Figure 16. These profiles were adopted for their magnitudes, and the duration of maintaining a particular level of consumption was reduced from the minutes to seconds level, for ease of experiment. The electrolyzer in the STB at the NREL has already been tested to maintain a constant power consumption for any desired amount of time. There are numerous protocols being adopted to demonstrate pilot projects related to demand response around the world. The computation of the exact economic compensation due to participation in demand response programs is out of scope. However, if the electrolyzers are able to satisfy hydrogen demand by participating in such programs, this will lead to an enhancement of revenue based on agreements.
5. Concluding Remarks
This paper has discussed the growing need of flexibility in electric grids, particularly distribution networks, on account of the growing variability and uncertainty in DERs. This paper presents controllable loads, such as electrolyzers, as enablers of flexibility in the electric grids and hence assists in the assimilation of the DER-related challenges. The required “awareness” for loads can be added with the implementation of FECs such as that demonstrated here. The three modules in the proposed FEC are communication, interpretation, and optimization. The two control loops within the optimization module are fast and slow loops for grid services and the market, respectively. The FEC acts as a connecting link between the load and a higher grid management system to generate techno-economically optimal operating regimes in real-time for loads.
The controllability of electrolyzers in the subsecond level time regime is utilized with the FEC to demonstrate grid support and load management programs. With the flexible electrolyzer operation, the paper demonstrates automated participation in demand response programs, local voltage support, frequency support, and so forth. Hydrogen refueling stations predominantly use electrolyzers for producing hydrogen that is used as transportation fuel. Centralized electrolysis is used for large, commercial hydrogen manufacturers that supply mostly industrial processes with hydrogen as the fuel. For a large (105 MW) electrolyzer with and without the FEC, the frequency deviation was reduced from 0.02 to 0.01 Hz. Similarly for a small electrolyzer, the frequency deviation was reduced from 0.003 to 0.001 Hz. For large electrolyzers with and without FECs, the voltage deviations were limited within the range of 0.94 and 0.89 p.u. and 0.95 and 0.88 p.u., respectively. The simulation case for the small electrolyzer with and without FEC driven electrolyzer led to a voltage drop of 0.001 and 0.015 p.u., respectively. The values provided here are for a set of typical power system events simulated in real-time for the IEEE 34 node feeder system. The slow-loop optimization test on the basis of on-peak and off-peak prices of electricity led to supplying a typical hydrogen demand with the lowest and highest SOC of 11% and 95%, respectively. A couple of real-world demand response programs were also sent as signals to the electrolyzer stack with the FEC, and the response that was obtained was sufficient. It is noted that grid services at the distribution network are not currently being compensated for, particularly if provided by loads, except for in the case of demand response-type programs. The two major outcomes of demonstrating electrolyzers as controllable loads have been satisfied, namely, the desired operation of electrolyzers to optimize revenue with hydrogen demand being satisfied and no impact on the life of the load itself.
Acknowledgments
Funding support from the Fuel Cell Technologies Office, the Department of Energy is acknowledged.
Author Contributions
Manish Mohanpurkar, Yusheng Luo, Danny Terlip, Kevin Harrison, and Fernando Dias were key in establishing the experimental setup and performing experiments; Joshua Eichman contributed to the development of slow loop, Rob Hovsapian and Jennifer Kurtz helped coordinate, manage, and provide technical directions for the research activity. Paper writing activities were divided based on the above contributions.
Conflicts of Interest
The authors declare no conflicts of interest.
References
- EPRI: Distributed Energy Resources. Available online: http://www2.epri.com/Our-Work/Pages/Distributed-Electricity-Resources.aspx (accessed on 3 September 2017).
- Mohanpurkar, M.; Ramakumar, R. Probability density functions for power output of wind electric conversion systems. In Proceedings of the IEEE Power and Energy Society General Meeting, Providence, RI, USA, 25–29 July 2010; pp. 1–7. [Google Scholar]
- DNV GL. A Review of Distributed Energy Resources. Available online: http://www.nyiso.com/public/webdocs/media_room/publications_presentations/Other_Reports/Other_Reports/A_Review_of_Distributed_Energy_Resources_September_2014.pdf (accessed on 3 September 2017).
- Eurostat. Renewable Energy Statistics. Available online: http://ec.europa.eu/eurostat/statistics-explained/index.php/Renewable_energy_statistics (accessed on 3 September 2017).
- Electricity in the United States—Energy Explained, Your Guide to Understanding Energy—Energy Information Administration. Available online: https://www.eia.gov/energyexplained/index.cfm?page=electricity_in_the_united_states#tab2 (accessed on 3 September 2017).
- Mohanpurkar, M.; Ouroua, A.; Hovsapian, R.; Luo, Y.; Singh, M.; Muljadi, E.; Gevorgian, V.; Donalek, P. Real-time co-simulation of adjustable-speed pumped storage hydro for transient stability analysis. Electr. Power Syst. Res. 2018, 154, 276–286. [Google Scholar] [CrossRef]
- Chae, J.; Joo, S.K. Demand Response Resource Allocation Method Using Mean-Variance Portfolio Theory for Load Aggregators in the Korean Demand Response Market. Energies 2017, 10, 879. [Google Scholar] [CrossRef]
- Zhou, N.; Liu, N.; Zhang, J.; Lei, J. Multi-Objective optimal sizing for BATTERY Storage of PV-based microgrid with demand response. Energies 2016, 9, 591. [Google Scholar] [CrossRef]
- Dias, F.; Luo, Y.; Mohanpurkar, M.; Hovsapian, R.; Scoffield, D. Potential for Plug-In Electric Vehicles to provide grid support services. In Proceedings of the IEEE Transportation Electrification Conference and Expo (ITEC), Chicago, IL, USA, 22–24 June 2017; pp. 294–299. [Google Scholar] [CrossRef]
- Wang, B.; Liu, X.; Zhu, F.; Hu, X.; Ji, W.; Yang, S.; Wang, K.; Feng, S. Unit commitment model considering flexible scheduling of demand response for high wind integration. Energies 2015, 8, 13688–13709. [Google Scholar] [CrossRef]
- Hong, Y.; Wang, S.; Huang, Z. Efficient Energy Consumption Scheduling: Towards Effective Load Leveling. Energies 2017, 10, 105. [Google Scholar] [CrossRef]
- Boboescu, I.Z.; Gherman, V.D.; Lakatos, G.; Pap, B.; Bíró, T.; Maróti, G. Surpassing the current limitations of biohydrogen production systems: The case for a novel hybrid approach. Bioresour. Technol. 2016, 204, 192–201. [Google Scholar] [CrossRef] [PubMed]
- Bejan, A. Advanced Engineering Thermodynamics; Wiley: Hoboken, NJ, USA, 1988. [Google Scholar]
- Bakker, S.; Van Lente, H.; Meeus, M.T. Credible expectations—The US Department of Energy’s Hydrogen Program as enactor and selector of hydrogen technologies. Technol. Forecast. Soc. Chang. 2012, 79, 1059–1071. [Google Scholar] [CrossRef]
- Fernandes, T.; Pimenta, R.; Correas, L.; García-Camús, J.; Cabral, A.; Reyes, F.; Grano, B.; Guerra, R.; Couhert, C.; Chacón, E. Platform for promoting a hydrogen economy in Southwest Europe: The HYRREG project. Int. J. Hydrog. Energy 2013, 38, 7594–7598. [Google Scholar] [CrossRef]
- College of the Desert: Hydrogen Fuel Cell Engines and Related Technologies. Available online: https://energy.gov/sites/prod/files/2014/03/f12/fcm01r0.pdf (accessed on 12 September 2017).
- Hydrogen Production and Storage: R&D Priorities and Gaps. Available online: https://www.iea.org/publications/freepublications/publication/hydrogen.pdf (accessed on 4 September 2017).
- Felgenhauer, M.; Hamacher, T. State-of-the-art of commercial electrolyzers and on-site hydrogen generation for logistic vehicles in South Carolina. Int. J. Hydrog. Energy 2015, 40, 2084–2090. [Google Scholar] [CrossRef]
- Mori, M.; Mržljak, T.; Drobnič, B.; Sekavčnik, M. Integral characteristics of hydrogen production in alkaline electrolysers. J. Mech. Eng. 2013, 59, 585–594. [Google Scholar] [CrossRef]
- Trifkovic, M.; Sheikhzadeh, M.; Nigim, K.; Daoutidis, P. Hierarchical control of a renewable hybrid energy system. In Proceedings of the IEEE 51st Annual Conference on Decision and Control (CDC), Maui, HI, USA, 10–13 December 2012; pp. 6376–6381. [Google Scholar] [CrossRef]
- Ayers, K.E.; Anderson, E.B.; Capuano, C.; Carter, B.; Dalton, L.; Hanlon, G.; Manco, J.; Niedzwiecki, M. Research advances towards low cost, high efficiency PEM electrolysis. ECS Trans. 2010, 33, 3–15. [Google Scholar] [CrossRef]
- Funmilayo, H.B.; Silva, J.A.; Butler-Purry, K.L. Overcurrent protection for the IEEE 34-node radial test feeder. IEEE Trans. Power Deliv. 2012, 27, 459–468. [Google Scholar] [CrossRef]
- Heffner, G.; Goldman, C.; Kirby, B.J.; Kintner-Meyer, M. Loads Providing Ancillary Services: Review of International Experience; Technical Report; Oak Ridge National Laboratory (ORNL): Oak Ridge, TN, USA, 2007. [Google Scholar]
- Eichman, J.; Harrison, K.; Peters, M. Novel Electrolyzer Applications: Providing More Than Just Hydrogen; Technical Report; National Renewable Energy Laboratory (NREL): Golden, CO, USA, 2014. [Google Scholar]
- Pacific Gas and Electric Company. Find Out if Peak Day Pricing is Right for Your Business. Available online: https://www.pge.com/en_US/business/rate-plans/rate-plans/peak-day-pricing/peak-day-pricing.page (accessed on 17 September 2017).
Figure 1.
Proposed front end controller (FEC) with controllable electrolyzers as an example.
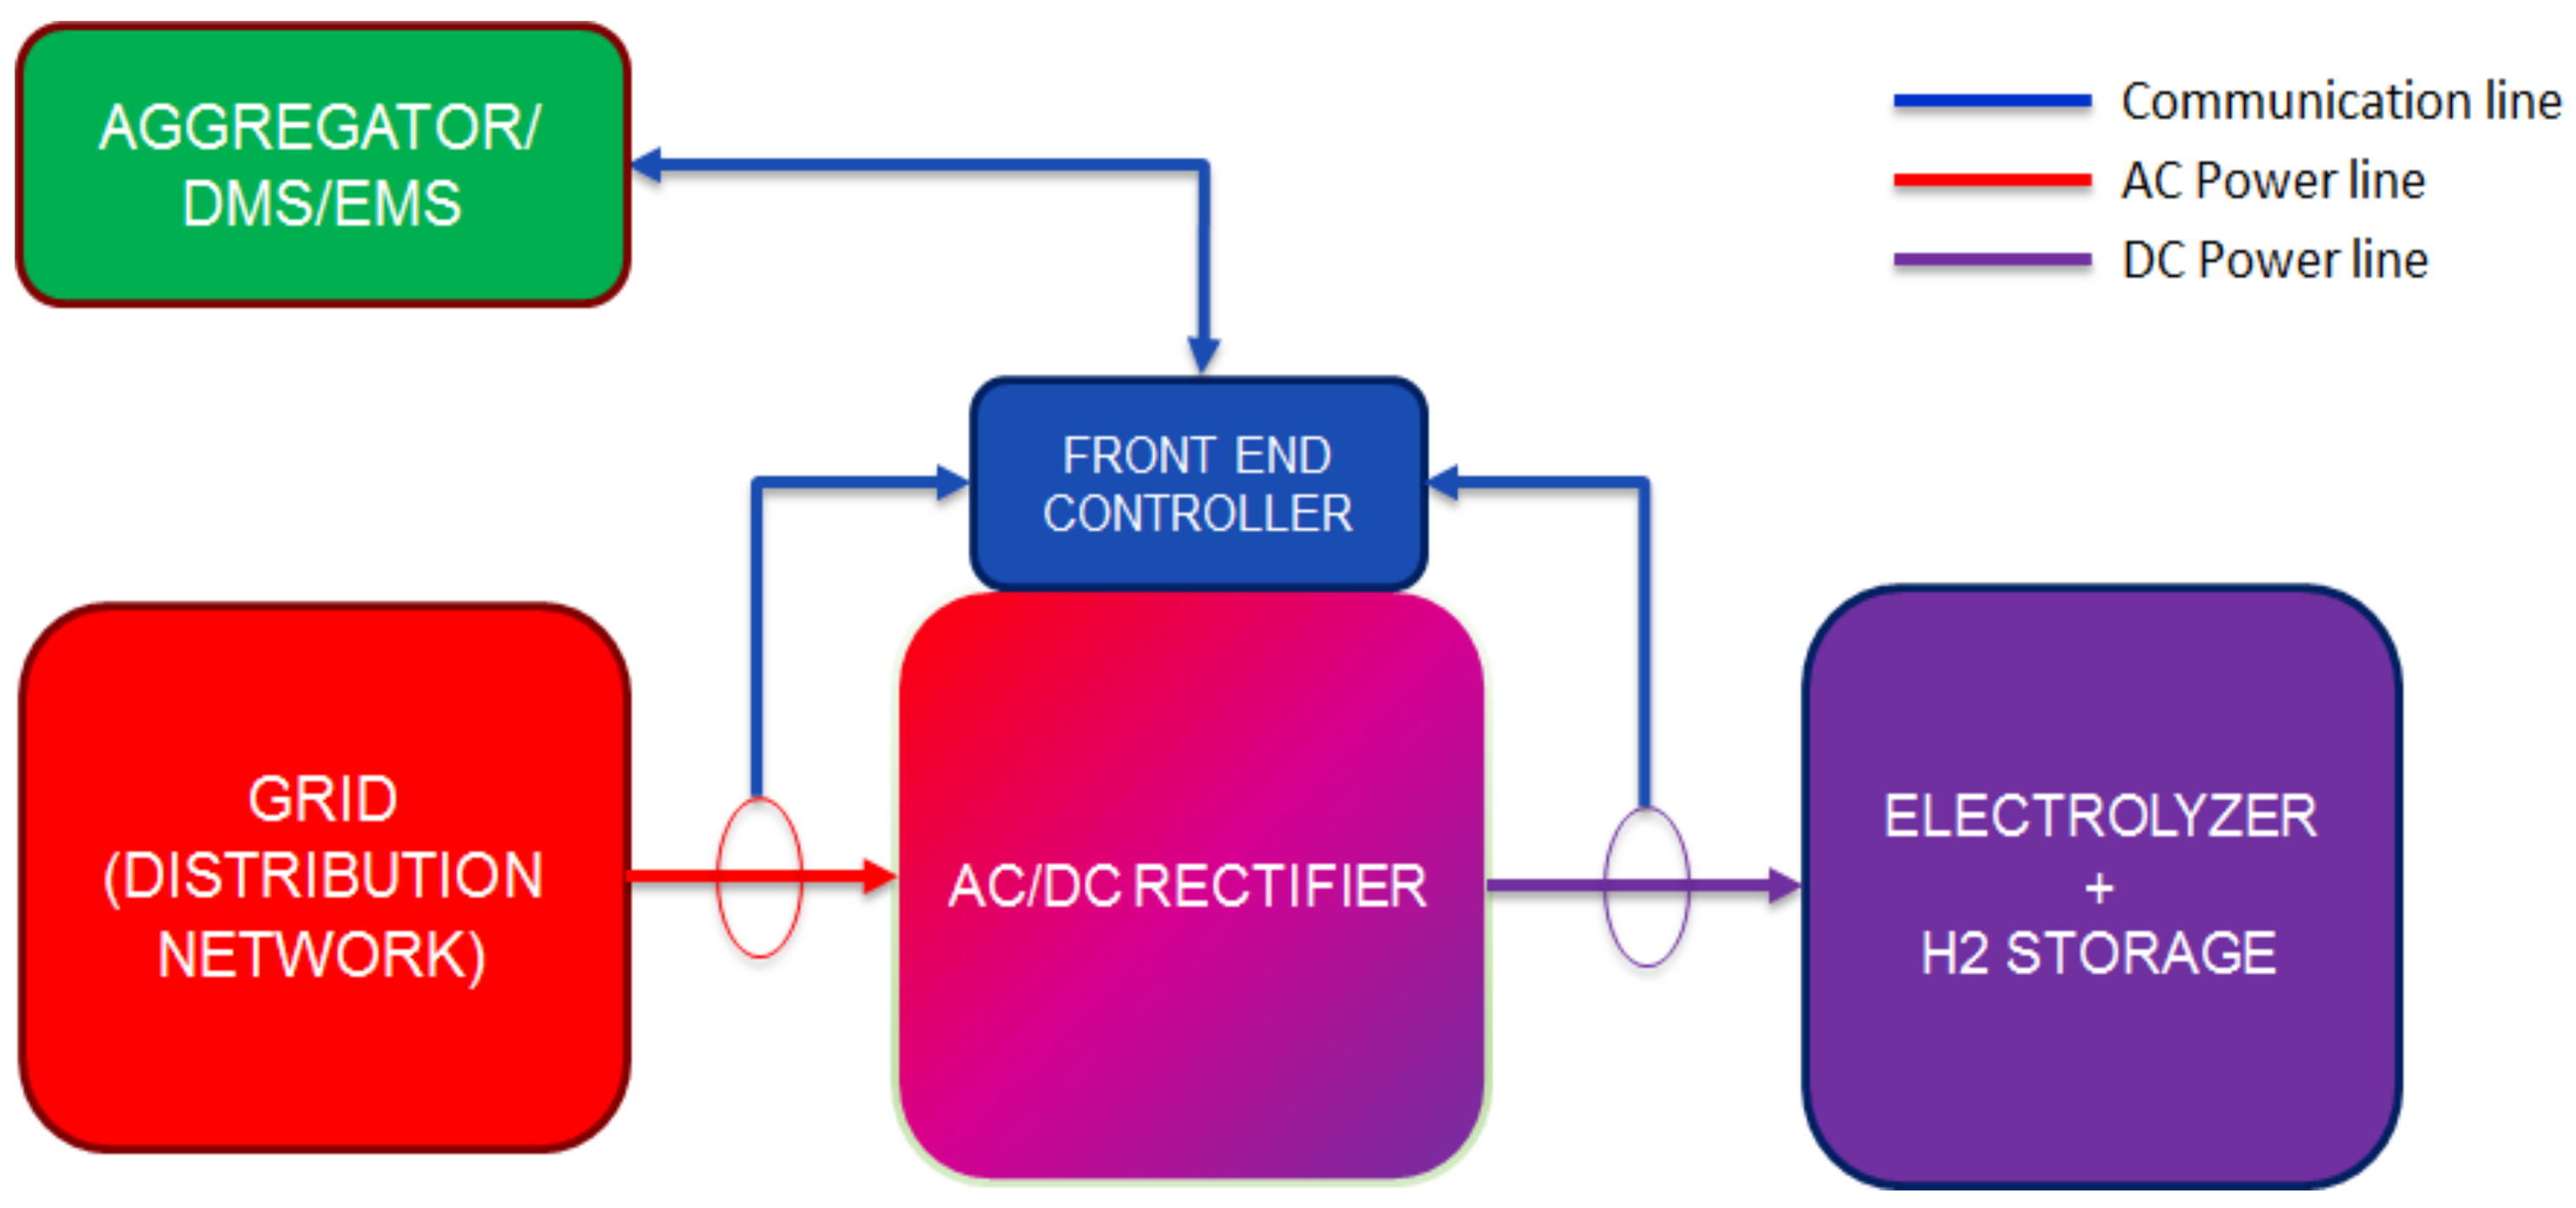
Figure 2.
Proposed front end controller (FEC) architecture comprising communication, optimization, and interpretation modules.
Figure 2.
Proposed front end controller (FEC) architecture comprising communication, optimization, and interpretation modules.

Figure 3.
Sample operation and outcome of the slow and fast loop of the front end controller (FEC).

Figure 4.
Flowchart depicting the operation of the front end controller (FEC) with an electrolyzer.

Figure 5.
Electrolyzer stack efficiency is shown to decrease with increasing current and decreasing temperature for the 250 kW stack.
Figure 5.
Electrolyzer stack efficiency is shown to decrease with increasing current and decreasing temperature for the 250 kW stack.

Figure 6.
The efficiency of the power supplies for the electrolyzer, given as the fraction of DC power per unit AC power for different power consumption levels.
Figure 6.
The efficiency of the power supplies for the electrolyzer, given as the fraction of DC power per unit AC power for different power consumption levels.

Figure 7.
Experimental setup used for demonstrating the value of front end controller (FEC) control of electrolyzer.
Figure 7.
Experimental setup used for demonstrating the value of front end controller (FEC) control of electrolyzer.
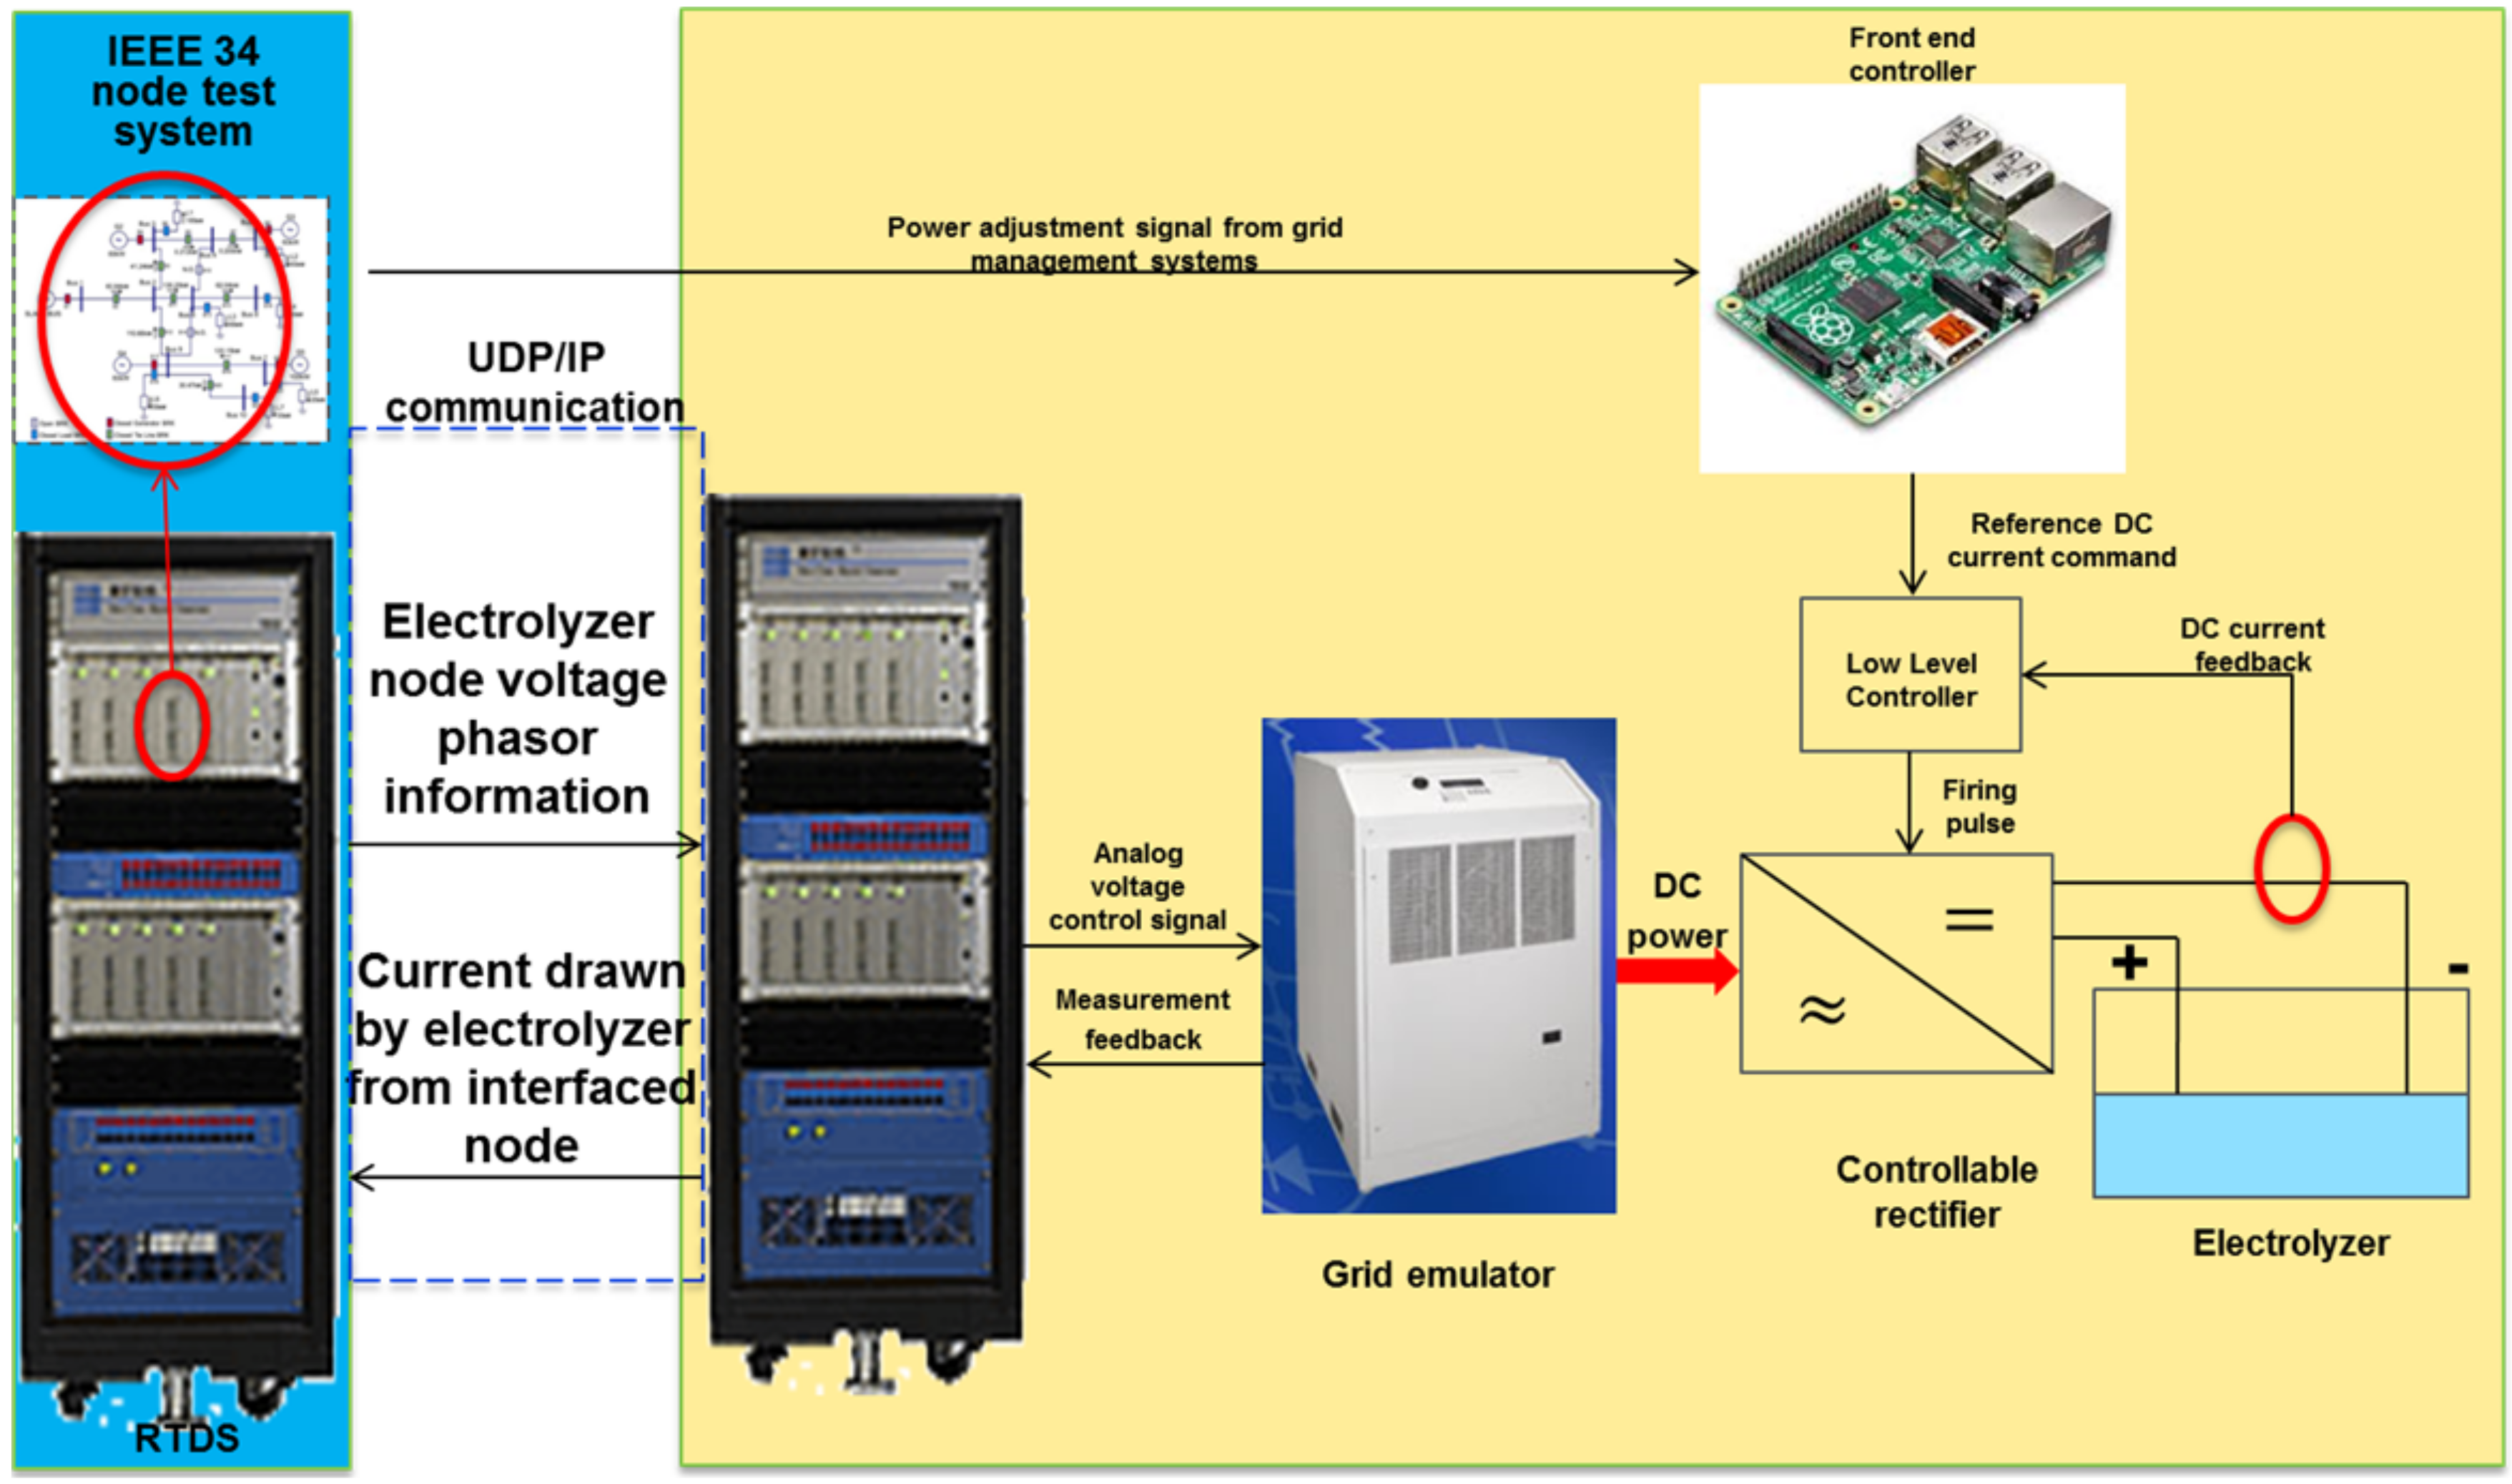
Figure 8.
Detailed signals associated with the control loops of front end controller (FEC).
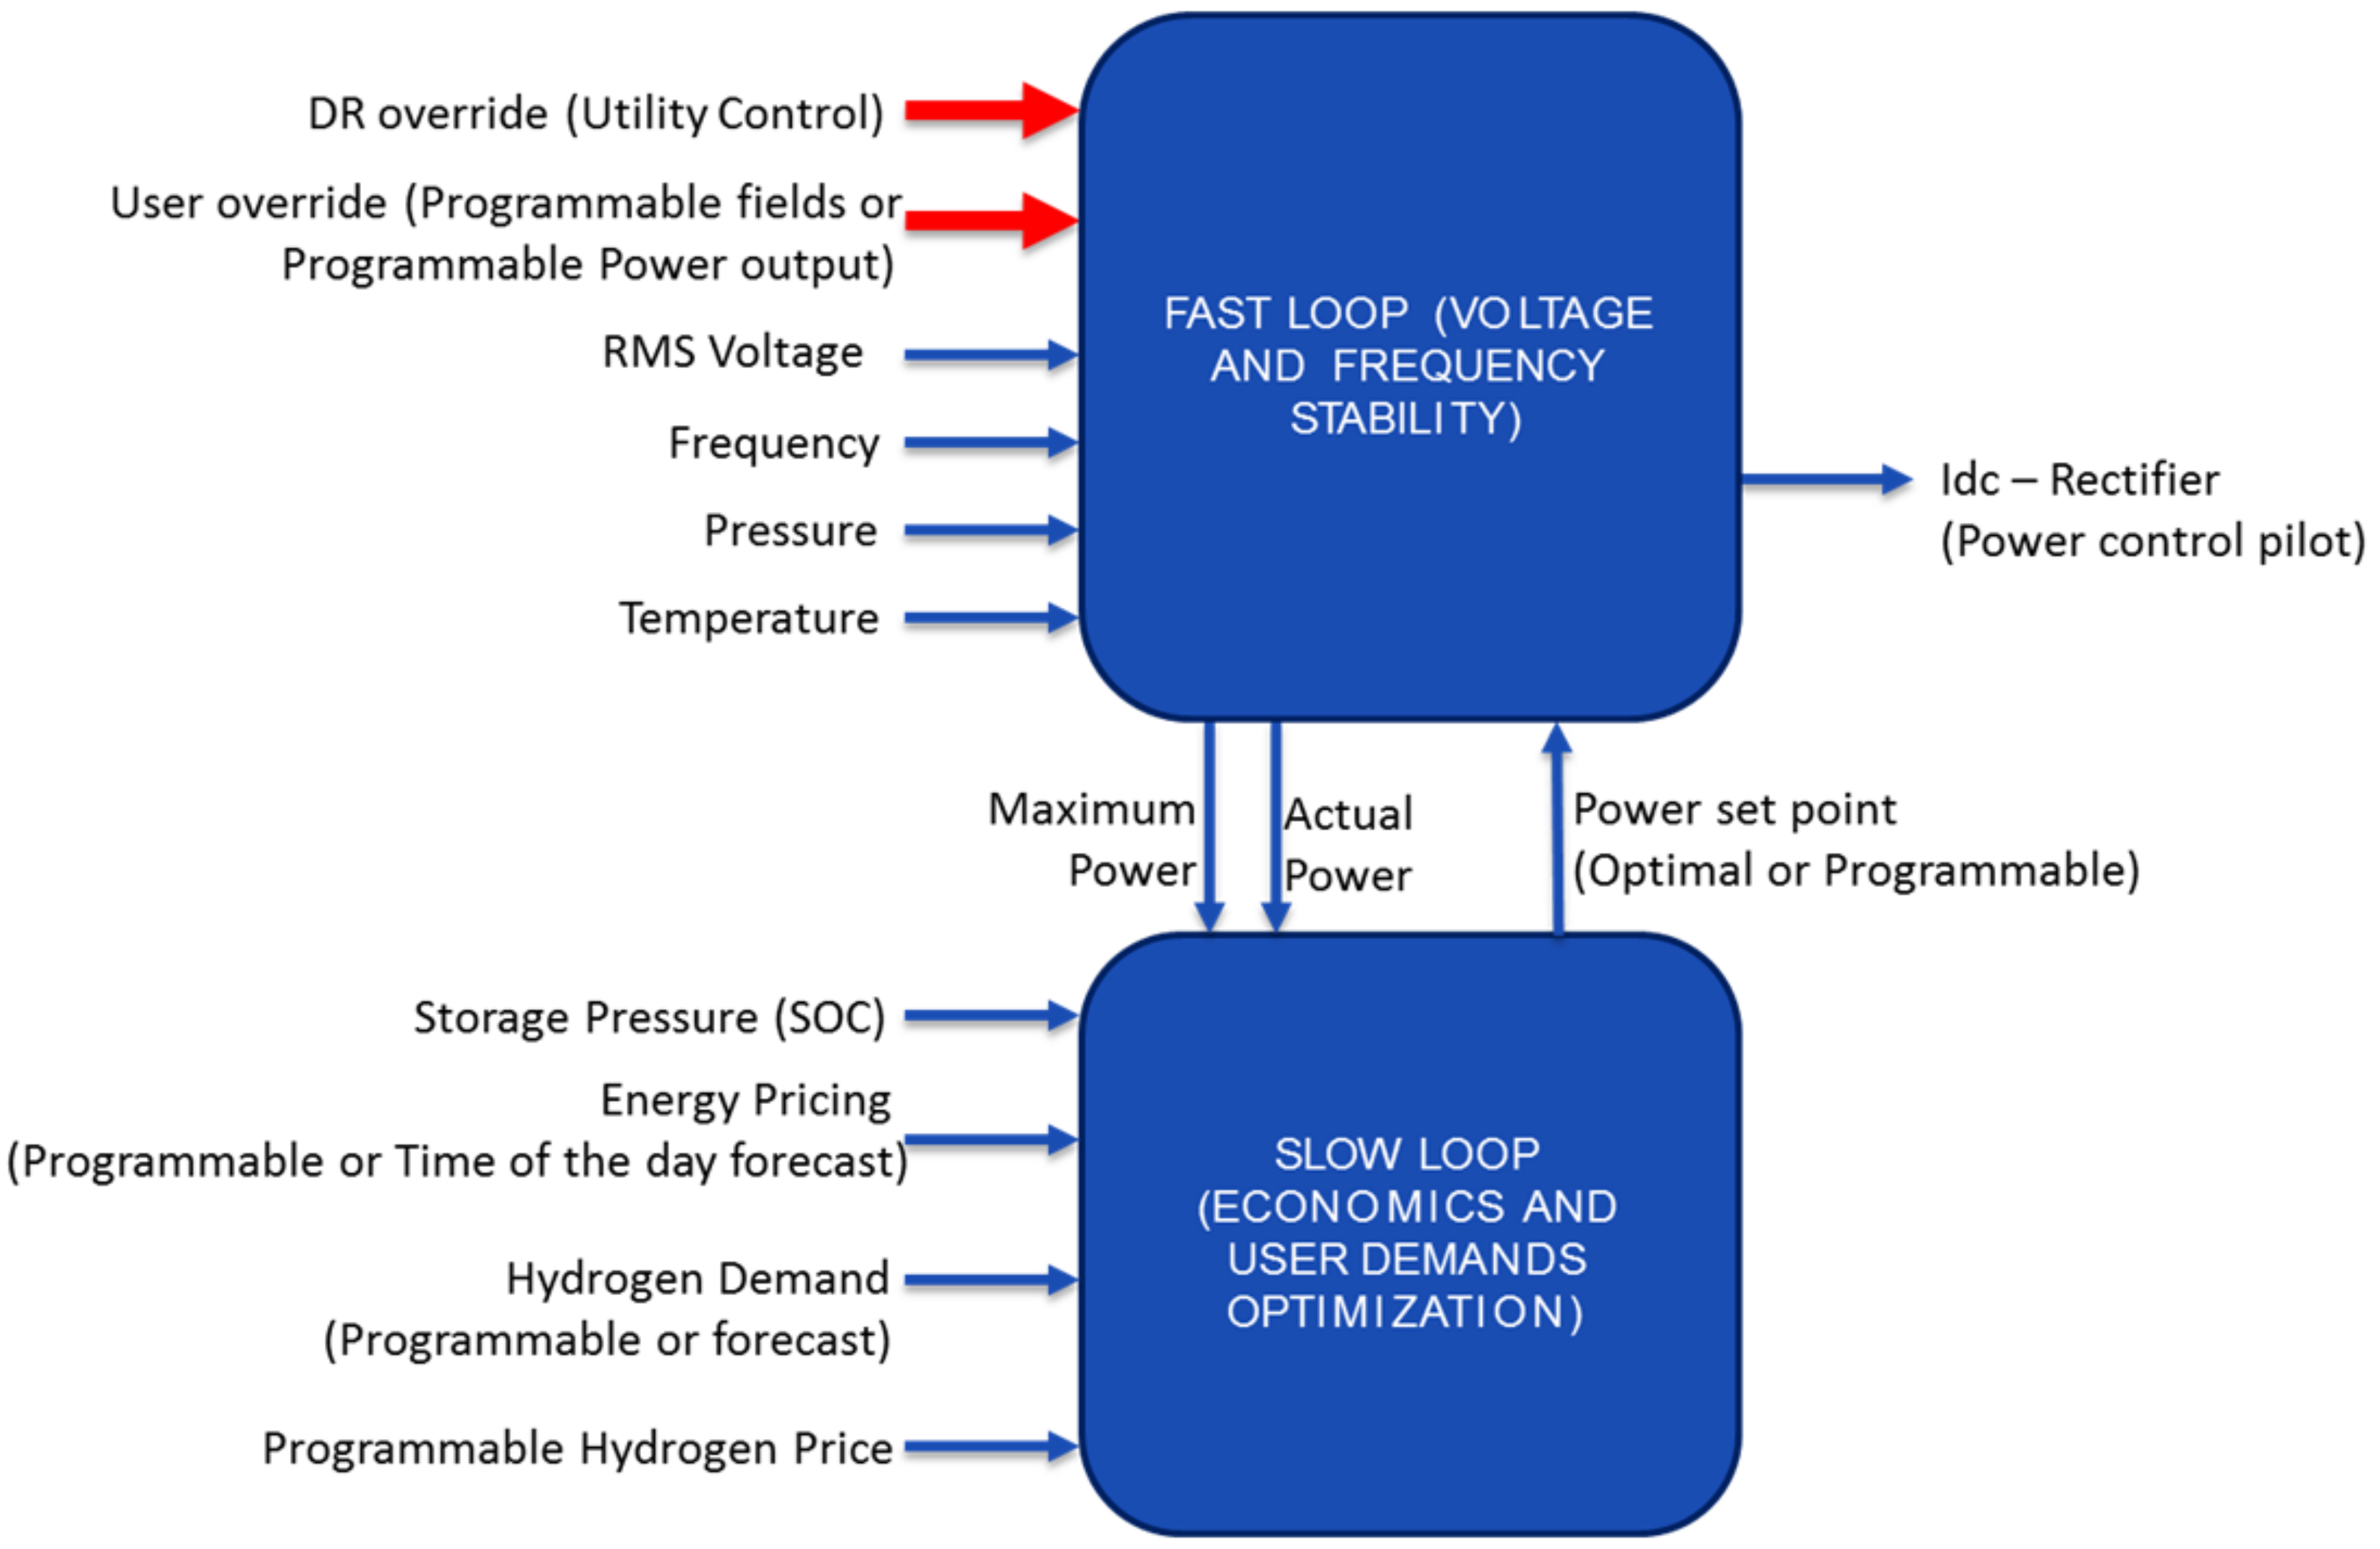
Figure 9.
One-line diagram of the standard IEEE 34 feeder system.
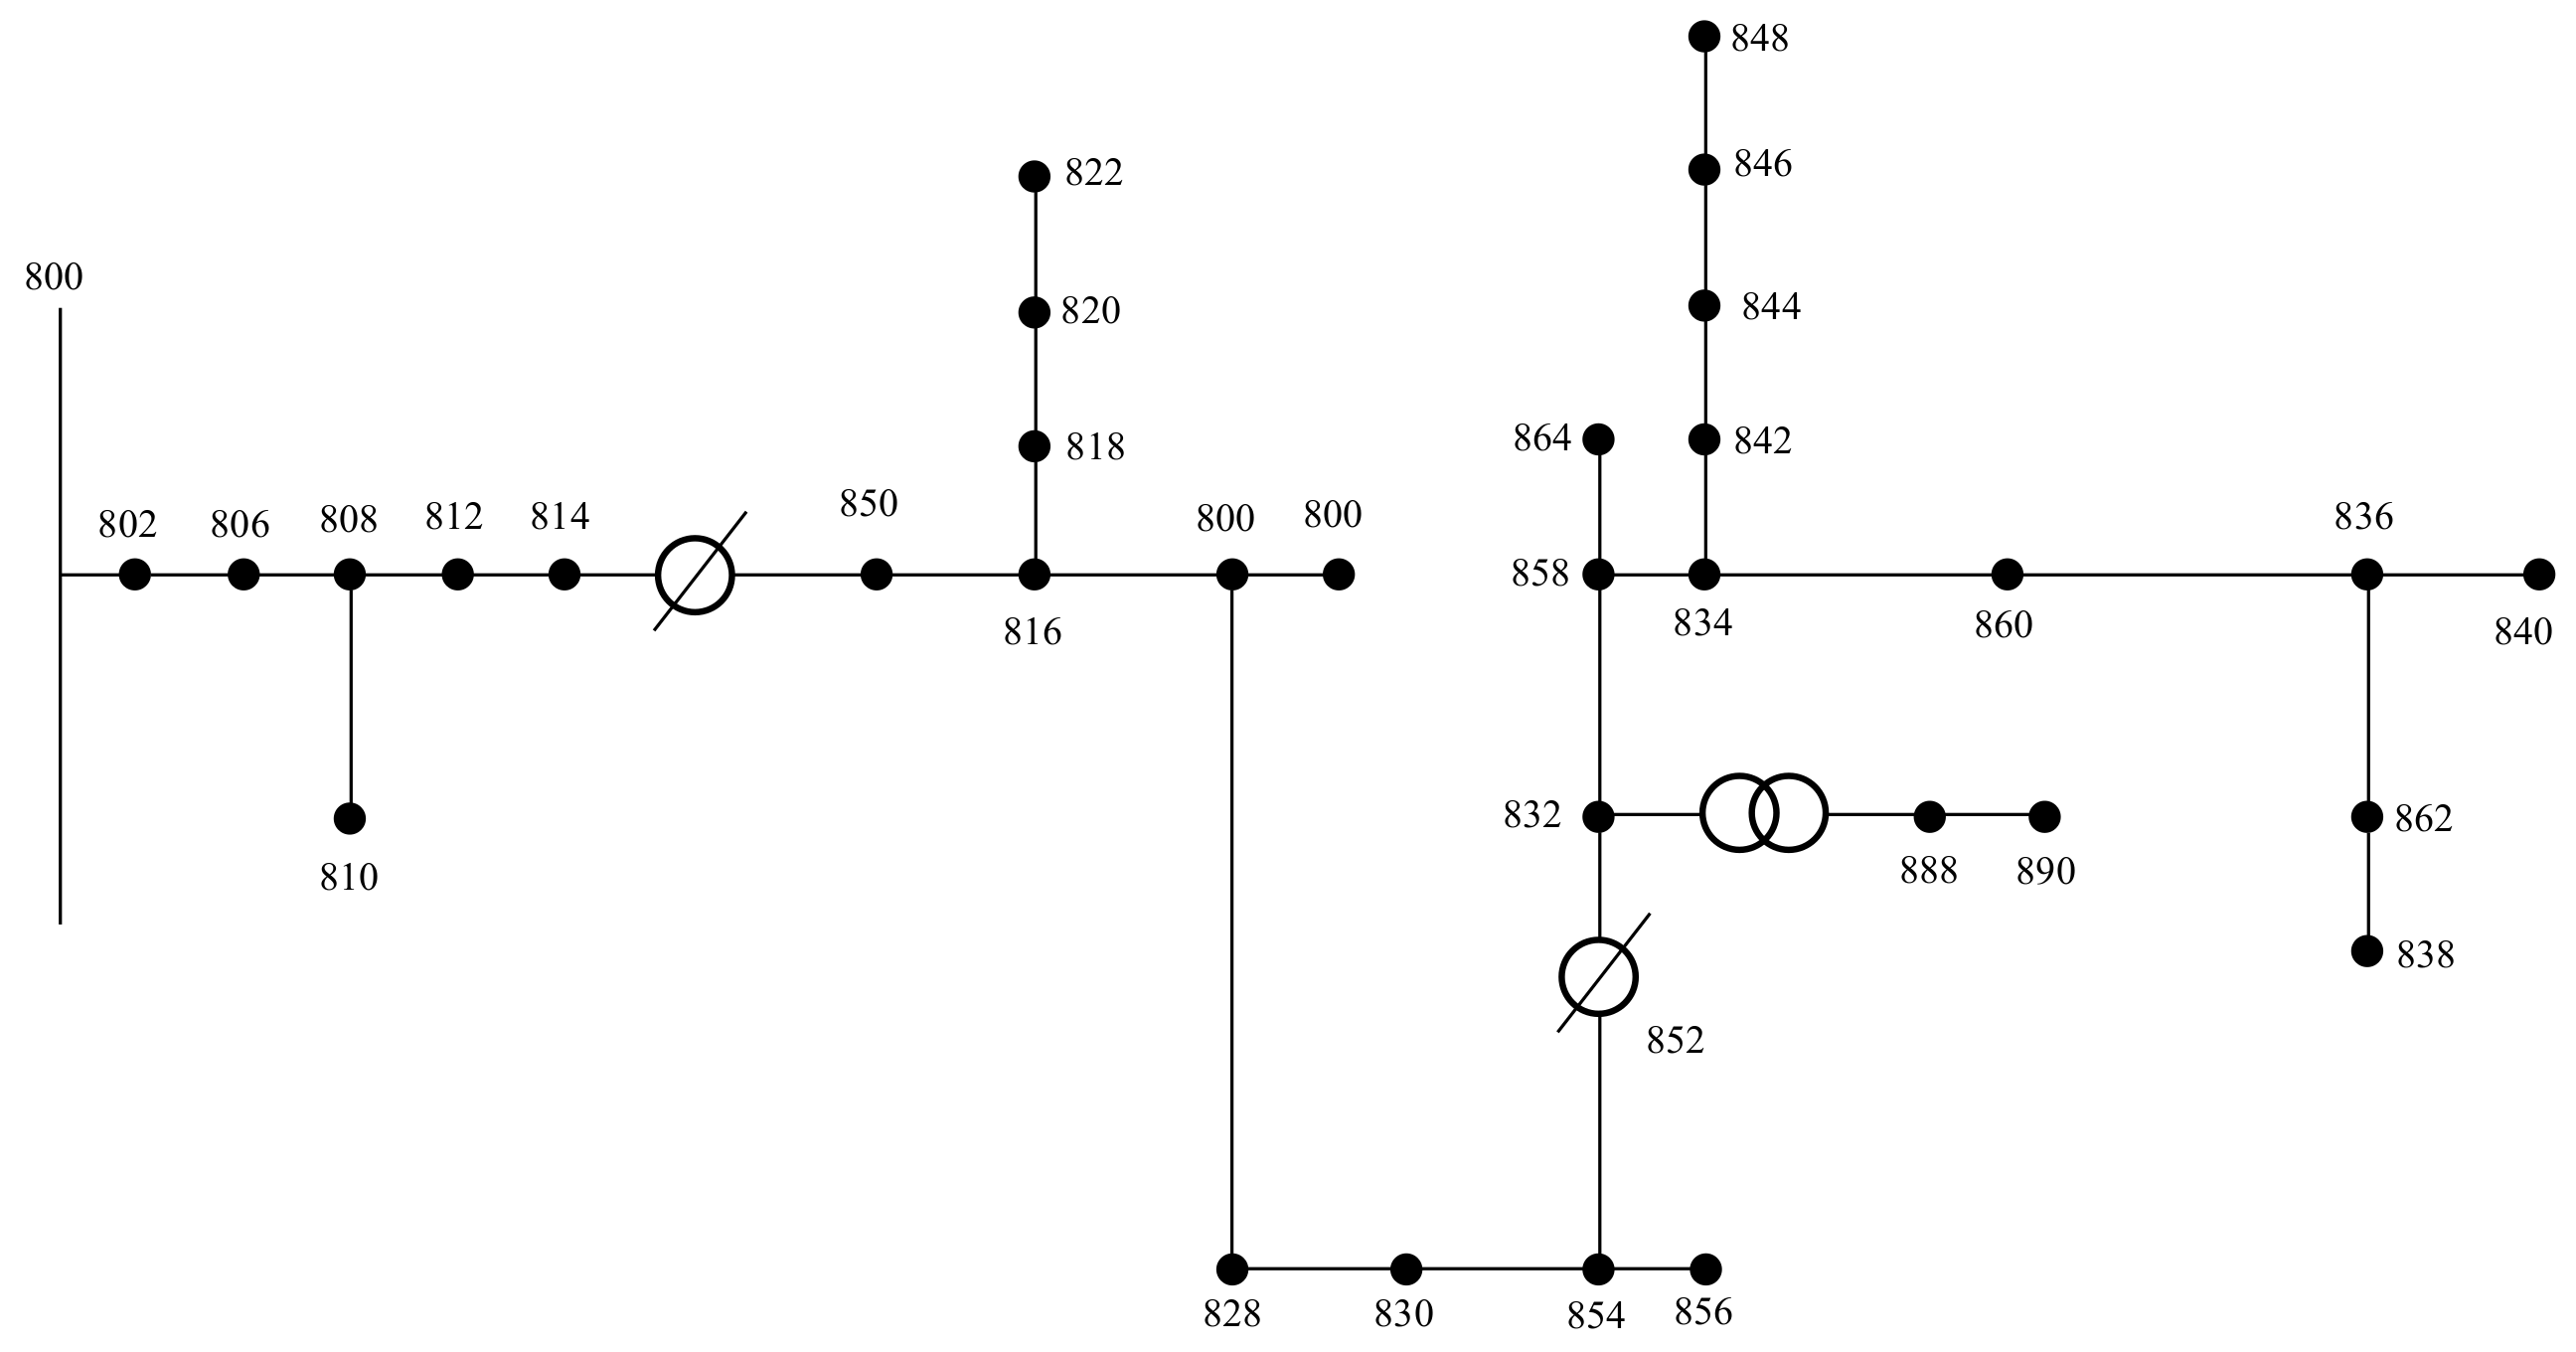
Figure 10.
Case study: frequency support from large-scale hydrogen refueling station.
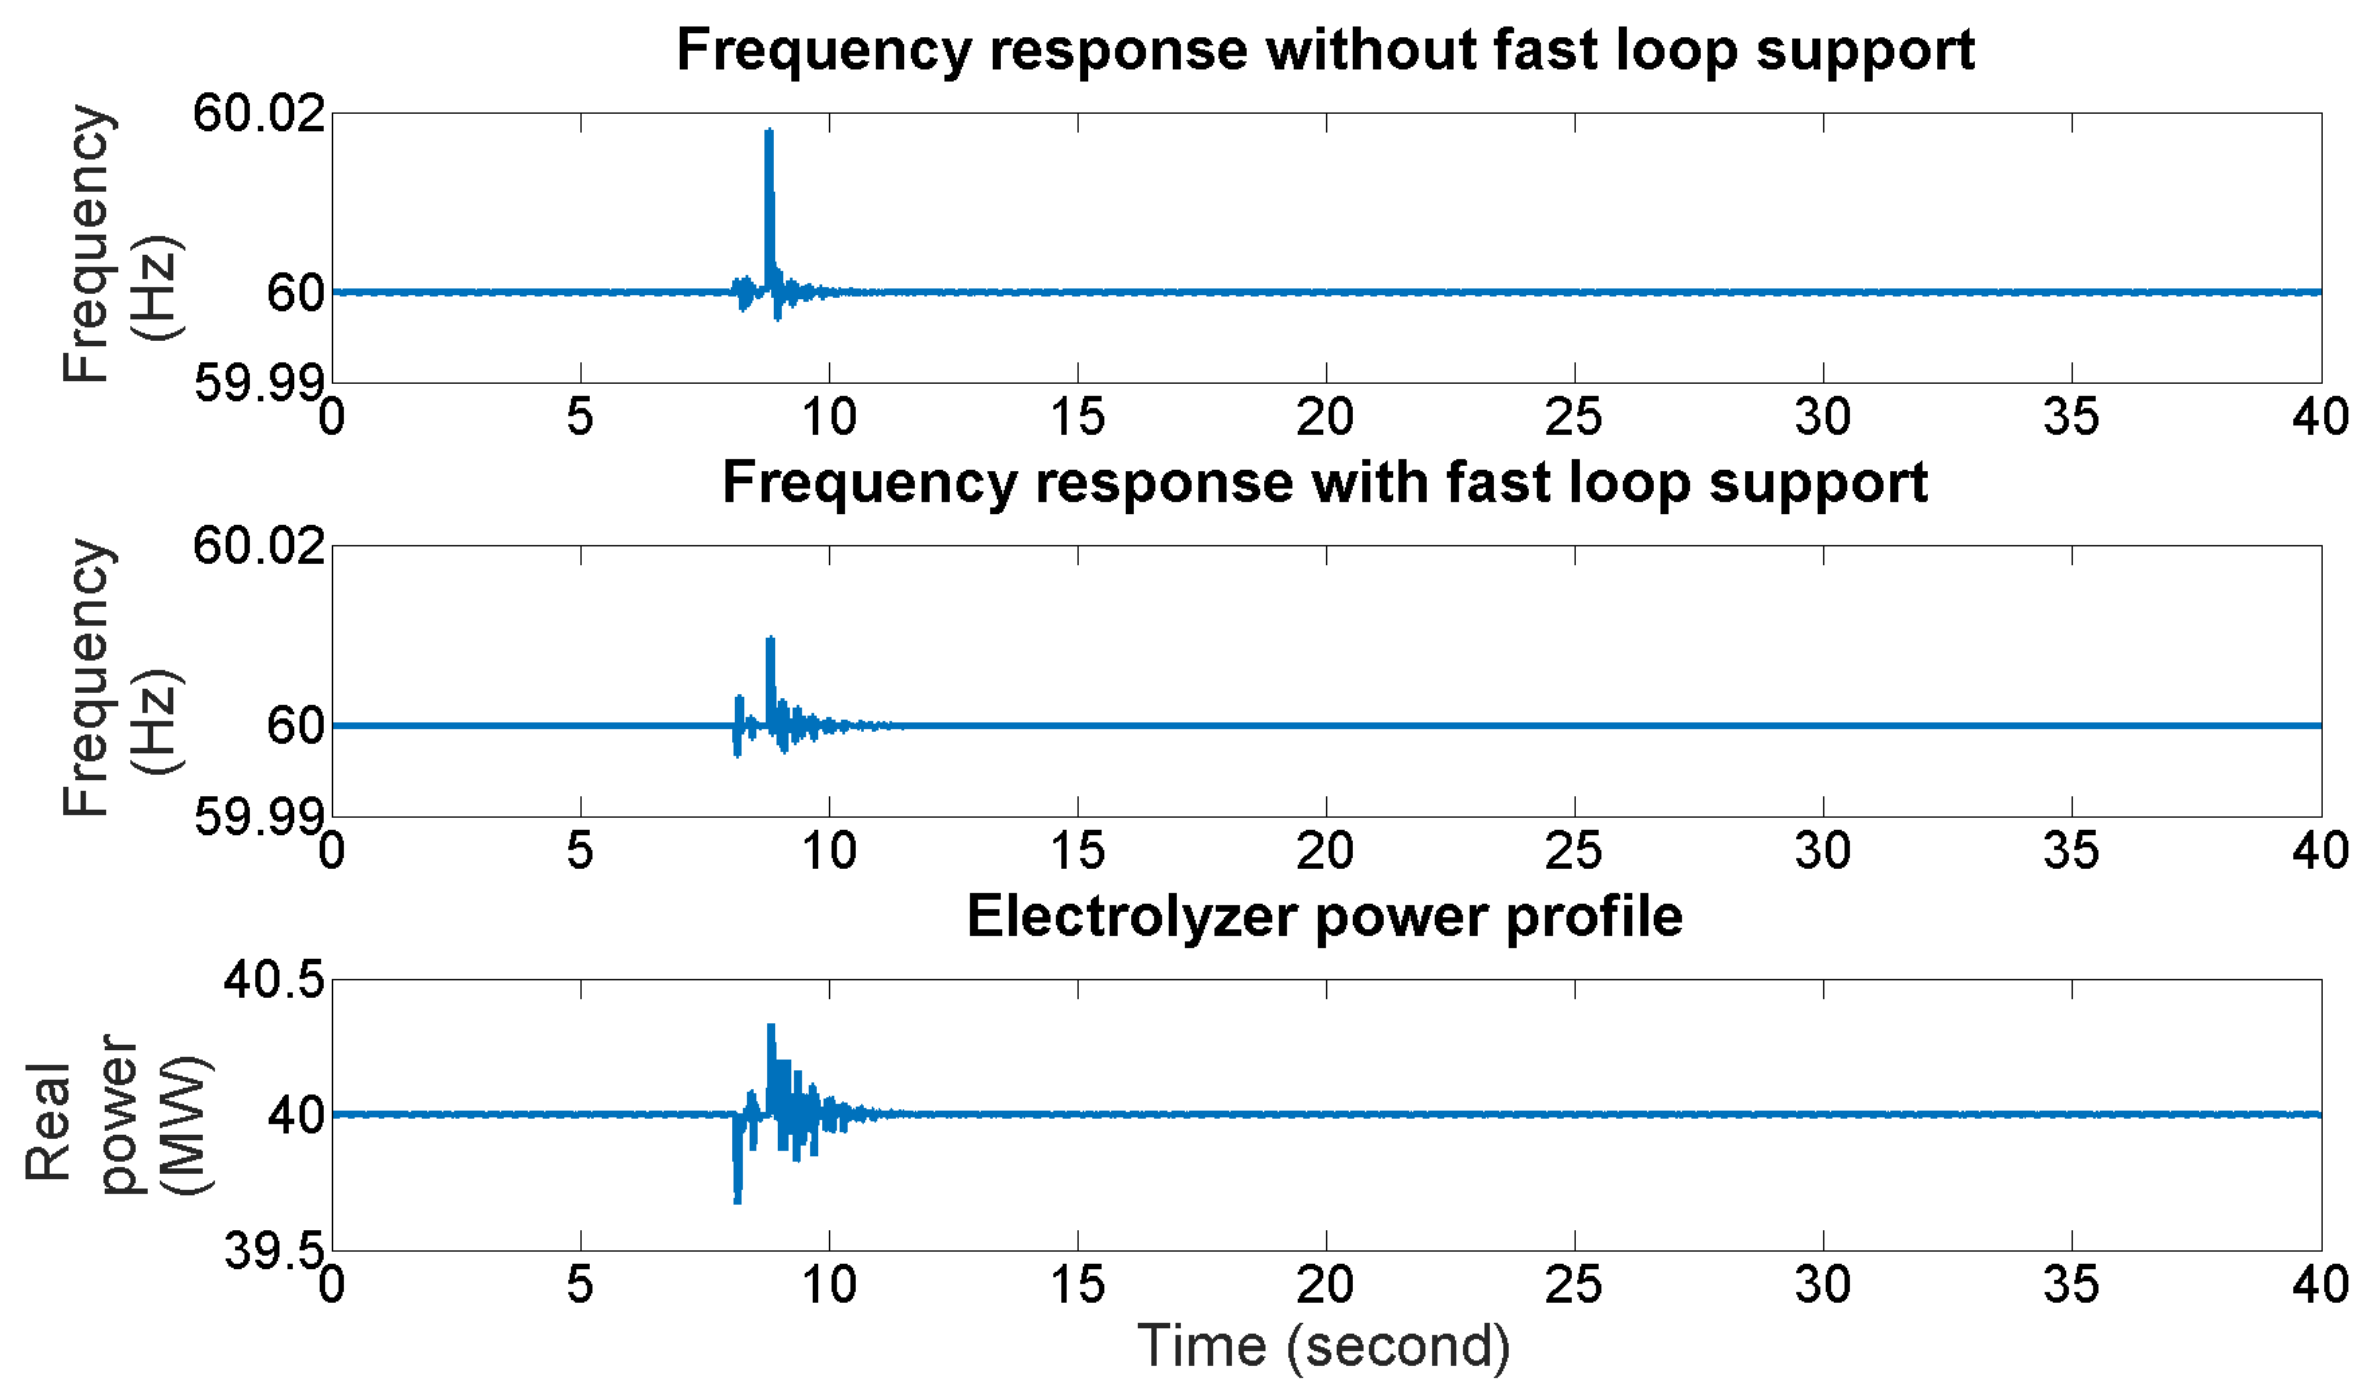
Figure 11.
Case study: frequency support from small-scale hydrogen refueling station.

Figure 12.
Case study: voltage support from large-scale hydrogen refueling station.
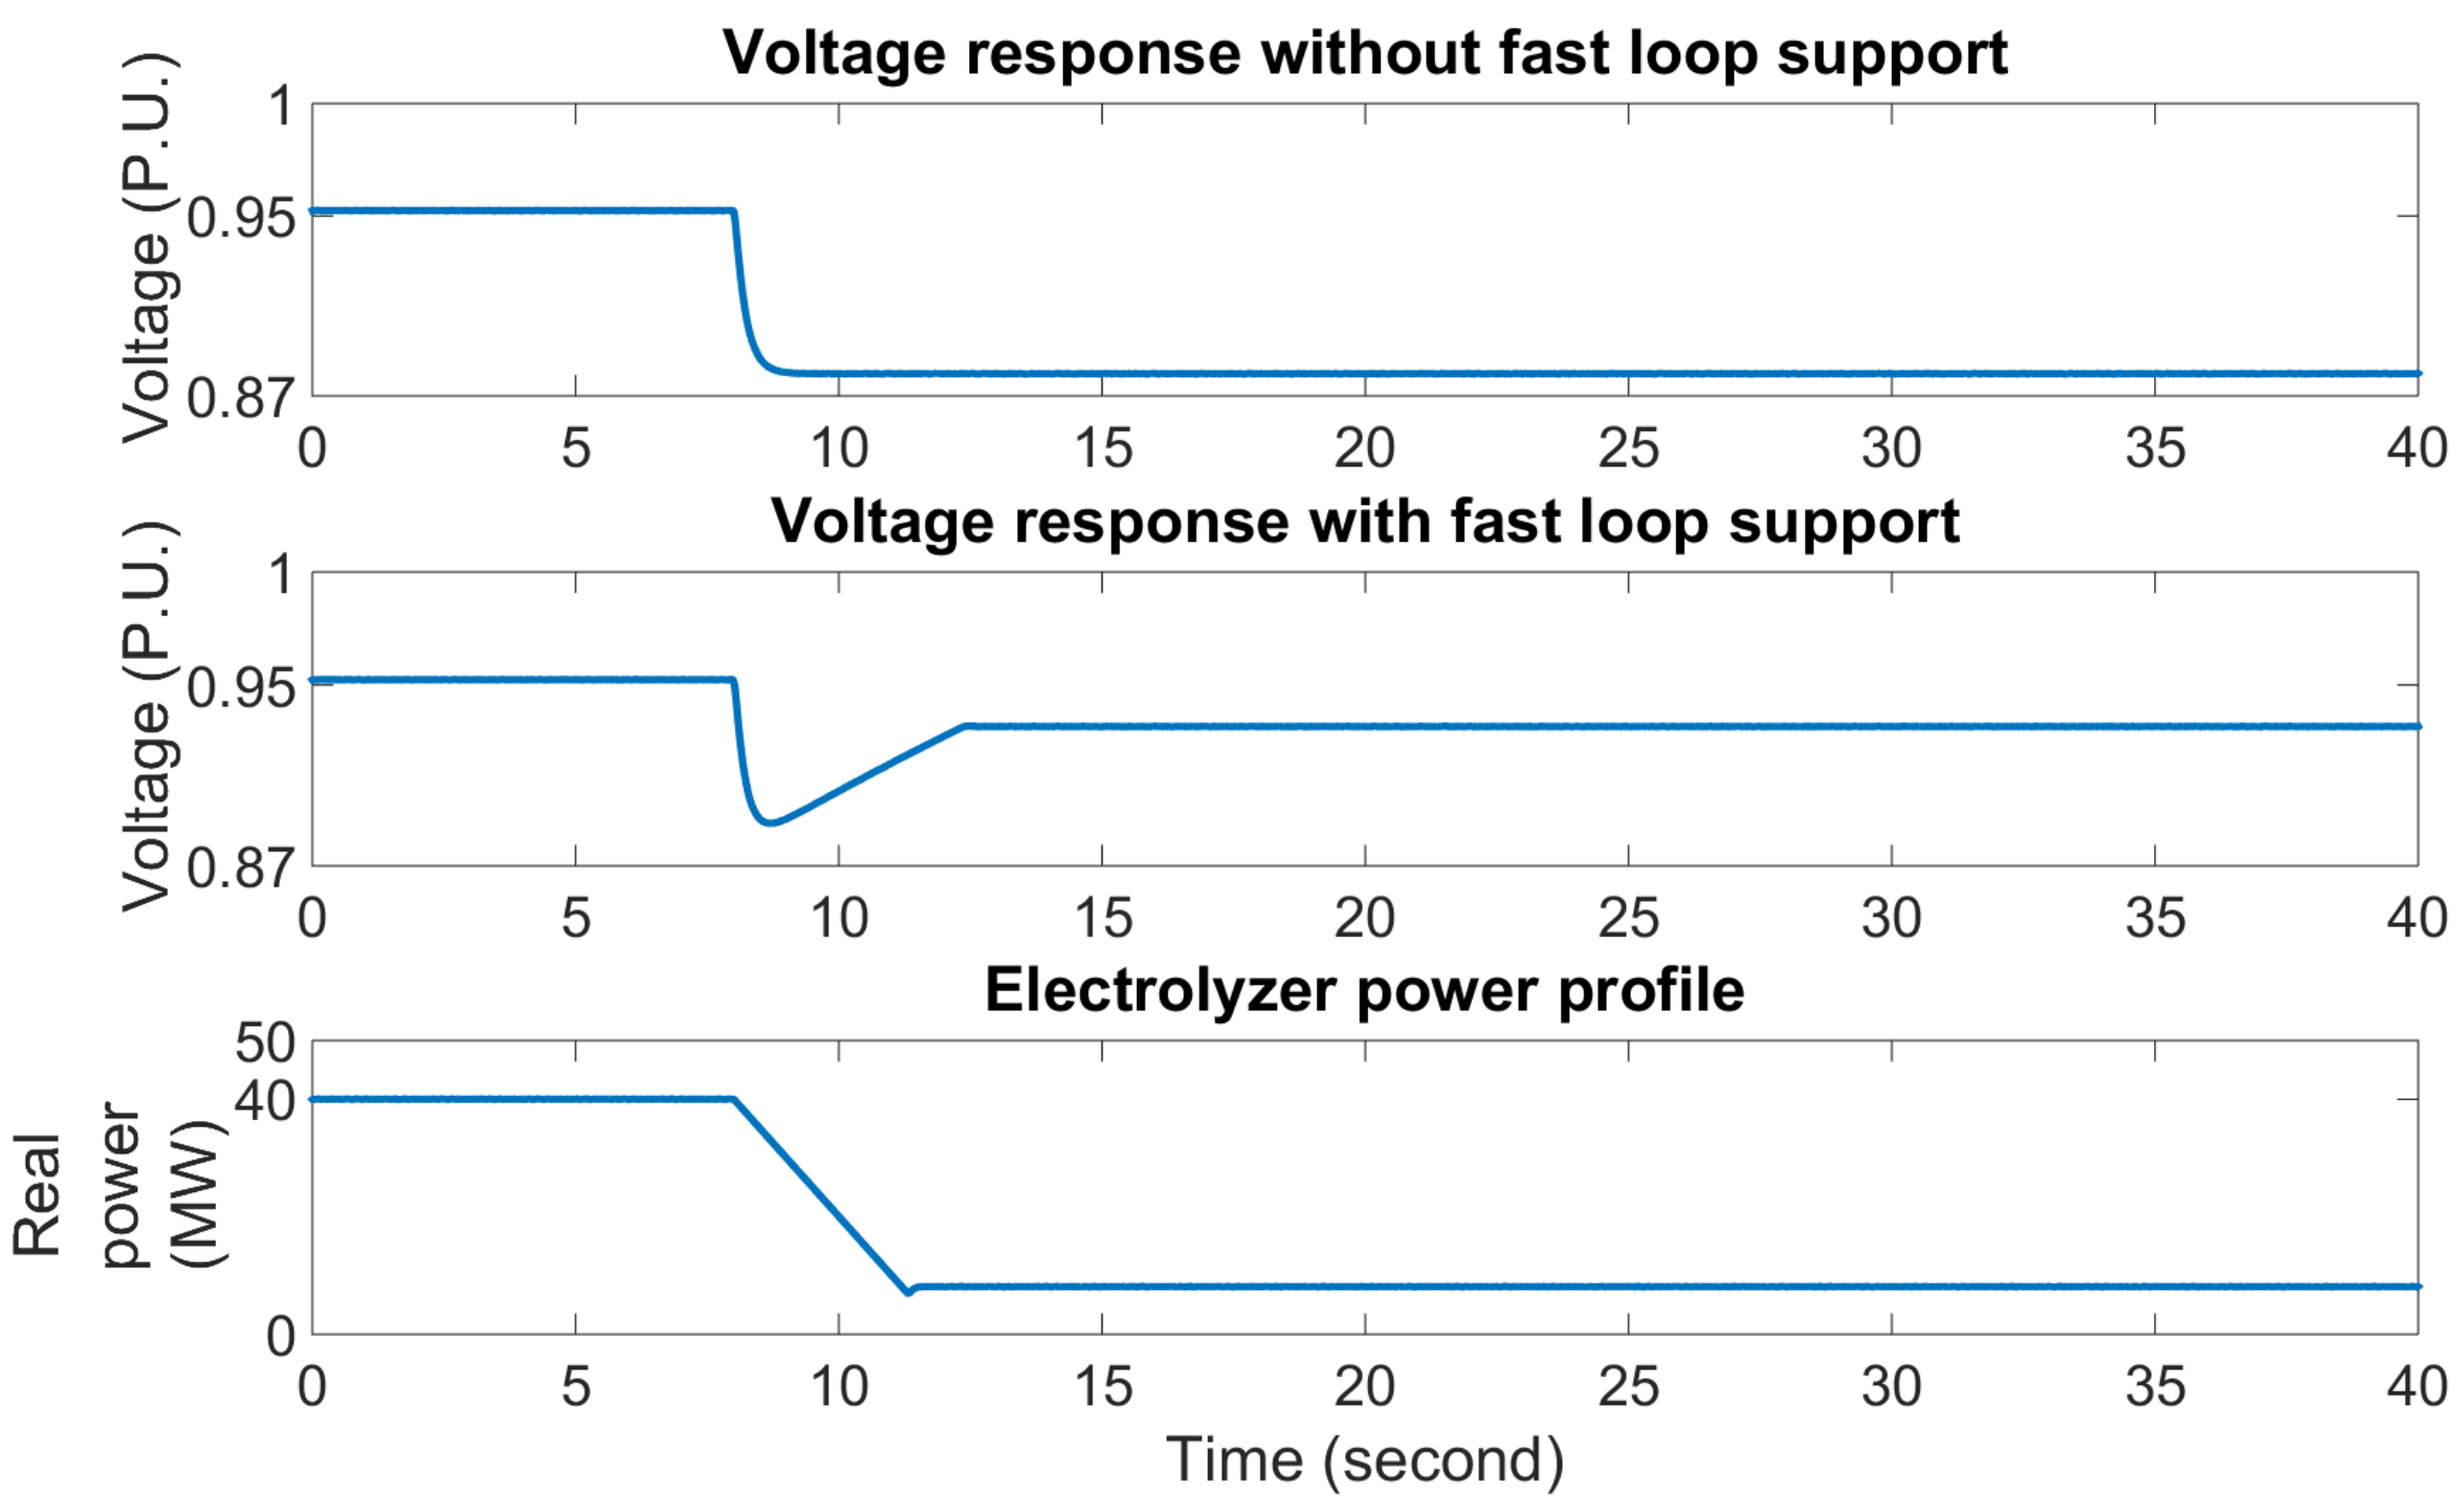
Figure 13.
Case study: voltage support from small-scale hydrogen refueling station.

Figure 14.
Case study: slow-loop optimization effect on electrolyzer operation.

Figure 15.
Electrolyzer following a practical utility demand response program (E-19).

Figure 16.
Electrolyzer following a practical utility demand response program (E-20).


Table 1.
Load characterizations of the 120 kW electrolyzer stack for different loading conditions.
| Performance Metric | Ramp | Load | Demand Response | Random |
|---|---|---|---|---|
| Response Time | <1 s | <1 s | <1 s | <1 s |
| Settling Time | <1 s | <1 s | <1 s | <1 s |
| Slew Rate | +1 kW/s −1 kW/s (Other rates were 0.5 and 2 kW/s) | Predetermined load values at variable times | 10, 20, 30, 40, 50 and 118 kW, and E-20 DR (PG&E) at 2, 5, and 10 min interval | Random set-points between 13 to 118 kW/s |
| Operational Limits | 13 to 118 kW | 13 to 118 kW | 13 to 118 kW | 13 to 118 kW |
| Startup and Shutdown Time | 30 and <1 s | 30 and <1 s | 30 and <1 s | 30 and <1 s |
© 2017 by the authors. Licensee MDPI, Basel, Switzerland. This article is an open access article distributed under the terms and conditions of the Creative Commons Attribution (CC BY) license (http://creativecommons.org/licenses/by/4.0/).
Share and Cite
MDPI and ACS Style
Mohanpurkar, M.; Luo, Y.; Terlip, D.; Dias, F.; Harrison, K.; Eichman, J.; Hovsapian, R.; Kurtz, J. Electrolyzers Enhancing Flexibility in Electric Grids. Energies 2017, 10, 1836. https://doi.org/10.3390/en10111836
AMA Style
Mohanpurkar M, Luo Y, Terlip D, Dias F, Harrison K, Eichman J, Hovsapian R, Kurtz J. Electrolyzers Enhancing Flexibility in Electric Grids. Energies. 2017; 10(11):1836. https://doi.org/10.3390/en10111836
Chicago/Turabian StyleMohanpurkar, Manish, Yusheng Luo, Danny Terlip, Fernando Dias, Kevin Harrison, Joshua Eichman, Rob Hovsapian, and Jennifer Kurtz. 2017. "Electrolyzers Enhancing Flexibility in Electric Grids" Energies 10, no. 11: 1836. https://doi.org/10.3390/en10111836
Note that from the first issue of 2016, this journal uses article numbers instead of page numbers. See further details here.