Experimental Study of Hydrogen Addition Effects on a Swirl-Stabilized Methane-Air Flame


Department of Energy Sciences, Lund University, Ole Römers väg 1, SE-22100 Lund, Sweden
*
Author to whom correspondence should be addressed.
Energies 2017, 10(11), 1769; https://doi.org/10.3390/en10111769
Submission received: 2 October 2017
/
Revised: 27 October 2017
/
Accepted: 1 November 2017
/
Published: 3 November 2017
(This article belongs to the Section I: Energy Fundamentals and Conversion)
Abstract
:The effects of H2 addition on a premixed methane-air flame was studied experimentally with a swirl-stabilized gas turbine model combustor. Experiments with 0%, 25%, and 50% H2 molar fraction in the fuel mixture were conducted under atmospheric pressure. The primary objectives are to study the impacts of H2 addition on flame lean blowout (LBO) limits, flame shapes and anchored locations, flow field characteristics, precessing vortex core (PVC) instability, as well as the CO emission performance. The flame LBO limits were identified by gradually reducing the equivalence ratio until the condition where the flame physically disappeared. The time-averaged CH chemiluminescence was used to reveal the characteristics of flame stabilization, e.g., flame structure and stabilized locations. In addition, the inverse Abel transform was applied to the time-averaged CH results so that the distribution of CH signal on the symmetric plane of the flame was obtained. The particle image velocimetry (PIV) was used to detect the characteristics of the flow field with a frequency of 2 kHz. The snapshot method of POD (proper orthogonal decomposition) and fast Fourier transform (FFT) were adopted to capture the most prominent coherent structures in the turbulent flow field. CO emission was monitored with an exhaust probe that was installed close to the combustor exit. The experimental results indicated that the H2 addition extended the flame LBO limits and the operation range of low CO emission. The influence of H2 addition on the flame shape, location, and flow field was observed. With the assistance of POD and FFT, the combustion suppression impacts on PVC was found.
1. Introduction
Modern gas turbines are preferred to operate at the lean premixed condition in order to control exhaust emissions, which can be harmful to the environment and human health [1,2]. An important issue is to avoid combustion instability and combustion lean blowout (LBO) since the flames are very sensitive to perturbations in the flow field and some other local properties changes. Previous studies indicated that the ultra-lean flames suffered a series of undesirable behaviors, such as flame quenching, low combustion efficiency, thermo-acoustic combustion instabilities, and soot particles [3]. In order to overcome these negative effects, many investigations were attempted and the use of hydrogen and hydrogen blended fuels was identified as a considerable promise for a stable operation of gas turbine combustor under lean premixed conditions [4,5,6].
The H2 addition influence on the turbulent flame burning velocity of different fuels was investigated in many studies [7,8,9,10,11,12]. All of the results indicated that the H2 addition in the fuel stream increased the global chemical reaction rate. In addition, the enhanced reactivity was reported to increase the intensity of interactions between flame-vortex in turbulent flows [13]. The performance of exhaust emissions was an issue of interest in many past studies. One study measured CO emission at different axial locations along the combustor. The results indicated that the higher H2 molar fraction in the fuel blends could benefit a lower CO concentration at a fixed power [14]. Another study showed that adding H2 molar fraction in the fuel blends with constant fuel volume flow, the CO emission first decreased and then increased [15]. This suggested that the CO emission was dependent on not only the H2 molar fraction in the fuel blends but also the operating conditions. However, the combined effects on CO emission were not well investigated by previous studies. NOx emission with H2 addition was also examined by a few studies [16,17]. It should be noted that the H2 addition leads to two contrary effects on NOx formation. In principle, H2 addition may result in a reduction of the prompt NOx due to the decrease in hydrocarbon radicals. However, H2 addition may increase the flame temperature, which promotes the thermal NOx formation. As a result, the net effect of H2 addition on NOx formation is determined by the combined effects. Studies focused on the flame structures and combustion oscillations showed that the use of H2 significantly altered the flame characteristics due to the different properties of transport and chemical reactivity [18,19]. Some investigations with a swirl-stabilized configuration indicated that the thermoacoustic instabilities were very sensitive to the H2 molar fraction in the fuel blends [20,21].
In a swirl-stabilized dump combustor, vortices that appear in the inner shear layer (ISL) that is formed between the center recirculation zone (CRZ) and the annular jet flow can be a source of flame instability which features an unsteady coherent vortex structure. This helical vortex structure is often referred as the precessing vortex core (PVC), which could significantly influence the combustor performance. Based on the previous work, H2 effects on the PVC instability was not sufficiently investigated. In the current study, the H2 addition effects on the instabilities driven by PVC along with the other important issues, e.g., flame LBO limits, characteristics of flame reaction zones, flow field, and CO emission were investigated. The experimental investigations were carried out with a swirl-stabilized gas turbine model combustor at the atmospheric pressure. The LBO equivalence ratios were measured with three H2 molar fractions in the fuel blends (0%, 25%, and 50%) with combustor inlet temperature of 384 K and 484 K. The impacts of H2 addition on flame shapes and stabilized positions were revealed by CH chemiluminescence imaging. A high-speed particle image velocimetry (PIV) system was used to identify the flow field with a frequency of 2 kHz. Both the time-averaged and instantaneous velocity field were investigated and compared. The PIV results were also studied with the snapshot method of POD (proper orthogonal decomposition) to capture the PVC in the vicinity of ISL. Fast Fourier transform (FFT) was adopted to identify the frequency of the most prominent coherent structures that are represented by the POD modes. CO emission was monitored with a water-cooled emission probe that was installed close to the combustor exit. The adiabatic flame temperature was calculated to understand the H2 addition effects on CO emission with the use of CHEMKIN software (17.0, ANSYS, San Diego, CA, USA) [22] and GRI-mech 3.0 mechanism [23].
2. Experiments and Method
2.1. Flow Path and Equipment
Figure 1 shows a schematic illustration of the flow paths design and experimental setup. The combustor was designed with two air supplies and two fuel sources. Air supply to the combustor was provided by the high-pressure laboratory air. Swirl flow was generated by blending the air flow came from axial and tangential directions. The air streams from both of the directions can be adjusted and monitored by using the differential pressure mass flow controllers (MCR250, Alicat Scientific, Tucson, AZ, USA). Fuel gas (methane and hydrogen) were provided by pressurized gas cylinders and were controlled with the use of differential pressure mass flow controllers (MCR50, Alicat Scientific, Tucson, AZ, USA). The fuel flow was injected into the tangential air stream and then the tangential flow (fuel and air) was blended with axial air flow in the swirler. In order to guarantee a good fuel-air mixing, a 60 mm mixing section was designed prior to the combustor inlet. Equivalence ratios (Ф) could be adjusted by altering the fuel flow rate, while keeping the air flow constant. For the convenience to achieve an appropriate inlet temperature, the air flow could be preheated by two feedback controlled heaters (Sureheat Jet, Sylvania, Exeter, NH, USA) with a maximum power of 8 kW. A 1.5 mm diameter thermocouple (K-type) with a measurement uncertainty of 2.2 K was used to measure the combustor inlet temperature. Combustion exhaust was discharged from the laboratory by using a ventilation system.
Figure 2 briefly shows the design and dimensions of the combustor and swirler. The combustor cylinder comprised a metal section, which was supported by four pneumatic actuators and an optical section (a quartz liner), which was designed for combustion measurement techniques, such as flame chemiluminescence and laser diagnostics. The swirler was installed prior to the combustor and designed with four horizontal channels (3 mm wide and 10 mm high) and one vertical channel. Different flow patterns can be achieved by adjusting the flow ratio between the axial and tangential direction. In order to characterize the swirl flow, a very important non-dimensional number need to be defined:
In above equation, S represents the swirl number and R represents swirler radius. and , which express the axial flux of the radial momentum and axial momentum that could be obtained by solving the following equations:
In above equations, (gas density), (velocity in axial direction), and V (velocity in tangential direction) need to be known in order to calculate the swirl number. For the currently used experimental rig, the velocity distribution of and V was measured by using LDA (Laser Doppler Anemometry) in the previous investigation [24].
2.2. Operating Condition, LBO, and CO Emission Measurements
Table 1 summarized the operating parameters of the present experimental investigation. LBO limits were measured by gradually decreasing the mass flow rate of CH4 and H2 (while keeping airflow constant) until the flame was physically away from the combustor. It should be noted that the fuel decreasing was conducted using the minimum step that is allowed by the Alicat mass flow controller. The CO emission in combustion products was monitored by a NDIR (nondispersive infrared photometers) CO/CO2 exhaust analyzer (Binos 100, Rosemount, Hasselroth, Germany) with a 5 ppm uncertainty. Water vapor contained in the sample gas was eliminated by a cooler. The emission analysis system was zeroed and calibrated before every experiment.
2.3. Investigation of the Flame and Flow Field
The previous literature indicated that the characteristics of flame reaction zone could be identified by using flame chemiluminescence. In the present study, flame visualization was achieved by using time-averaged CH chemiluminescence. The CH signal was recorded by a CCD camera (D70s, Nikon, Tokyo, Japan) with a 0.77 s exposure time and 3008 × 2000 pixels resolution. An AF Nikkor lens (50 mm/F1.8D, Nikon, Tokyo, Japan) and a band-pass CH filter (430/10, LaVision, Göttingen, Germany) was used for the imaging of time-averaged CH signal. The camera aperture was adjusted to f/1.8 in order to get an appropriate CH intensity during the entire operating range.
The features of velocity field were visualized with the use of a 2D high-speed PIV system. The laser wavelength was 527 nm and the recording rate was 2 kHz. Details of the operating parameters for PIV measurement are summarized in Table 2. The two-dimensional (2D) PIV measurement was performed to study the flow field with combustion and without combustion. The measurement plane was illuminated by a thin laser sheet (thickness was approximate 1 mm), which was generated by the optical lens. The TiO2 particles with a primary diameter of 20 nm were used as seeding particles. Multi-pass cross-correlation algorithm was used to evaluate the velocity field from the directly obtained images. The interrogation windows of 64 × 64 pixels and subsequent 32 × 32 pixels were used in the processing of velocity field with a 50% window overlap. The averaged flow fields were achieved by calculating the time average of 2000 instantaneous velocity snapshots.
2.4. Mathematical Description for the Proper Orthogonal Decomposition (POD)
The POD is one of the most effective methods for the multivariate data analysis and was first introduced in the context of fluid mechanics by Lumley [25]. Essentially, POD is a method that decomposes a given data collection into a linear combination of the optimized orthogonal basis and the corresponding coefficients. In current work, the POD was implemented as a post-processing technique on the 2D-PIV results with the main purpose of identifying the dominant flow structures [26,27]. PIV measurement results, in general, yield N observations of , x represents the spatial coordinates, and denotes time series t1, t2, tN. are considered as time stationary so that
where represents the mean field and denotes the fluctuations. Assume that can be decomposed as
where is the time-dependent amplitude coefficients and is a orthogonal basis. The objective of POD is to get an optimal orthogonal basis which maximize the expression
subject to the constraint
Here 〈〉 denotes the time-averaged operation and stands for the inner product. With the use of Lagrange multipliers, a function can be constructed
The maximum value of 〈〉 can be reached when the derivative of equals to zero. This convert the extreme value problem to an equivalent eigenvalue problem
where the linear operator R is defined by
The orthogonal basis can be obtained by solving the Equation (6). For a more detailed explanation, the readers may refer to the book by Holmes et al. [28].
2.5. Computational Implementation: Method of Snapshots
In practical applications, the POD can be implemented either by the classical method [25] or by the snapshot method [29]. The decomposition results obtained from the classical method are equivalent to those that are obtained from the snapshot method. However, the snapshot method has a low computation cost in the situation where the spatial data number is more than the snapshots number. Therefore, the method of snapshot suggested by Sirovich in 1987 was adopted in current work. In practice, the data is only available as discrete spatial grid points. When considering the POD analysis of N flame images, each image can be arranged in a vector u after the mean value is subtracted. Then, the vector u can be combined into a matrix :
The auto-correlation matrix C is formed as:
The eigenvalues λ and eigenvectors A can be obtained by solving the eigenvalue problem of matrix C:
The POD modes can then be calculated by
The time constants are found by projecting the original data onto the POD modes
where are time coefficients and
It is important to recognize that a POD mode does not necessarily reveal an actual coherent structure that is observed in a turbulent flow field. Based on a mathematical view, each POD mode denotes a component of the flow field that can be reconstructed by summing over all weighted modes.
3. Results and Discussion
3.1. LBO Limits and The Averaged Features of Flames and Flow Field
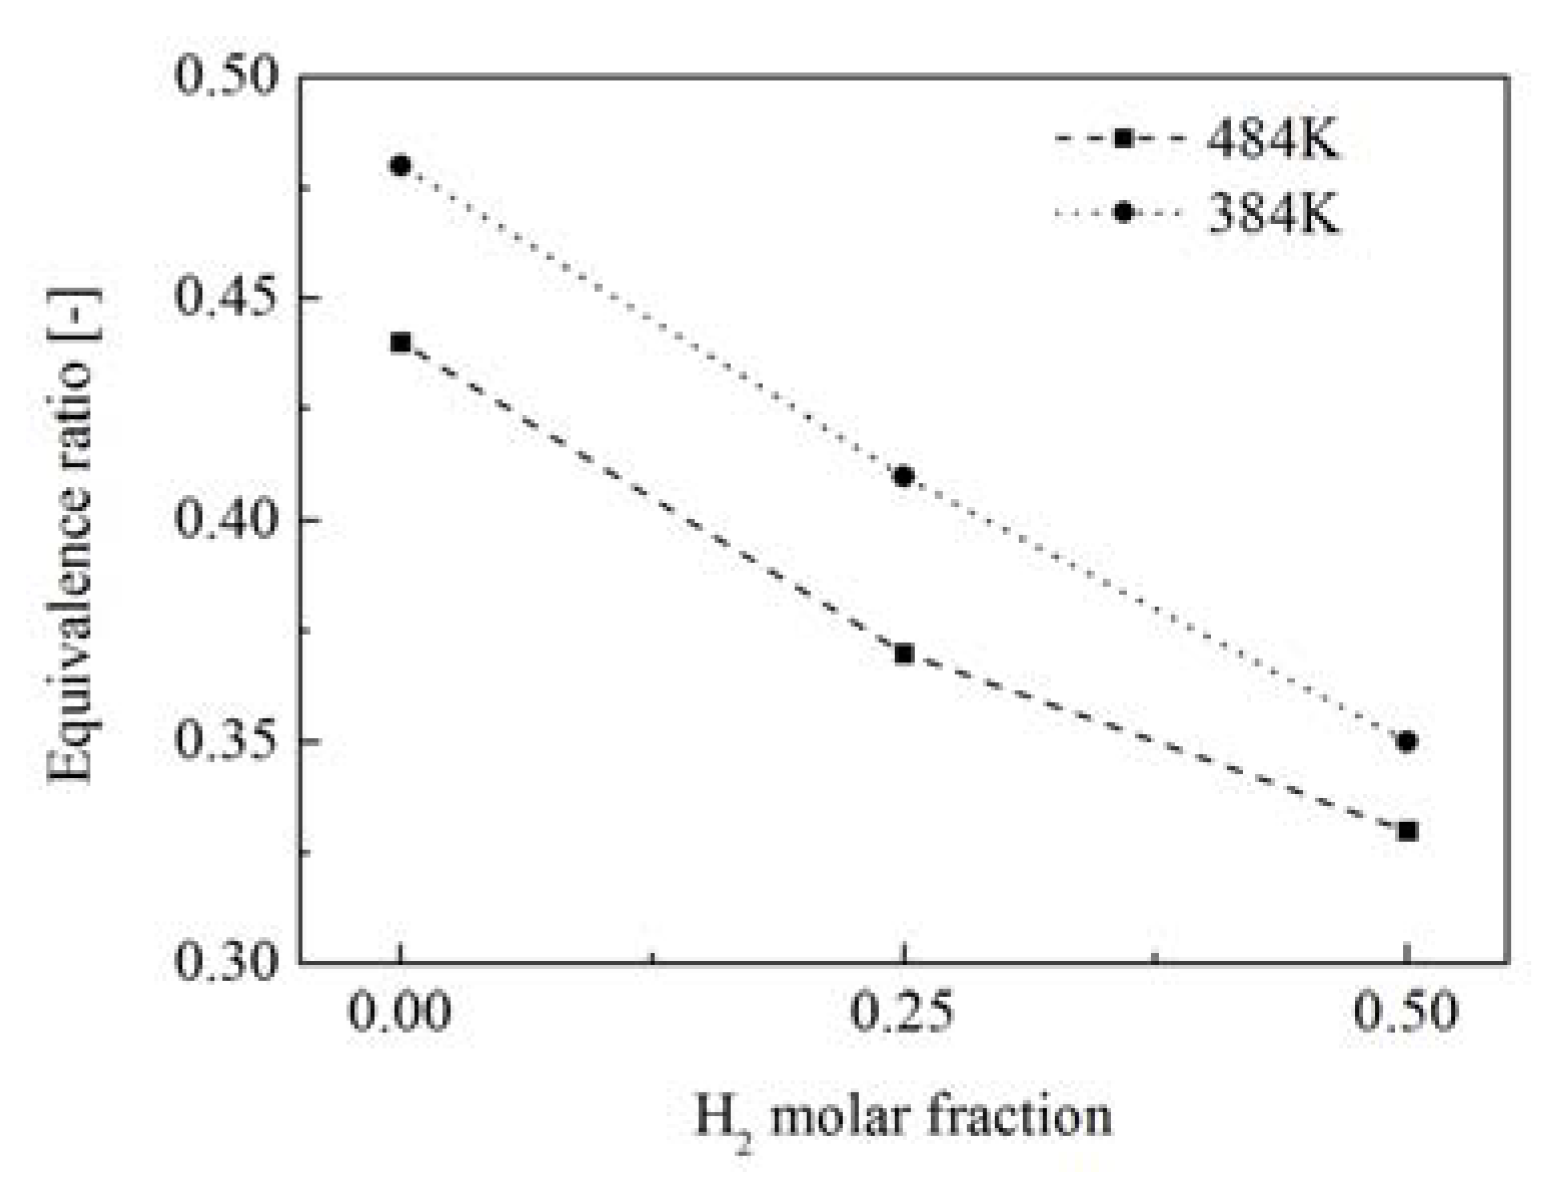
H2 addition effect on LBO limit of the swirl-stabilized methane-air flame was examined. Swirl flow is commonly utilized in gas turbine combustors for the flame stabilization, which is very important for the design of the gas turbine combustion system. Extensive investigations showed that the swirl flow could improve the combustion stability and extend the combustion LBO limits [30,31,32]. In the current work, the LBO limit is defined as the equivalence ratio where the flame physically disappeared in the combustor, as shown in Figure 3. It is known that with the increase of H2 molar fraction and combustor inlet temperature, the turbulent flame velocity was increased and the ignition delay time was decreased. As a result, the LBO limits were found to be extended to lower values. The results indicated that improving the combustor inlet temperature and H2 molar fraction in the fuel mixture could lead to significant advantages for stable combustor operation.
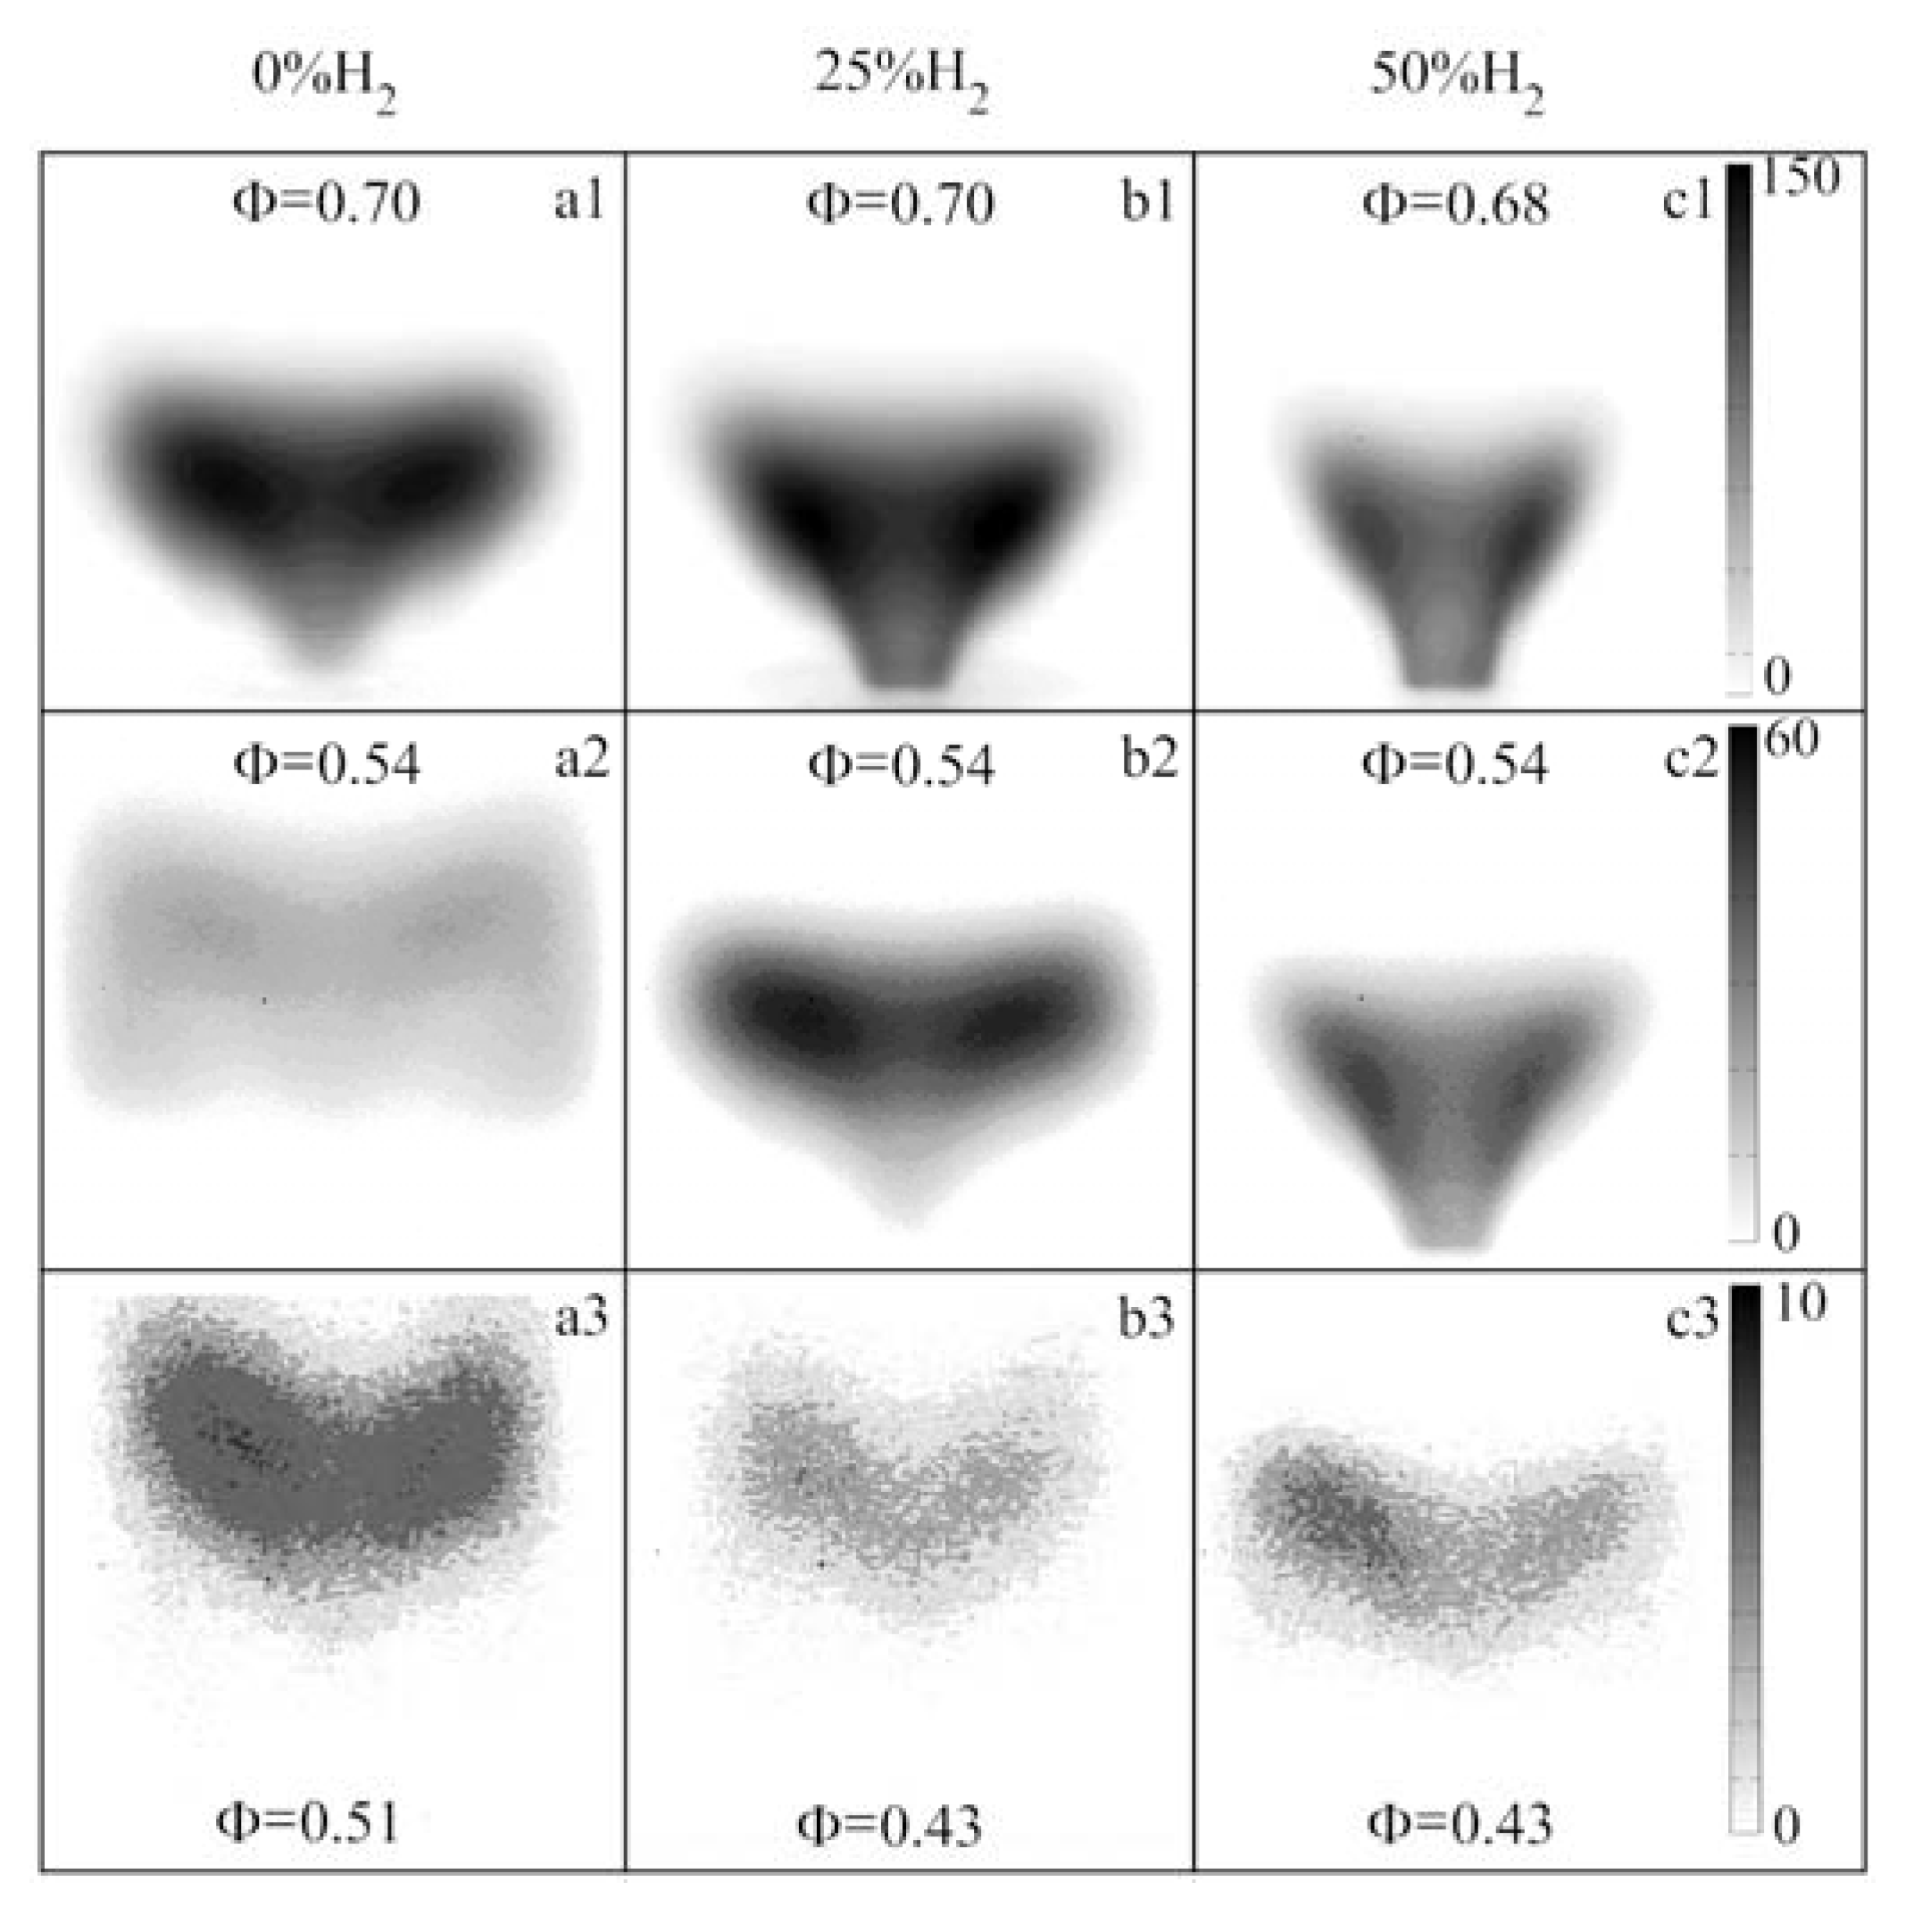
The CH signal has been proved as a good indication of the locations of flame reaction zone [33]. Therefore, CH signal was used to reveal the flame shapes, length, and anchored locations for the CH4/H2 flames. Figure 4 shows the CH chemiluminescence of the swirl-stabilized CH4/H2 flames that were captured at different equivalence ratios. It could be observed that with the increase of equivalence ratios and H2 molar fraction in the fuel mixture, the flame reaction zone traveled and stabilized upstream due to the augmented turbulent flame speed. At the opposite case, the flame temperature was low, hence the combustion chemical reaction rates were reduced. As a result, a low CH intensity was observed and the flame stabilized downstream. Figure 4(a1–a3) shows the methane flame evolution along the decrease of equivalence ratio. The flame shapes started with an attached ‘V’ shape at equivalence ratio 0.7. Then, the flame changed to an ‘M’ shape at an equivalence ratio 0.54 and the edge of flame stabilized close to the combustor liner. Finally, at the equivalence ratio 0.51, the methane flame became a lifted ‘V’ shape flame. For the combustion cases with 25% and 50% H2 addition, the flame shapes gradually changed from the attached ‘V’ shape to the lifted ’V’ shape. The ‘M’ shape flame was not observed. The low CH intensity near LBO limits indicated that the flame had a weak ability to adapt to the changes of local properties, e.g., equivalence ratio and velocity. Hence, the fluctuations of high strain rate and local equivalence ratios could result in local flame extinction.
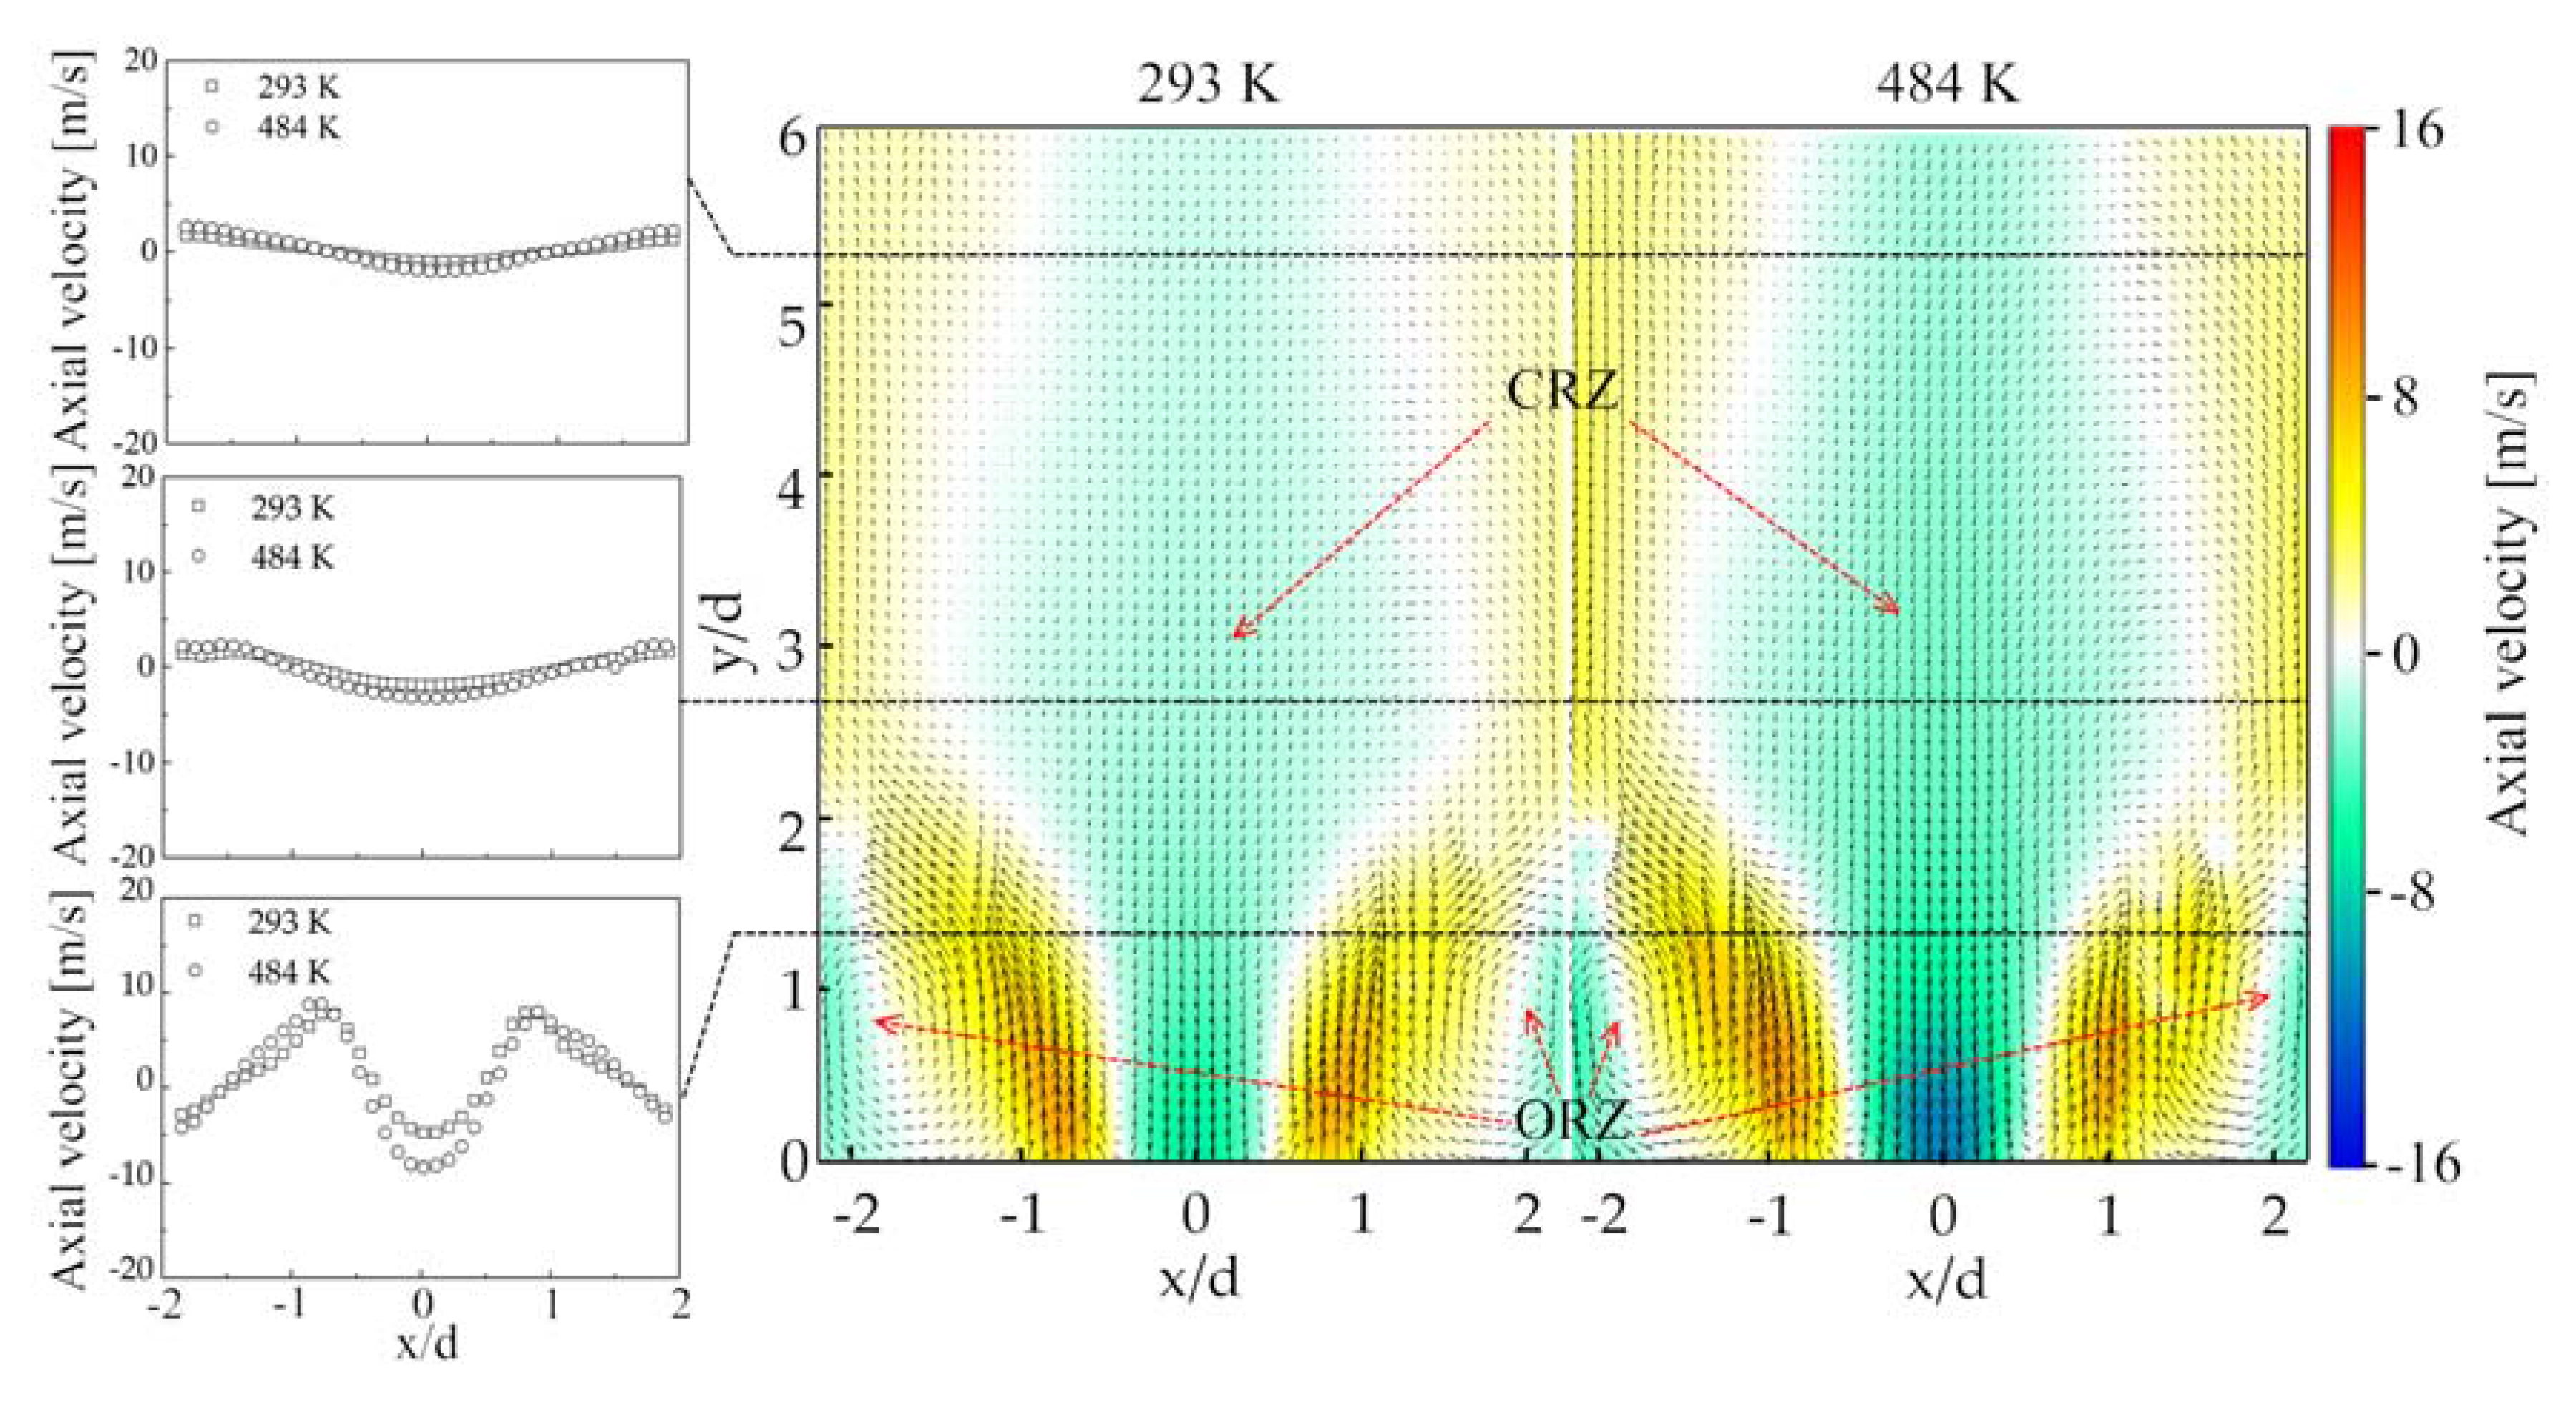
The flame structure features and the anchored location is strongly influenced by the velocity field. Figure 5 shows the structure of the average velocity field at non-reacting conditions with the combustor inlet temperature 293 K and 484 K. The time-averaged velocity fields were obtained by averaging 2000 instantaneous velocity fields, which are equivalent to a time interval of 1 s. The arrows represent the 2D velocity vector field, meanwhile, the contour plot indicates the axial velocity component. The color scale of the contour plot shows that white color represents the locations where the axial velocity component is zero. The axial velocity component profiles were plotted at y/d = 1.3, 2.7, and 5.3. It was observed that due to the vortex breakdown, a center recirculation zone (CRZ) with low and negative velocity (relative to the incoming flow) was created in the center of the combustor. The presence of CRZ could recirculate the hot combustion products and incompletely burned fuel to the flame reaction zone and the upstream mixing zone. Therefore, the heat and mass transfer between the fuel-oxidizer mixture and the recirculated gas species is enhanced, and a strong influence of CRZ on the flame shapes, stabilization, and anchored locations can be expected. Because of the geometry of the dump combustor, another toroidal recirculation zone, which is defined as outer recirculation zone (ORZ), was formed. An annular jet flow was located between the CRZ and ORZ, with a high velocity. Strong velocity, temperature, and species concentration gradients occurred in the inner shear layer (ISL) between the annular jet flow and the CRZ, and in the outer shear layer (OSL) between the annular jet flow and the ORZ. It can be observed that the structure of the average flow is largely independent of the combustor inlet temperature, except for a velocity increase that appeared in the CRZ, annular jet flow, ORZ, and the flow field between the liner and CRZ at a higher combustor inlet temperature. In the average flow, the stagnation points (SP), i.e., the upstream and downstream boundaries of the CRZ, were located outside of the measurement domain.
Figure 6 shows a comparison of the velocity field, flame structures, and flame locations, with different fuel compositions and equivalence ratios. The H2 addition and equivalence ratio effects on average flow field were shown in Figure 6(a1–a4). Based on the observation of the flow field, the approximate locations of the boundaries of CRZ, ORZ, and the annular high-speed jet flow was marked by the red dashed line. In order to estimate the locations of the reaction zones in the average flow field, the approximated boundaries were mapped to the CH images. With 25% H2 in the fuel mixture, it can be observed that there was a significant velocity increase in the CRZ as compared to pure CH4 at equivalence ratio 0.7. The velocity in the ORZ and the annular jet flow was also enhanced. At a lower equivalence ratio 0.54, however, the H2 addition did not show a significant influence on the CRZ size and the velocity increase was not observed. The decrease of the equivalence ratio from 0.7 to 0.54 resulted in a reduction in the size and velocity of the CRZ for both of the fuels. Figure 6(b1–b4) shows the CH distribution (obtained by using inverse Abel transform) on the PIV measurement plane. The CH signal indicated the location and structure of the flame reaction zones. At equivalence ratio 0.7, the reaction rate was enhanced by H2 addition and the reaction zone of both fuel composition stabilized as a ‘V’ shape, which was found located at the ISL. At equivalence ratio 0.54, the reaction zone of CH4 flame was located downstream as ‘M’ shape. However, with 25% H2 addition, the flame still stabilized as a ‘V’ shape at the ISL.
3.2. Instantaneous Velocity Fields
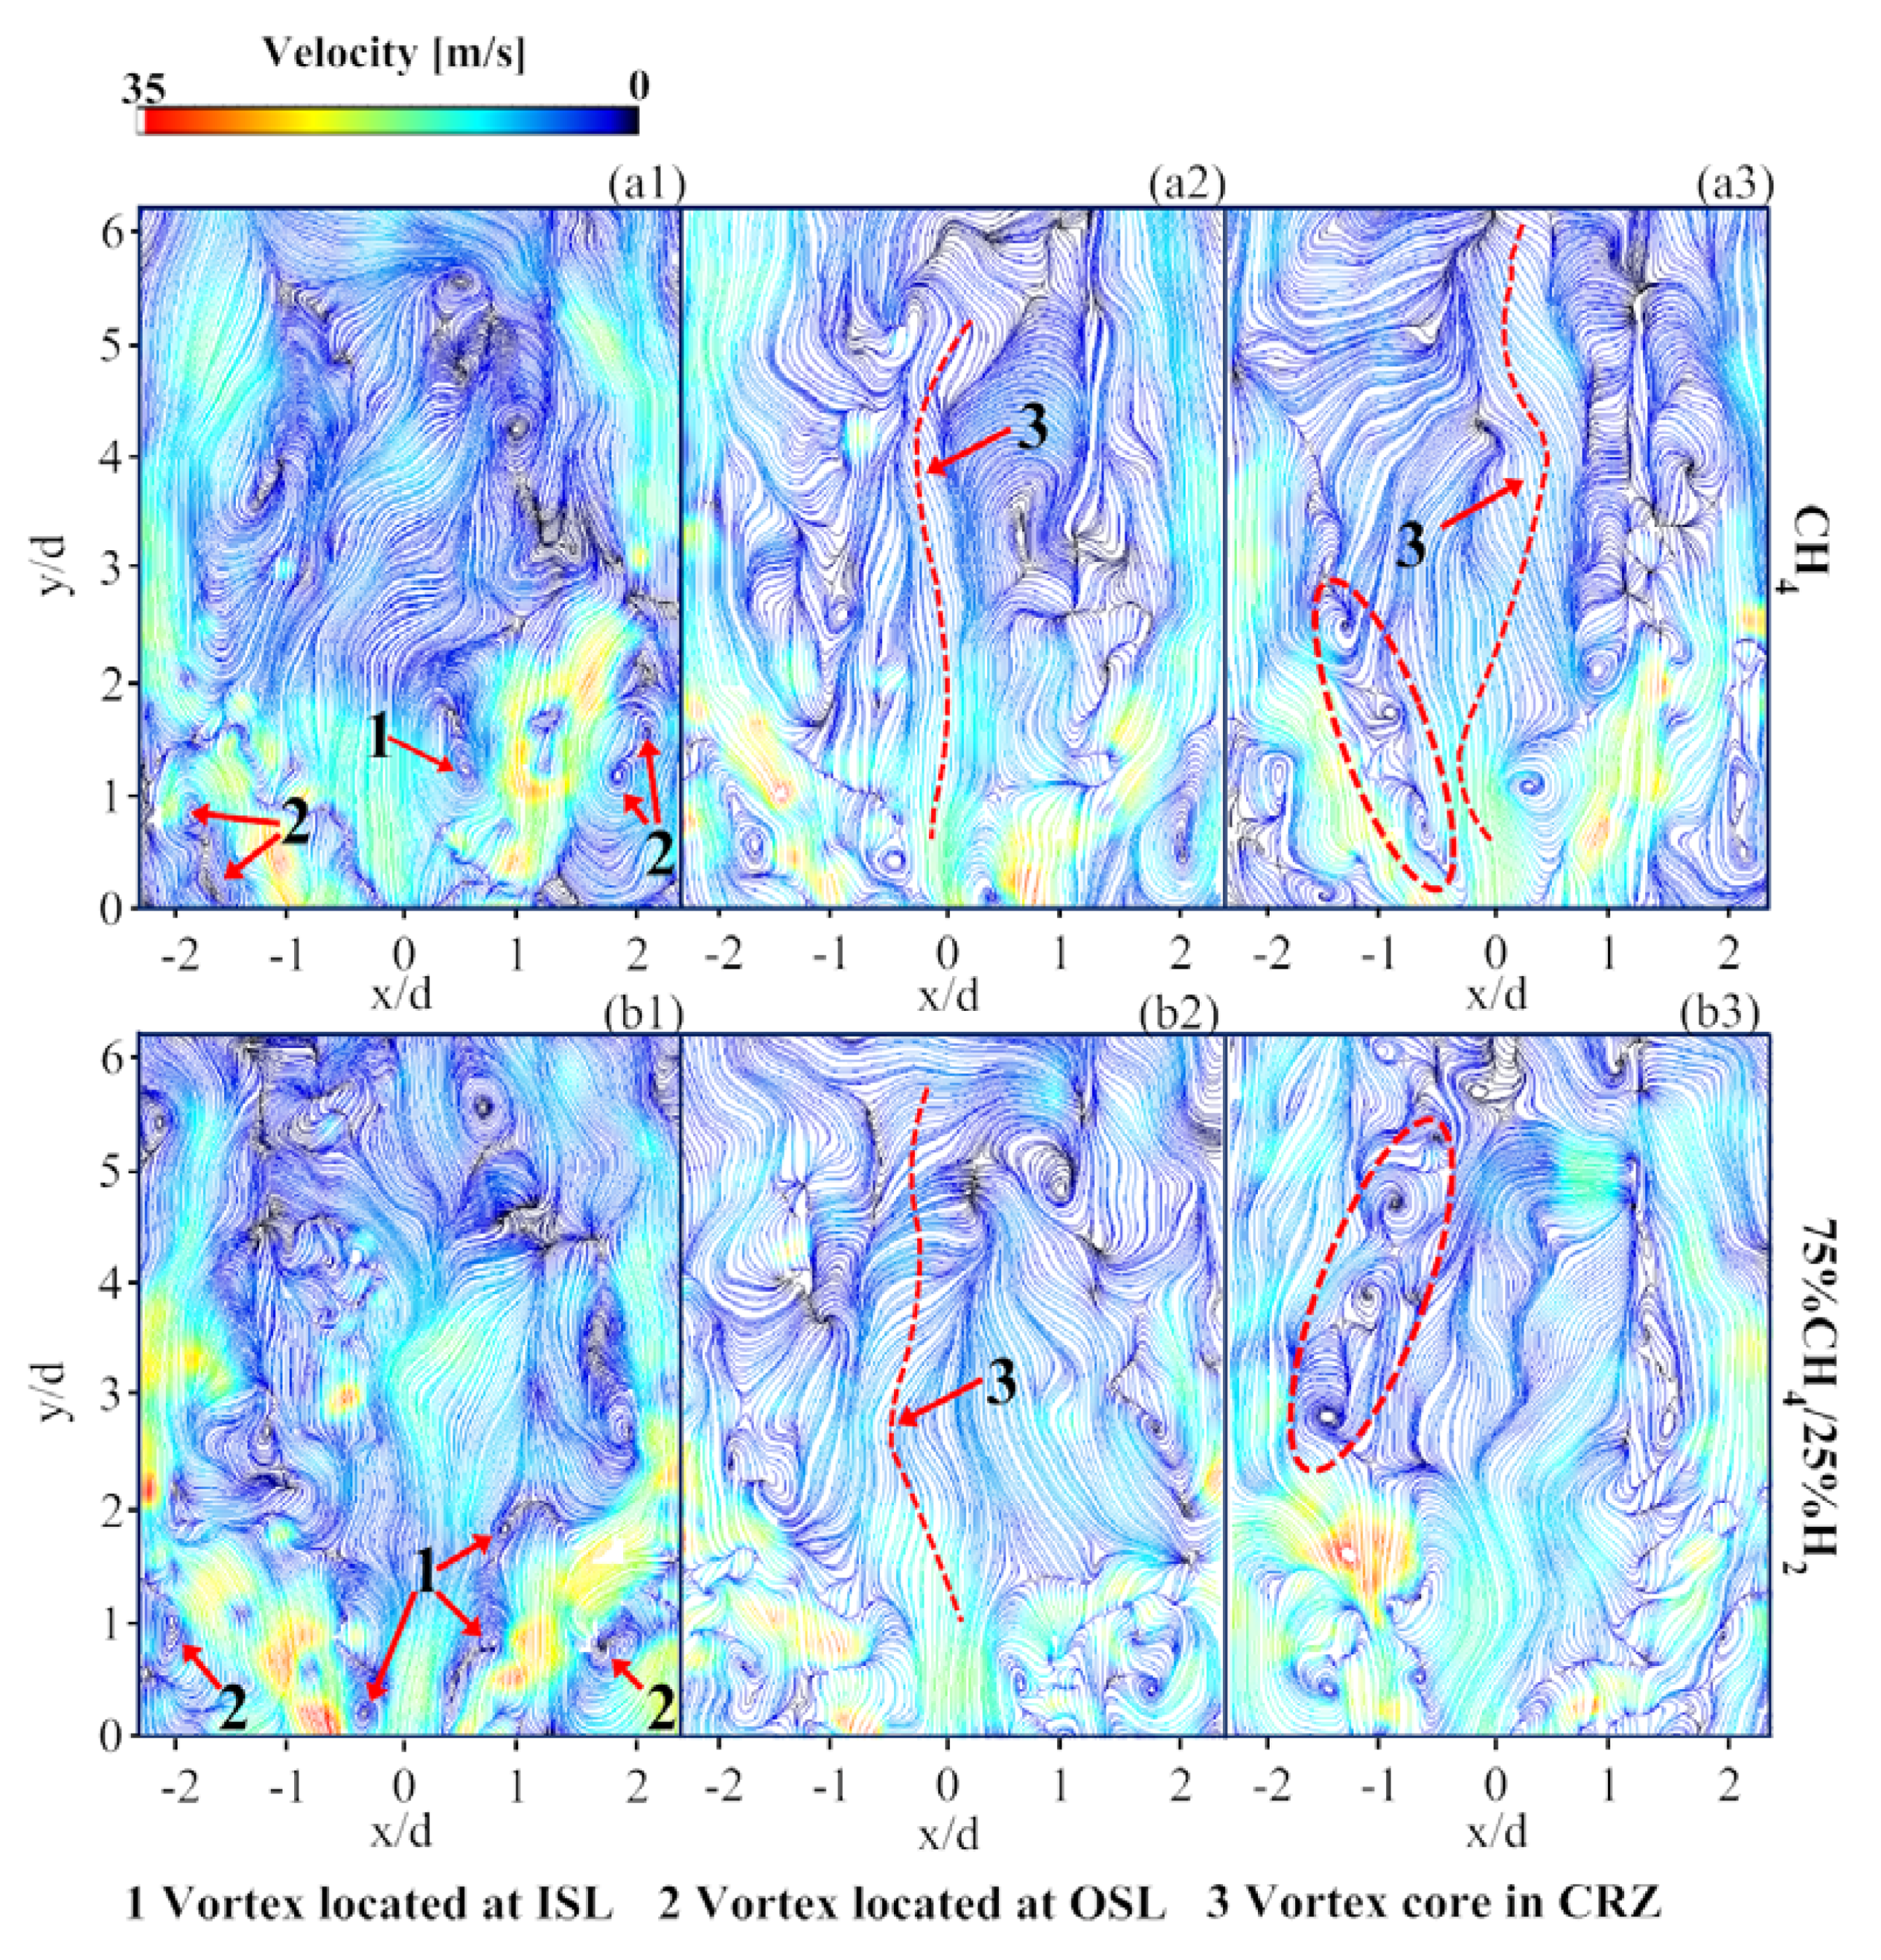
Figure 7 depicts the instantaneous velocity fields at equivalence ratio 0.7 for the flames of CH4 and 75%CH4/25%H2. The color of the streamline plots represents the absolute value of velocity. An instantaneous snapshot of the velocity field revealed distinctive features that were not shown by the average flow field. Vortices structures with different sizes were clearly observed in the vicinity of ISL and OSL. Big vortices structures contained small-scale vortices. Vortices with small scale can influence the reactants mixing and flame reaction zones. Entrainment of hot combustion products could be enhanced by the rotational movement of vortices. Higher velocity was found in the intermittent jet flow, zones near liner wall, and the bottom of CRZ. Figure 7(a1,b1) showed that the ISL and OSL were twisted by multiple vortices, which indicated the presence of a coherent helical vortex. Such a helical vortex is often encountered in swirl-stabilized flames and it is commonly referred to precessing vortex core (PVC). The previous study indicated that the presence of PVC can influence the flame structure and evolution, local turbulent intensity, and combustion efficiency [31,34,35]. The frequency of PVC rotation is very important as it can resonate with low-frequency acoustic oscillation and can damage the combustor hardware. Besides the PVC, unsteady vertical vortex core in the center of CRZ was captured and shown in Figure 7(a2,a3,b2). Figure 7(a3,b3) revealed the vortex shedding along the ISL which was circled by the red dashed line.
3.3. Identification of Precessing Vortex Core by POD Analysis
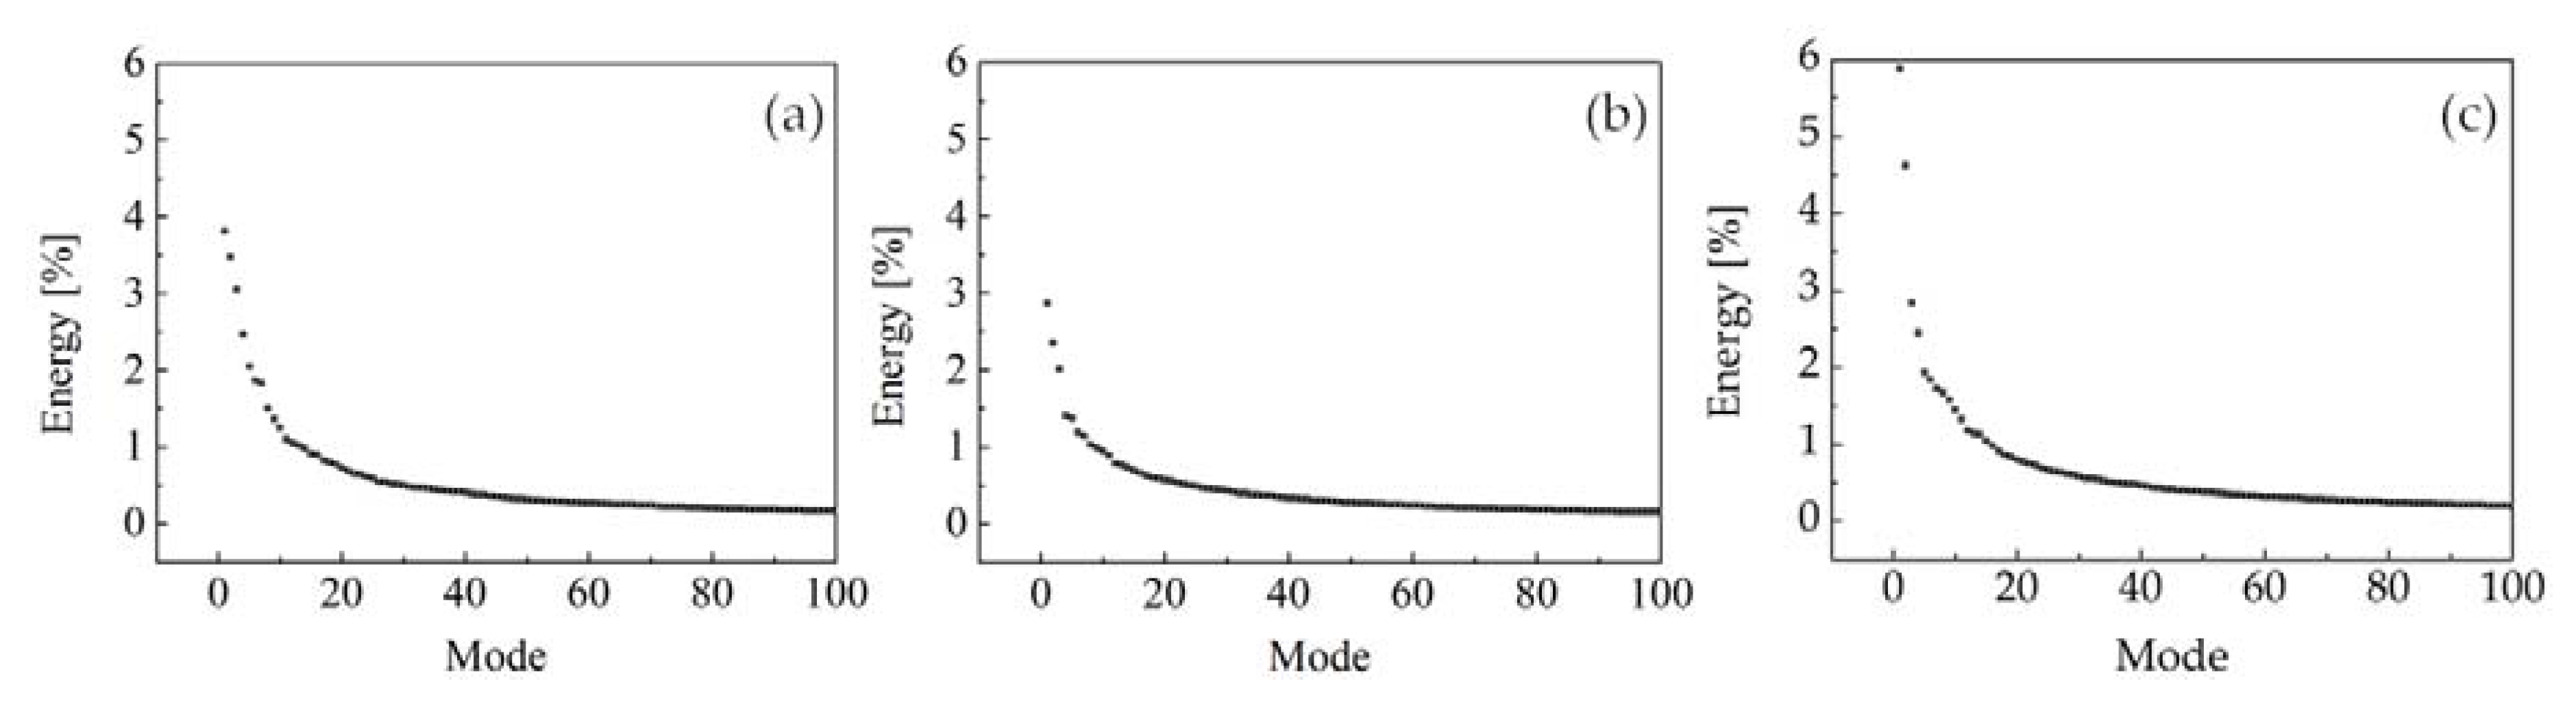
Further investigations of the main coherent structures in the flow field were attempted by using snapshot POD method. In current work, 2000 instantaneous velocity snapshots were used in POD analysis. As a result, 2000 POD modes and their corresponding time coefficients were achieved. In addition, the obtained POD modes were sorted in a descending order according to their energy proportion. Figure 8 shows the energy distribution of the first 100 modes for the non-reacting flow with two combustor inlet temperatures and the reacting flow with 25% H2 addition at equivalence ratio 0.7. Mode 1 contained the most energy proportion, and each successive mode represented the next greatest energy contribution. It could be found that the energy in the first few modes was much greater than the successive modes. Figure 8c shows that with the interaction between the flame and turbulent flow, more energy was contained in the first a few modes when compared to the non-reacting case.
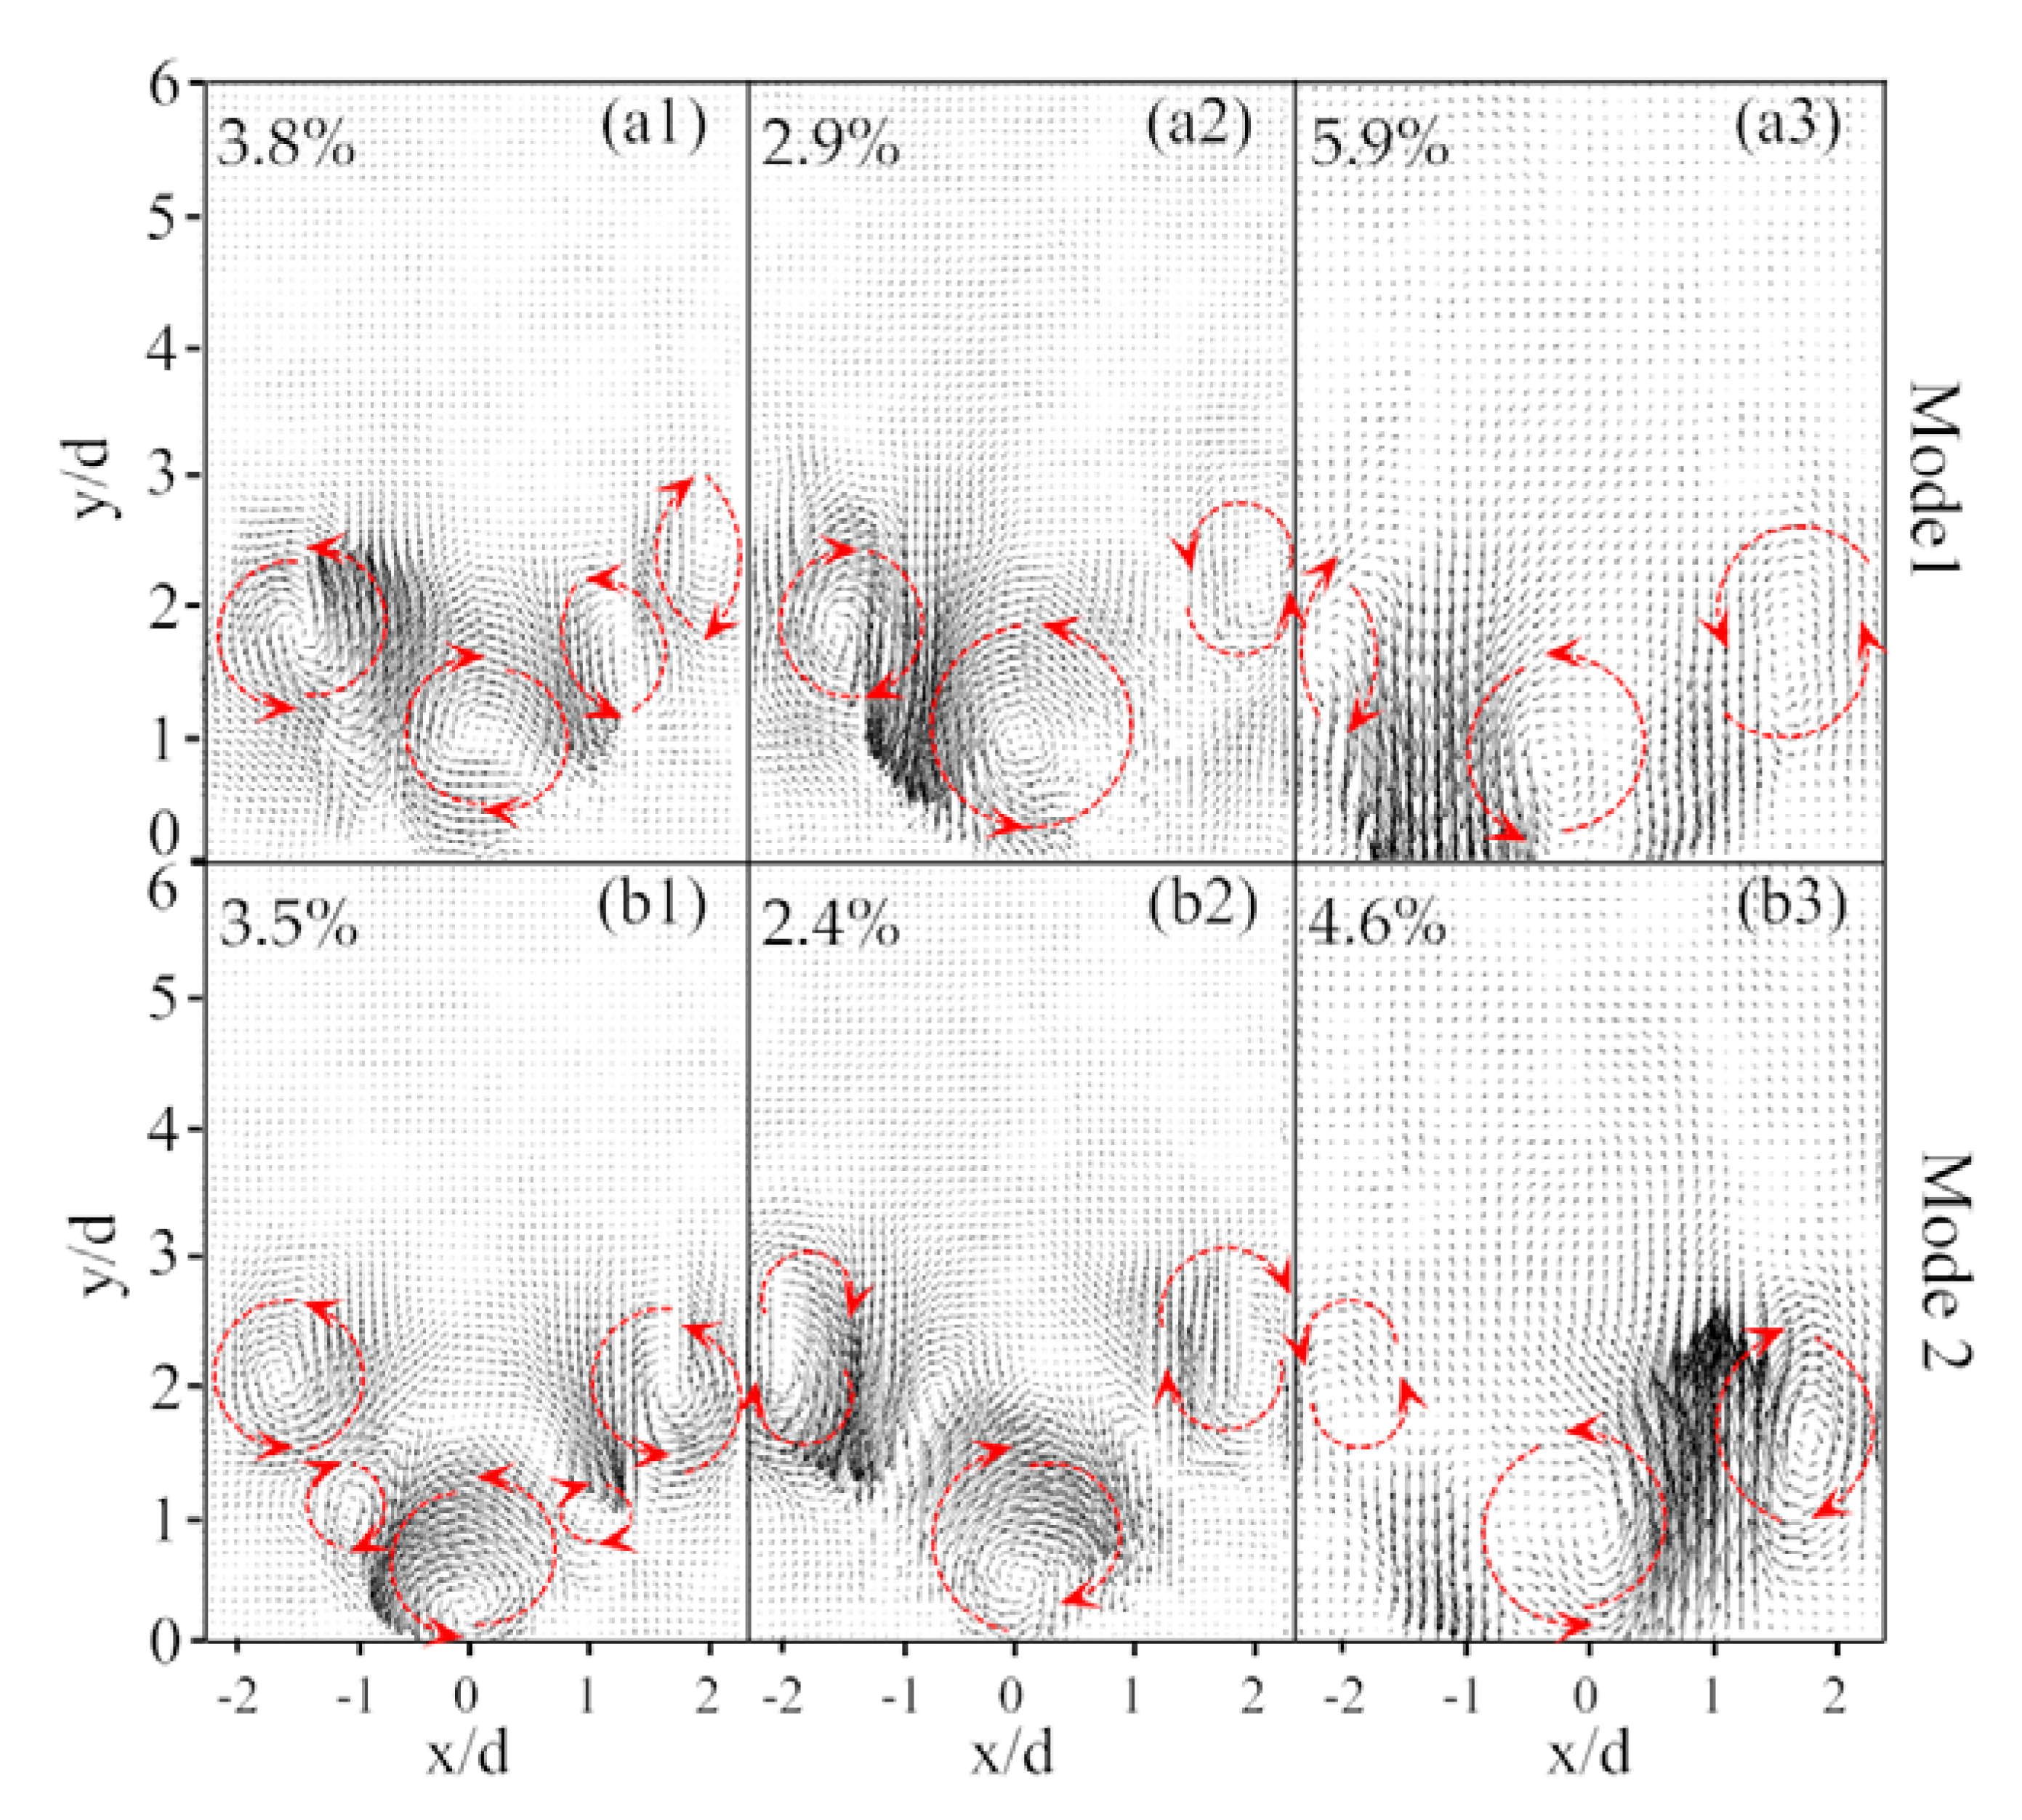
The characteristics of the spatial structure and periodicity of the coherent structures can be revealed by the shape of POD mode and the corresponding time coefficients. Generally, the first several POD modes represent the most dominant unsteady structures in the flow field in terms of kinetic energy [36]. It is worthy to note that the flow patterns observed in a POD mode do not necessarily correspond to the individual coherent structures [37]. It may happen that a dominant dynamic feature is spread over several POD modes, according to the previous studies. A structure is apparent in a single mode only if it has very high energy in a single snapshot, or the structure is identical (shape, location, and orientation) in many snapshots. Any alteration of flow structures will distribute the flow energy to other modes. A comparison of the first two POD spatial modes with the different operating conditions is shown in Figure 9. The vortex structures and their rotating direction were marked by the red dashed line with the arrow. The percentage values in each POD mode denote their proportions of turbulent kinetic energy in the measurement domain. In fact, the first 10 POD spatial modes were examined and the results indicated that the first two modes had a similar spatial structure in both the non-reacting flow (with the combustor inlet temperature of 384 K and 484 K), and the reacting flow (with 25% H2 addition at equivalence ratio 0.7 and combustor inlet temperature 484 K). In addition, the energy of the first two modes is in the same order of magnitude. The first two modes shown in Figure 9 represented the vortex pattern along the ISL, which is very typical for a helical instability featuring a PVC. According to Figure 9(a3,b3), it could be observed that the vortex structure in the first two modes was weakened as compared to the non-reacting flow. In addition, the annular high-velocity jet flow was also captured in the first two POD modes which resulted in an increase in the corresponding energy proportion.
Figure 10 shows the time coefficients of the first two modes of both the non-reacting flow and the reacting flow. The turbulent flow field of the combustor features the unsteady vortex structures with different scales, as well as the incoherent turbulent motions. Due to the fact that different phenomena are often superimposed on each other, the spectrum shown in Figure 10 contains not only the periodic fluctuations of the coherent structures, but also the chaotic turbulence. Therefore, the fast Fourier transform was used to identify the prominent frequency of the coherent structures that are represented by the POD modes. Based on Figure 10(a1,a2), it can be observed that the first two modes oscillated along time with a phase shift. Figure 10(b1,c1) shows the fast Fourier transform (FFT) analysis results for the non-reacting flow. Results indicated that the prominent frequencies related to the first two modes were all 136 Hz. This revealed that the first two POD modes were associated with a self-excited single-helical instability, which features a precessing vortex core (PVC) [38,39]. The representation of PVC by two modes could be related to the motion of vortices in the measurement plane due to the precession of PVC helix. The presence of PVC has been proven to benefit the local mixing which is vital for creating a more homogeneous distribution of temperature and density [40]. The frequency of PVC rotation is an important parameter for combustor operation since the PVC can resonate with low-frequency acoustic oscillation, which could damage the equipment.
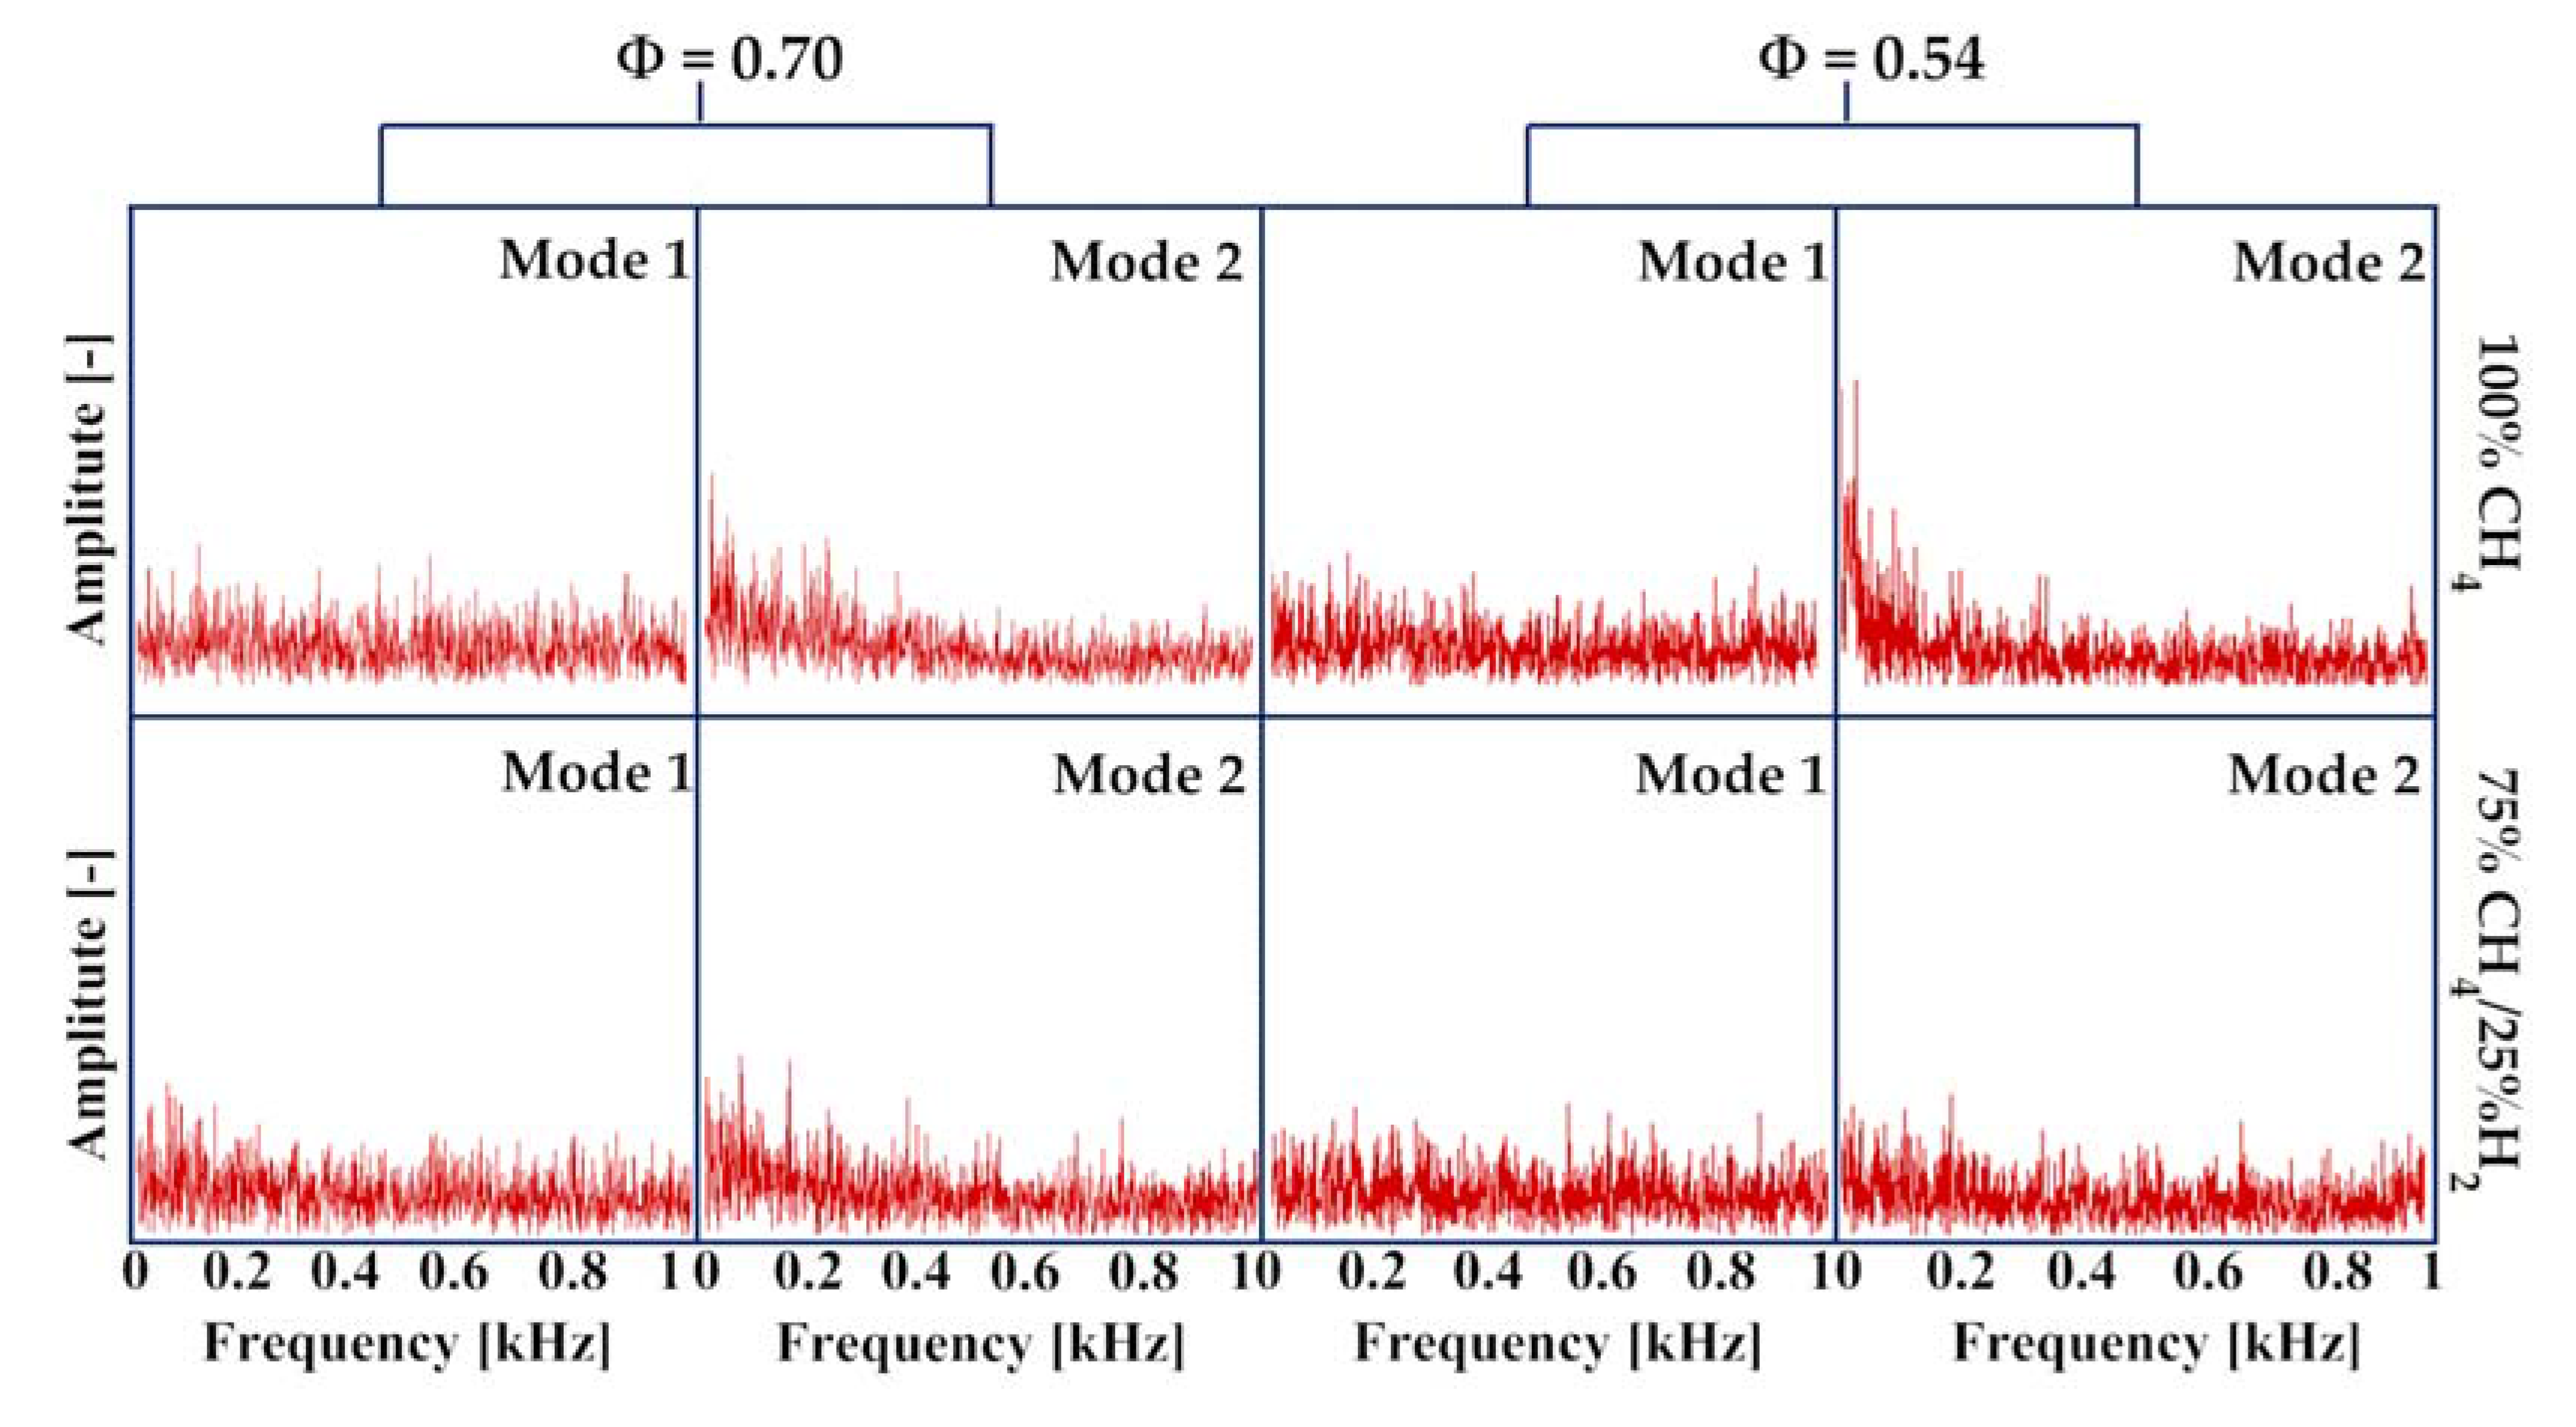
In the reacting flow with an equivalence ratio of 0.7 and 25% H2 addition, the 136 Hz peak frequency could still be observed in the first two modes. However, the FFT results did not reveal any strong self-excited oscillations which meant a thermo-acoustically stable flame. In this condition, the instability caused by the PVC was suppressed by the combustion. The governing mechanisms for the damping of the PVC were suggested to be the increased viscosity [41,42]. Previously, the combustion effect on the PVC instability was reported by a number of studies. Similar suppression effect of combustion on PVC instability was observed in some research [42,43]. More studies indicated that the PVC occurrence and amplitude under the combustion conditions strongly depended on the operating conditions, e.g., equivalence ratios and the confinement levels [44,45]. The effects of equivalence ratio and fuel composition were examined in the current study. Figure 11 shows the FFT analysis result of the time coefficients for the first two POD modes in different operating conditions. Strong oscillation with the same frequency in mode 1 and mode 2 was not observed. Hence, the frequency of PVC cannot be identified. Based on Figure 11, no connections were observed between the PVC suppression and the equivalence ratios and the H2 addition in the combustion.
3.4. CO Emissions
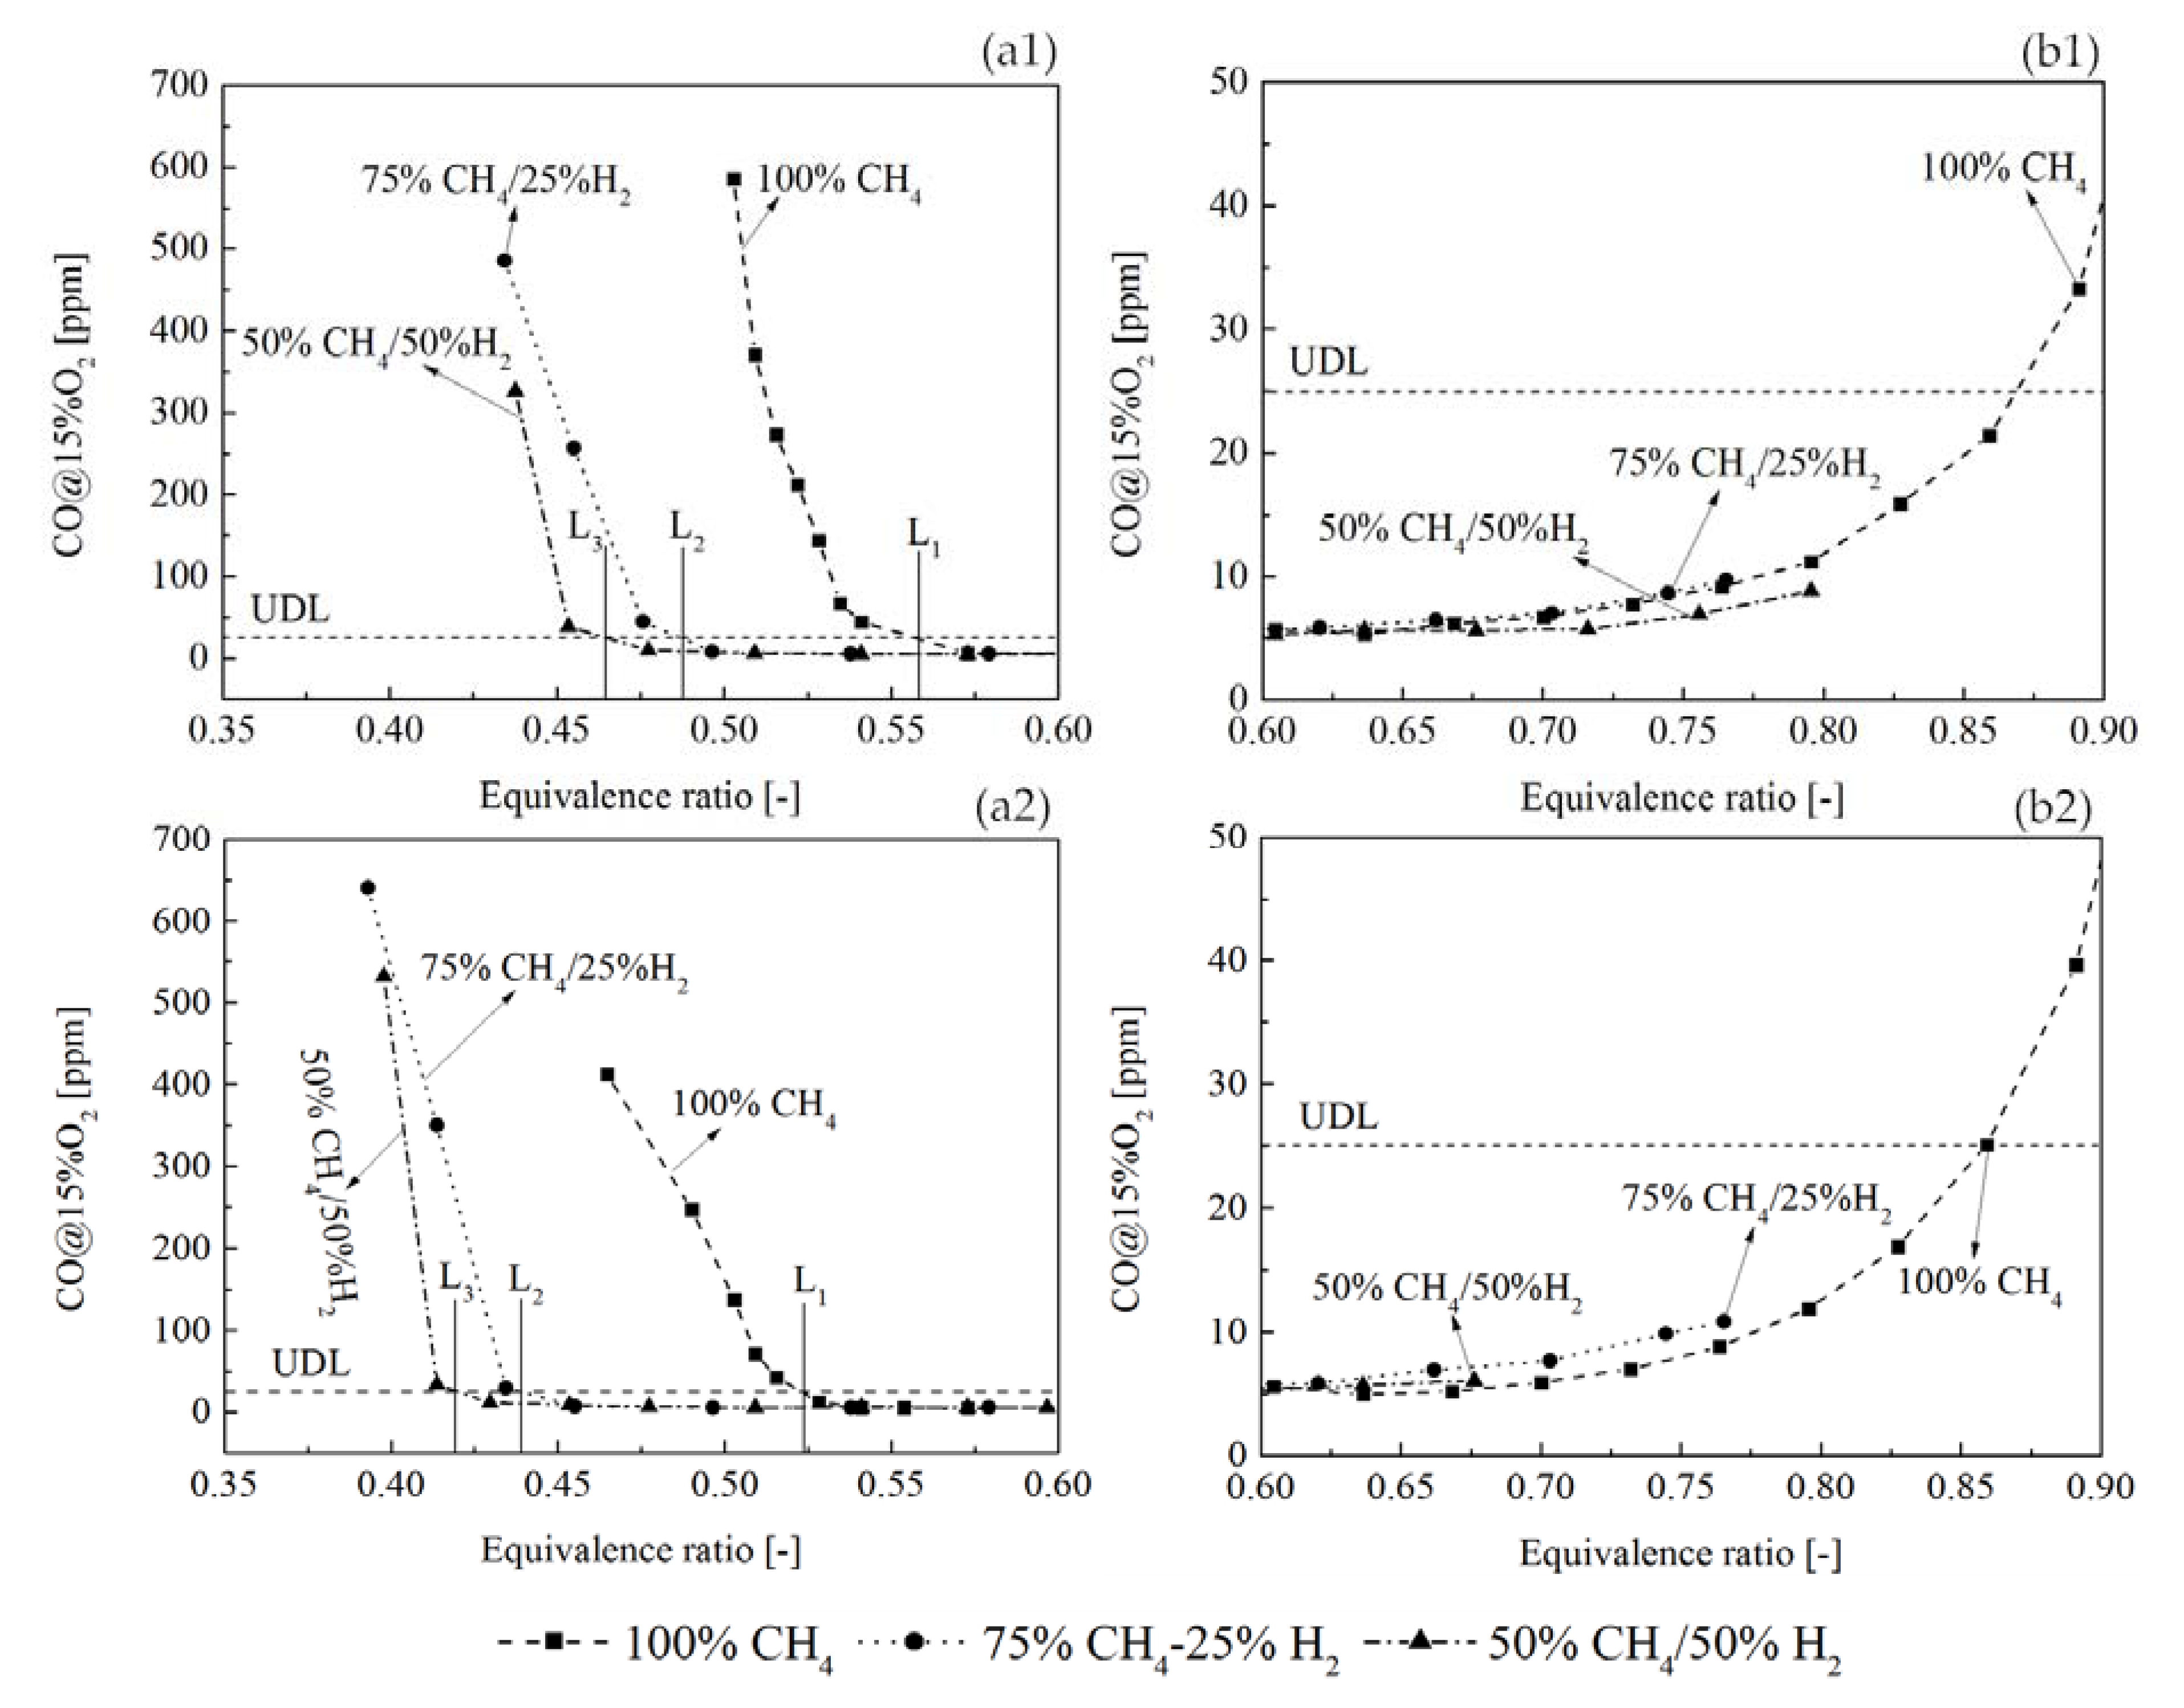
The H2 addition effect on CO emission performance was examined with three H2 molar fractions (0%, 25%, and 50%) in the fuel blends, and two combustor inlet temperatures (384 K and 484 K). The dependency of CO emission on equivalence ratio was shown in Figure 12. A user-defined limit (UDL) of CO emission concentration of combustion products was set at 25 ppm. Below UDL, the CO is considered as acceptable and combustion is operated at a good efficiency. Near the LBO limits, the equivalence ratios at the UDL were represented by L1, L2, and L3, the subscript stood for the corresponding H2 molar fraction. Based on Figure 12(a1,a2), combustion operation near the LBO limits resulted in an exponential CO concentration increase in combustion products. This was due to the reduction of CO oxidation rate that is caused by lower flame temperature. Due to the improvement of oxidation rate, CO concentration was reduced along the increase of equivalence ratio. Figure 12(b1,b2) shows CO emission profile from the equivalence ratio 0.60 to 0.90. With the H2 addition, CO emission at high equivalence ratios was not measured due to the strong flame flashback, which could damage the mixing section of the combustor. Towards higher equivalence ratios, CO concentration profile showed an increasing tendency. This was due to the dissociation of CO2 to CO, which became significant at a high flame temperature. Comparison of the CO concentration with different H2 molar fraction indicated that the operation range with low CO was extended to by H2 addition. In addition, higher combustor inlet temperature could also contribute to a broader equivalence ratio range for low CO operation.
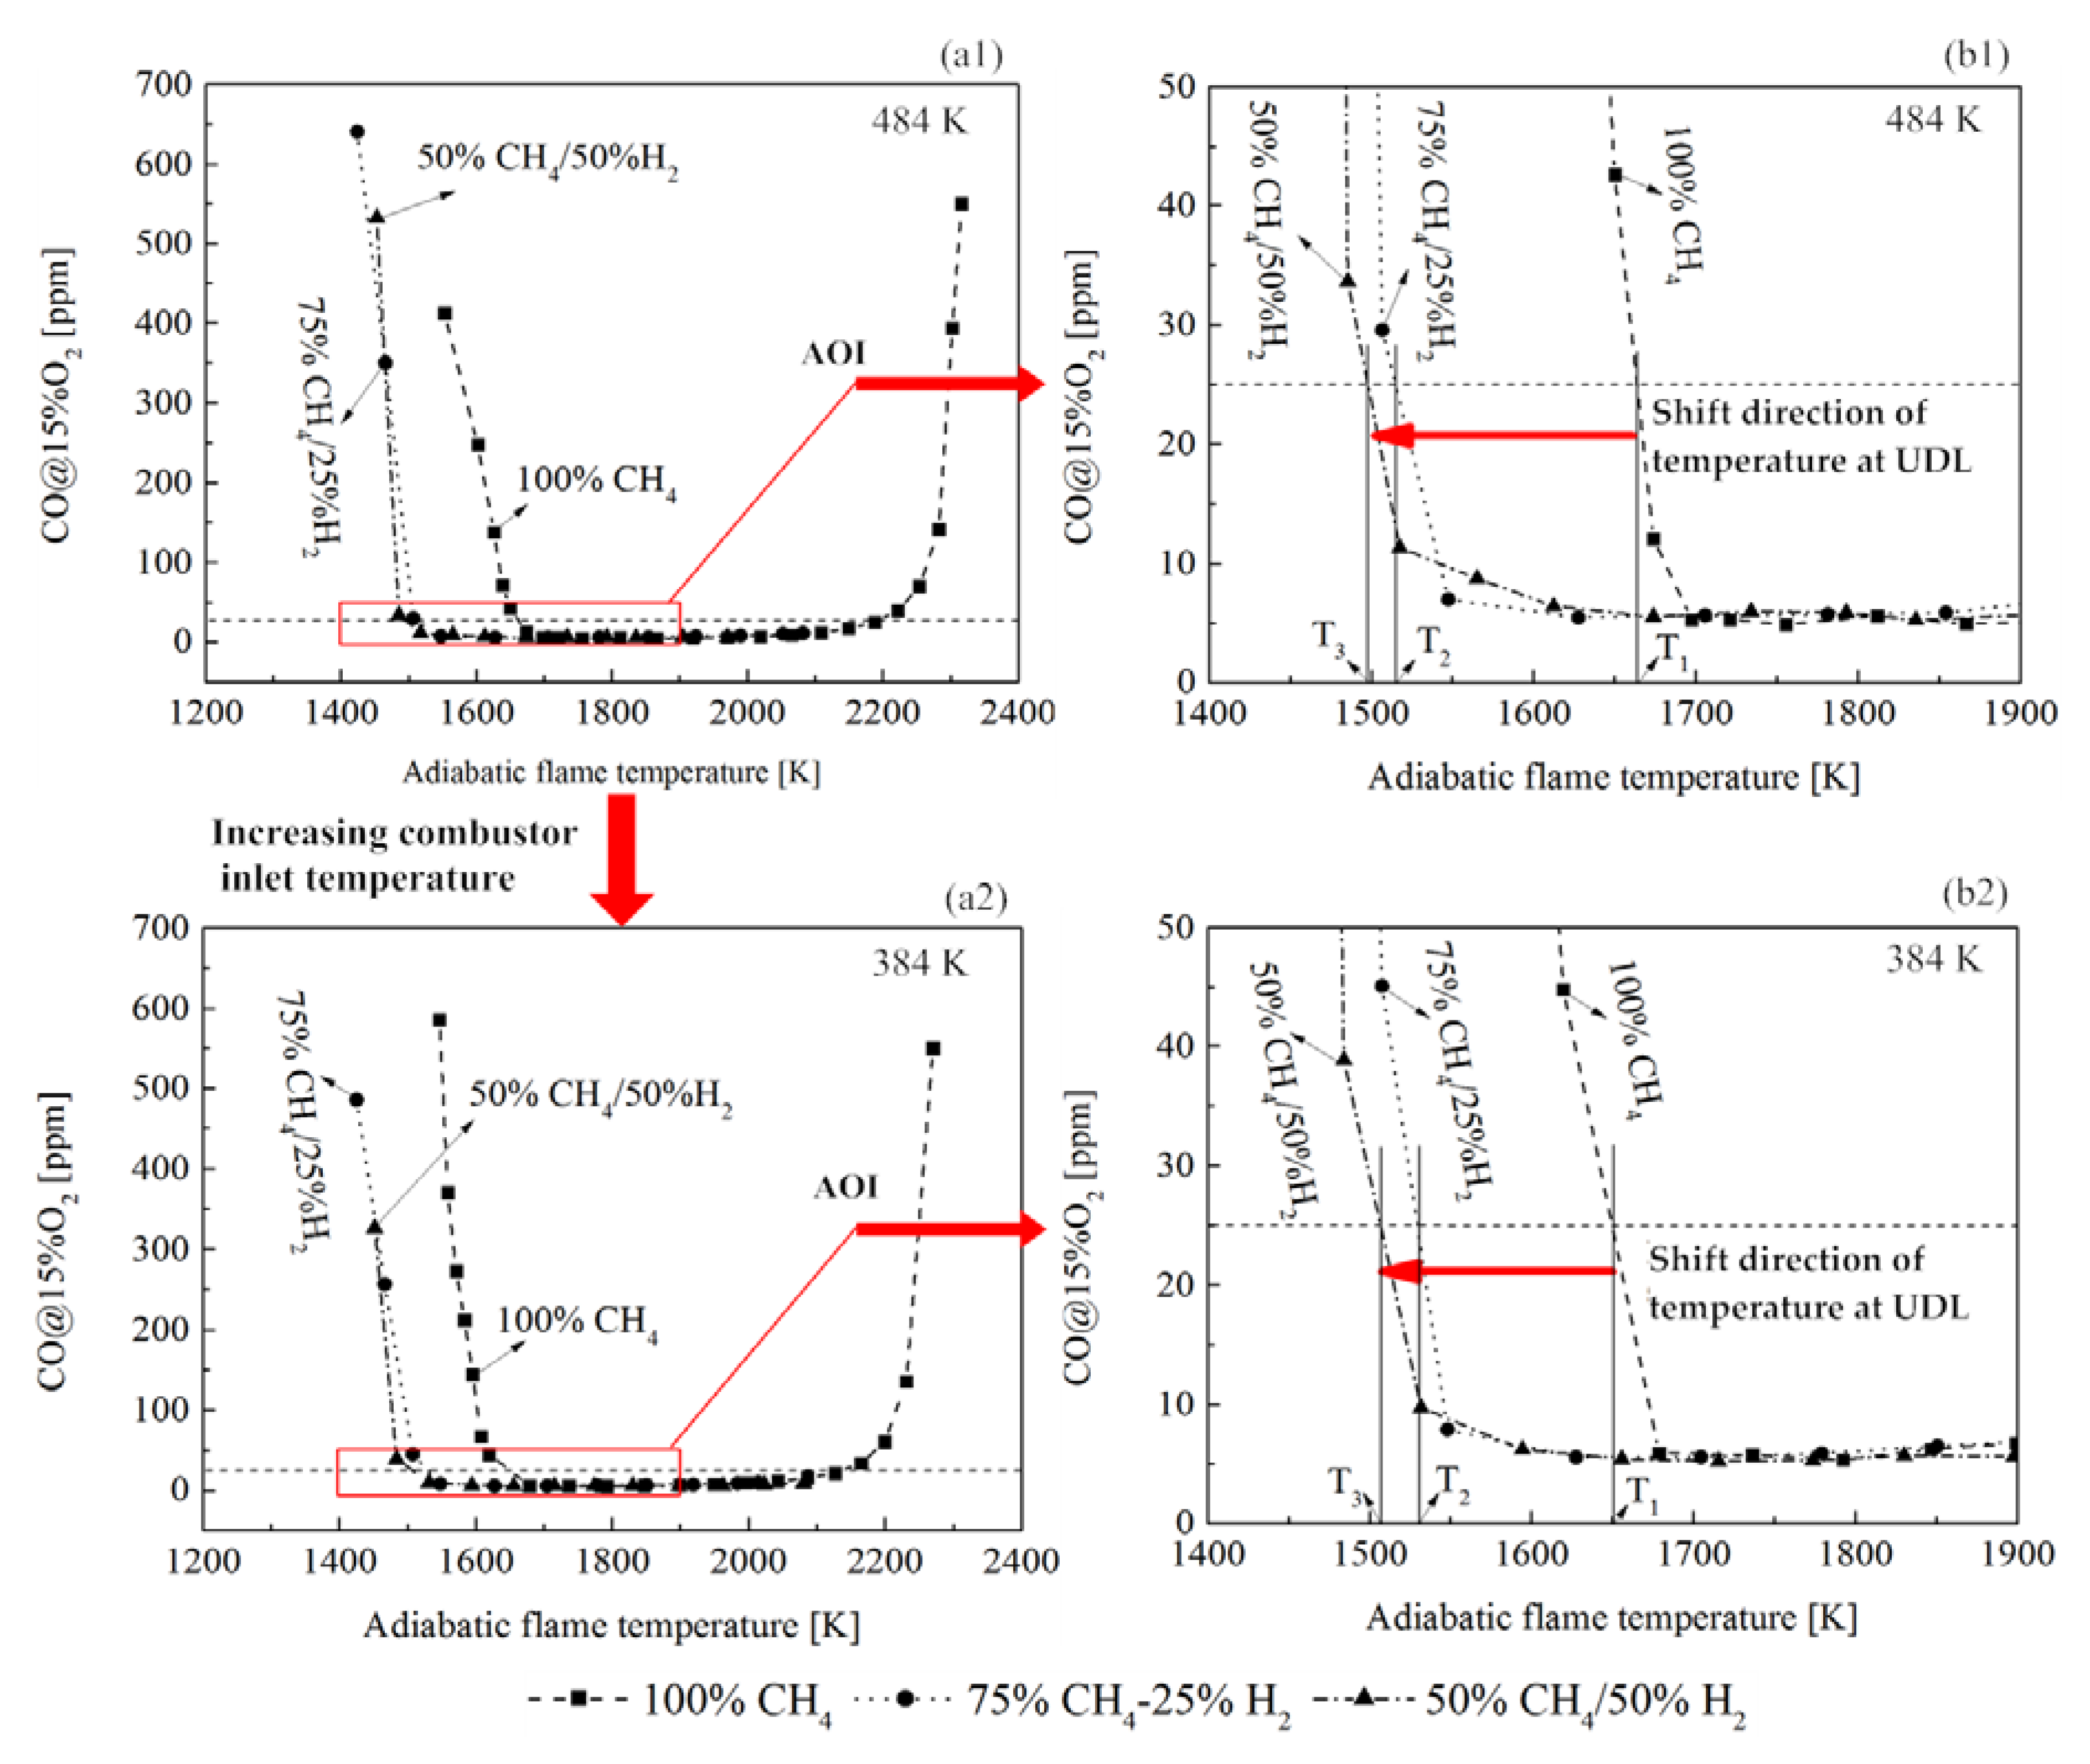
Figure 13 shows the dependency of CO on the adiabatic flame temperature, which indicates the H2 addition and combustor inlet temperature effects. With the H2 addition in fuel blends, it was observed from Figure 13(a1,a2) that the combustion with CO lower than UDL could be operated in a lower adiabatic flame temperature than CH4 flame. However, increasing the H2 molar fraction in the fuel mixture did not significantly extend the margin of adiabatic flame temperature for low CO operation. Particular attention was paid to the area of interest (AOI), which was marked by the solid red line. Figure 13(b1,b2) shows the AOI in a CO scale range from 0 to 50 ppm. The adiabatic flame temperature of UDL with different H2 molar fraction was identified (represented by T1, T2, and T3). A slight change of the temperature of UDL was observed with the increase of combustor inlet temperature.
4. Conclusions
The H2 addition effects were investigated experimentally with a premixed and swirl-stabilized gas turbine model combustor under the atmospheric pressure. The H2 molar fraction of 0%, 25%, and 50% in the fuel mixture was studied. The time-averaged CH chemiluminescence imaging, 2D high-speed PIV, and CO emission detection were employed to understand the features of H2 addition influence. According to the analysis of the experimental results, the following conclusions were summarized
- The flame LBO limits can be extended to lower equivalence ratios by adding H2 in the fuel flow and improving the combustor inlet temperature. Higher H2 molar fraction in the fuel mixture can benefit the combustor operation with an extended equivalence ratio range.
- Time-averaged CH chemiluminescence indicated that the flame reaction zone traveled and stabilized upstream with the increase of equivalence ratios and H2 molar fraction in the fuel mixture. The attached ‘V’ shape flame, ‘M’ shape flame, and a lifted ‘V’ shape flame was found along the decrease of the equivalence ratio without H2 addition. With 25% and 50% H2 addition, the flame shape changed from the attached ‘V’ shape to the lifted ‘V’ shape. The ‘M’ shape flame was not found.
- The time-average velocity field of non-reacting flow revealed the presence of center recirculation zone (CRZ) and outer recirculation zone (ORZ) due to the vortex breakdown and the geometry of the dump combustor, respectively. An annular jet flow was found to be located between the CRZ and ORZ. The velocity in the CRZ, ORZ, and the annular jet flow was enhanced by improving the combustor inlet temperature from 384 K to 484 K.
- The time-average velocity field of reacting flow indicated that the H2 addition could lead to a velocity increase in the flow field at equivalence ratio 0.7. However, at a lower equivalence ratio 0.54, this effect was not observed. Reducing equivalence ratio resulted in a size reduction of CRZ for both the CH4 flame and 75%CH4/25%H2 flame. By using inverse Abel transform, it could be observed that the flame with 25% H2 addition was able to stabilize at the ISL at a lower equivalence ratio when compared to the CH4 flame.
- Unlike the average flow field, the instantaneous velocity field of the reacting flow revealed the unsteady vortices structures, which indicated the presence of a coherent helical vortex. Such a helical vortex often appears in swirling flow and it is commonly referred to as the precessing vortex core (PVC).
- In the non-reacting flow, the structure of POD spatial mode and their relevant time coefficients indicated that the first two POD modes were associated with a self-excited single helical instability which features a PVC. In the reacting flow, the flame of CH4 and 75%CH4/25%H2 were studied at the equivalence ratio of 0.70 and 0.54. Fast Fourier transform showed that the PVC was suppressed by the combustion.
- The CO emission measurement showed that the equivalence ratio operation range with low CO (under the UDL) was extended by H2 addition and improving the combustor inlet temperature. In addition, adding H2 made it possible to operate a low CO combustion at lower adiabatic flame temperatures. However, increasing H2 molar fraction from 25% to 50% did not significantly extend the margin of adiabatic flame temperature for low CO operation.
Acknowledgments
The authors want to express a deep appreciation to the China Scholarship Council (CSC) for the great contribution to the present research.
Author Contributions
The experimental investigation was designed and performed by Mao Li. The article writing was done by Mao Li; Data analysis method was contributed by Mao Li and Yiheng Tong; Article writing was supervised by Marcus Thern and Jens Klingmann.
Conflicts of Interest
The authors declare no conflict of interest.
References
- Correa, S.M. Power generation and aeropropulsion gas turbines: From combustion science to combustion technology. Symp. (Int.) Combust. 1998, 27, 1793–1807. [Google Scholar] [CrossRef]
- Lefebvre, A.H. The role of fuel preparation in low-emission combustion. J. Eng. Gas Turbines Power 1995, 117, 617–654. [Google Scholar] [CrossRef]
- Kim, H.-S.; Lim, A.-H.; Ann, K.-Y.; Lee, S.-M. Study on the Combustion Characteristics of a Lean-Premixed Combustor. J. Korean Soc. Combust. 2004, 9, 25–31. [Google Scholar]
- Nguyen, O.; Samuelsen, S. The effect of discrete pilot hydrogen dopant injection on the lean blowout performance of a model gas turbine combustor. In Proceedings of the ASME 1999 International Gas Turbine and Aeroengine Congress and Exhation, Indianapolis, IN, USA, 7–10 June 1999. [Google Scholar]
- Phillips, J.N.; Roby, R.J. Enhanced gas turbine combustor performance using H2-enriched natural gas. In Proceedings of the ASME 1999 International Gas Turbine and Aeroengine Congress and Exhation, Indianapolis, IN, USA, 7–10 June 1999. [Google Scholar]
- Di Sarli, V. Stability and emissions of a lean pre-mixed combustor with rich catalytic/lean-burn pilot. Int. J. Chem. Reactor Eng. 2014, 12, 77–89. [Google Scholar] [CrossRef]
- Ilbas, M.; Crayford, A.; Yılmaz, I.; Bowen, P.; Syred, N. Laminar-burning velocities of hydrogen-air and hydrogen-methane-air mixtures: An experimental study. Int. J. Hydrog. Energy 2006, 31, 1768–1779. [Google Scholar] [CrossRef]
- Halter, F.; Chauveau, C.; Djebaili-Chaumeix, N.; Gökalp, I. Characterization of the effects of pressure and hydrogen concentration on laminar burning velocities of methane-hydrogen-air mixtures. Proc. Combust. Inst. 2005, 30, 201–208. [Google Scholar] [CrossRef]
- Yu, G.; Law, C.; Wu, C. Laminar flame speeds of hydrocarbon + air mixtures with hydrogen addition. Combust. Flame 1986, 63, 339–347. [Google Scholar] [CrossRef]
- Scholte, T.; Vaags, P. Burning velocities of mixtures of hydrogen, carbon monoxide and methane with air. Combust. Flame 1959, 3, 511–524. [Google Scholar] [CrossRef]
- Di Sarli, V.; Di Benedetto, A. Laminar burning velocity of hydrogen-methane/air premixed flames. Int. J. Hydrog. Energy 2007, 32, 637–646. [Google Scholar] [CrossRef]
- Di Sarli, V.; Di Benedetto, A. Effects of non-equidiffusion on unsteady propagation of hydrogen-enriched methane/air premixed flames. Int. J. Hydrog. Energy 2013, 38, 7510–7518. [Google Scholar] [CrossRef]
- Di Sarli, V.; Di Benedetto, A.; Long, E.J.; Hargrave, G.K. Time-Resolved Particle Image Velocimetry of dynamic interactions between hydrogen-enriched methane/air premixed flames and toroidal vortex structures. Int. J. Hydrog. Energy 2012, 37, 16201–16213. [Google Scholar] [CrossRef] [Green Version]
- İlbaş, M.; Yılmaz, İ. Experimental analysis of the effects of hydrogen addition on methane combustion. Int. J. Energy Res. 2012, 36, 643–647. [Google Scholar] [CrossRef]
- Li, M.; Zhang, Q.; Li, G.; Li, P. Effects of Hydrogen Addition on the Performance of a Pilot-Ignition Direct-Injection Natural Gas Engine: A Numerical Study. Energy Fuels 2017, 31, 4407–4423. [Google Scholar] [CrossRef]
- Guo, H.; Smallwood, G.J.; Liu, F.; Ju, Y.; Gülder, Ö.L. The effect of hydrogen addition on flammability limit and NOx emission in ultra-lean counterflow CH 4/air premixed flames. Proc. Combust. Inst. 2005, 30, 303–311. [Google Scholar] [CrossRef]
- Cho, E.-S.; Chung, S.H. Improvement of flame stability and NOx reduction in hydrogen-added ultra lean premixed combustion. J. Mech. Sci. Technol. 2009, 23, 650–658. [Google Scholar] [CrossRef]
- Lieuwen, T.; McDonell, V.; Petersen, E.; Santavicca, D. Fuel flexibility influences on premixed combustor blowout, flashback, autoignition, and stability. J. Eng. Gas Turbines Power 2008, 130, 011506. [Google Scholar] [CrossRef]
- Kim, K.T.; Lee, J.G.; Lee, H.J.; Quay, B.D.; Santavicca, D.A. Characterization of forced flame response of swirl-stabilized turbulent lean-premixed flames in a gas turbine combustor. J. Eng. Gas Turbines Power 2010, 132, 041502. [Google Scholar] [CrossRef]
- Davis, D.; Therkelsen, P.; Littlejohn, D.; Cheng, R. Effects of hydrogen on the thermo-acoustics coupling mechanisms of low-swirl injector flames in a model gas turbine combustor. Proc. Combust. Inst. 2013, 34, 3135–3143. [Google Scholar] [CrossRef]
- Yilmaz, I.; Ratner, A.; Ilbas, M.; Huang, Y. Experimental investigation of thermoacoustic coupling using blended hydrogen–methane fuels in a low swirl burner. Int. J. Hydrog. Energy 2010, 35, 329–336. [Google Scholar] [CrossRef]
- Kee, R.; Rupley, F.; Miller, J. CHEMKIN-PRO 15112; Reaction Design: San Diego, CA, USA, 2011. [Google Scholar]
- Smith, G.P.; Golden, D.M.; Frenklach, M.; Moriarty, N.W.; Eiteneer, B.; Goldenberg, M.; Bowman, C.T.; Hanson, R.K.; Song, S.; Gardiner, W.C., Jr. GRI-Mech 3.0. 1999. Available online: http://combustion.berkeley.edu/gri-mech/ (accessed on 22 August 2017).
- Sayad, P.; Schönborn, A.; Li, M.; Klingmann, J. Visualization of different flashback mechanisms for H2/CH4 mixtures in a variable-swirl burner. J. Eng. Gas Turbines Power 2015, 137, 031507. [Google Scholar] [CrossRef]
- Lumley, J.L. The structure of inhomogeneous turbulent flows. Atmos. Turbul. Radio Wave Propag. 1967, 166–178. [Google Scholar]
- Cavar, D.; Meyer, K.E. LES of turbulent jet in cross flow: Part 2—POD analysis and identification of coherent structures. Int. J. Heat Fluid Flow 2012, 36, 35–46. [Google Scholar] [CrossRef]
- Roux, A.; Gicquel, L.; Sommerer, Y.; Poinsot, T. Large eddy simulation of mean and oscillating flow in a side-dump ramjet combustor. Combust. Flame 2008, 152, 154–176. [Google Scholar] [CrossRef]
- Holmes, P. Turbulence, Coherent Structures, Dynamical Systems and Symmetry; Cambridge University Press: Cambridge, UK, 2012. [Google Scholar]
- Sirovich, L. Turbulence and the dynamics of coherent structures. I. Coherent structures. Q. Appl. Math. 1987, 45, 561–571. [Google Scholar] [CrossRef]
- Driscoll, J.; Temme, J. Role of swirl in flame stabilization. In Proceedings of the 49th AIAA Aerospace Sciences Meeting including the New Horizons Forum and Aerospace Exposition, Orlando, FL, USA, 4–7 January 2011. [Google Scholar]
- Syred, N.; Beer, J. Combustion in swirling flows: A review. Combust. Flame 1974, 23, 143–201. [Google Scholar] [CrossRef]
- Weigand, P.; Meier, W.; Duan, X.; Stricker, W.; Aigner, M. Investigations of swirl flames in a gas turbine model combustor: I. Flow field, structures, temperature, and species distributions. Combust. Flame 2006, 144, 205–224. [Google Scholar] [CrossRef]
- Hardalupas, Y.; Orain, M. Local measurements of the time-dependent heat release rate and equivalence ratio using chemiluminescent emission from a flame. Combust. Flame 2004, 139, 188–207. [Google Scholar] [CrossRef]
- Huang, Y.; Yang, V. Dynamics and stability of lean-premixed swirl-stabilized combustion. Prog. Energy Combust. Sci. 2009, 35, 293–364. [Google Scholar] [CrossRef]
- Syred, N. A review of oscillation mechanisms and the role of the precessing vortex core (PVC) in swirl combustion systems. Prog. Energy Combust. Sci. 2006, 32, 93–161. [Google Scholar] [CrossRef]
- Berkooz, G.; Holmes, P.; Lumley, J.L. The proper orthogonal decomposition in the analysis of turbulent flows. Annu. Rev. Fluid Mech. 1993, 25, 539–575. [Google Scholar] [CrossRef]
- Chen, H.; Reuss, D.L.; Sick, V. On the use and interpretation of proper orthogonal decomposition of in-cylinder engine flows. Meas. Sci. Technol. 2012, 23, 085302. [Google Scholar] [CrossRef]
- Oberleithner, K.; Sieber, M.; Nayeri, C.; Paschereit, C.; Petz, C.; Hege, H.-C.; Noack, B.; Wygnanski, I. Three-dimensional coherent structures in a swirling jet undergoing vortex breakdown: Stability analysis and empirical mode construction. J. Fluid Mech. 2011, 679, 383–414. [Google Scholar] [CrossRef]
- Stöhr, M.; Sadanandan, R.; Meier, W. Phase-resolved characterization of vortex–flame interaction in a turbulent swirl flame. Exp. Fluids 2011, 51, 1153–1167. [Google Scholar] [CrossRef] [Green Version]
- Galley, D.; Ducruix, S.; Lacas, F.; Veynante, D. Mixing and stabilization study of a partially premixed swirling flame using laser induced fluorescence. Combust. Flame 2011, 158, 155–171. [Google Scholar] [CrossRef]
- Kuenne, G.; Ketelheun, A.; Janicka, J. LES modeling of premixed combustion using a thickened flame approach coupled with FGM tabulated chemistry. Combust. Flame 2011, 158, 1750–1767. [Google Scholar] [CrossRef]
- Roux, S.; Lartigue, G.; Poinsot, T.; Meier, U.; Bérat, C. Studies of mean and unsteady flow in a swirled combustor using experiments, acoustic analysis, and large eddy simulations. Combust. Flame 2005, 141, 40–54. [Google Scholar] [CrossRef]
- Giauque, A.; Selle, L.; Gicquel, L.; Poinsot, T.; Buechner, H.; Kaufmann, P.; Krebs, W. System identification of a large-scale swirled partially premixed combustor using LES and measurements. J. Turbul. 2005, 6, N21. [Google Scholar] [CrossRef]
- Boxx, I.; Arndt, C.M.; Carter, C.D.; Meier, W. High-speed laser diagnostics for the study of flame dynamics in a lean premixed gas turbine model combustor. Exp. Fluids 2012, 52, 555–567. [Google Scholar] [CrossRef] [Green Version]
- Terhaar, S.; Oberleithner, K.; Paschereit, C.O. Impact of steam-dilution on the flame shape and coherent structures in swirl-stabilized combustors. Combust. Sci. Technol. 2014, 186, 889–911. [Google Scholar] [CrossRef]
Figure 1.
Experimental setup and device connection.
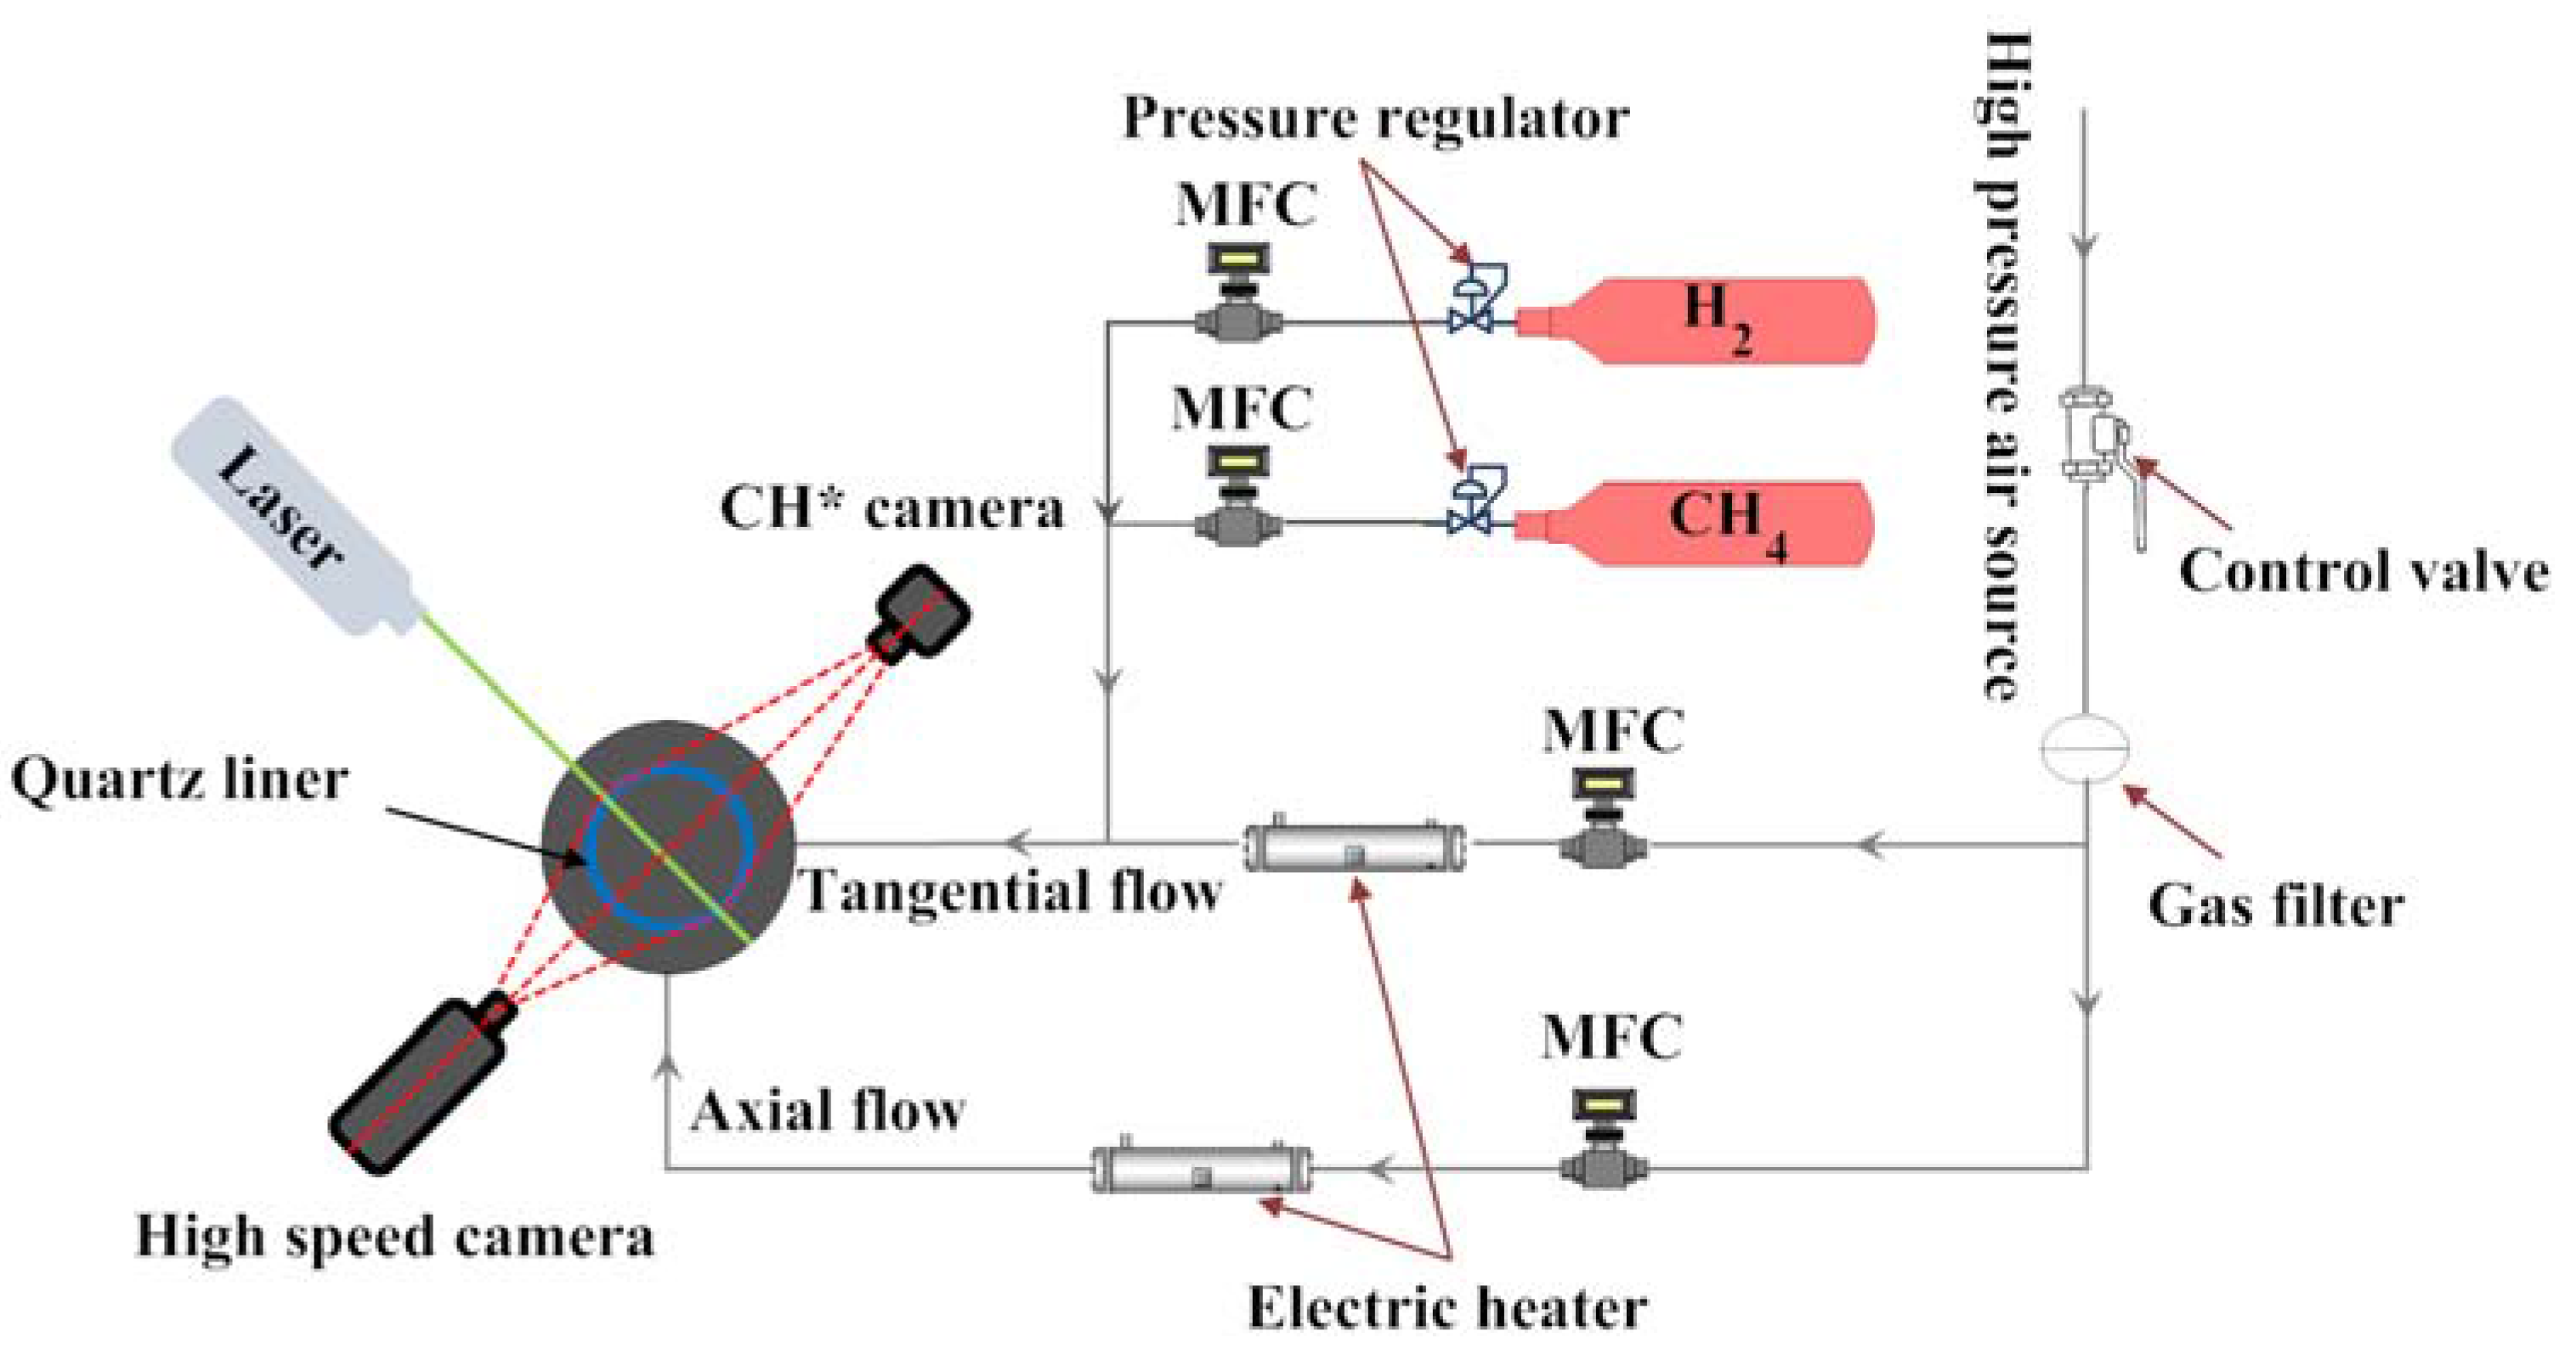
Figure 2.
Schematic diagram of the swirl-stabilized combustor with optical access and swirler cross-section.
Figure 2.
Schematic diagram of the swirl-stabilized combustor with optical access and swirler cross-section.
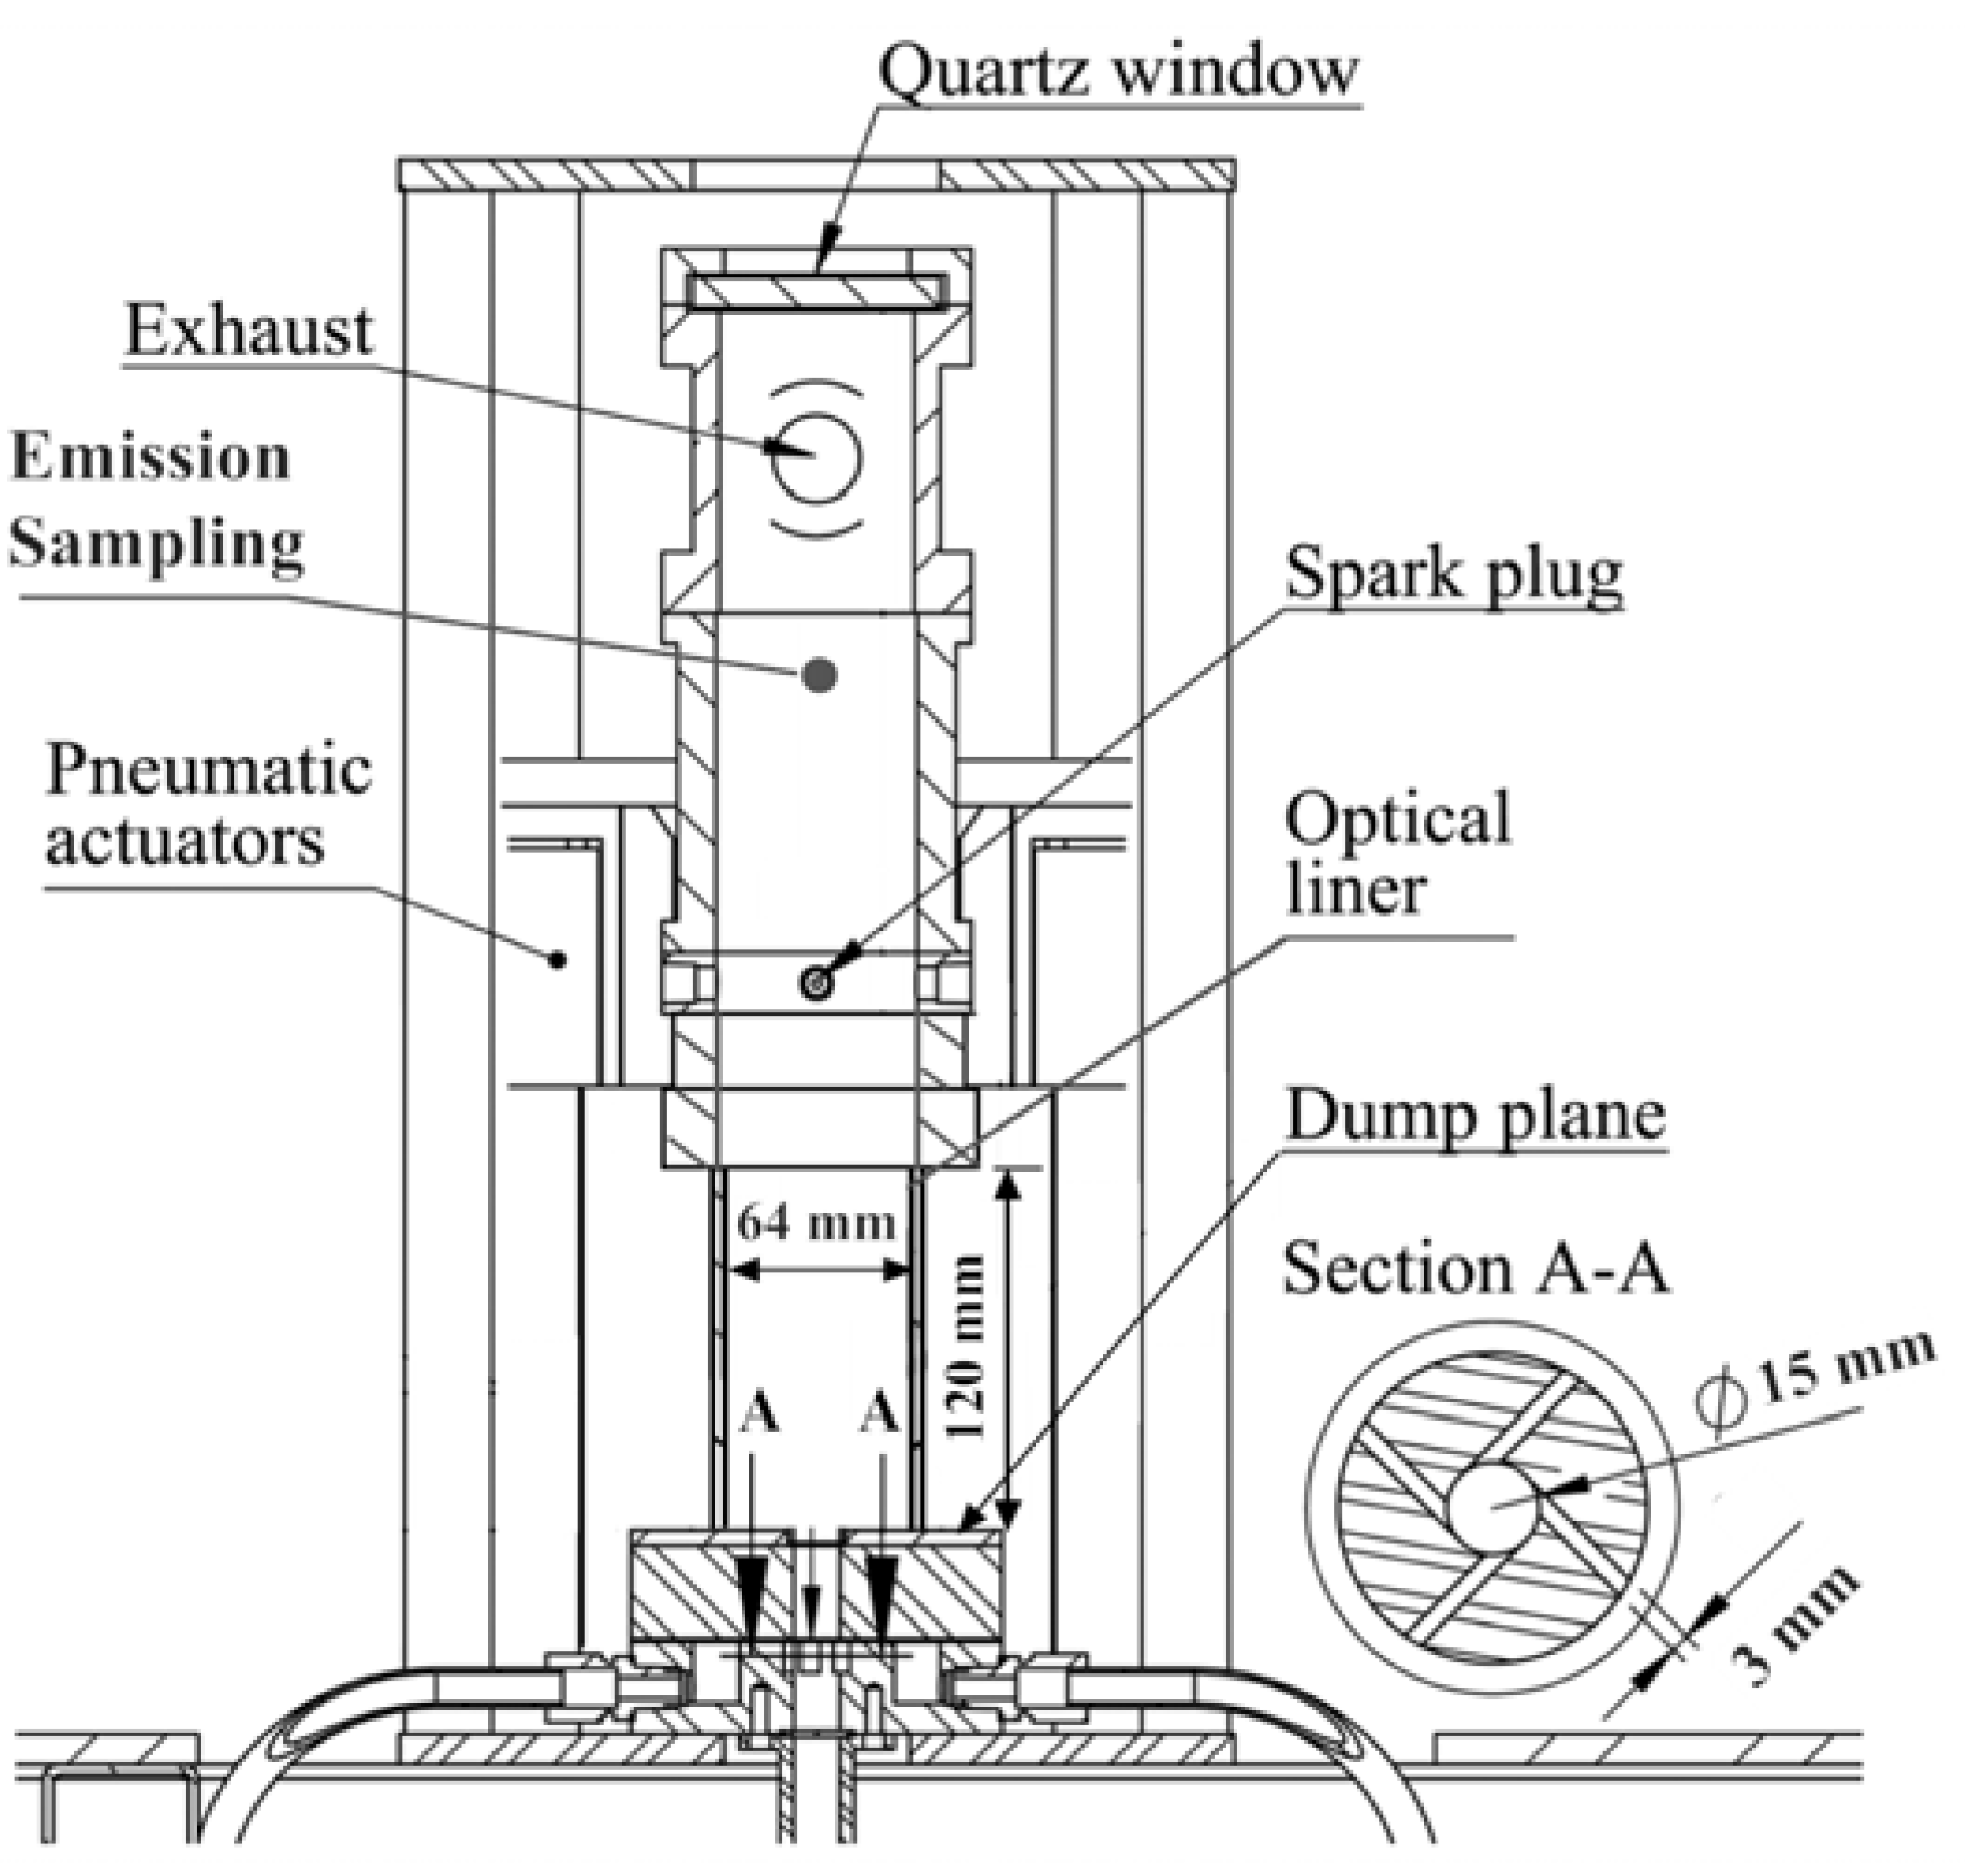
Figure 3.
The dependency of lean blowout (LBO) limits on H2 molar fraction at combustor inlet temperature 484 K and 384 K.
Figure 3.
The dependency of lean blowout (LBO) limits on H2 molar fraction at combustor inlet temperature 484 K and 384 K.

Figure 4.
CH chemiluminescence depicts the variation of flame shapes and anchored locations with 0%, 25%, and 50% H2 molar fractions in the fuel mixtures at three equivalence ratios. The combustor inlet temperature is 484 K.
Figure 4.
CH chemiluminescence depicts the variation of flame shapes and anchored locations with 0%, 25%, and 50% H2 molar fractions in the fuel mixtures at three equivalence ratios. The combustor inlet temperature is 484 K.

Figure 5.
Particle image velocimetry (PIV) measurements results indicated the combustor inlet temperature influence on the non-reacting flow field obtained by averaging 2000 instantaneous velocity vector field. The velocity vector was represented by the arrow and the axial velocity component was represented by the contour plot. Radial profiles of axial velocity were shown at y/d = 1.3, 2.7, 5.3. Flow direction is from bottom to top.

Figure 6.
Effects of H2 addition and equivalence ratio on flow field and flame features. (a1–a4) shows the flow field, arrows represent the velocity vector and contour plot indicates the axial velocity component; (b1–b4) shows the CH distribution after using the inverse Abel transform. Flow direction is from bottom to top.
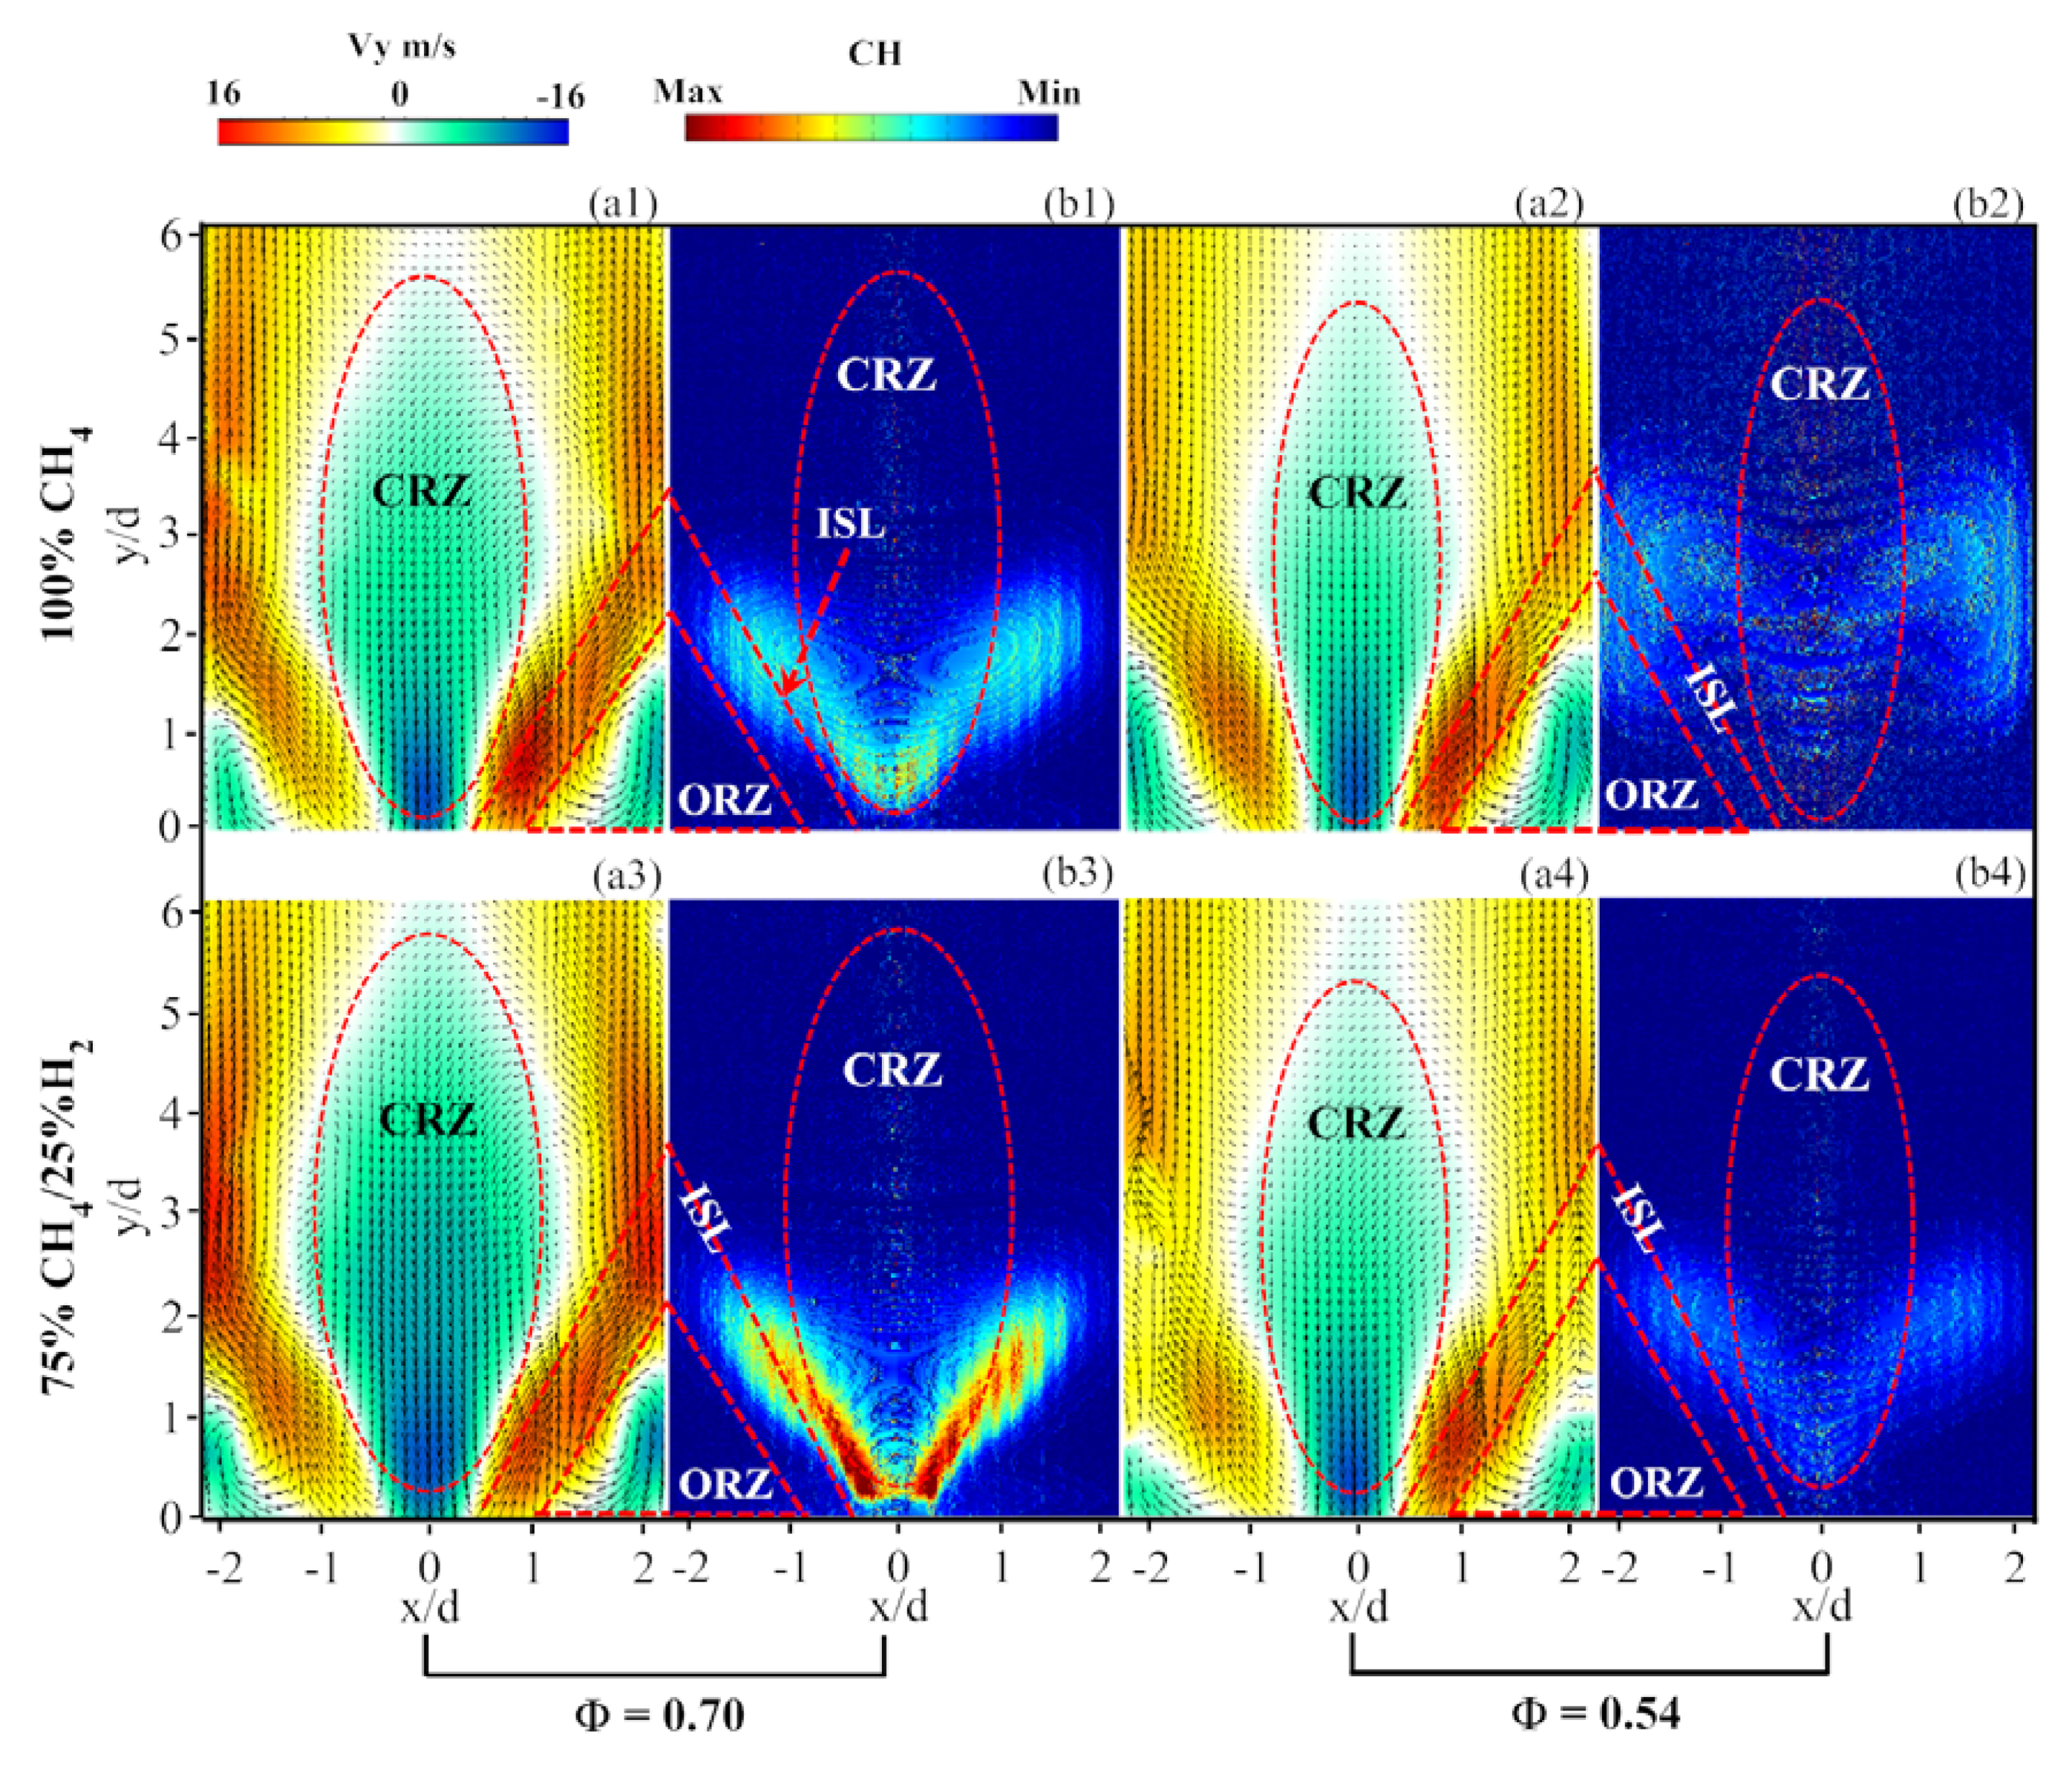
Figure 7.
Instantaneous velocity field at reacting condition with equivalence ratio 0.7 (non-consecutive). The color of streamlines represents the absolute value of local velocity. Flow direction is from bottom to top.
Figure 7.
Instantaneous velocity field at reacting condition with equivalence ratio 0.7 (non-consecutive). The color of streamlines represents the absolute value of local velocity. Flow direction is from bottom to top.

Figure 8.
Energy distribution in the first 100 modes. (a) non-reacting flow with combustor inlet temperature 384 K; (b) non-reacting flow with combustor inlet temperature 484 K; and, (c) combustion with 25% H2 addition at Φ = 0.7 and combustor inlet temperature 484 K.
Figure 8.
Energy distribution in the first 100 modes. (a) non-reacting flow with combustor inlet temperature 384 K; (b) non-reacting flow with combustor inlet temperature 484 K; and, (c) combustion with 25% H2 addition at Φ = 0.7 and combustor inlet temperature 484 K.

Figure 9.
The first two spatial proper orthogonal decomposition (POD) modes show similar structures. (a1,b1) represent non-reacting flow with combustor inlet temperature 384 K; (a2,b2) represent non-reacting flow with combustor inlet temperature 484 K; (a3,b3) represent the combustion with 25% H2 addition at Φ = 0.7 and combustor inlet temperature 484 K.

Figure 10.
Temporal characteristics of the first two POD modes. (a1,b1,c1) shows the non-reacting flow and (a2,b2,c2) shows the reacting flow with 25% H2 addition at Φ = 0.7. The combustor inlet temperature for both cases is 484 K.
Figure 10.
Temporal characteristics of the first two POD modes. (a1,b1,c1) shows the non-reacting flow and (a2,b2,c2) shows the reacting flow with 25% H2 addition at Φ = 0.7. The combustor inlet temperature for both cases is 484 K.
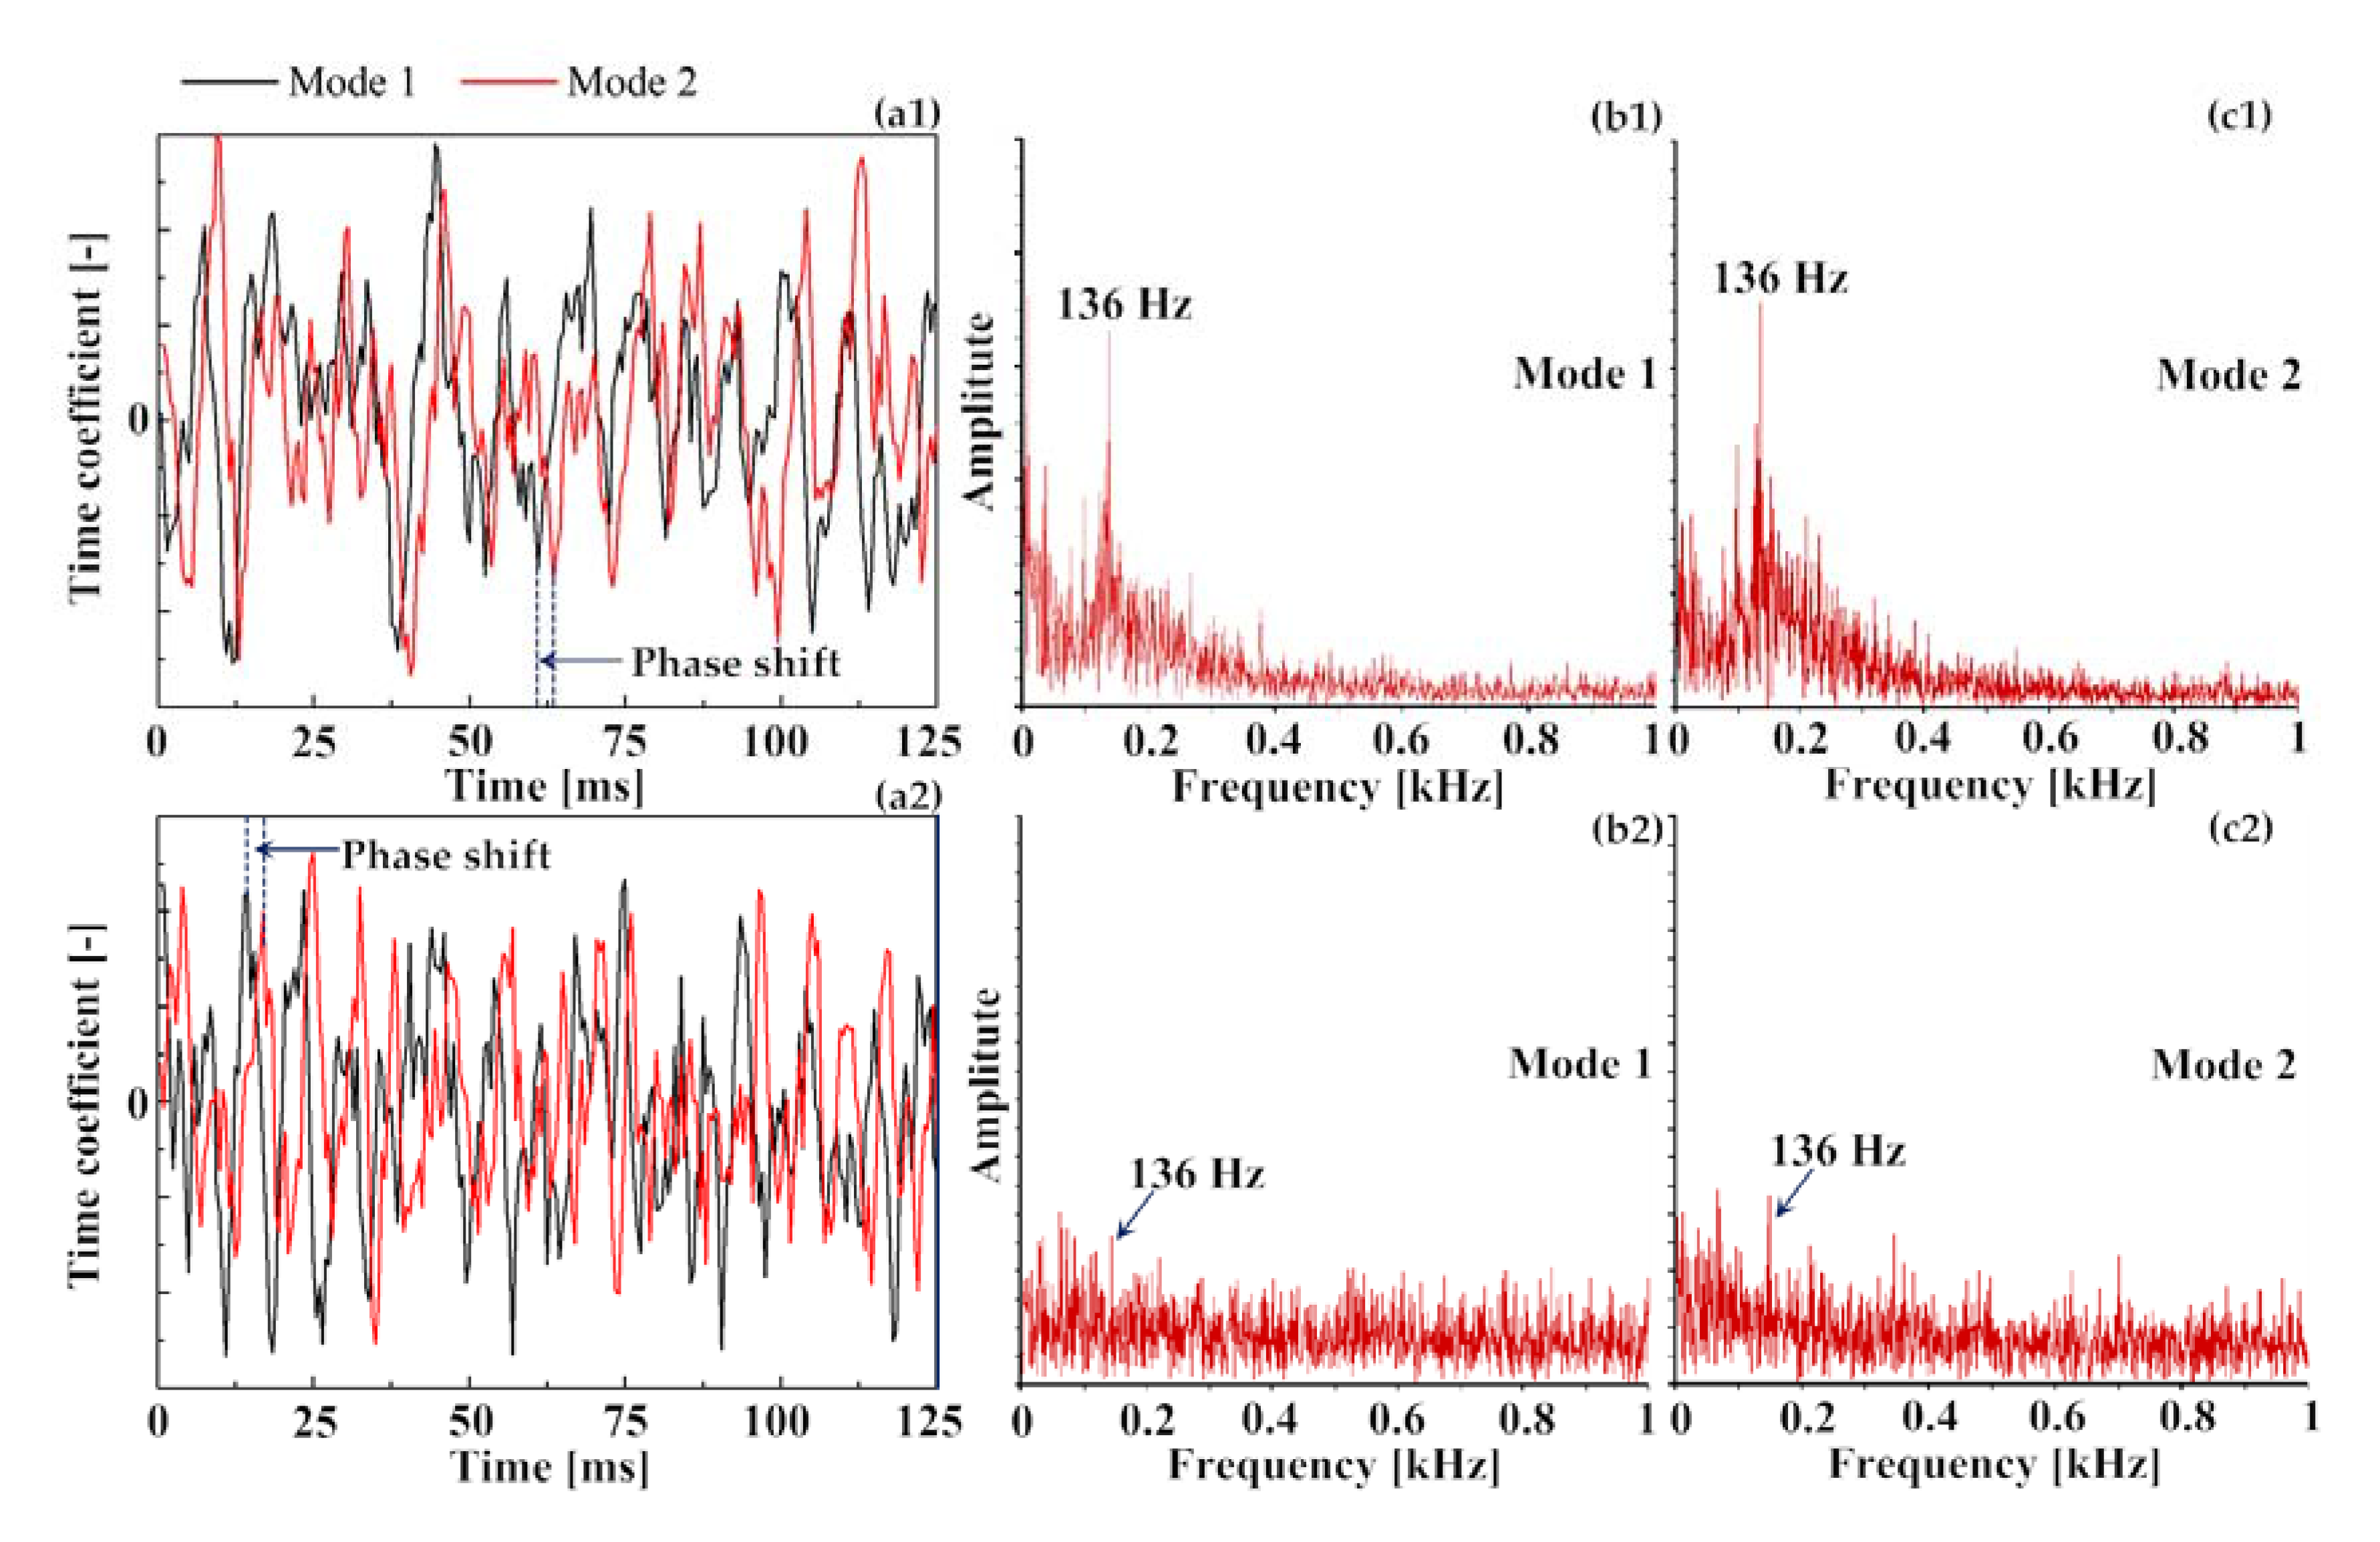
Figure 11.
Identification of the strong oscillation based on the fast Fourier transform (FFT) analysis for the first two POD modes. The first row shows the flame of methane, and the second row shows the methane flame with 25% H2 addition.
Figure 11.
Identification of the strong oscillation based on the fast Fourier transform (FFT) analysis for the first two POD modes. The first row shows the flame of methane, and the second row shows the methane flame with 25% H2 addition.

Figure 12.
H2 addition effects on CO emission. (a1,b1) at combustor inlet temperature 384 K; (a2,b2) at combustor inlet temperature 484 K.
Figure 12.
H2 addition effects on CO emission. (a1,b1) at combustor inlet temperature 384 K; (a2,b2) at combustor inlet temperature 484 K.

Figure 13.
The dependency of CO emission on the flame temperature. (a1,b1) at combustor inlet temperature 484 K, (a2,b2) at combustor inlet temperature 384 K.
Figure 13.
The dependency of CO emission on the flame temperature. (a1,b1) at combustor inlet temperature 484 K, (a2,b2) at combustor inlet temperature 384 K.


Table 1.
Operation conditions for experimental measurements.
| Items | Units | Operating Parameter | Uncertainty |
|---|---|---|---|
| Fuel | - | CH4/H2 blends | - |
| H2 molar fraction | - | 0–50% | - |
| Air flow rate | g/s | 2.96 | ±0.02 |
| Equivalence ratio | - | 1–LBO (lean blowout) limits | 0.01 |
| Swirl number | - | 0.58 | ±0.01 |
| Preheated temperature | K | 384/484 | ±2 |
Table 2.
PIV (particle image velocimetry) setup parameters.
| PIV System | Lavision |
|---|---|
| Camera | Phantom V611 |
| Recording resolution | 1280 × 800 pixels |
| Recording frequency | 2 kHz |
| Laser | ND:YLF |
| Laser sheet thickness | ≈1 mm |
| Laser wavelength | 527 nm |
| Laser pulse interval | 50 µs |
| Seeding particles | TiO2 |
© 2017 by the authors. Licensee MDPI, Basel, Switzerland. This article is an open access article distributed under the terms and conditions of the Creative Commons Attribution (CC BY) license (http://creativecommons.org/licenses/by/4.0/).
Share and Cite
MDPI and ACS Style
Li, M.; Tong, Y.; Klingmann, J.; Thern, M. Experimental Study of Hydrogen Addition Effects on a Swirl-Stabilized Methane-Air Flame. Energies 2017, 10, 1769. https://doi.org/10.3390/en10111769
AMA Style
Li M, Tong Y, Klingmann J, Thern M. Experimental Study of Hydrogen Addition Effects on a Swirl-Stabilized Methane-Air Flame. Energies. 2017; 10(11):1769. https://doi.org/10.3390/en10111769
Chicago/Turabian StyleLi, Mao, Yiheng Tong, Jens Klingmann, and Marcus Thern. 2017. "Experimental Study of Hydrogen Addition Effects on a Swirl-Stabilized Methane-Air Flame" Energies 10, no. 11: 1769. https://doi.org/10.3390/en10111769
Note that from the first issue of 2016, this journal uses article numbers instead of page numbers. See further details here.