A Review of Lithium-Air Battery Modeling Studies


1
School of Mechanical Engineering, Yeungnam University, Gyeongsan 38541, Korea
2
School of Mechanical and Materials Engineering, Washington State University, Pullman, WA 99164-2920, USA
3
Department of Electrical Engineering, Chungnam National University, Daejeon 34134, Korea
*
Author to whom correspondence should be addressed.
Energies 2017, 10(11), 1748; https://doi.org/10.3390/en10111748
Submission received: 29 September 2017
/
Revised: 26 October 2017
/
Accepted: 26 October 2017
/
Published: 1 November 2017
(This article belongs to the Section D: Energy Storage and Application)
Abstract
:Li-air batteries have attracted interest as energy storage devices due to their high energy and power density. Li-air batteries are expected to revolutionize the automobile industry (for use in electric and hybrid vehicles) and electrochemical energy storage systems by surpassing the energy capacities of conventional Li-ion batteries. However, the practical implementation of Li-air batteries is still hindered by many challenges, such as low cyclic performance and high charging voltage, resulting from oxygen transport limitations, electrolyte degradation, and the formation of irreversible reduction products. Therefore, various methodologies have been attempted to mitigate the issues causing performance degradation of Li-air batteries. Among myriad studies, theoretical and numerical modeling are powerful tools for describing and investigating the chemical reactions, reactive ion transportation, and electrical performance of batteries. Herein, we review the various multi-physics/scale models used to provide mechanistic insights into processes in Li-air batteries and relate these to overall battery performance. First, continuum-based models describing ion transport, pore blocking phenomena, and reduction product precipitation are presented. Next, atomistic modeling-based studies that provide an understanding of the reaction mechanisms in oxygen evolution reaction (OER) and oxygen reduction reaction (ORR), as well as ion–ion interactions in the electrolyte, are described.
1. Background
The highest specific energy storage achieved by state-of-the-art lithium-ion batteries is too low to meet current demands in the automotive industry [1,2]. Lithium-Air (Li-air) batteries [3,4], which are based on the chemistry of a Li metal anode and air cathode, have extremely high theoretical energy densities, as shown in Figure 1, and have been proposed as alternative systems. These batteries, if implemented in electric vehicles, will afford a driving range of greater than 550 km. However, in practice, the measured energy density of Li-air batteries is still significantly lower than theoretical values. Achieving the theoretically predicted energy densities of Li-air batteries depends, in part, on the selection of appropriate electrolytes that allow high cyclability and improve energy density without compromising safety [1]. Another critical issue in Li-air batteries is the selection of a suitable cathode structure along with catalysts to improve efficiency and cycle life. These issues, as aptly summarized in a recent review by Grande et al. [5], are related to the overall poor rate capability, high charge overvoltage, and low chemical stability of active materials, leading to a diminished cycle life and the high reactivity of metallic lithium in the anode, which poses a safety threat.
Recent articles have reviewed some of the critical challenges in the development of commercially viable Li-air cells [5] and specific issues related to cathode development [7], and presented ongoing work that aims to overcome these issues [8]. In this review article, we describe various modeling efforts, ranging from atomistic to systems-level, directed towards solving the major challenges impeding the commercialization of Li-air batteries. These efforts include the selection of specific materials for various components of Li-air batteries, characterization of cell electrochemical performance under various operating conditions, and evaluation of the dynamic electrical characteristics of battery packs. Obviously, a single approach cannot account for the complex physics that govern processes at these disparate length scales. Therefore, modeling efforts in Li-air batteries have included first-principles calculations, classical molecular simulations, thermodynamic models for cell components, physics-based models for cell performance [9,10,11], and equivalent electric circuit models [12]. For instance, issues regarding reaction kinetics, catalysis, and species transport are best addressed with atomistic simulations, while overall cell characteristics can be obtained from physics-based continuum-scale models that account for potential gradients across the cell and reaction kinetics at individual electrodes. We describe efforts in each of these categories and provide a final outlook on the modeling efforts needed in future to develop Li-air batteries that are able to meet the excellent theoretically predicted capabilities.
2. Continuum-Based Models
Unlike conventional Li-ion batteries, oxygen is used as the active cathode material in Li-air batteries. This oxygen is obtained from air, which diffuses into the electrolyte from the atmosphere and undergoes reduction at the cathode. Even though abundant oxygen can be obtained from the atmosphere, most electrolytes exhibit relatively low solubility and poor diffusivity for oxygen. These oxygen limitations are related to low specific capacity in Li-air batteries. With regard to the oxygen limitation problem, Read et al. characterized the oxygen transport properties of several organic electrolytes [13,14]. Their study presented the specific capacity of Li-air batteries of several electrolytes and related their performance to the oxygen solubility and diffusivity. They then demonstrated the oxygen limitation problem in Li-air batteries with an analytical solution using the diffusion equation for oxygen with steady-state assumption. However, more accurate transient models are required to accurately capture the complex behavior of Li-air batteries, such as changes in the concentration profile of active species, transport of oxygen/lithium ions in the electrolyte, and transient battery characteristics. Various continuum models have been proposed to account for these effects.
2.1. Microstructure of the Air Cathode
In typical continuum-based models, the cathode material is considered as porous media and the structure is represented by several parameters, such as porosity, permeability, and tortuosity. Generally, porosity is widely used to characterize porous air cathodes in Li-air batteries. In the discharge state, the porosity decreases continuously due to deposition of the reduction product (Li2O2) resulting in oxygen limitation and electric passivation. The deposition growth rate is dependent on the shape of the air cathode microstructure. Therefore, many continuum-based models that include changes in porosity have been proposed for various microstructures of cathode materials.
2.1.1. Shape of Cathode Materials
The first model of Li-air batteries was presented by assuming a cylindrical pore structure at the cathode [15]. In this model, the air cathode was assumed to have cylinder-shaped pores oriented perpendicular to the electrode (see Figure 2).
As the battery is discharged, the cylinder radius decreases due to deposition of the reduction product. Therefore, the porosity of the air cathode decreases with discharge depth and is formulated in terms of the radius as:
where ε0 and are the cathode void fraction and mean pore radius, respectively. The Tafel equation was used to describe lithium peroxide production, with the reaction mechanism only depending on oxygen concentration, as follows:
where , , cA, and ks are the molar weight, density of lithium peroxide, concentration of oxygen in the electrolyte, and overall electrochemical oxygen reduction rate coefficient, respectively. The reaction coefficient is obtained as the Tafel form:
where ks,e,0, Eo and αc are the intrinsic reaction rate coefficient, reaction activation energy, and charge transfer coefficient, respectively. The proposed model demonstrated a pore blocking problem at the air cathode leading to oxygen limitation. The results showed that lower oxygen partial pressure leads to poor battery performance, and their results are in good agreement with experimental findings (see Figure 3).
By attributing pore blockage to the poor specific capacity of the Li-air battery, Andrei et al. proposed a new approach to enhance the electric performance of Li-air batteries [16]. Through numerical simulation, they suggested that air cathodes with nonuniform catalyst distribution can improve the battery performance. They presented a more accurate electrochemical model using concentrated solution theory [17]:
where ε is the porosity, DLi,eff and are the effective diffusion constants of the Li and oxygen, respectively, CLi and are the concentrations of the lithium in electrolyte (equal to the concentration of Li+) and oxygen, respectively, t+ is the transference number, F is the Faraday constant, ILi is the electrolyte current density, κeff is the effective electric conductivity of the electrolyte, κD is the diffusional conductivity, and RC is the oxygen conversion rate. These mathematical models are widely used for battery modeling to describe species transport and potential changes in the electrolyte. Furthermore, the Butler-Volmer equation, including the effect of lithium concentration and oxygen, was employed to describe electrochemical reactions at the anode and cathode:
where β’ = 0.5, I0, and k are the symmetry coefficient, reaction parameter at the anode, and reaction rate constant at the cathode, respectively, ηa and ηc are overpotentials for the anodic and cathodic reaction, respectively, and is the normalization parameter. In their study, the reaction constant was manipulated to evaluate the effect of catalysis. For uniformly distributed catalysts, the reaction constant increases with addition of the catalyst. Otherwise, for nonuniform catalyst distribution, the reaction constant varies with position as:
where L is the cell length, Lc is the location of the cathode–separator interface, and k0 and kmax are the reaction rate coefficients at the edge of the cathode (i.e., x = L) and cathode–separator interface, respectively,. The authors suggested that additional catalyst should be introduced to the separator facing region because Li2O2 deposits mostly at the air-facing region in the cathode, resulting in pore blockage.
Figure 4 shows the results for uniformly and non-uniformly distributed catalysts. For the former (Figure 4a), although discharge voltage was significantly improved, a relatively small enhancement of specific capacity was observed. Meanwhile, for the latter (Figure 4b), a notable improvement in specific capacity was achieved. This study elucidated that suppressing the reaction rate near the oxygen-entering interface delayed the pitch-off of the oxygen conduction channel, which improved battery performance.
Albertus et al. identified capacity limitations in a Li-air batteries by modeling a cathode material with a sphere-shaped pore [9]. Furthermore, an electric passivation model based on spherical carbon particles was applied (see Figure 5).
In this study, it was assumed that the reduction reaction occurred on the deposition surface, and that the electric potential drop was induced by electrons passing across the deposited film as:
where and are the potentials of the solid and liquid phase, respectively, is the open circuit voltage, and and Rproducts are the current density and electronic resistance of the discharge product, respectively. The discharge process of a Li-air battery with a flat cathode electrode was studied to obtain a relationship between resistivity and layer thickness. In this work, an empirical relationship between film resistivity and its thickness was presented, as:
where l is the film thickness, and c1 and c2 are constants which should be determined from the experiment. Albertus et al. also investigated the relative impacts of electric passivation and oxygen limitation on battery performance, claiming that electric passivation rather than oxygen limitation reduced battery capacity in this battery system (see Figure 6). Similar results were also reported by Yoo et al. [18].
Chen et al. [19] investigated the performance of Li-air batteries with carbon nanotube (CNT) and carbon nanofiber (CNF) cathodes, where the cathode material was modeled as a cylinder. In previous models [15,16], deposition was considered to occur on the cylindrical pore region, while in the CNT work, deposition was considered to occur on the surface of the cylindrical nanotubes. In this study, a mathematical model for elucidating finite conductivity of the deposited layer on CNT and CNF was developed. At the early stage of discharge, lithium peroxide deposits on the surface of the cylindrical SWCNT/CNF (Figure 7b), while at the end of discharge, lithium peroxide fills the pores (Figure 7d), which can be assumed to be cylindrical.
To validate their proposed model, the numerical simulation was compared with experimental results for different current densities. Furthermore, the battery performance with varying conductivity was investigated, providing interesting results. The specific capacity generally decreased as the resistivity of lithium peroxide increased for a load of 1 mA/cm2. This result was in good agreement with the fact that the battery electric performance can be enhanced by improving the electric conductivity of the cathode. However, the specific capacity increased with resistivity up to ρ = 6 × 10¹² Ωcm (see Figure 8), due to the clogging delay. A large voltage drop occurred near the air surface, resulting in a lower overpotential in the region (see Figure 9). The reduced overpotential decreased the reaction rate and Li2O2 formation was diminished. Consequently, clogging of the pore near the air surface was slowed at lower conductivity and oxygen penetration into the cathode was better sustained, resulting in a higher specific capacity.
Wang et al. [20] published a detailed discussion of the oxygen limitation problems of various cathode pore shapes, including planar, cylindrical, and spherical pores (Figure 10). Different film resistor models were suggested for each cathode pore shape, and the voltage drop due to the electric passivation was modeled for each case as:
where R0 is the contact resistance between the carbon particle and deposit shell, Q is the Coulombic discharge, Mprod is the molecular weight of the discharge product, ρ is the density of the discharge product, a is the factor of effective catalyst area per unit volume when discharge product is present, A0 is the catalyst surface area factor per unit volume, n is the number of moles of electrons transferred per mole of product, and rp and rcarbon are radii of the cylindrical channel and carbon particle, respectively. In this study, the film resistor model (based on a cylindrical pore) exhibited a trend close to that observed experimentally. Nevertheless, the prediction made by the cylindrical model failed to match the experimental result. Therefore, an empirical model for electric resistance was adopted from the work of Albert [9], but modified as:
The resistance model achieved a good agreement between the prediction and experimental data at various load conditions.
In the same work [20], Wang et al. also reported the similarity between icing phenomena in PEM (proton exchange membrane) fuel cells and the precipitation behavior of discharge products in Li-air batteries (see Figure 11). It was observed that precipitation of the insoluble reduction product of Li-air batteries was similar to the icing phenomena observed in PEM fuel cells.
Similar to the icing phenomenon, Jung et al. [21] presented a deposition model describing discontinuous layers. Their study provided insightful discussion on the morphology of the reduction product at the cathode side. Most previous studies for modeling Li-air batteries were based on a solid deposition-layer model for Li2O2, which is a continuous layer. A new model for an island-like deposition layer was provided (see Figure 12).
The similarity between icing phenomena in PEM fuel cells and the island-like deposition layer on air cathodes is noteworthy. The discharge current density, deposit layer thickness, and voltage loss due to the Li2O2 layer were formulated with the deposition model as:
where iapp, M and κeff represent the applied current density and mass loading of carbon per unit volume of the cathode, and effective electric conductivity, respectively, and εDL and are the porosity and thickness of the Li2O2 deposit layer, respectively. From the numerical study, the voltage plateau in the discharge profile was clearly elucidated using the proposed model. Especially for low load conditions, the porous deposit-layer model matches the experimental results more closely than the solid deposit-layer model. It was concluded that the proposed porous deposit-layer model provided a more accurate prediction of the discharge behavior in Li-air batteries.
The aforementioned studies were focused on rigorous modeling of porosity changes to show pore clogging resulting in oxygen limitation. In contrast, Wang and Cho [22] reported the dependency of the electric performance of Li-air batteries on the structure of the air cathode by employing pore tortuosity in addition to porosity. Tortuosity was presented as an exponent term in the Bruggeman correlation, which represents the deviation of a diffusion path from straight lines in porous media. According to their model, the effective diffusivity of oxygen can be expressed as:
where ε0 and εprod are the volume fraction of insoluble precipitates and pore space, respectively, and τd is the diffusion path tortuosity. The authors studied the electric performance for different values of tortuosity using an analytical formulation for mass diffusion and electric potential drop. The study demonstrated that specific capacity decreased with increasing tortuosity due to significant oxygen limitation (see Figure 13).
Furthermore, the air cathode performance was investigated as a function of Damköhler number (Da), a ratio of the reaction rate and mass transport rate:
where is the diffusion thickness. Here, the non-dimensional Damköhler number represents the transport limitation of reactive species. In this study, Li-air batteries were observed to have different capacities with the same Da number for different tortuosities (see Figure 14).
Therefore, it was concluded that tortuosity and porosity should be considered together for continuum modeling of the air cathode.
2.1.2. Size of Cathode Materials
Although several studies have discussed the dependency of battery performance on pore and particle shapes, the effect of pore size has not been considered in continuum modeling. In reality, the air cathode has various pore sizes, with the pore size distribution depending on the type of cathode material. Motivated by this limitation, Xue et al. first proposed a continuum model of Li-air batteries considering the cathode pore size distribution [23]. In this model, the effective area, considering electron tunneling limitations, was defined using pore size distribution as:
where and are the thickness of the Li2O2 layer and the effective specific surface area without considering electron tunneling limitations, respectively. In their study, the pore size distribution was obtained for two types of air cathode materials, namely Super P and Ketjen Black. Ketjen Black is known as a porous carbon with micropores (~10 nm), while Super P contains mesopores (2–50 nm) (see Figure 15).
Furthermore, the same research group extended the electron tunneling model to a comprehensive mathematical model for a general case where both surface thin film growth and solution phase reactions coexist [11]. They introduced an escape parameter, which represents pore connectivity, by considering the pore network, and reported that the film growth was highly dependent on the escape parameter. In their study, two mechanisms for reduction product formation were suggested:
The reduction of oxygen depends on escaping from the Nth small pore to the ‘Hall’ where the reaction of particle formation occurs, as shown in Figure 16.
The escape parameter () was proposed as a function of escape probability () and pore radius () as:
By introducing the escape parameter, the amount of reduced oxygen resulting in film and particle formation can be written as:
and the overall reaction for Li2O2 formation can be expressed as:
It is important to note that the stoichiometry coefficient is a function of the escape parameter. In this study, it was proposed that the escape parameter varied with electrolyte type and battery performance was investigated with two distinct electrolytes, namely tetraethylene glycol dimethyl ether (TEGDME) and dimethyl sulfoxide (DMSO). The simulation results showed a much larger resistance for DMSO than TEGDME, which was attributed to high electrolyte resistance and viscosity, resulting in a low escape parameter in TEGDME (see Figure 17).
Li introduced a continuum model for Li-air batteries that considered the contribution of pore size to the discharge capacity of the battery [24]. In the study, it was assumed that there is a critical pore size, because too-small pores cannot hold reactants. Similar to the previous study, the effective reaction area (Aeff) was formulated using a probability distribution function (PDF) of pore size as:
where dmin is the critical pore size, is the thickness of the Li2O2 layer, μ is the mean pore size, and σ is the shape factor. Using this model, the battery performance was investigated with varying mean pore size. As shown in Figure 18, a higher specific capacity was obtained from cathodes with a smaller mean pore. However, a lower specific capacity was observed when the mean pore was too small (10 nm). These simulation results demonstrated that pores smaller than the critical size cannot contribute to the discharge capacity.
2.2. Aqueous Electrolyte
As discussed in the previous section, Li-air batteries suffer from oxygen limitation problems resulting from pore clogging. This problem can be circumvented by running a Li-air battery with aqueous electrolyte because the reduction product (Li-OH) is soluble in the electrolyte [25]. However, the moisture in aqueous electrolytes introduces a parasitic reaction with Li-metal, preventing the desired performance of the Li-air battery being achieved [26]. Therefore, to avoid the undesirable reaction of Li and moisture, a hybrid Li-air battery consisting of Li-metal/non-aqueous electrolyte/Li-conductive membrane/aqueous electrolyte has been proposed (see Figure 19) [27].
Andrei et al. first addressed the continuum model for dual electrolyte systems in Li-air batteries [28]. This Li-air battery consists of an organic electrolyte at the anode and an aqueous electrolyte at the cathode (see the modeling domain in Figure 20).
As shown in Figure 20, oxygen diffuses into the porous cathode filled with aqueous electrolyte, while Li ions diffuse from the anode to the cathode through the organic electrolyte, lithium conductive separator, and the aqueous electrolyte. The chemical reaction in a Li-air battery with aqueous electrolyte can be summarized as:
Furthermore, saturation of the reduction product (LiOH·H2O) was mathematically modeled at the cathode as follows:
where RC is the oxygen conversion rate, Ms and ρs are the molecular weight and mass density of deposited (LiOH·H2O), respectively, and cLi,sat is the solubility of LiOH in water. Similar to the previous study on Li-air batteries with non-aqueous electrolyte [16], the pore shape at the cathode was considered to be a hollow cylinder and deposition of the reduction product filled the pore, reducing the cylinder radius. This study demonstrated that the cathode maintained porosity until precipitation occurred, with a clear discharge plateau observed in the early discharge state, as shown in Figure 21.
Horstmann et al. presented interesting results with a continuum model accounting for sedimentation of the reduction product in an aqueous electrolyte [29].
In their study, it was assumed that sedimentation of dust particles due to precipitation occurred mainly in the separator region (see Figure 22) and precipitation kinetics were adopted for the nucleation and growth of lithium hydroxide monohydrate (LiOH·H2O). The precipitation depends on the number of nucleation sites, and the rate of nucleation of critical nuclei is estimated as:
where D0 is the self-diffusion coefficient of Li+, aD is the length scale of LiOHaq, Z is the Zeldovitch factor, N0 is the number of nucleation sites, and ΔGcrit is the critical nucleus formation energy. From the nucleation kinetics, they proposed formulations for the area () supporting the nucleus, the volume fraction of the column-shaped crystal on the surface (εcryst) in the cell, and the volume fraction of the crystal reservoir (εres) at the bottom of the cell bottom as:
where rcrit is the critical radius of the nucleus, is the molar volume of the crystal phase, f is the size distribution of the LiOH·H2O nucleus, τ is the typical time for the decay process in sedimentation, is the reaction rate of nucleation, and εcryst and εres are the volume fractions of column-shaped crystals on the surface and crystal reservoir at the bottom of the cell.
From parametric studies, it was found that competitive specific energy was only achieved when the reduction product was allowed to precipitate (Figure 23). Furthermore, changes in battery performance were investigated with varying numbers of nucleation sites in the separator region. It was observed that homogenous precipitation in the electrolyte maximized the capacity of the Li-air battery using aqueous electrolyte. The advantage of external forces (stirring) in homogenizing sedimentation of the reduction product was also demonstrated (see Figure 23).
Nimon et al. [30] also demonstrated changes in the porous structure with undischarged, partially discharged, and fully discharged KB carbon-based air cathodes by considering the precipitation kinetics of the reduction product in a nonaqueous electrolyte system. In this study, the rate of precipitation of the reduction product was formulated using the Heaviside step function (H) as:
where , , and are the reaction product concentration, the solubility limit of Li2O2 in the free electrolyte, and the solubility limit of Li2O2 taking into consideration of the Kelvin equation, respectively. The deposition of solid discharge product reportedly occurred within small mesopores with radii of up to 10 nm (experimental finding, see Figure 24). Furthermore, theoretical discharge data, calculated from the proposed mathematical model using the minimum pore radius, were compared with experiment results and showed good agreement.
2.3. Modeling of Cycle Performance
One of the significant characteristics of rechargeable batteries is their cyclic performance, which is a major factor in evaluating the performance of Li-air batteries [31]. Unfortunately, it has been reported that Li-air batteries have high oxygen evolution reaction (OER) potentials, resulting in the irreversible formation of reduction products and electrolyte degradation [32]. Therefore, a crucial concern in advancing the performance of the Li-air battery is reducing the charging voltage, because the electrolyte might degrade at a high charge voltage [33]. To alleviate this problem, new composite materials for cathodes and novel electrolytes with additives have been proposed [34,35,36].
Motivated by this requirement, several models that predict the charge behavior and cyclic performance of Li-air batteries have been proposed. For instance, Sahapatsombut et al. presented the cyclic behavior of Li-air batteries obtained using a multiscale model [10]. To describe discharge and charge reactions, the reaction rates at the anode and cathode were expressed in the Butler–Volmer form as:
where i0 is the exchange current density for the anode, ηa is the surface overpotential for reaction at the anode, ja and jc are the local transfer current densities between the electrode and electrolyte interface at the anode and cathode, respectively, ci,s is the molar concentration of species i at the wall or surface of the electrode, ka and kc are the anodic and cathodic rate constant, respectively, and β is the symmetry factor, which is equal to 0.5. In their study, the carbon electrode was assumed to be a spherical particle and lithium peroxide deposition was modeled on the surface (see Figure 25). The authors considered that the lithium ion and oxygen diffuse through the Li2O2 layer for the reduction reaction because Li2O2 is an insulating material resulting in electric isolation. Like previous studies, their simulation results suggested that an improved specific capacity can be obtained for the Li-air cell with a high oxygen solubility/diffusivity, high cathode porosity, and thinner cathode during the discharge state. However, in contrast to previous studies, it was reported that less specific capacity was obtained with a higher reduction rate constant (Figure 26). In their study, they argued that the carbon porosity was modified by reaction with the catalyst during preparation. As a result, some of the closed micropores were opened, giving the discharge products greater access, and some open pores were widened. Furthermore, the study modeled the charging behavior of Li-air batteries. The authors reported that the charging voltage decreased with an increasing solubility limit of lithium peroxide, and that this improvement was attributed to better surface oxidation reaction kinetics.
In addition to this study, an advanced continuum model considering electrolyte degradation by CO2 in the Li-air battery was proposed by the same research group [37]. In their advanced model, two major reactions were introduced, namely electrolyte degradation and Li2CO3 formation. The electrolyte decomposes to CO2, H2O, HCO2Li and CH3CO2Li with O2·Li2CO3 formation occurring through electrochemical reduction of CO2 resulting from electrolyte degradation. The major reactions can be summarized as follows:
Mechanism 1:
Mechanism 2:
Solvent degradation:
The repeated deposition of a film, resulting from lithium salts (Li2CO3), over the carbon surface after each discharge–charge cycle hinders reactive species transport and the electrochemical reaction. Finally, irreversible products diminish the electric conductivity of the air cathode electrode and reduce the lithium ion concentration, leading to cell voltage loss. They demonstrated that the capacity loss was significantly higher in the presence of the degradation mechanism, which is in good agreement with the experimental findings (see Figure 27).
The computational results indicated that the performance of Li-air batteries can be improved by increasing the oxygen concentration while reducing other reactive species resulting from side reactions in the electrolyte. The researchers noted that this could be achieved by employing an oxygen-selective membrane at the air-facing cathode [38], as shown in Figure 28.
A microhomogeneous model was developed to evaluate the impact of replacing pure oxygen with ambient air. Similar to the group’s previous model (Sahapatsombut et al. [37]), a comprehensive reaction mechanism involving electrolyte degradation and Li2CO3 formation was applied. Furthermore, a Li-air battery employing silicon oil as an oxygen-selective liquid membrane was modeled. The oxygen transport mechanism across the membrane by diffusion was described. The oxygen concentration in the downstream (after pass membrane) was obtained by equating gas diffusion and species permeation, as:
where Ni,m is the diffusion flux of gas through the membrane, Di,m is the diffusion coefficient in the membrane medium, ci and ci,m are the concentrations of the gas on upstream (air side) and downstream (after passing the membrane), respectively, l is the thickness of the membrane, is the permeation flow rate of gas i (mol/s), Am is the membrane surface area (m2), and is the partial pressure differential of gas i (Pa). Battery performance was investigated using the proposed model, and an improved specific capacity was observed for the Li-air battery employing an oxygen-selective membrane with respect to the air breathing case, as shown in Figure 29.
2.4. IL-Based Electrolyte
Ionic liquids (ILs) have received much attention as promising solvents for synthesizing novel electrolytes for rechargeable batteries as they are thermally and chemically stable. The superior characteristics of ILs can potentially lead to large enhancements in cyclability [39], and efforts have been made toward using ILs in Li batteries [40,41]. Several experimental studies have demonstrated the feasibility of IL electrolytes in Li-air batteries [42,43]. However, experiments showed that batteries using ILs as electrolyte can primarily be operated at low load current densities due to the low mobility of reactive species, resulting in an inferior rate capability. To study the transport phenomena of reactive species in Li-batteries, Yoo et al. presented an electrochemical model for IL electrolytes in lithium batteries [39]. In their study, a new mathematical model for the transport of lithium ions in IL electrolytes was derived.
It is important to note that all previous continuum models were based on organic electrolytes/solvent. Conventional organic electrolyte/solvent systems (such as propylene carbonate) are binary systems consisting of a cation, anion, and neutral species. In contrast, IL electrolytes are ternary systems consisting of three different ions. Table 1 shows the differences between organic and IL electrolytes.
To investigate the ternary system, Kisoo et al. proposed a rigorous mathematical model for lithium transport in IL-based electrolytes, as:
where D is the Maxwell-Stefan diffusivity and subscripts 1, 2, and 3 correspond to Li, cation, and anion, respectively. The Maxwell-Stefan diffusivities were obtained from molecular dynamics (MD) simulations by calculating the Onsager formulation. The authors identified a lithium transport limitation problem resulting from strong ion–ion interactions in the IL electrolyte (see Figure 30).
Furthermore, the same research group used their continuum model to study Li-air batteries with IL electrolytes, presenting interesting characteristics of IL electrolytes [44]. For instance, in IL electrolytes, oxygen solubility and diffusivity increase with temperature, which contrasts the thermal behavior of other liquid electrolytes (see Table 2).
The authors reported a substantial improvement in electrical performance in the Li-air battery with increasing operating temperature, as shown in Figure 31.
2.5. Two-Dimensional (2-D) Modeling
One-dimensional models have been used to study performance behavior in Li-air batteries focusing on species transport phenomena (Li+ and oxygen) mainly from the anode to cathode, or from the gas diffusion layer to the cathode. However, interesting effects, such as the contribution of the ratio of open area at the air-facing side and active flow systems, can only be observed by two-dimensional analysis. Li and Fargri [45] proposed a two-dimensional model for Li-air batteries to study the oxygen limitation problem. In their work, the 2-D distribution of the volume fraction of , the principal reduction product in the electrode, was illustrated.
It was found that effective porosity decreased faster closer to the air side (see Figure 32). To circumvent the pore clogging problem, nonuniform distribution of effective porosity was suggested in the air inlet side for better electric performance. Furthermore, the effect of cathode open ratios (air inlet/Rib) was systematically studied using 2D analysis. The maximum capacity was reported to sharply decrease when the cathode open ratio, the ratio of open area to total cathode surface area facing the atmosphere, decreased from 100% to 50%. These results can be obtained only by 2D analysis.
Furthermore, the research group provided interesting 2-D analysis combining fluid flow at the cathode side. Most Li-air batteries have lower specific capacities than the theoretical value due to non-uniform distribution of Li2O2 deposition, which results in pore clogging. To solve this problem, Li et al. proposed an active air cathode with recirculating oxygen to reach the electrolyte, which is similar to a flow battery [46]. A schematic of such an active Li-oxygen battery system is shown in Figure 33.
In their study, a continuum model involving internal convection in the air cathode was developed for the Li-air/oxygen battery. A considerable improvement in battery performance with the active air cathode was reported (see Figure 34). Although biased deposition of the reduction product was alleviated by employing the active air cathode, non-uniform utilization of the air cathode was still observed. Therefore, non-uniform porosity was suggested and a higher specific capacity was achieved with the air cathode having a higher porosity near the air inlet and outlet (see Figure 35).
Furthermore, the study was extended to a more realistic cathode considering two different layers of materials. Similar to the previous study, a higher specific capacity was observed with a dual layer cathode contributing to the electrode utilization [47]. While continuum-scale models, such as the ones presented here, are able to determine the performance of Li-air batteries, often times these models are reliant on parameters that are not easily available from experimental measurements. Furthermore, these models are not able to address microscale and discontinuous phenomena such as dendrite growth. These issues can be addressed by various mesoscale models, such as the phase-field model. Phase-field models have been particularly effective in modeling dendritic growth [48,49] and particle growth and coarsening during discharge [50]. Wherever atomistic scale details, reaction chemistry or electronic properties are required, atomistic simulation methods based on DFT and MD are effective. Efforts using these models are described in the section below.
3. Atomistic and Molecular Models
In this section, we describe various atomistic and molecular modeling efforts, based on first principles as well as classical approach, which have been directed towards solving the major challenges that impede the commercialization of Li-air batteries. These efforts can largely be categorized as ones that address the selection of appropriate electrolyte, ones that are directed towards understanding the mechanism and rates of OER and oxygen reduction reaction (ORR) in presence of catalysts and ones that investigate the formation and transport properties of lithium oxides. We describe efforts in each of these categories and identify key processes that are needed to develop a Li-air battery that can meet its excellent theoretically predicted capabilities.
3.1. Developing Appropriate Electrolyte
A wide range of organic liquid based electrolytes (e.g., propylene carbonate, ethylene carbonate, and dimethyl carbonate) have been frequently employed in Li-air batteries, primarily due to their high ionic conductivity coupled with high mobility of oxygen in these aprotic electrolytes. However, the poor chemical and electrochemical stability of these electrolytes often lead to low cycle life. For instance, these electrolytes are often chemically reactive with the intermediate products and discharge products, such as the superoxide radical, in Li-air batteries. These reactions lead to gradual decomposition of the electrolytes leading to low cyclability. Another important property of electrolytes is the width of the electrochemical stability window (ESW). On the other hand, electrolytes with relatively high chemical and electrochemical stability, such as ionic liquids, have poor ionic transport properties. Therefore, it is critically important to identify electrolytes that are safe, electrochemically and chemically stable, possess high ionic conductivity and have the ability to dissolve oxygen and the lithium oxides in order to realize the theoretically predicted energy density of Li-air batteries [4]. Several theoretical studies, based on first principles calculations, have been directed towards evaluating each of these aspects in a range of electrolytes that include ionic liquids, glymes, sulfones, and nitriles.
Atomistic calculations based on first principles can correlate the molecular structure with ESWs of electrolytes and help identify novel electrolytes that are stable at high voltages, thus eliminating expensive screening processes. In a pioneering study, Ong et al. [51] calculated the electrochemical stability of various imidazolium and pyrrolidinium-based ionic liquids using a combination of density functional theory (DFT) and MD simulations. This work was followed by that of Borodin et al. [52] where they applied DFT [53] to evaluate the electrochemical stability of phosphates and carbonates. Their work determined the stability towards first and second oxidation and reduction by considering isolated solvent molecules in an implicit solvent environment.
Another approach, known as the thermodynamic cycle method [53,54], has been employed by Shao et al. [55,56] to calculate the oxidation potential of sulfone-based electrolytes and showed excellent agreement with experimental results. For instance, Borodin et al. [57] employed the free energy cycle approach to evaluate the oxidative stability of a range of carbonate, sulfone and alkyl phosphate electrolytes by determining the oxidation potential and the initial decomposition reactions. While the above-mentioned studies employed various methods to calculate the electrochemical stability of a range of electrolytes, these studies did not account for structural changes and impact of cation-anion pairing on the electrochemical stability of ILs. Recently, Kazemiabnavi et al. [58] applied the thermodynamic cycle method [54,55,59] to calculate the oxidation and reduction potentials of cations. The length of the side alkyl chain was varied from ethyl () to hexyl (). In addition to structural features of cations, this study considered different family of anions including the trifluoromethyl-based and trifluoromethanesulfonate () anions as well as the fluorinated and anions. The ESWs of a wide range of ILs were evaluated based on calculated redox potentials, as presented in Figure 36. The results demonstrated that the limits of the ESWs of the modeled ILs are based on the reduction potential of cations of the IL and the oxidation potential of the corresponding anions. ILs with anions were found to have a wider ESW. The thermodynamic cycle approach is computationally inexpensive and therefore can be employed to select IL electrolytes for specific electrodes. This information is especially pertinent to high-voltage rechargeable batteries that require electrolytes with wide ESWs.
In an effort to determine the chemical stability of commonly used ether and amide-based electrolytes against superoxide ions, Bryantsev et al. [61] used DFT calculations to study the autoxidative stability of these solvents. The study systematically evaluated the reaction pathways, including transition states, for reactions involving the superoxide radical. Furthermore, it identified factors that determine the extent of oxidative stability in order to facilitate strategies to design molecules with increased stability. The study determined that the resistance to autoxidation can be significantly improved through fluorination at the β-carbon to the ether oxygen (CF3CH2OMe) and the carbonyl side of the amide moiety. Furthermore, substitution of the reactive hydrogens via manipulation of steric constraints at the radical center by introducing steric hindrance at the reaction center, or upon involvement of ether and amide lone pairs in conjugation with the aromatic or ketonic π-system was identified as another effective route.
As mentioned earlier, the solubility and diffusivity of various chemical species, including discharge products, are important factors that determine the performance of Li-air batteries. Various atomistic simulations have tried to determine these properties and associated mechanisms. As an example, Akagi et al. [62] recently reported a detailed MD simulation-based study of the kinetics of Li+ and O2− in DMSO and EMI-TFSI electrolyte. This study evaluated the free energy for separation of Li+ and O2− in these solvents, as shown in Figure 37, and determined that the formation and decomposition rates of Li+ − O2− pairs are greater in DMSO than in EMI-TFSI. Furthermore, the simulations demonstrate that the strong structuring of EMI-TFSI around the ions is responsible for these differences, and it explains why the LiO2 clusters formed in DMSO during the battery discharge are larger than those in EMI-TFSI. In another study, Scheers et al. [63] modeled the solvation of LiO2− in various solvents such as dimethyl ether (DME), DMSO and propylene carbonate (PC) using Car-Parrinello MD simulations. The study showed that contact ion pairs LiO2− are more stable over solvent-separated ion pairs, particularly in DME and PC. The study further explored the role of additives such as tetrabutylammonium in diminishing the associations between the ions.
Motivated by the stability of undissociated solvated peroxide LiO2− , Chau et al. [64] investigated nucleophilic attacks by LiO2− on some of the popular organic electrolytes that include acetonitrile, 1-methyl-2 pyrrolidone, dimethoxyethane and DMSO. The study employed DFT to calculate activation energies for these reactions, as shown in Figure 38, and these electrolytes are susceptible to chemical instability in presence of LiO2−.
The study suggests methods to design new electrolytes that would be more stable in presence of LiO2−. One such example includes substitution of an H atom in an O–CH2 component of DME with an F atom. The activation energy for the nucleophilic attack increases from 24.8 kcal/mol to 36.2 kcal/mol. Liu et al. performed DFT calculations of the Gibbs activation energy for C–H bond scission in CH2 and CH3 groups of DME as well as various coordinated Li+-DME structures due to attached by O2− ion [65]. Their results suggest that with a higher level of coordination, the activation energies increase and therefore, for highly concentrated LiTFSI–DME electrolytes, can significantly enhance the stability of the electrolyte in Li-air batteries.
Two critical properties that impact the performance of Li-air batteries are the solubility and diffusion coefficient of oxygen in the electrolyte. Banerjee et al. [44,66] performed MD simulations to determine the solubility of oxygen in N-methyl-N-propylpyrrolidinium bis (trifluoromethane-sulfonyl) imide (mppy+TFSI−) IL. The study evaluated the solubility at a range of temperature and showed that the oxygen solubility increases with increasing temperature. Figure 39 illustrates these results. The evaluated solubility values were used as inputs to a continuum scale model developed by Yoo et al. [44]. The simulation results showed that the performance of a Li-air battery is significantly enhanced at relatively high operating temperature, due in part, to the enhanced oxygen solubility.
More recently, Foster et al. [67] employed MD simulations to determine the oxygen solubility and transport properties in common solvents in presence of various salt species at a range of concentrations. The results emphasize the role of electrolyte composition on the oxygen solubility and diffusivity. In solvents with high donor number, such as DMSO, the diffusivity of oxygen is mostly independent of salt concentration, anion choice, and oxygen partial pressure. However, in solvents with low donor number, such as TEGDME, oxygen diffusivity is influenced by salt concentration and anion choice. This effect is explained by reduced electrostatic screening in the latter class of solvents. The study further reported that the solubility of oxygen in electrolytes is impacted by both dispersion effects from dissociated ions and the electrostatic effects. The concentration of oxygen is typically decreased through salting-out, but may also be increased by salting-in at high salt concentrations. It was also shown that in the same solvent, large anions such as TFSI and BETI (bisperfluoroethylsulfonylimide) can increase oxygen concentration in comparison to smaller anions such as BF4. The calculations determined that the diffusivity of superoxide is reduced based on the size of its solvation sphere. Strong interactions with high donor number solvent molecules or the inclusion of large anions in the solvation sphere may lead to reduced O2 diffusion rates. Furthermore, high donor number solvents may improve the stability of soluble O2 and LiO2, as compared with low donor number solvents. However, this effect is diminished at high Li+ concentrations. The mobility of Li+, which determines the ionic conductivity, is an extremely important property. The calculations indicate that in Li-air batteries with electrolytes having low dissolved O2 concentrations, oxygen becomes the mass transport-limiting reactant. However, at low salt concentrations, Li+ diffusion may be limiting.
The solvation and mobility of lithium ion in liquid electrolytes play crucial roles in determining the battery performance. Various studies have investigated lithium ion mobility in electrolytes and found an inverse correlation between viscosity and lithium ion mobility. In particular, ILs have been widely investigated due to their low vapor pressure and high chemical and thermal stability that make them promising candidates as battery electrolytes. However, ILs have relatively high viscosity and therefore low ionic conductivity. A viable option of tailoring the viscosity and ionic conductivity of ILs is through the inclusion of additives. Molecular simulation methods, such as MD, directly account for interactions between the various ions and molecules and are therefore very effective in evaluating diffusivity of ions within mixed electrolytes and in establishing a correlation between the molecular structure of the additives [68] and enhancement in ionic conductivity. For instance, MD simulations of Banerjee et al. has shown that small amount of ethylene carbonate additive is extremely effective in enhancing the ionic conductivity [39] of pyrrolidinium cation based ILs. The study provided insights into the underlying mechanisms that govern lithium ion mobility. Radial distribution functions of lithium-ion with respect to the atoms of the anion and additive molecules indicated that the negative charges on the oxygen atoms of the additives reduce the extent of formation of negatively charged clusters by preferentially coordinating with Li+ ions. Of the additives considered in this study, ethylene carbonate, due to its highly electronegative oxygen, was found to be the most effective in reducing the coordination between Li+ and TFSI− and therefore led to significant enhancement in the diffusivity of Li+ ions.
A more recent study by Laria et al. [70] investigated the solvation of lithium cation in DMSO-acetonitrile (ACN) binary aprotic mixtures using MD simulations. Their simulations investigated the roles of ion-solvent and solvent-solvent interactions in defining solvation structures around ions and underscored the difference between the natures of solvation for these two aprotic solvents. Results from their calculations indicate that the cation is preferentially solvated by DMSO even at low concentrations. As part of this study, the diffusion coefficients of several species were calculated, as presented in Figure 40. The results indicated faster translational dynamics of the two components in ACN-rich solutions. Sauer et al. [71] investigated the impact of mixed anions on solvation and coordination of Li cations and its impact on the discharge capacity. As part of the study, MD simulations were performed to obtain the coordination number of NO3− and TFSI− anions with respect to the lithium cation at a range of concentrations. The results suggest that the NO3− anion, due to its higher donor number than TFSI−, preferentially associates with the lithium cation with the coordination number increasing at higher concentrations.
In addition to the previously mentioned individual studies that address specific electrolyte properties, recent efforts have attempted to screen electrolytes based on an extensive structure-property matrix. For instance, Korth et al. [72] employed DFT calculations of ionization potential, electron affinity, frontier orbital energies and oxidation and reduction potentials of several thousand solvent species to screen ideal electrolytes. Further work on screening electrolytes based on in silico design principles were conducted by Persson et al. [73,74]. One of the studies presented a hierarchical computational scheme to screen based on multiple properties of electrolytes using high-throughput quantum chemistry calculations done for 1400 organic molecules [73]. The property space considered in this study included redox potentials, solvation energies and were mapped onto structural changes in the molecules. While these calculations were not specifically targeted to properties for Li-air batteries, such as chemical stability of electrolytes, the outcome would still be useful in screening out less effective electrolytes. In a separate study, Persson et al. reported a high-throughput infrastructure for automated screening of electrolytes. One of the hallmarks of this effort was 55,000 quantum chemical calculations to evaluate ionization potential, electron affinity, dissociation constant, and salt-molecule binding complex structures for a set of 4830 molecules. These efforts provide an avenue to down select electrolytes from a huge design space in an efficient and cost-effective manner by leveraging artificial intelligence approaches.
3.2. Identifying Suitable Cathode Structure and Catalysts
As mentioned earlier, one of the critical challenges for Li-air batteries is poor rate capability. To address this issue, research efforts have been directed at identifying suitable cathode structures and catalysts that include metals and nanoalloys [75]. In particular, atomistic modeling efforts are effective in both understanding the reaction mechanisms as well as in down selecting cathode materials and catalysts. For instance, Dabrowski and Ciacchi used a combination of DFT-MD and classical MD simulations to investigate the mechanism for OER [76]. The study considered amorphous clusters of Li2O2 at the cathode surrounded by DMSO solvent or vacuum. The calculations involved removal of electrons from the structure. The results from their study suggested a two-stage reaction where peroxide transitions to superoxide first and then leads to the evolution of oxygen molecules. This study was followed by that of Sun and Zhou, where they investigated the impact of adsorbed water molecule on the OER [77]. The calculations indicated that the water molecule essentially works as a catalyst and lowers the energy barrier for an intermediate step in the OER. Kang et al. further studied the role of graphene-based catalysts in ORR and OER [78]. They performed DFT calculations that showed that the OER and ORR reactions are facilitated by graphene-based catalysts, particularly by doping them with N or encapsulating with Cu crystals. In particular, Cu support enhances chemical interaction between oxygen and lithium and the graphene surface, and induces favorable electronic charge distribution. Another recent work by Yun et al. investigated the mechanism of ORR and the catalytic role of various defective sites such as graphitic, pyridinic and pyrrolic sites in graphene [79]. The DFT based calculations demonstrated that N doped graphitic sites act as an effective catalyst and facilitate the transport of electrons.
The electron transfer reactions at the anode-electrolyte interface as well as cathode-electrolyte interface determine the transfer current densities [39,44]. A Recent study by Kazemiabnavi et al. investigated the rate of electron transfer at these interfaces as a function of the dielectric properties of the electrolyte [80,81,82]. The DFT based calculations were performed on a simple defect-free crystalline Li surface that is in contact with imidazolium-based solvents. The results from this study, shown in Figure 41, indicate that the dielectric constant of the solvent plays a very important role in the electron transfer rates at interfaces. The calculated Gibbs free energy of the overall reaction decreases linearly with the inverse of the static dielectric constant of the IL, which in turn corresponds with an increase in the length of alkyl side chain of the imidazolium cation. Consistent with this trend, the electron transfer rate constant increases with decreasing size of the alkyl side chain on the imidazolium cation. In a similar fashion, the electron transfer rate at the cathode-electrolyte interface can be calculated from first principles calculations [82]. In another study, Kazemiabnavi et al. modeled the electron transfer process near a graphitic cathode in presence of IL electrolytes. The study employed a Marcus theory-based model, in conjunction with DFT, to calculate the electron transfer rates for a wide range of ILs. The results from the DFT calculations indicate that the electron transfer rate at the cathode increases with increase in the side alkyl chains on the IL cation, and in turn decreases with increase in dielectric constant of the electrolyte [82].
Another recent study by Bhatt and Lee investigated the role of ion-conducting lithium salts in ORR kinetics in DMSO electrolytes [83]. Various thermodynamic parameters, such as Gibb’s free energy, the heat of formation and binding energy were calculated with DFT. The results from these calculations indicated that LiCF3SO3 is the most stable in DMSO compared to LiPF6 and LiN(CF3SO2)2 and is the most favorable for ORR kinetics. In order to explicitly study the impact of the various lithium salts, the Gibb’s free energy for the reactions involving the formation of lithium peroxide and lithium oxide were calculated. The structural and thermodynamic analysis indicate that the LiCF3SO3 salt favors the ORR kinetics.
Lee et al. investigated the reaction pathway of the heterostructure of h-BN and Ni (111) as cathode catalysts using DFT calculations [84]. The calculations determined that the catalyst prefers a two-electron pathway instead of a four-electron pathway, despite a large adsorption energy of oxygen. The associated free energy diagram for the ORR obtained from this study is shown in Figure 42. The study also determined that the electrochemical performance of h-BN/Ni (111) is remarkable with a maximum discharge potential of 1.93 V and a minimum charge potential of 3.83 V making it a potential substitute to the popular but expensive Pt-based alloys. A related study by Li et al. investigated CeO2 (111) surfaces as cathode catalysts for ORR using first-principles calculations [85]. The calculations determined that reduced CeO2 with surface oxygen vacancies is the most critical surface for the initial ORR. Furthermore, the study identified Li3O2 cluster as the most probable precursor for Li2O2 crystal growth at the start of the discharge process.
Sankarasubramanian et al. performed a very systematic first-principles based study that compared various noble metals and alloy surfaces as potential catalysts for ORR reactions in Li-air batteries [86]. The noble metals investigated included Pt, Au and Pd, while Fe, Co, Ni and Cu were used as model alloying metals. The modeling effort was able to replicate experimental activity values for noble metals. The DFT calculations correlated the binding energy of intermediate species with the reaction pathway based on one, two and four electron mechanisms. The reaction free energies were calculated as a parameter to evaluate catalytic activity of the surfaces. Surface passivation through the growth of peroxide layers was also discussed. Finally, the highest activities were found in Pt3Co and Pd3Fe and indicated that these alloys are promising candidates as catalysts.
3.3. Providing Insights into Formation and Charge Transport Properties of Lithium Peroxide
Several first-principles calculations have been directed towards understanding the properties of lithium peroxide layer, which is the primary discharge product in Li-air batteries. The transport properties in lithium peroxide depend on the morphology of the clusters formed and their surface properties. In one of the earliest studies, Curtiss et al. reported results from first principles calculations that investigated the structure of lithium peroxide agglomerates and nanoparticles. Their results determined that a triplet state is prevalent in dimers, trimers, and tetramers of lithium peroxide. However, closed shell singlet state is favored in case of lithium peroxide monomers. Furthermore, the high spin states of the clusters of lithium peroxide have O-O moieties that protrude from the surface and have superoxide-like features in terms of bond distances. These morphologies and surface structures play a critical role in determining the nature of the surface reactions and electronic conductivity [87].
Hummelshoj et al. performed a DFT based study to model, in extensive details, the growth and dissolution of Li2O2 on various facets and sites of a Li2O2 surface [88]. This study included a range of potential that mimics growth conditions during various phases of charge and discharge cycle. The calculations systematically addressed the formation of various sites on the Li2O2 surface and evaluated the free energy changes for all charge transfer steps in terms of the overpotential for charge and discharge. An example of the growth mechanism on perfect steps of Li2O2 as obtained from this study is shown in Figure 43. In a related study, Mekonnen et al. performed a DFT study, accounting for van der Waals dispersion, in conjunction with nonequilibrium Green’s function (NEGF) method to evaluate the role of Li2O2 on Li2CO3 interface on the charge and ion transport [89]. The results indicated that the lithium-ion vacancies are trapped in the peroxide layer on the interface resulting in reduction in the coherent transport. The NEGF calculations demonstrated that the coherent transport is reduced due to the presence of interfaces and defects. One way of alleviating this issue, suggested by the calculations, would be to employ nanostructured cathodes such as pillared graphene nanostructures that could enable enough interfaces capable of achieving electronic conduction.
Sluggish charge transport through Li2O2 during charge process leads to a high overpotential for OER [7]. The inclusion of various catalysts, such as transition metals, is a potential route for addressing this issue. The inclusion of Co into Li2O2, as a potential means to enhance rechargeability, was studied using coupled first principles and continuum scale model by Radin et al. [90].
First-principles calculations showed that the introduction of Co has a significant impact on the defect chemistry, including a change in concentration of the lithium vacancies. These results, when coupled with a continuum scale species transport model, show that Co3O4 promotes oxidation of bulk lithium peroxide due to enhanced electronic and ionic transport within Li2O2 and improves the voltaic efficiency. In another study, Kumar et al. performed first-principles calculations to investigate the initial decomposition reactions of a common electrolyte, DME, at the surface of Li2O2 with peroxide and superoxide terminating planes [91]. The study identifies H-abstraction from DME as one of the important preliminary steps in the decomposition of the electrolyte. Furthermore, the results indicate that the barrier for the H-abstraction is lower on surfaces that are terminated by superoxides. Presence of electric field pointing away from the surface decreases the barrier slightly, while the barrier is substantially increased when the field direction is reversed. Overall, the calculations in conjunction with classical rate theory suggest that hydrogen abstraction at lithium peroxide surfaces account for degradation of ether solvents in Li-air batteries, further indicating that surface passivation of lithium peroxide could stabilize the solvent.
Tu et al. employed theoretical calculations to study gold-decorated cracked carbon submicron tube arrays as catalysts [92]. The objective of this study was to investigate if these cathode structures enable guided Li2O2 growth. The results from the calculations indicate that the presence of Au nanoparticles improves the conductivity as well as provides catalytic sites that guide the growth of thin layers of Li2O2 inside the cracked tubes. Such growth of Li2O2 presents cathode deactivation and provides space for reactant transport.
Lee et al. performed DFT calculations to determine the mechanism for adsorption of lithium oxide and other ORR products on graphene-based cathode [93]. The optimized structures and binding energy for species such as oxygen, lithium, LiO2, and Li2O2 were calculated at various configurations. The results indicated that O2 is weakly adsorbed on graphene, while the adsorbed Li atoms were adsorbed on centers of the hexagonal graphene with a relatively high adsorption energy and charge transfer. The calculations further indicated that Li adsorption precedes that of O2 and Li2O2. Furthermore, the study revealed that configurations where Li2O2 is parallel to the plane of graphene, are preferred. This work was followed by a similar study of adsorption of ORR species on N-doped graphene [94]. The results from the DFT calculations indicated that the adsorption energies of O2 were greater on N-doped graphene compared to pristine graphene and also result in greater charge transfer in the former structure. The charge density difference for adsorption of LiO2 and Li2O2 on N-doped graphene, obtained from this study, is presented in Figure 44. The effect is opposite in case of atomic Li, where a lower amount of charge transfer happens in case of N-doped graphene indicating that Li tends to adsorb to sites that are farther away from the N-doped sites in graphene. As far as the lithium oxides are concerned, the binding energies are stronger in case of N-doped graphene. Overall, results from the study indicated an enhancement in the adsorption of lithium oxides with greater charge transfer in case of N-doped graphene.
Transition metal oxides such as MnO2 are popular cathode catalysts in Li-air batteries. A dedicated study to understand the surface properties of rutile MnO2 was conducted by Tompsett et al. using DFT calculations. The study determined that MnO2 has a rod-like nanostructured form with (110) surface being the most thermodynamically favored facets along with other low energy facts such as (211) and (211) [95]. These nanostructured morphologies could be potentially favorable for catalytic applications in Li-air batteries. Furthermore, the surface Mn sites typically show a slightly lower coordination of 5.5, compared to the 6-fold coordination in bulk. These under-coordinated Mn sites have enhanced magnetic moments that could play an important role in the catalytic activity. Additionally, the calculations showed relatively low formation energies for surface oxygen vacancies, compared to that in other transition metal oxides, which may also favor catalytic activity in rutile MnO2. The ORR reaction around these catalysts and growth of Li2O2 were modeled based on a combination of first principles and mesoscale calculations by Liu et al. [96]. The theoretical calculations investigated the interface between MnO2 and the products of ORR reactions to determine the merits of the catalyst. The adsorption energies for Li, O2, LiO2, Li2O, and Li2O2 were calculated and indicated that MnO2 preferentially reacts with Li atoms and strongly chemisorbs LiO2. The MnO2 has a strong affinity for lithium oxide species and therefore facilitates the formation of a nicely wetted Li2O2 film on the cathode. The overpotential for the formation of Li2O2 was calculated as 0.49 V, which is rather low and suggests that MnO2 is an effective catalyst that facilitates the formation of Li2O2 as a major reaction product.
4. Conclusions and Future Outlook
Modeling tools ranging from atomistic to macroscopic length scales have been employed to address critical challenges in Li-air batteries. In particular, continuum-scale models are able to investigate pore blockage, electrode volume changes, and reduction product formation. These phenomena are difficult to identify experimentally, but significantly affect the battery performance. Despite the efficacy of these models, these models are unable to elucidate microscale and discontinuous phenomena, such as dendrite formation at the reaction surface [97], pore structure changes [98], and the isolation of electrode materials [14]. Therefore, there is a growing need for advanced continuum models that are able to couple these micro and macro phenomena. With this in mind, mesoscale models and simulations are being considered to overcome the limitations of conventional continuum-based model. For example, Jithin et al. [99] have applied the lattice Boltzmann method to simulate the discontinuous formation of lithium peroxide on the cathode material, which is treated as continuous porous media in the conventional continuum model. Furthermore, Monte Carlo simulation, a well-known method that accounts for mesoscale physics, has been used to model the ORR [100]. Although these studies were unable to fully elucidate the reaction phenomena in the overall domain of the Li-air battery due to computational cost, the feasibility of this new approach to Li-air battery research was demonstrated. These preliminary studies suggest that new continuum models complemented by mesoscale models, such as lattice Boltzmann methods and Monte Carlo simulation, will enable rigorous analysis of micro–macro reaction phenomena and accurate performance predictions of Li-air batteries. This type of hybrid model is expected to significantly benefit battery research.
While continuum and mesoscale models are able to access cell-level phenomena and predict battery performance, accessing the underlying electrochemistry and transport mechanisms necessitate modeling at the atomistic resolution. Prior work reported in the scientific literature demonstrates that atomistic simulations are powerful tools that can be employed for screening electrolytes, cathode structures, and catalysts. These modeling efforts are also able to provide detailed insight into the fundamental mechanisms that govern the kinetics and thermodynamics of charge transfer and transport through the electrolyte and cathode-electrolyte interfaces. Ab initio quantum mechanical methods such as DFT as well as classical MD have been employed for studying electrochemistry and transport in systems ranging in size from several molecules to bulk structures. However, there are several key issues that still need to be addressed and atomistic simulations can play a critical role. In particular, disruptive improvement in performance can only be attained through concerted efforts to design novel electrode architecture and identify compatible electrolytes. While recent studies have modeled chemistry at the cathode-electrolyte interface, additional work is necessary to completely understand the influence of chemistry on the diffusion of ions through the porous cathode structure. The effects of nanoconfinement, as the lithium peroxide deposits on carbon during discharge, needs to be studied in further details [101]. While several parameter-based mesoscale and continuum scale models have been developed to address these issues, multiscale efforts are important to accurately model the transport processes. From an atomistic modeling perspective, it is necessary that further efforts are directed towards developing reactive and polarizable force fields to access larger length scales through classical MD simulations. Ultimately, collaborative efforts that employ modeling at multiple length scales, experimental characterization, and electrochemical performance measurements are required to address the outstanding issues that impede the commercialization of Li-air batteries.
Acknowledgments
This work was supported by the National Research Foundation of Korea (NRF) grant funded by the Korean government (2017R1C1B2001990).
Author Contributions
Prashanta Dutta conceived the overall idea and designed the structure of the whole review paper. Kisoo Yoo and Jonghoon Kim reviewed all papers related to the continuum and system level modeling, while Soumik Banerjee reviewed the works related to atomistic modeling. All four authors wrote the paper.
Conflicts of Interest
The authors declare no conflicts of interest.
References
- Cairns, E.J.; Albertus, P. Batteries for Electric and Hybrid-Electric Vehicles. Annu. Rev. Chem. Biomol. Eng. 2010, 1, 299–320. [Google Scholar] [CrossRef] [PubMed]
- Marom, R.; Amalraj, S.F.; Leifer, N.; Jacob, D.; Aurbach, D. A review of advanced and practical lithium battery materials. J. Mater. Chem. 2011, 21, 9938–9954. [Google Scholar] [CrossRef]
- Lee, J.-S.; Kim, S.T.; Cao, R.; Choi, N.-S.; Liu, M.; Lee, K.T.; Cho, J. Metal-Air Batteries with High Energy Density: Li-Air versus Zn-Air. Adv. Energy Mater. 2011, 1, 34–50. [Google Scholar] [CrossRef]
- Girishkumar, G.; McCloskey, B.; Luntz, A.C.; Swanson, S.; Wilcke, W. Lithium—Air Battery: Promise and Challenges. J. Phys. Chem. Lett. 2010, 1, 2193–2203. [Google Scholar] [CrossRef]
- Grande, L.; Paillard, E.; Hassoun, J.; Park, J.-B.; Lee, Y.-J.; Sun, Y.-K.; Passerini, S.; Scrosati, B. The Lithium/Air Battery: Still an Emerging System or a Practical Reality? Adv. Mater. 2015, 27, 784–800. [Google Scholar] [CrossRef] [PubMed]
- Bruce, P.G.; Freunberger, S.A.; Hardwick, L.J.; Tarascon, J.M. Li-O2 and Li-S batteries with high energy storage. Nat. Mater. 2012, 11, 19–29. [Google Scholar] [CrossRef] [PubMed]
- Jung, K.N.; Kim, J.; Yamauchi, Y.; Park, M.S.; Lee, J.W.; Kim, J.H. Rechargeable lithium-air batteries: A perspective on the development of oxygen electrodes. J. Mater. Chem. A 2016, 4, 14050–14068. [Google Scholar] [CrossRef]
- Lu, J.; Lau, K.C.; Sun, Y.K.; Curtiss, L.A.; Amine, K. Review-Understanding and Mitigating Some of the Key Factors that Limit Non-Aqueous Lithium-Air Battery Performance. J. Electrochem. Soc. 2015, 162, A2439–A2446. [Google Scholar] [CrossRef]
- Albertus, P.; Girishkumar, G.; McCloskey, B.; Sanchez-Carrera, R.S.; Kozinsky, B.; Christensen, J.; Luntz, A.C. Identifying Capacity Limitations in the Li/Oxygen Battery Using Experiments and Modeling. J. Electrochem. Soc. 2011, 158, A343–A351. [Google Scholar] [CrossRef]
- Sahapatsombut, U.; Cheng, H.; Scott, K. Modelling the micro-macro homogeneous cycling behaviour of a lithium-air battery. J. Power Sources 2013, 227, 243–253. [Google Scholar] [CrossRef]
- Xue, K.-H.; McTurk, E.; Johnson, L.; Bruce, P.G.; Franco, A.A. A comprehensive model for non-aqueous lithium air batteries involving different reaction mechanisms. J. Electrochem. Soc. 2015, 162, A614–A621. [Google Scholar] [CrossRef]
- Mehta, M.; Mixon, G.; Zheng, J.P.; Andrei, P. Analytical electrochemical impedance modeling of Li-air batteries under DC discharge. J. Electrochem. Soc. 2013, 160, A2033–A2045. [Google Scholar] [CrossRef]
- Read, J. Characterization of the lithium/oxygen organic electrolyte battery. J. Electrochem. Soc. 2002, 149, A1190–A1195. [Google Scholar] [CrossRef]
- Read, J.; Mutolo, K.; Ervin, M.; Behl, W.; Wolfenstine, J.; Driedger, A.; Forster, D. Oxygen transport properties of organic electrolytes and performance of lithium/oxygen battery. J. Electrochem. Soc. 2003, 150, A1351–A1356. [Google Scholar] [CrossRef]
- Sandhu, S.S.; Fellner, J.P.; Brutchen, G.W. Diffusion-limited model for a lithium/air battery with an organic electrolyte. J. Power Sources 2007, 164, 365–371. [Google Scholar] [CrossRef]
- Andrei, P.; Zheng, J.P.; Hendrickson, M.; Plichta, E.J. Some Possible Approaches for Improving the Energy Density of Li-Air Batteries. J. Electrochem. Soc. 2010, 157, A1287–A1295. [Google Scholar] [CrossRef]
- Newman, J.S. Electrochemical Systems; Prentice-Hall: Englewood Cliffs, NJ, USA, 1972. [Google Scholar]
- Yoo, K.; Banerjee, S.; Dutta, P. Modeling of volume change phenomena in a Li-air battery. J. Power Sources 2014, 258, 340–350. [Google Scholar] [CrossRef]
- Chen, X.J.; Bevara, V.V.; Andrei, P.; Hendrickson, M.; Plichta, E.J.; Zheng, J.P. Combined effects of oxygen diffusion and electronic resistance in Li-air batteries with carbon nanofiber cathodes. J. Electrochem. Soc. 2014, 161, A1877–A1883. [Google Scholar] [CrossRef]
- Wang, Y. Modeling discharge deposit formation and its effect on lithium-air battery performance. Electrochim. Acta 2012, 75, 239–246. [Google Scholar] [CrossRef]
- Jung, C.Y.; Zhao, T.S.; An, L. Modeling of lithium–oxygen batteries with the discharge product treated as a discontinuous deposit layer. J. Power Sources 2015, 273, 440–447. [Google Scholar] [CrossRef]
- Wang, Y.; Cho, S.C. Analysis of air cathode perfomance for lithium-air batteries. J. Electrochem. Soc. 2013, 160, A1847–A1855. [Google Scholar] [CrossRef]
- Xue, K.-H.; Nguyen, T.-K.; Franco, A.A. Impact of the cathode microstructure on the discharge performance of lithium air batteries: A multiscale model. J. Electrochem. Soc. 2014, 161, E3028–E3035. [Google Scholar] [CrossRef]
- Li, X. A modeling study of the pore size evolution in lithium-oxygen battery electrodes. J. Electrochem. Soc. 2015, 162, A1636–A1645. [Google Scholar] [CrossRef]
- He, P.; Wang, Y.; Zhou, H. A Li-air fuel cell with recycle aqueous electrolyte for improved stability. Electrochem. Commun. 2010, 12, 1686–1689. [Google Scholar] [CrossRef]
- Zhang, T.; Imanishi, N.; Shimonishi, Y.; Hirano, A.; Xie, J.; Takeda, Y.; Yamamoto, O.; Sammes, N. Stability of a water-stable lithium metal anode for a lithium–air battery with acetic acid–water solutions. J. Electrochem. Soc. 2010, 157, A214–A218. [Google Scholar] [CrossRef]
- Manthiram, A.; Li, L. Hybrid and Aqueous Lithium-Air Batteries. Adv. Energy Mater. 2015, 5, 1401302. [Google Scholar] [CrossRef]
- Andrei, P.; Zheng, J.P.; Hendrickson, M.; Plichta, E.J. Modeling of Li-air batteries with dual electrolyte. J. Electrochem. Soc. 2012, 159, A770–A780. [Google Scholar] [CrossRef]
- Horstmann, B.; Danner, T.; Bessler, W.G. Precipitation in aqueous lithium–oxygen batteries: A model-based analysis. Energy Environ. Sci. 2013, 6, 1299–1314. [Google Scholar] [CrossRef] [Green Version]
- Nimon, V.Y.; Visco, S.J.; de Jonghe, L.C.; Volfkovich, Y.M.; Bograchev, D.A. Modeling and experimental study of porous carbon cathodes in Li-O2 cells with non-aqueous electrolyte. ECS Electrochem. Lett. 2013, 2, A33–A35. [Google Scholar] [CrossRef]
- Imanishi, N.; Yamamoto, O. Rechargeable lithium–air batteries: Characteristics and prospects. Mater. Today 2014, 17, 24–30. [Google Scholar] [CrossRef]
- Lim, H.D.; Park, K.Y.; Song, H.; Jang, E.Y.; Gwon, H.; Kim, J.; Kim, Y.H.; Lima, M.D.; Robles, R.O.; Lepró, X.; et al. Enhanced Power and Rechargeability of a Li-O2 Battery Based on a Hierarchical-Fibril CNT Electrode. Adv. Mater. 2013, 25, 1348–1352. [Google Scholar] [CrossRef] [PubMed]
- Wu, S.; Qiao, Y.; Yang, S.; Ishida, M.; He, P.; Zhou, H. Organic hydrogen peroxide-driven low charge potentials for high-performance lithium-oxygen batteries with carbon cathodes. Nat. Commun. 2017, 8, 15607. [Google Scholar] [CrossRef] [PubMed]
- Jung, H.-G.; Hassoun, J.; Park, J.-B.; Sun, Y.-K.; Scrosati, B. An improved high-performance lithium-air battery. Nat. Chem. 2012, 4, 579–585. [Google Scholar] [CrossRef] [PubMed]
- Liu, T.; Leskes, M.; Yu, W.; Moore, A.J.; Zhou, L.; Bayley, P.M.; Kim, G.; Grey, C.P. Cycling Li-O2 batteries via LiOH formation and decomposition. Science 2015, 350, 530–533. [Google Scholar] [CrossRef] [PubMed]
- Elia, G.A.; Hassoun, J.; Kwak, W.J.; Sun, Y.K.; Scrosati, B.; Mueller, F.; Bresser, D.; Passerini, S.; Oberhumer, P.; Tsiouvaras, N.; et al. An advanced lithium–air battery exploiting an ionic liquid-based electrolyte. Nano Lett. 2014, 14, 6572–6577. [Google Scholar] [CrossRef] [PubMed]
- Sahapatsombut, U.; Cheng, H.; Scott, K. Modelling of electrolyte degradation and cycling behaviour in a lithium-air battery. J. Power Sources 2013, 243, 409–418. [Google Scholar] [CrossRef]
- Sahapatsombut, U.; Cheng, H.; Scott, K. Modelling of operation of a lithium-air battery with ambient air and oxygen-selective membrane. J. Power Sources 2014, 249, 418–430. [Google Scholar] [CrossRef]
- Yoo, K.; Deshpande, A.; Banerjee, S.; Dutta, P. Electrochemical Model for Ionic Liquid Electrolytes in Lithium Batteries. Electrochim. Acta 2015, 176, 301–310. [Google Scholar] [CrossRef]
- Saint, J.; Best, A.S.; Hollenkamp, A.F.; Kerr, J.; Shin, J.H.; Doeff, M.M. Compatibility of LixTiyMn1−yO2 (y = 0, 0.11) electrode materials with pyrrolidinium-based ionic liquid electrolyte systems. J. Electrochem. Soc. 2008, 155, A172–A180. [Google Scholar] [CrossRef]
- Sakaebe, H.; Matsumoto, H. N-Methyl-N-propylpiperidinium bis(trifluoromethanesulfonyl)imide (PP 13-TFSI)—Novel electrolyte base for Li battery. Electrochem. Commun. 2003, 5, 594–598. [Google Scholar] [CrossRef]
- Kuboki, T.; Okuyama, T.; Ohsaki, T.; Takami, N. Lithium-air batteries using hydrophobic room temperature ionic liquid electrolyte. J. Power Sources 2005, 146, 766–769. [Google Scholar] [CrossRef]
- Higashi, S.; Kato, Y.; Takechi, K.; Nakamoto, H.; Mizuno, F.; Nishikoori, H.; Iba, H.; Asaoka, T. Evaluation and analysis of Li-air battery using ether-functionalized ionic liquid. J. Power Sources 2013, 240, 14–17. [Google Scholar] [CrossRef]
- Yoo, K.; Dive, A.M.; Kazemiabnavi, S.; Banerjee, S.; Dutta, P. Effects of Operating Temperature on the Electrical Performance of a Li-air Battery operated with Ionic Liquid Electrolyte. Electrochim. Acta 2016, 194, 317–329. [Google Scholar] [CrossRef]
- Li, X.; Faghri, A. Optimization of the cathode structure of lithium-air batteries based on a two-dimensional, transient, non-isothermal model. J. Electrochem. Soc. 2012, 159, A1747–A1754. [Google Scholar] [CrossRef]
- Li, X.; Huang, J.; Faghri, A. Modeling study of a Li-O2 battery with an active cathode. Energy 2015, 81, 489–500. [Google Scholar] [CrossRef]
- Huang, J.; Faghri, A. Capacity enhancement of a lithium oxygen flow battery. Electrochim. Acta 2015, 174, 908–918. [Google Scholar] [CrossRef]
- Wang, D.; Zhang, W.; Zheng, W.T.; Cui, X.Q.; Rojo, T.; Zhang, Q. Towards High-Safe Lithium Metal Anodes: Suppressing Lithium Dendrites via Tuning Surface Energy. Adv. Sci. 2017, 4, 1600168. [Google Scholar] [CrossRef] [PubMed]
- Jana, A.; Ely, D.R.; Garcia, R.E. Dendrite-separator interactions in lithium-based batteries. J. Power Sources 2015, 275, 912–921. [Google Scholar] [CrossRef]
- Welland, M.J.; Lau, K.C.; Redfern, P.C.; Liang, L.; Zhai, D.; Wolf, D.; Curtiss, L.A. An atomistically informed mesoscale model for growth and coarsening during discharge in lithium-oxygen batteries. J. Chem. Phys. 2015, 143, 224113. [Google Scholar] [CrossRef] [PubMed]
- Ong, S.P.; Andreussi, O.; Wu, Y.; Marzari, N.; Ceder, G. Electrochemical Windows of Room-Temperature Ionic Liquids from Molecular Dynamics and Density Functional Theory Calculations. Chem. Mater. 2011, 23, 2979–2986. [Google Scholar] [CrossRef]
- Borodin, O.; Olguin, M.; Spear, C.E.; Leiter, K.W.; Knap, J. Towards high throughput screening of electrochemical stability of battery electrolytes. Nanotechnology 2015, 26, 354003. [Google Scholar] [CrossRef] [PubMed]
- Knap, J.; Spear, C.E.; Borodin, O.; Leiter, K.W. Advancing a distributed multi-scale computing framework for large-scale high-throughput discovery in materials science. Nanotechnology 2015, 26, 434004. [Google Scholar] [CrossRef] [PubMed]
- Parker, V.D. Energetics of Electrode Reactions. II. The Relationship Between Redox Potentials, Ionization Potentials, Electron Affinities, and Solvation Energies of Aromatic Hydrocarbons. J. Am. Chem. Soc. 1976, 98, 98–103. [Google Scholar] [CrossRef]
- Shao, N.; Sun, X.-G.; Dai, S.; Jiang, D.-E. Electrochemical Windows of Sulfone-Based Electrolytes for High-Voltage Li-Ion Batteries. J. Phys. Chem. B 2011, 115, 12120–12125. [Google Scholar] [CrossRef] [PubMed]
- Shao, N.; Sun, X.-G.; Dai, S.; Jiang, D.-E. Oxidation Potentials of Functionalized Sulfone Solvents for High-Voltage Li-Ion Batteries: A Computational Study. J. Phys. Chem. B 2012, 116, 3235–3238. [Google Scholar] [CrossRef] [PubMed]
- Borodin, O.; Behl, W.; Jow, T.R. Oxidative Stability and Initial Decomposition Reactions of Carbonate, Sulfone, and Alkyl Phosphate-Based Electrolytes. J. Phys. Chem. C 2013, 117, 8661–8682. [Google Scholar] [CrossRef]
- Kazemiabnavi, S.; Zhang, Z.; Thornton, K.; Banerjee, S. Electrochemical Stability Window of Imidazolium-Based Ionic Liquids as Electrolytes for Lithium Batteries. J. Phys. Chem. B 2016, 120, 5691–5702. [Google Scholar] [CrossRef] [PubMed]
- Zhang, X.R.; Pugh, J.K.; Ross, P.N. Computation of Thermodynamic Oxidation Potentials of Organic Solvents Using Density Functional Theory. J. Electrochem. Soc. 2001, 148, E183–E188. [Google Scholar] [CrossRef]
- Galinski, M.; Lewandowski, A.; Stepniak, I. Ionic liquids as electrolytes. Electrochim. Acta 2006, 51, 5567–5580. [Google Scholar] [CrossRef]
- Bryantsev, V.S.; Faglioni, F. Predicting Autoxidation Stability of Ether- and Amide-Based Electrolyte Solvents for Li-Air Batteries. J. Phys. Chem. A 2012, 116, 7128–7138. [Google Scholar] [CrossRef] [PubMed]
- Jung, S.; Canova, F.F.; Akagi, K. Characteristics of Lithium Ions and Superoxide Anions in EMI-TFSI and Dimethyl Sulfoxide. J. Phys. Chem. A 2016, 120, 364–371. [Google Scholar] [CrossRef] [PubMed]
- Scheers, J.; Lidberg, D.; Sodeyama, K.; Futera, Z.; Tateyama, Y. Life of superoxide in aprotic Li-O2 battery electrolytes: Simulated solvent and counter-ion effects. Phys. Chem. Chem. Phys. 2016, 18, 9961–9968. [Google Scholar] [CrossRef] [PubMed]
- Chau, V.K.C.; Chen, Z.N.; Hu, H.; Chan, K.Y. Exploring Solvent Stability against Nucleophilic Attack by Solvated LiO2- in an Aprotic Li-O2 Battery. J. Electrochem. Soc. 2017, 164, A284–A289. [Google Scholar] [CrossRef]
- Liu, B.; Xu, W.; Yan, P.; Sun, X.; Bowden, M.E.; Read, J.; Qian, J.; Mei, D.; Wang, C.-M.; Zhang, J.-G. Enhanced Cycling Stability of Rechargeable Li-O2 Batteries Using High-Concentration Electrolytes. Adv. Funct. Mater. 2016, 26, 605–613. [Google Scholar] [CrossRef]
- Deshpande, A.; Dutta, P.; Banerjee, S. Solubility of oxygen in lithium-air battery electrolytes: A molecular dynamics study. In Proceedings of the ASME 2014 International Mechanical Engineering Congress and Exposition (IMECE 2014), Montreal, QC, Canada, 14–20 November 2014. [Google Scholar]
- Gittleson, F.S.; Jones, R.E.; Ward, D.K.; Foster, M.E. Oxygen solubility and transport in Li-air battery electrolytes: Establishing criteria and strategies for electrolyte design. Energy Environ. Sci. 2017, 10, 1167–1179. [Google Scholar] [CrossRef]
- Borodin, O.; Smith, G.D. Structure and dynamics of N-methyl-N-propylpyrrolidinium bis(trifluoromethanesulfonyl)imide ionic liquid from molecular dynamics simulations. J. Phys. Chem. B 2006, 110, 11481–11490. (In English) [Google Scholar] [CrossRef] [PubMed]
- Mozhzhukhina, N.; Longinotti, M.P.; Corti, H.R.; Calvo, E.J. A conductivity study of preferential solvation of lithium ion in acetonitrile-dimethyl sulfoxide mixtures. Electrochim. Acta 2015, 154, 456–461. [Google Scholar] [CrossRef]
- Semino, R.; Zaldivar, G.; Calvo, E.J.; Laria, D. Lithium solvation in dimethyl sulfoxide-acetonitrile mixtures. J. Chem. Phys. 2014, 141, 214509. [Google Scholar] [CrossRef] [PubMed]
- Iliksu, M.; Khetan, A.; Yang, S.; Simon, U.; Pitsch, H.; Sauer, D.U. Elucidation and Comparison of the Effect of LiTFSI and LiNO3 Salts on Discharge Chemistry in Nonaqueous Li-O2 Batteries. ACS Appl. Mater. Interfaces 2017, 9, 19319–19325. [Google Scholar] [CrossRef] [PubMed]
- Korth, M. Large-scale virtual high-throughput screening for the identification of new battery electrolyte solvents: Evaluation of electronic structure theory methods. Phys. Chem. Chem. Phys. 2014, 16, 7919–7926. [Google Scholar] [CrossRef] [PubMed]
- Cheng, L.; Assary, R.S.; Qu, X.; Jain, A.; Ong, S.P.; Rajput, N.N.; Persson, K.; Curtiss, L.A. Accelerating Electrolyte Discovery for Energy Storage with High-Throughput Screening. J. Phys. Chem. Lett. 2015, 6, 283–291. [Google Scholar] [CrossRef] [PubMed]
- Qu, X.; Jain, A.; Rajput, N.N.; Cheng, L.; Zhang, Y.; Ong, S.P.; Brafman, M.; Maginn, E.; Curtiss, L.A.; Persson, K.A. The Electrolyte Genome project: A big data approach in battery materials discovery. Comput. Mater. Sci. 2015, 103, 56–67. [Google Scholar] [CrossRef]
- Shan, S.; Luo, J.; Wu, J.; Kang, N.; Zhao, W.; Cronk, H.; Zhao, Y.; Joseph, P.; Petkov, V.; Zhong, C.-J. Nanoalloy catalysts for electrochemical energy conversion and storage reactions. RSC Adv. 2014, 4, 42654–42669. [Google Scholar] [CrossRef]
- Dabrowski, T.; Ciacchi, L.C. Atomistic Modeling of the Charge Process in Lithium/Air Batteries. J. Phys. Chem. C 2015, 119, 25807–25817. [Google Scholar] [CrossRef]
- Sun, Y.; Zhou, H.S. Facilitating the Oxygen Evolution Reaction of Lithium Peroxide via Molecular Adsorption. J. Phys. Chem. C 2016, 120, 10237–10243. [Google Scholar] [CrossRef]
- Kang, J.; Yu, J.S.; Han, B. First-Principles Design of Graphene-Based Active Catalysts for Oxygen Reduction and Evolution Reactions in the Aprotic Li-O2 Battery. J. Phys. Chem. Lett. 2016, 7, 2803–2808. [Google Scholar] [CrossRef] [PubMed]
- Yun, K.H.; Hwang, Y.; Chung, Y.C. Effective catalytic media using graphitic nitrogen-doped site in graphene for a non-aqueous Li-O2 battery: A density functional theory study. J. Power Sources 2015, 277, 222–227. [Google Scholar] [CrossRef]
- Kazemiabnavi, S.; Dutta, P.; Banerjee, S. Density Functional Theory Based Study of the Electron Transfer Reaction at the Lithium Metal Anode in a Lithium–Air Battery with Ionic Liquid Electrolytes. J. Phys. Chem. C 2014, 118, 27183–27192. [Google Scholar] [CrossRef]
- Kazemiabnavi, S.; Dutta, P.; Banerjee, S. Ab Initio Modeling of the Electron Transfer Reaction Rate at the Electrode-Electrolyte Interface in Lithium-Air Batteries. In Proceedings of the ASME 2014 International Mechanical Engineering Congress and Exposition (IMECE 2014), Montreal, QC, Canada, 14–20 November 2014; Volume 6A, p. V06AT07A037. [Google Scholar]
- Kazemiabnavi, S.; Dutta, P.; Banerjee, S. A density functional theory based study of the electron transfer reaction at the cathode-electrolyte interface in lithium-air batteries. Phys. Chem. Chem. Phys. 2015, 17, 11740–11751. [Google Scholar] [CrossRef] [PubMed]
- Bhatt, M.D.; Lee, J.S. Density Functional Theory (DFT) Study for Role of Ion-Conducting Lithium Salts Regarding the Oxygen Reduction Reaction (ORR) Kinetics in Li-air (O2) Batteries. Electrochim. Acta 2015, 182, 1124–1131. [Google Scholar] [CrossRef]
- Lee, M.; Hwang, Y.; Yun, K.H.; Chung, Y.C. Cathode reaction mechanism on the h-BN/Ni (111) heterostructure for the lithium-oxygen battery. J. Power Sources 2016, 307, 379–384. [Google Scholar] [CrossRef]
- Li, X.; Li, Z.; Yang, X.; Jia, L.; Fu, Y.Q.; Chi, B.; Pu, J.; Li, J. First-principles study of the initial oxygen reduction reaction on stoichiometric and reduced CeO2 (111) surfaces as a cathode catalyst for lithium-oxygen batteries. J. Mater. Chem. A 2017, 5, 3320–3329. [Google Scholar] [CrossRef]
- Sankarasubramanian, S.; Singh, N.; Mizuno, F.; Prakash, J. Ab initio investigation of the oxygen reduction reaction activity on noble metal (Pt, Au, Pd), Pt3M (M = Fe, Co, Ni, Cu) and Pd3M (M = Fe, Co, Ni, Cu) alloy surfaces, for Li-O2 cells. J. Power Sources 2016, 319, 202–209. [Google Scholar] [CrossRef]
- Lau, K.C.; Assary, R.S.; Redfern, P.; Greeley, J.; Curtiss, L.A. Electronic Structure of Lithium Peroxide Clusters and Relevance to Lithium-Air Batteries. J. Phys. Chem. C 2012, 116, 23890–23896. [Google Scholar] [CrossRef]
- Hummelshoj, J.S.; Luntz, A.C.; Norskov, J.K. Theoretical evidence for low kinetic overpotentials in Li-O2 electrochemistry. J. Chem. Phys. 2013, 138, 034703. [Google Scholar] [CrossRef] [PubMed]
- Mekonnen, Y.S.; Garcia-Lastra, J.M.; Hummelshoj, J.S.; Jin, C.J.; Vegge, T. Role of Li2O2@Li2CO3 Interfaces on Charge Transport in Nonaqueous Li-Air Batteries. J. Phys. Chem. C 2015, 119, 18066–18073. [Google Scholar] [CrossRef] [Green Version]
- Radin, M.D.; Monroe, C.W.; Siegel, D.J. How Dopants Can Enhance Charge Transport in Li2O2. Chem. Mater. 2015, 27, 839–847. [Google Scholar] [CrossRef]
- Kumar, N.; Radin, M.D.; Wood, B.C.; Ogitsu, T.; Siegel, D.J. Surface-Mediated Solvent Decomposition in Li-Air Batteries: Impact of Peroxide and Superoxide Surface Terminations. J. Phys. Chem. C 2015, 119, 9050–9060. [Google Scholar] [CrossRef]
- Tu, F.; Hu, J.; Xie, J.; Cao, G.; Zhang, S.; Yang, S.A.; Zhao, X.; Yang, H.Y. Au-Decorated Cracked Carbon Tube Arrays as Binder-Free Catalytic Cathode Enabling Guided Li2O2 Inner Growth for High-Performance Li-O2 Batteries. Adv. Funct. Mater. 2016, 26, 7725–7732. [Google Scholar] [CrossRef]
- Lee, J.H.; Kang, S.G.; Moon, H.S.; Park, H.; Kim, I.T.; Lee, S.G. Adsorption mechanisms of lithium oxides (LixO2) on a graphene-based electrode: A density functional theory approach. Appl. Surf. Sci. 2015, 351, 193–202. [Google Scholar] [CrossRef]
- Lee, J.H.; Kang, S.G.; Kim, I.T.; Kwon, S.; Lee, I.; Lee, S.G. Adsorption mechanisms of lithium oxides (LixO2) on N-doped graphene: A density functional theory study with implications for lithium-air batteries. Theor. Chem. Acc. 2016, 135, 1–9. [Google Scholar] [CrossRef]
- Tompsett, D.A.; Parker, S.C.; Islam, M.S. Rutile (beta-)MnO2 Surfaces and Vacancy Formation for High Electrochemical and Catalytic Performance. J. Am. Chem. Soc. 2014, 136, 1418–1426. [Google Scholar] [CrossRef] [PubMed]
- Liu, Z.X.; de Jesus, L.R.; Banerjee, S.; Mukherjee, P.P. Mechanistic Evaluation of LixOy Formation on delta-MnO2 in Nonaqueous Li-Air Batteries. ACS Appl. Mater. Interfaces 2016, 8, 23028–23036. [Google Scholar] [CrossRef] [PubMed]
- Winter, M.; Besenhard, J.O. Electrochemical lithiation of tin and tin-based intermetallics and composites. Electrochim. Acta 1999, 45, 31–50. [Google Scholar] [CrossRef]
- Xiao, J.; Wang, D.; Xu, W.; Wang, D.; Williford, R.E.; Liu, J.; Zhang, J.-G. Optimization of air electrode for Li/air batteries. J. Electrochem. Soc. 2010, 157, A487–A492. [Google Scholar] [CrossRef]
- Jithin, M.; Das, M.K.; De, A. Lattice Boltzmann Simulation of Lithium Peroxide Formation in Lithium–Oxygen Battery. J. Electrochem. Energy Convers. Storage 2016, 13, 031003. [Google Scholar] [CrossRef]
- Blanquer, G.; Yin, Y.; Quiroga, M.A.; Franco, A.A. Modeling Investigation of the Local Electrochemistry in Lithium-O2 Batteries: A Kinetic Monte Carlo Approach. J. Electrochem. Soc. 2016, 163, A329–A337. [Google Scholar] [CrossRef]
- Andersen, C.P.; Hu, H.; Qiu, G.; Kalra, V.; Sun, Y. Pore-Scale Transport Resolved Model Incorporating Cathode Microstructure and Peroxide Growth in Lithium-Air Batteries. J. Electrochem. Soc. 2015, 162, A1135–A1145. [Google Scholar] [CrossRef]
Figure 1.
Practical specific energies of some rechargeable batteries, along with estimated driving distances and pack prices. Reprinted by permission from Macmillan Publishers Ltd: Nature Materials, Bruce et al. [6], copyright© 2011.
Figure 1.
Practical specific energies of some rechargeable batteries, along with estimated driving distances and pack prices. Reprinted by permission from Macmillan Publishers Ltd: Nature Materials, Bruce et al. [6], copyright© 2011.
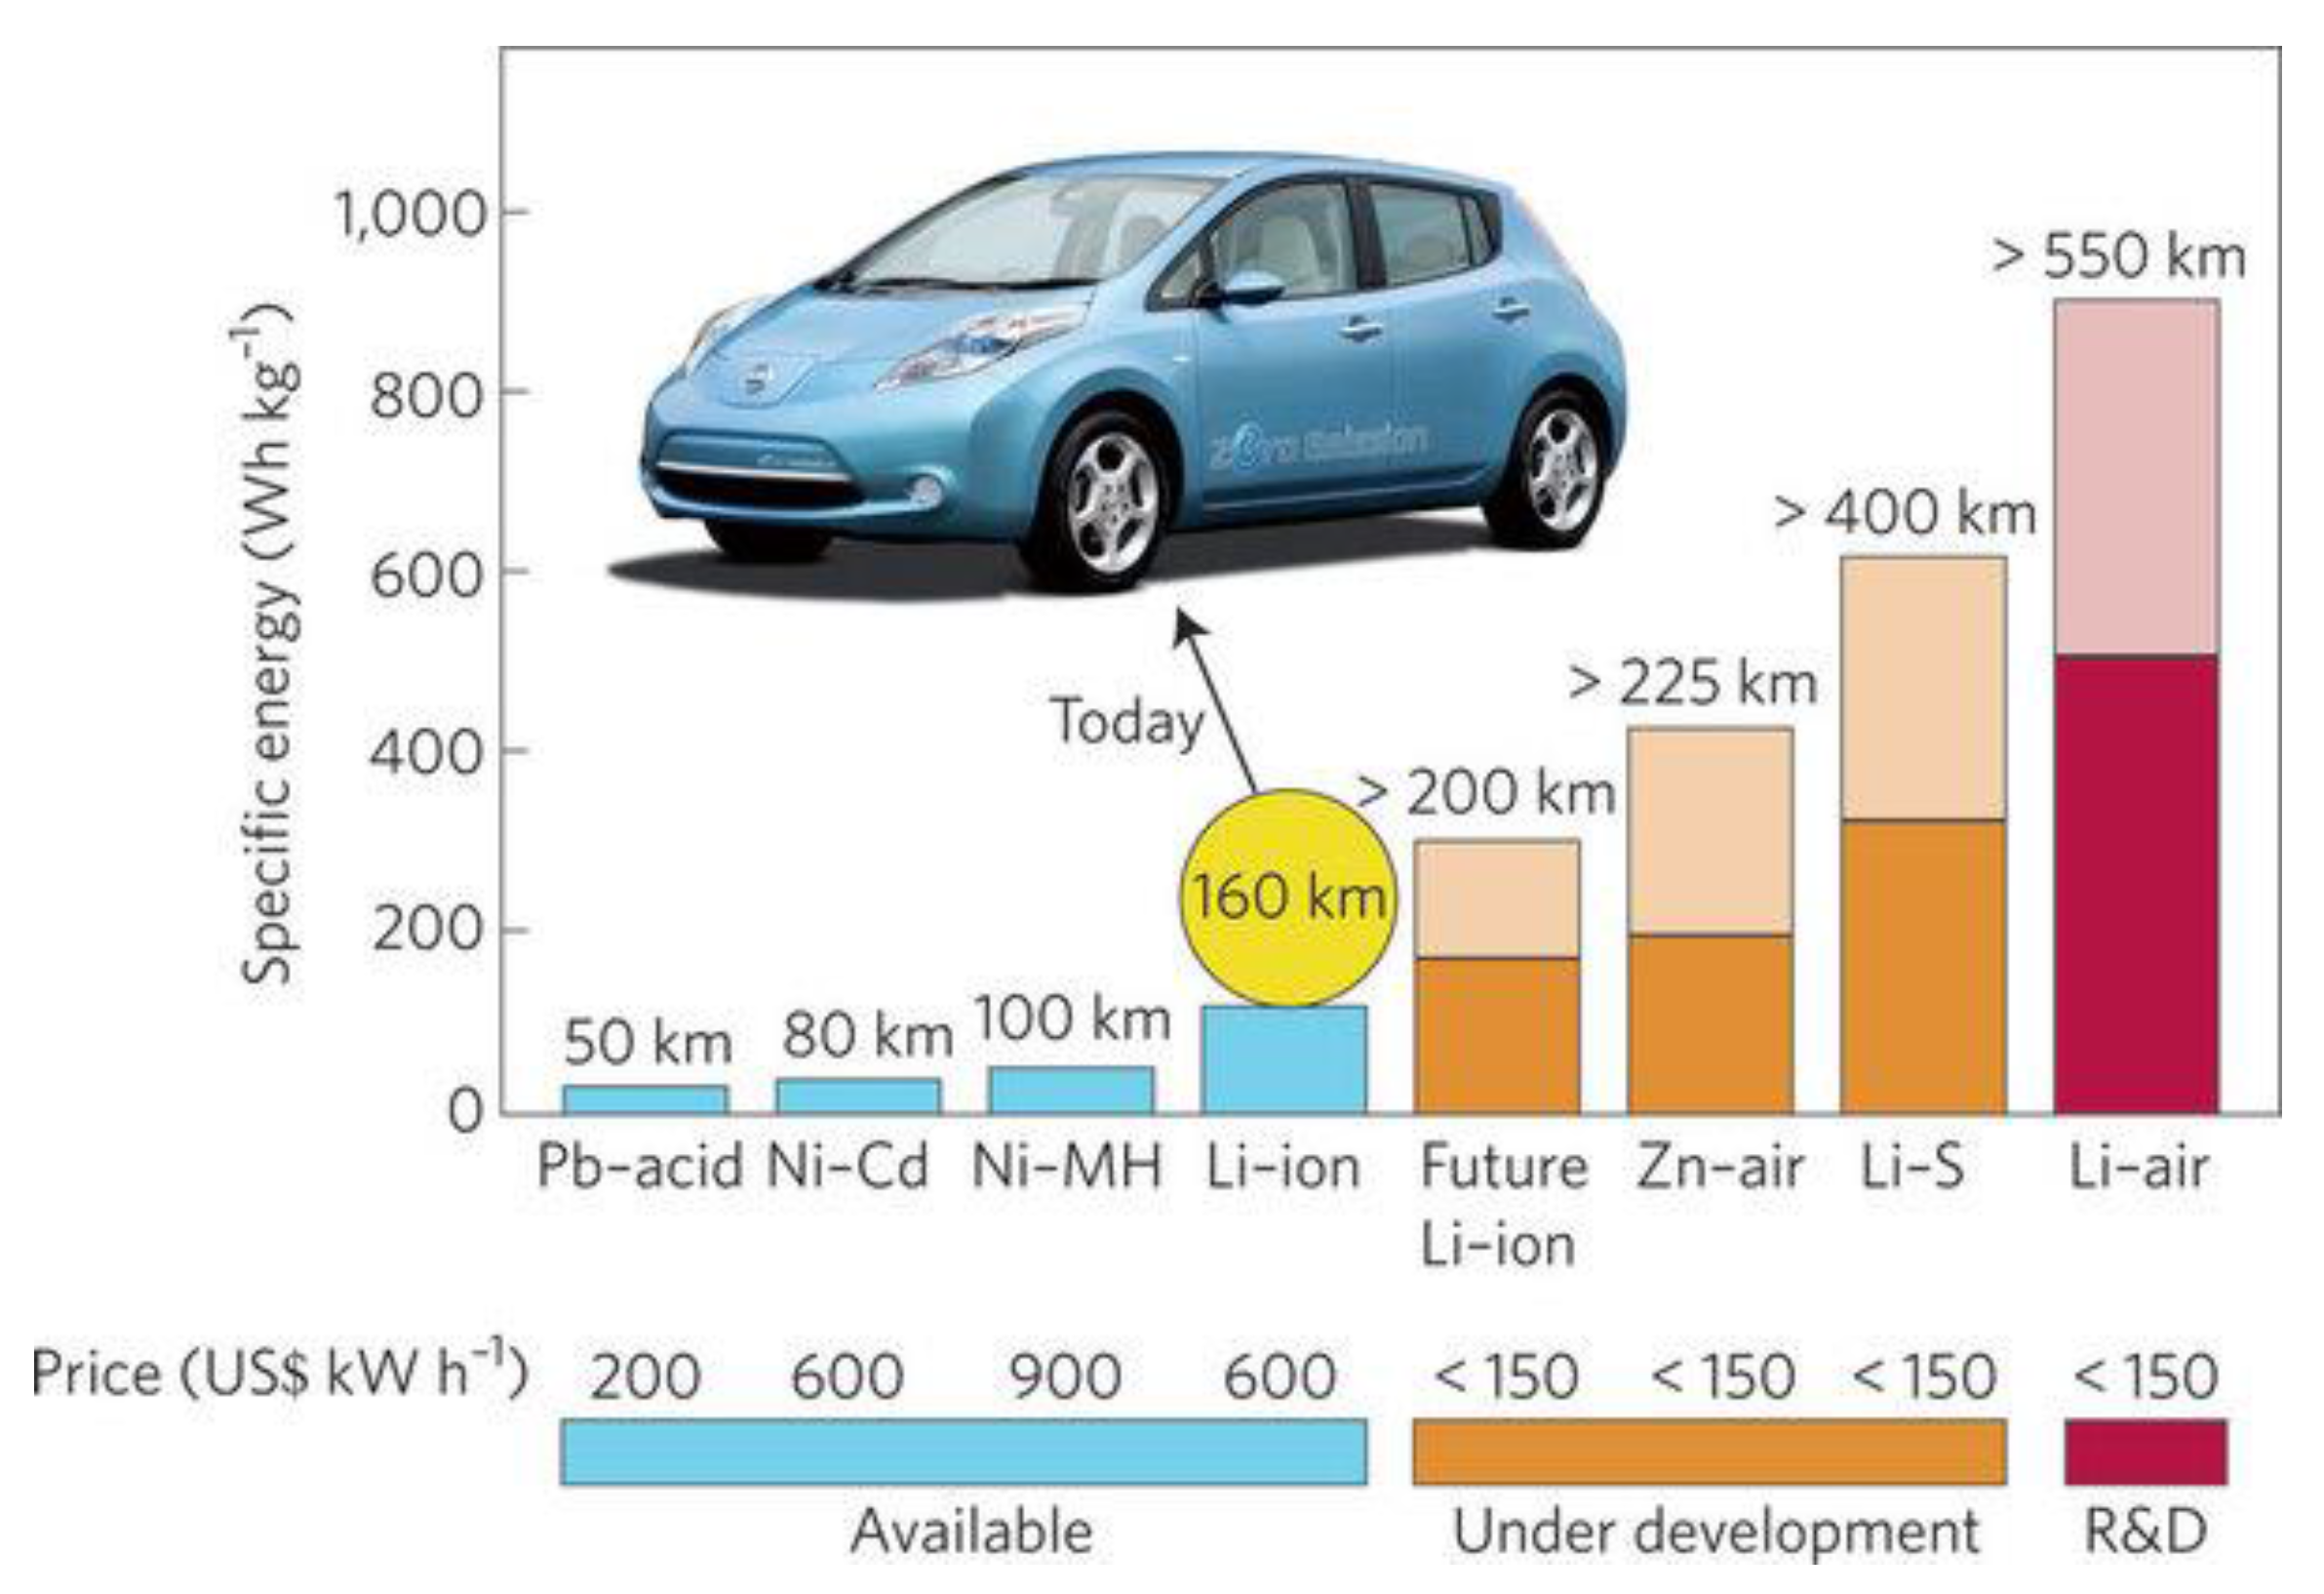
Figure 2.
(a) Schematic of the lithium/air system and (b) geometry of an individual pore in the cathode reaction layer. Reprinted from Sandhu et al. [15], with permission from Elsevier.
Figure 2.
(a) Schematic of the lithium/air system and (b) geometry of an individual pore in the cathode reaction layer. Reprinted from Sandhu et al. [15], with permission from Elsevier.

Figure 3.
Specific capacities as a function of oxygen partial pressure for current densities of (a) 0.5; (b) 0.1; and (c) 0.05 mA/cm. Symbols are experimental values. Reprinted from Sandhu et al. [15], with permission from Elsevier.
Figure 3.
Specific capacities as a function of oxygen partial pressure for current densities of (a) 0.5; (b) 0.1; and (c) 0.05 mA/cm. Symbols are experimental values. Reprinted from Sandhu et al. [15], with permission from Elsevier.

Figure 4.
Cell voltage vs. specific capacity for different reaction rate coefficients: (a) uniformly and (b) non-uniformly distributed catalysts. Republished from Andrei et al. [16] with permission of the Electrochemical Society, conveyed through Copyright Clearance Center, Inc.
Figure 4.
Cell voltage vs. specific capacity for different reaction rate coefficients: (a) uniformly and (b) non-uniformly distributed catalysts. Republished from Andrei et al. [16] with permission of the Electrochemical Society, conveyed through Copyright Clearance Center, Inc.

Figure 5.
Growth scheme of discharge products on the surface of a spherical carbon particle in a positive porous electrode. Republished from Albertus et al. [9] with permission of the Electrochemical Society, conveyed through Copyright Clearance Center, Inc.
Figure 5.
Growth scheme of discharge products on the surface of a spherical carbon particle in a positive porous electrode. Republished from Albertus et al. [9] with permission of the Electrochemical Society, conveyed through Copyright Clearance Center, Inc.
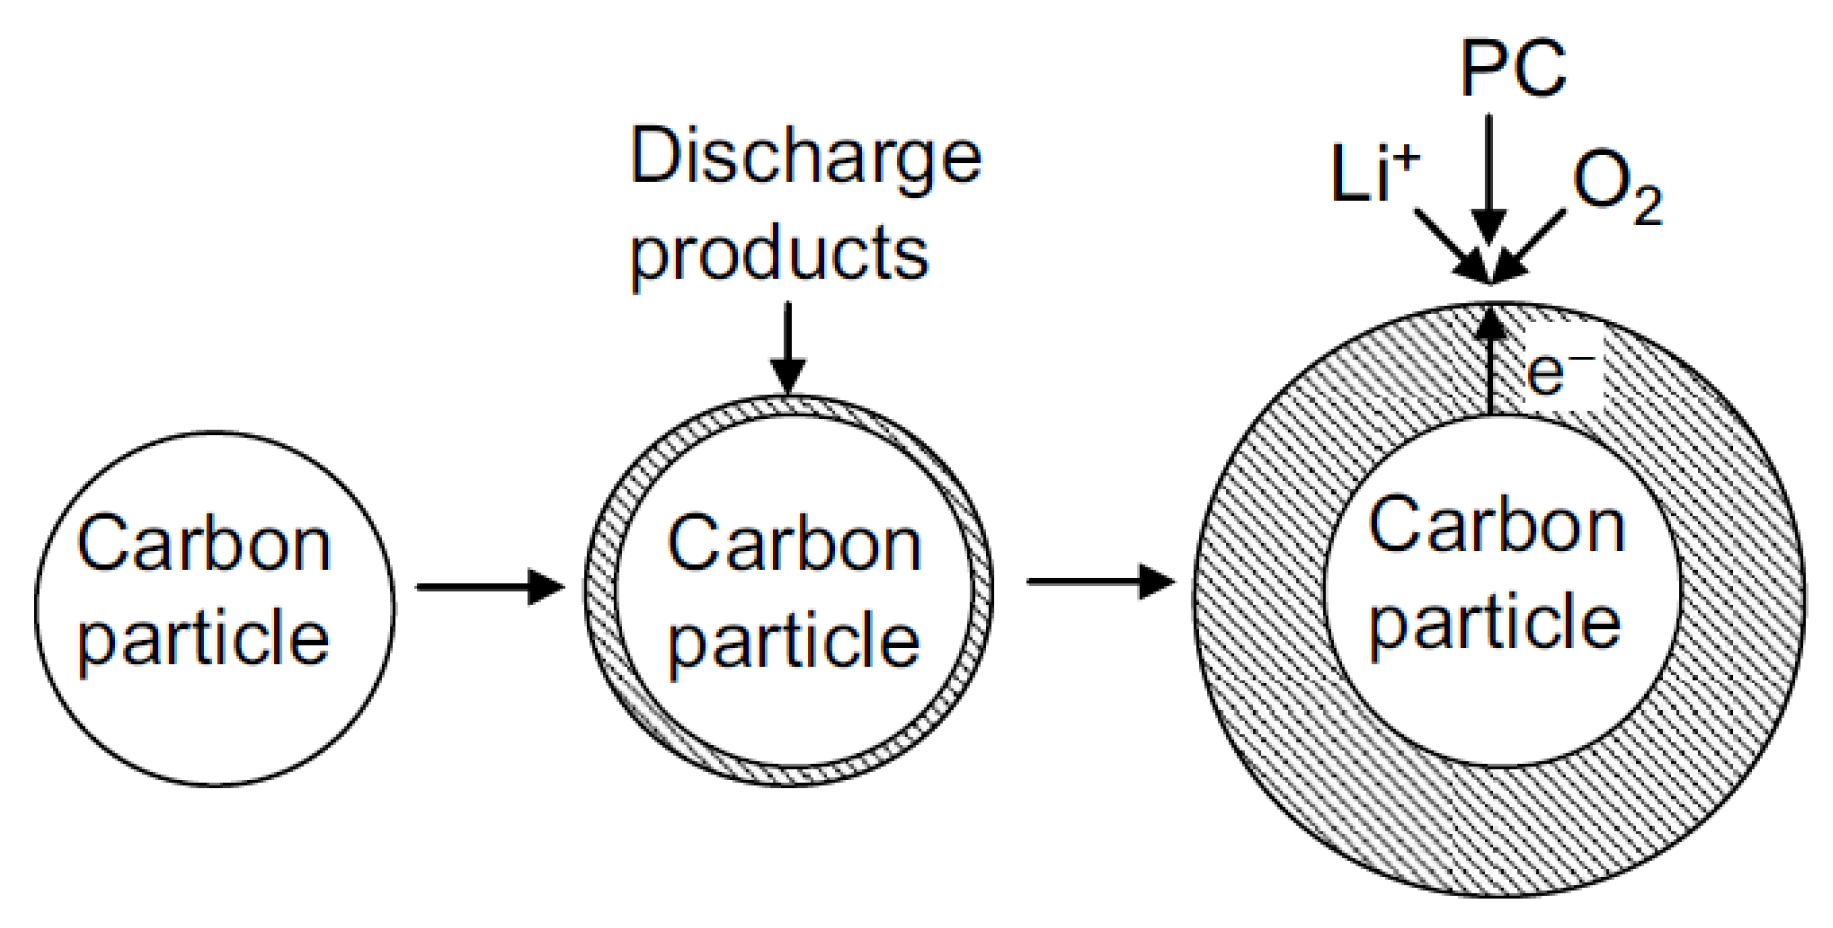
Figure 6.
Simulation results demonstrating the relative impacts of oxygen transport limitation and electronic resistance of the discharge products. Load condition: (a) 0.08 mA/cm2; (b) 0.46 mA/cm2. Republished from Albertus et al. [9] with permission of Electrochemical Society, conveyed through Copyright Clearance Center, Inc.
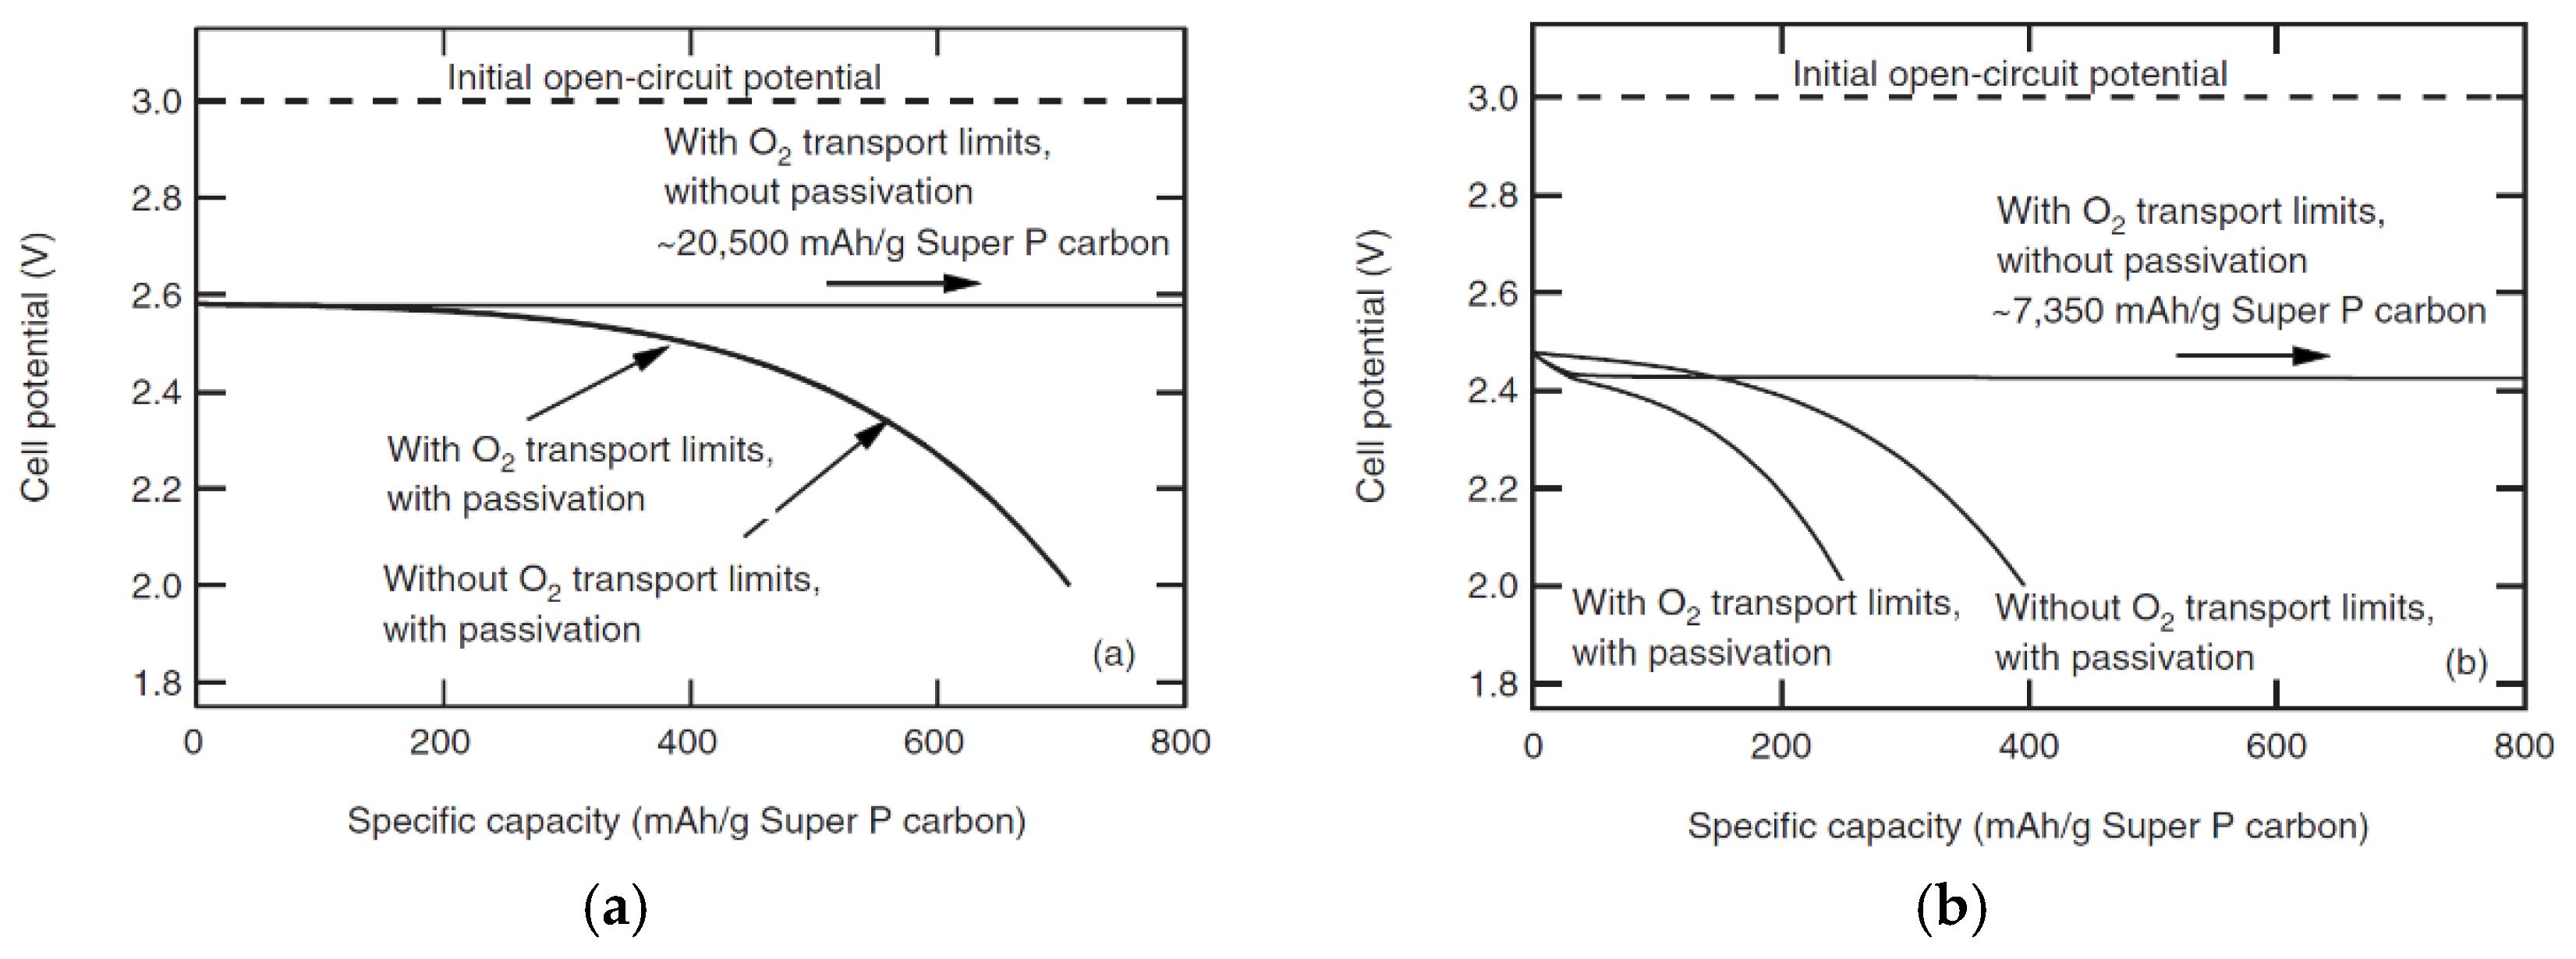
Figure 7.
Formation of a lithium peroxide layer on the surface of SWCNTs and CNFs. (a) Pristine cathode; (b,c) during the first part of the discharge; and (d) at the final part of discharge. Republished from Chen et al. [19] with permission of the Electrochemical Society, conveyed through Copyright Clearance Center, Inc.

Figure 8.
Discharge curves of Li-air cells computed for different lithium peroxide resistivities. Republished from Chen et al. [19] with permission of The Electrochemical Society, conveyed through Copyright Clearance Center, Inc.
Figure 8.
Discharge curves of Li-air cells computed for different lithium peroxide resistivities. Republished from Chen et al. [19] with permission of The Electrochemical Society, conveyed through Copyright Clearance Center, Inc.

Figure 9.
The ohmic potential drop across the Li2O2 layer as a function of position in the cathode after the first discharge (when the cell voltage reaches 2 V). Republished from Chen et al. [19] with permission of The Electrochemical Society, conveyed through Copyright Clearance Center, Inc.
Figure 9.
The ohmic potential drop across the Li2O2 layer as a function of position in the cathode after the first discharge (when the cell voltage reaches 2 V). Republished from Chen et al. [19] with permission of The Electrochemical Society, conveyed through Copyright Clearance Center, Inc.
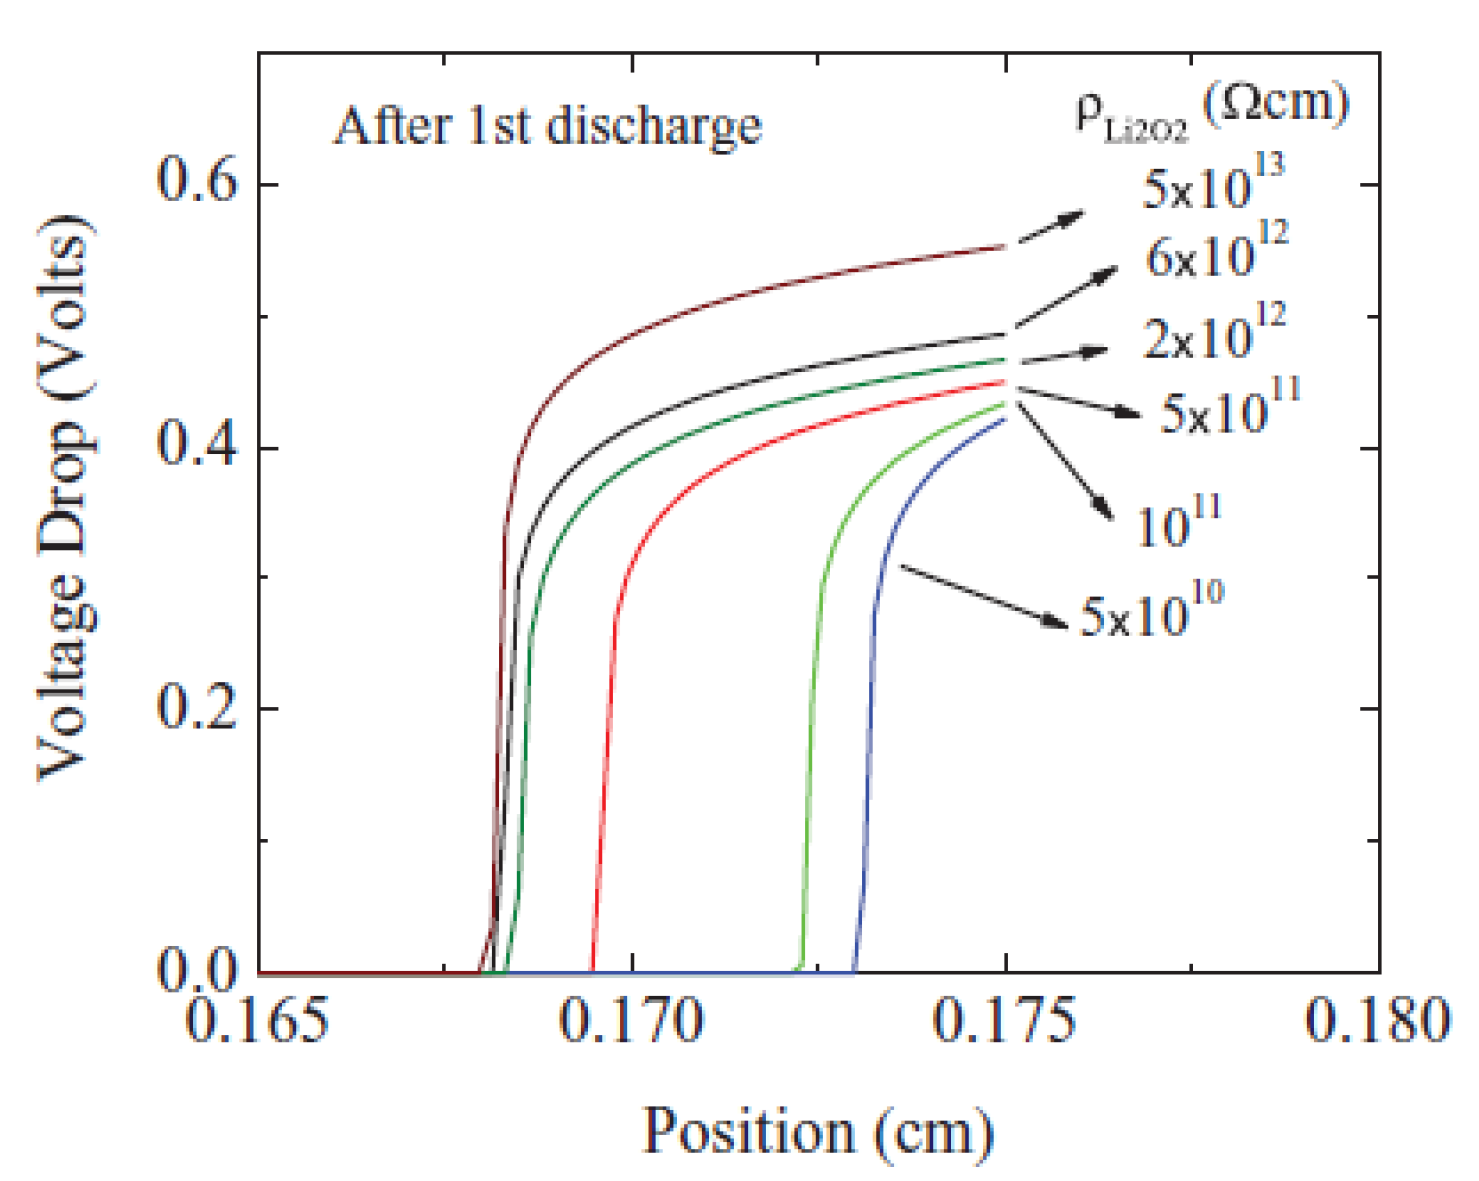
Figure 10.
Various discharge product growth modes: (a) Cylindrical-film growth mode; (b) spherical-film growth mode; and (c) planar-film growth mode. Reprinted from Wang et al. [20], with permission from Elsevier.
Figure 10.
Various discharge product growth modes: (a) Cylindrical-film growth mode; (b) spherical-film growth mode; and (c) planar-film growth mode. Reprinted from Wang et al. [20], with permission from Elsevier.

Figure 11.
(a) Solid water islands scattered over the thin ionomer film, allowing oxygen access to the catalyst; (b) Ice islands connect, forming a thin ice layer and blocking oxygen access to the local catalyst. Reprinted from Wang et al. [20], with permission from Elsevier.
Figure 11.
(a) Solid water islands scattered over the thin ionomer film, allowing oxygen access to the catalyst; (b) Ice islands connect, forming a thin ice layer and blocking oxygen access to the local catalyst. Reprinted from Wang et al. [20], with permission from Elsevier.
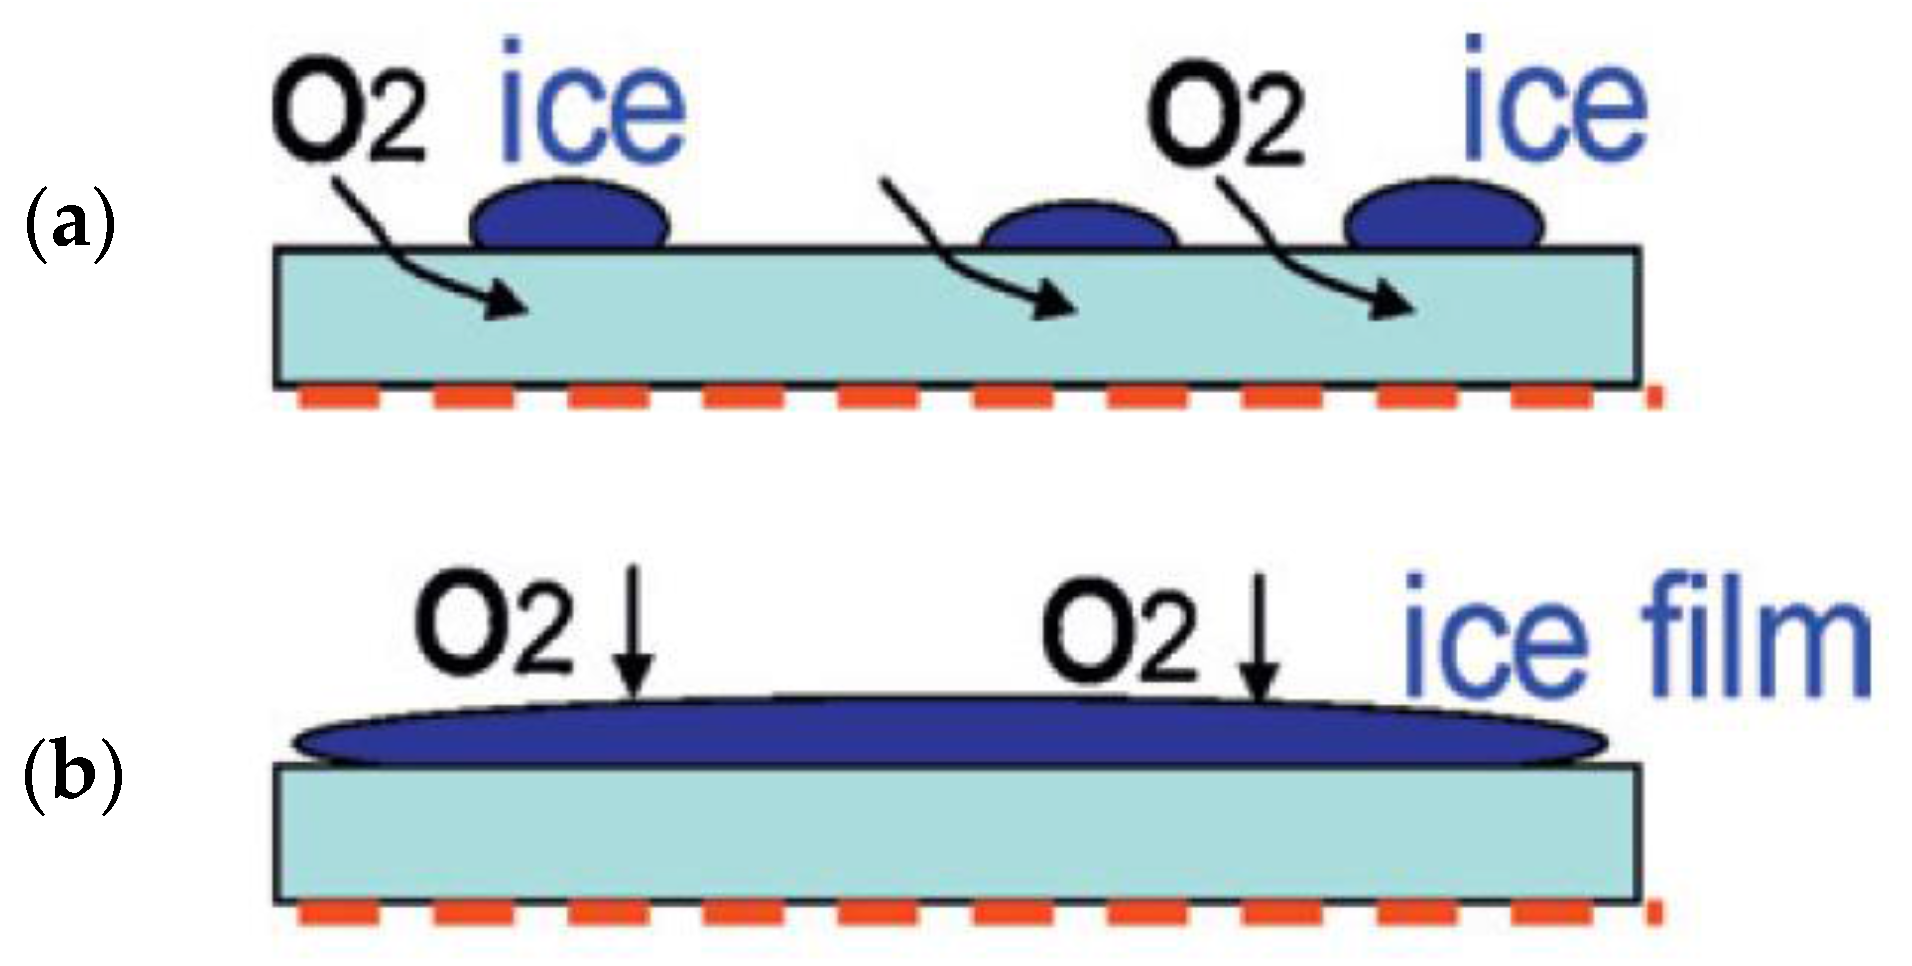
Figure 12.
An illustration of Li2O2 formation at different discharge current densities. (A) Island-like deposition at low current densities; and (B) plate-like deposition at high current densities. Reprinted from Jung et al. [21], with permission from Elsevier.
Figure 12.
An illustration of Li2O2 formation at different discharge current densities. (A) Island-like deposition at low current densities; and (B) plate-like deposition at high current densities. Reprinted from Jung et al. [21], with permission from Elsevier.
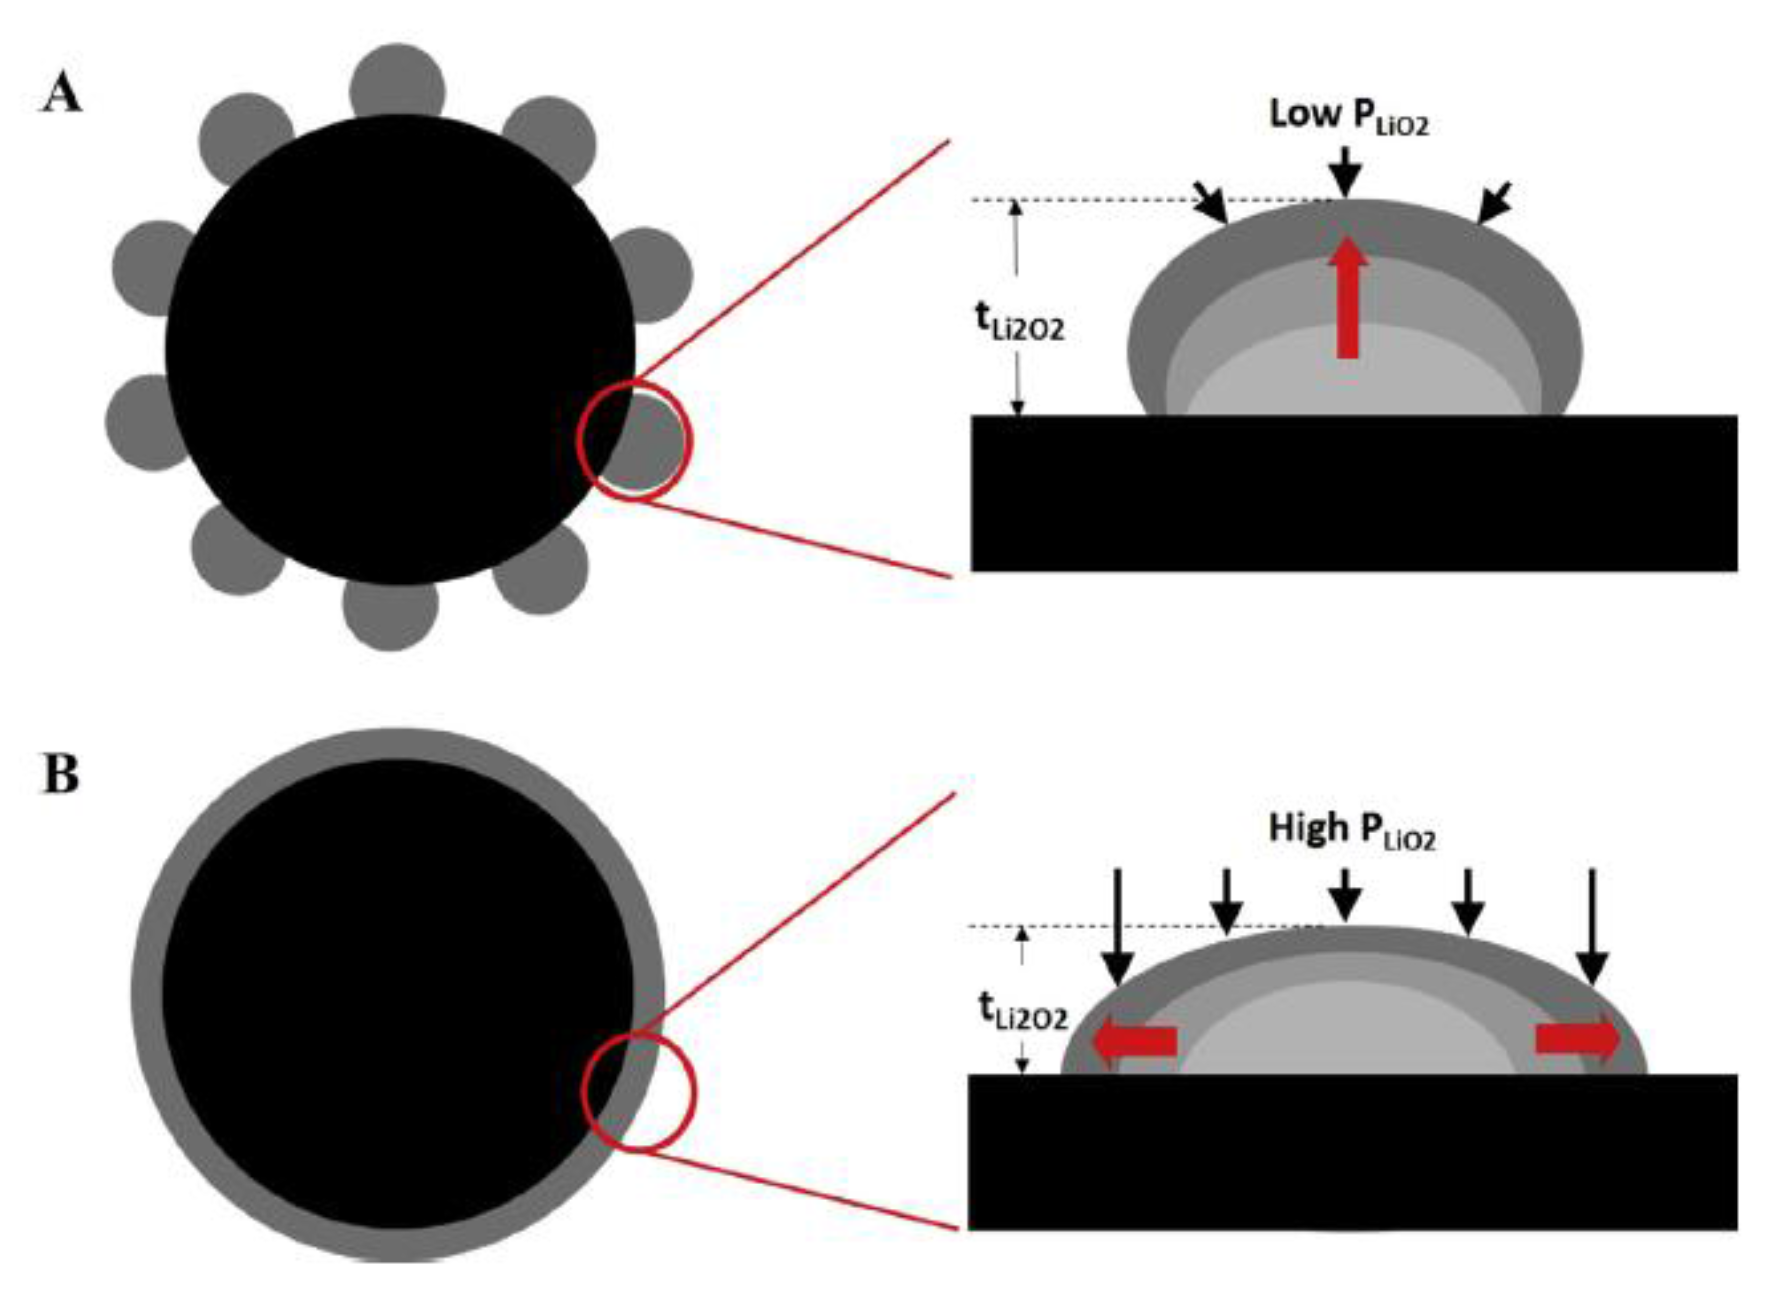
Figure 13.
Li-air battery performance under varying electrode tortuosity. Republished from Wang and Cho [22] with permission of The Electrochemical Society, conveyed through Copyright Clearance Center, Inc.
Figure 13.
Li-air battery performance under varying electrode tortuosity. Republished from Wang and Cho [22] with permission of The Electrochemical Society, conveyed through Copyright Clearance Center, Inc.

Figure 14.
Li-air battery performance with varying Da numbers. Republished from Wang and Cho [22] with permission of The Electrochemical Society, conveyed through Copyright Clearance Center, Inc.
Figure 14.
Li-air battery performance with varying Da numbers. Republished from Wang and Cho [22] with permission of The Electrochemical Society, conveyed through Copyright Clearance Center, Inc.

Figure 15.
Pore size distribution of Super P and Ketjen Black carbons, with parameters in the bimodal distribution function. Republished from Xue et al. [23] with permission of The Electrochemical Society, conveyed through Copyright Clearance Center, Inc.
Figure 15.
Pore size distribution of Super P and Ketjen Black carbons, with parameters in the bimodal distribution function. Republished from Xue et al. [23] with permission of The Electrochemical Society, conveyed through Copyright Clearance Center, Inc.

Figure 16.
Pore network model to evaluate the mathematical form of the escape function. Republished from Xue et al. [11] with permission of The Electrochemical Society, conveyed through Copyright Clearance Center, Inc.
Figure 16.
Pore network model to evaluate the mathematical form of the escape function. Republished from Xue et al. [11] with permission of The Electrochemical Society, conveyed through Copyright Clearance Center, Inc.

Figure 17.
Simulated discharge curves for TEGDME and DMSO electrolytes in comparison with experiments. The discharge current density is 4 A·m2. Republished from Xue et al. [11] with permission of The Electrochemical Society, conveyed through Copyright Clearance Center, Inc.
Figure 17.
Simulated discharge curves for TEGDME and DMSO electrolytes in comparison with experiments. The discharge current density is 4 A·m2. Republished from Xue et al. [11] with permission of The Electrochemical Society, conveyed through Copyright Clearance Center, Inc.

Figure 18.
Discharge performance of lithium–oxygen batteries with various mean pore sizes (in nm). The critical pore size is 10 nm. Republished from Li [24] with permission of The Electrochemical Society conveyed through Copyright Clearance Center, Inc.
Figure 18.
Discharge performance of lithium–oxygen batteries with various mean pore sizes (in nm). The critical pore size is 10 nm. Republished from Li [24] with permission of The Electrochemical Society conveyed through Copyright Clearance Center, Inc.

Figure 19.
Schematic of hybrid and aqueous Li-air batteries. The anode electrolyte can be a conventional polymeric separator soaked with an organic electrolyte or a polymer or ceramic Li+-ion solid electrolyte, as indicated. Republished from Manthiram and Li [27] with permission of John Wiley and Sons conveyed through Copyright Clearance Center, Inc.
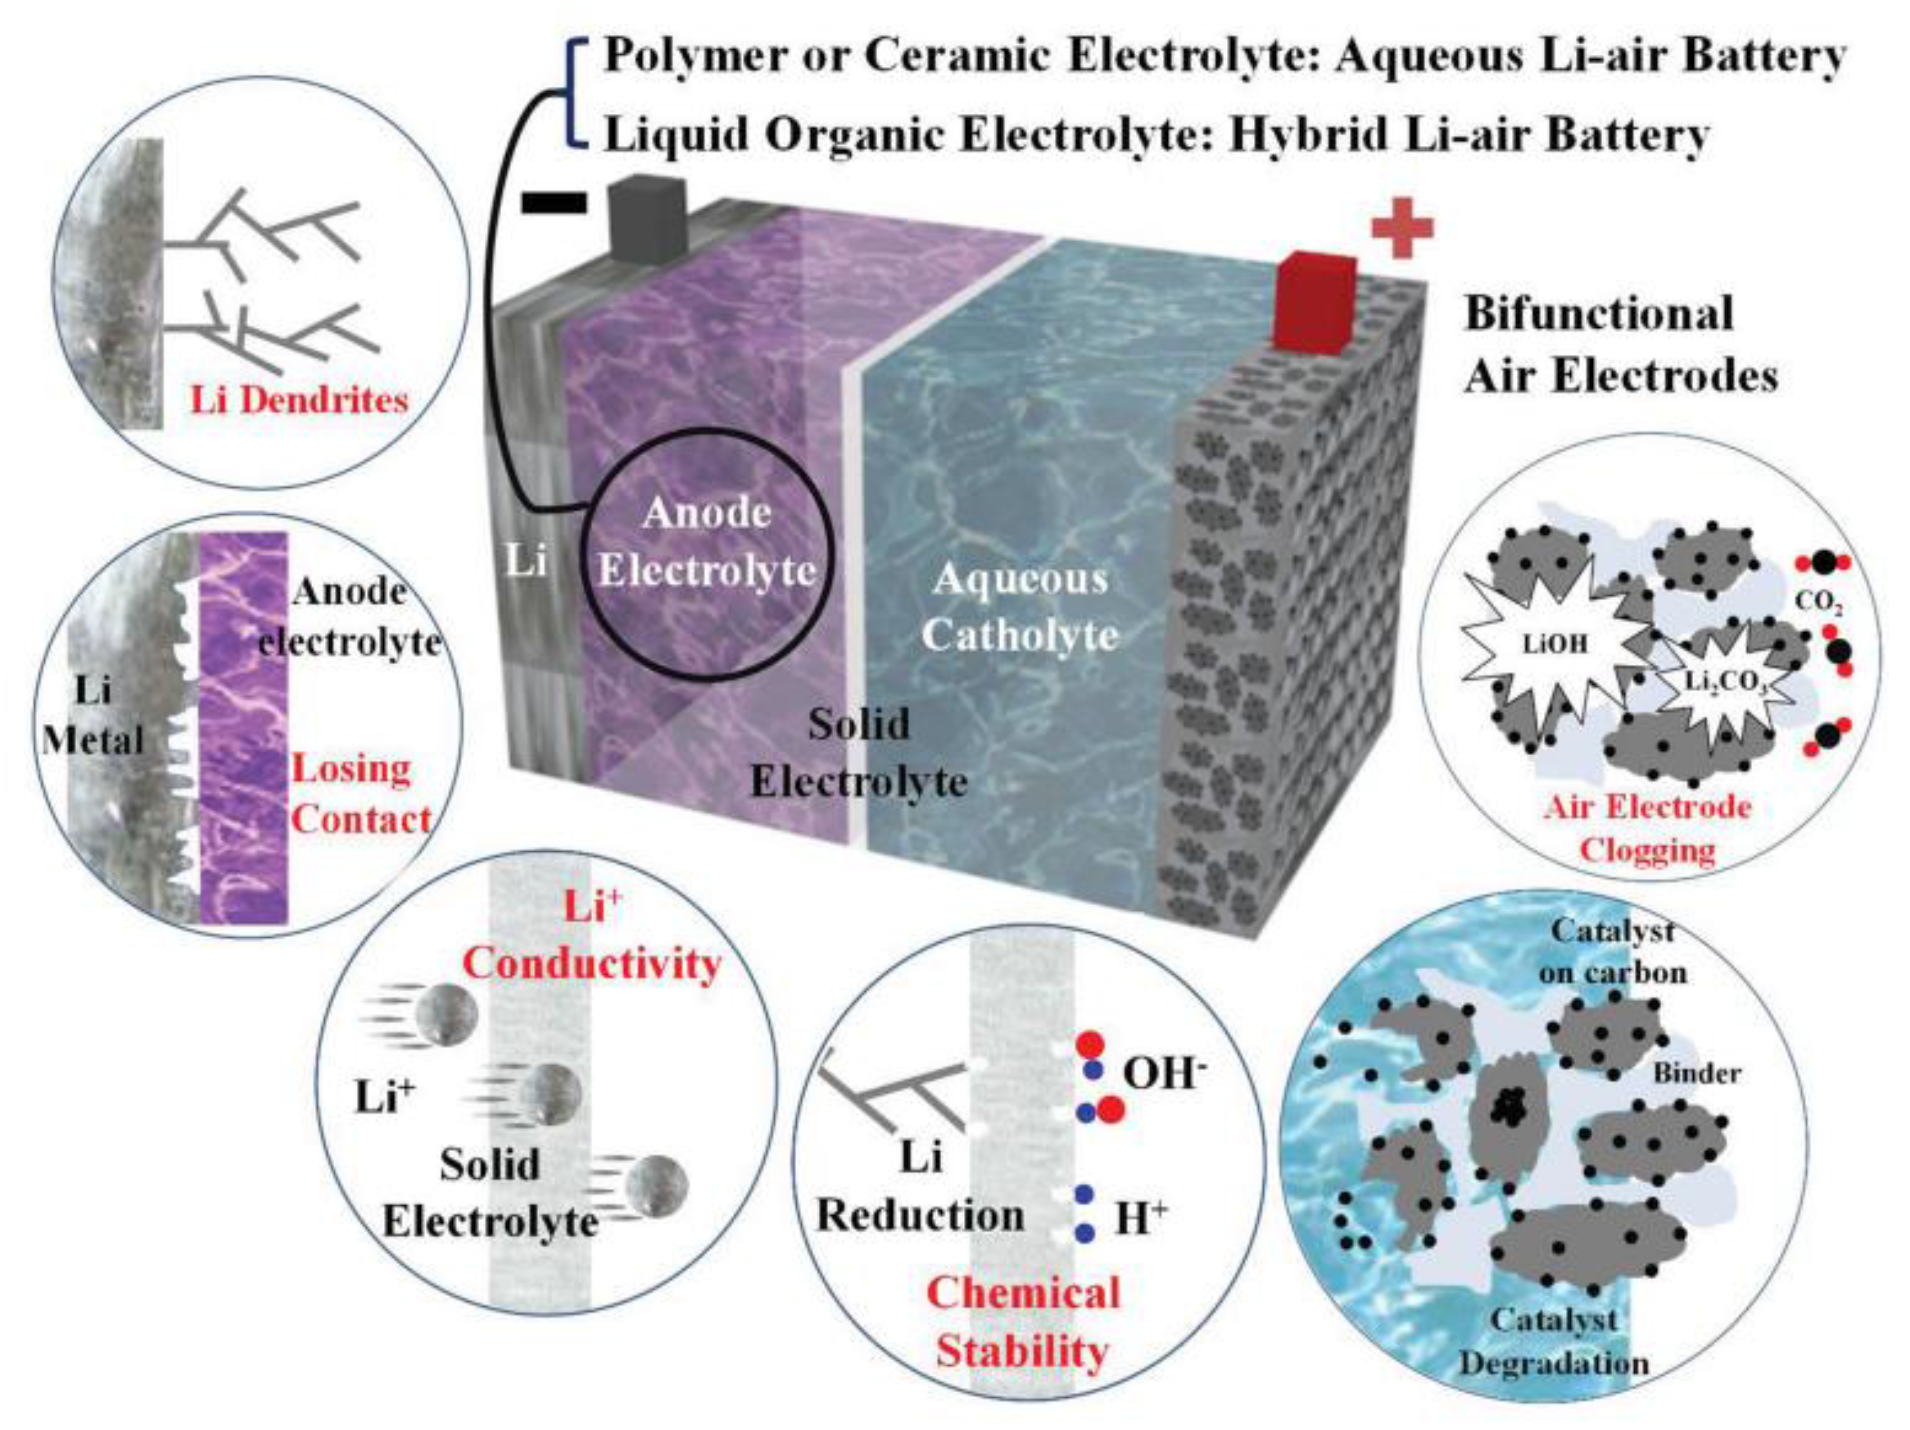
Figure 20.
Li-air battery with aqueous electrolyte at the cathode and organic electrolyte at the anode, showing the region that is discretized and simulated. Ion and electron flows during discharge are shown by arrows. Republished from Andrei et al. [28] with permission of The Electrochemical Society conveyed through Copyright Clearance Center, Inc.

Figure 21.
Minimum porosity at the cathode as a function of specific capacity. Republished from Andrei et al. [28] with permission of The Electrochemical Society conveyed through Copyright Clearance Center, Inc.
Figure 21.
Minimum porosity at the cathode as a function of specific capacity. Republished from Andrei et al. [28] with permission of The Electrochemical Society conveyed through Copyright Clearance Center, Inc.

Figure 22.
Schematic of precipitation kinetics: (a) nucleation on surfaces in a porous separator and a cathode and (b) nucleation on dust particles inside a separating bulk electrolyte with sedimentation due to gravity. Reprinted from Horstmann et al. [29], with permission from The Royal Society of Chemistry.

Figure 23.
Discharge capacity of a Li-air battery after galvanostatic discharge at i = 10 A/m2 with nucleation on dust particles as a function of density of (a) nucleation centers in the separator and (b) surface energy. Reprinted from Horstmann et al. [29], with permission from The Royal Society of Chemistry.
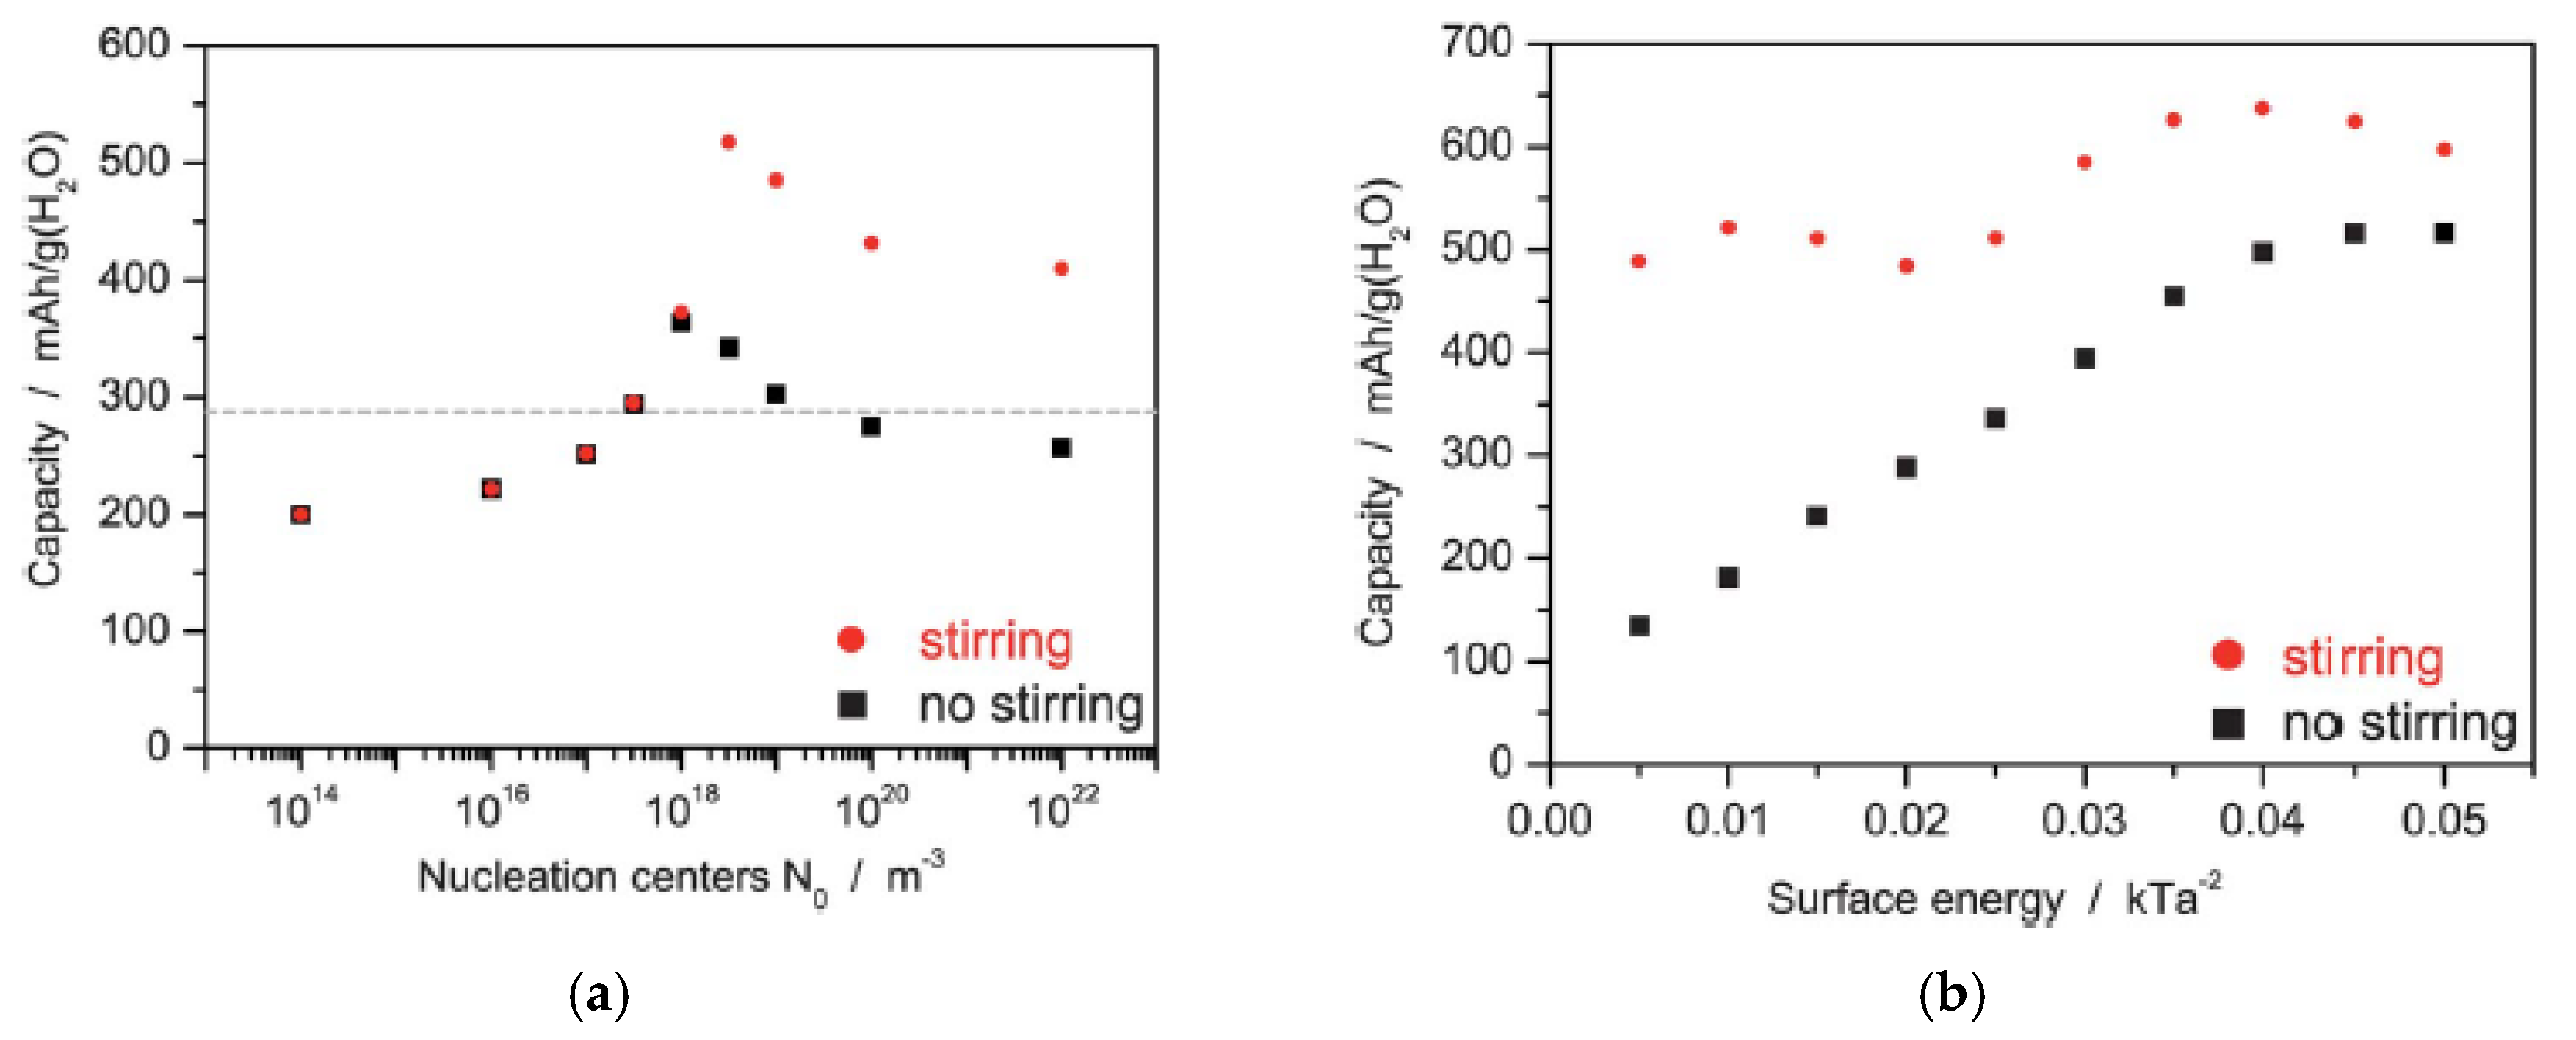
Figure 24.
Integral porograms for air cathodes before discharge (curve 1), after partial discharge of 48% at 0.25 mA/cm2 (curve 2), and after full discharge at 0.25 mA/cm2 (curve 3). Republished from Nimon et al. [30] with permission of The Electrochemical Society conveyed through Copyright Clearance Center, Inc.
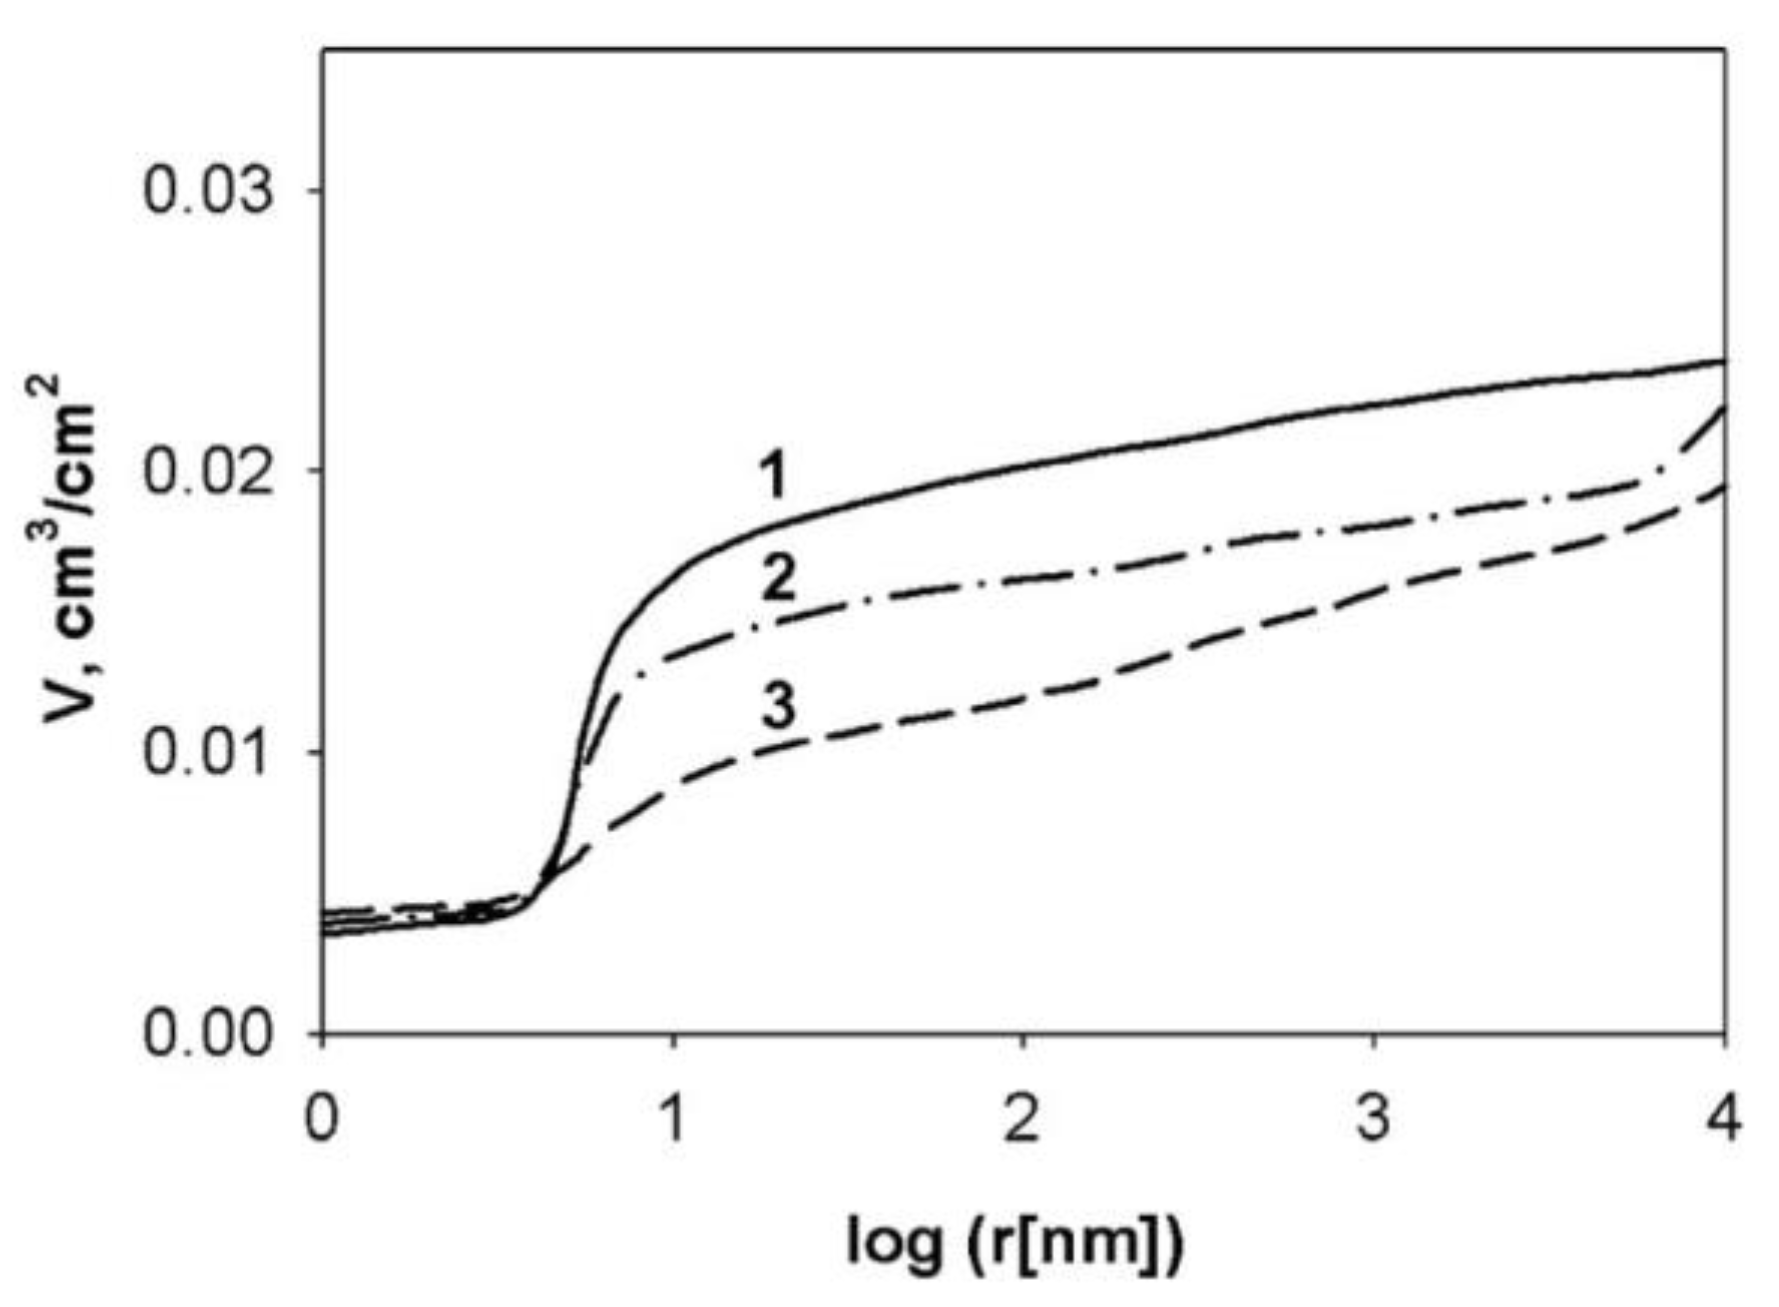
Figure 25.
Schematic diagram of reactant transport inside the porous electrode and discharge product growth on the surface of spherical electrode particles. Reprinted from Sahapatsombut et al. [10], with permission from Elsevier.
Figure 25.
Schematic diagram of reactant transport inside the porous electrode and discharge product growth on the surface of spherical electrode particles. Reprinted from Sahapatsombut et al. [10], with permission from Elsevier.
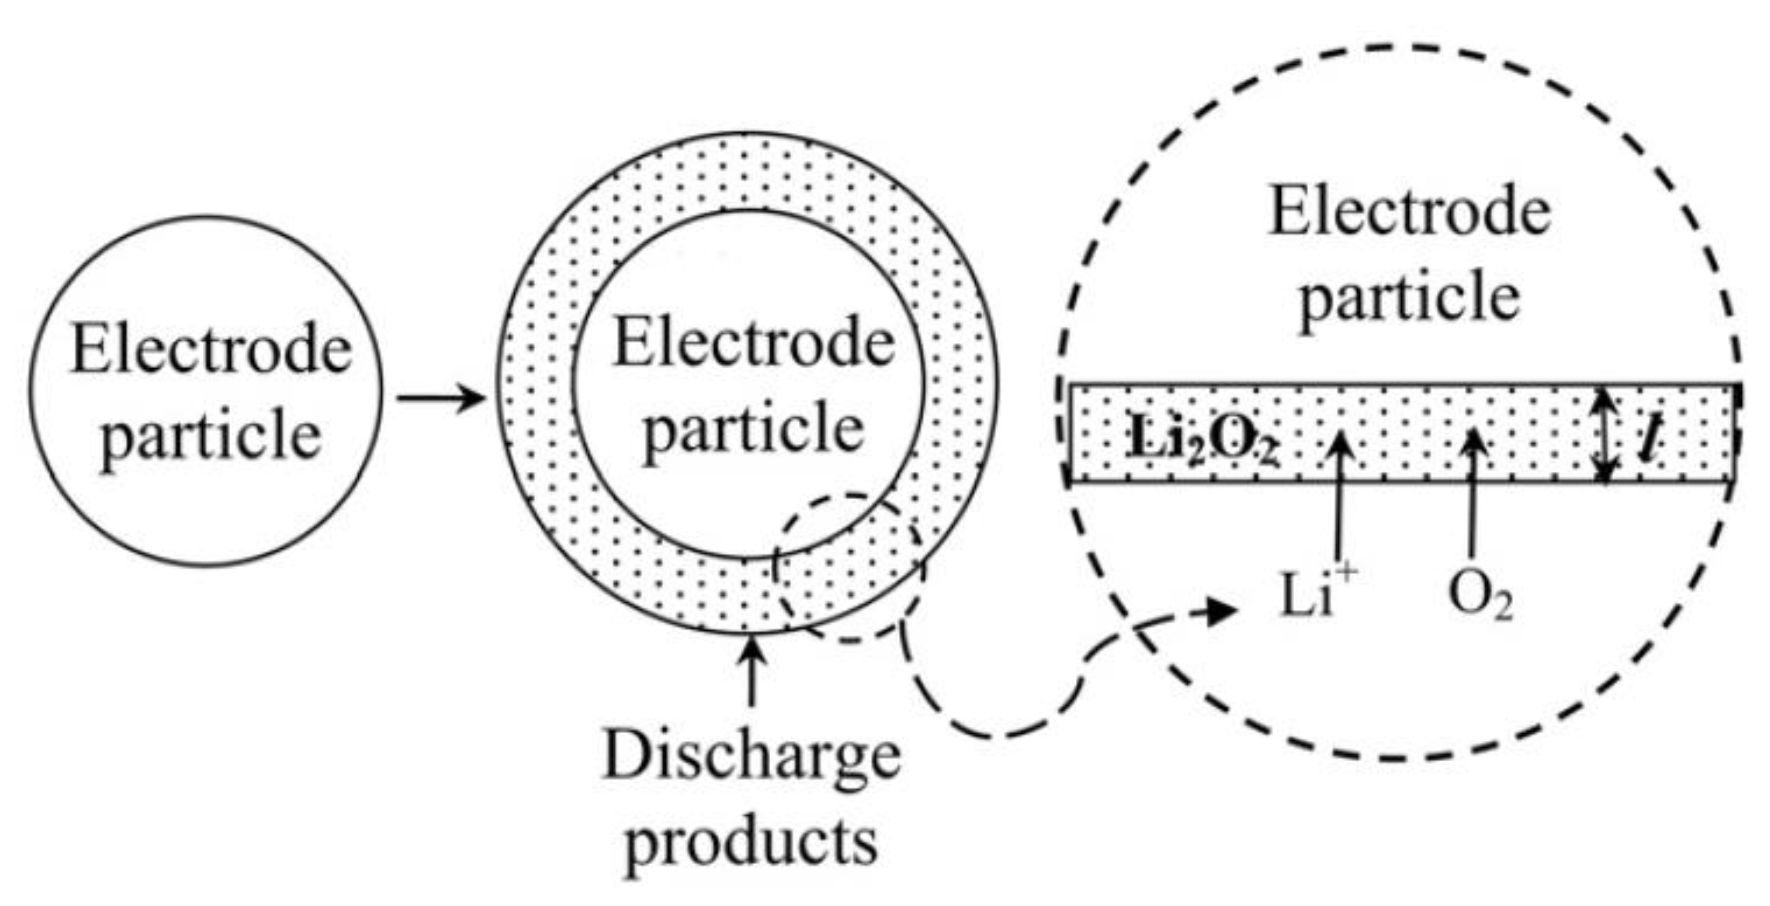
Figure 26.
Predicted cell performance of the Li-air battery at a current density of 0.1 mA/cm2 as a function of (a) cathodic rate constant and (b) Li2O2 solubility factor. Reprinted from Sahapatsombut et al. [10] , with permission from Elsevier.
Figure 26.
Predicted cell performance of the Li-air battery at a current density of 0.1 mA/cm2 as a function of (a) cathodic rate constant and (b) Li2O2 solubility factor. Reprinted from Sahapatsombut et al. [10] , with permission from Elsevier.

Figure 27.
Cyclic performance (discharge capacity and capacity retention against cycle number) of a 10-cycle rechargeable Li-air battery considering Li2CO3 formation by electrolyte degradation. Reprinted from Sahapatsombut et al. [37], with permission from Elsevier.
Figure 27.
Cyclic performance (discharge capacity and capacity retention against cycle number) of a 10-cycle rechargeable Li-air battery considering Li2CO3 formation by electrolyte degradation. Reprinted from Sahapatsombut et al. [37], with permission from Elsevier.
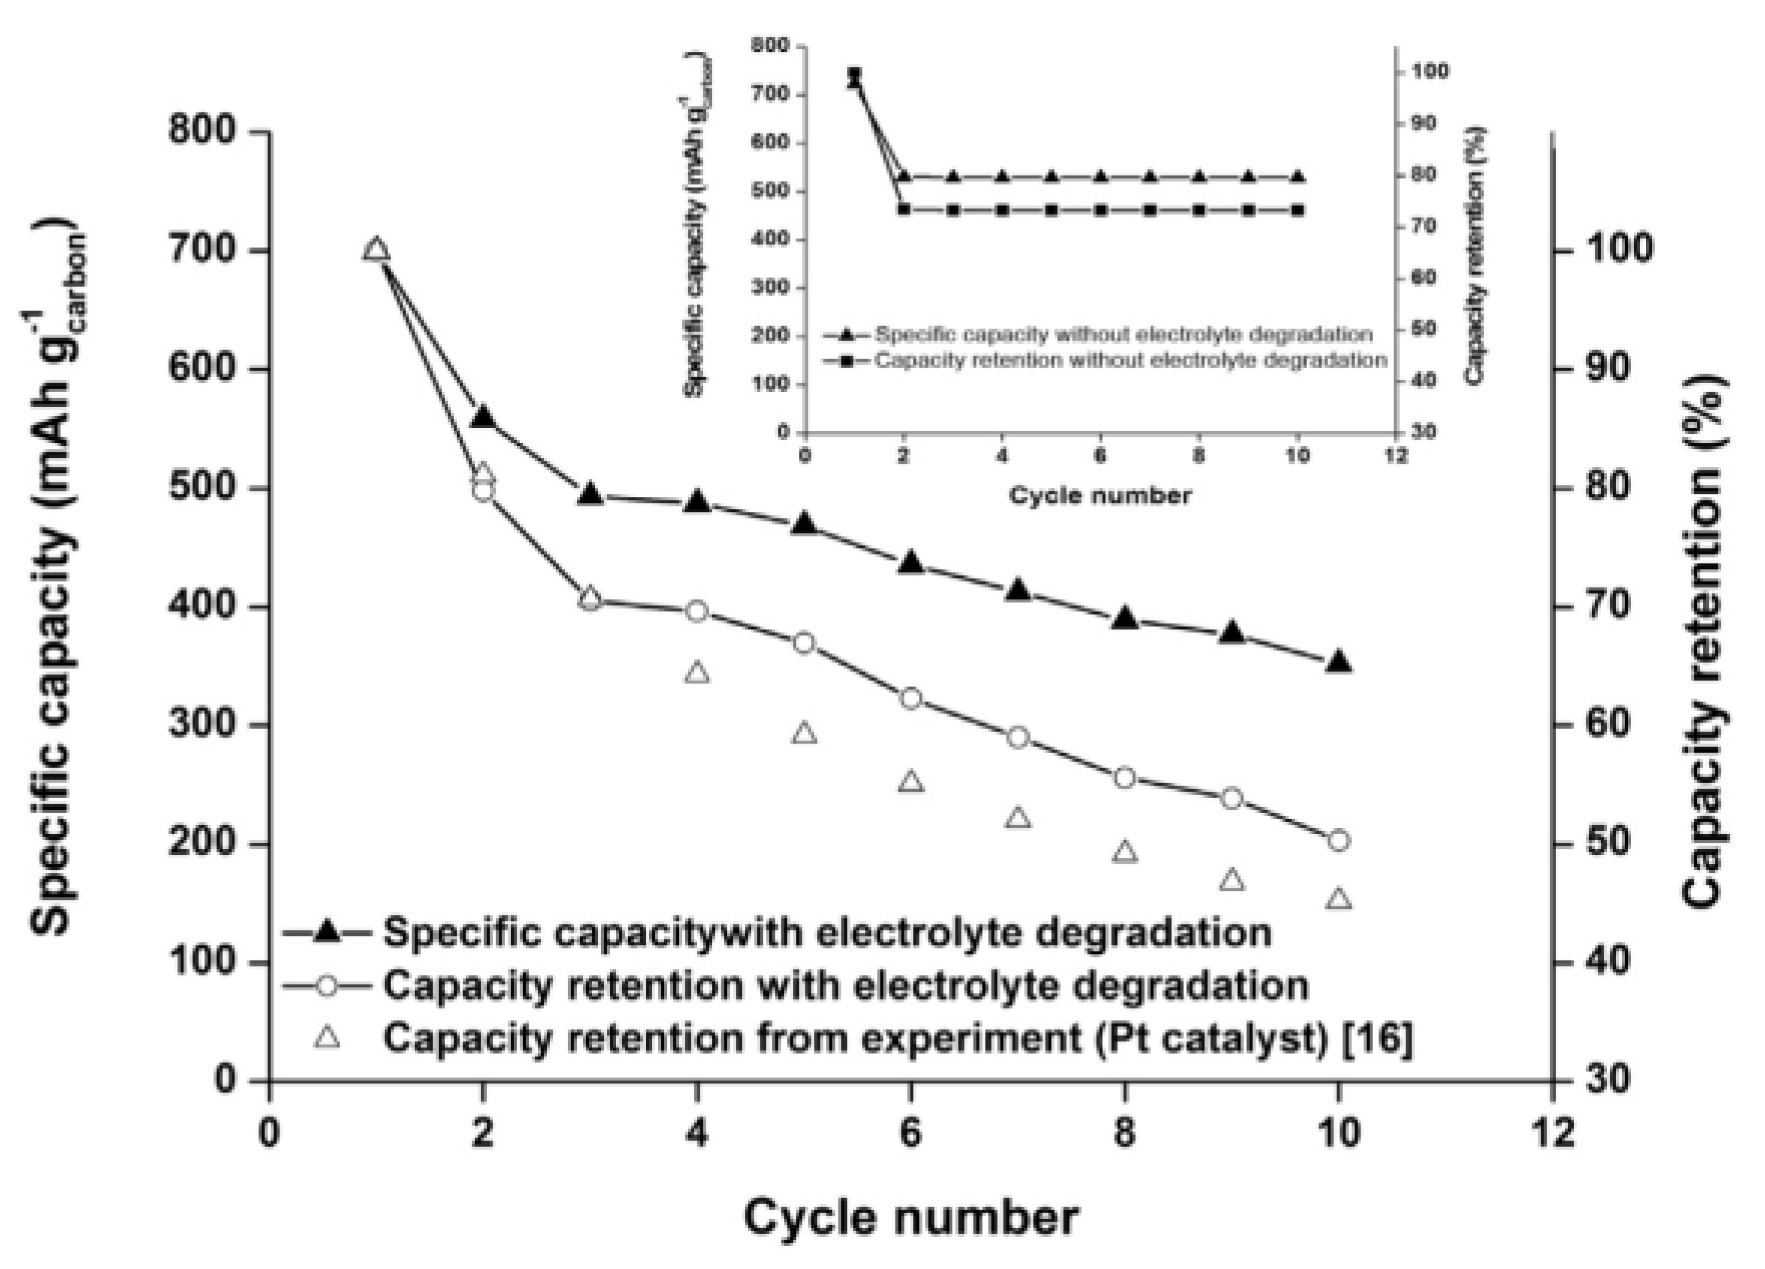
Figure 28.
Schematic of the computation domain of a Li-air battery during discharge operation. (a) Li-air battery operation with ambient air feeding. Inset demonstrates the formation of discharge products, such as Li2O2 and Li2CO3, covering the porous carbon surface; (b) Li-air battery protected by an oxygen-selective membrane at the cathode. Reprinted from Sahapatsombut et al. [38], with permission from Elsevier.
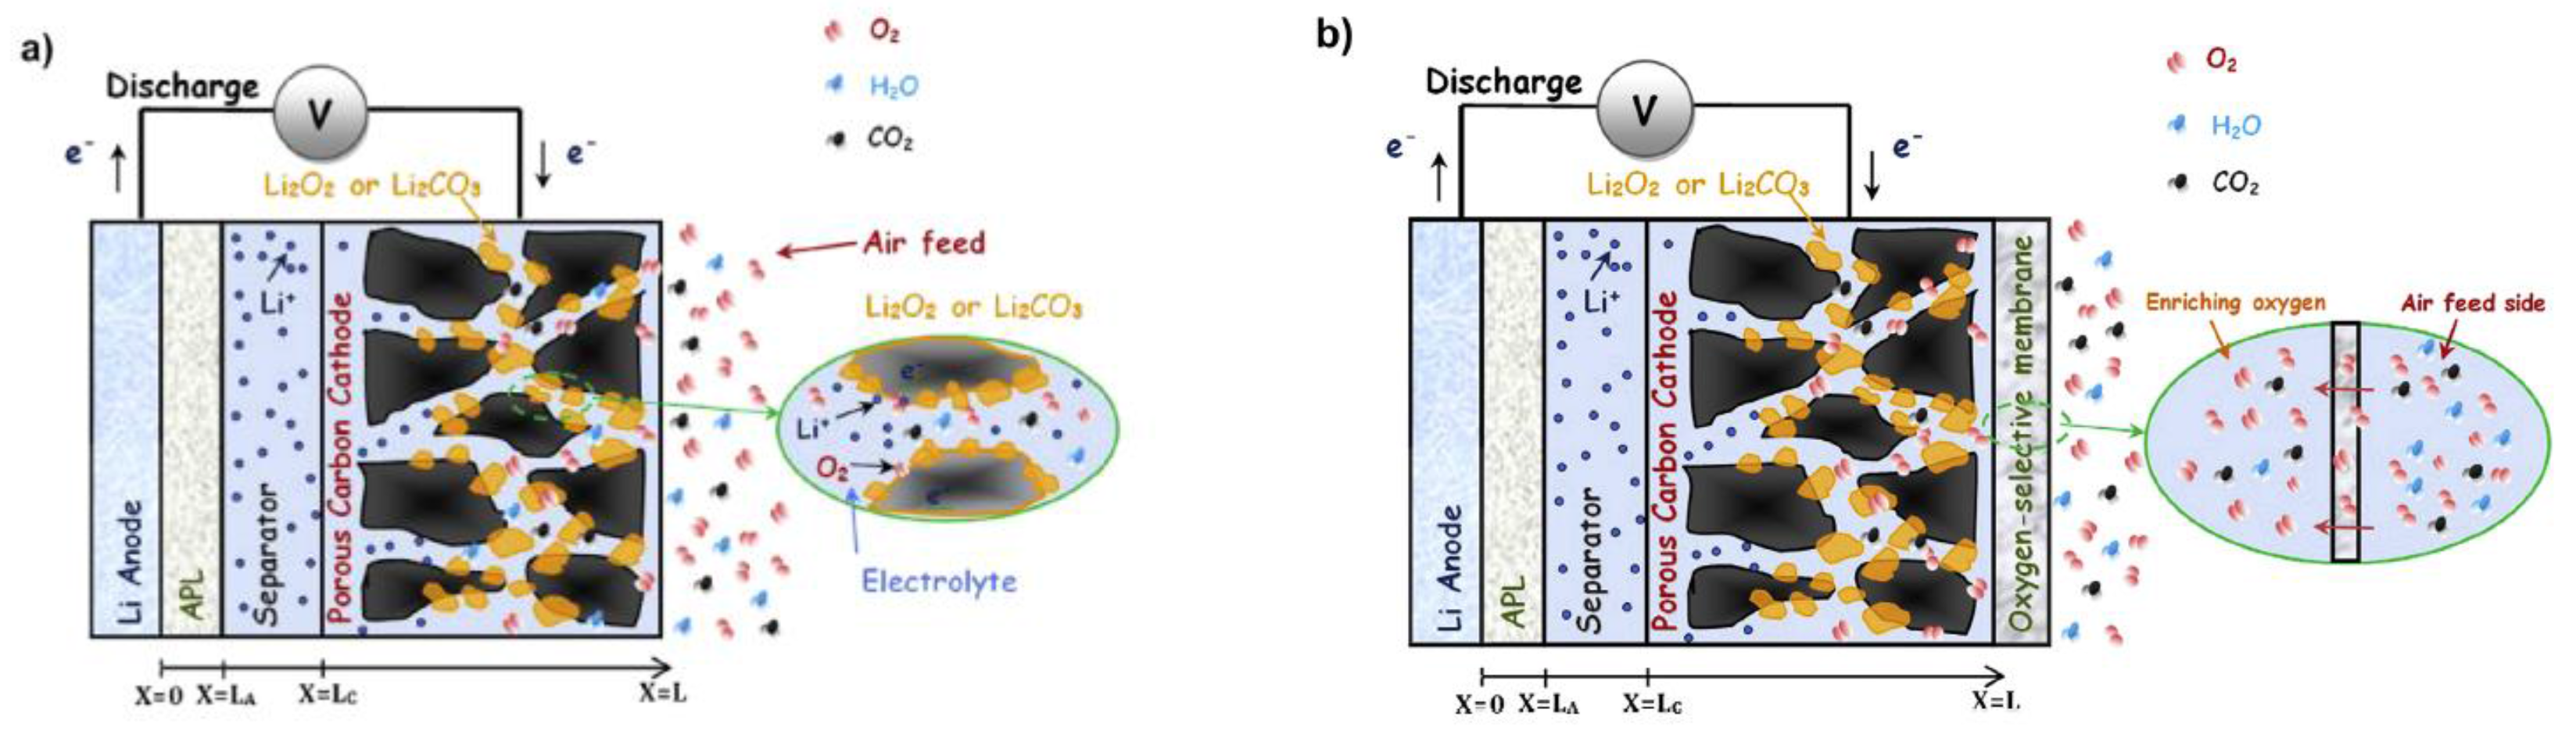
Figure 29.
(a) Comparison of voltage–capacity curves for a nonaqueous Li-air battery operated in ambient air with and without an oxygen-selective membrane at a rate of 0.05 mA/cm2 (b) Effect of oxygen permeability on maximum specific discharge capacity at different discharge rates for a nonaqueous Li-air battery protected with a 50-mm-thick oxygen-selective membrane. Reprinted from Sahapatsombut et al. [38], with permission from Elsevier.

Figure 30.
Electric performance of battery depending on (a) separator thickness; (b) separator porosity; and (c) load current. Adapted with copyright permission from Yoo et al. [39], with permission from Elsevier.
Figure 30.
Electric performance of battery depending on (a) separator thickness; (b) separator porosity; and (c) load current. Adapted with copyright permission from Yoo et al. [39], with permission from Elsevier.
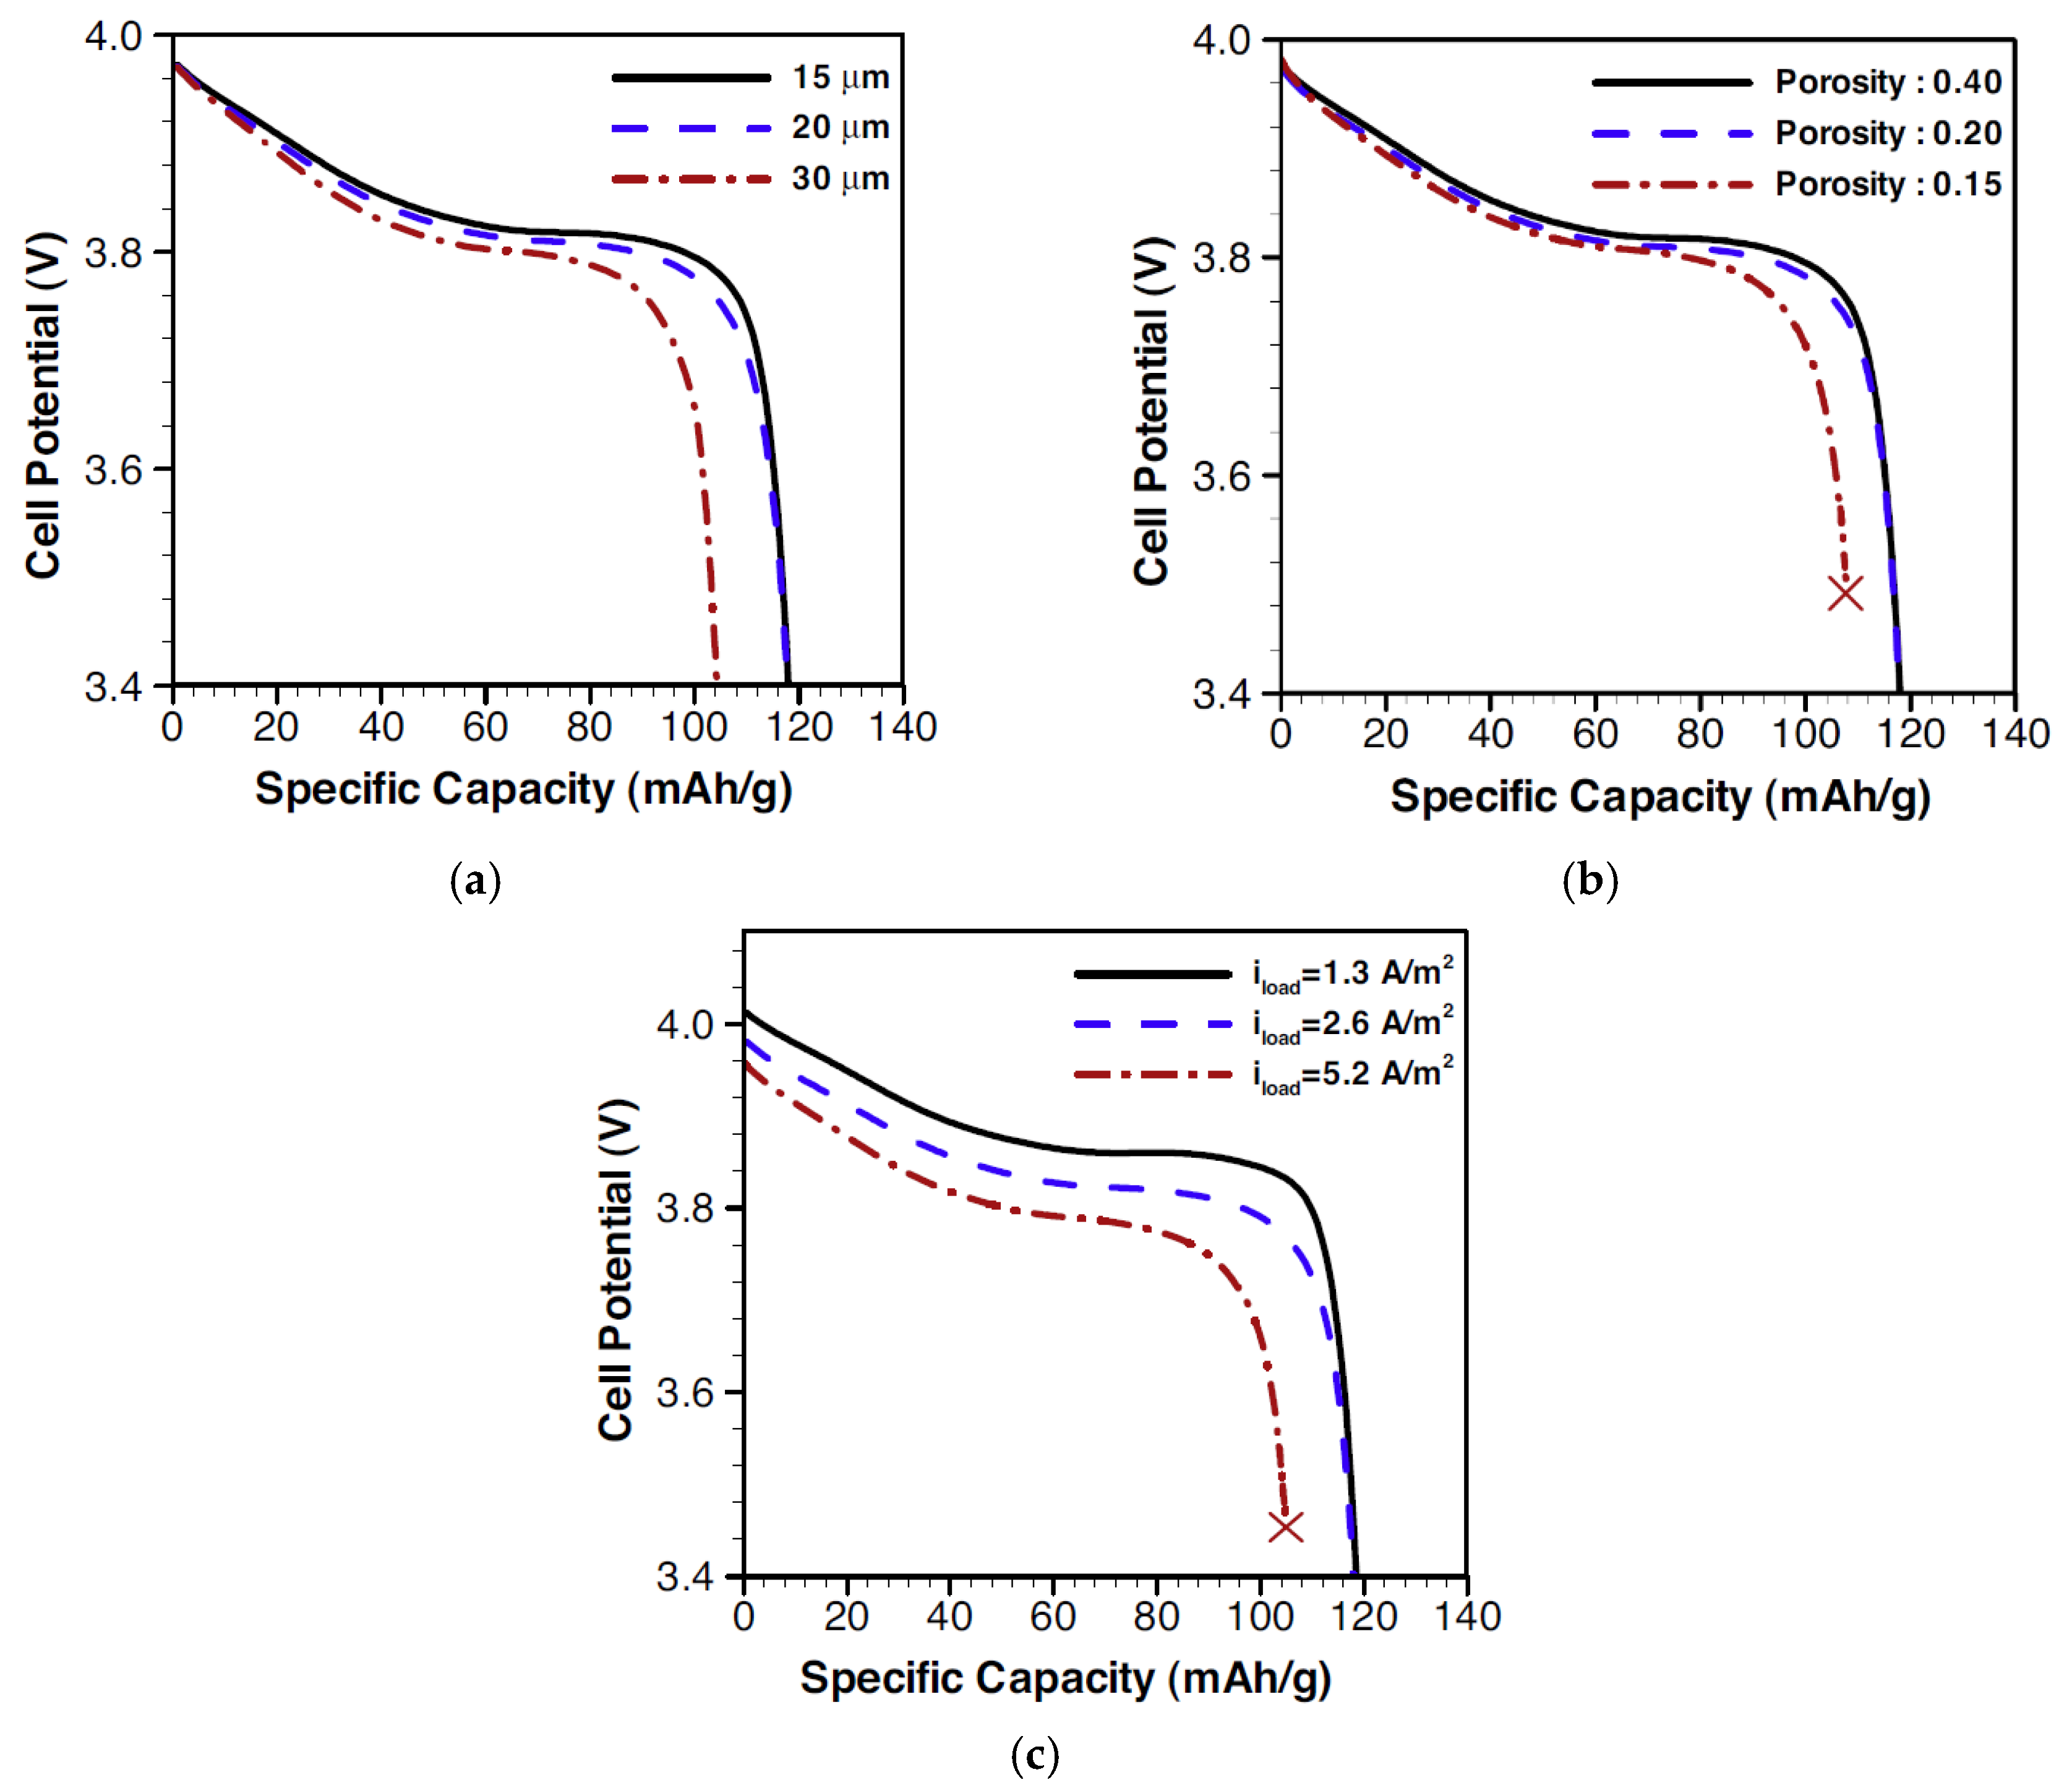
Figure 31.
Electrical performance of a Li-air cell during discharge for an applied load current density of (a) 2 A/m2; (b) 3 A/m2; and (c) 4 A/m2; (d) Maximum specific capacity ratio with respect to maximum specific capacity at 1 A/m2 for various load current conditions is shown. Adapted with copyright permission from Yoo et al. [44], with permission from Elsevier.

Figure 32.
Volume fractions of Li2O2 in the electrode with 50% open ratio after discharge. Electrode is 800-μm thick and discharged at 0.2 mA/cm2. Republished from Li and Fargri [45] with permission of The Electrochemical Society conveyed through Copyright Clearance Center, Inc.
Figure 32.
Volume fractions of Li2O2 in the electrode with 50% open ratio after discharge. Electrode is 800-μm thick and discharged at 0.2 mA/cm2. Republished from Li and Fargri [45] with permission of The Electrochemical Society conveyed through Copyright Clearance Center, Inc.

Figure 33.
(a) An active Li-oxygen battery system; (b) interdigital channel at the cathode; and (c) cross-sectional view of interdigital channels. Republished from Li et al. [46], with permission of The Electrochemical Society conveyed through Copyright Clearance Center, Inc.
Figure 33.
(a) An active Li-oxygen battery system; (b) interdigital channel at the cathode; and (c) cross-sectional view of interdigital channels. Republished from Li et al. [46], with permission of The Electrochemical Society conveyed through Copyright Clearance Center, Inc.
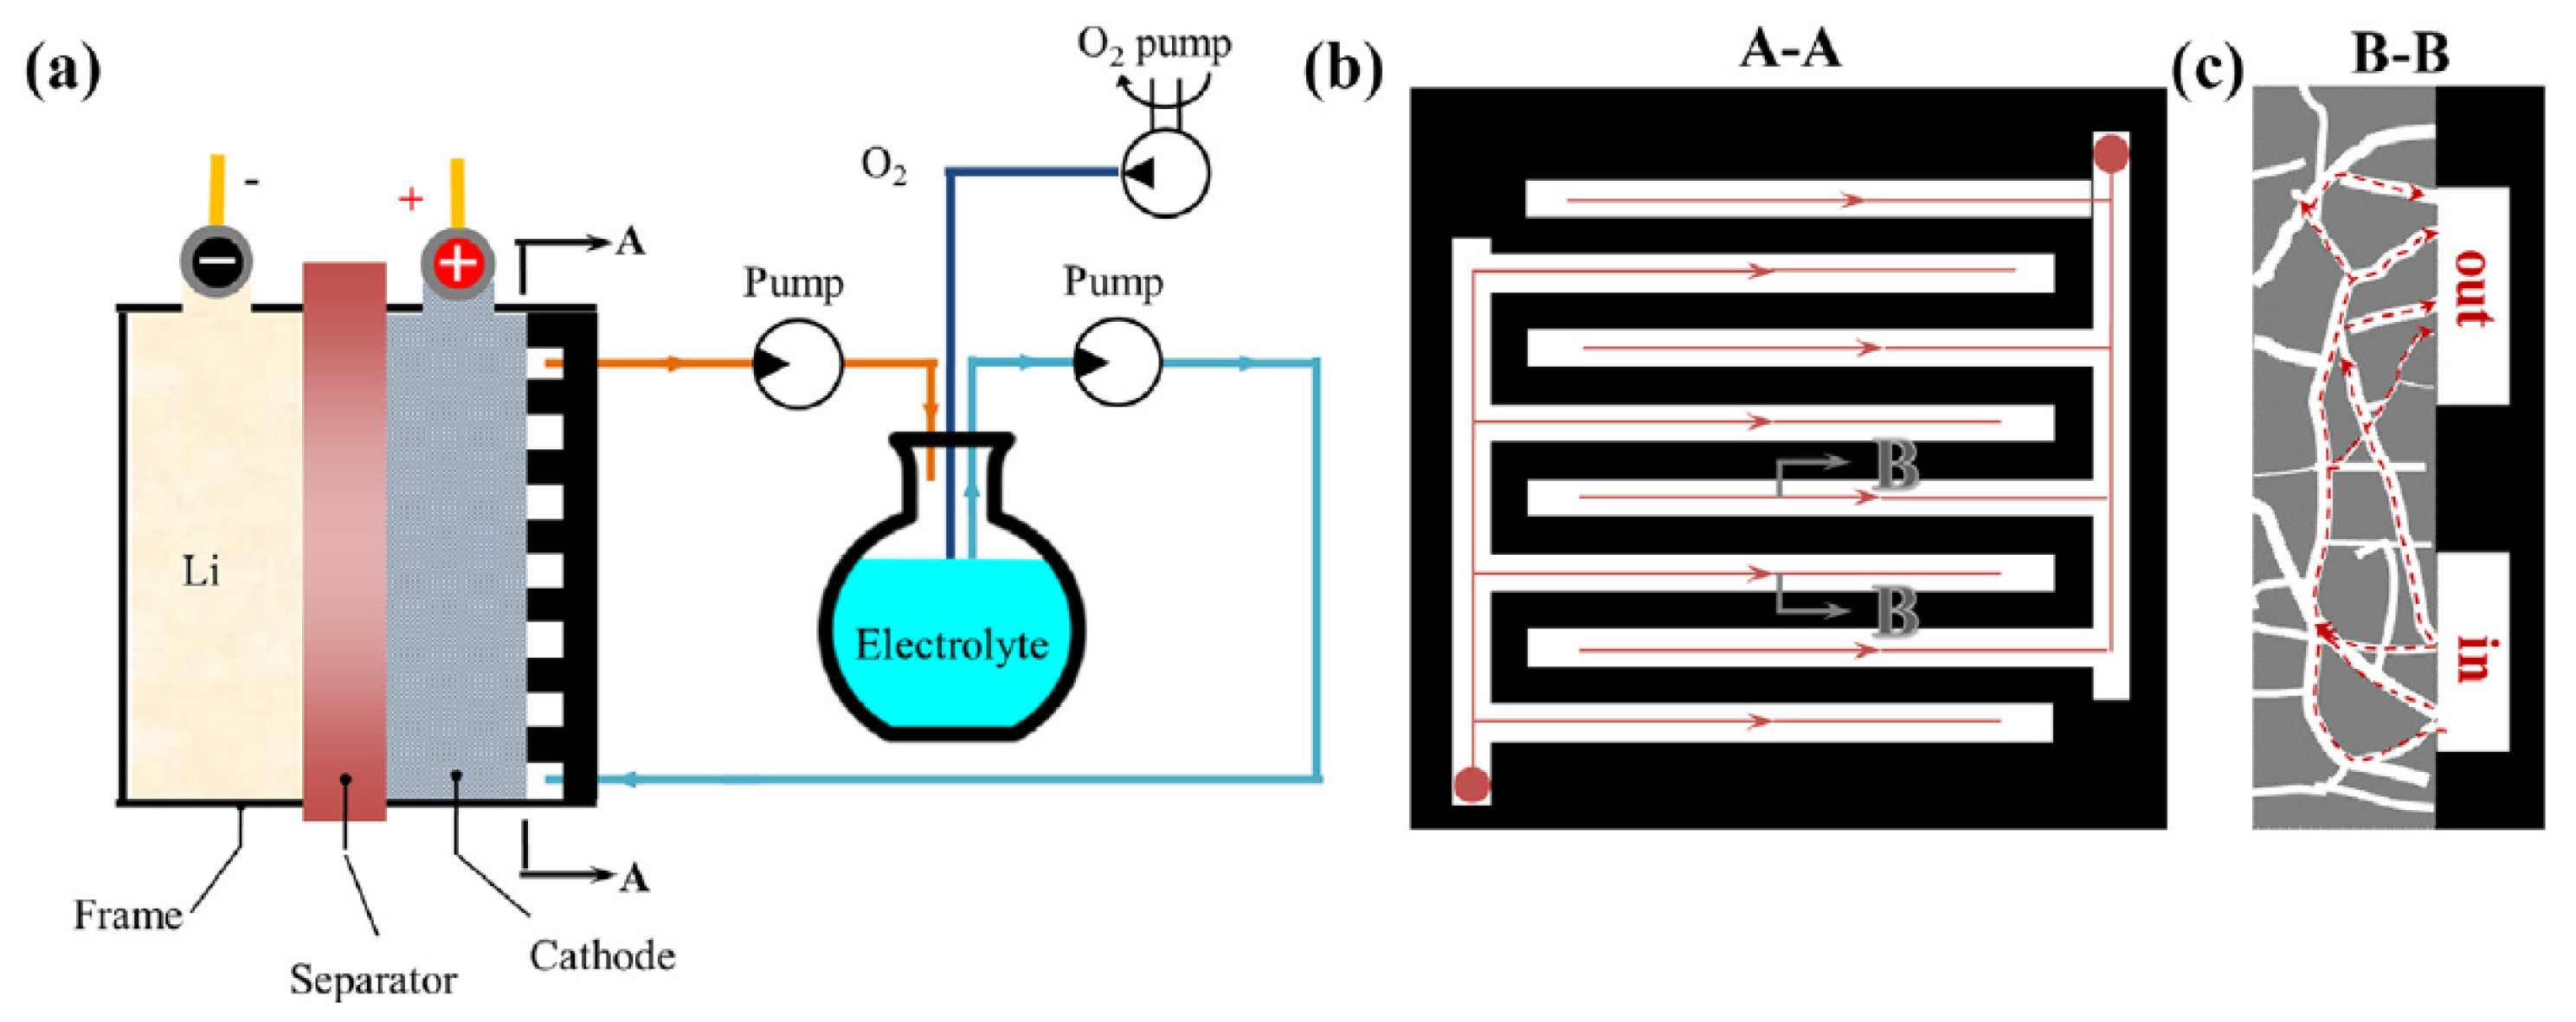
Figure 34.
Comparison of voltage vs. specific capacity curves for Li-oxygen cells with passive and active cathodes. Here the discharge current density is 0.2 mA/cm2. Republished from Li et al. [46] with permission of The Electrochemical Society conveyed through Copyright Clearance Center, Inc.
Figure 34.
Comparison of voltage vs. specific capacity curves for Li-oxygen cells with passive and active cathodes. Here the discharge current density is 0.2 mA/cm2. Republished from Li et al. [46] with permission of The Electrochemical Society conveyed through Copyright Clearance Center, Inc.

Figure 35.
(a) Performance curves of Li-air cells and (b) distribution of Li2O2 volume fractions of active Li–oxygen cells with gradient electrode porosities. Republished from Li et al. [46] with permission of The Electrochemical Society conveyed through Copyright Clearance Center, Inc.
Figure 35.
(a) Performance curves of Li-air cells and (b) distribution of Li2O2 volume fractions of active Li–oxygen cells with gradient electrode porosities. Republished from Li et al. [46] with permission of The Electrochemical Society conveyed through Copyright Clearance Center, Inc.
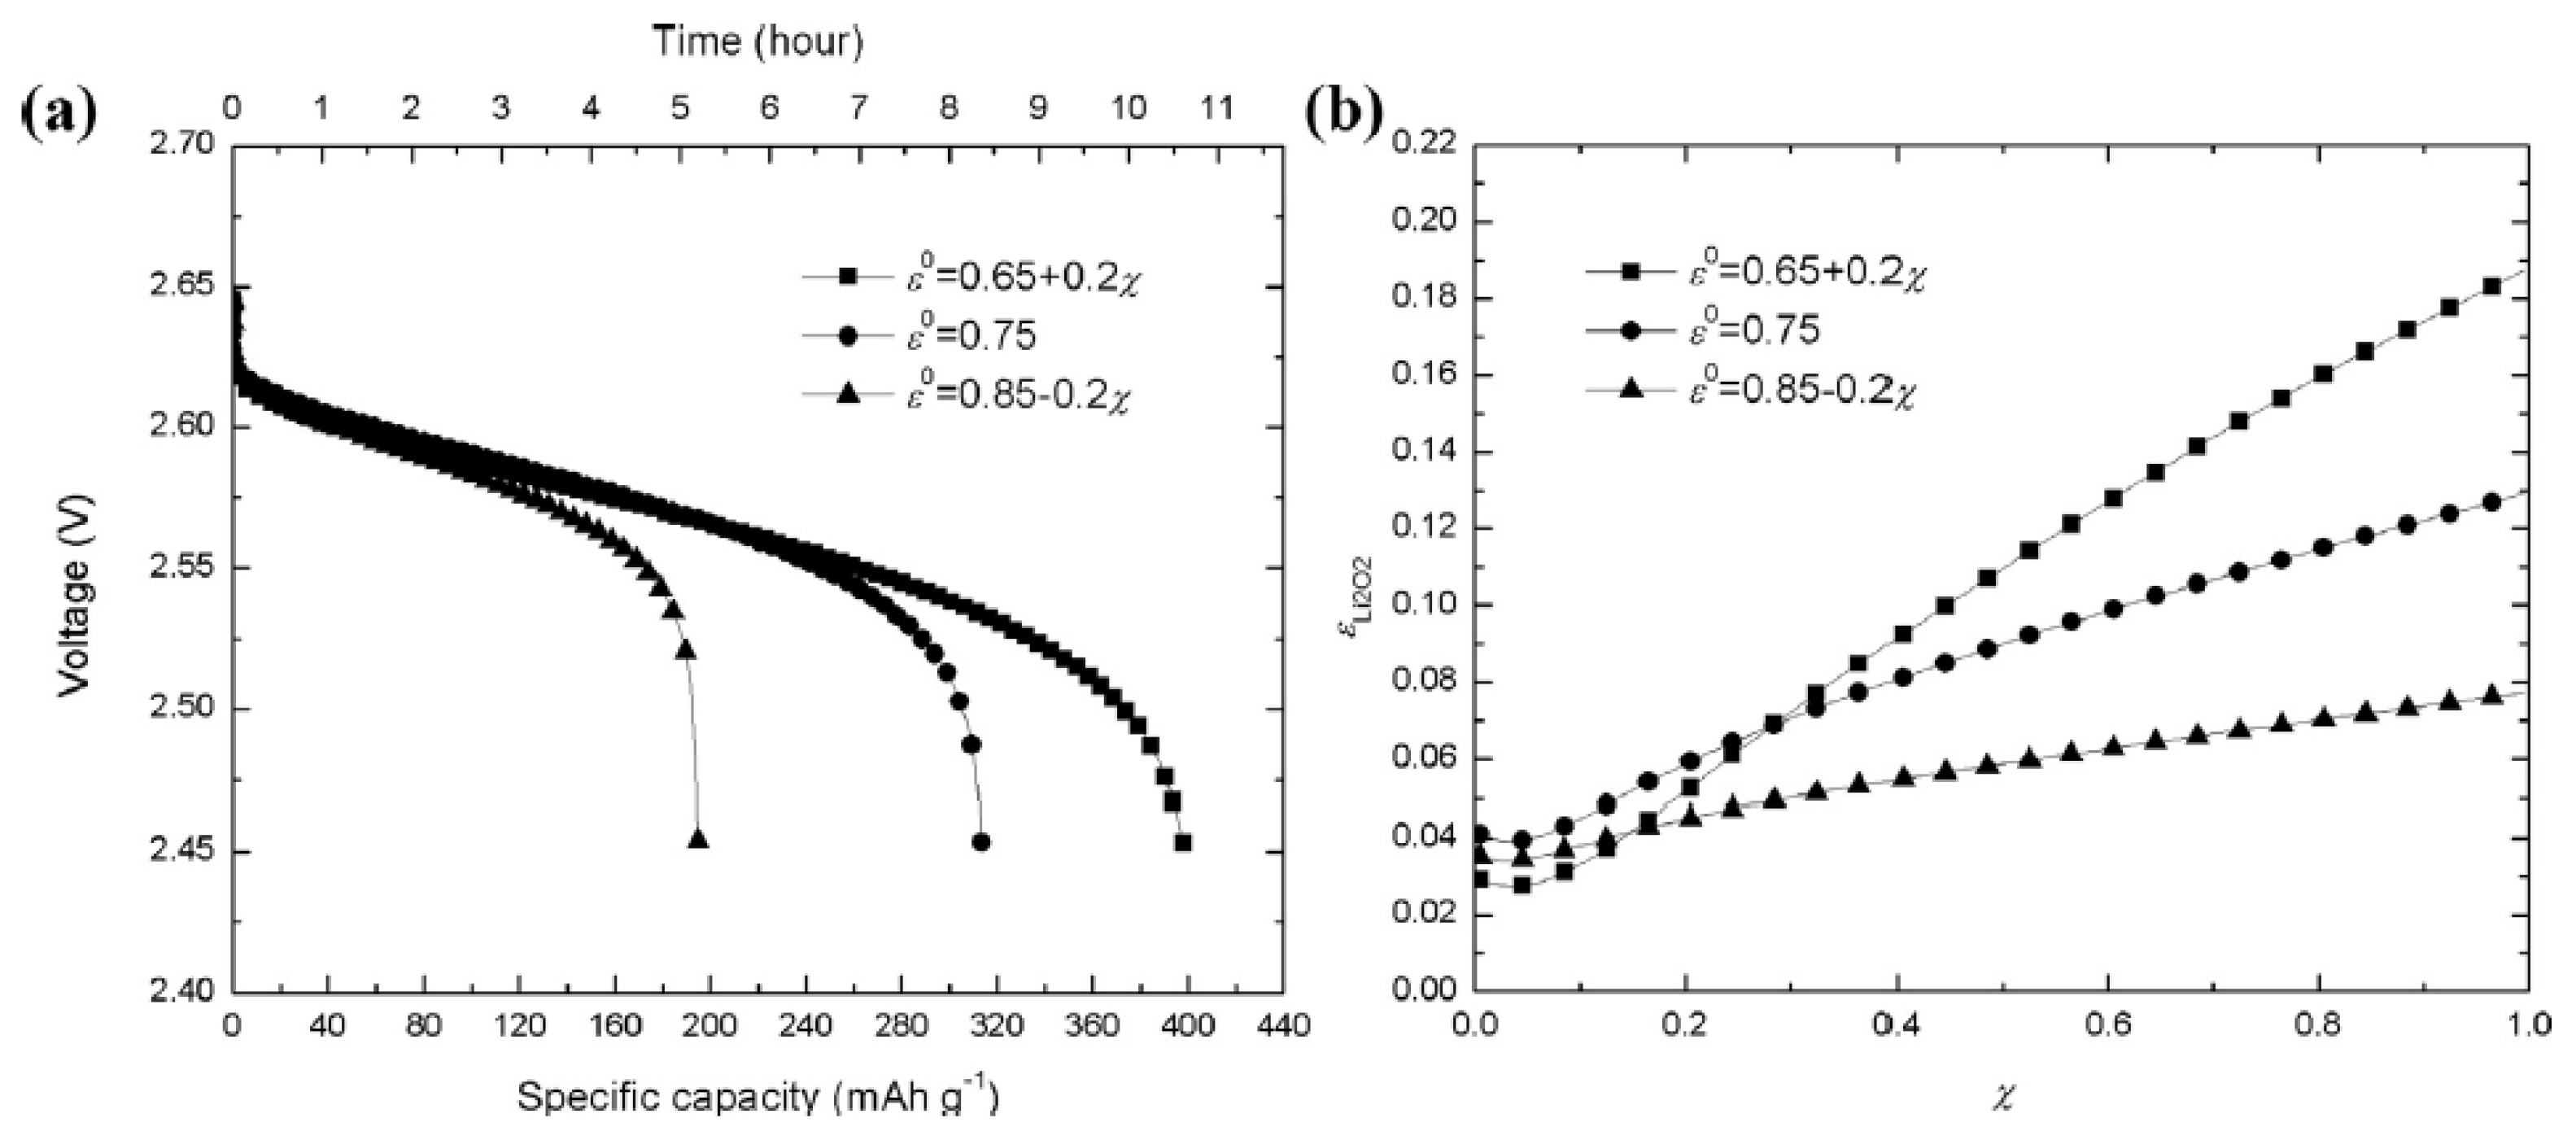
Figure 36.
The calculated width of the electrochemical stability windows (ESWs) of select ionic liquids obtained by the thermodynamic cycle and highest occupied molecular orbital and lowest unoccupied molecular orbital (HOMO/LUMO) methods compared to the experimental values [60]. Adapted with copyright permission from Kazemiabnavi et al. [58]. Copyright© 2016, American Chemical Society.
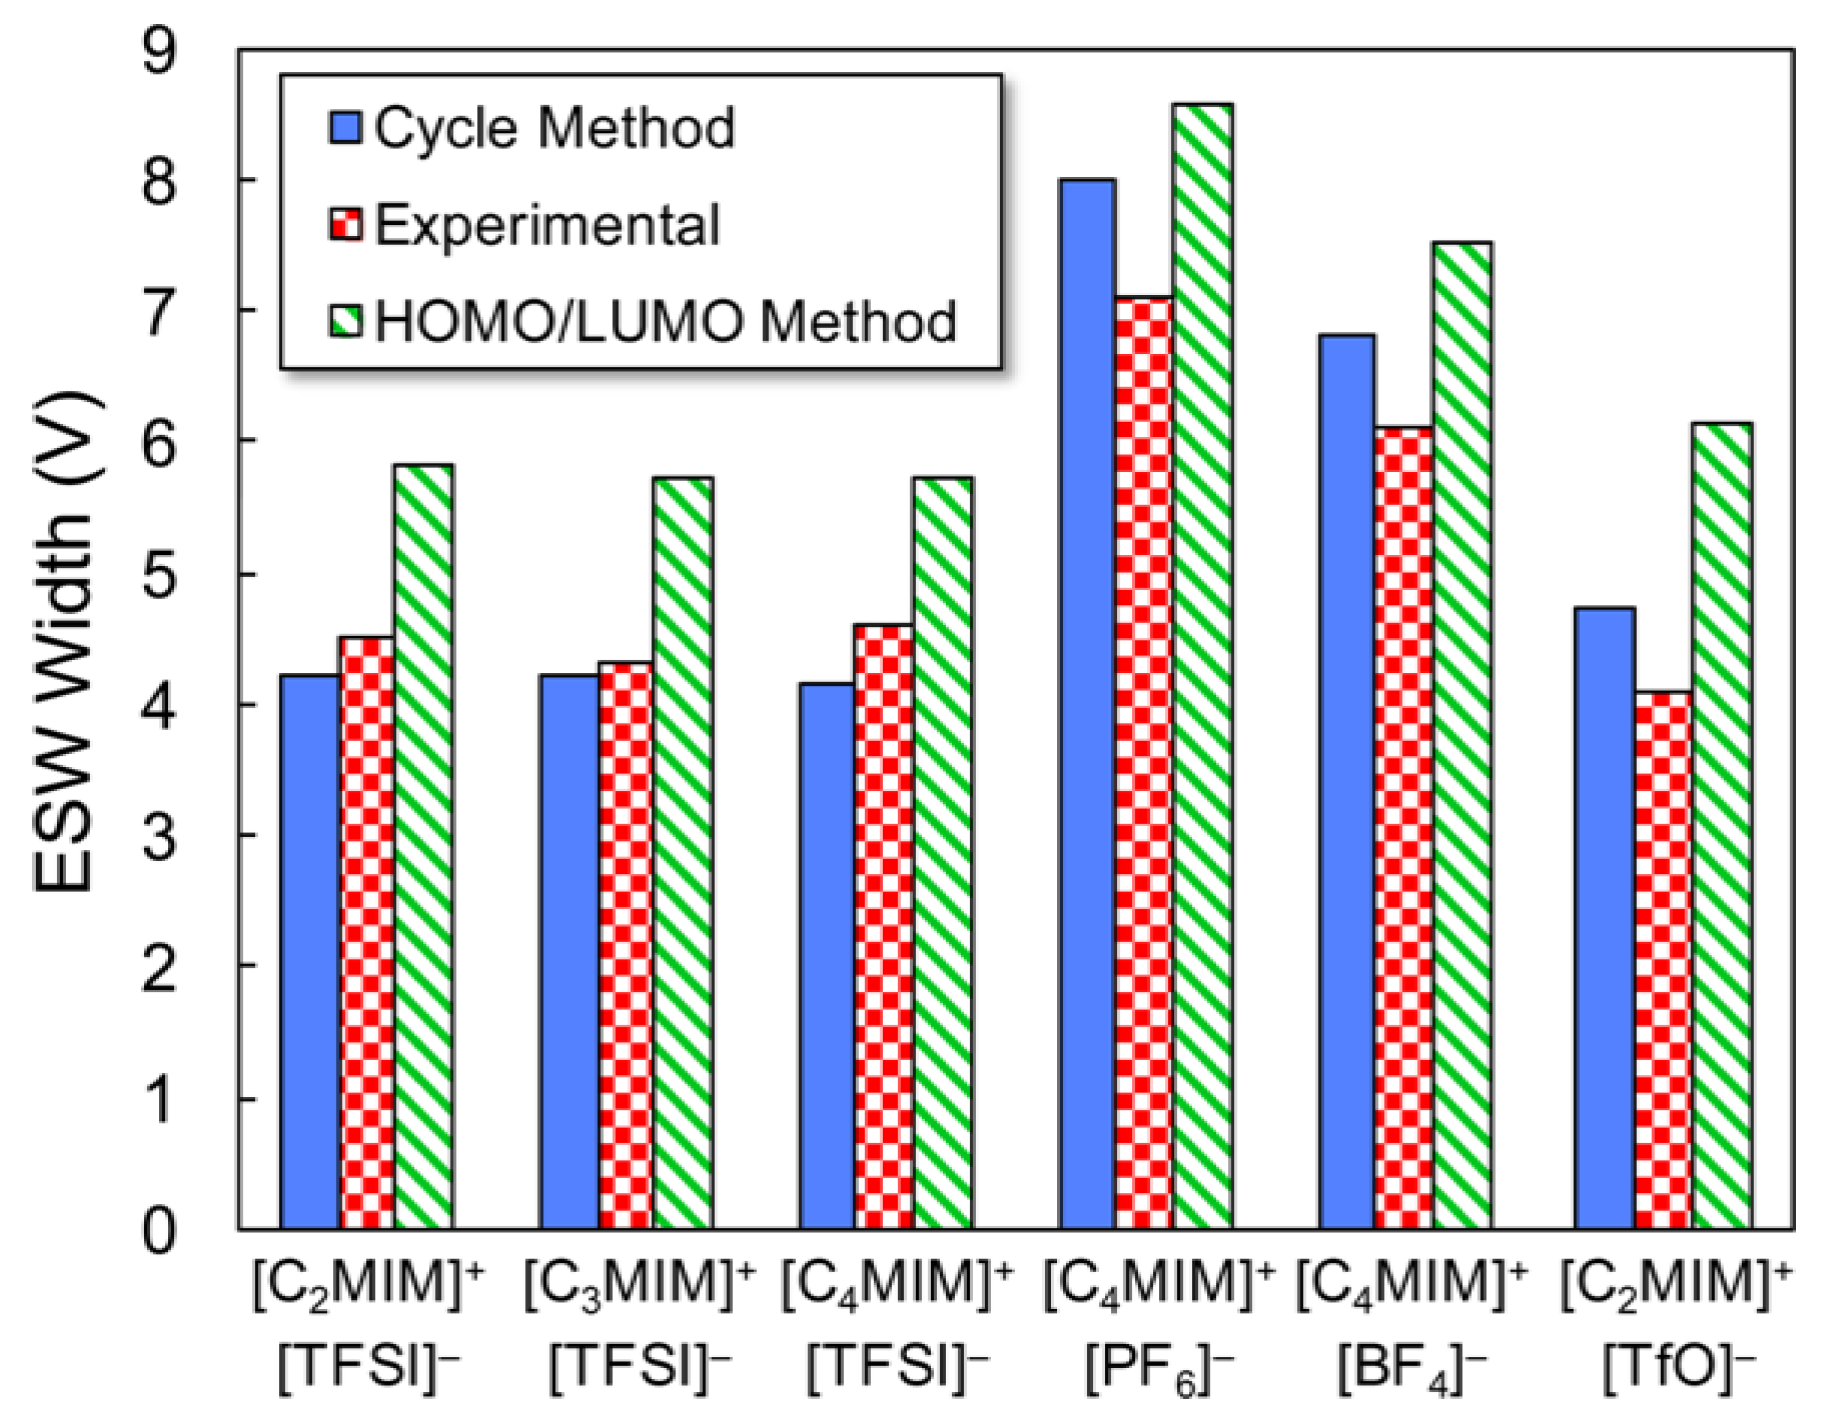
Figure 37.
(a) Free energy as a function of Li+ − O2− aggregation and separation in EMI-TFSI and in DMSO under dilute condition. Snapshots of Li+ − O2− clusters formed in (b) EMI-TFSI and (c) DMSO after 200 ns. Adapted with copyright permission from Akagi et al. [62]. Copyright© 2016, American Chemical Society.
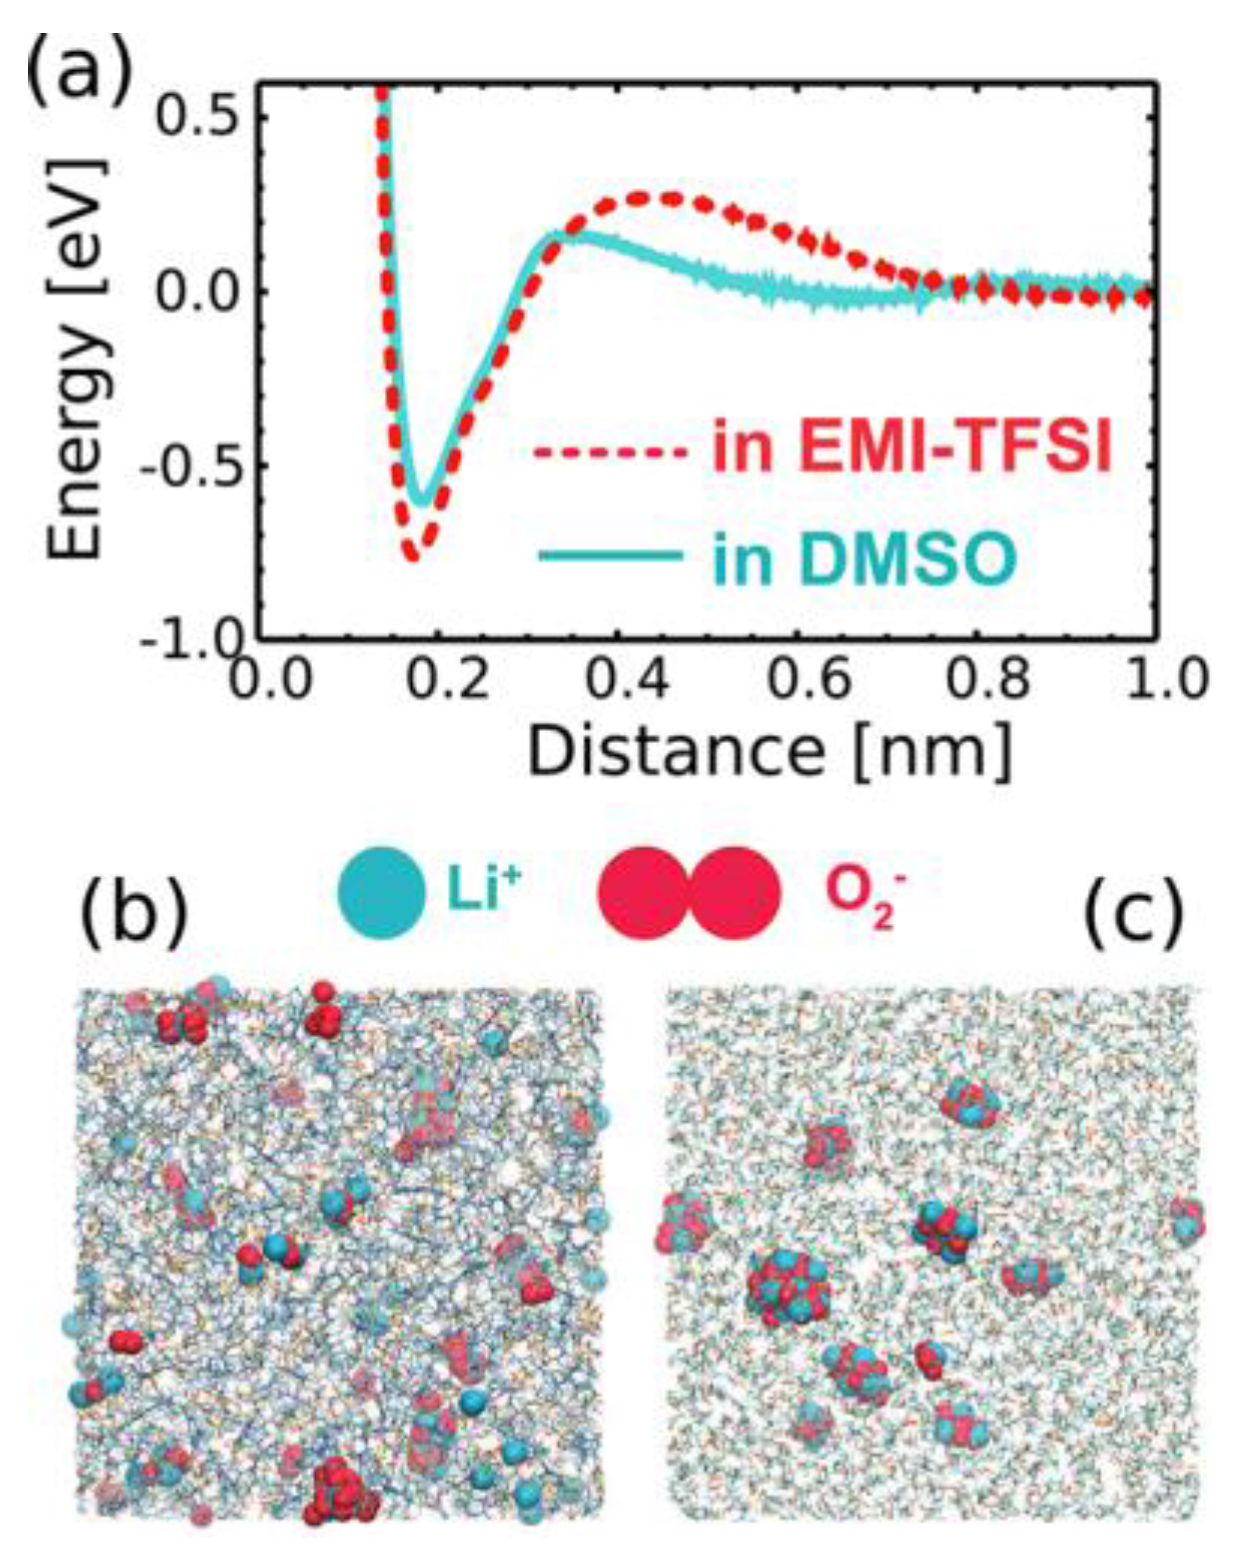
Figure 38.
Schematic diagram of the reaction profile for the nucleophilic attack by LiO2− (solv) on −CH2− of DME (going right) and DME with one hydrogen replaced with fluorine (going left) together with the structures of the reaction complex, transition state complex, and product. Republished from Chau et al. [64] with permission of The Electrochemical Society conveyed through Copyright Clearance Center, Inc.
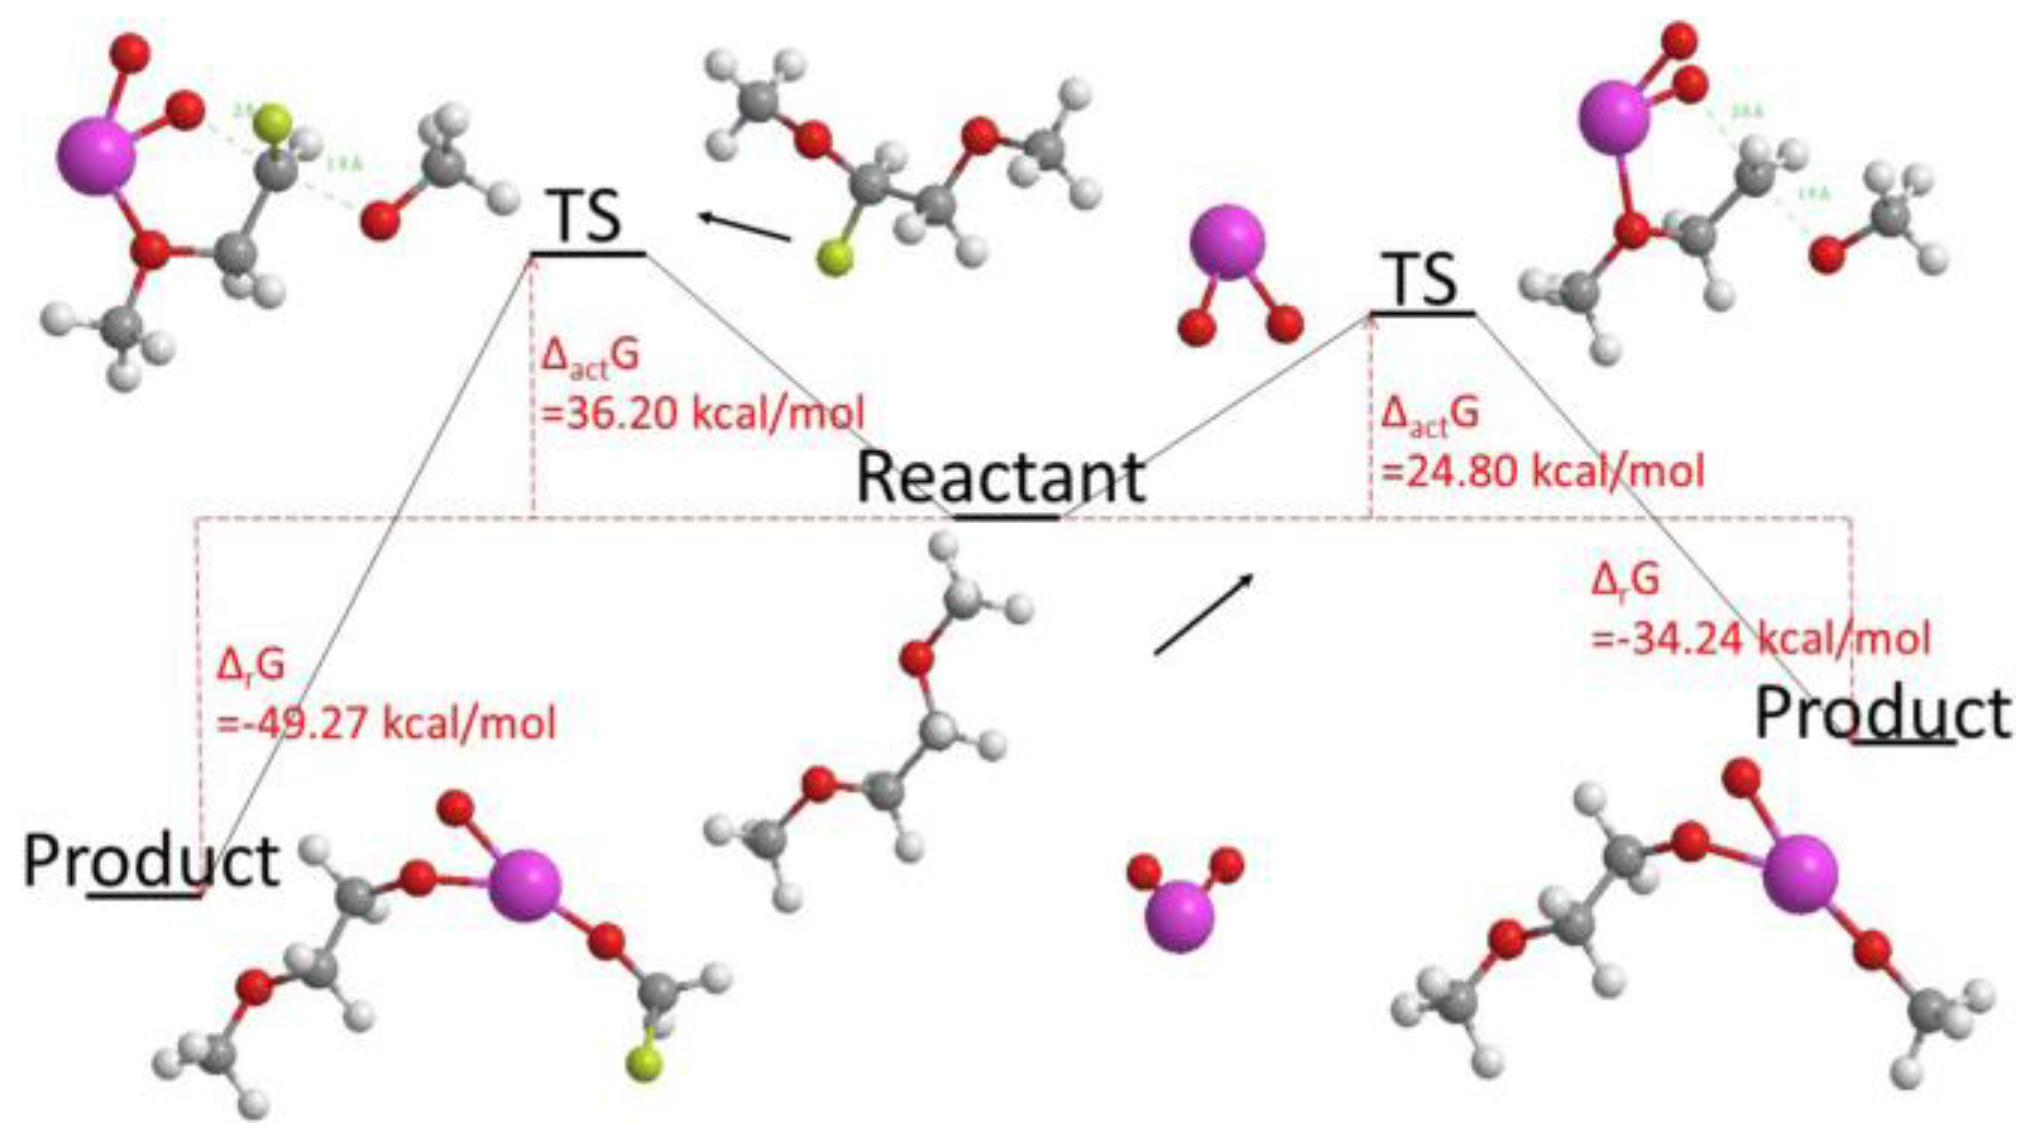
Figure 39.
The variance of Henry’s constant and solubility of oxygen (×10,000 mole fraction) with temperature are shown. The Henry’s constant decreases with temperature. Reprinted from Yoo et al. [44], with permission from Elsevier.
Figure 39.
The variance of Henry’s constant and solubility of oxygen (×10,000 mole fraction) with temperature are shown. The Henry’s constant decreases with temperature. Reprinted from Yoo et al. [44], with permission from Elsevier.
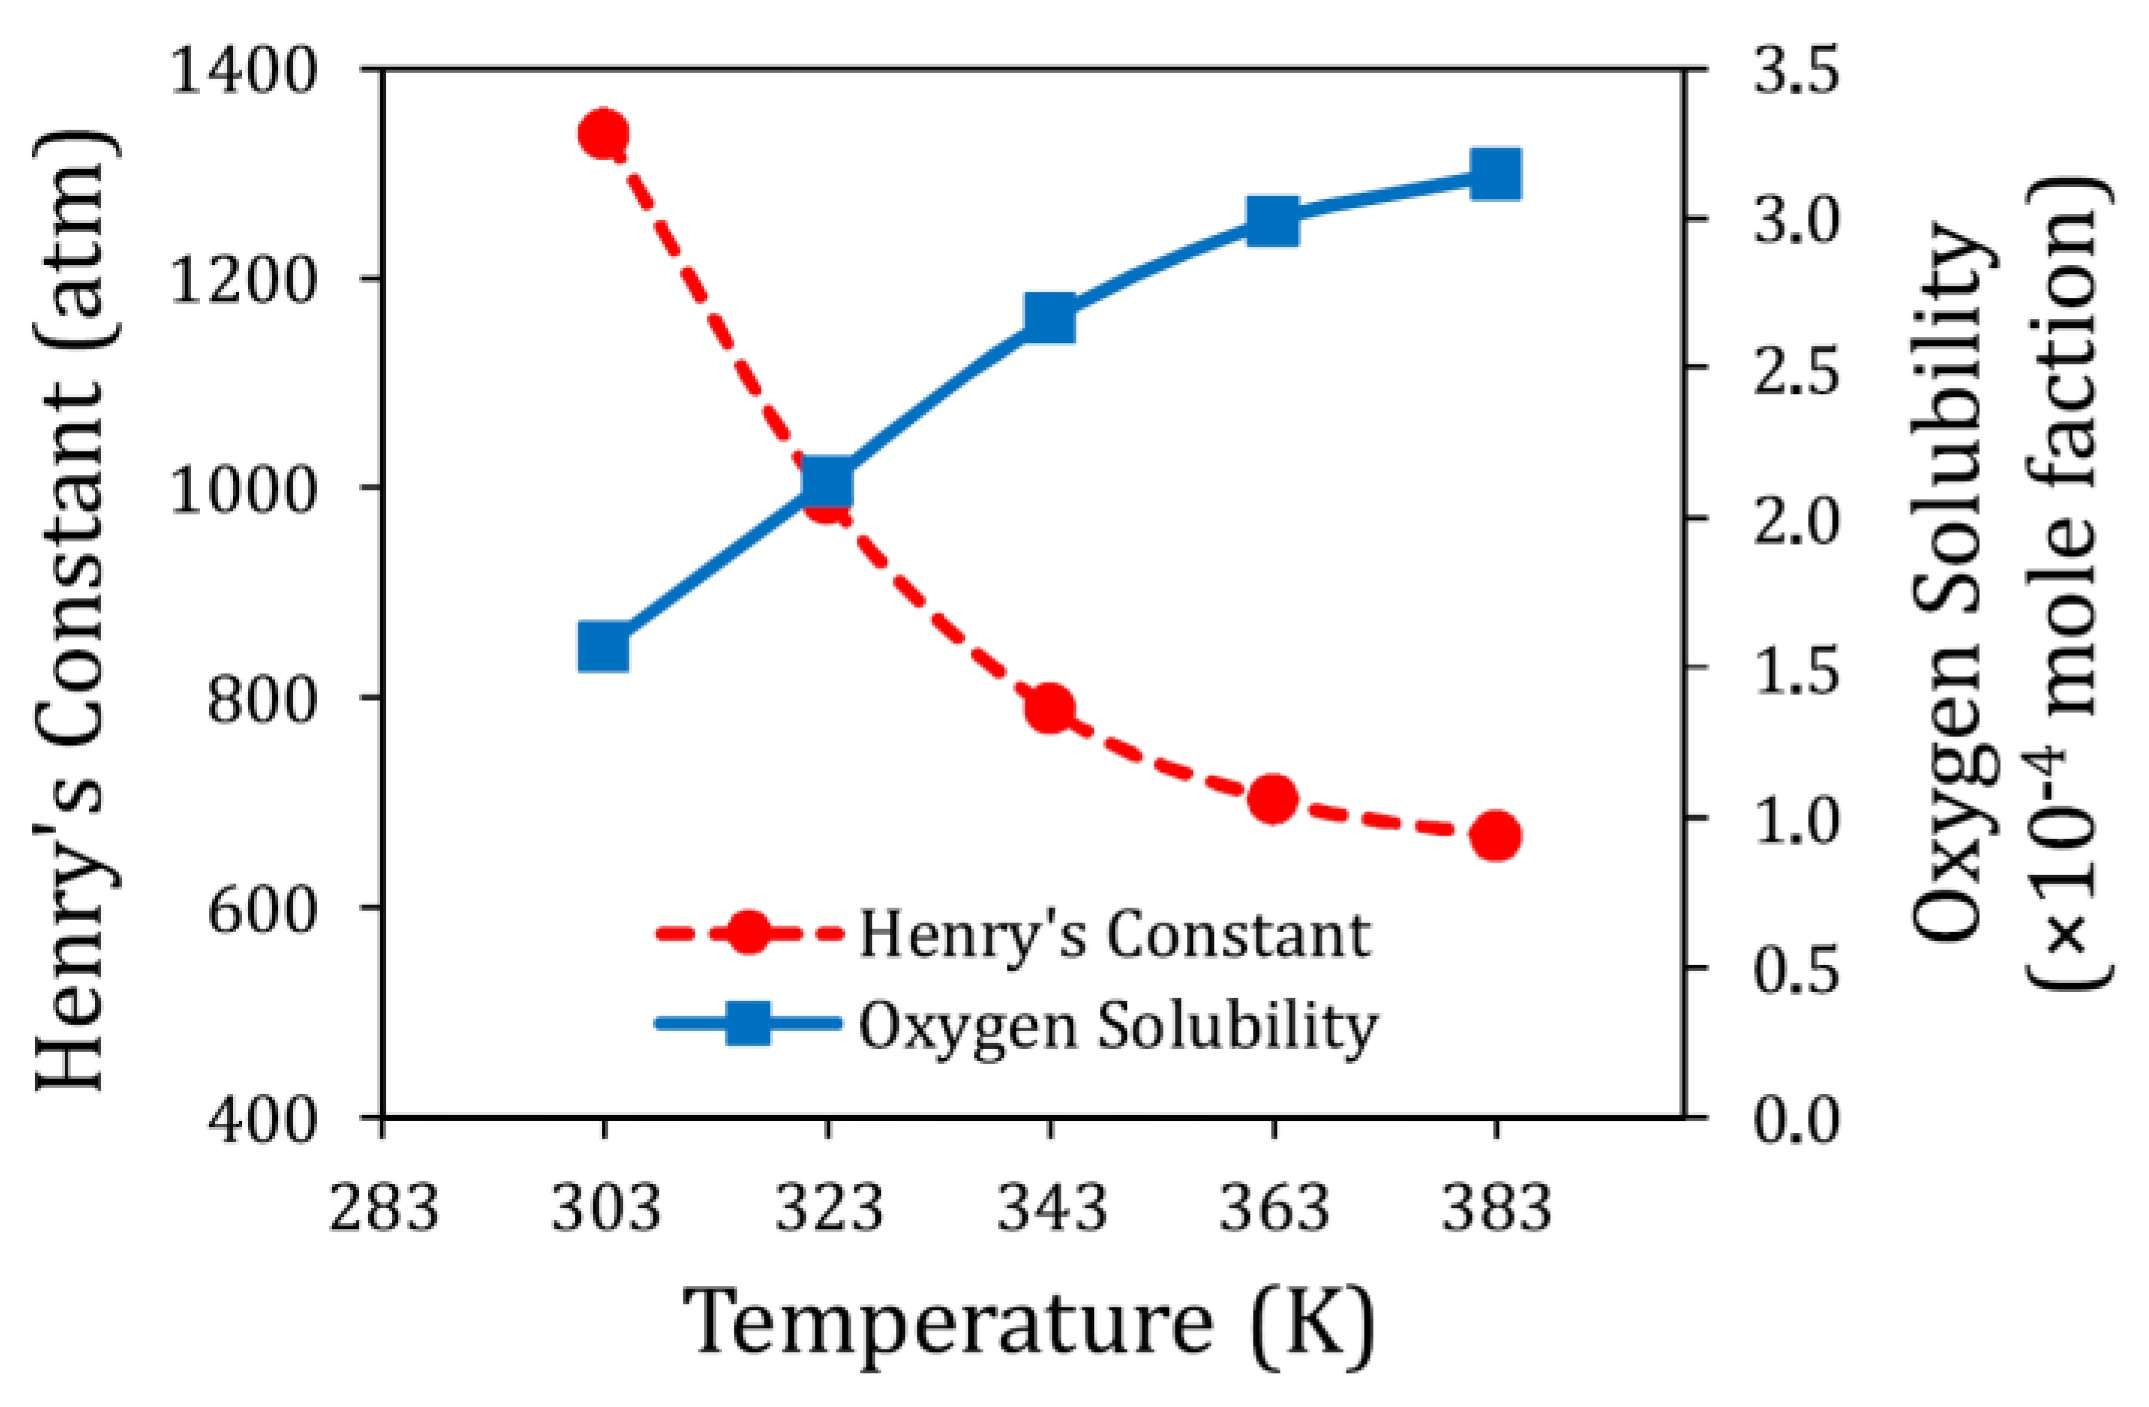
Figure 40.
Diffusion coefficients for different species. DMSO: circles, ACN: stars, Cl−: red diamonds, K+: green squares, Li+: black triangles. Also shown are experimental results for Li+ (blue triangles) obtained from conductivity measurements [69]. Reprinted from Laria at al. [70] with the permission of AIP Publishing.

Figure 41.
The electron transfer rates, as a function of the length of the side alkyl chain in imidazolium cation, n, is shown. The inset in the plot shows the structure of the lithium lattice where a lithium atom is ionized and ends up in solvated state. The chemical structure of the imidazolium based cation shows an example where n = 3. The TFSI anion’s structure is also provided. Reprinted with copyright permission from Kazemiabnavi et al. [80]. Copyright© 2014, American Chemical Society.
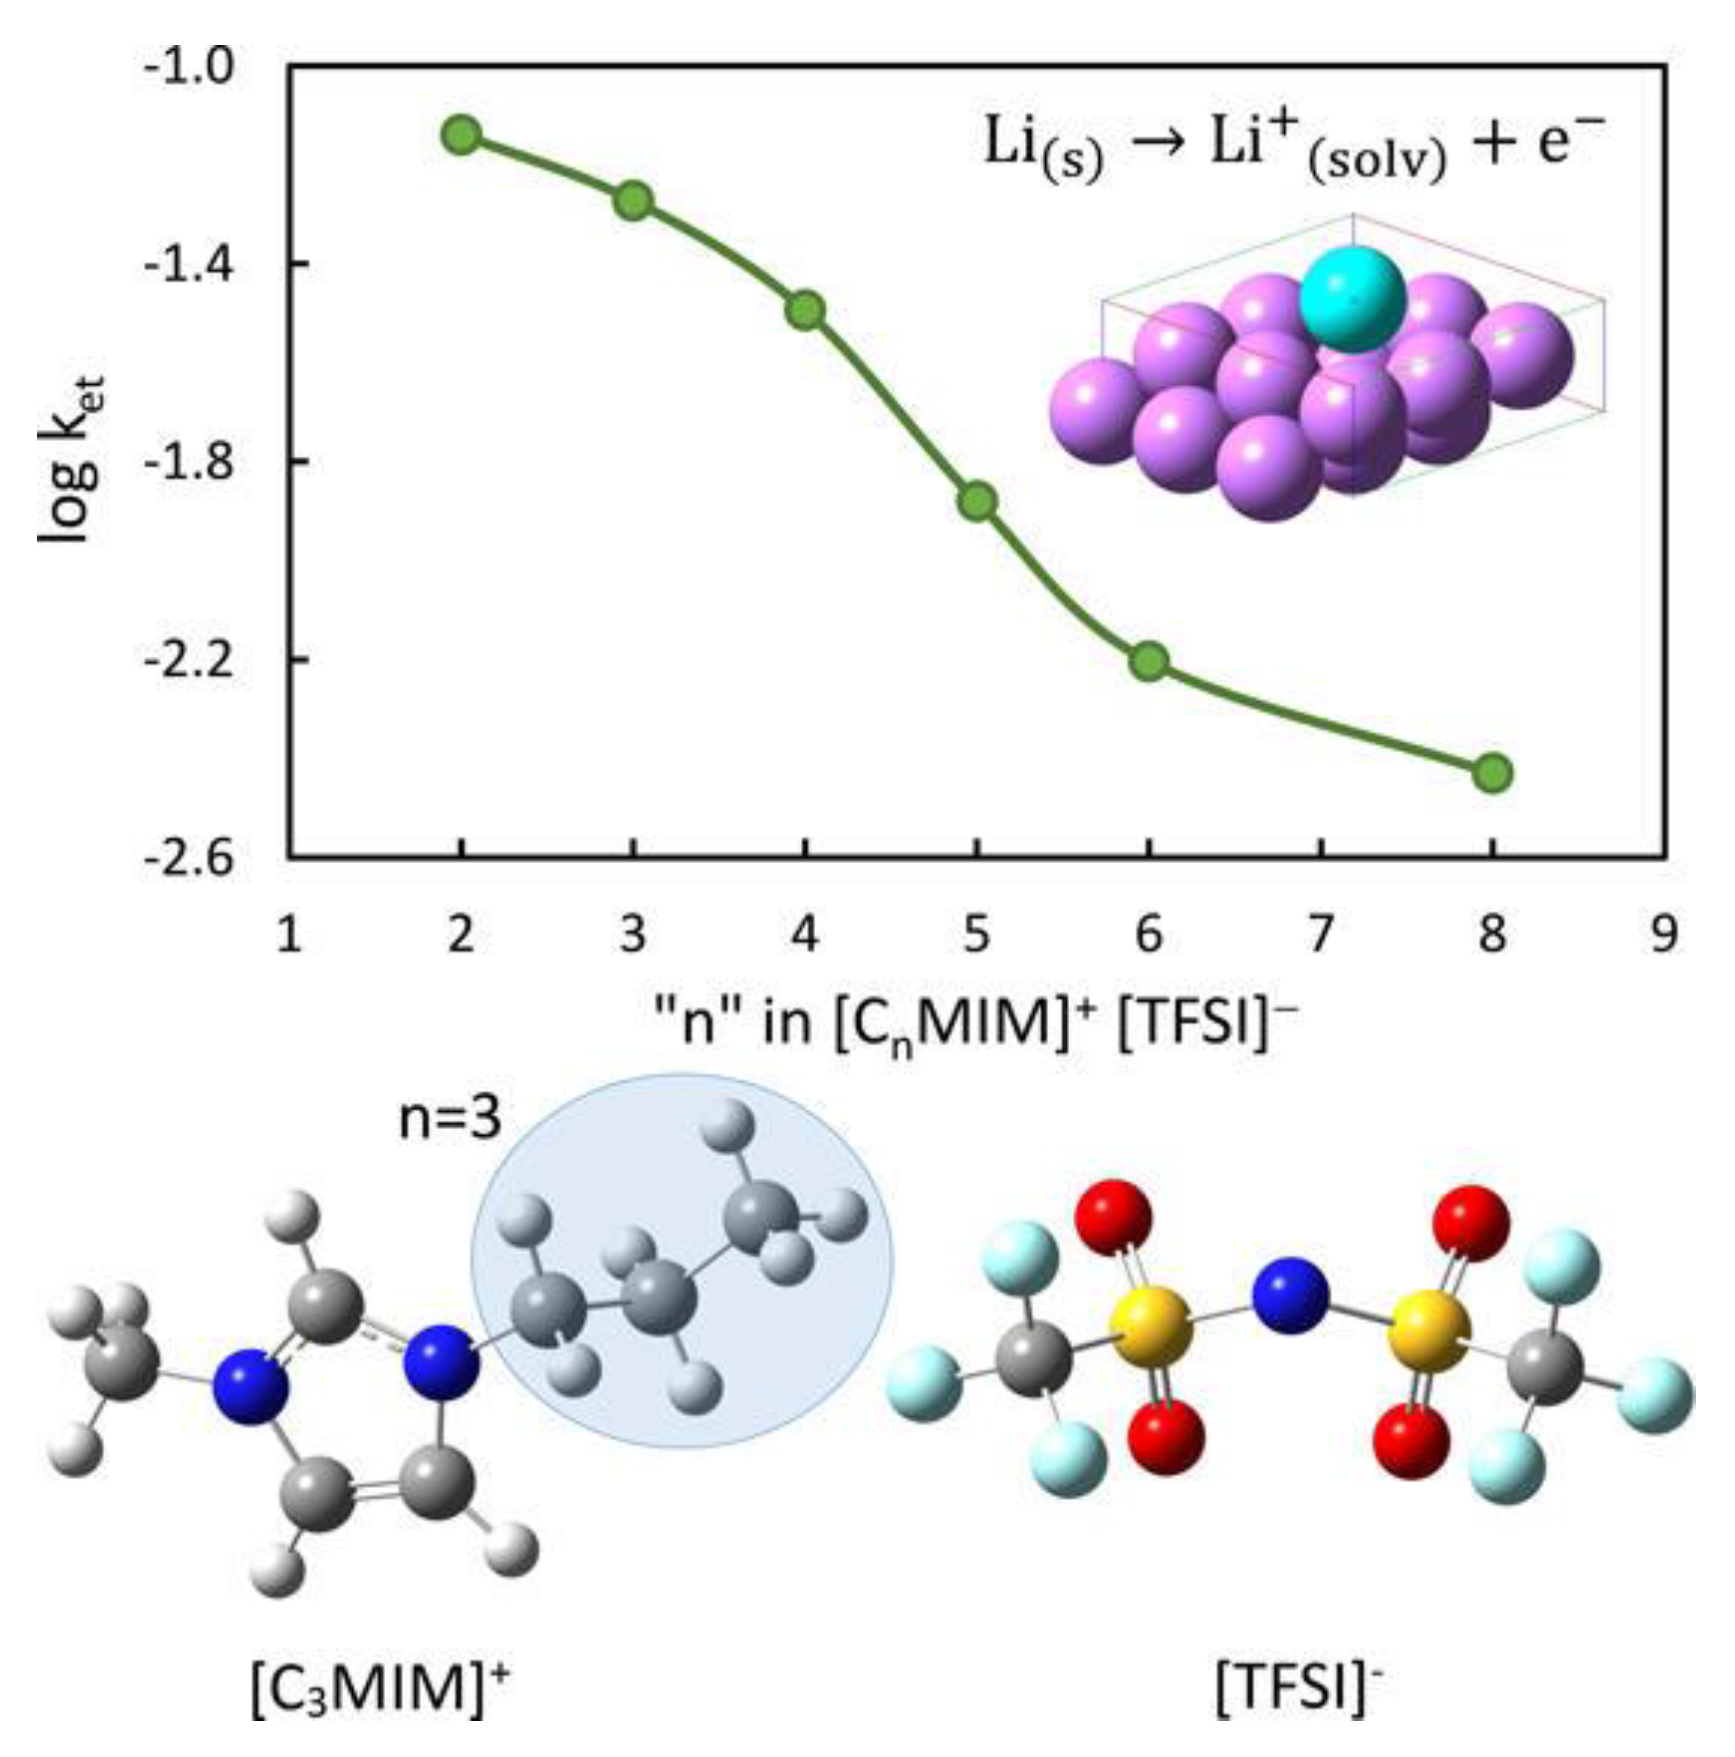
Figure 42.
Free energy diagram for the ORR on the h-BN/Ni (111) surface. The black, blue, and red lines denote the reaction steps shared by the two pathways, for the 2e− pathway and for the 4e− pathway, respectively. The asterisk marks the adsorbed states of the ORR intermediates. Reprinted from Lee et al. [84], with permission from Elsevier.

Figure 43.
The most facile mode for crystal growth/dissolution on perfect steps of Li2O2 (1–100) modeled by the initial formation of kinks. The images show the intermediate states of the cathode surface, where colors highlight atoms that have adsorbed during discharge or atoms that have yet to desorb during charge. Colors: O is dark gray and red; Li is light gray and yellow. Energies are plotted for the total system, where Li and O2 that are not adsorbed are included in solution (Li+ + e−) and O2 as the labels show. During discharge, the potential-limiting step is the adsorption of the second LiO2 in the valley site, which amounts to an over-potential of 0.11 V for discharge on a step. During charge the removal of the first Li is potential-limiting resulting in an overpotential of 0.15 V for charge. Reprinted from Hummelshoj et al. [88] with the permission of AIP Publishing.

Figure 44.
Plots of charge density difference (a) for N-doped graphene/LiO2 and (b) for N-doped graphene/Li2O2. Reproduced from Lee et al. [94] with permission of Springer.
Figure 44.
Plots of charge density difference (a) for N-doped graphene/LiO2 and (b) for N-doped graphene/Li2O2. Reproduced from Lee et al. [94] with permission of Springer.


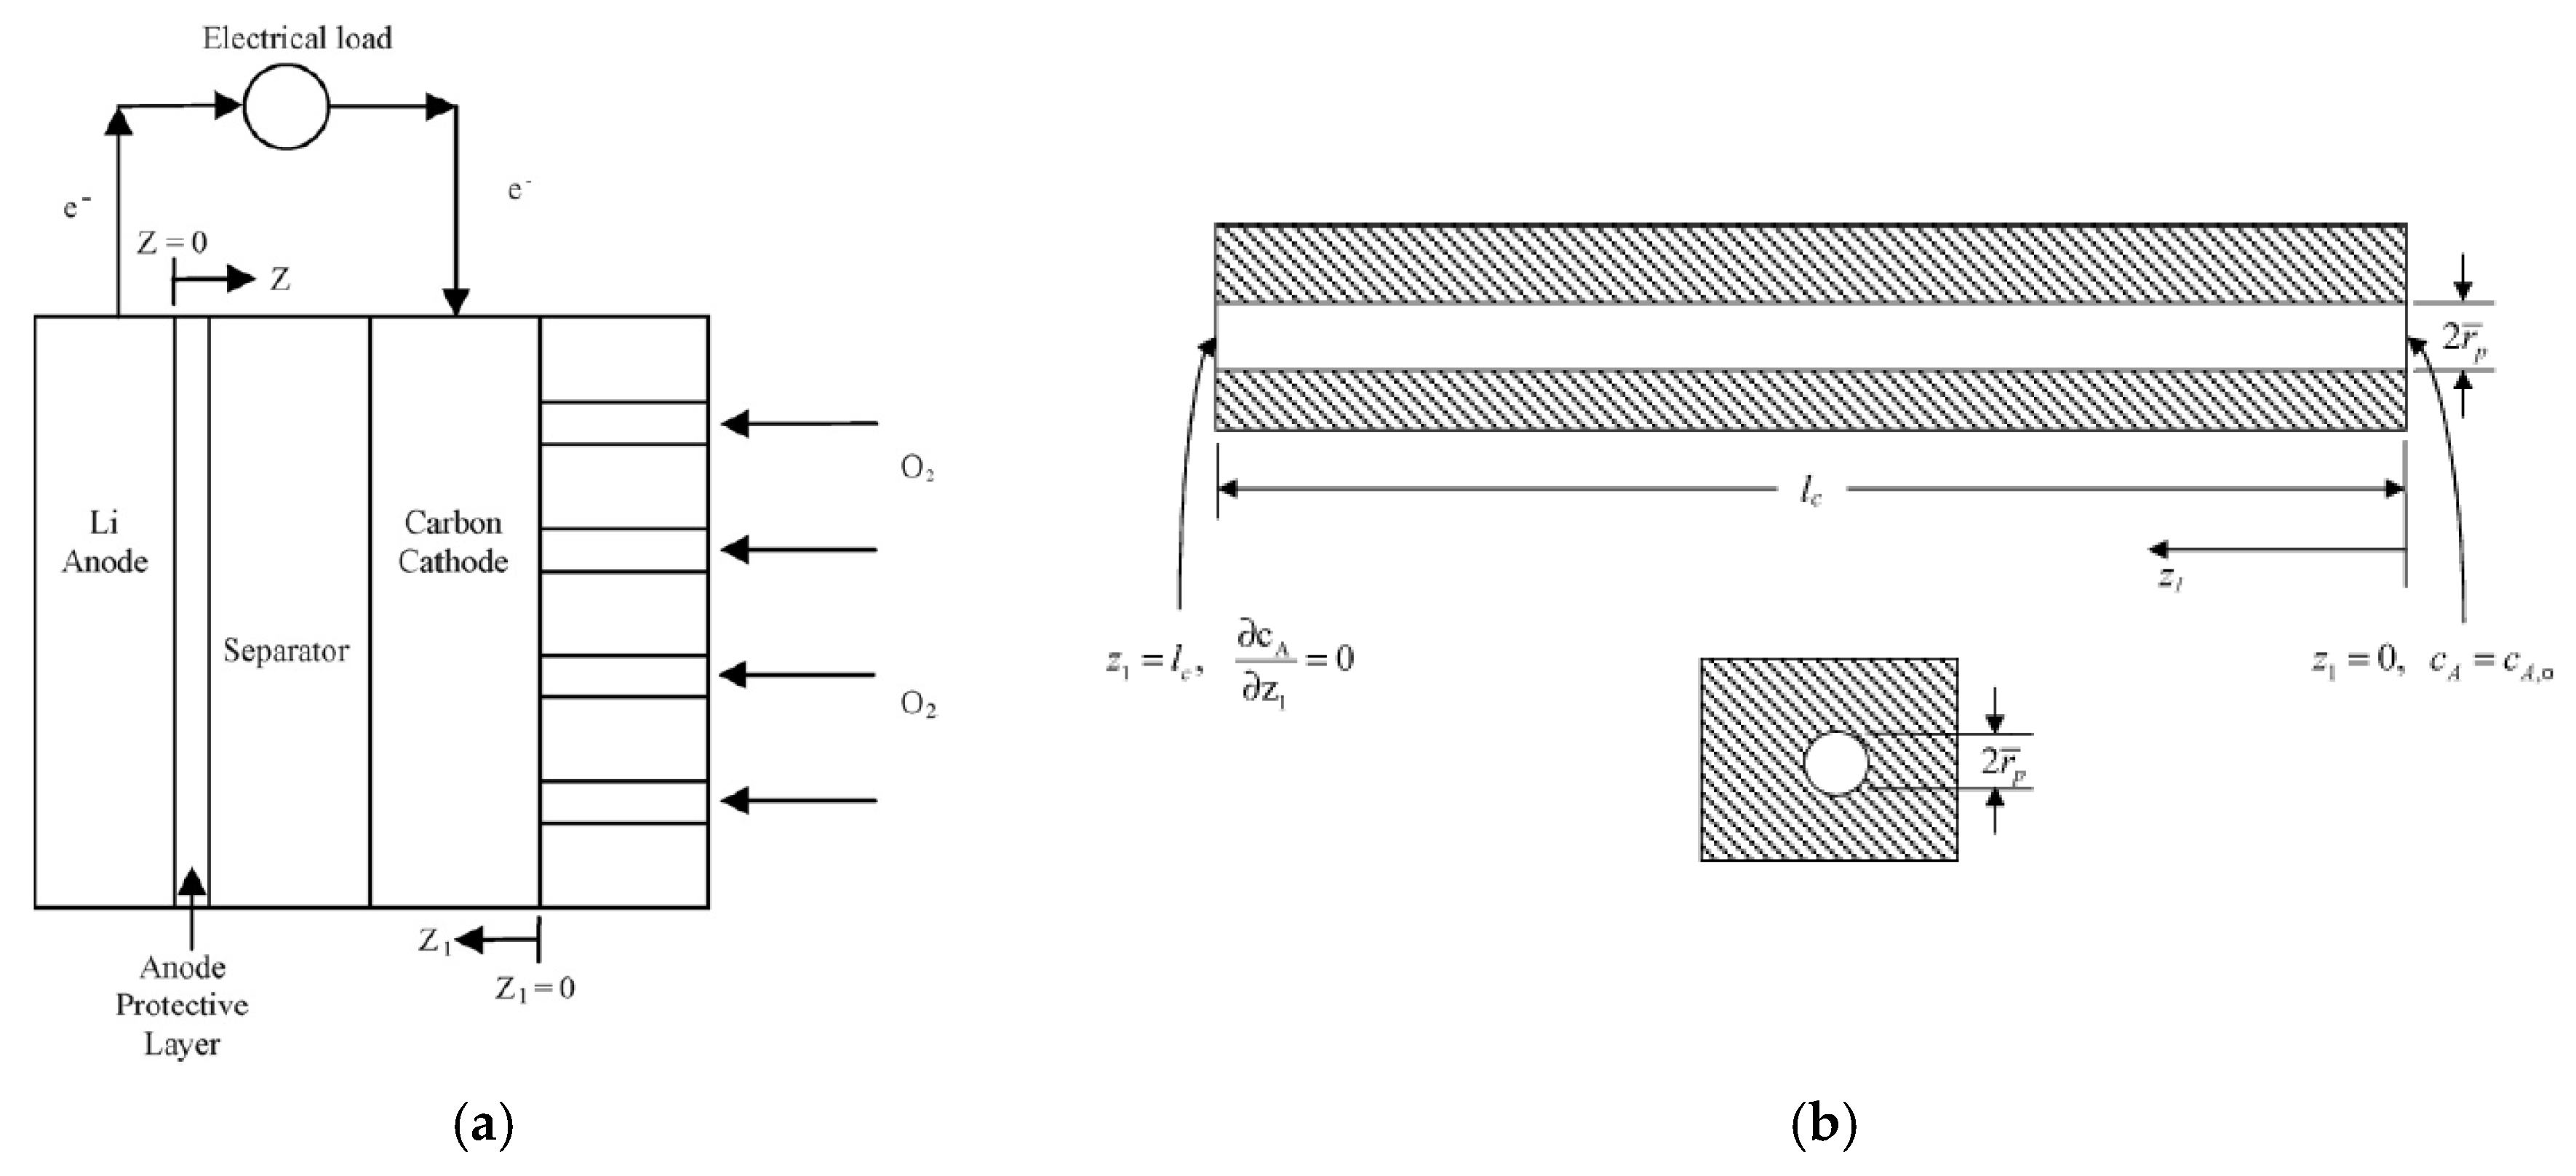
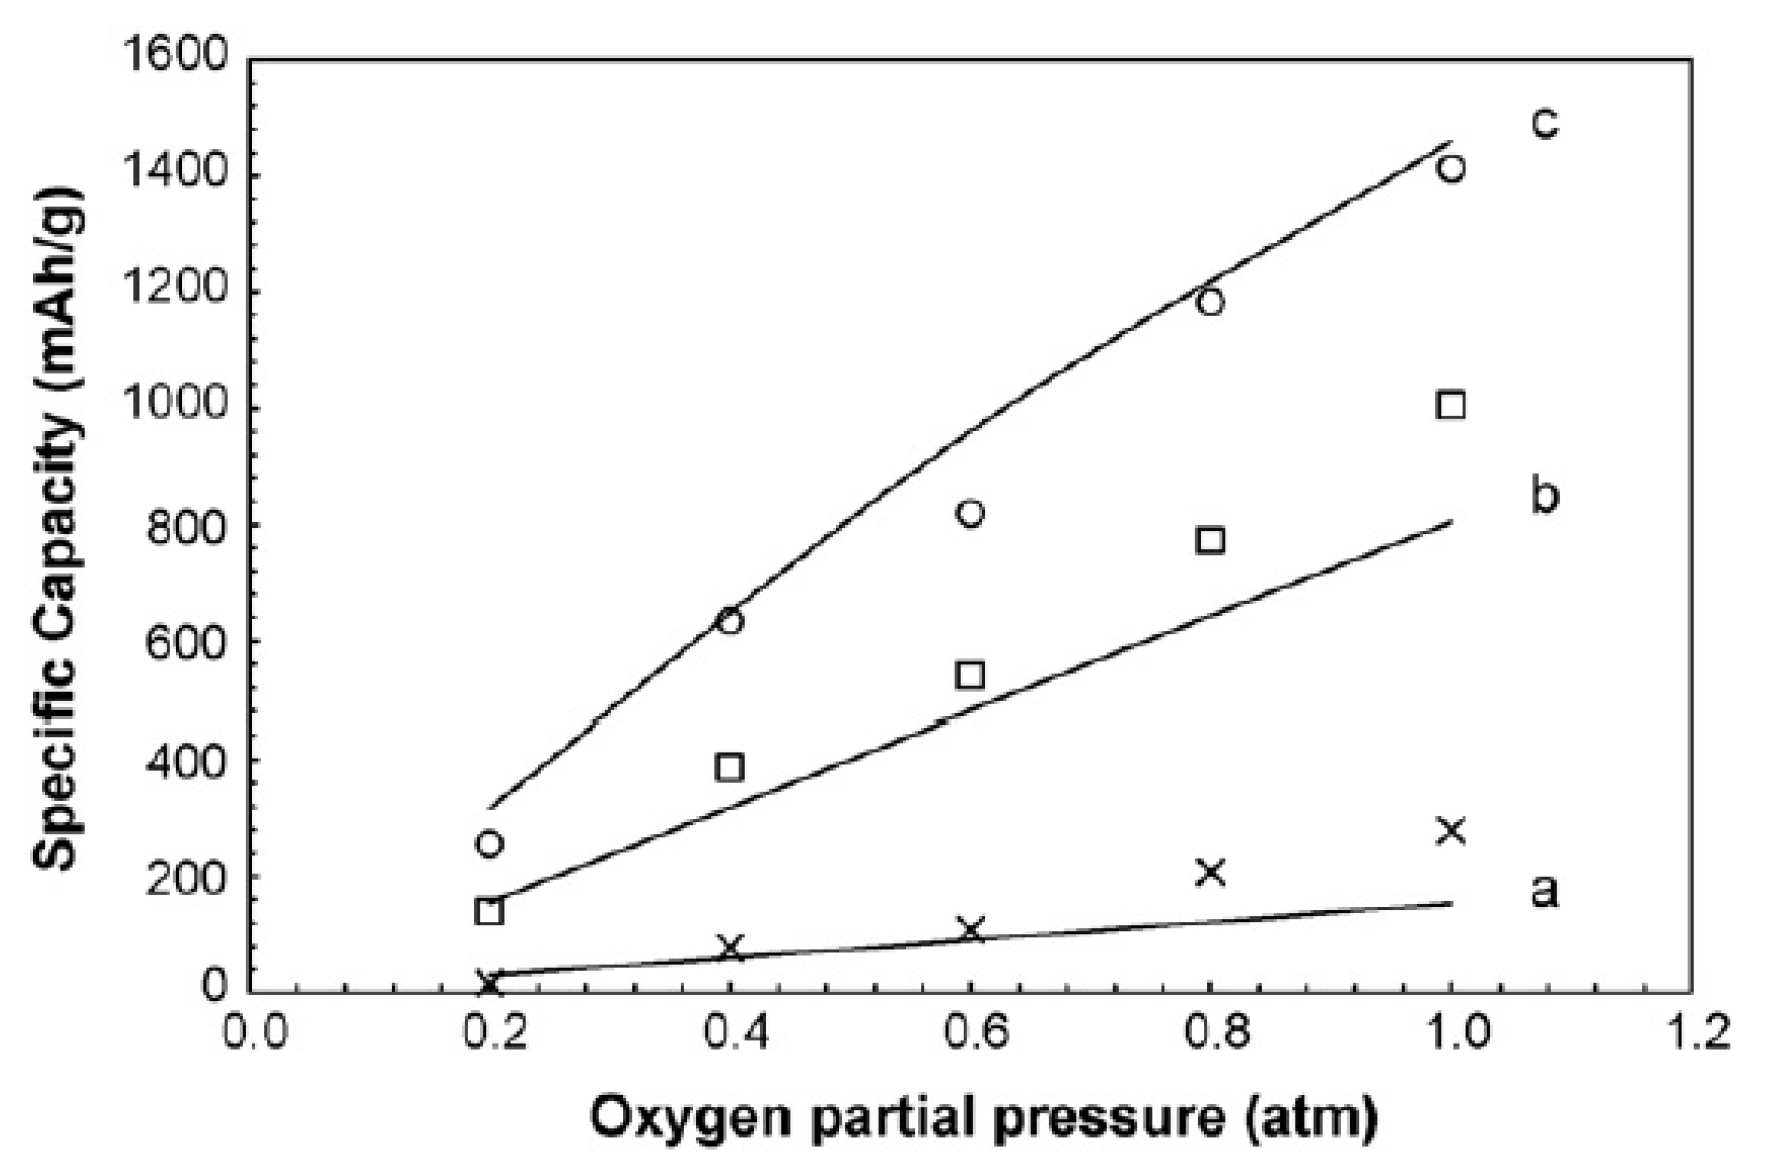
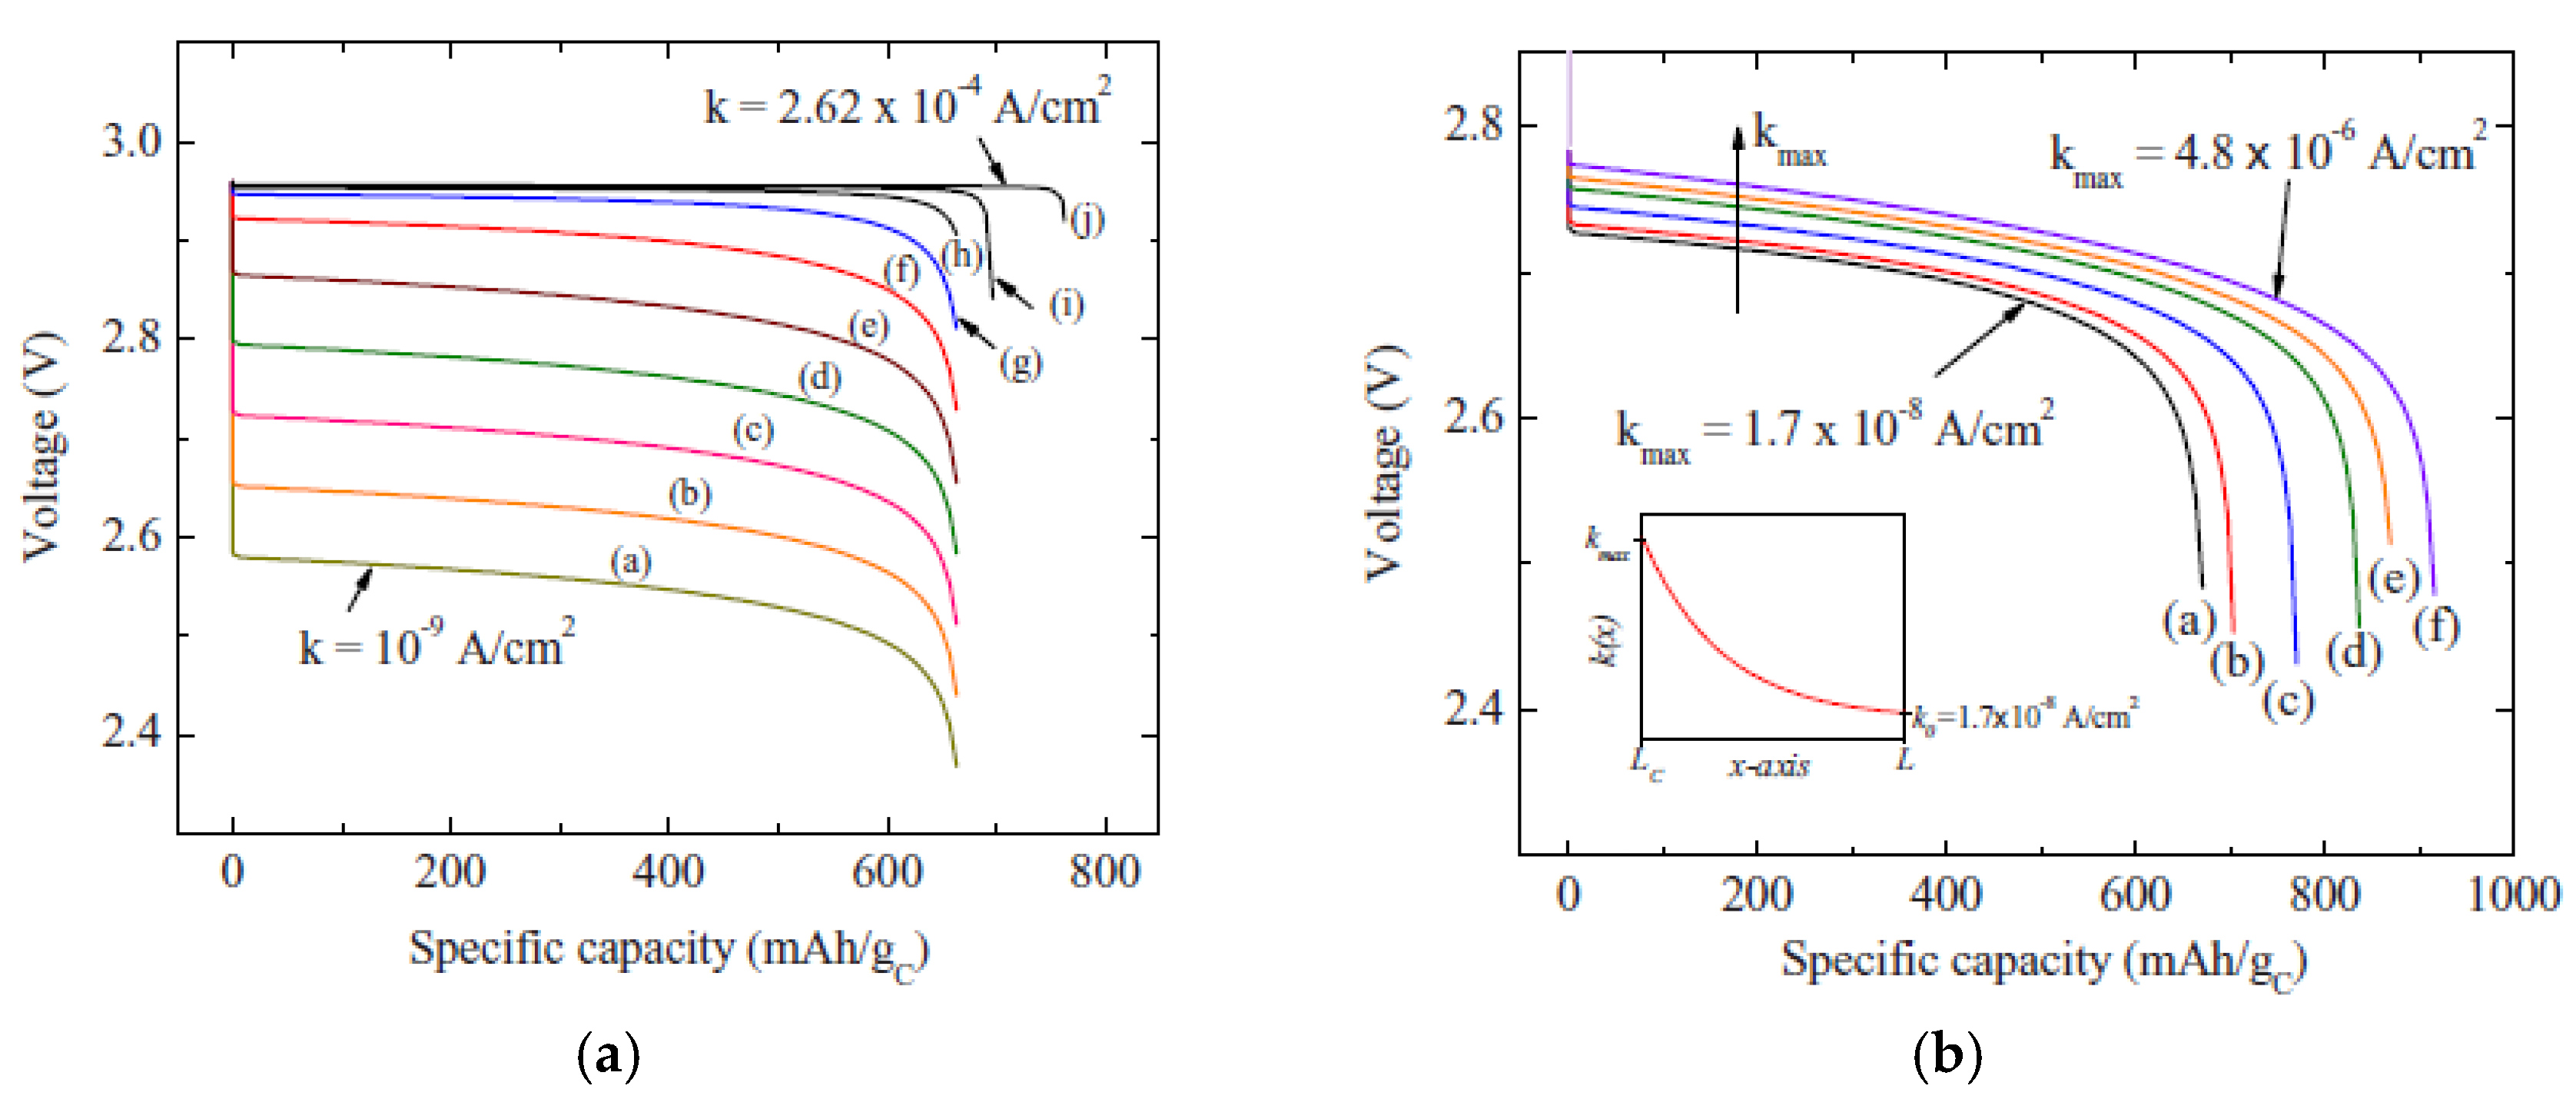
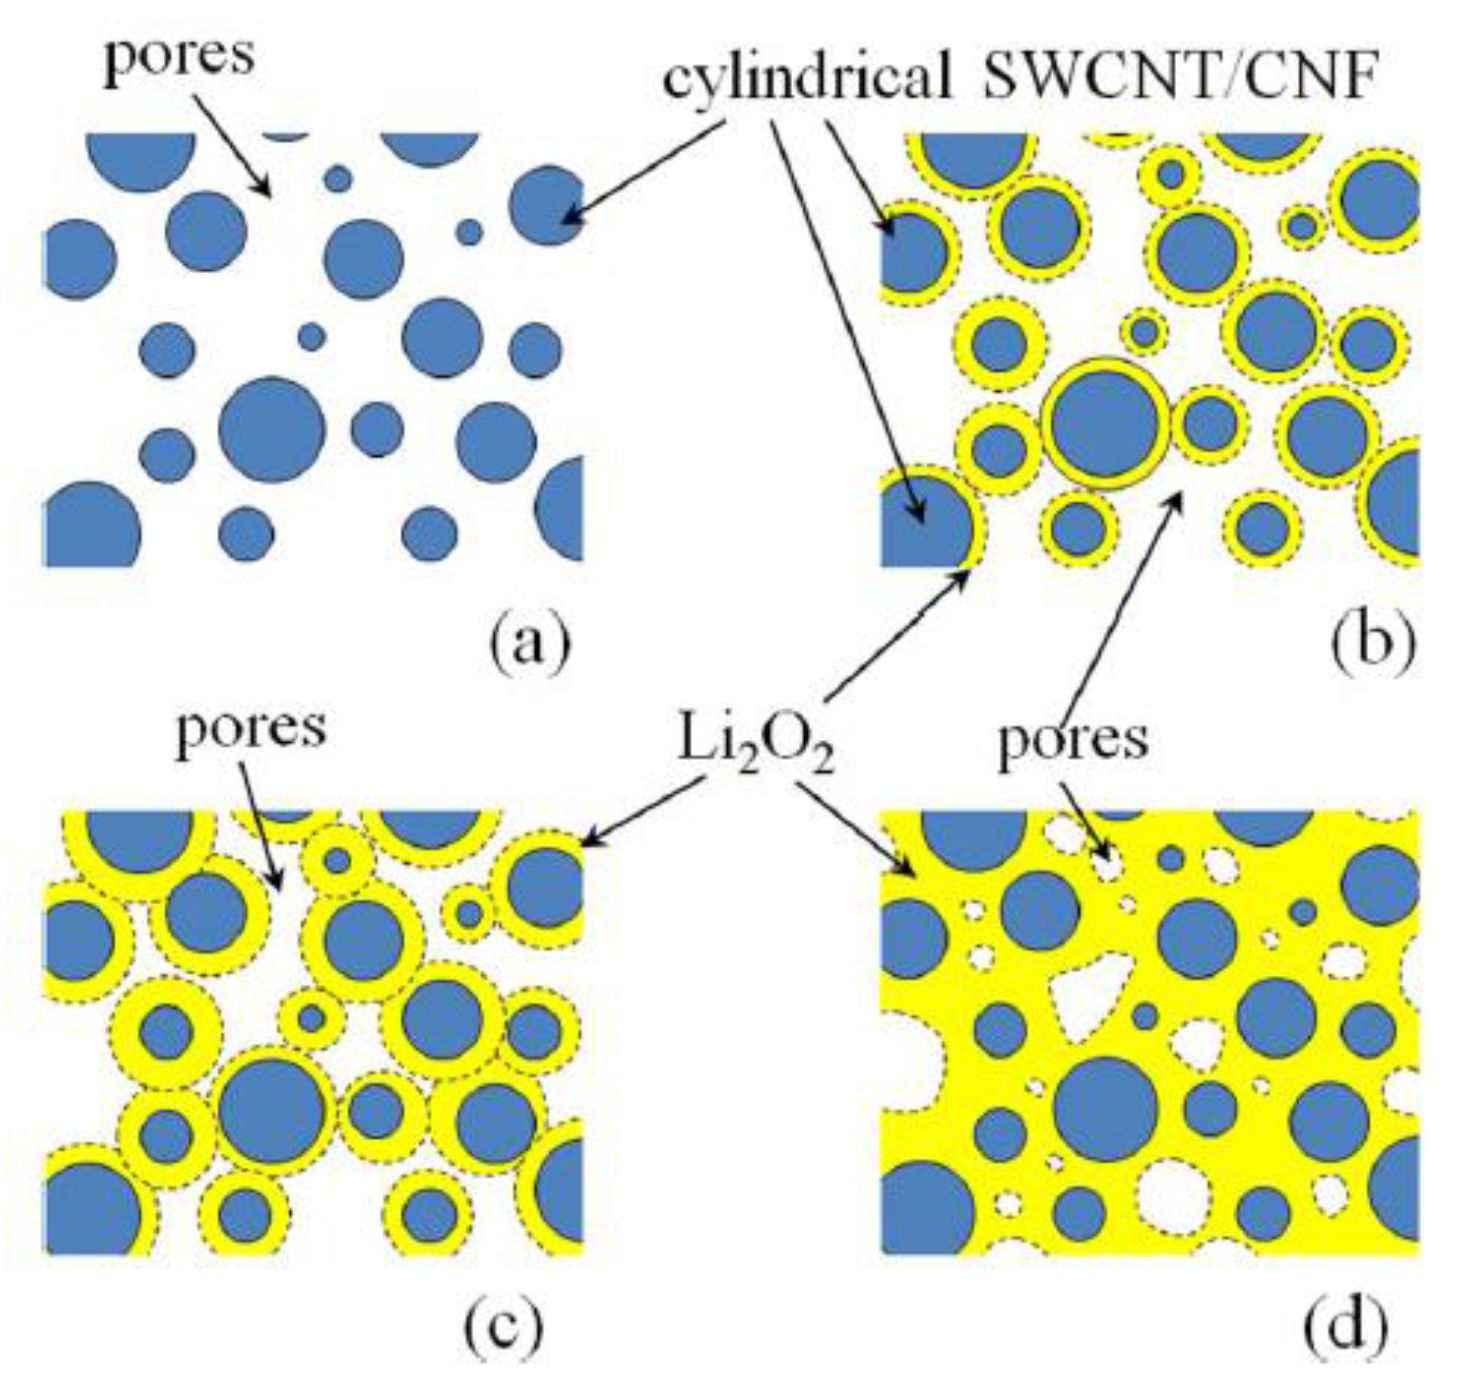
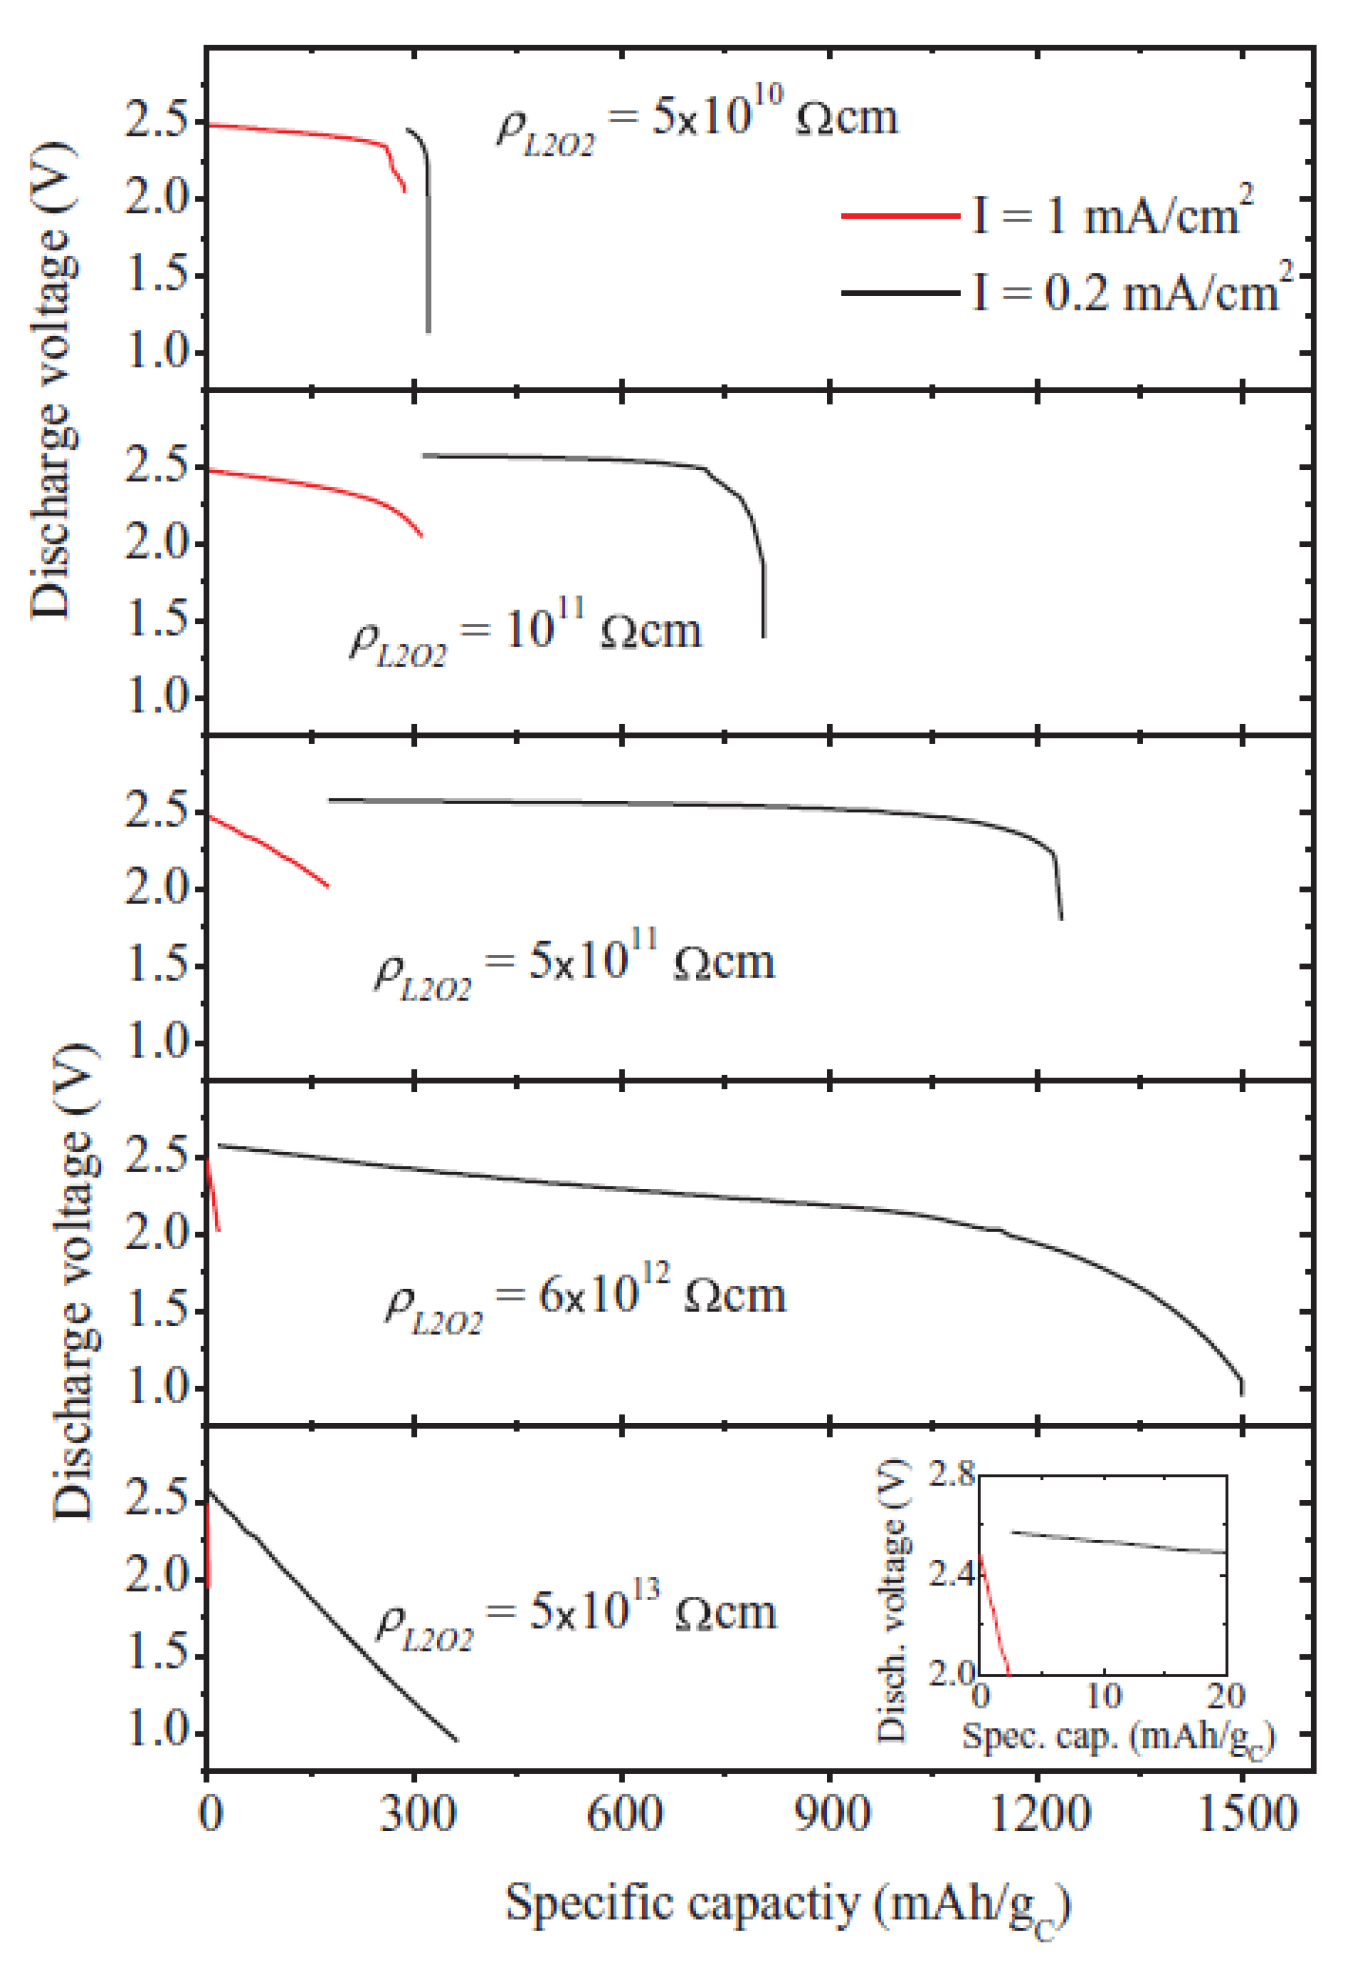
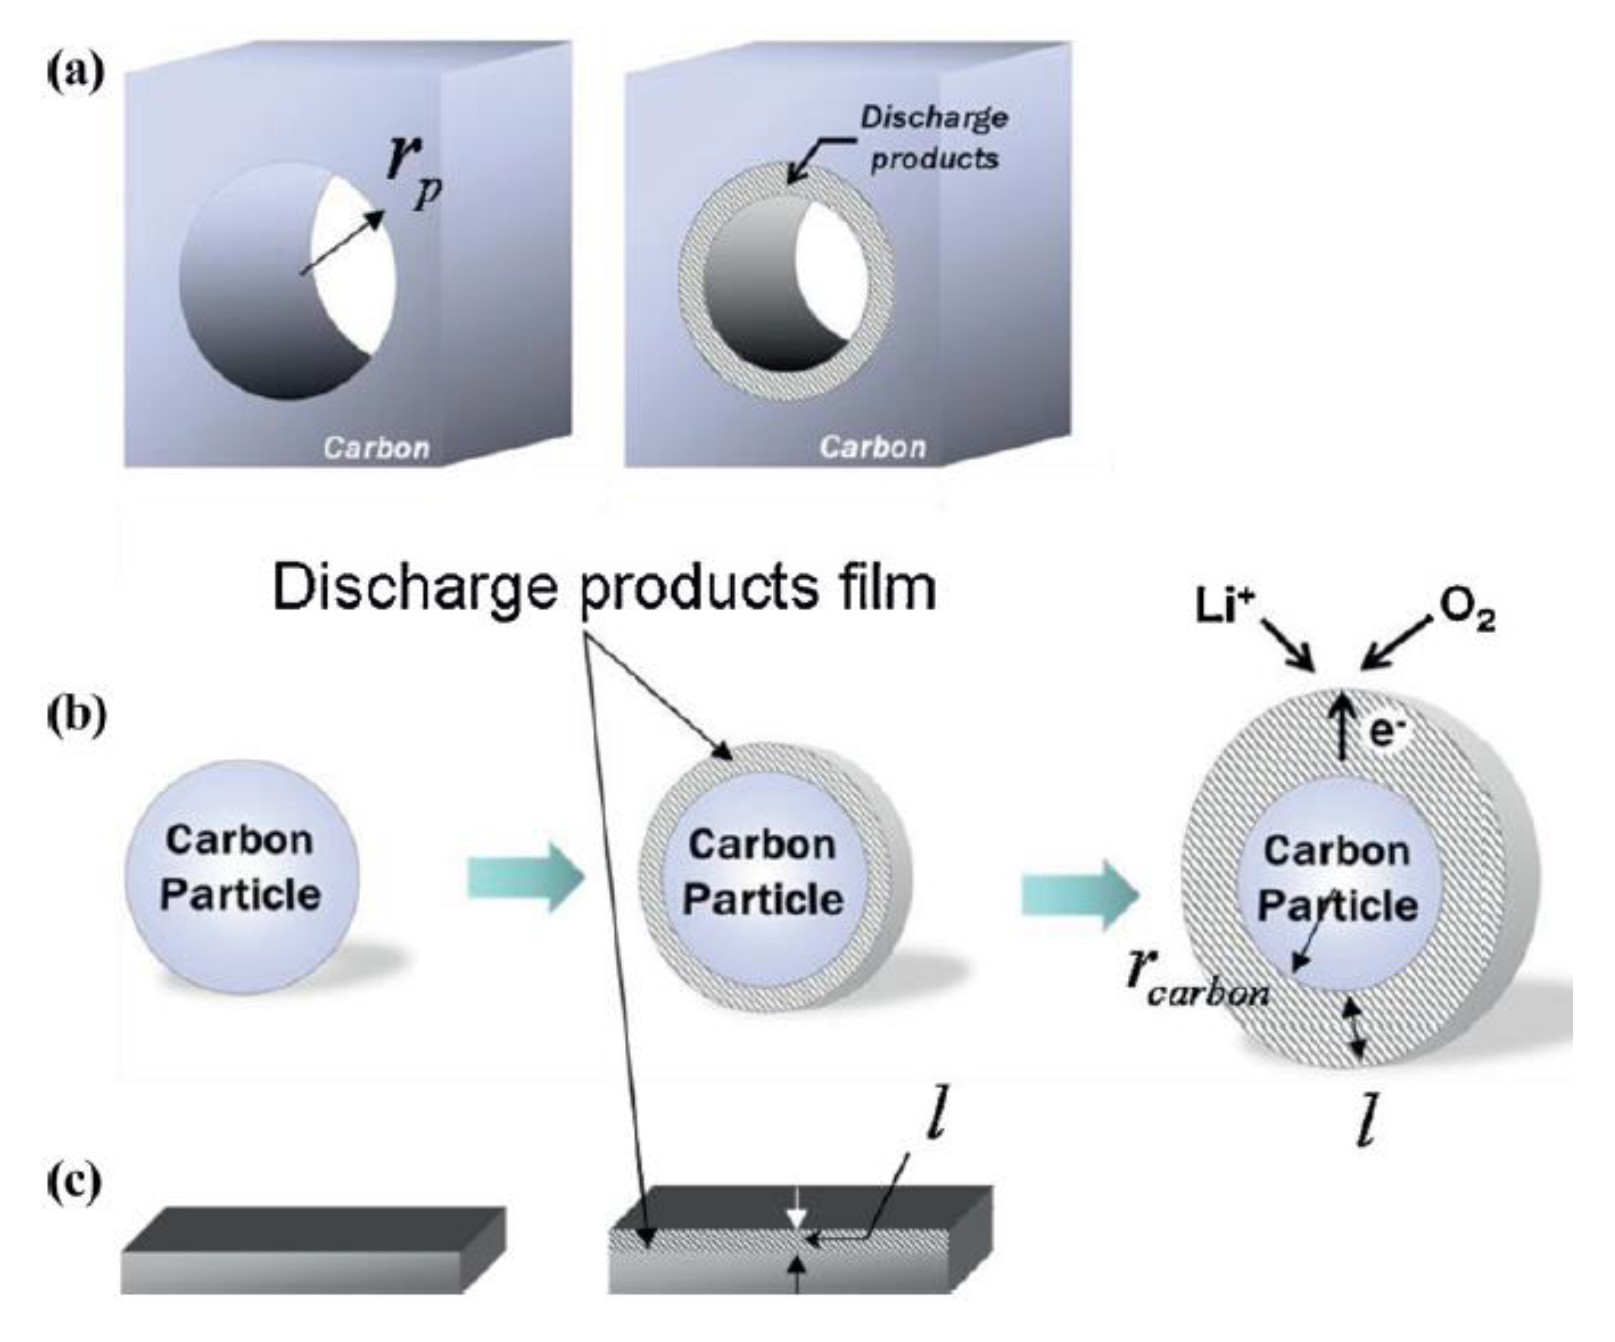
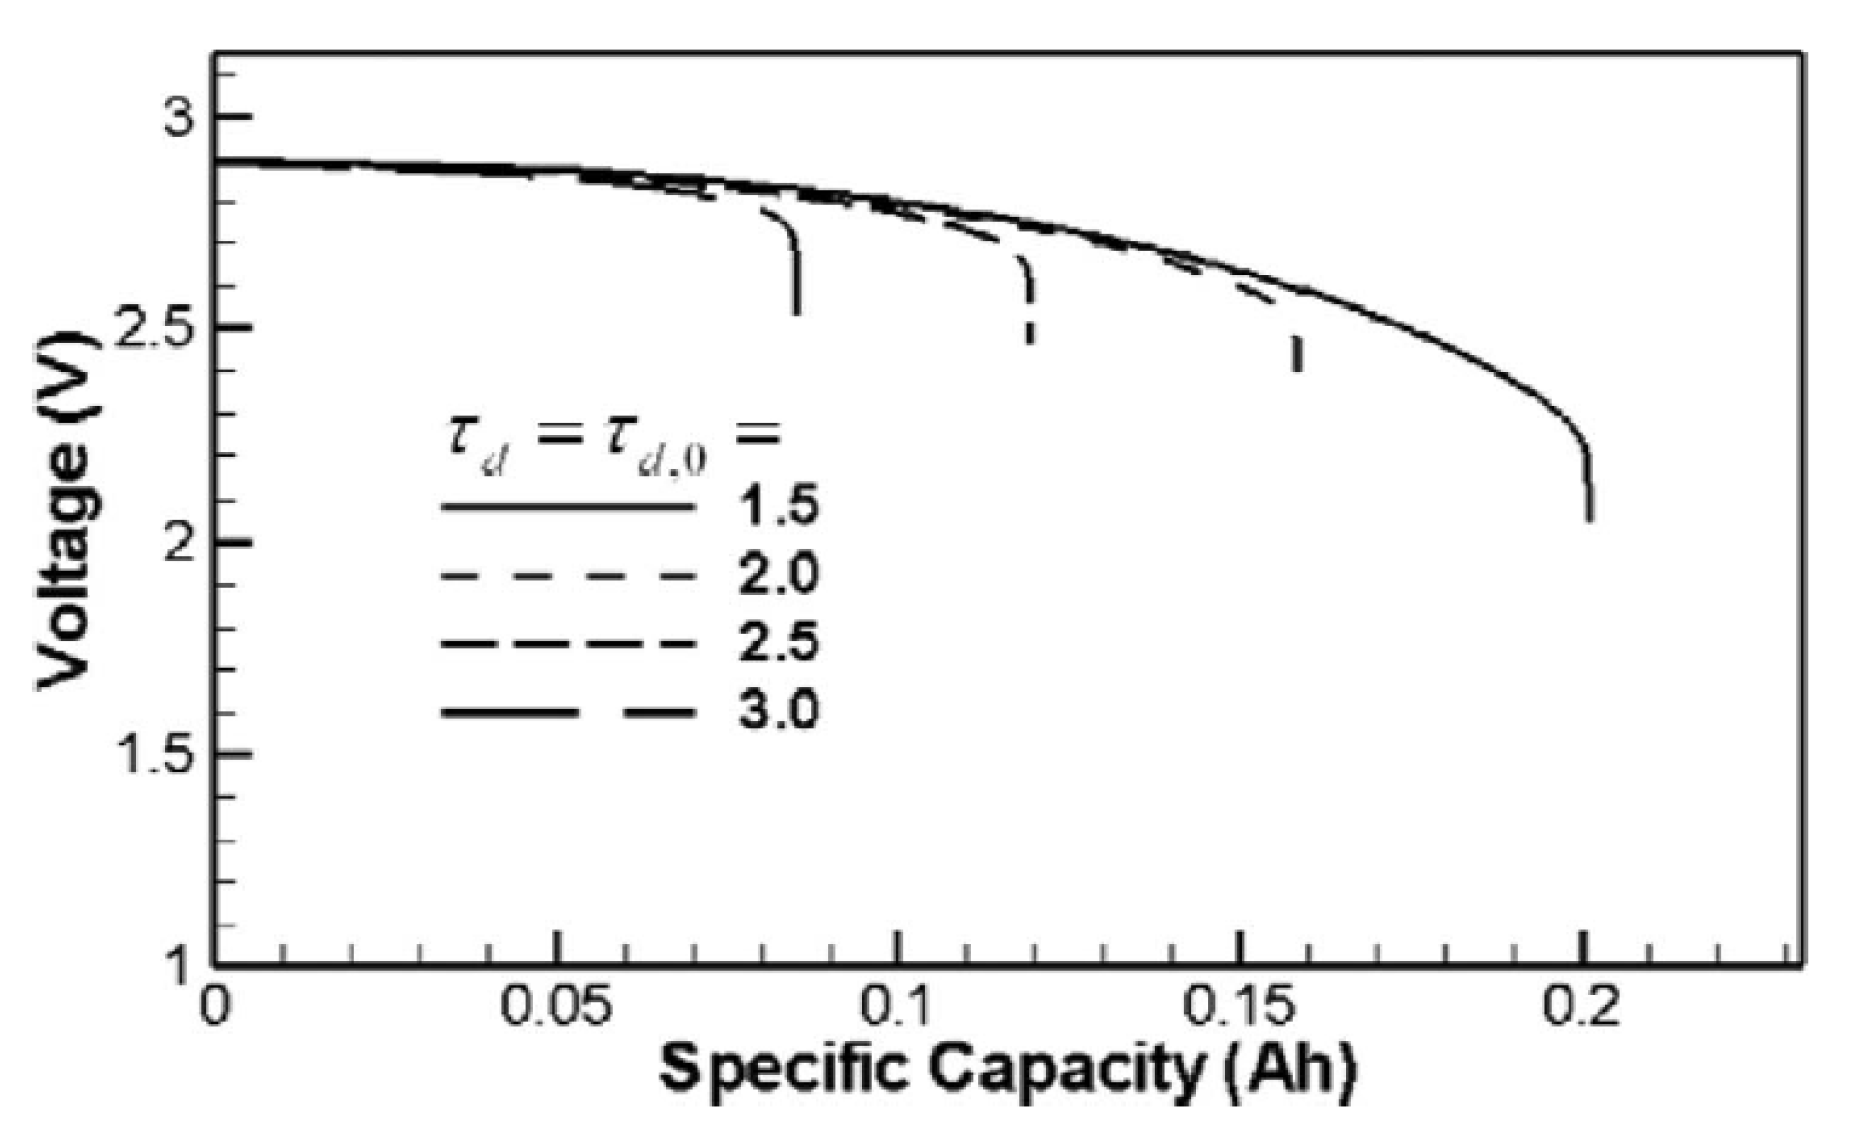
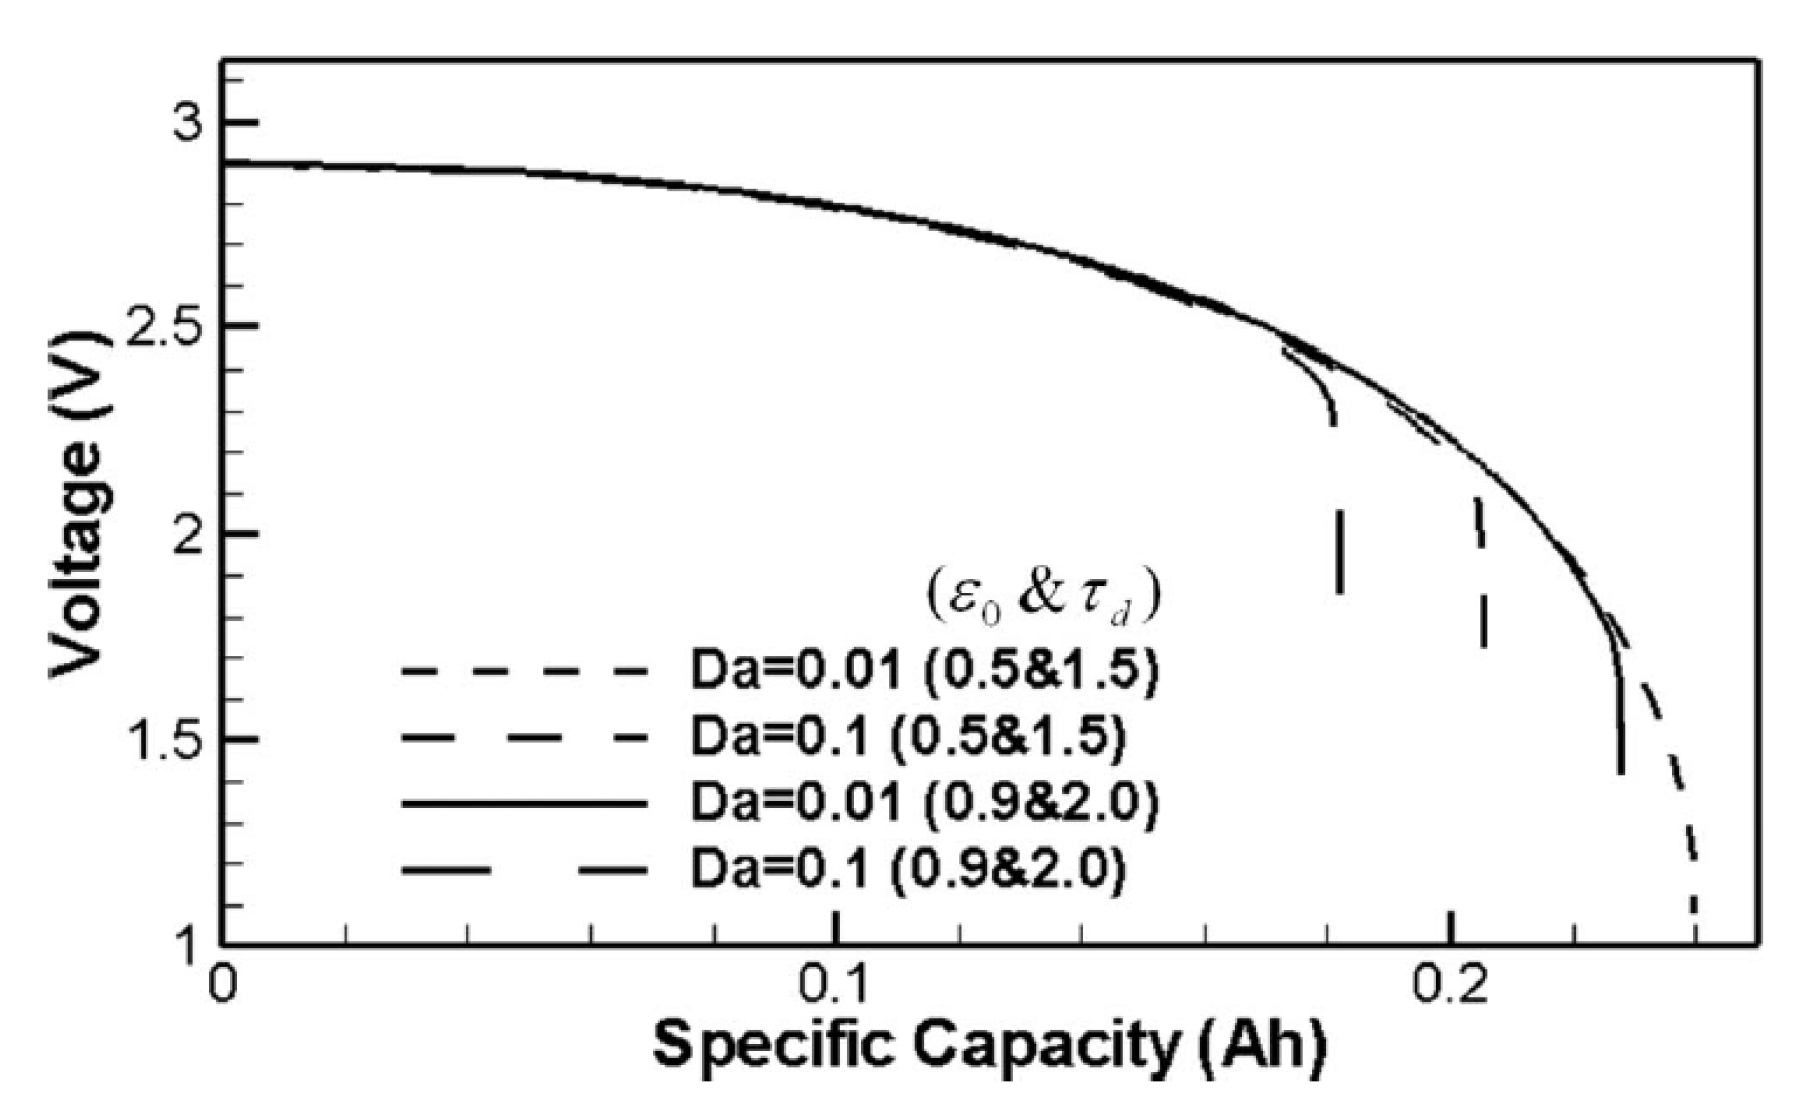
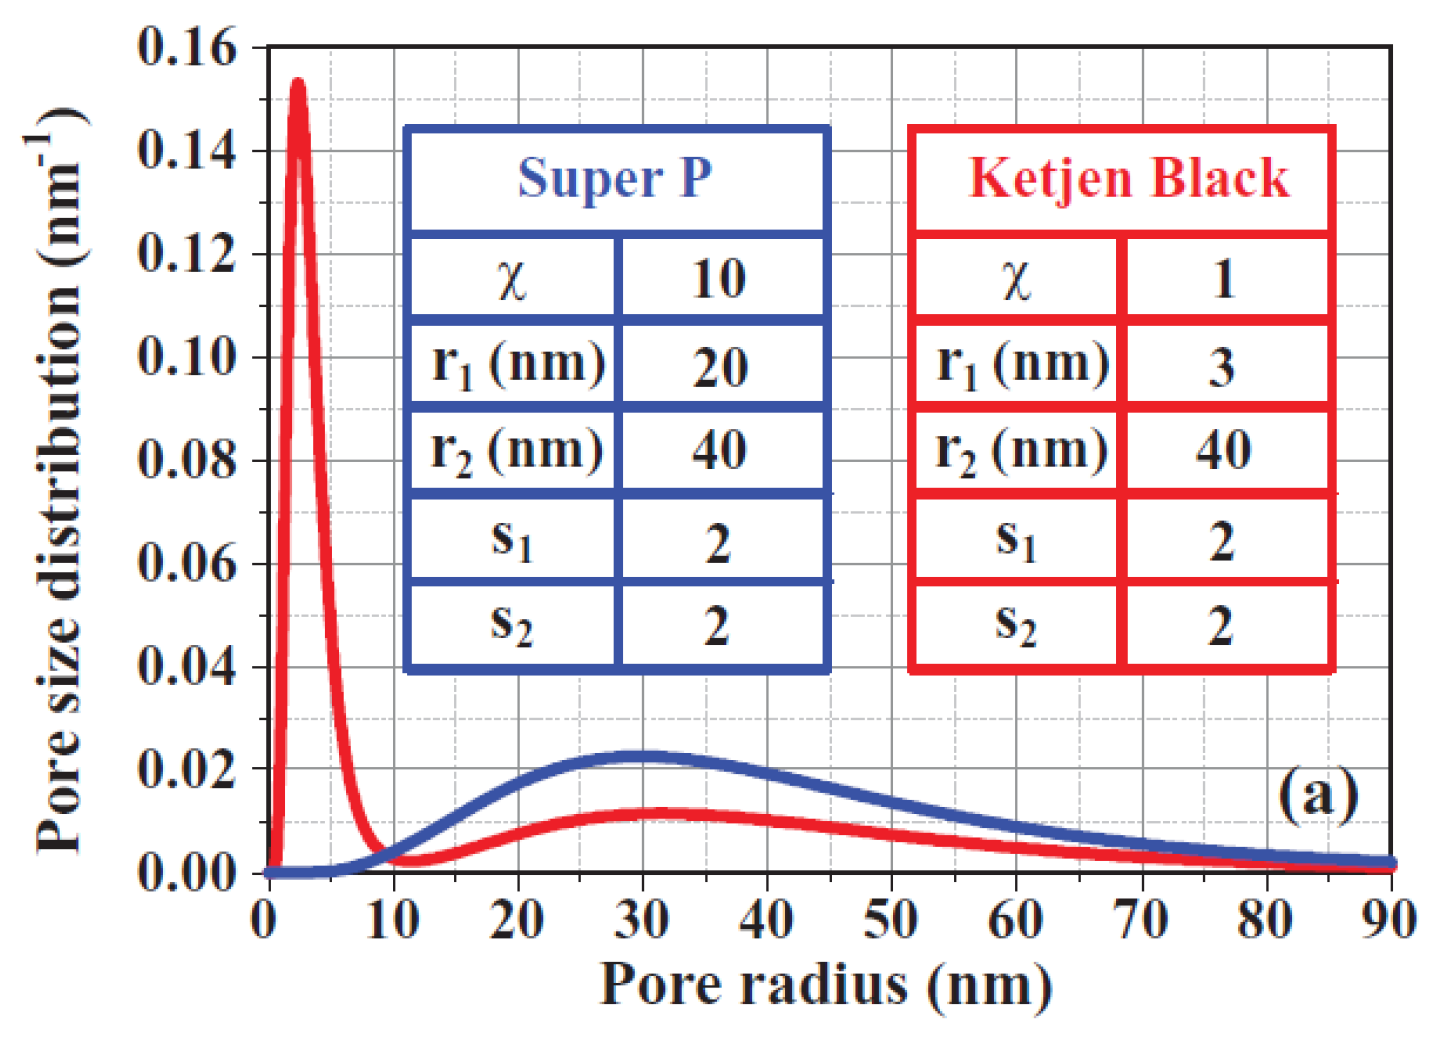
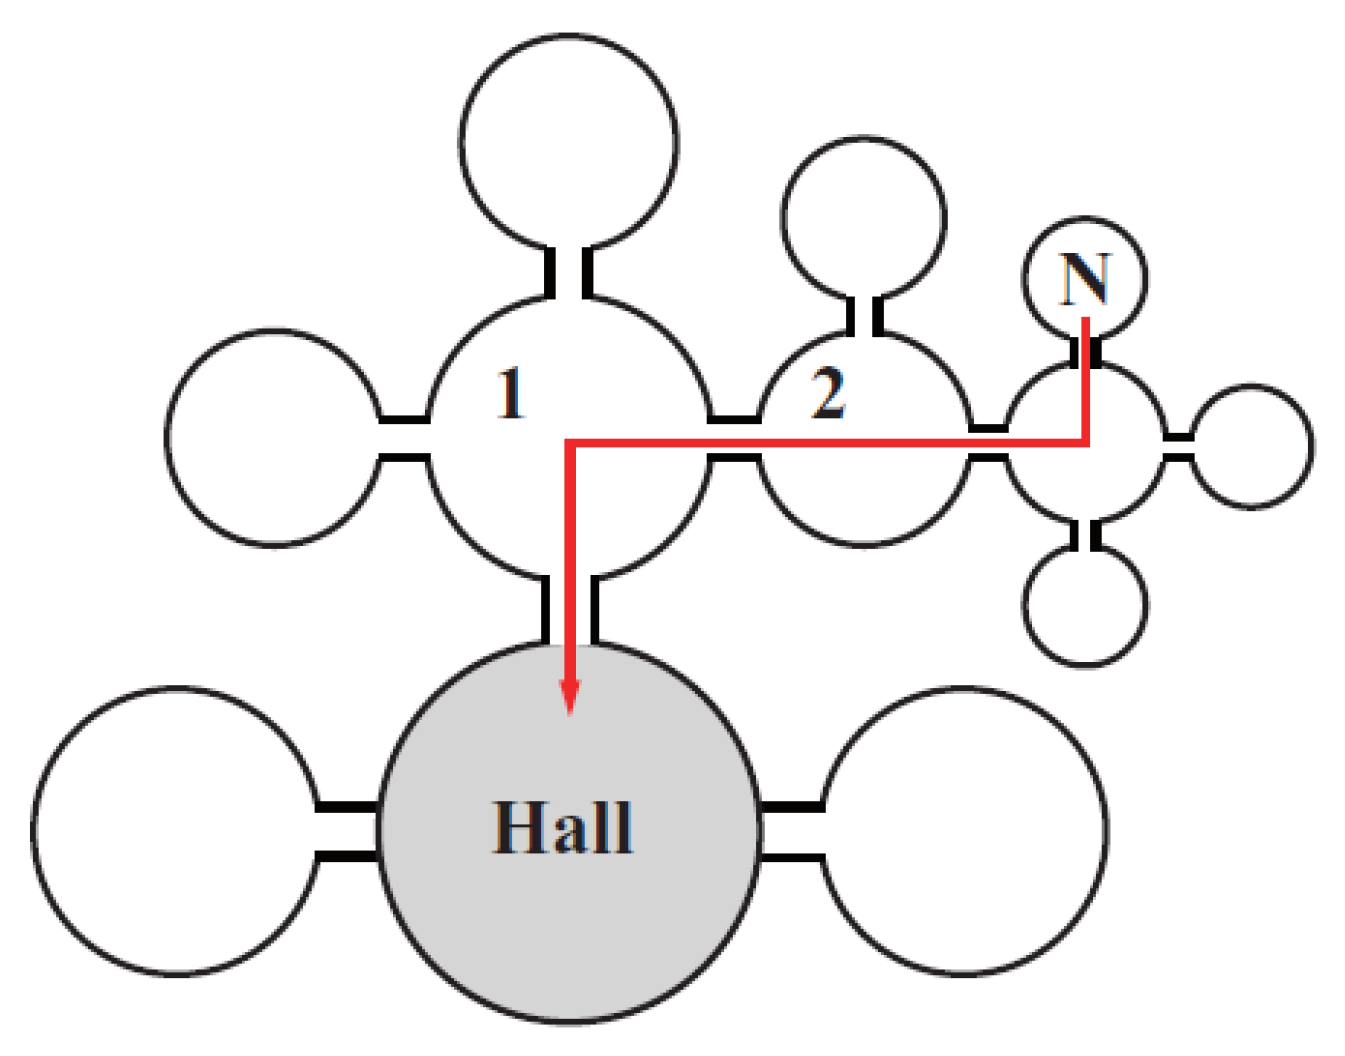
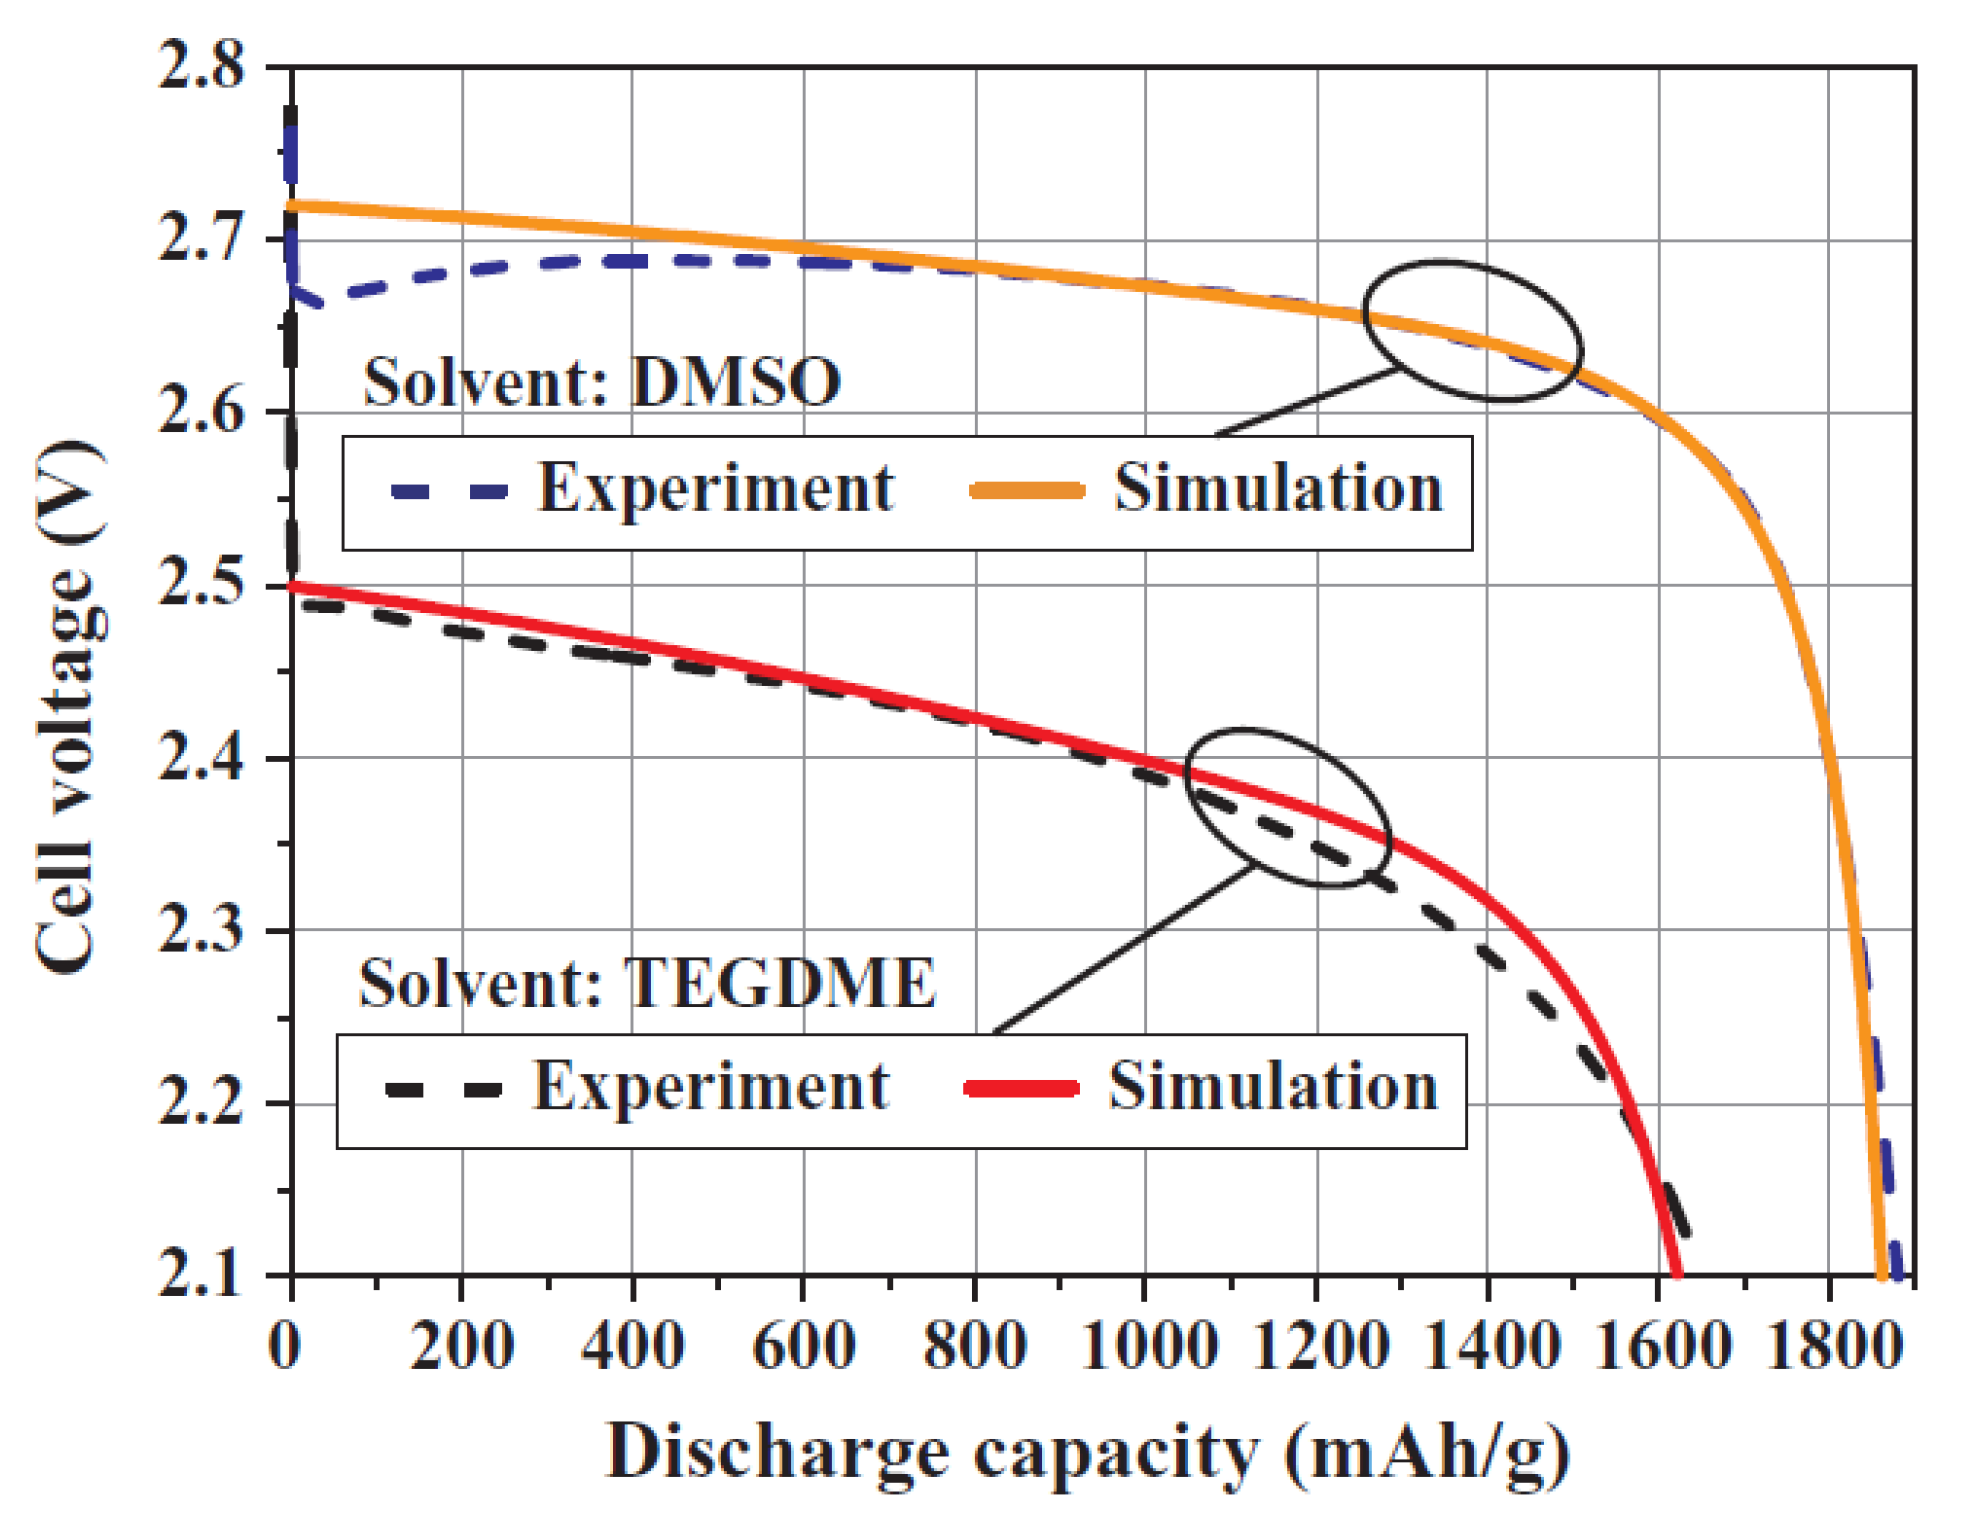
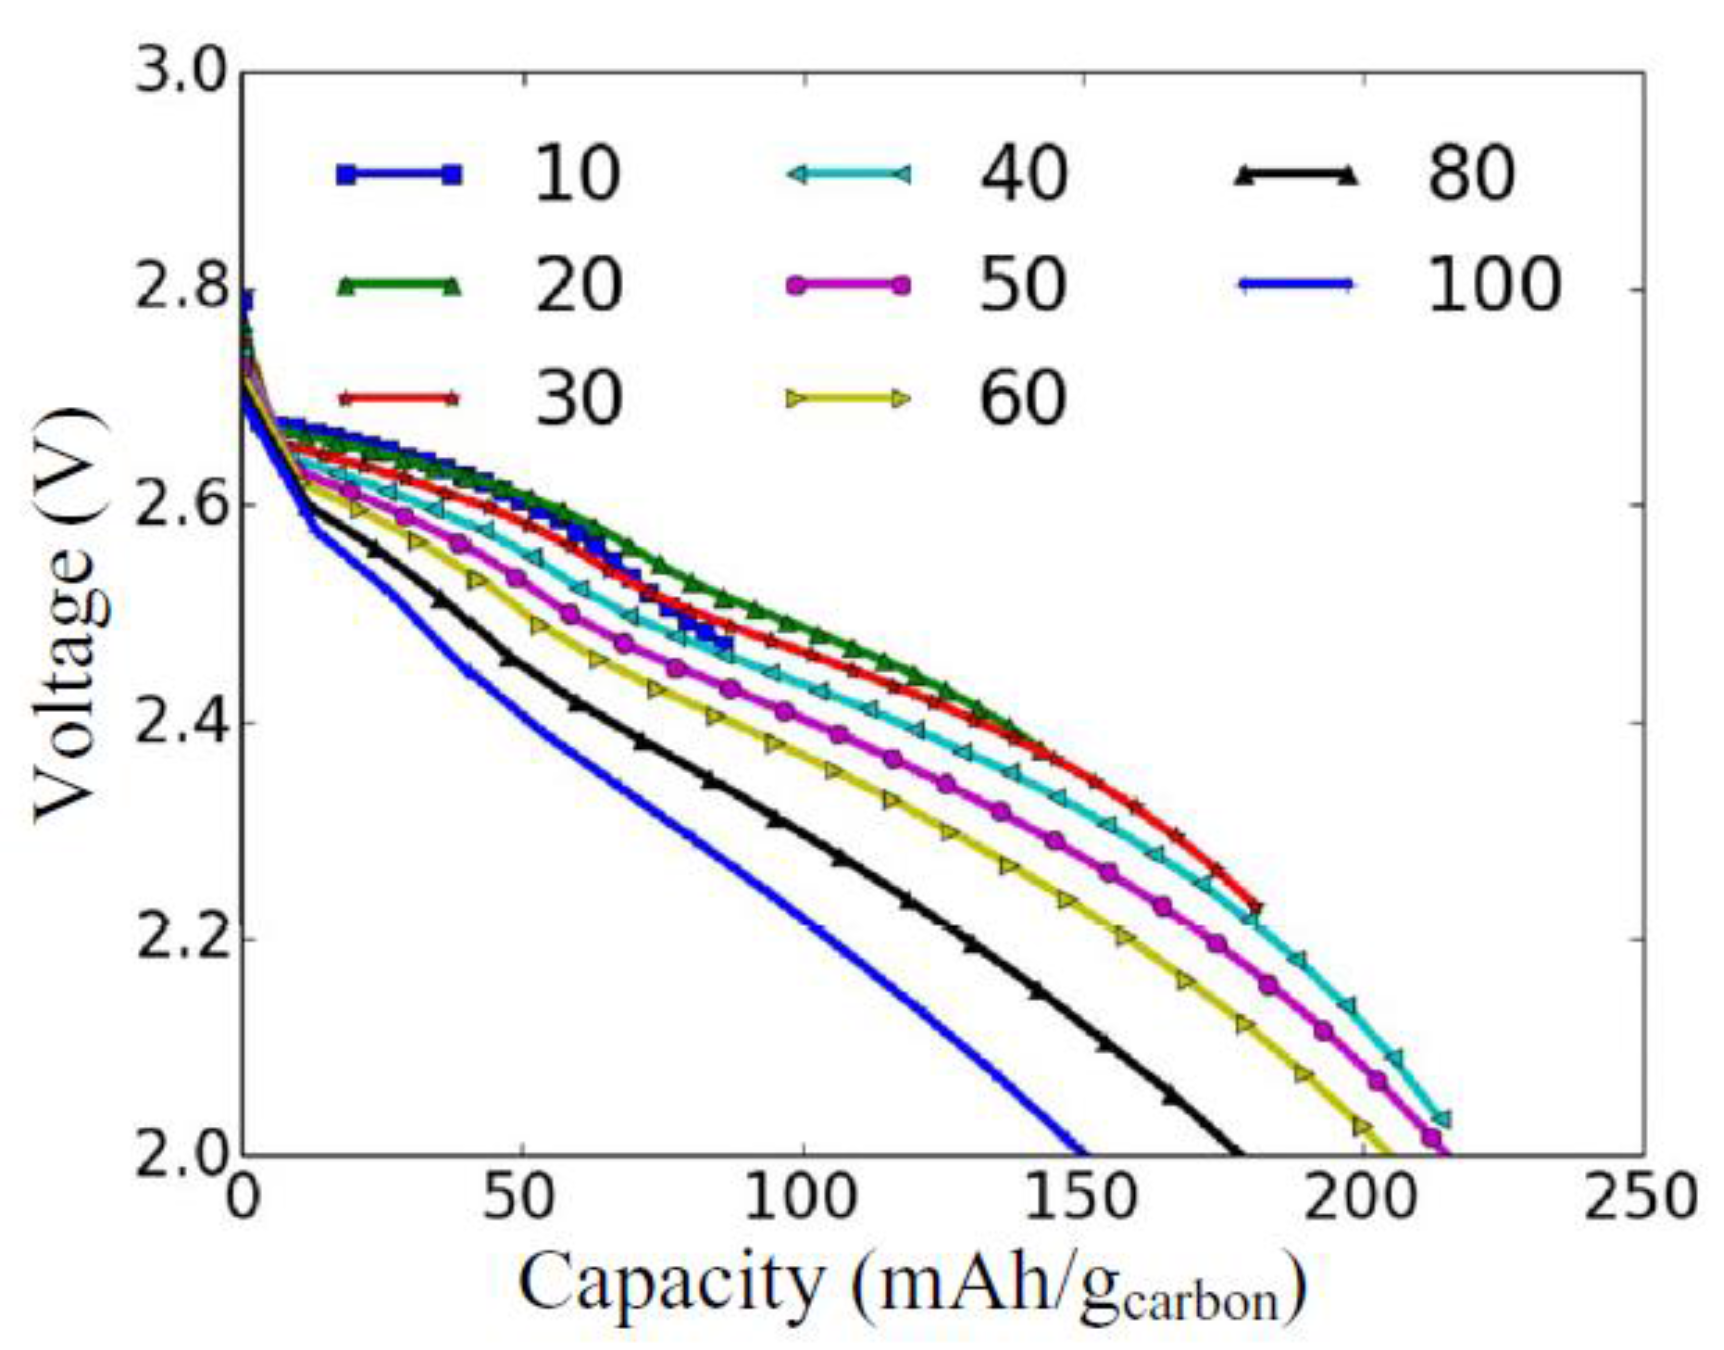
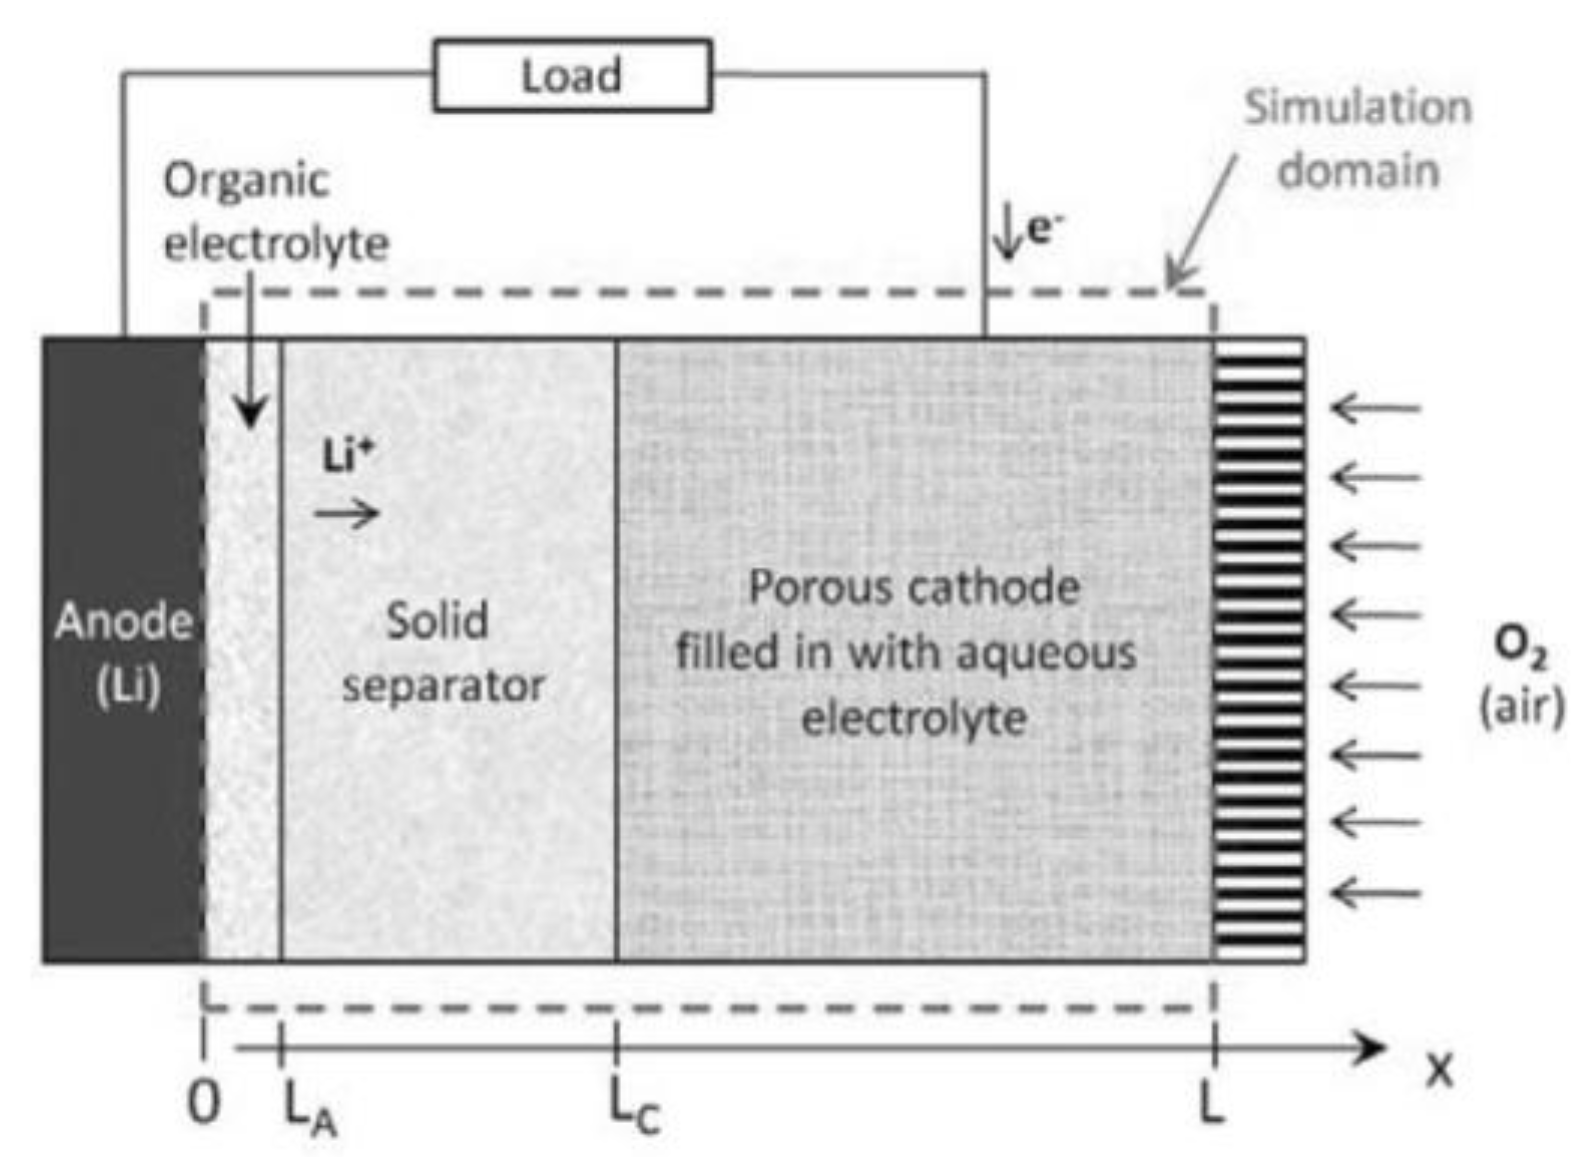
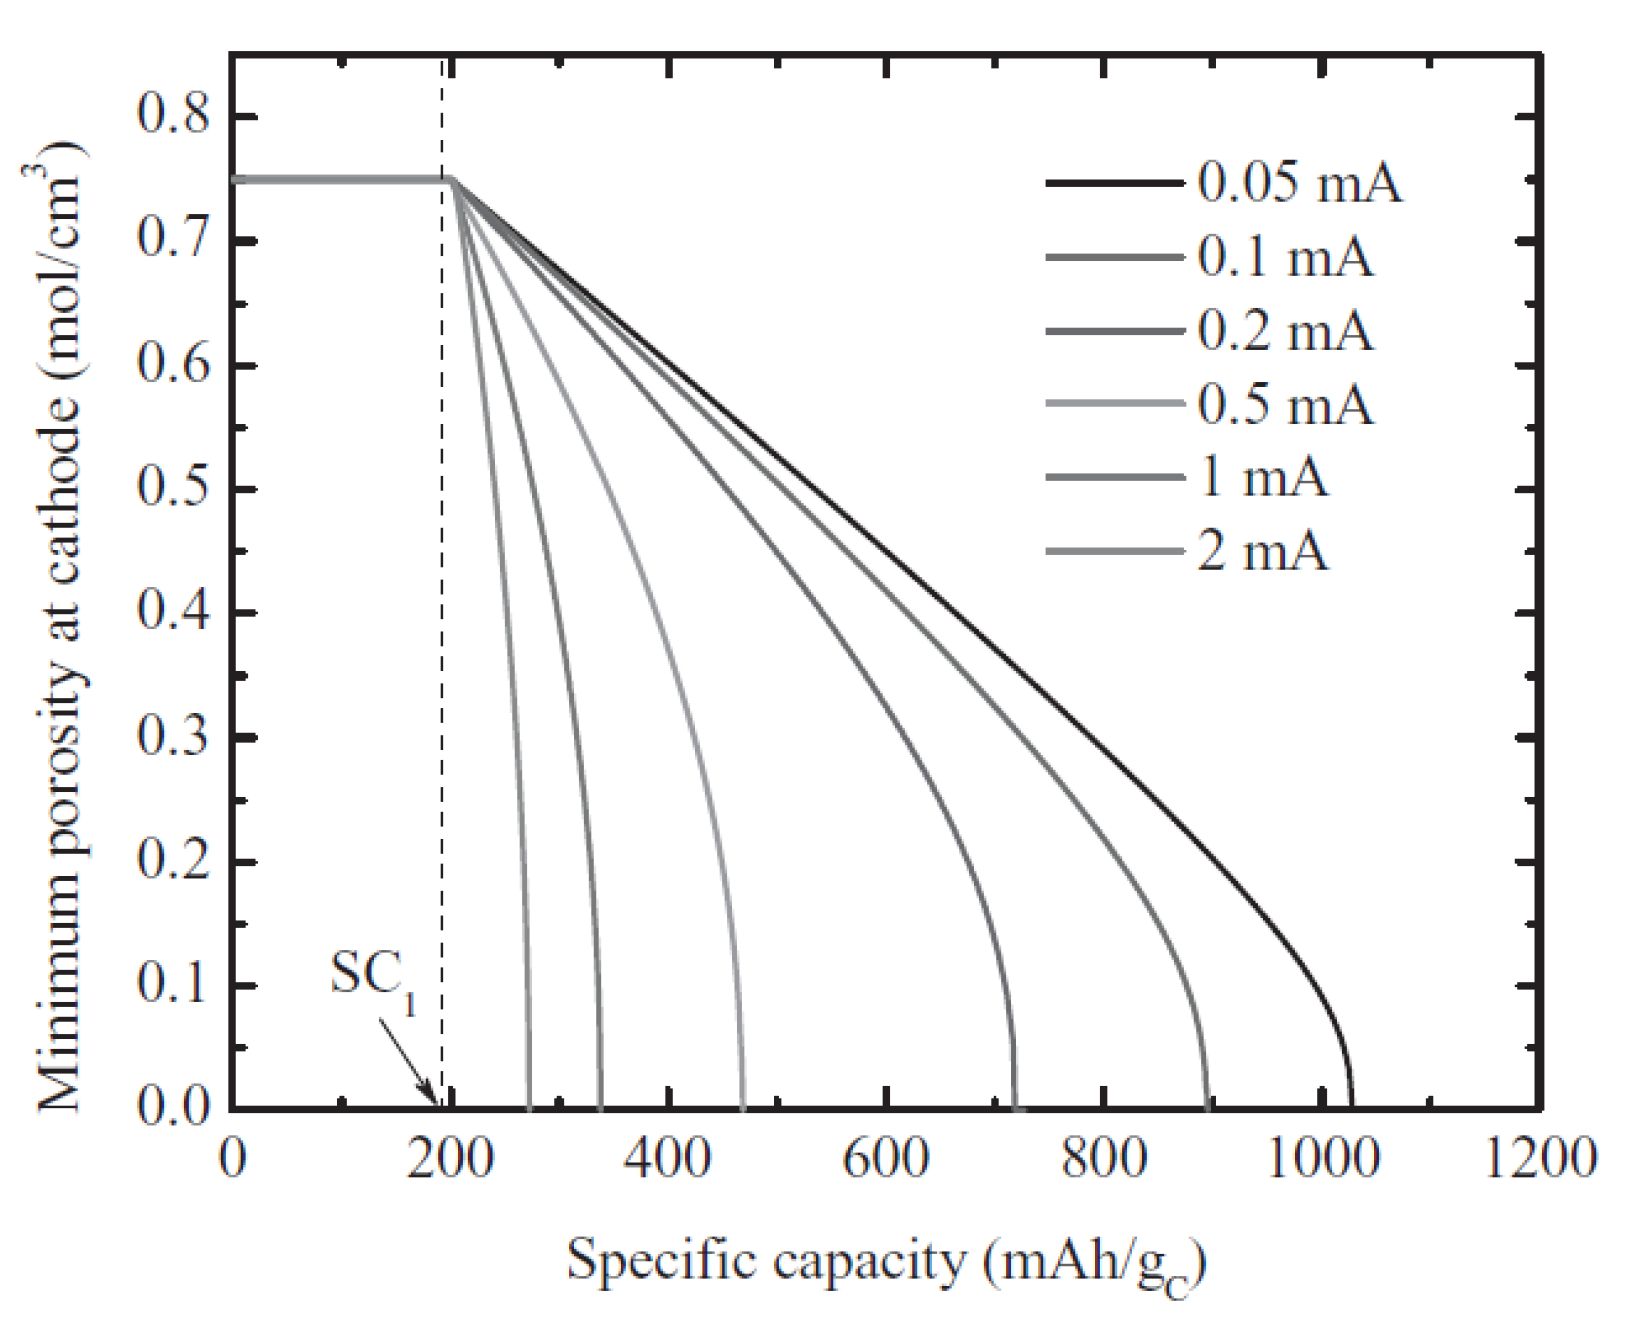
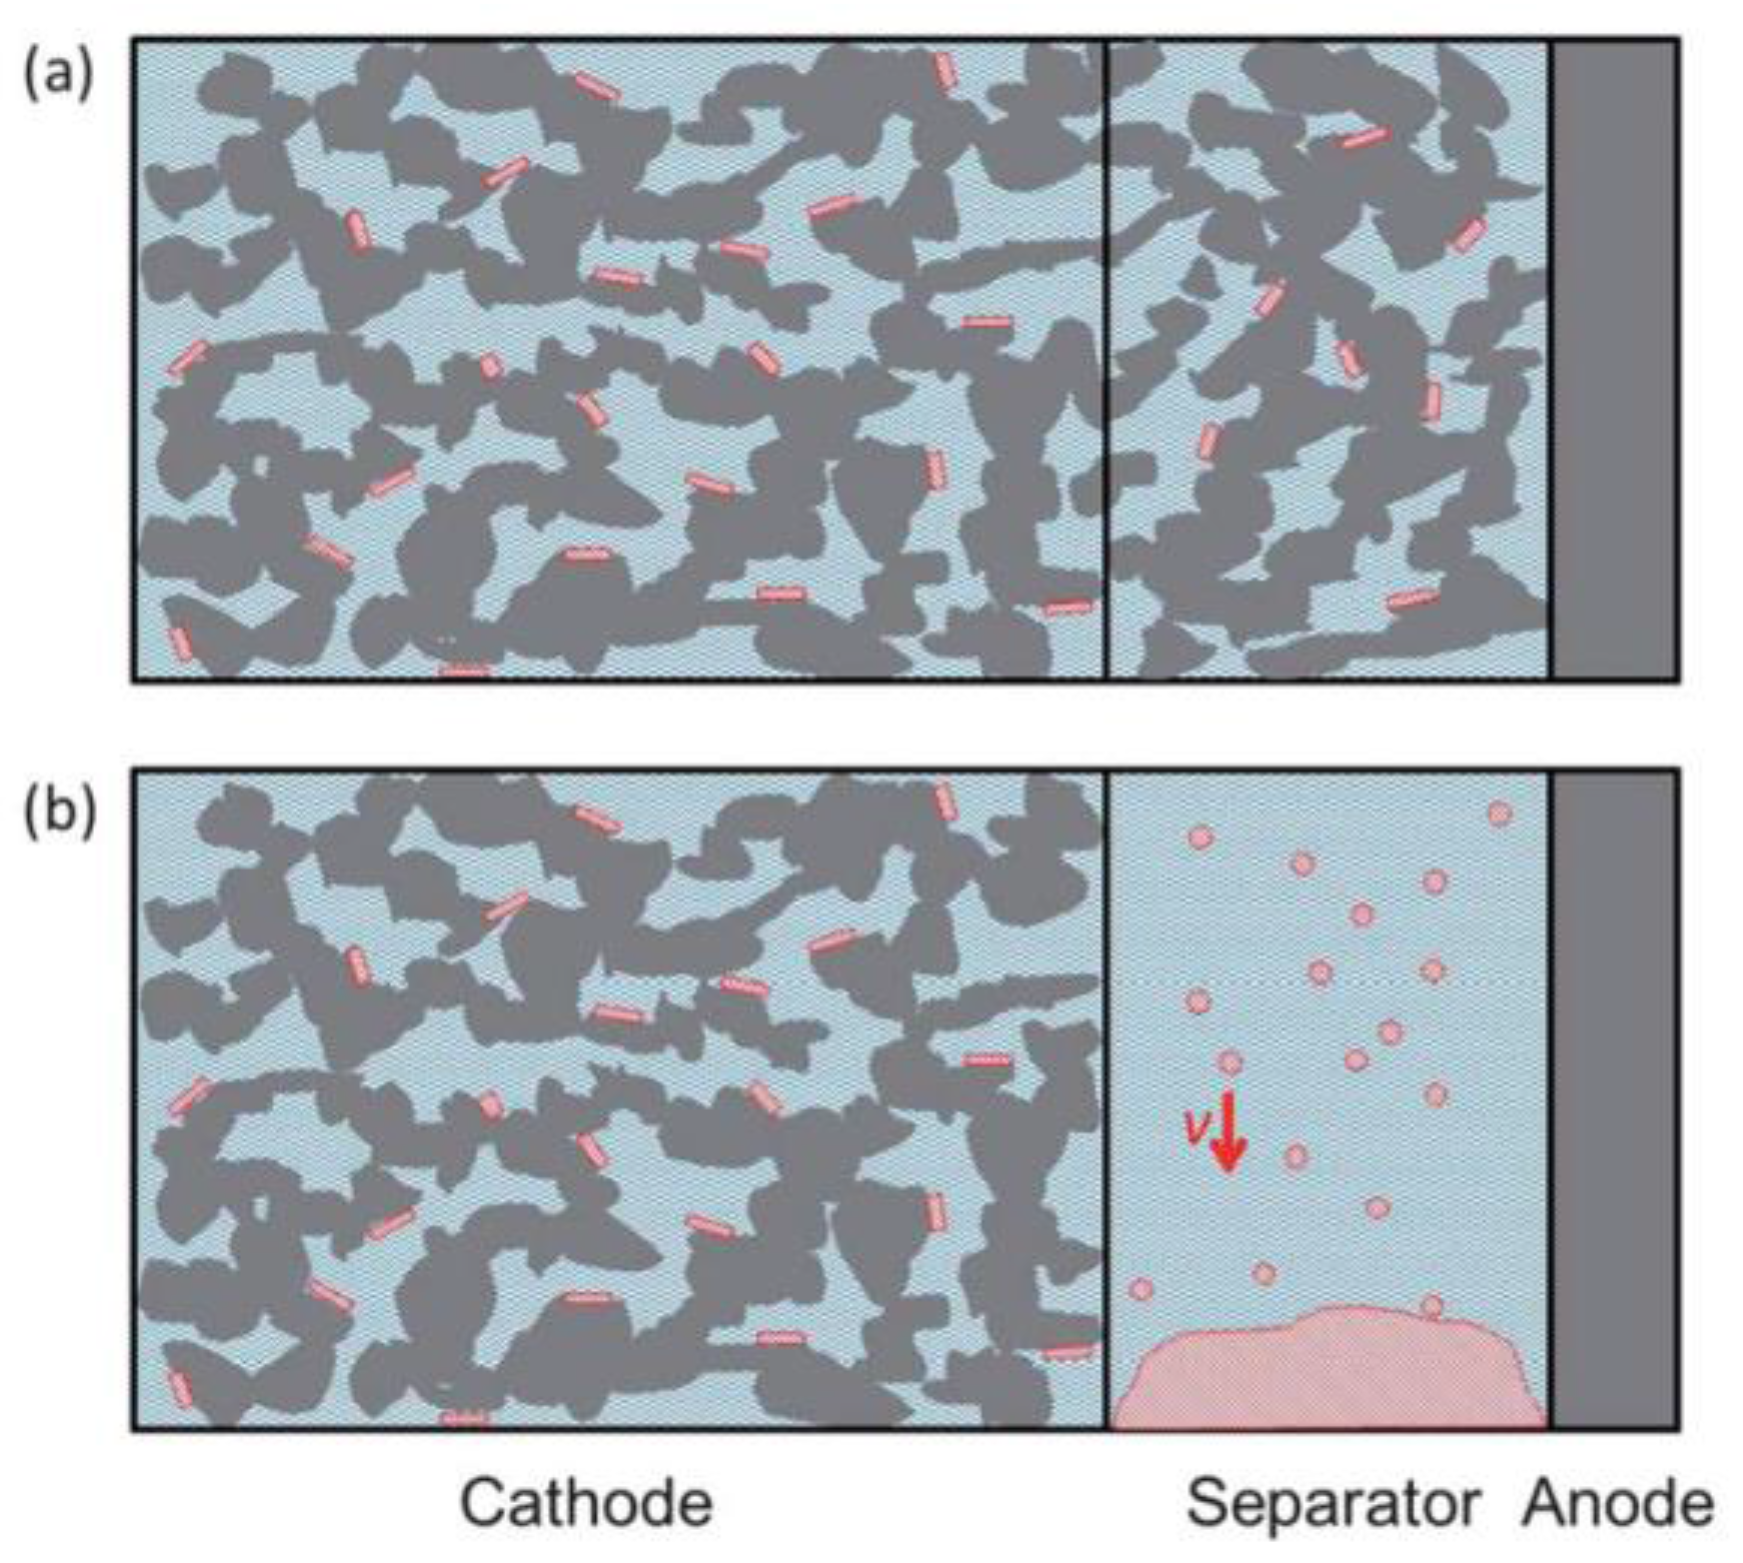
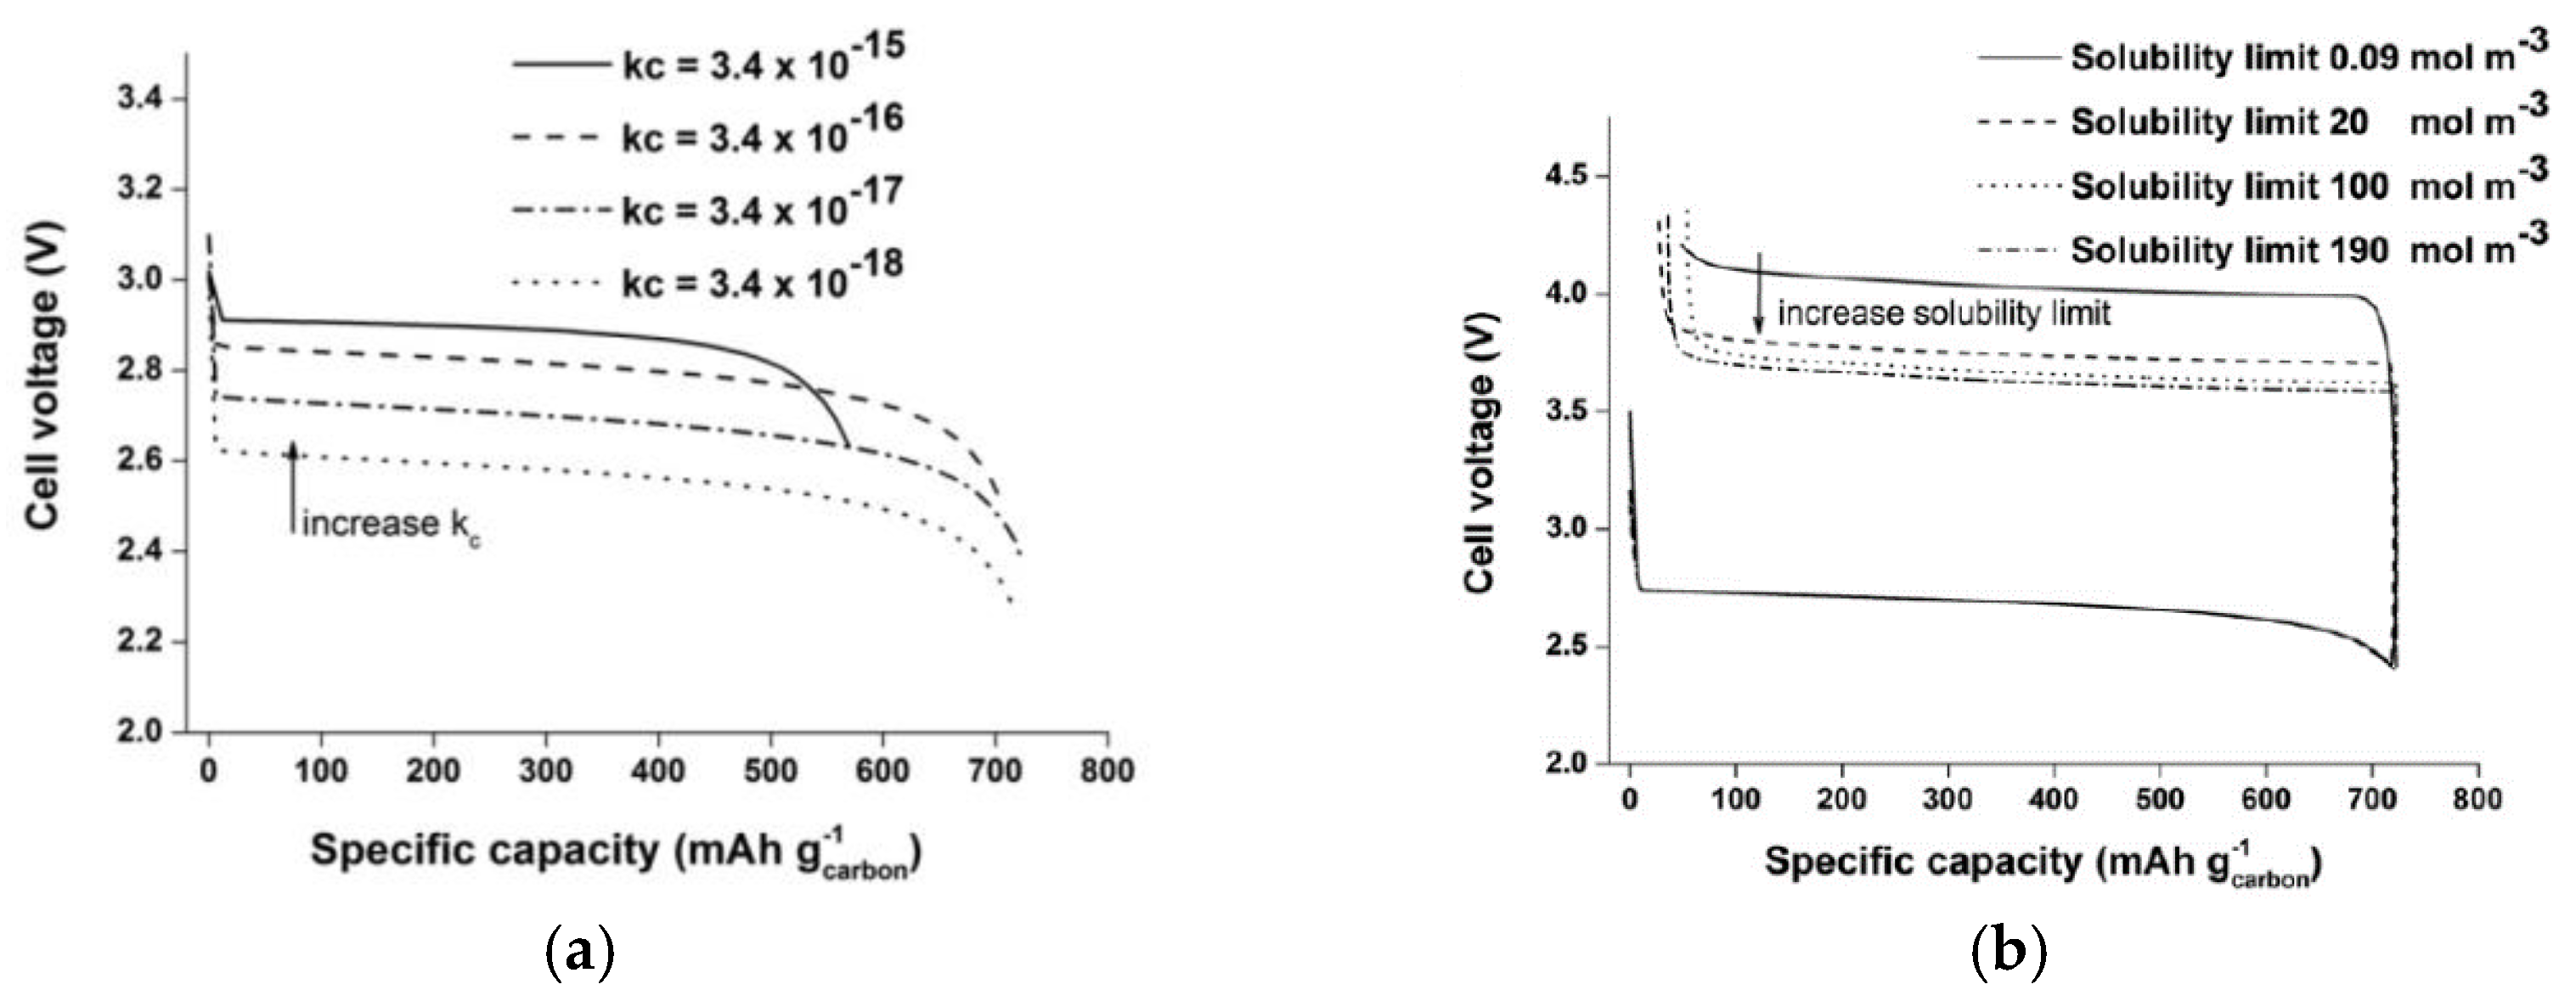
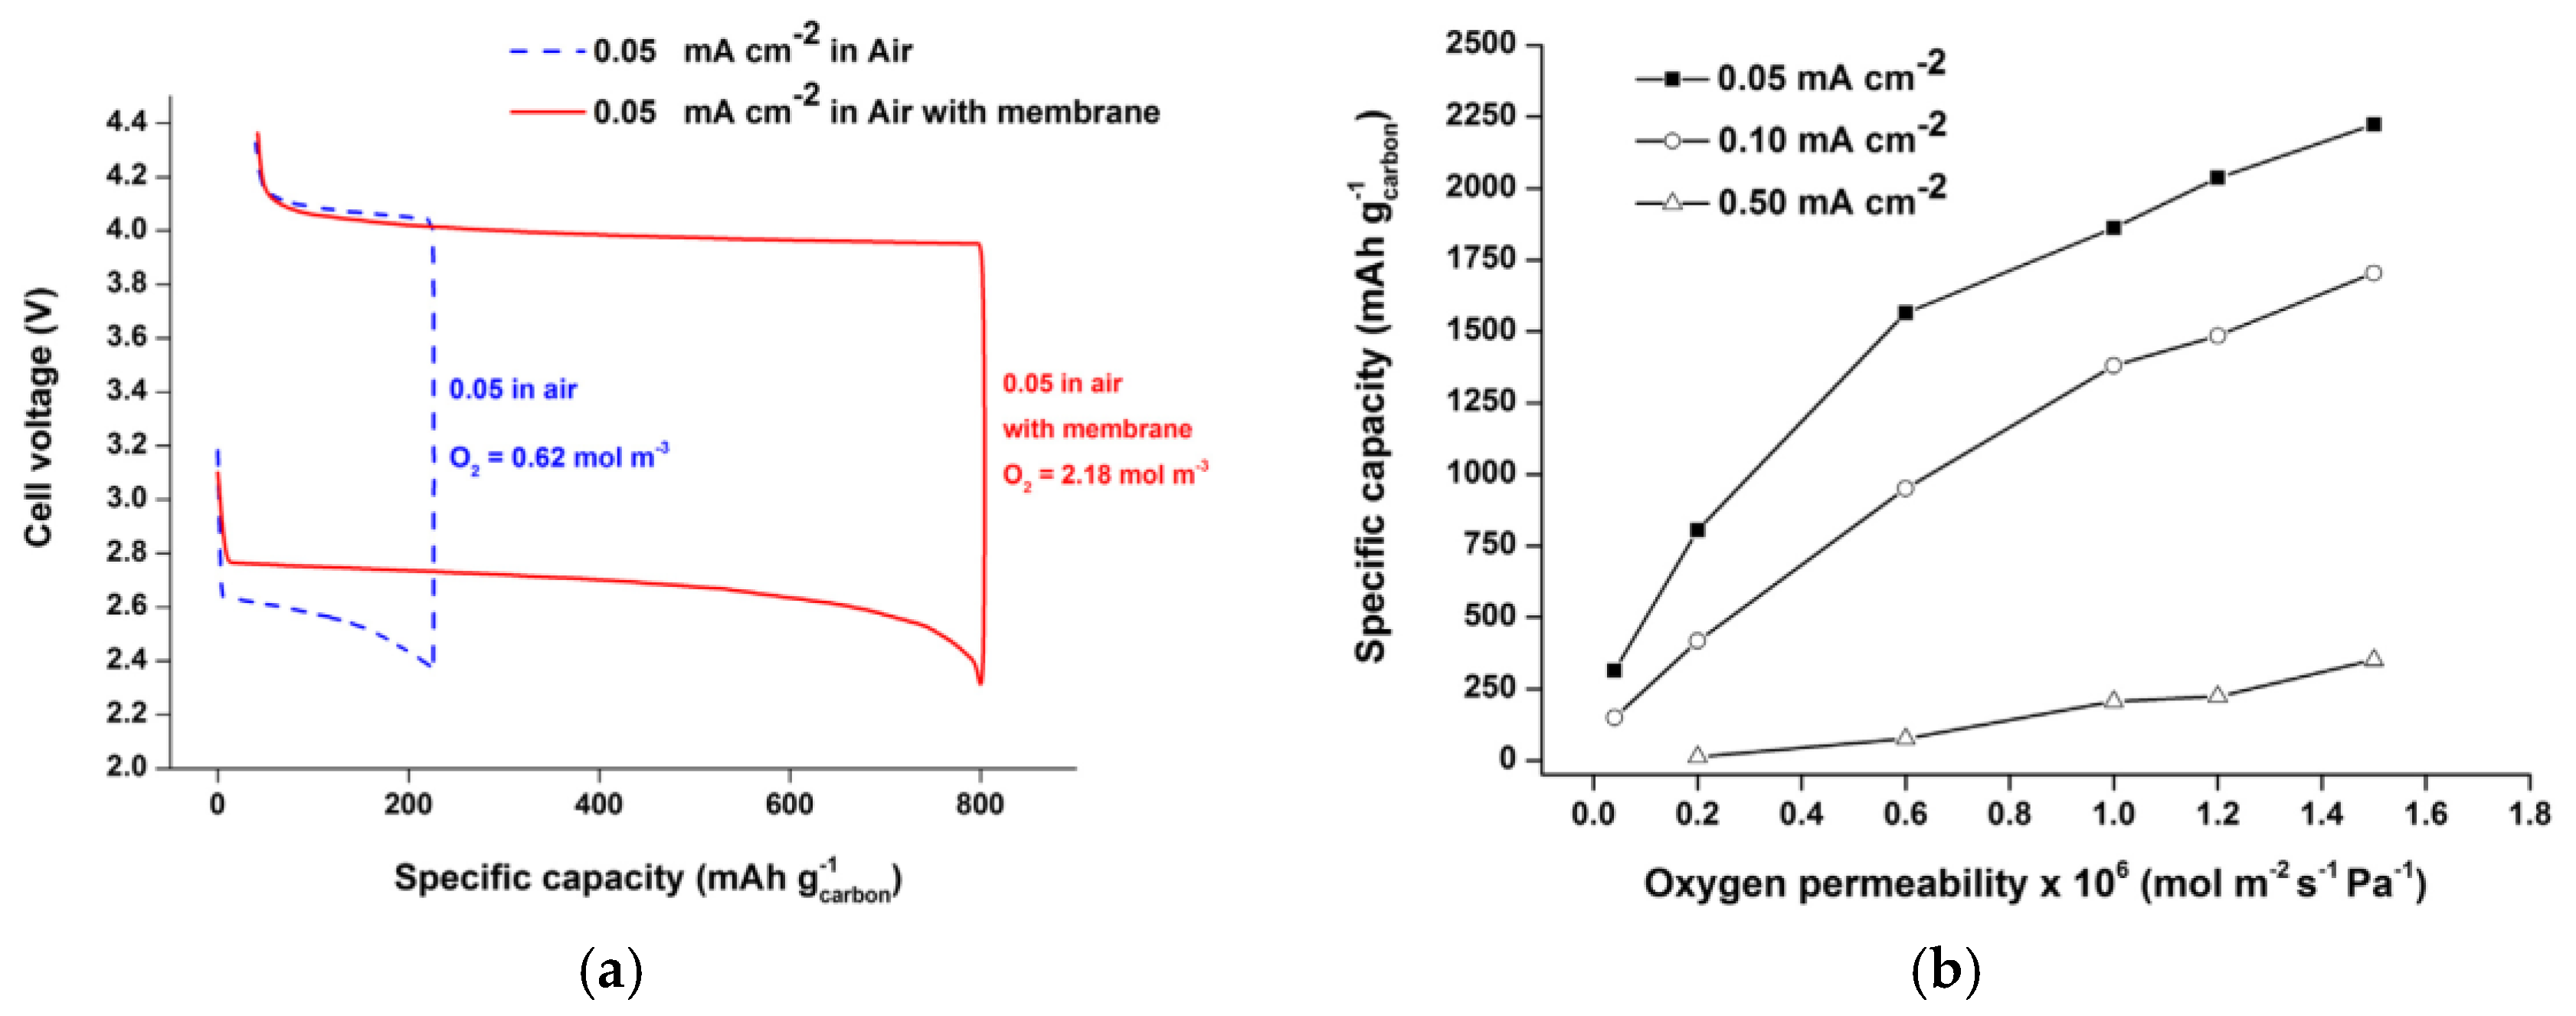
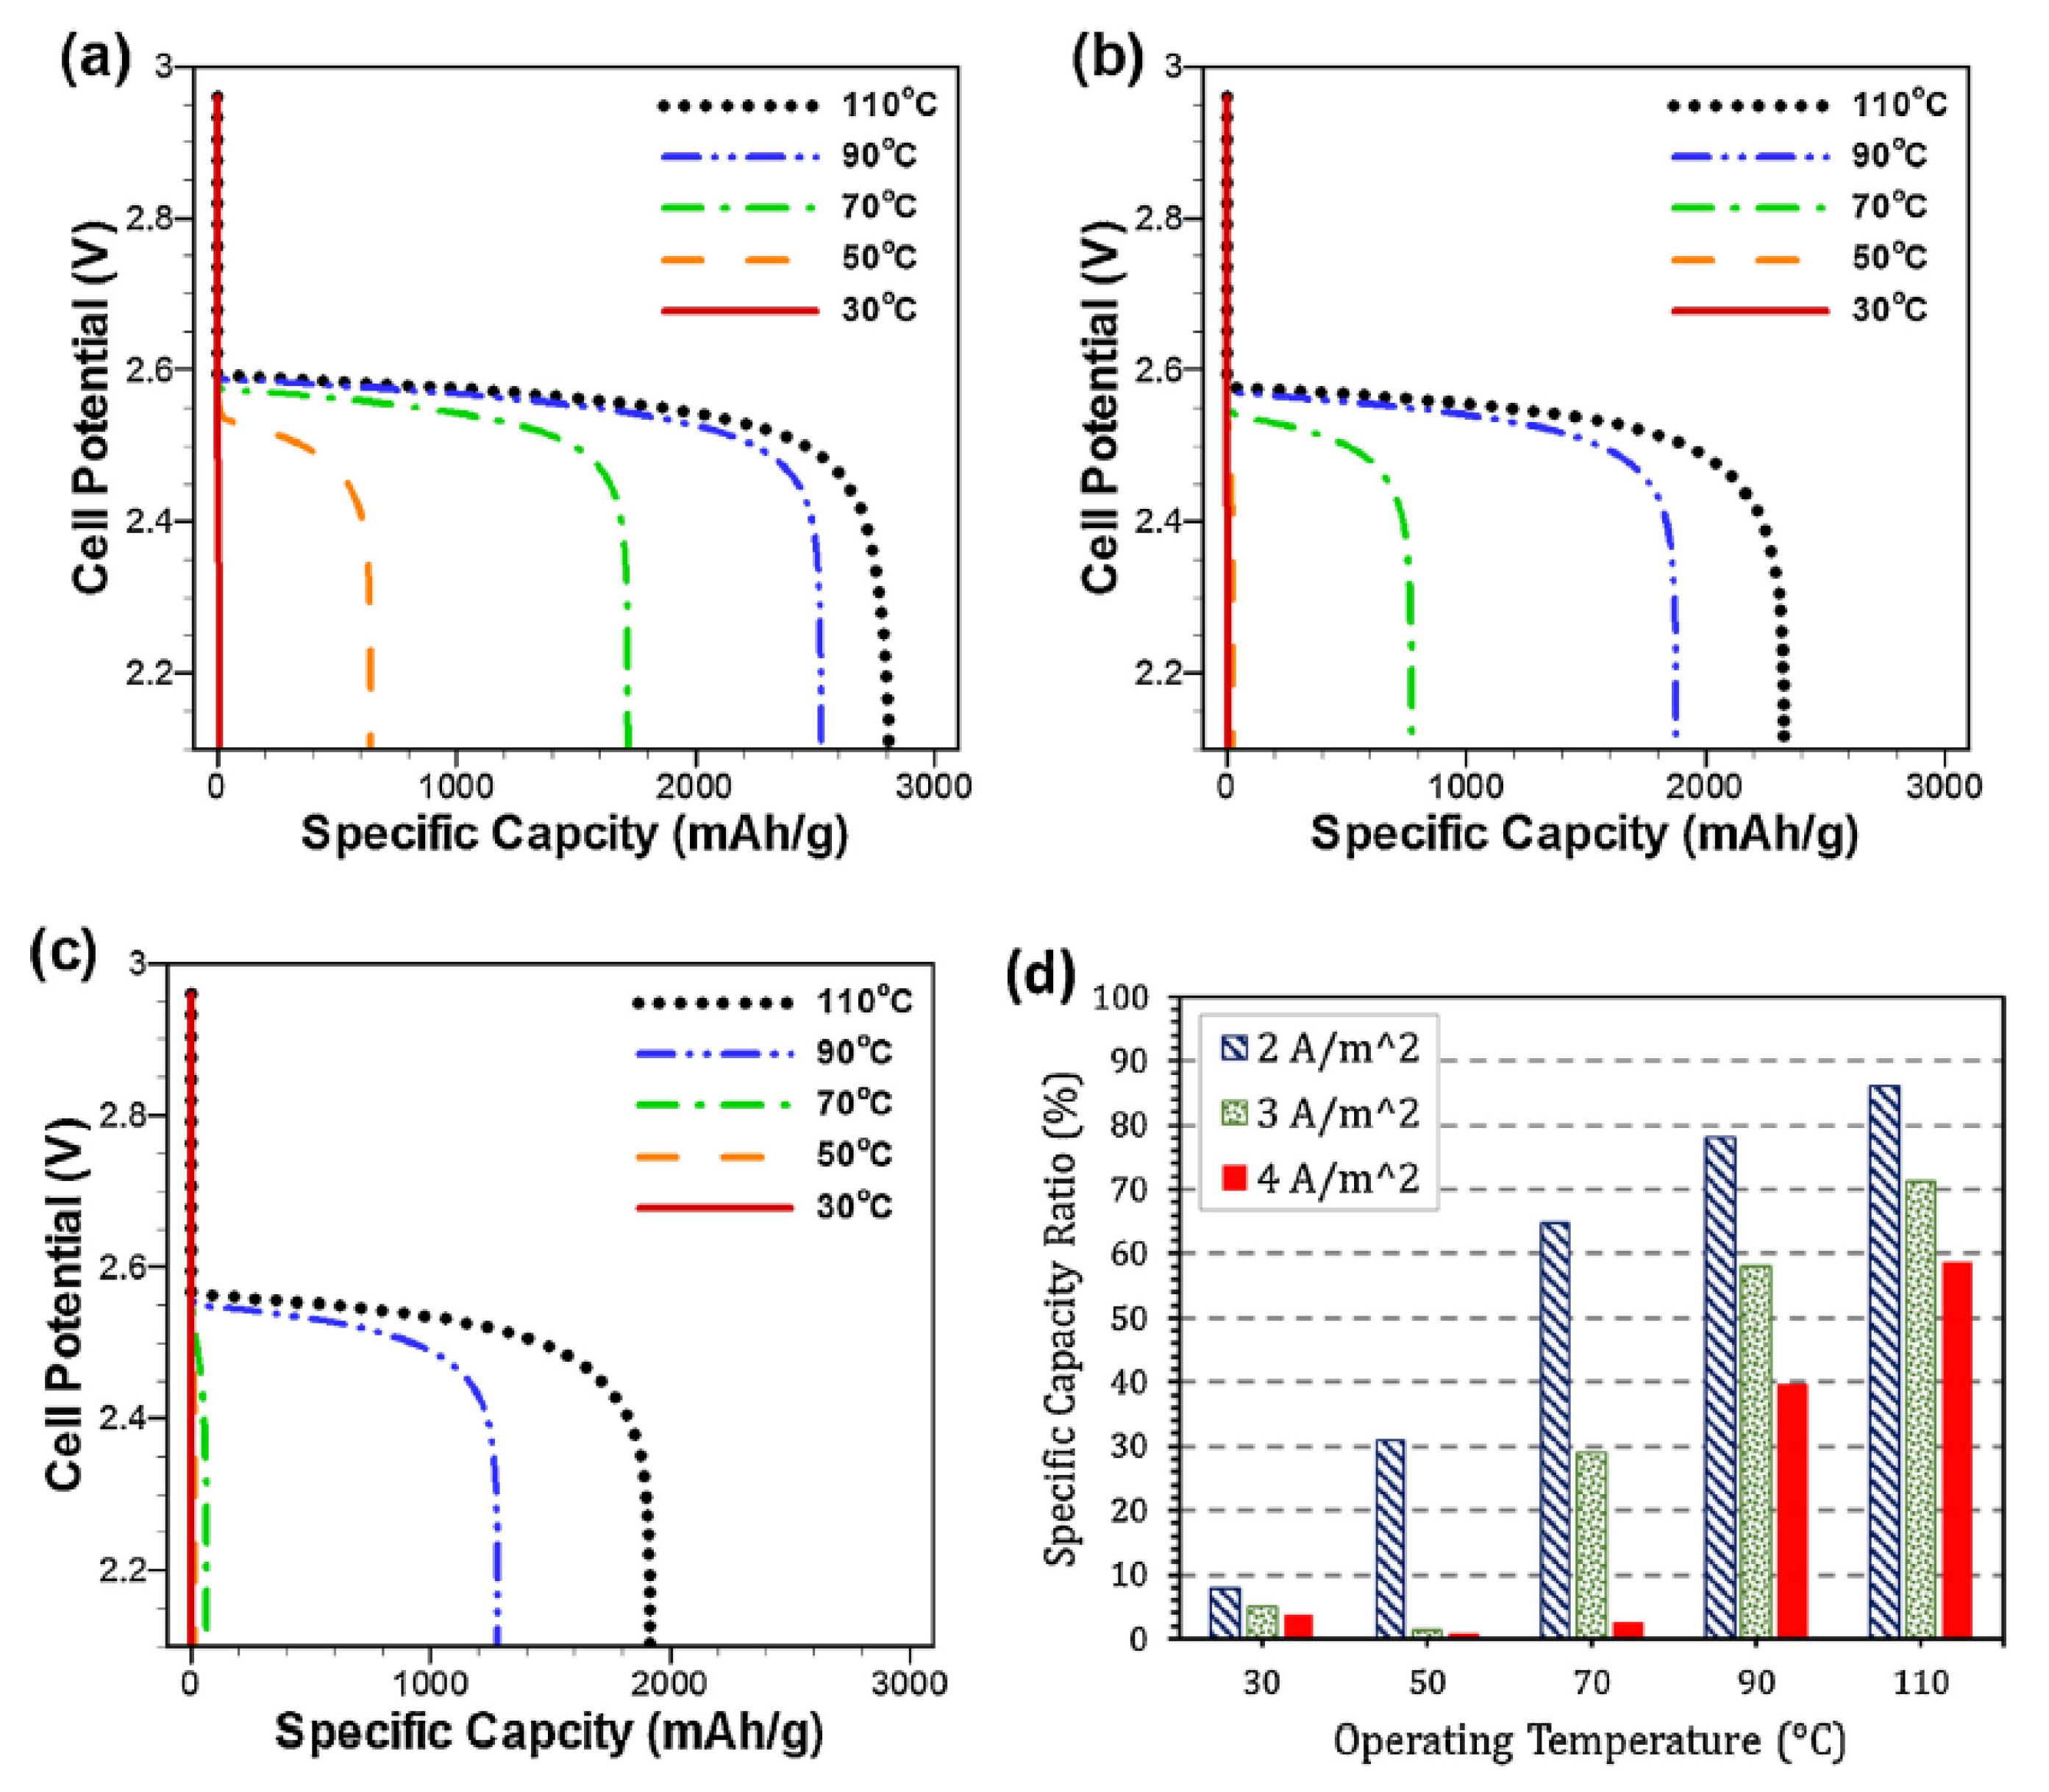
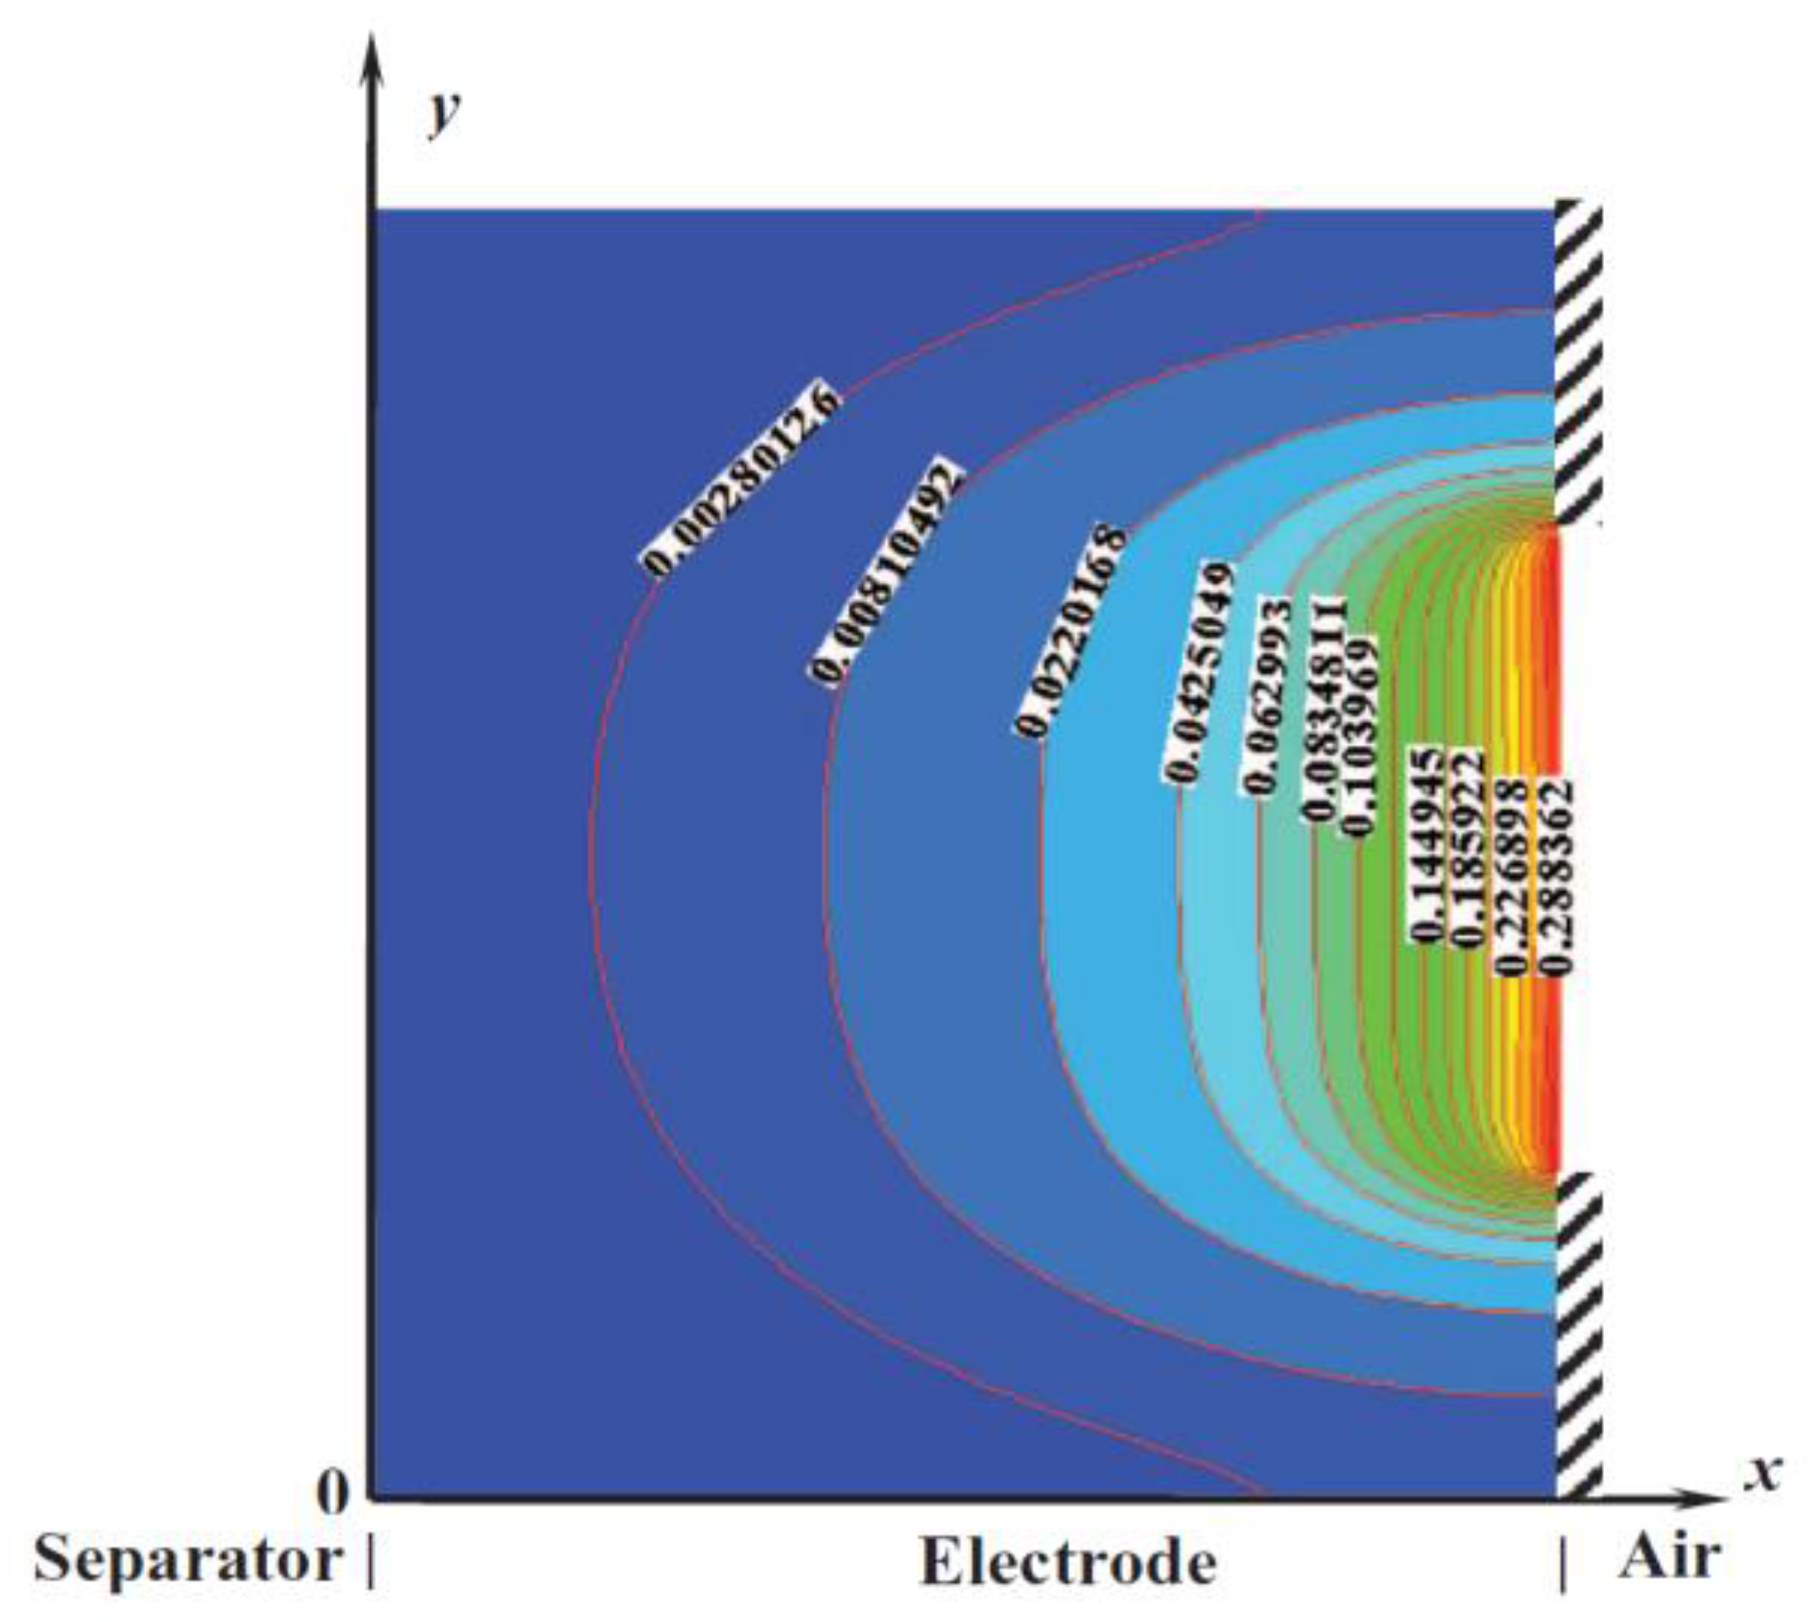
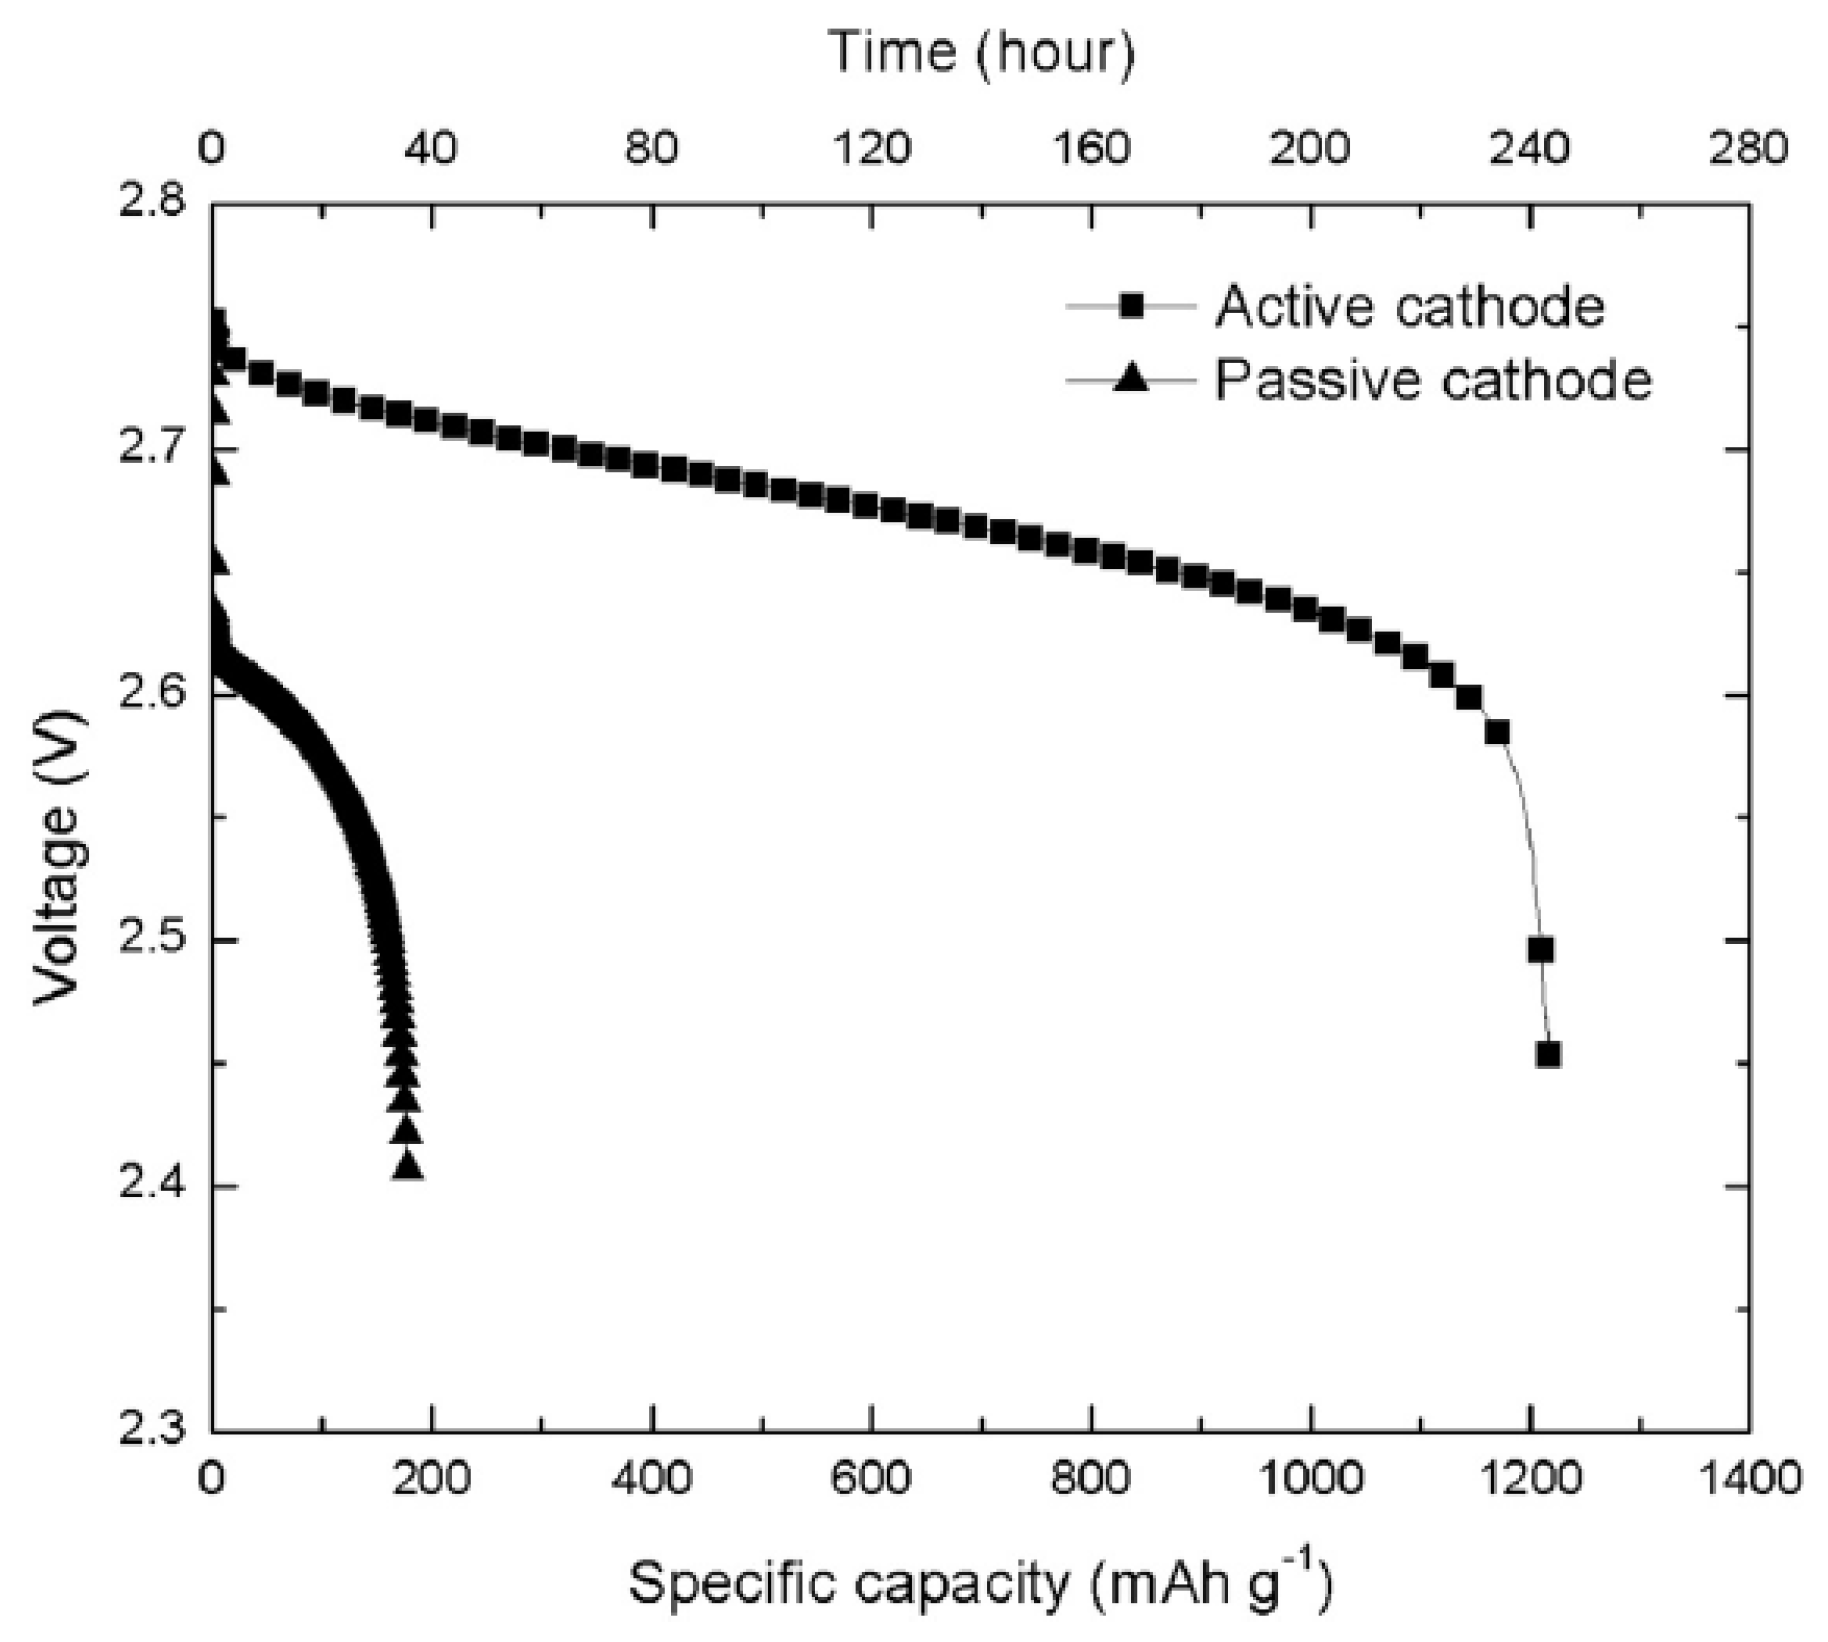
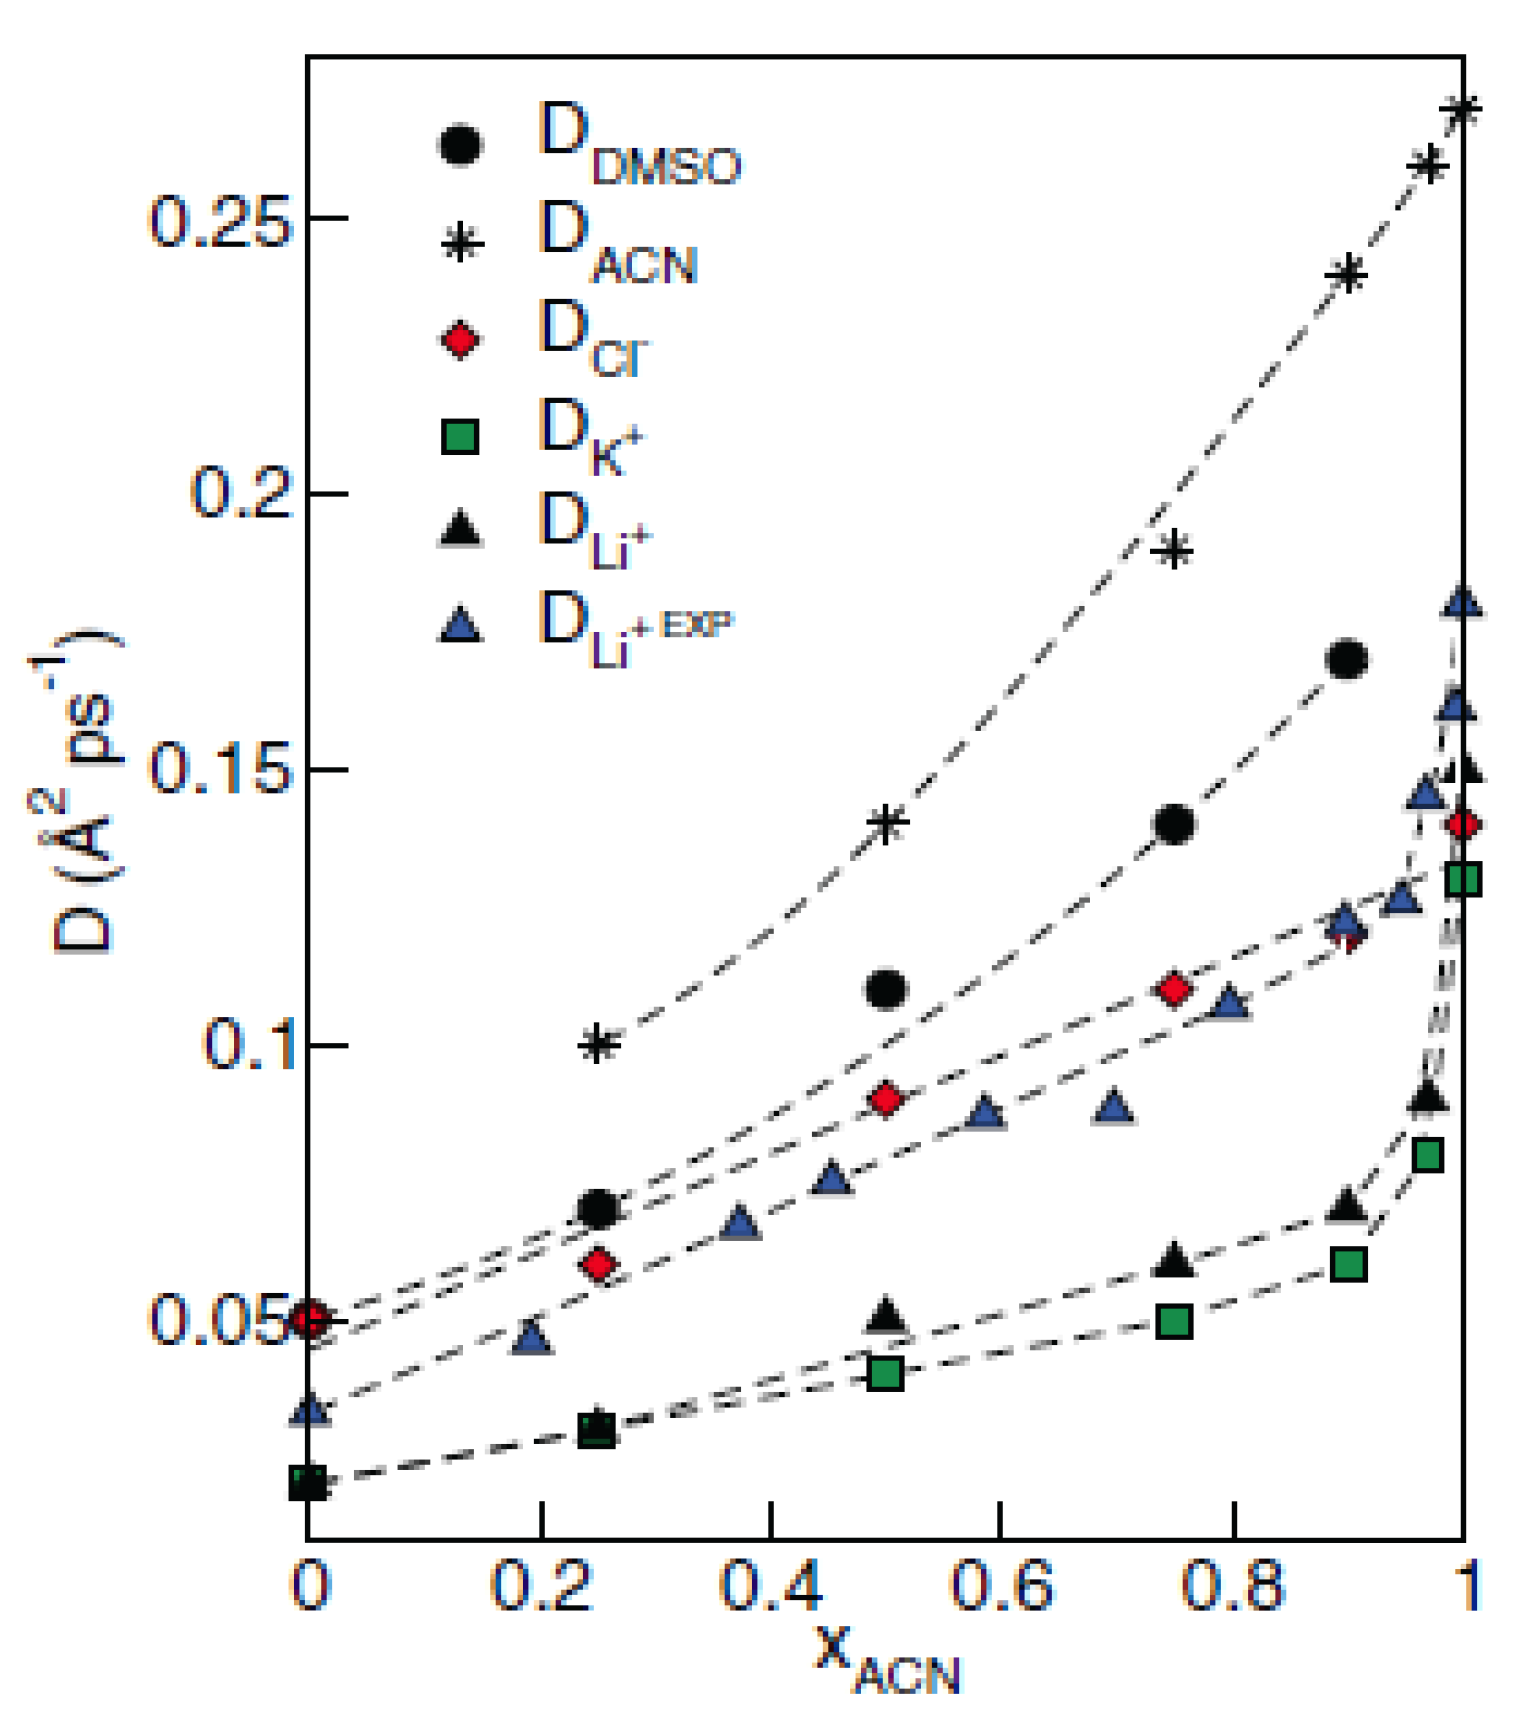
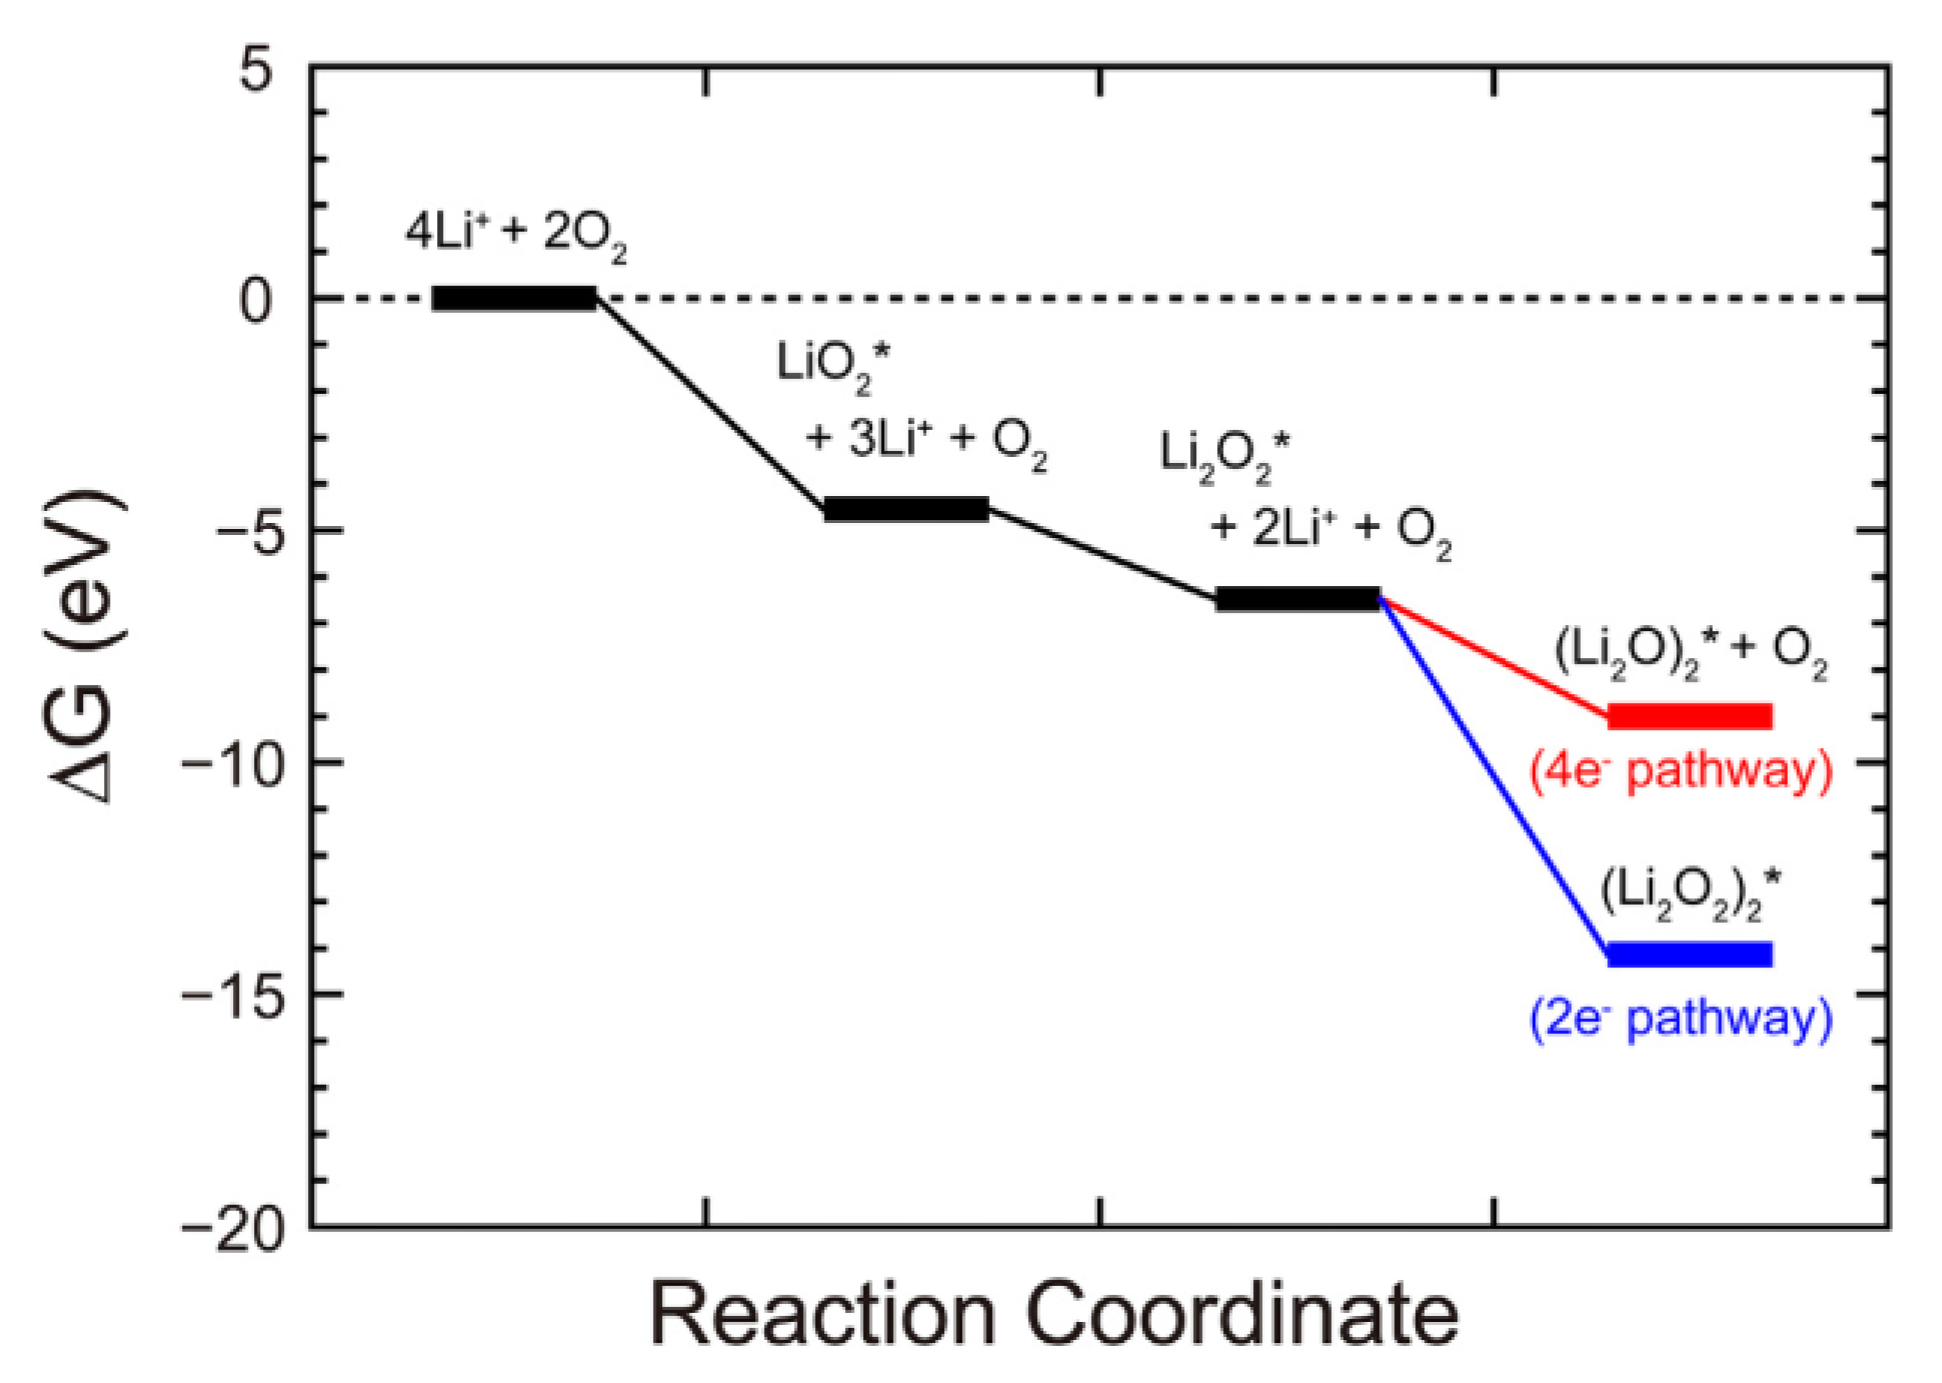
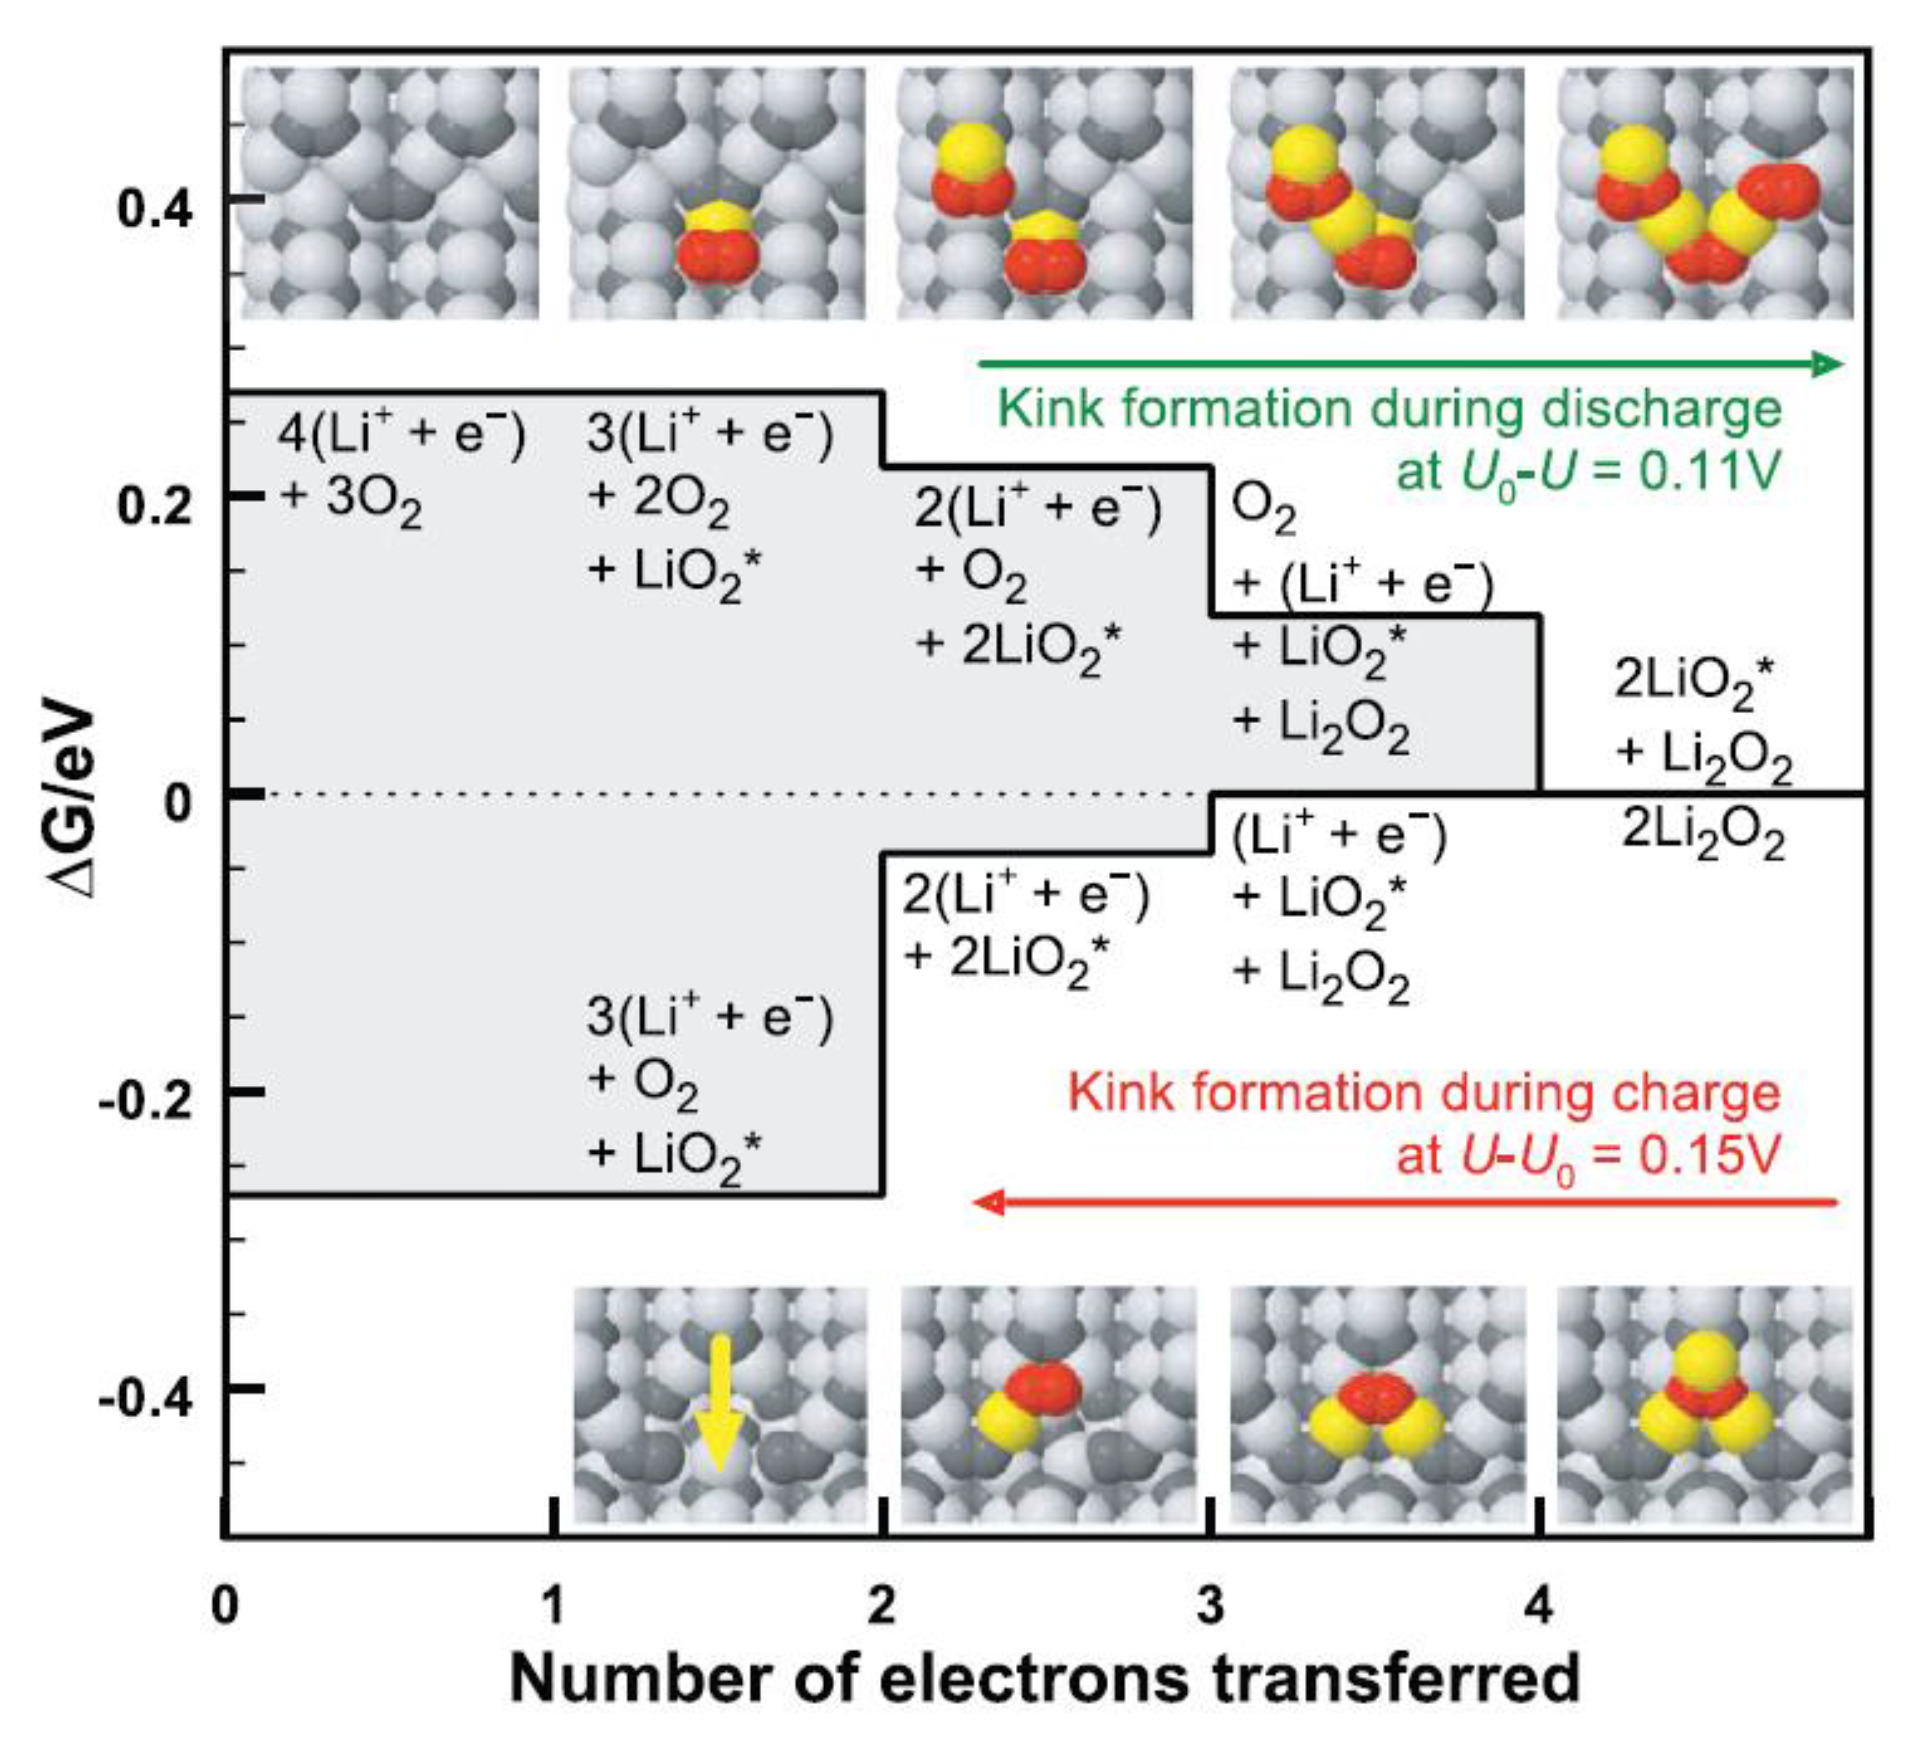
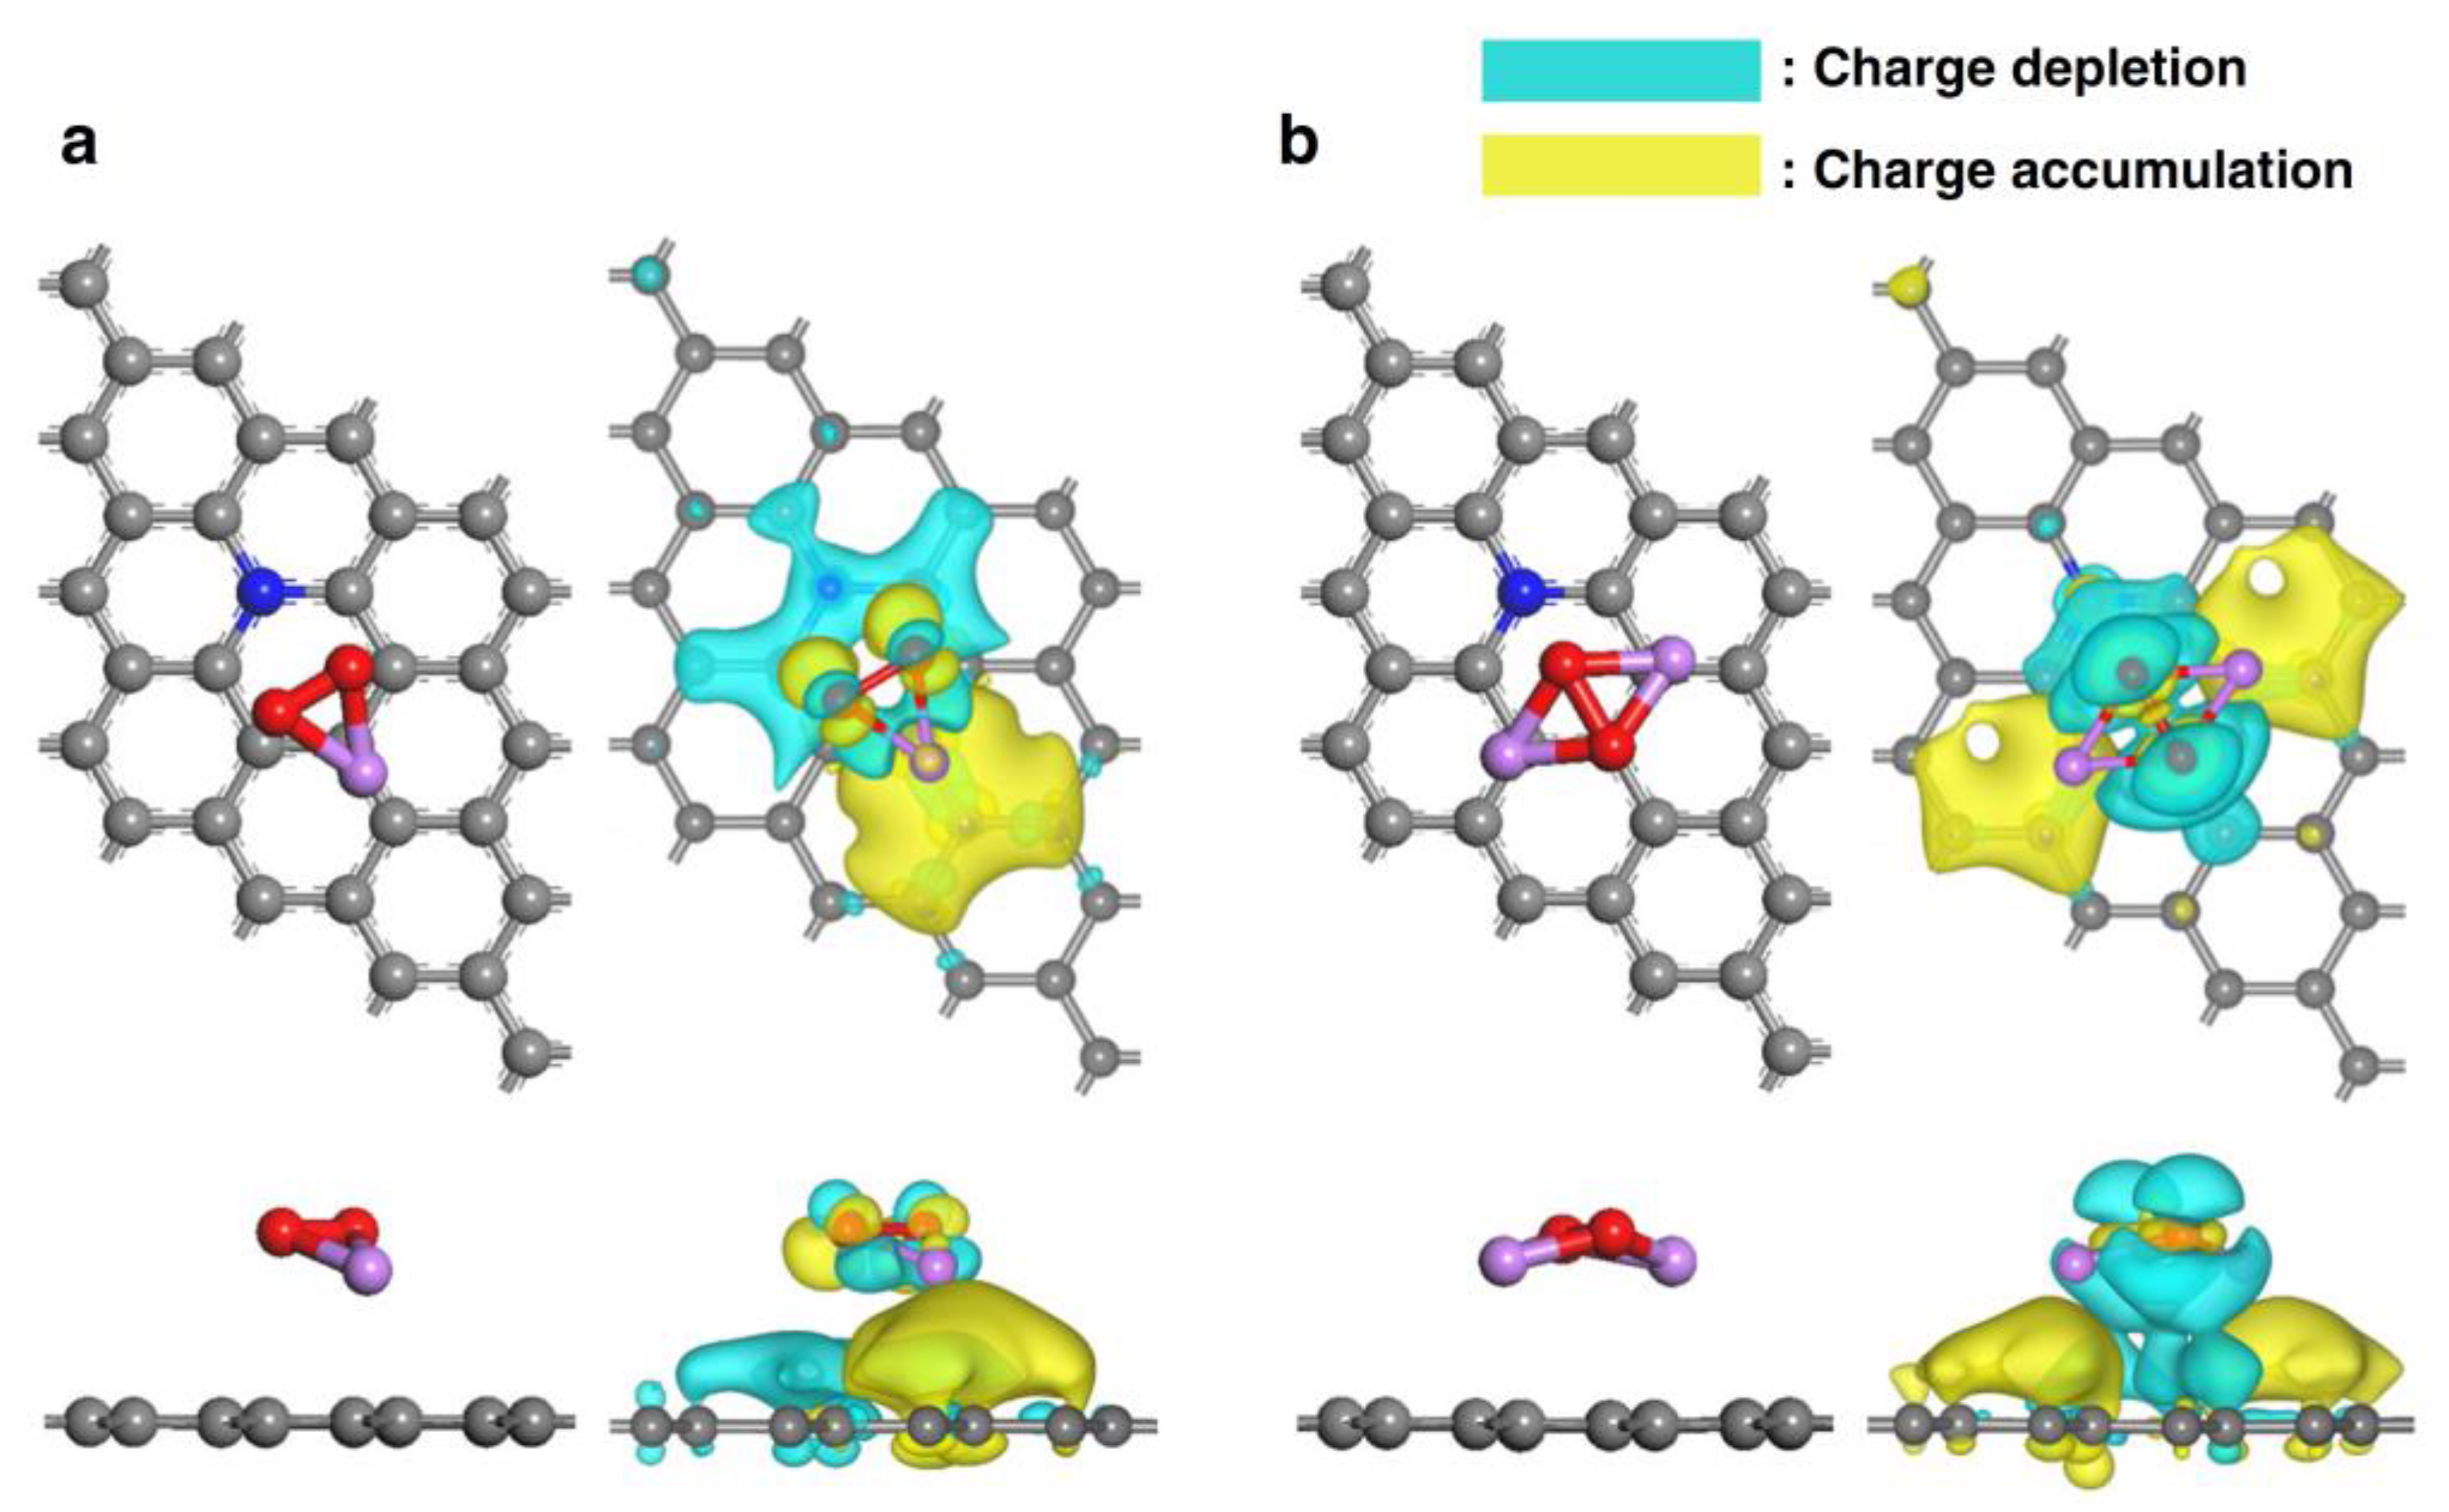
Table 1.
Comparison between organic-liquid-based binary electrolyte and ionic-liquid-based ternary system. Adapted with copyright permission from Yoo et al. [39], with permission from Elsevier.
Table 1.
Comparison between organic-liquid-based binary electrolyte and ionic-liquid-based ternary system. Adapted with copyright permission from Yoo et al. [39], with permission from Elsevier.
| Solvent | Salt | Electrolyte | Ions | System |
|---|---|---|---|---|
| Organic (propylene carbonate) | LiPF6 | Organic Electrolyte | Li+, PF6− | Binary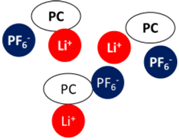 |
| Ionic Liquid (mppy-TFSI) | LiTFSI | Ionic Liquid Electrolyte | Li+, mppy+, TFSI− | Ternary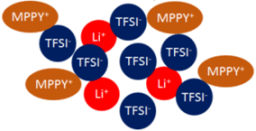 |
Table 2.
Transport and dissolution properties of ions. Adapted with copyright permission from Yoo et al. [44], with permission from Elsevier.
Table 2.
Transport and dissolution properties of ions. Adapted with copyright permission from Yoo et al. [44], with permission from Elsevier.
| Parameter | Temperature (oC) | Unit | |||||
|---|---|---|---|---|---|---|---|
| 30 | 50 | 70 | 90 | 110 | |||
| Maxwell-Stefan Diffusivities | D12 a | 2.6625 | 4.1332 | 4.3976 | 10.1566 | 26.9723 | ×10−12 (m2/s) |
| D13 a | 4.6936 | 6.6999 | 7.5526 | 16.5441 | 44.812 | ||
| D23 a | 5.2847 | 5.2847 | 15.814 | 21.352 | 27.7031 | ||
| Heny’s constant of Oxygen | 1337.35 | 989.48 | 788.61 | 702.56 | 668.01 | atm | |
| Diffusivity of Oxygen | 1.213 | 3.416 | 5.412 | 6.732 | 7.526 | ×10−10 (m2/s) | |
a 1: Li+, 2: MPPY+, 3: TFSI−.
© 2017 by the authors. Licensee MDPI, Basel, Switzerland. This article is an open access article distributed under the terms and conditions of the Creative Commons Attribution (CC BY) license (http://creativecommons.org/licenses/by/4.0/).
Share and Cite
MDPI and ACS Style
Yoo, K.; Banerjee, S.; Kim, J.; Dutta, P. A Review of Lithium-Air Battery Modeling Studies. Energies 2017, 10, 1748. https://doi.org/10.3390/en10111748
AMA Style
Yoo K, Banerjee S, Kim J, Dutta P. A Review of Lithium-Air Battery Modeling Studies. Energies. 2017; 10(11):1748. https://doi.org/10.3390/en10111748
Chicago/Turabian StyleYoo, Kisoo, Soumik Banerjee, Jonghoon Kim, and Prashanta Dutta. 2017. "A Review of Lithium-Air Battery Modeling Studies" Energies 10, no. 11: 1748. https://doi.org/10.3390/en10111748
Note that from the first issue of 2016, this journal uses article numbers instead of page numbers. See further details here.