Article

A Comparison Study of a Generic Coupling Methodology for Modeling Wake Effects of Wave Energy Converter Arrays

1
Department of Civil Engineering, Ghent University, Technologiepark 904, B-9052 Zwijnaarde, Belgium
2
Department of General Engineering, Ecole Centrale de Lyon, 36 avenue Guy de Collongue, 69134 Écully, France
*
Author to whom correspondence should be addressed.
Energies 2017, 10(11), 1697; https://doi.org/10.3390/en10111697
Submission received: 31 August 2017 / Revised: 6 October 2017 / Accepted: 18 October 2017 / Published: 25 October 2017

Abstract

:
Wave Energy Converters (WECs) need to be deployed in large numbers in an array layout in order to have a significant power production. Each WEC has an impact on the incoming wave field, by diffracting, reflecting and radiating waves. Simulating the wave transformations within and around a WEC array is complex; it is difficult, or in some cases impossible, to simulate both these near-field and far-field wake effects using a single numerical model, in a time- and cost-efficient way in terms of computational time and effort. Within this research, a generic coupling methodology is developed to model both near-field and far-field wake effects caused by floating (e.g., WECs, platforms) or fixed offshore structures. The methodology is based on the coupling of a wave-structure interaction solver (Nemoh) and a wave propagation model. In this paper, this methodology is applied to two wave propagation models (OceanWave3D and MILDwave), which are compared to each other in a wide spectrum of tests. Additionally, the Nemoh-OceanWave3D model is validated by comparing it to experimental wave basin data. The methodology proves to be a reliable instrument to model wake effects of WEC arrays; results demonstrate a high degree of agreement between the numerical simulations with relative errors lower than 5 % and to a lesser extent for the experimental data, where errors range from 4 % to 17 % .

1. Introduction

Wave energy is a very promising form of renewable energy, globally inspiring developers to design wave energy converters. With an estimated total shore-facing wave energy of 2 TW [1], it cannot be ignored in the evolution towards an energy market, independent of fossil fuels. The energy transmitted by ocean waves can be transformed into usable electricity by using Wave Energy Converters (WECs).
The success of the WEC technology strongly depends on its economic competitiveness and efficiency with regard to other renewable energy resources, like wind and solar energy. To achieve competitive WEC technologies, a large number of devices is needed in a park or farm configuration, composed of WEC arrays [2]. Deploying a large number of WECs in the sea has a significant impact on the propagation of the incident waves, through the WEC array [3]. Due to the interaction of the WECs with the incident waves, the following wave field physical processes, called “near-field effects”, take place:
  • Reflection: the incident wave encounters the WEC. A part of its energy is absorbed by the WEC; a part is transmitted past the WEC; and the remaining part is reflected, back to the open sea, with a smaller wave height and a different phase.
  • Diffraction: the waves undergo a change in direction as they pass around the WEC, as a result of the lateral yield of momentum flux, resulting in a concentric pattern, superimposed on the incident waves.
  • Radiation: as a response to the incident wave field, a WEC that is not fixed and has at least one degree of freedom will be put in motion, resulting in the creation of radiated waves.
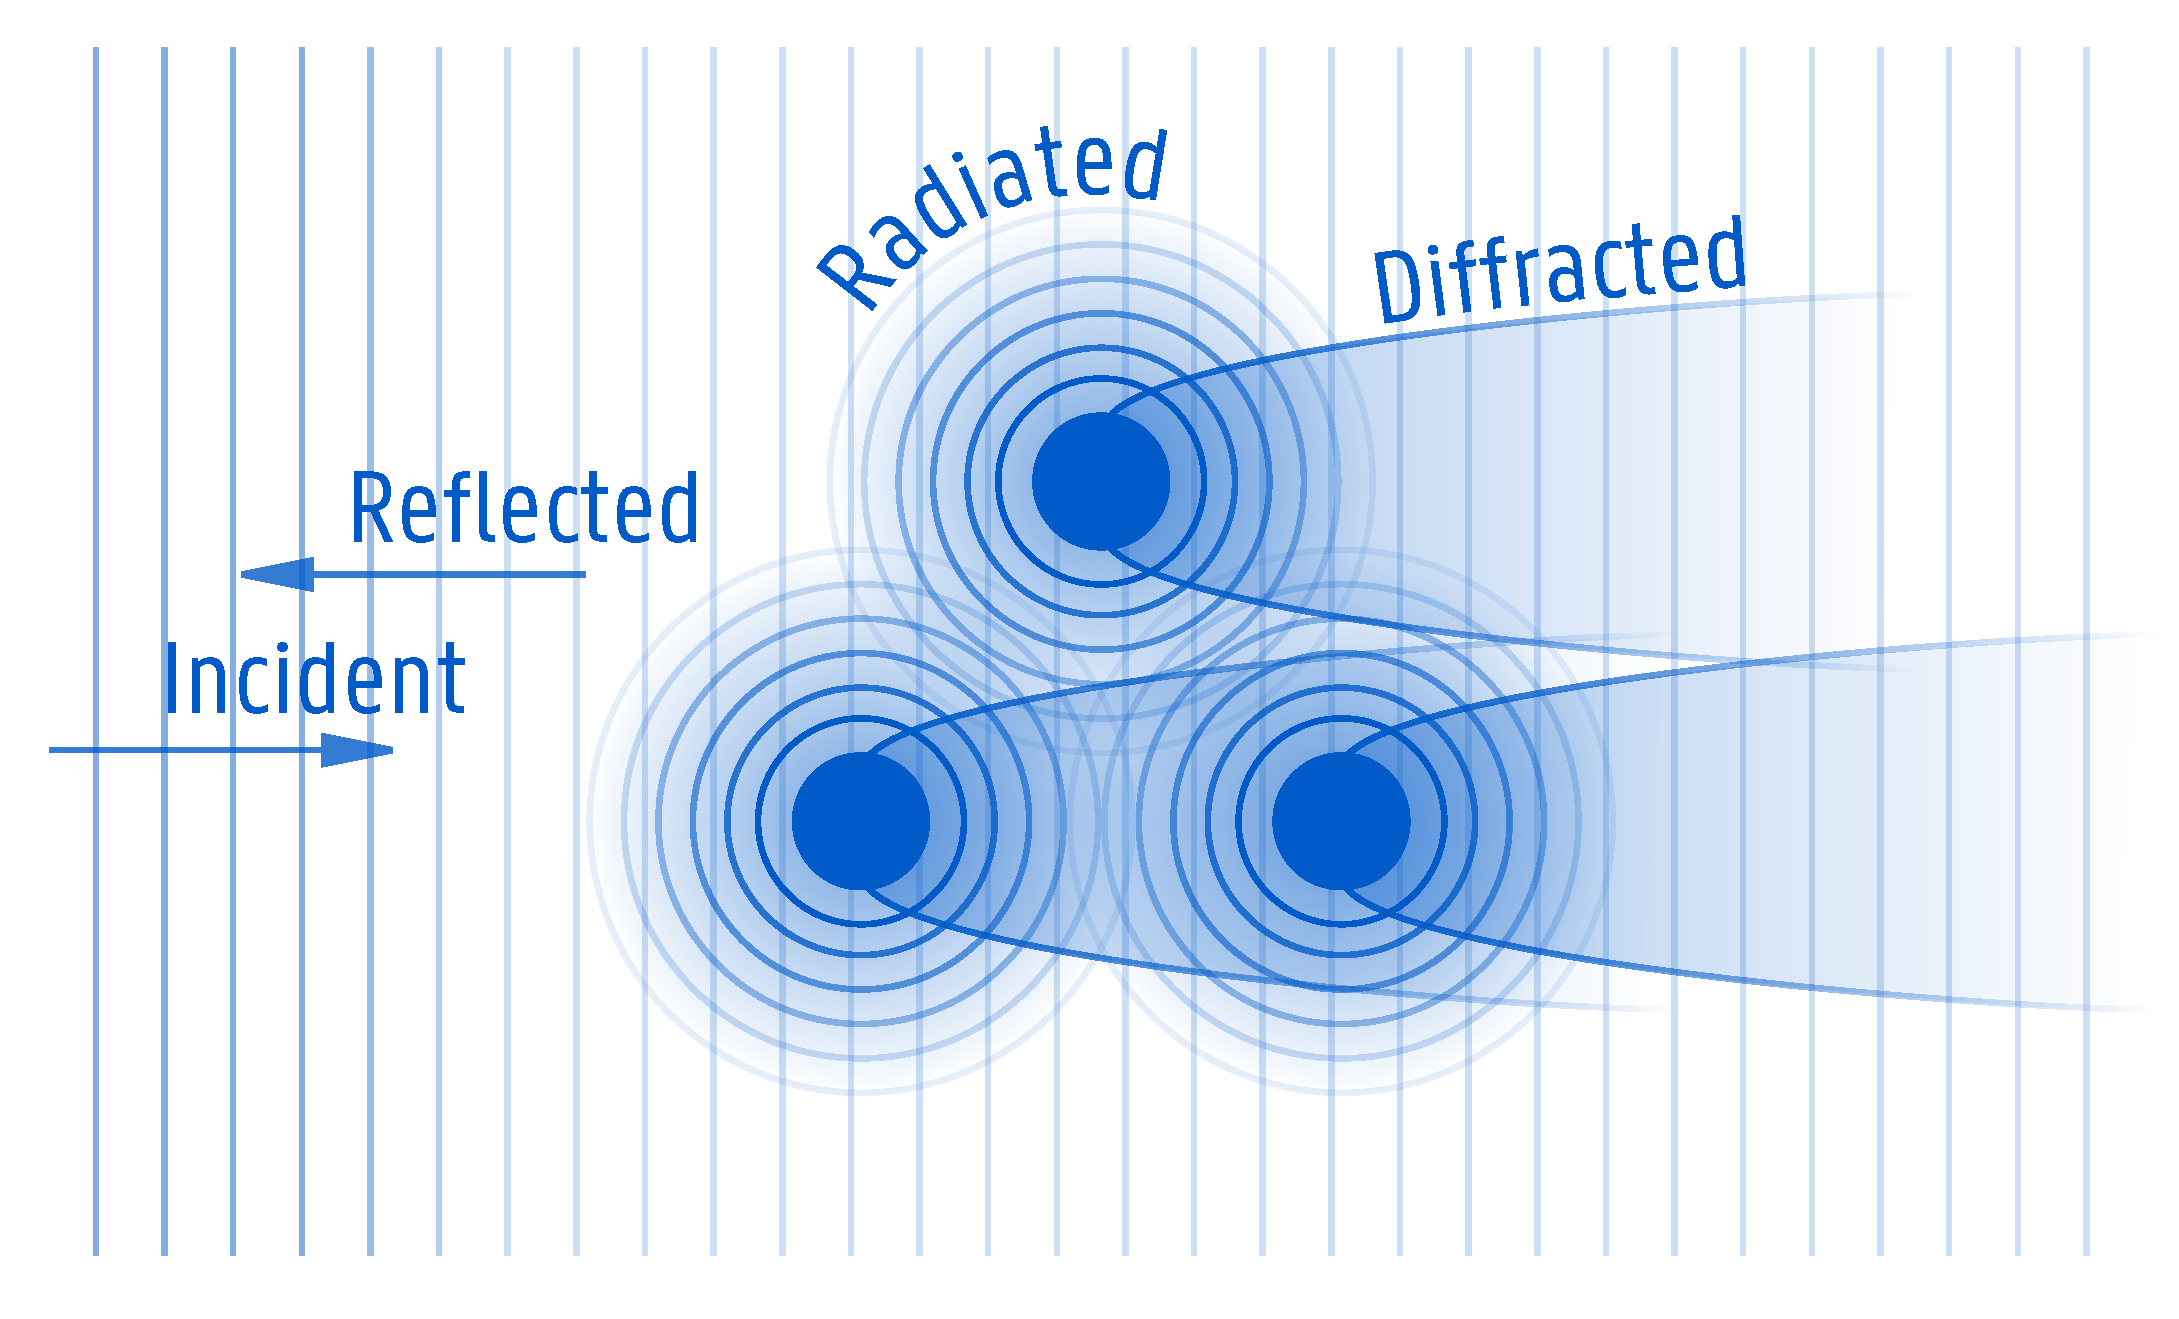
The combination of the above physical phenomena results in a complex total wave field (see Figure 1). At specific locations, the superposition of the waves leads to a higher energy content, called “hot spots”. In other locations, mostly in the lee of the WEC, there are wake effects, leading to a lower energy content. Consequently, it is important to have a good understanding of the location of hot spots and wakes in order to efficiently position a large number of WECs in an array layout. Moreover, this complex near-field wave field will propagate further outwards and have an effect on the far-field wave field, the so-called “far-field effects”. It has been shown that the maximum absorbed energy of point-absorbers is directly linked to the interaction of the radiated wave field with the incident wave field [4]. Although this study mainly focuses on wave interactions with heaving point-absorber WECs, the described modeling methodology is applicable to any floating/fixed offshore structure/device.
The research presented in this paper focuses on the numerical modeling of wave-structure and wave-wave interactions within closely-spaced clusters of floating or fixed structures. Currently, there is no numerical model readily available to perform fast simulations of wave propagation in a large domain, over variable bathymetry, through closely-spaced structures; a choice has to be made between the use of accurate wave-structure interaction models with limited domain sizes and large domain wave propagation models, which lack the ability of accurately modeling complex wave fields. This research aims at overcoming these limitations by combining a wave-structure interaction solver and a wave propagation model to simulate wave propagation through closely-spaced clusters of floating or fixed structures, such as WECs or floating wind turbines.
Next, an overview of the numerical modeling of WEC arrays is given. Many different models exist and are based on various theoretical or applied approaches. Previous work [5,6,7] has given an interesting overview of the different types of numerical models, and these studies concluded that all models have specific advantages and disadvantages and often result in making a decision between either computational speed or accuracy. In addition, the modeling can be performed in the frequency domain or the time domain. The first is typically known for fast computation times, but often leads to overestimation of absorbed power [8]. The latter is necessary when combined wave-structure and wave-wave interaction are studied.
First, the wave-structure interaction models in the near-field are discussed. The most commonly-used models are the Boundary Element Method (BEM) potential flow solvers (e.g., Aquaplus [9], ANSYS Aqwa [10], WAMIT [11], Nemoh [12]). These calculate the frequency-dependent hydrodynamic properties of a single or multiple WEC devices. These tools allow one to study the near-field effects such as radiation and diffraction for a linear, regular incident wave over a flat sea bottom. Secondly, due to a better description of the related physics as presented in [13], the use of codes resolving the Navier–Stokes equations (e.g., Computational Fluid Dynamics (CFD) models [14,15,16,17] and Smoothed Particle Hydrodynamics (SPH) [18,19,20,21]) for modeling WECs is growing nowadays. The governing equations are solved in the time domain; this means the physical variables do not have to be constant per frequency, but can vary in a non-linear manner over time (e.g., slack-lined mooring forces, non-linear PTO forces). The BEM and the Navier–Stokes-based solvers will be hereafter referred to as “wave-structure interaction solvers”.
The second group of numerical modeling tools focuses on wave propagation models, mainly applied to study far-field effects. Within these, a WEC or floating device is represented in a simplified way, e.g., by a porous structure that extracts a specific quantity of wave power from the incoming waves. The simulated WEC exhibits a specific amount of reflection, transmission and absorption of the incident waves. Firstly, there are the spectral propagation models. They consider a complete WEC array as a spatially-uniform energy sink [22,23,24]. Often, these models are used to study the impact of a WEC farm on the coastal wave climate. The downsides of these type of models are the omission of the wave interactions in between WEC devices and the parametrized power absorption by the WEC. The most important drawback is the inaccurate representation of wave diffraction by the WECs. The whole WEC array is approximated as one giant structure absorbing a part of the incident wave energy. Secondly, there are time domain wave propagation models; a distinction can be made between wave propagation models based on mild-slope equations [2,25,26,27] and Boussinesq models [28,29,30,31].
All of the above-mentioned models suffer from a common problem: they cannot be used to model both near-field interactions and far-field effects, as recently reviewed in [6,32]. Models based on the Boundary Element Method (BEM) approach of potential flow theory or on the approach of Navier–Stokes equations suffer from a high computational cost, when simulating power absorption and the wave field alteration due to large WEC arrays. Simulation domains of non-constant water depth are prohibitive, which results also in restrictions on the number of the simulated WECs (typically less than 10 WECs). However, in order to investigate far-field effects, for example to study coastal impact, much larger computational domains are required.
On the other hand, the approach of wave propagation models enables simulation of these far-field effects. Large WEC arrays installed in large domains (several tens of kilometers) are modeled at a reasonable computational cost. As a result, the changes in wave field and the associated environmental impacts can be studied at the regional scale. However, the WECs are approximated up to now by using parametrized energy sinks and empirically tuned energy absorption coefficients. This method only partially addresses the underlying physics, which may lead to erroneous model conclusions. Moreover, when it comes to the modeling of oscillating WECs, the radiated wave field induced by the WEC’s motion is not considered in wave propagation models such as in [33,34,35].
The present research focuses on introducing a generic coupling methodology, combining the near-field accuracy of wave-structure interaction models with time-efficient far-field wave propagation models. An application of this methodology has resulted in two “in-house” developed modeling tools; both of them combining the BEM wave-structure interaction model, Nemoh, with a fast wave propagation model. The first tool uses a depth-averaged mild-slope equation model called MILDwave [27,36], while the second one is a 3D, fully-non-linear potential flow solver called OceanWave3D [29]. The latter model has the extra advantage of being able to calculate non-depth averaged wave kinematics. Near-field effects such as radiation and diffraction are calculated by the BEM solver, and the interaction with the incident waves and further propagation in the far-field over variable bathymetry are handled by the wave propagation model.
In Section 2 of this paper, the coupling methodology is introduced. Next, the methodology is applied to a wave-structure interaction solver and two wave propagation models, to model both the near-field and far-field effects of wave propagation through a WEC array, as presented in Section 3. In Section 4, the results of the numerical models are compared through a large number of simulations, covering a wide spectrum of wave conditions and WEC array layouts. In addition, the OceanWave3D-Nemoh model is compared to an experimental dataset in Section 4. The results of the present study are discussed in Section 5 together with the concluding remarks.

2. Coupling Methodology

In this section, a numerical coupling methodology for predicting the wave field around devices or structures (single or in a park layout) is presented and is inspired by the work of [26,27], where an internal circular wave generation boundary around floating structures was applied to pass information from WAMIT [11] to MILDwave and propagate the waves within the wave propagation domain. The present coupling methodology has been developed to combine:
  • the advantages of the approach of wave-structure interaction solvers, which accurately formulate and efficiently resolve the physical processes in wave energy absorption and floating structures;
  • and the benefits of the approach of wave propagation models, which efficiently resolve the propagation and transformation of waves over large distances, including bathymetric variability and wave transformation processes when approaching the coastline.

2.1. General Concept

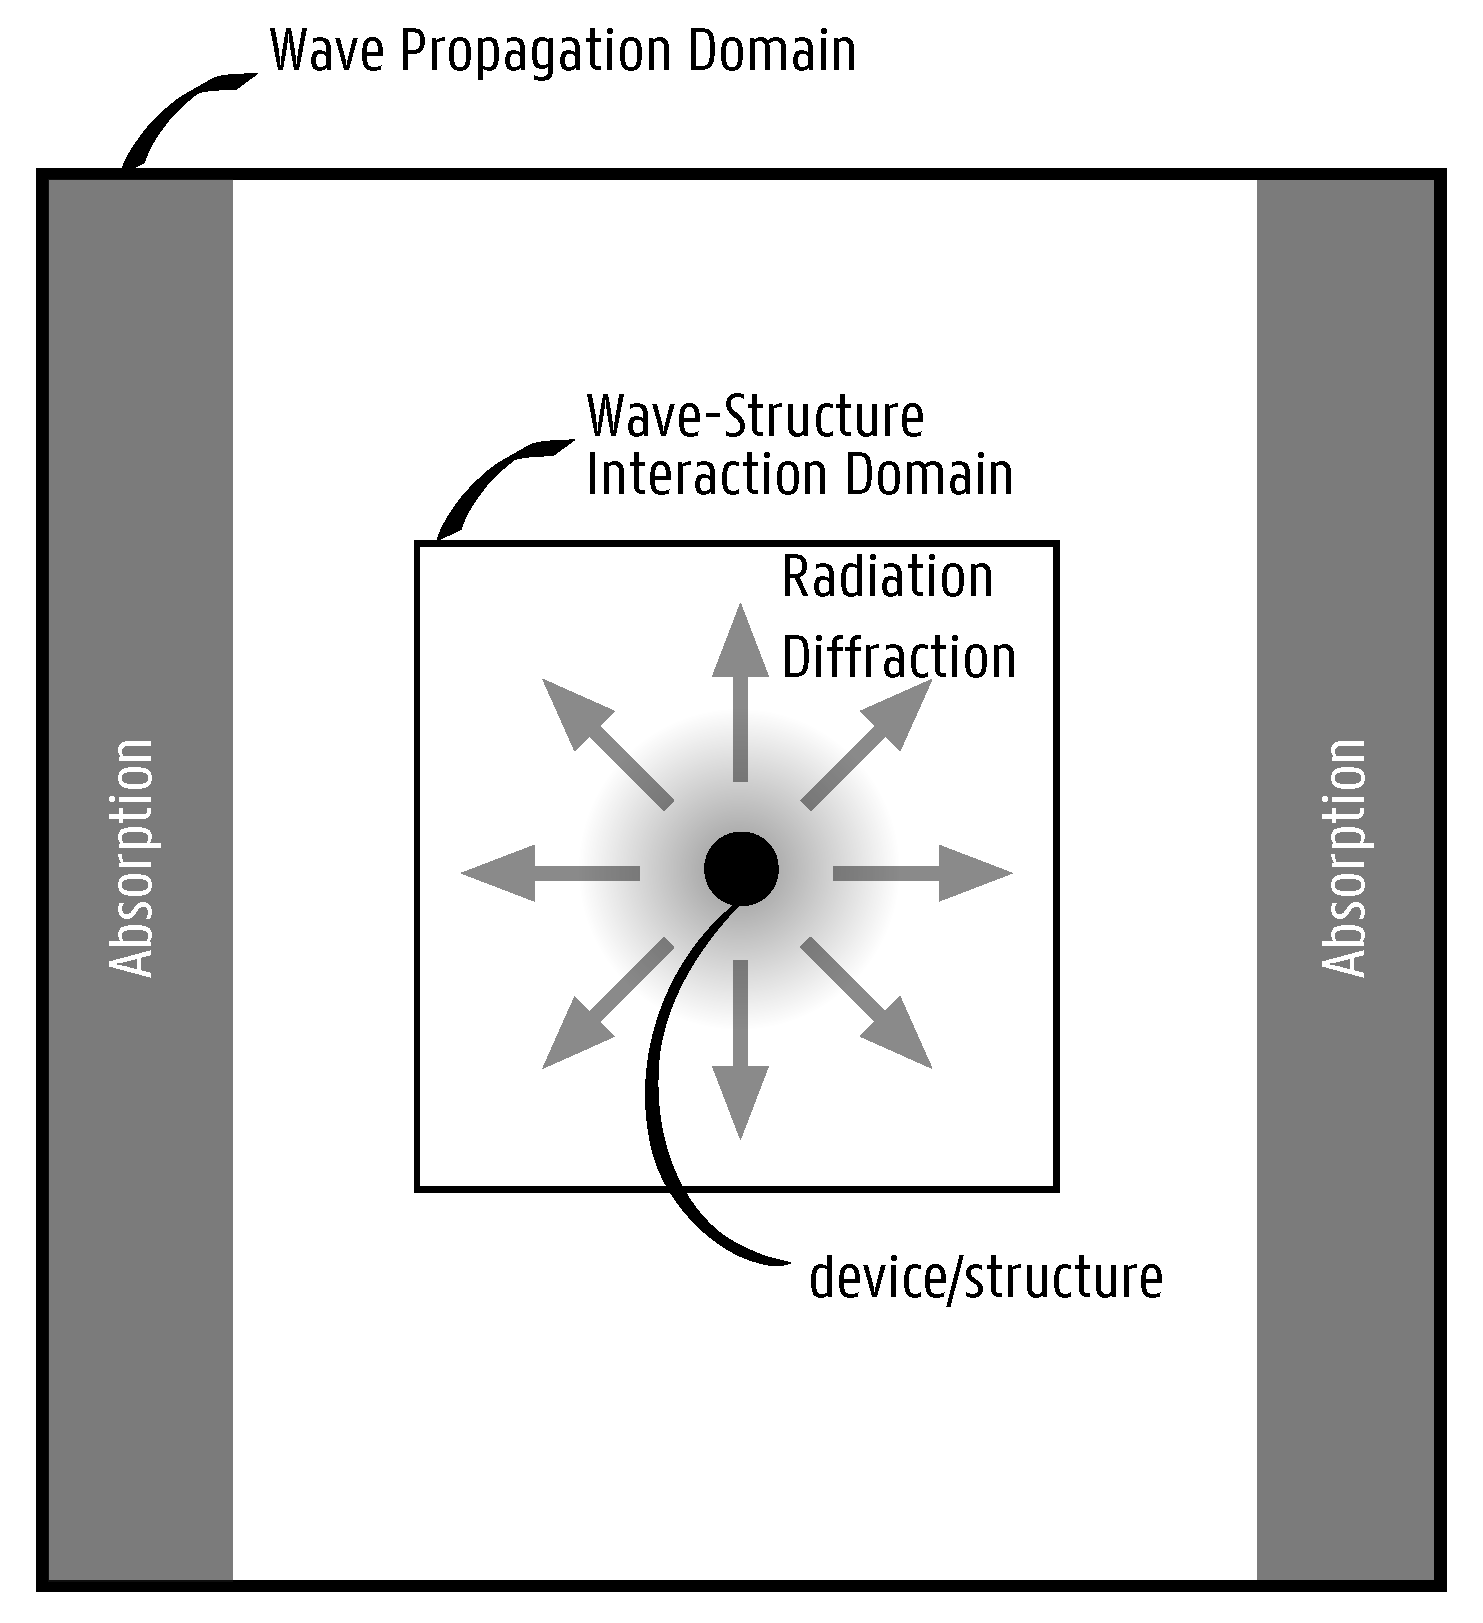
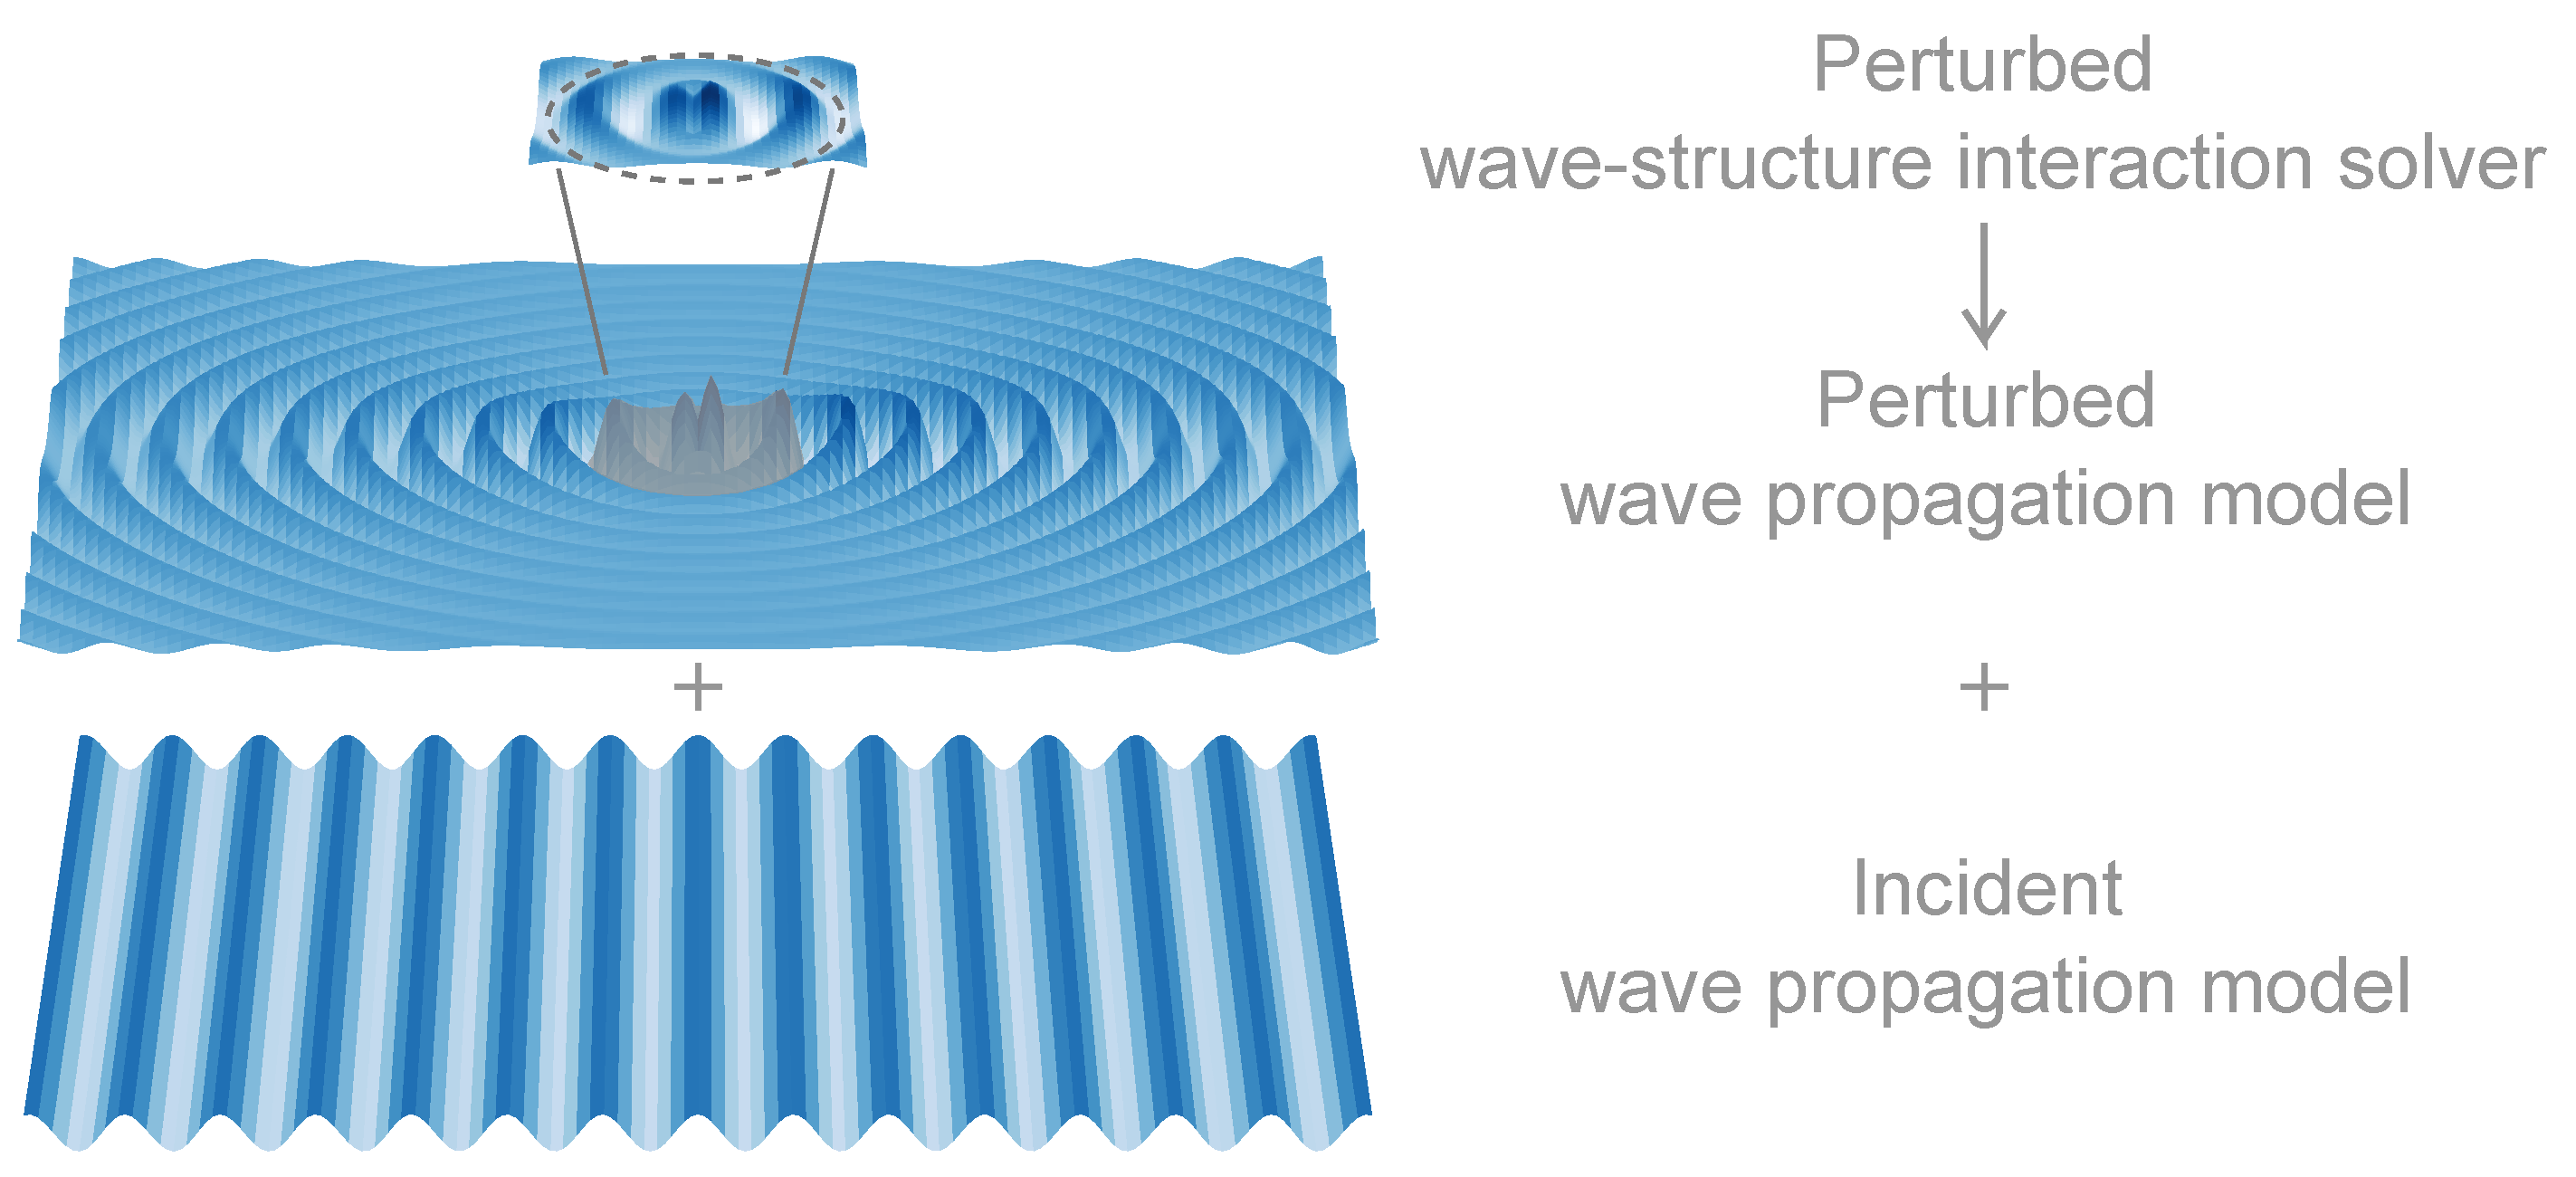
The goal of the coupling methodology is to predict the total wave field, by superposing the perturbed (reflected + diffracted + radiated) wave field and the incident wave field. For the perturbed waves, a frequency domain wave-structure interaction solver is used within a restricted zone around the floating or fixed devices. The propagation and transformation of the incident waves in a large domain is calculated by employing a wave propagation model. The coupling methodology is applicable to both floating and fixed offshore devices. However, in this paper, the focus is put on floating devices or structures, which is the most complex and computationally demanding case. The general concept is sketched in Figure 2.
The main coupling mechanism is a superposition of two separate simulations: one for the perturbed wave field and another for the incident wave field. The perturbed wave field is a combination of the radiation and diffraction (including wave reflection) and is calculated during a first run in the frequency domain by the wave-structure interaction solver, within a restricted zone around the device/structure, indicated by the dashed circle in Figure 2. Note that this zone can be used either around a single device/structure or around a cluster of devices/structures. Within the wave propagation model, the perturbed field is propagated outwards from the center of the domain. In a separate run, the incident waves are propagated over the entire domain in the wave propagation model. It is only after both runs have finished that the wave fields are superposed to result in the total wave field. This superposition principle is possible, since the linear wave theory is applicable.

2.2. Calculating the Perturbed Wave Field

The perturbed wave field is the superposition of the radiated and diffracted field and is calculated in two steps. First, a frequency domain simulation is performed in the wave-structure interaction domain with a flat bathymetry; here, we use a linear BEM solver, where the static and dynamic pressure are integrated over the floating body resulting in radiation and diffraction forces. These quantities depend on the body shape, the degrees of freedom, the wave period and the local water depth. Many different body shapes are possible, ranging from axisymmetric shapes to WEC devices, barges, ships and offshore platforms.
The wave-structure interaction calculation results in the complex, frequency-dependent radiated and diffracted wave fields (including the wave reflection), which are calculated on a rectangular grid. This grid is chosen smaller and finer than the wave propagation grid, which offers higher accuracy.
In the next step, the diffracted and radiated waves, as calculated in the previous step, are propagated in the wave propagation model with varying bathymetry. Specifically, they are imposed on a circular wave generation zone and are propagated towards the outside of the domain. At this point, it is to be noted that this internal wave propagation zone should not necessarily be circular and can be otherwise defined. In order to impose the perturbed wave field in the wave propagation model, it is necessary to transform both the radiated and diffracted wave field to the time domain within that coupling zone:
η R ( x , y , t ) = j = 1 n b { A · ( i ω ) · | RAO j | · exp ( i ϕ RAO j ) · | R j | · exp ( i ϕ R j ) exp ( i ω t ) }
η D ( x , y , t ) = { A · | D | · exp ( i ϕ D ) exp ( i ω t ) }
Within Equations (1) and (2), η R is the radiated wave field in the time domain. This is a summation of the radiated wave field for each device/structure in the array. η D is the diffracted wave field for the complete array. A is the wave amplitude. | RAO j | is the amplitude of the complex response amplitude operator for the corresponding device/structure j, defined by Equation (3) [37], while ϕ RAO j is the phase angle. | R j | is the amplitude of the complex radiated wave field for device/structure j and a specific frequency, coming directly from the wave-structure interaction model, while ϕ R j is the phase angle. | D | is the amplitude of the diffracted wave field, while ϕ D is the phase angle. The parameters calculated with the BEM solver are indicated with bold font.
RAO j = F ex , j ( M j + M A , j + M P T O ) ω 2 + i ω ( B hyd , j + B P T O ) + ( C j + C P T O )
In Equation (3), F ex , j is the complex wave excitation force, M j the mass of device/structure j , M A , j the added mass, B hyd , j the hydrodynamic damping coefficient and C j the hydrostatic stiffness. The effect of a linear Power Take-Off (PTO) system on the radiated wave field is taken into account by adding external mass M P T O , damping B P T O or spring coefficient C P T O . The parameters calculated with the BEM solver are indicated with bold font.
The perturbed (radiation + diffracted) wave field is propagated using the wave propagation model from within a circular zone around the device/structure (see Figure 3). The circular area (light grey gradient) is a wave generation zone defined by a radius R c , termed as the “coupling radius”. Within that circular zone, the surface elevation is imposed, so waves are forced to propagate away from the device/structure. At the interface between the wave generation zone and the wave propagation domain, the waves are released and propagate across the domain. From that point onwards, the governing wave propagation equations take over and take into account the (variable) bathymetry. At the left and right side of the wave propagation domain, wave absorbing boundary conditions such as relaxation zones or sponge layers are applied (dark grey zones).

2.3. Calculating the Incident Wave Field

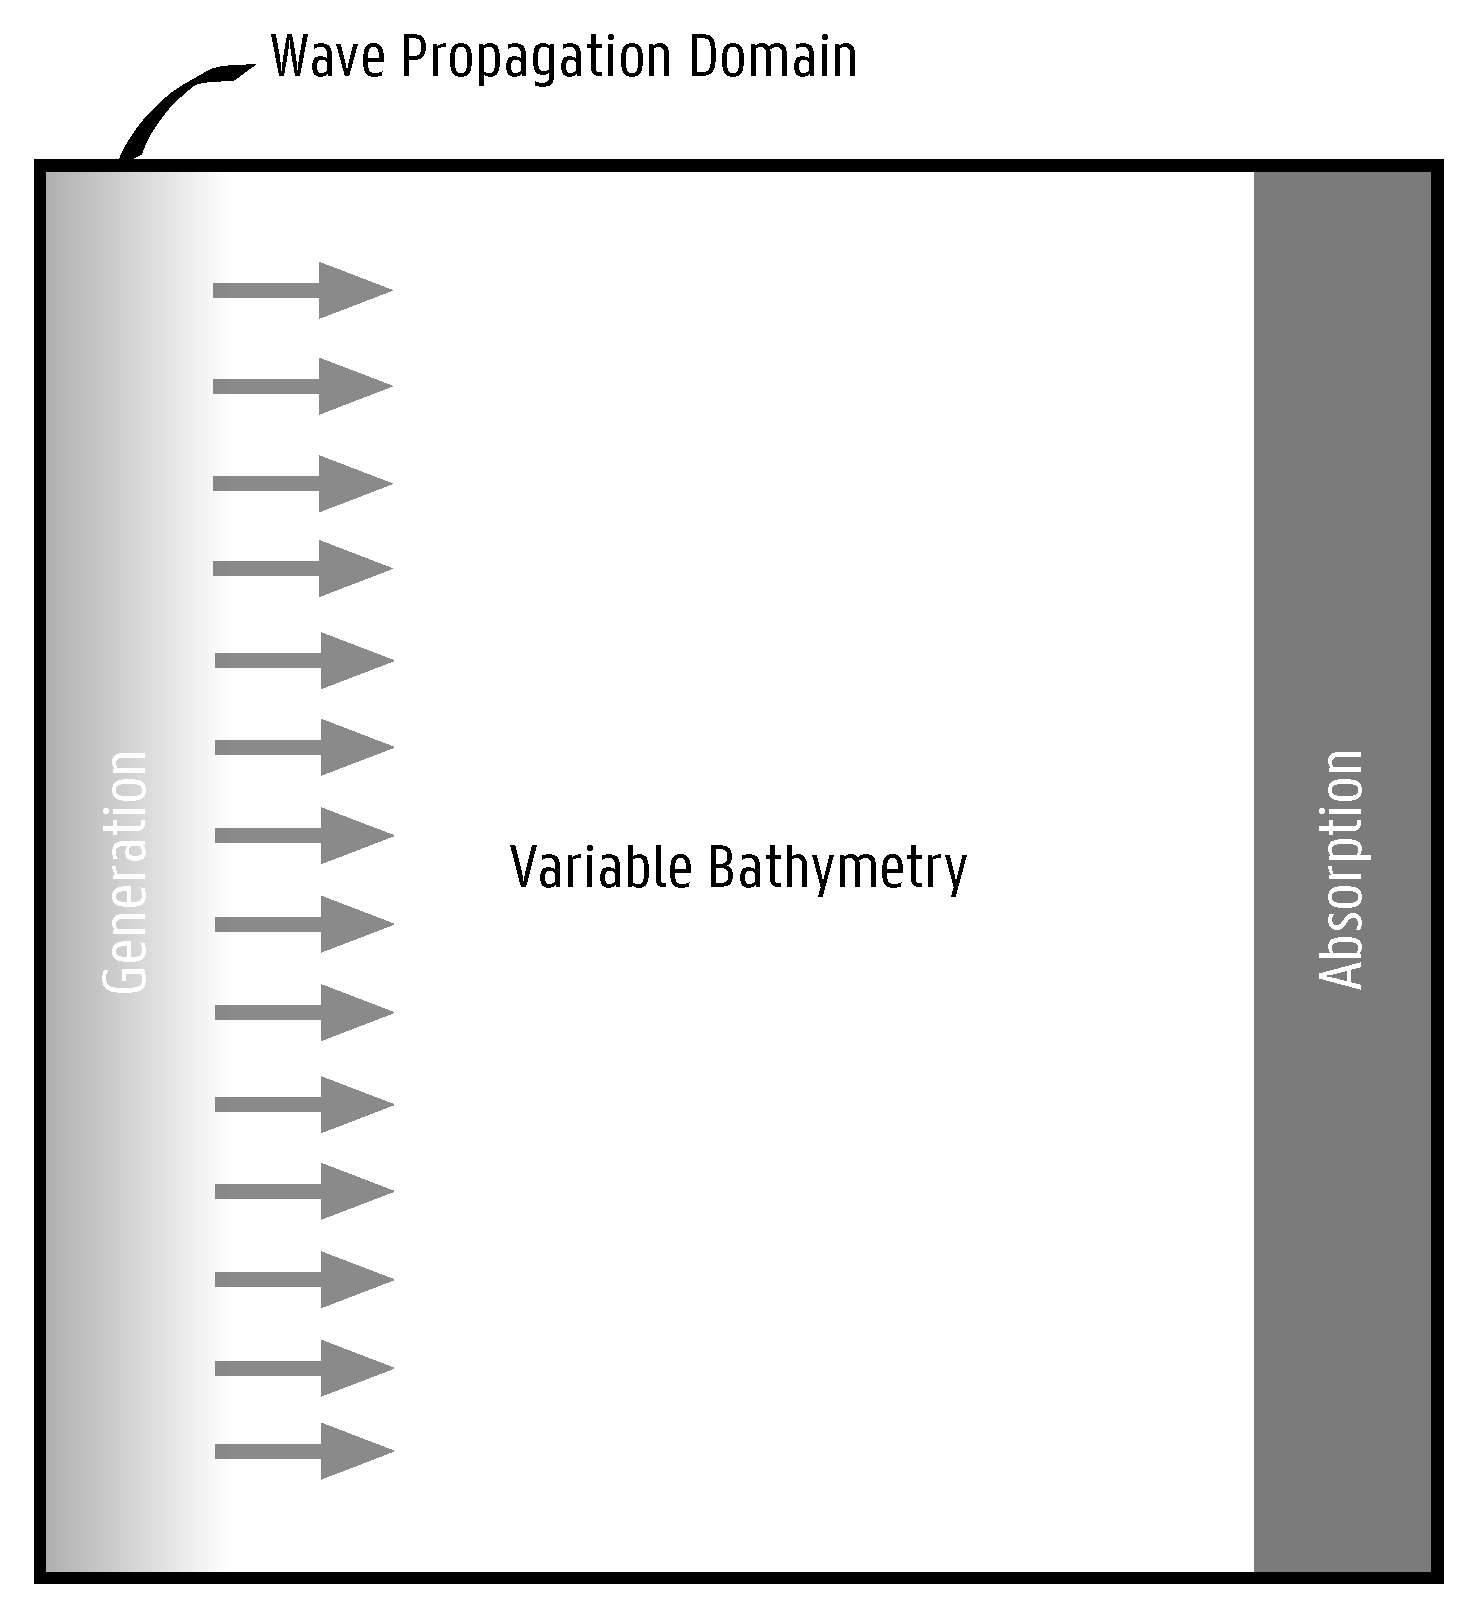
The incident wave field is directly calculated in the time domain within the wave propagation model. However, special attention is needed for the phase angle of the incident wave. It is important that at the center of the circular coupling zone, the phase angle is always equal to ω t . This is necessary since the perturbed wave field is coming from the frequency domain, where the phase is referenced with respect to the center of the device/structure. This phase matching is ensured by calculating the phase angle in the incident wave run, at the center of the coupling zone, and subtracting this value from the perturbed wave field phase angle. The numerical setup is illustrated in Figure 4. The wave propagation models are able to simulate shoaling and refraction of incident waves over complex bathymetries. In the case of mild-slope equation models, the slopes need to remain within a gradient of 1 / 3 , while Boussinesq-type models and fully non-linear potential flow models can handle any type of bathymetry, however with a certain pre-processing and numerical instability cost [38]. At the left, boundary conditions of the generation of regular linear waves are applied:
η I ( x , y , t ) = { A · exp ( i ( ω t k ( x cos θ y sin θ ) ) ) }
In Equation (4), η I is the incident surface elevation, A is the wave amplitude, ω is the wave frequency (in rad/s), k is the wave number and θ is the wave direction. Waves propagate towards the right side, where the waves are absorbed by a relaxation boundary condition or a sponge layer. The top and bottom boundaries can be reflective (no-flux boundary condition) or absorbing, depending on the selected wave propagation model. When reflective boundaries are applied, it is advised to extend the wave propagation domain, perpendicular to the incident wave direction.
In the case of irregular incident waves, the superposition principle can be applied. A linear, irregular wave can be represented as a sum of a finite number of regular wave components, each with a characteristic wave height and wave period derived from the wave spectrum. In order to avoid local attenuation of the surface elevation η I , each regular wave component should be shifted with a random phase angle ϕ i :
η I = i = 1 n { A i · exp ( i ( ω t k ( x cos θ y sin θ ) ϕ i ) ) }
Modeling the wave propagation of irregular waves through a closely-spaced cluster of floating/fixed offshore devices requires performing multiple coupled simulations with regular waves, each shifted with a random phase angle, and finally superposing all individual regular wave fields.

3. Application of the Coupling Methodology

In this section, the coupling methodology, described in Section 2, will be demonstrated for predicting WEC array effects. Moreover, it will be demonstrated for two different wave propagation models. First, the employed wave-structure interaction solver is discussed, followed by the two wave propagation models. Next, the results obtained by the coupling methodology implemented in these two wave propagation models will be compared to each other and to experimental data.

3.1. Wave-Structure Interaction Model

The wave-structure interaction solver used in this research is the open-source software package Nemoh, developed at Ecole Centrale de Nantes [12]. The current Version v2.03 is based on linear potential flow theory and thus makes the following assumptions:
  • The fluid is inviscid;
  • The fluid is incompressible ;
  • The flow is irrotational;
  • The wave amplitude is small w.r.t. the wavelength;
  • The amplitude of the body motion is small w.r.t. its dimension;
  • The sea bottom is flat;
The flow is described by a velocity potential Φ , as a function of time and space. The flow field ν is expressed as the gradient of the velocity potential:
ν = Φ
Combining Equation (6) with Assumption 2 leads to the well-known Laplace equation:
Δ Φ = 0
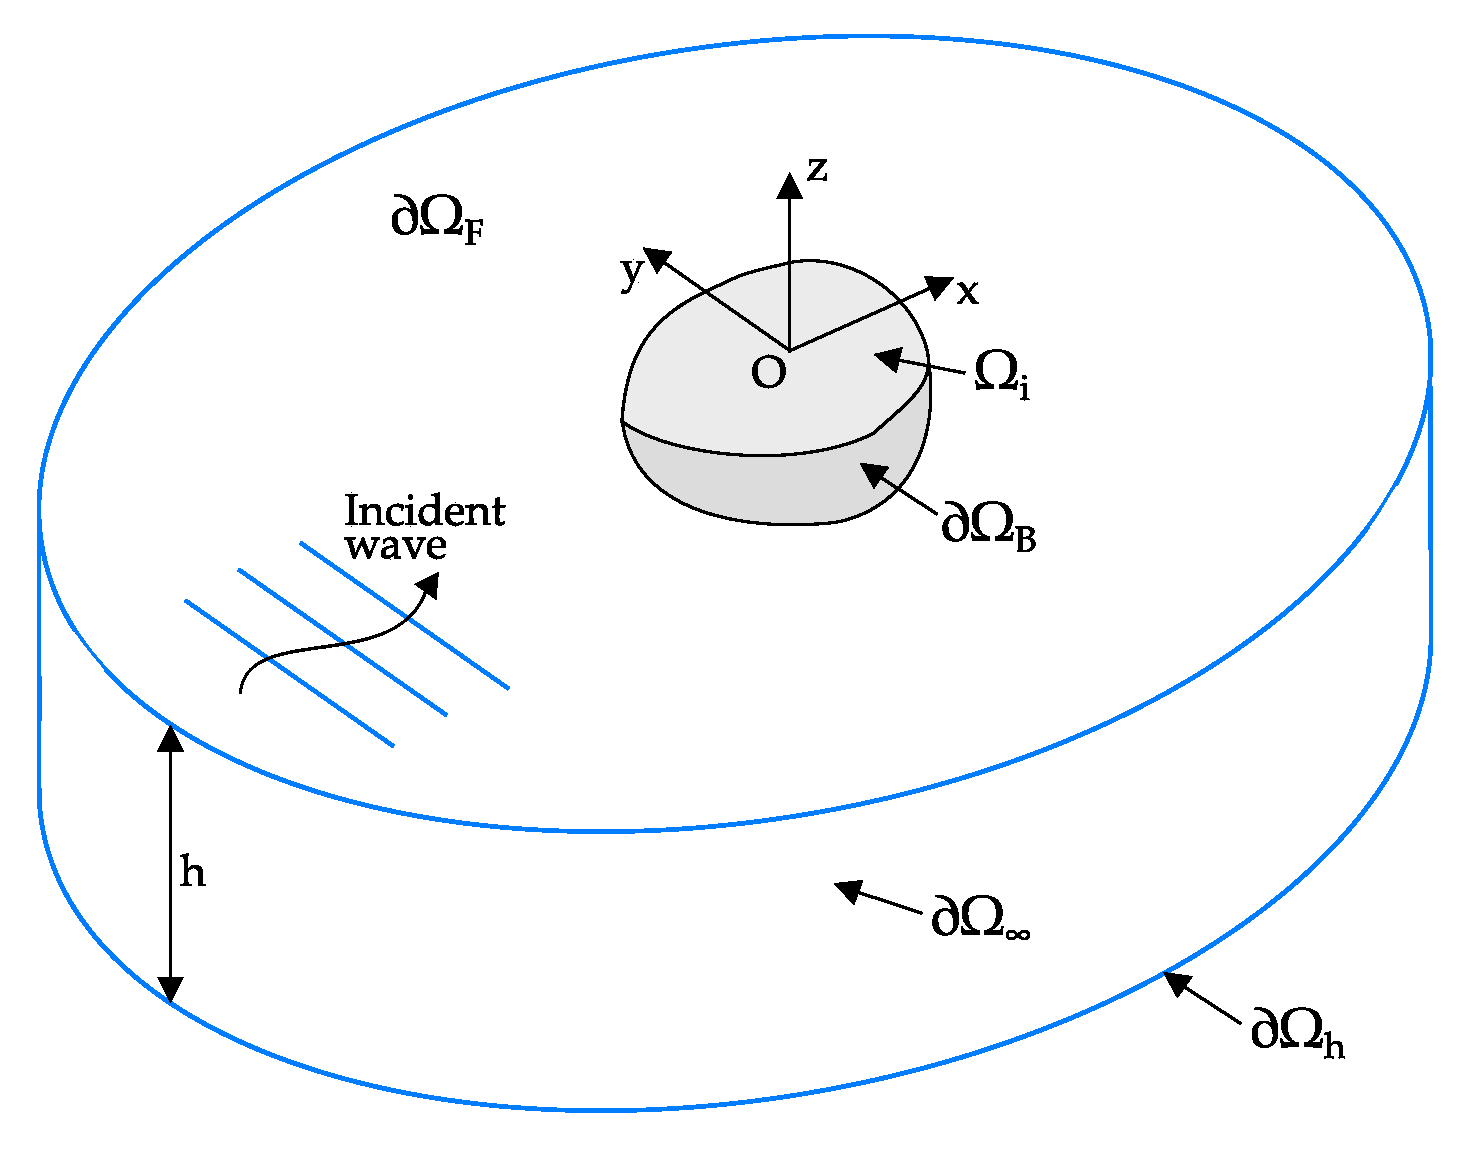
This equation is valid in the entire fluid domain, denoted Ω . The whole velocity potential problem becomes then a linear Boundary Value Problem (BVP), visually represented in Figure 5. The boundary conditions are given in the set of Equation (8).
Φ ( M ) z = ω 2 g Φ ( M ) M Ω F Φ ( M ) z = 0 M Ω h Φ ( M ) z = f ( M ) M Ω B R ( Φ ( M ) R i m 0 ) ( Φ Φ 0 ) 0 R 0
Here, M ( x , y , z ) is a given point in the fluid domain, f ( M ) is a scalar function, m 0 is the wave number solution of the dispersion relation and Φ 0 is the incident wave potential at infinity. The boundary conditions are expressed over the different boundary surfaces, where the indices stand for:
  • F: fluid domain boundary
  • h: sea bed boundary
  • B: floating body boundary
  • i: interface of floating body with the free surface
This 3D problem can be transformed into the 2D problem of a source distribution on the body surface using Green’s second identity and the appropriate Green function [9,39]. The mathematical problem is then discretized using a constant panel method, leading to a linear matrix problem whose coefficients are the influence coefficients. The BVP is numerically solved in the frequency domain; leading to the full flow field underneath the body. From the flow field, several other quantities are calculated:
  • The hydrodynamic coefficients: added mass M A and hydrodynamic damping B h y d ;
  • The pressure field p on the body surface and the Froude–Krylov forces F F K ;
  • Far-field diffracted and radiated velocity potential in the form of Kochin functions;
  • Near-field diffracted and radiated surface elevation | D | exp ( i ϕ D ) and | R | exp ( i ϕ R ) ;
These quantities are necessary for the coupling with each of the wave propagation models, which are discussed in the next section.

3.2. Wave Propagation Models

The second part of the coupling methodology is the wave propagation model. This model propagates the incident waves and predicts their interaction with the diffracted and radiated waves as predicted by Nemoh. For this, two separate software packages are applied: MILDwave, a 2D model based on mild-slope equations, and OceanWave3D, a 3D model based on fully non-linear potential flow equations. We will denote the coupled models as the MILDwave-Nemoh model and the OceanWave3D-Nemoh model, respectively.

3.2.1. MILDwave

In simulating the far-field effects, the wave propagation model MILDwave is employed [27,36]. MILDwave, developed at the Coastal Engineering Research Group of Ghent University, Belgium, is a phase-resolving model based on the depth-integrated mild-slope Equations (9) and (10) by Radder and Dingemans [40]. This particular model has been used also in modeling WEC arrays in a number of recent studies [26,27,41,42,43,44,45]. The mild-slope Equations (9) and (10) are solved using a finite difference scheme that consists of a two-step space-centered, time-staggered computational grid, as detailed in [46].
η t = ω 2 k 2 · C · C g g ϕ · ( C · C g g ϕ )
ϕ t = g η
Here, η and ϕ are, respectively, the surface elevation and the velocity potential at the free water surface, g is the gravitational acceleration, C is the phase velocity and C g the group velocity for a wave with wave number k and angular frequency ω .

3.2.2. OceanWave3D

The second applied wave propagation model is called OceanWave3D. The software is open-source and applies a fully-non-linear potential flow solver [29,47]. It is aimed at closing the performance gap between traditional Boussinesq-type models and volume-based solvers and enables fast (near) real-time hydrodynamics calculations. The fully-non-linear potential flow problem for waves on a fluid of variable depth is applied to find the free surface elevations on a 3D grid, with vertical sigma layers. This allows for the prediction of velocity profiles, in contrast to MILDwave, which only supports depth-averaged velocities. The evolution of the free surface is governed by the kinematic and dynamic boundary conditions:
t η = η · Φ ˜ + w ˜ ( 1 + η · η )
t Φ ˜ = g η 1 2 ( Φ ˜ · Φ ˜ w ˜ 2 ( 1 + η · η ) )
These are expressed as a function of the free surface quantities Φ ˜ = Φ ( x , y , η , t ) and w ˜ = z Φ | z = η . The problem is discretized using a method of lines approach, and for the time-integration of the free-surface conditions, a classical explicit four-stage, fourth-order Runge–Kutta scheme is employed. Spatial derivatives are replaced by the discrete counterparts using the high-order finite difference method, and non-linear terms are treated by direct product approximations at the collocation points. At the structural boundaries of the domain, i.e., at the bottom and wall sides, Neumann conditions are imposed. When applying the coupling method to OceanWave3D, the non-linear effects are omitted. Consequently, the linear superposition method can be applied and the total transformed wave field can be created by summation of the independent surface elevations and potentials.

3.3. Experimental Dataset

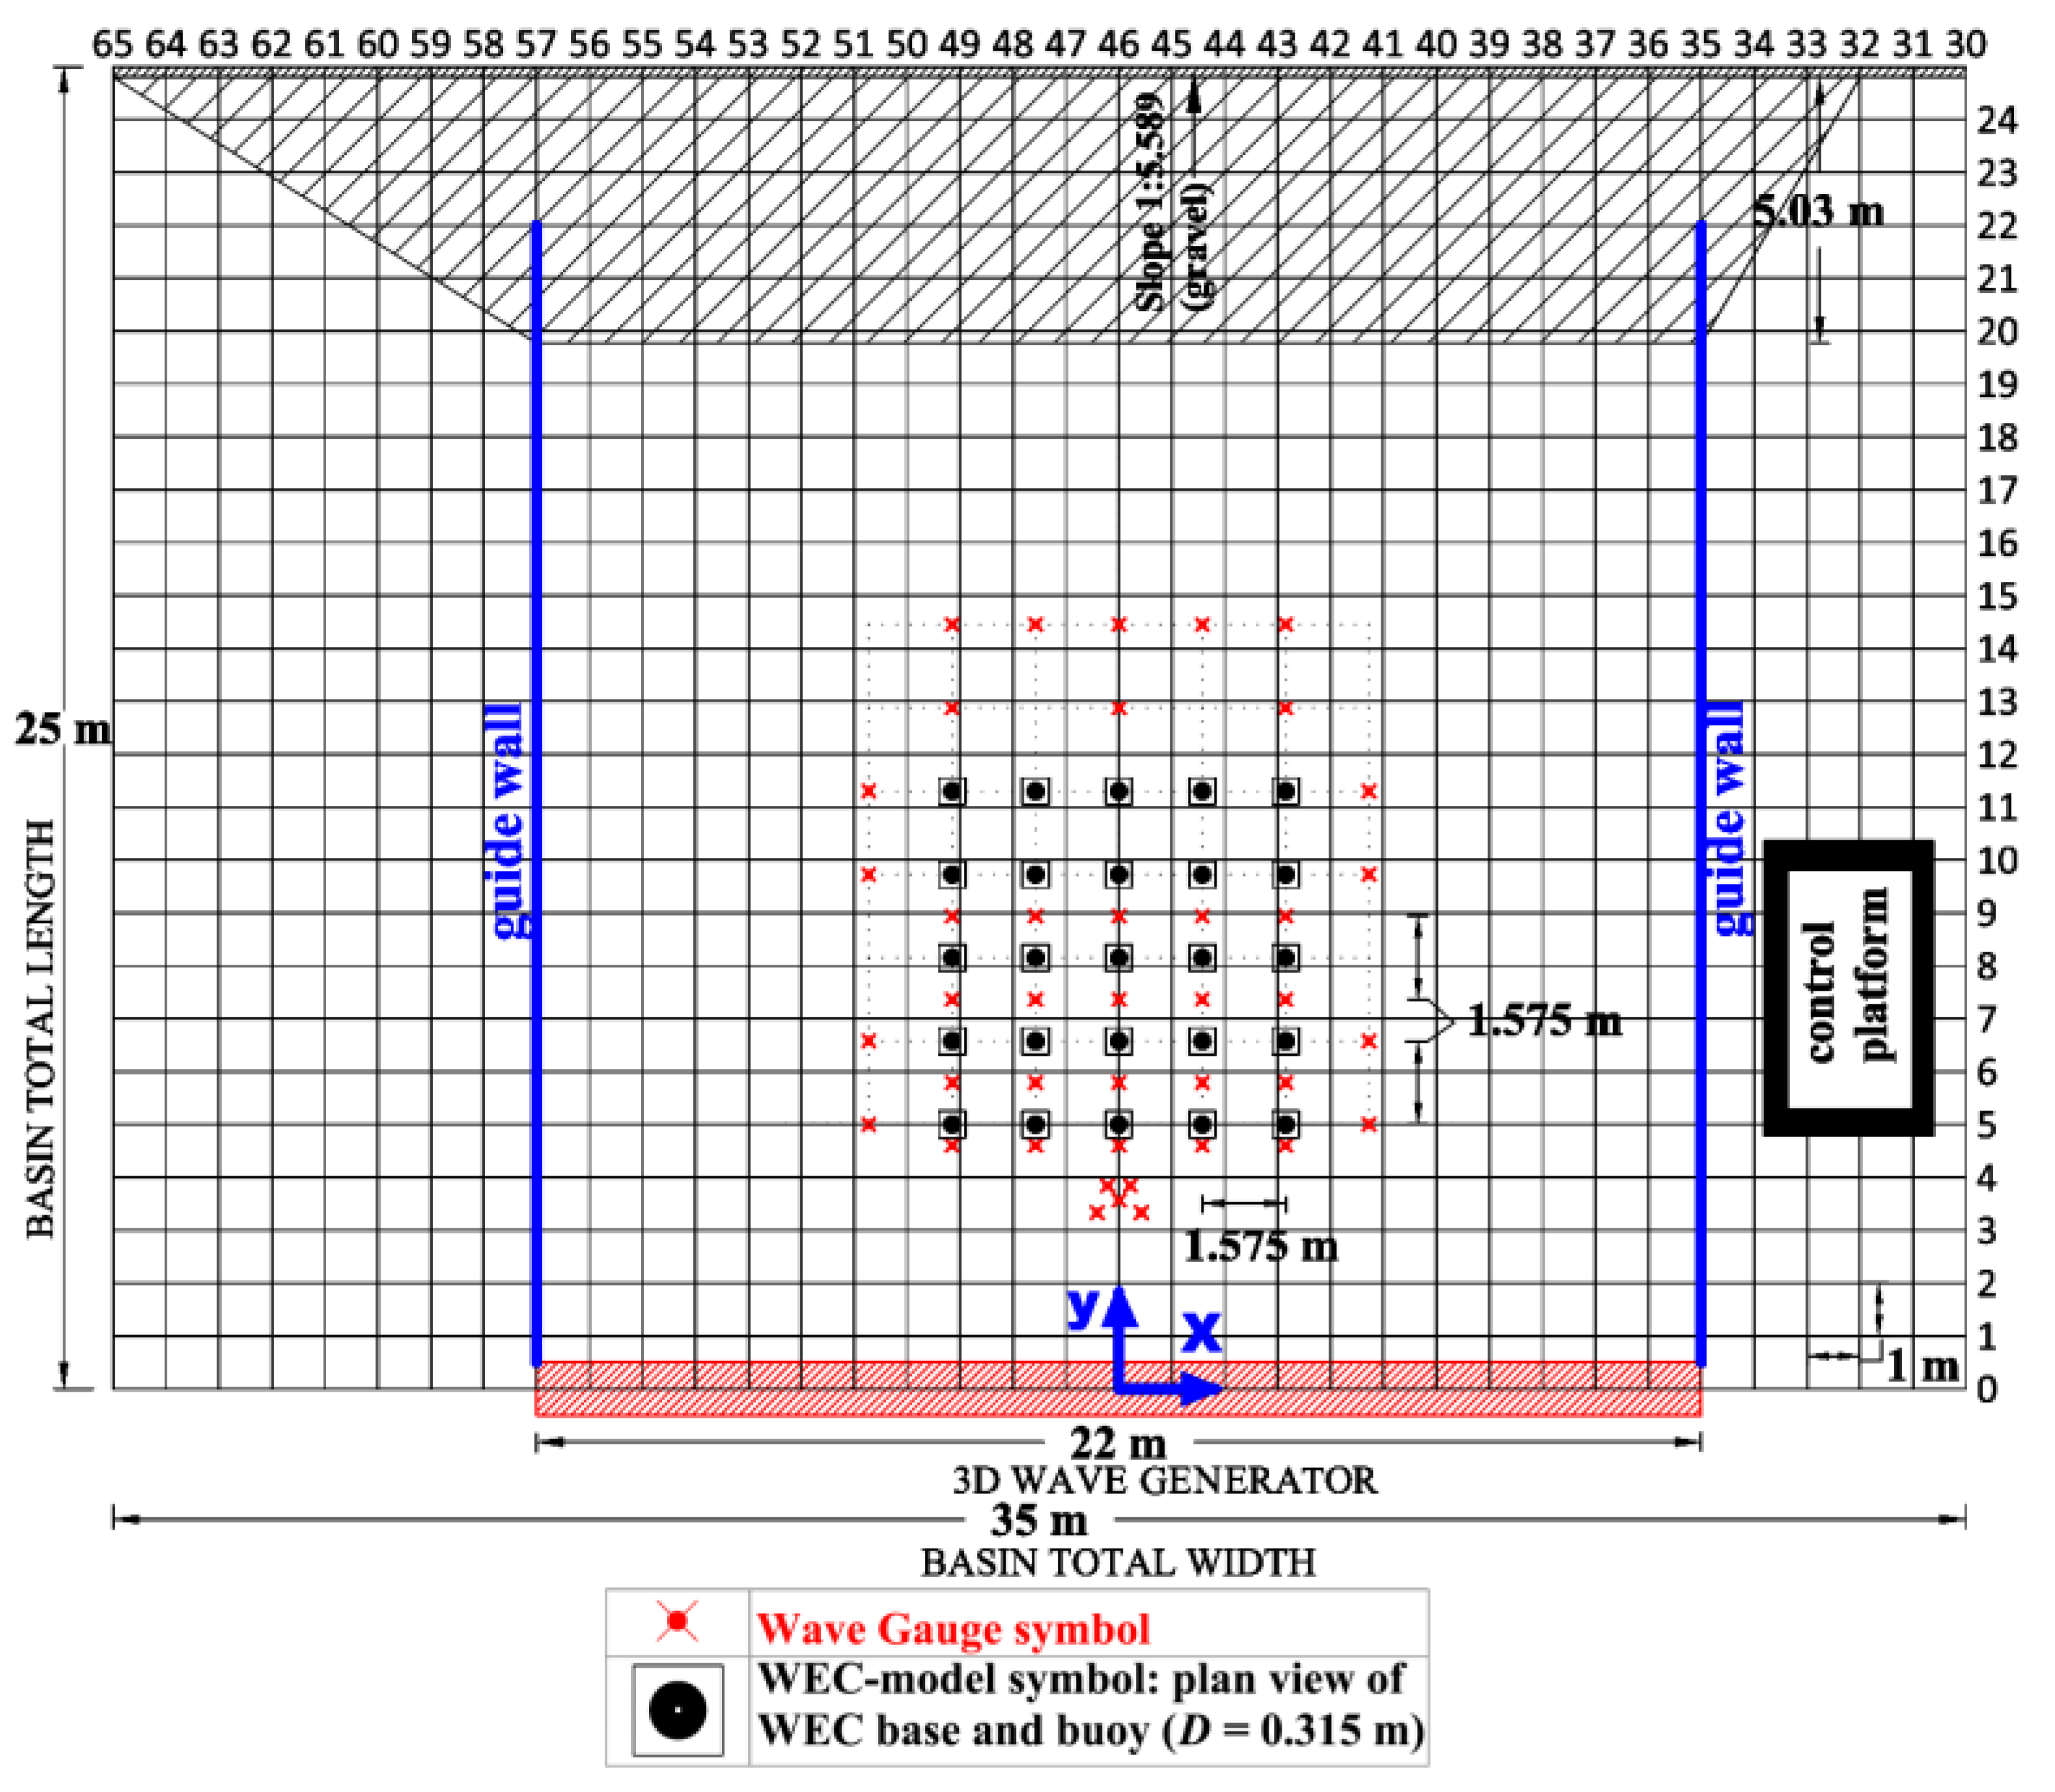
In 2013, as part of the WECwakes research project funded by the EU FP7 HYDRALAB IV program, experiments have been conducted in the Shallow Water Wave Basin of the Danish Hydraulic Institute (DHI) in Hørsholm, Denmark [3]. A large number of tests was performed on large arrays of point absorber-type WECs (up to 25 units, see Figure 6). The research performed within the WECwakes project focuses on generic heaving WECs, intended for validation purposes of numerical models.
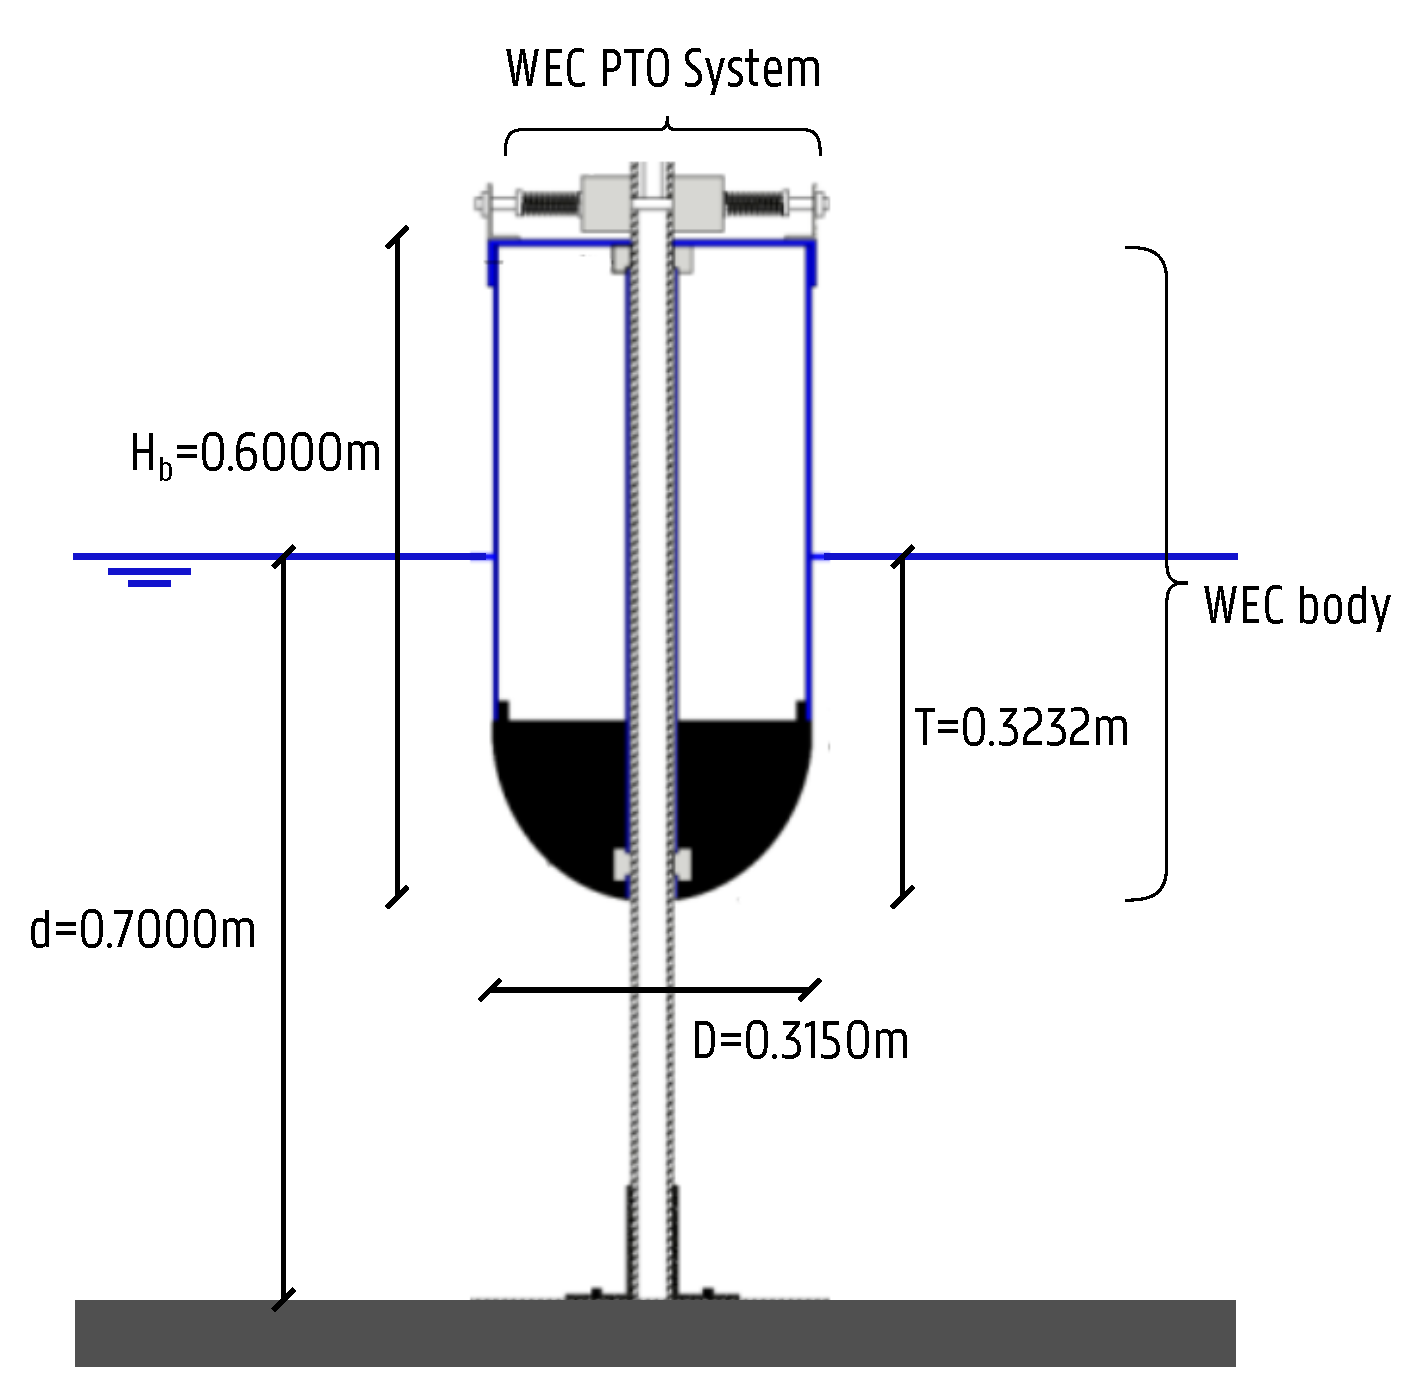
A range of WEC array geometric configurations and wave conditions have been tested. Each WEC unit is composed of a buoy, designed to heave along a vertical shaft only, and can thus be modeled as a single degree of freedom system (see Figure 7). The WEC consists of a cylindrical body and a spherical bottom. The diameter is 0.3150 m, while the draft is 0.3232 m. The water depth is fixed at 0.7000 m. Energy absorption through the WECs’ PTO system, is modeled by realizing energy dissipation through friction-based damping of the WECs’ heave motion. Wave gauges are used to measure the wave field within and around the arrays. Displacement meters are mounted on each WEC unit for the measurement of the heave displacement. The wave induced surge force is measured on five WECs along the central line of the array.
The experimental setup of 25 individual WEC units in an array layout, placed in the large wave tank, is at present the largest setup of its kind, studying the important impacts on power absorption and wave conditions of WEC array effects. Most importantly, the WECwakes database is comprehensive and is applicable not only to WEC arrays, but also to floating structures/platforms, stationary cylinders under wave action, etc., for understanding of, e.g., wave impact on the cylinders and wave field modifications around them. The WECwakes database is accessible to the research community as specified under the HYDRALAB rules.

3.4. Test Program

3.4.1. Comparison between Wave Propagation Models Using the Coupling Methodology

The first objective of this research is to compare the results obtained by the application of the introduced coupling methodology to both wave propagation models. For this reason, a test program based on long-crested regular and irregular waves is set up, as presented in Table 1. The WEC-WEC distance L W W is fixed at 3 D with D the diameter of the WEC. A cylindrical device is chosen with D = 20 m and a draft of T = 5 m. The following characteristics are varied during the tests:
  • Wave type: regular (REG) and irregular waves (IRR)
  • Water depth d: deep and transitional water
  • Number of WECs: ranging from one to five
  • Array geometrical layout: several configurations
  • Bathymetry: fixed bottom; two beach profiles (Beach1, Beach2); one sea bottom
Tests 3 to 10 are performed with multiple WECs. It is important to mention that the coupling methodology is applied by coupling the complete array of WECs, instead of coupling each WEC individually. Tests 7 to 9 and 10 are performed with varying bathymetry. Test 7 refers to wave propagation over a gradual beach slope (Beach1) with a gradient of 1 / 12 going from 50 m depth to 25 m over a length of 300 m. The bathymetry of Test 8 (Beach2) consists of two consecutive beach slopes with a gradient of around 1 / 10 with water depths from 50 m to 25 m to 1 m. Finally, Tests 9 and 10 are based on a sea bottom bathymetry with an average depth of 37 m. All bottom profiles are illustrated in Figure 8.
The accuracy of the results will be assessed by calculating the K D value, over a specific time window Δ t , as defined in Equation (13). It is the ratio of the numerically-calculated disturbed wave height H s , d to the incident wave height H i , d . The surface elevation η is squared and summed up over all n time steps within the time window Δ t . It is multiplied with the relative time step d t Δ t and a factor of eight. From this value, the square root is taken and finally divided by the incident wave height H i (for regular waves) or significant wave height H s , i (for irregular waves).
K D = H s , d H s , i = 8 · ( i n η i 2 ) · d t Δ t H s , i
The K D value summarizes the wave interactions during the entire simulation duration in one value per grid cell. When K D > 1 , it indicates a local increase of wave height or “hot spot”, while a value K D < 1 indicates a local decrease of wave height or “wake”.
Within the comparison study, results from both wave propagation models are compared with each other. Additionally, the results are compared to a pure BEM solution where possible (regular waves with constant water depth). The accuracy of the models is estimated based on the following outputs:
  • Contour plots of the K D values throughout the entire domain
  • Line cross-sections of the K D values along the wave direction
  • Contour plots of the relative differences between the results obtained by the wave propagation models
  • Calculation of relative K D error values

3.4.2. Comparison to Experimental Data

The WECwakes experiments consisted of 591 tests in total. Out of these tests, one geometrical array configuration is selected for the comparison with the results of the coupling methodology. There are two sets of regular incident wave conditions with wave height H = 0.074 m and wave period T, either 1.18 s (close to the resonance period T R of the device) or 1.26 s. These wave conditions, combined with a constant water depth of d = 0.7 m, result in non-linear Stokes second order waves. Although the numerical model is only valid for linear waves, the incident waves are only weakly non-linear. The wave propagation model OceanWave3D will be ran in non-linear mode, in contrast to what was advised in Section 3.2.2, to ensure maximum accuracy of incident waves. Superposing the weakly non-linear incident and perturbed waves will lead to an error smaller than 0.1 % on the wave trough in comparison to linear wave theory, justifying the application of the superposition principle. The comparison is performed for a configuration of nine WEC units, arranged in a 3 × 3 layout (see Figure 9). The WEC units have an equal spacing of five WEC diameters 5 D = 1.575 m.
The DHI wave basin has a wave generation width of 22 m, while the waves propagate over a length of 25 m. Side walls are installed in the basin to guide the incident waves and reflect the perturbed waves. This is mainly done to simplify the comparison to numerical models, where it is difficult to absorb waves from different directions.
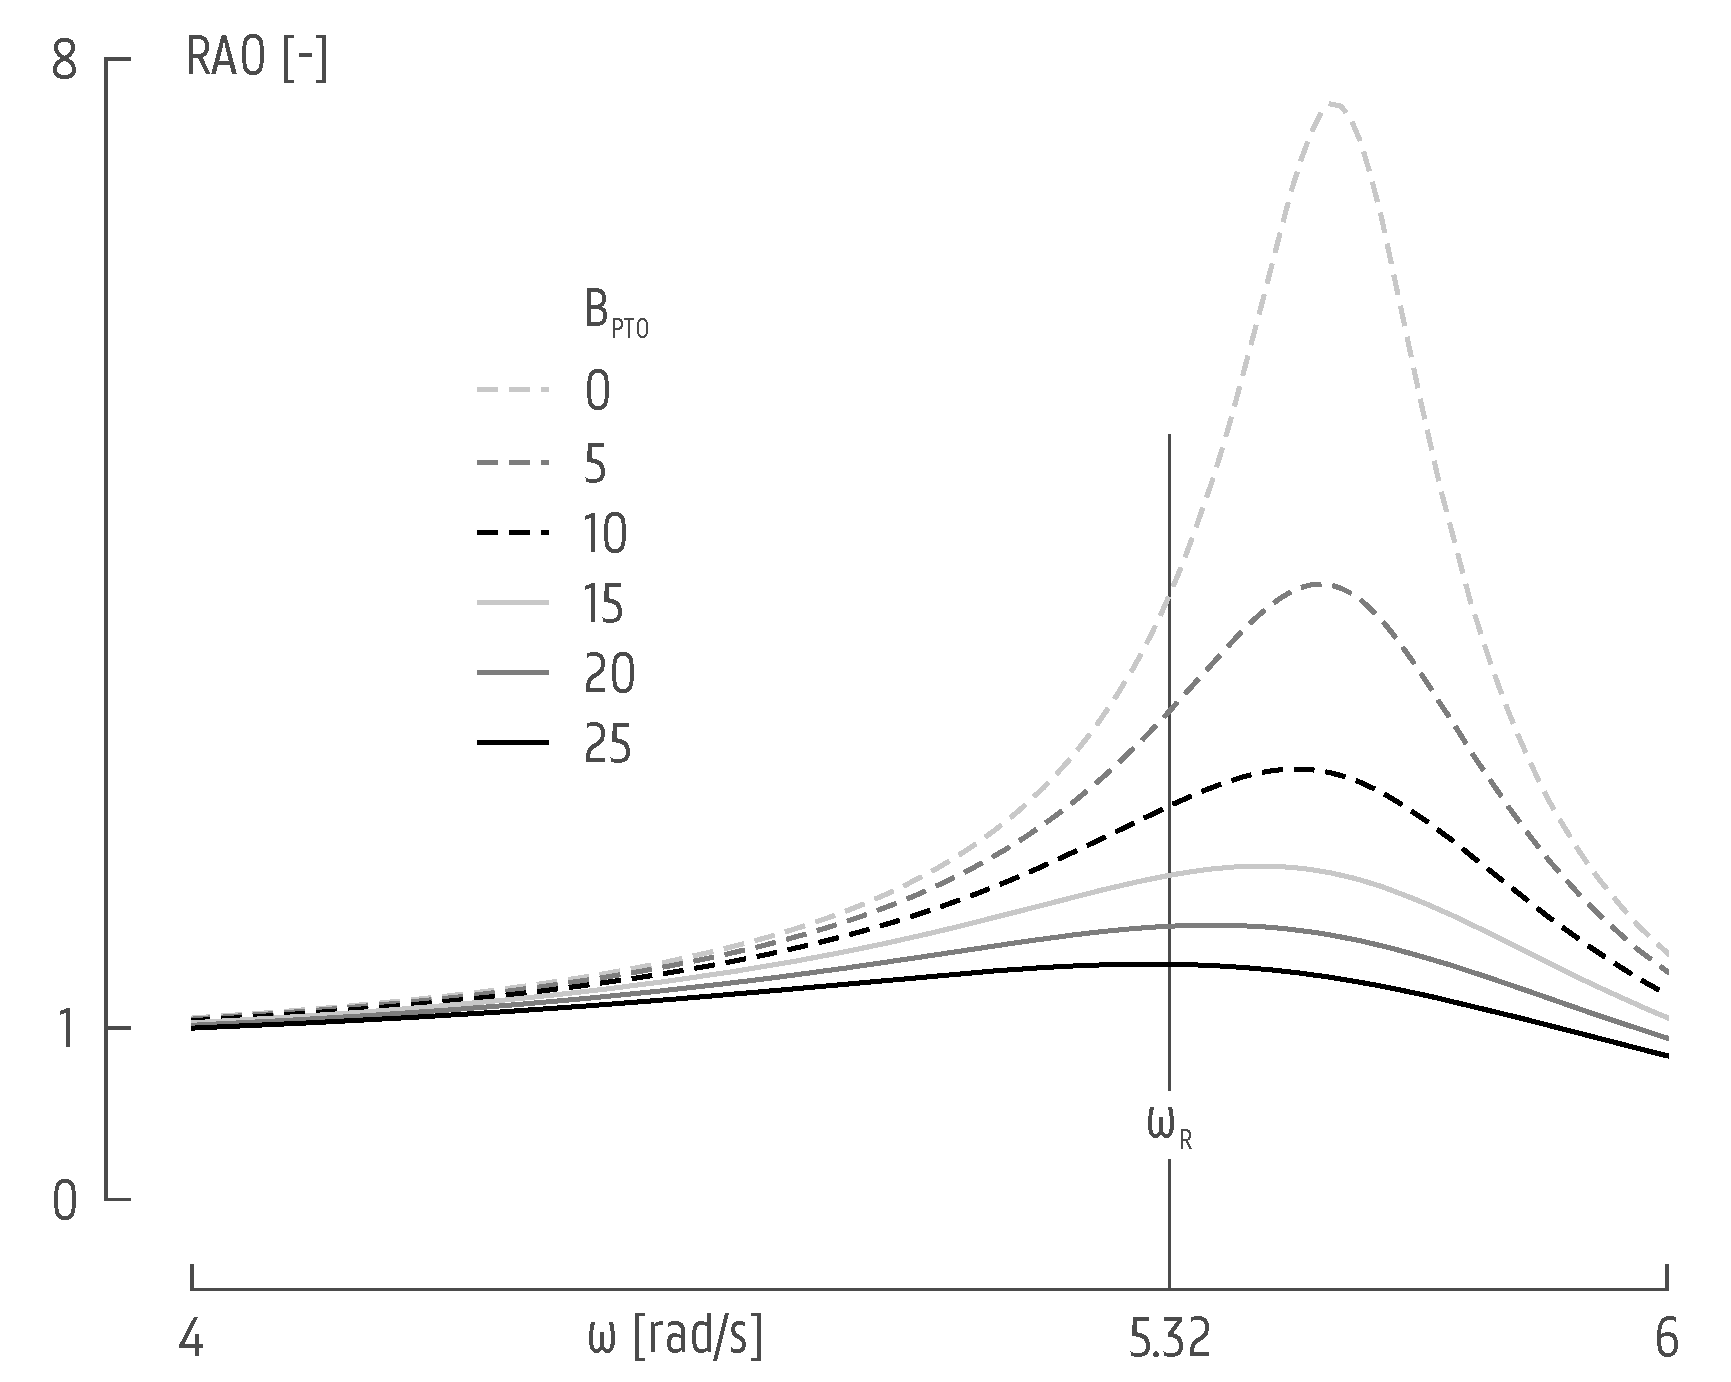
Each WEC unit is equipped with a friction-based PTO system. The effect of this PTO is included in the simulations by adding an external numerical damping term B P T O to the RAO, as previously demonstrated in Equation (3). In order to identify the correct value for this added damping, the RAO is calculated for several values of B P T O . When the peak of the RAO curve is located exactly on the natural frequency ω R = 2 π / T R = 5.32 rad/s, the external damping is considered correct. As illustrated in Figure 10, the correct value of B P T O lies between 20 and 25 kg/s. Further iterations lead to a value of B P T O = 23.5 kg/s.
The comparison of the results is based on the surface elevation, registered by 19 resistive wave gauges, distributed over the domain as illustrated in Figure 9. For each wave gauge, the surface elevation is compared to the signal obtained by the numerical model. The location of the wave gauges is not perfectly aligned with the computational grid, so results are interpolated. The accuracy of the numerical model is quantified by calculating the normalized RMSE between the surface elevation of the numerical model and the experimental data:
R M S E a = 1 n i = 1 n ( η n , i η e , i ) 2 H / 2
Additionally, the domain is shown in Figure 9, measuring 30 m long and 22 m wide, with a 2.5 m-long wave generation zone and a 5 m-long wave absorption boundary. The grid size is set to dx = 0.1 m, which corresponds to the suggested value of L / 20 , as explained in Section 4.1.1. The time step is set to dt = 0.05 s, and the coupling radius is Rc = 10, dx = 1 m (see Section 4.1.2).

4. Results

4.1. Sensitivity Analysis

Before diving into the comparison study, a good base setup is required for the numerical simulations. The aim is to apply both numerical models on the same computational grid. This grid should be chosen carefully to ensure converging results, whilst maintaining an acceptable computational time. For this reason, a sensitivity analysis is performed based on two grid characteristics. The first is the grid spacing dx in the x-direction. In this study, dx = dy, where dy is the grid spacing in the y-direction. The spacing has a direct impact on the computational time and the resolution of the output files. Here, the objective is to have the coarsest grid leading to a converged result, in order to minimize the computational time. The second characteristic is the coupling radius Rc. Ideally, this zone is kept as small as possible, in order to retain a large zone for the wave interactions in the wave propagation model.

4.1.1. Grid Spacing

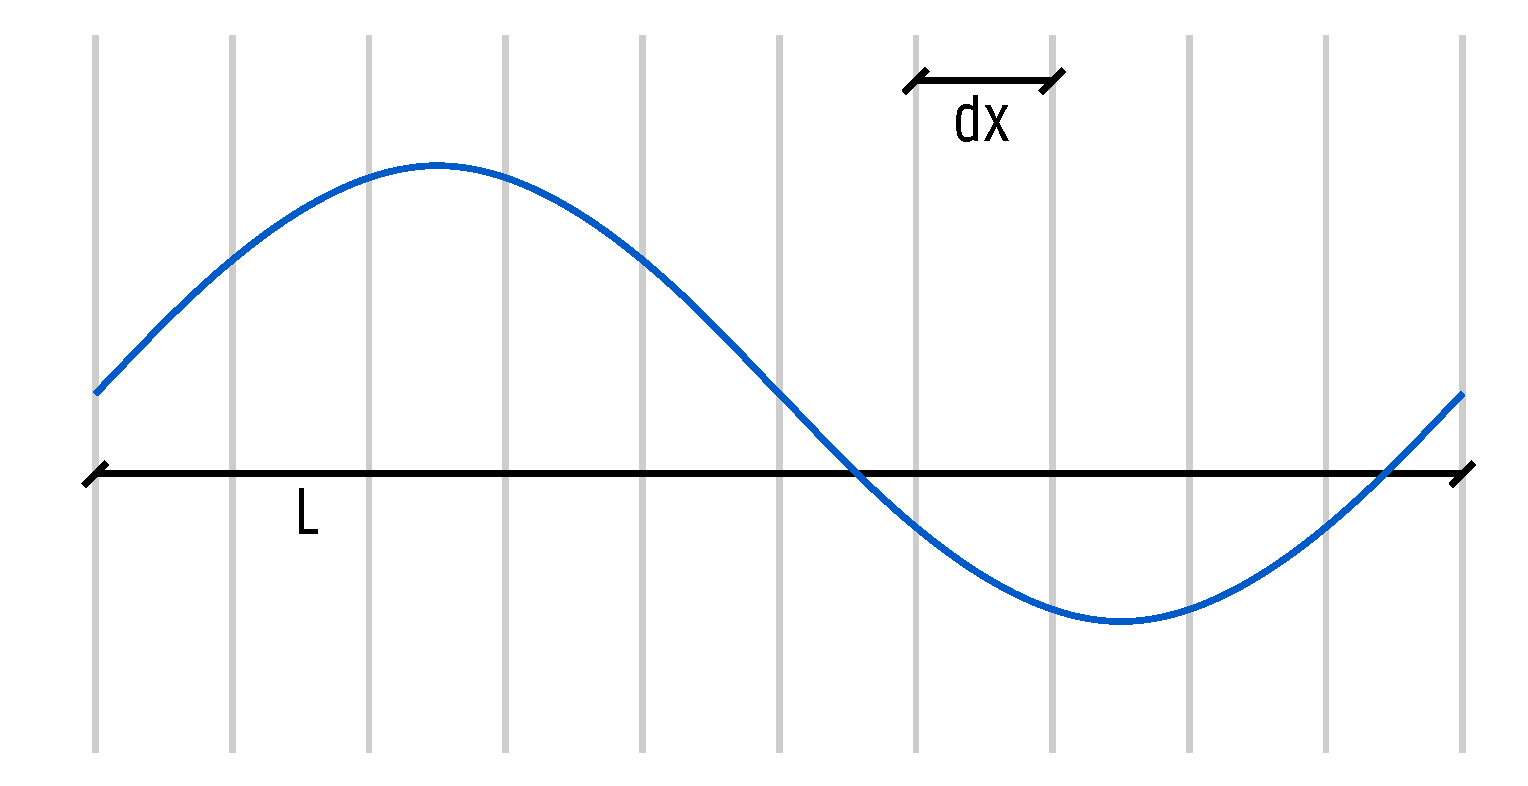
First, a sensitivity analysis is performed based on the grid spacing of the wave propagation model. The computational grid consists of square cells with size dx = dy. This size is varied, based on the wave length L of the incident waves, in order to achieve a convergent solution (see Figure 11). The largest grid size resulting in an accurate solution will be selected. The accuracy is determined by comparing the solution of the coupling methodology (applied to OceanWave3D) to a single BEM solution. The grid spacing dx is varied from L / 40 to L / 5 , as denoted in Table 2.
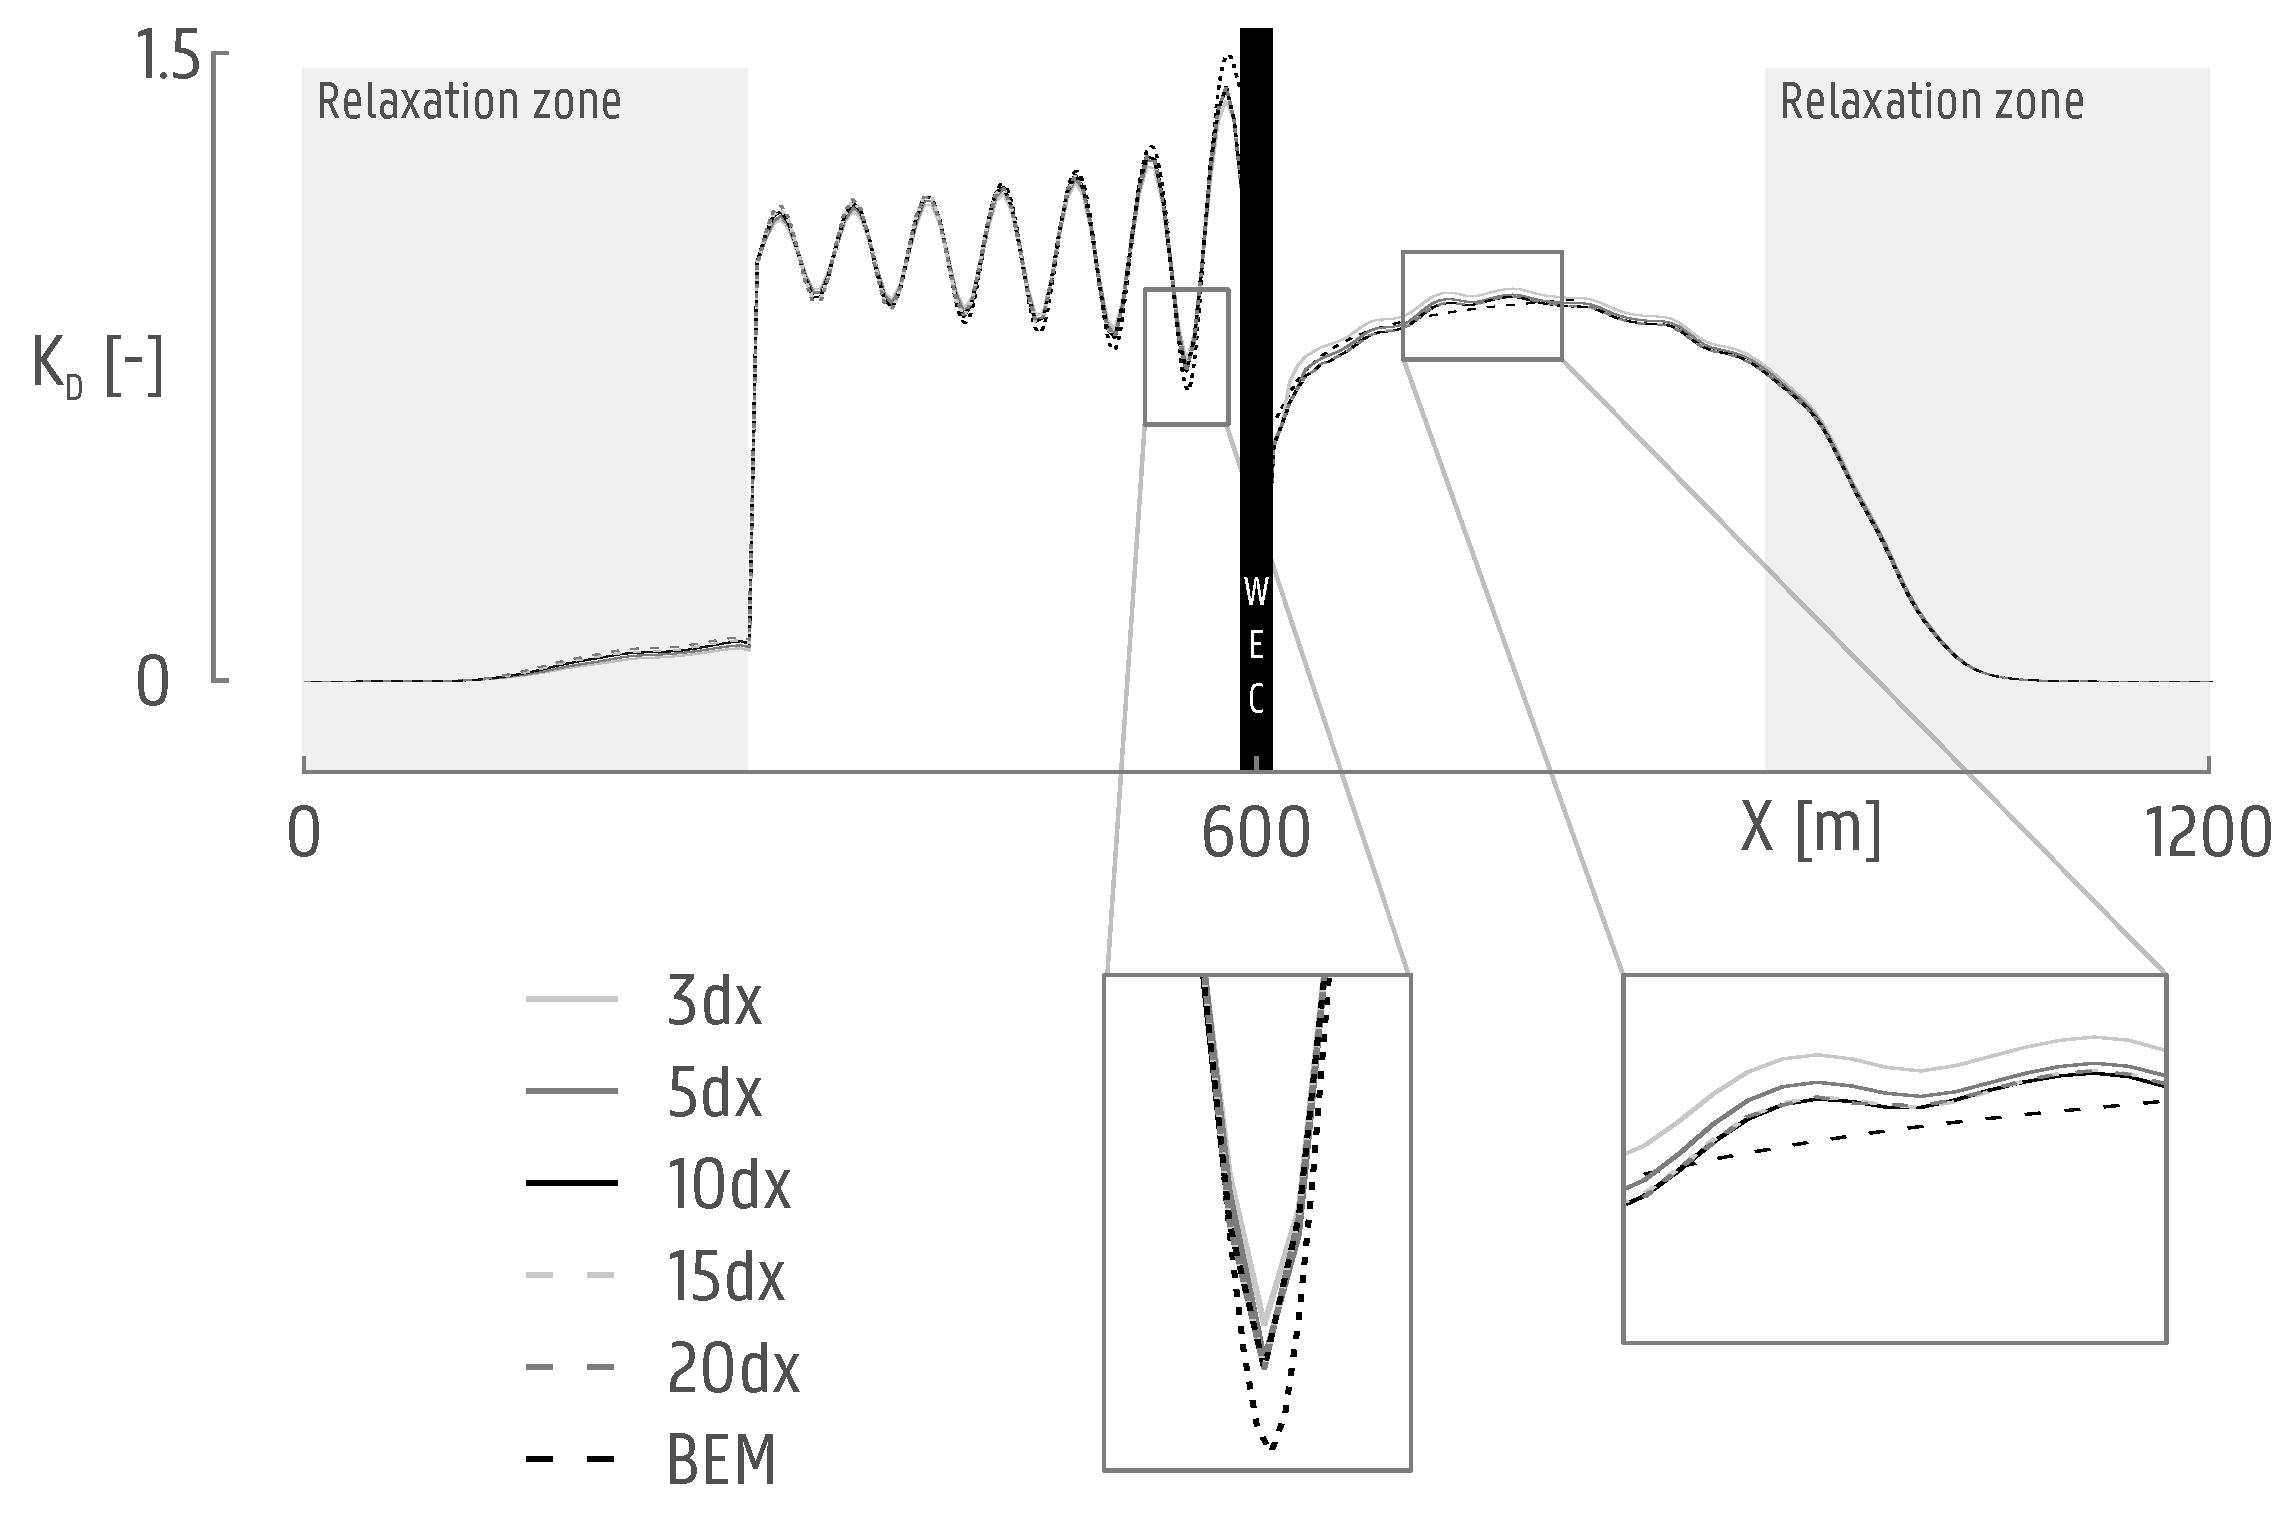
The sensitivity analysis is performed using the case of “Test 1” from Table 1. The K D value is calculated over a longitudinal section going through the center of the domain. The results are illustrated in Figure 12. Here, all five different grid spacings are plotted together with the BEM frequency domain result. In front of the device, there is a clear zone where wave reflection is observed. In the lee of the device, there is a wake that gradually disappears along the x-axis. At the beginning and at the end of the domain, there are wave relaxation zones where all energy is absorbed.
In Figure 12, it is difficult to assess the convergence of the results. For this reason, two regions of interest are enlarged for more detailed comparison. It becomes immediately clear that the grid spacings equal to L / 5 and L / 10 are too coarse. The peaks of the wave reflection are not reproduced, and the wake region is not accurately defined. The three finest resolutions ( L / 20 , L / 30 , L / 40 ) are all within a 0.5 % difference between each other. It is thus safe to assume the results have converged. In the test program, a grid spacing d x = L / 20 is used to ensure accurate results in combination with a reasonable computational time of around 30 min.

4.1.2. Coupling Radius

For the second sensitivity analysis, the value of the coupling radius R c is varied. Around the WEC device/array, a circular coupling zone is defined. Within this zone, the surface elevation values are forced into the wave propagation model, as resulted from the BEM simulation. The smaller this coupling zone is, the more space is available to freely propagate the waves and interact with other wave components. In order to identify the ideal coupling radius, the coupled model is run several times using each time a different coupling radius (see Figure 13). The results are compared to a solution obtained with the BEM model on the same computational grid. The coupling radius R c is varied from 3 to 20 d x (see Table 3).
The sensitivity analysis is again performed using “Test 1” from Table 1. The K D value is calculated over a longitudinal section going through the center of the WEC. The results are illustrated in Figure 14. Here, all five different radii are plotted together with the frequency domain result.
In the figure, it is difficult to assess the convergence of the results. For this reason, the same two regions as in Figure 12 are enlarged in more detail. The results obtained for all tested coupling radii are close to each other, but in the enlarged zone to the right, it is immediately clear that the coupling radii equal to three d x and five d x are too small to provide a sufficiently accurate result. The K D value of those radii differs from the one with the largest coupling radius up to 5 % . The three largest coupling radii all indicate the same converged result. For the completion of the test program, a coupling radius equal to 10 d x will be retained. In combination with the selected grid size of d x = L / 20 , this leads to a coupling radius of L / 2 .

4.2. Comparison of Numerical Models

In this section, the results of the comparison study between MILDwave and OceanWave3D, using the coupling methodology, are discussed. For each test described in Table 1, the K D results are compared. An extensive comparison will be performed for Test 1, while the results of the remaining tests will be condensed in RMSE values.

4.2.1. Test 1

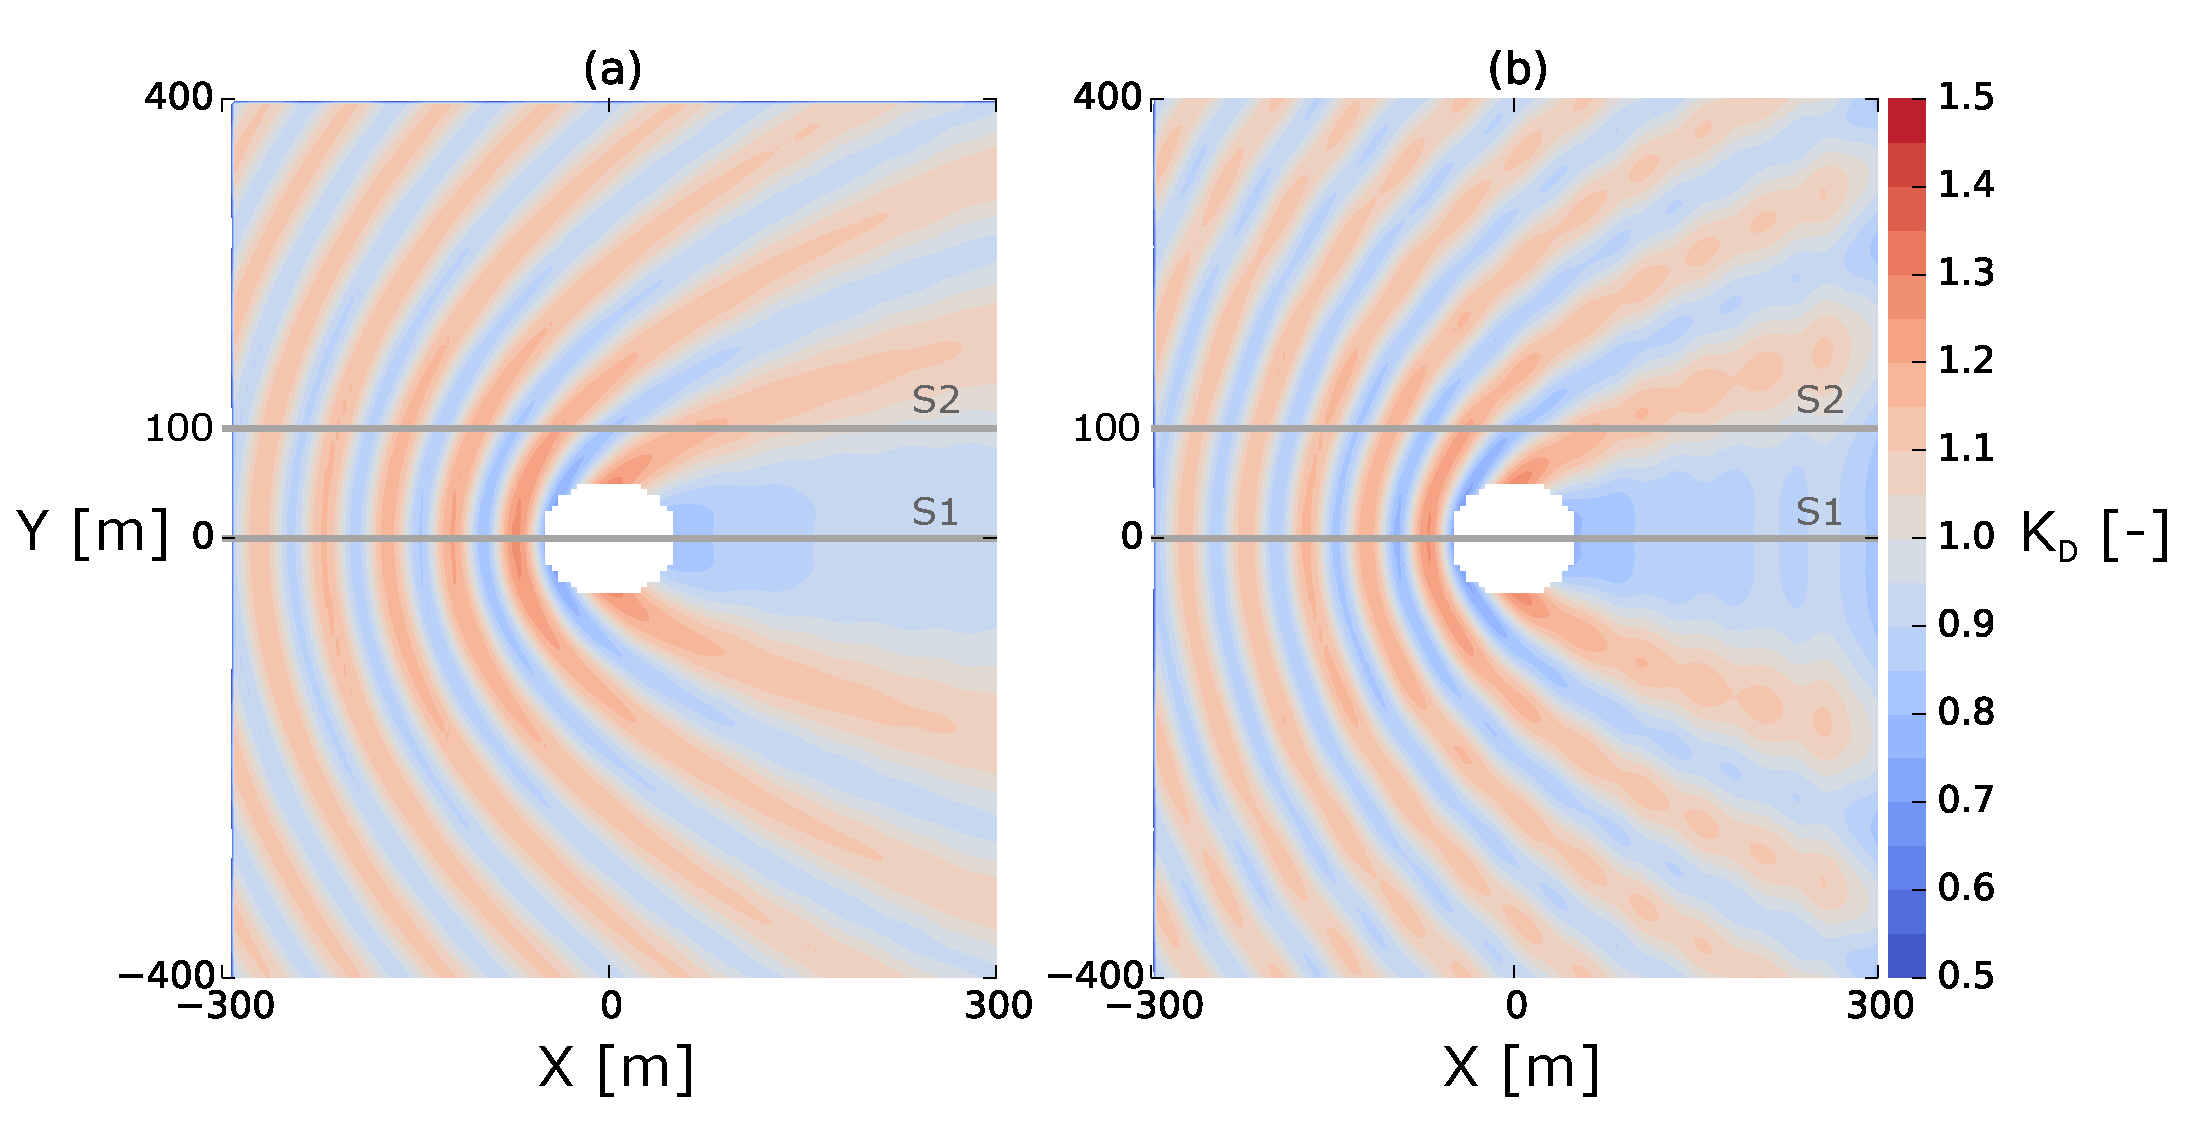
As defined in Table 1, “Test 1” consists of simulating the wave field around one single WEC in deep water. Each simulation is run for 150 s, allowing the wave field to completely develop in a steady state. Firstly, the K D values for both the MILDwave-Nemoh coupled models and the OceanWave3D-Nemoh coupled models are illustrated in Figure 15. Qualitatively, both figures correspond very well. The coupling zone is masked out (see central white area) since the implementation technique for each coupled model is slightly different. In front of the coupling zone, a clear reflection pattern with higher K D values is observed, while in the lee of the coupling zone there is a wake with reduced K D values.
A closer look is taken at two longitudinal sections in Figure 16. Section S1 is crossing the domain center, while Section S2 is taken at a location of y = 100 m. Again, the coupling zone is masked out for Section S1. Since Test 1 is performed with regular, linear waves over a constant water depth, the K D results can be compared to the Nemoh solution, as well. Both coupled models MILDwave-Nemoh and OceanWave3D-Nemoh achieve a very good correspondence with the Nemoh result and are very close to each other.
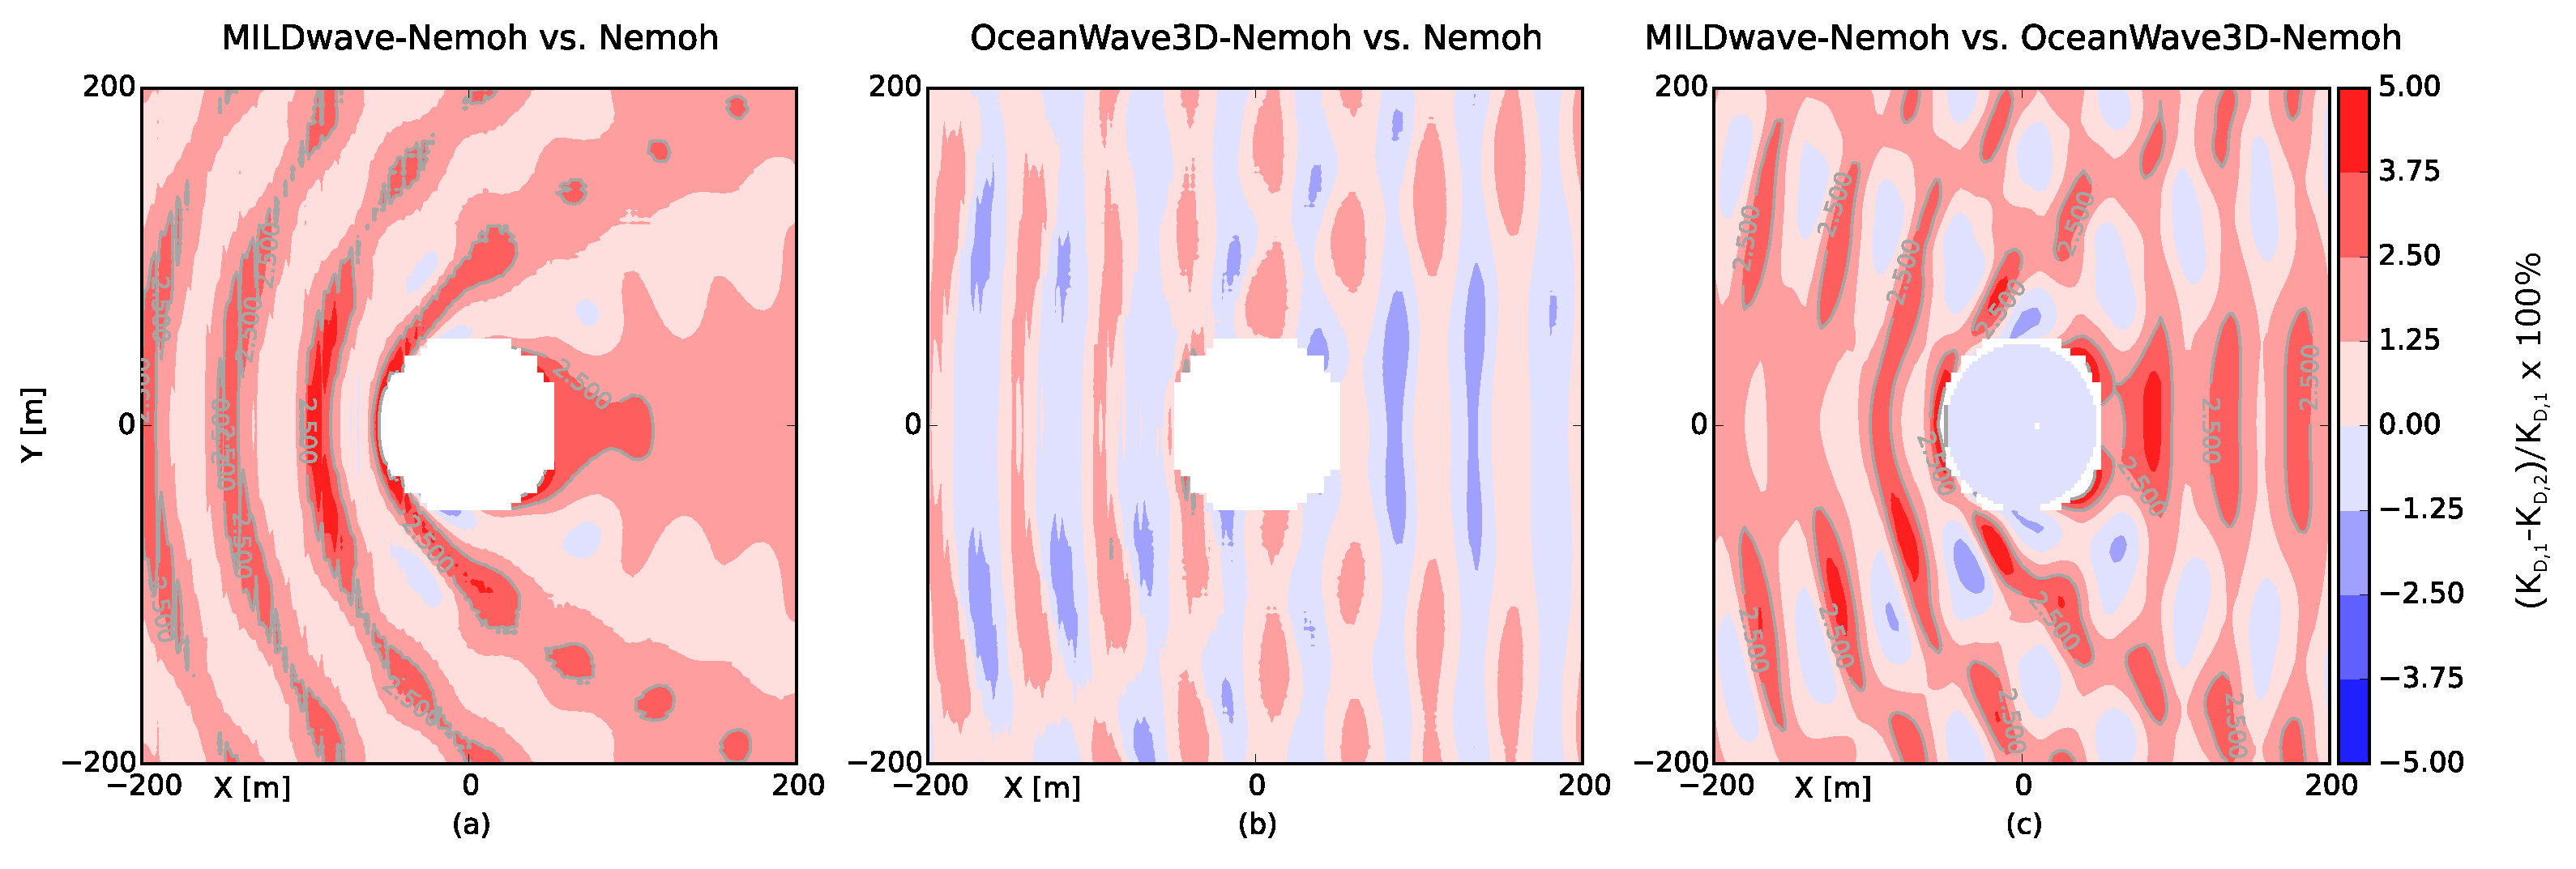
In Figure 17, the relative K D differences, ( K D , 1 K D , 2 ) / K D , 1 × 100 % , between the MILDwave-Nemoh, OceanWave3D-Nemoh and Nemoh models are quantified. Three plots show the difference between MILDwave-Nemoh and Nemoh, OceanWave3D-Nemoh and Nemoh and MILDwave-Nemoh and OceanWave3D-Nemoh, respectively. The MILDwave-Nemoh model maximally differs 5 % from the Nemoh result in the reflection zone in front of the WEC. This relative difference with Nemoh remains below 2 % for the OceanWave3D-Nemoh model. Comparing both coupled models to each other results in a maximum K D difference of 5 % , very locally in the diffraction zone.
As a final quantification of the comparison between the coupled models MILDwave-Nemoh, OceanWave3D-Nemoh and the wave-structure interaction solver Nemoh, one RMSE value can be calculated for the whole domain, based on the K D results. This is obtained by calculating the RMSE for each grid cell and averaging the result over the whole domain. For Test 1 from Table 1, this results in an error of RMSE = 1.7% for the MILDwave-Nemoh coupled model compared to Nemoh, an error RMSE = 1.0% for OceanWave3D-Nemoh compared to Nemoh and RMSE = 1.7% comparing both coupled wave propagation models MILDwave-Nemoh and OceanWave3D-Nemoh.

4.2.2. Comparison Summary

For each test of Table 1, the same comparison method is applied as the one presented in Section 4.2.1. However, for practical simplicity reasons, the remaining tests are summarized by calculating one RMSE value over the whole domain. For the tests performed with a flat bottom, there are three RMSE values: an error value comparing the MILDwave-Nemoh coupled model to Nemoh, one comparing the OceanWave3D-Nemoh model with Nemoh and an error value comparing both coupled models MILDwave-Nemoh and OceanWave3D-Nemoh. In the tests performed with a variable bathymetry, only the wave propagation models can be directly compared, since Nemoh is not applicable there. The summary for Tests 1 to 10 of Table 1 is given in Figure 18. It is clear that the coupling methodology succeeds in accurately propagating a total wave field, according to linear wave theory. For Tests 1 to 6, a direct comparison with Nemoh can be made since there is a flat bottom. Error values of K D remain below 3 % . When looking in more detail, it is clear that the largest errors are occurring at the border of the coupling zone. However, at a distance of only a couple of grid cells, the results are excellent. Due to the comparison with Nemoh, it can be concluded that the coupling methodology is able to extend the domain limitations of the wave-structure interaction model and accurately propagate a complex wave field over a larger domain. An assumption is then made that the accuracy of the wave field will remain high with variable bathymetries. The simulations with variable bathymetry show a very good agreement between MILDwave-Nemoh and OceanWave3D-Nemoh, as well, with RMSE values remaining below 5 % . The choice of which wave propagation model to use is easily made based on the following guideline. Since MILDwave calculates significantly faster, the only reasons to apply OceanWave3D are when: the bathymetry has slopes larger than 1/3 and there is a need for calculating velocity profiles or simulations with weakly non-linear waves. If these conditions or requirements are not applicable, then the use of MILDwave-Nemoh is strongly recommended, as this robust model provides quick and accurate results.

4.3. Comparison to the Experimental Dataset

The comparison of the K D results obtained with the OceanWave3D-Nemoh model with the experimental WECwakes data is performed based on the surface elevations at the 19 selected wave gauges, shown in Figure 9. First, the results for the test with a wave period of 1.18 s are discussed and, then, the results for the test with a wave period of 1.26 s.

4.3.1. Regular Waves with Wave Period T = 1.18 s

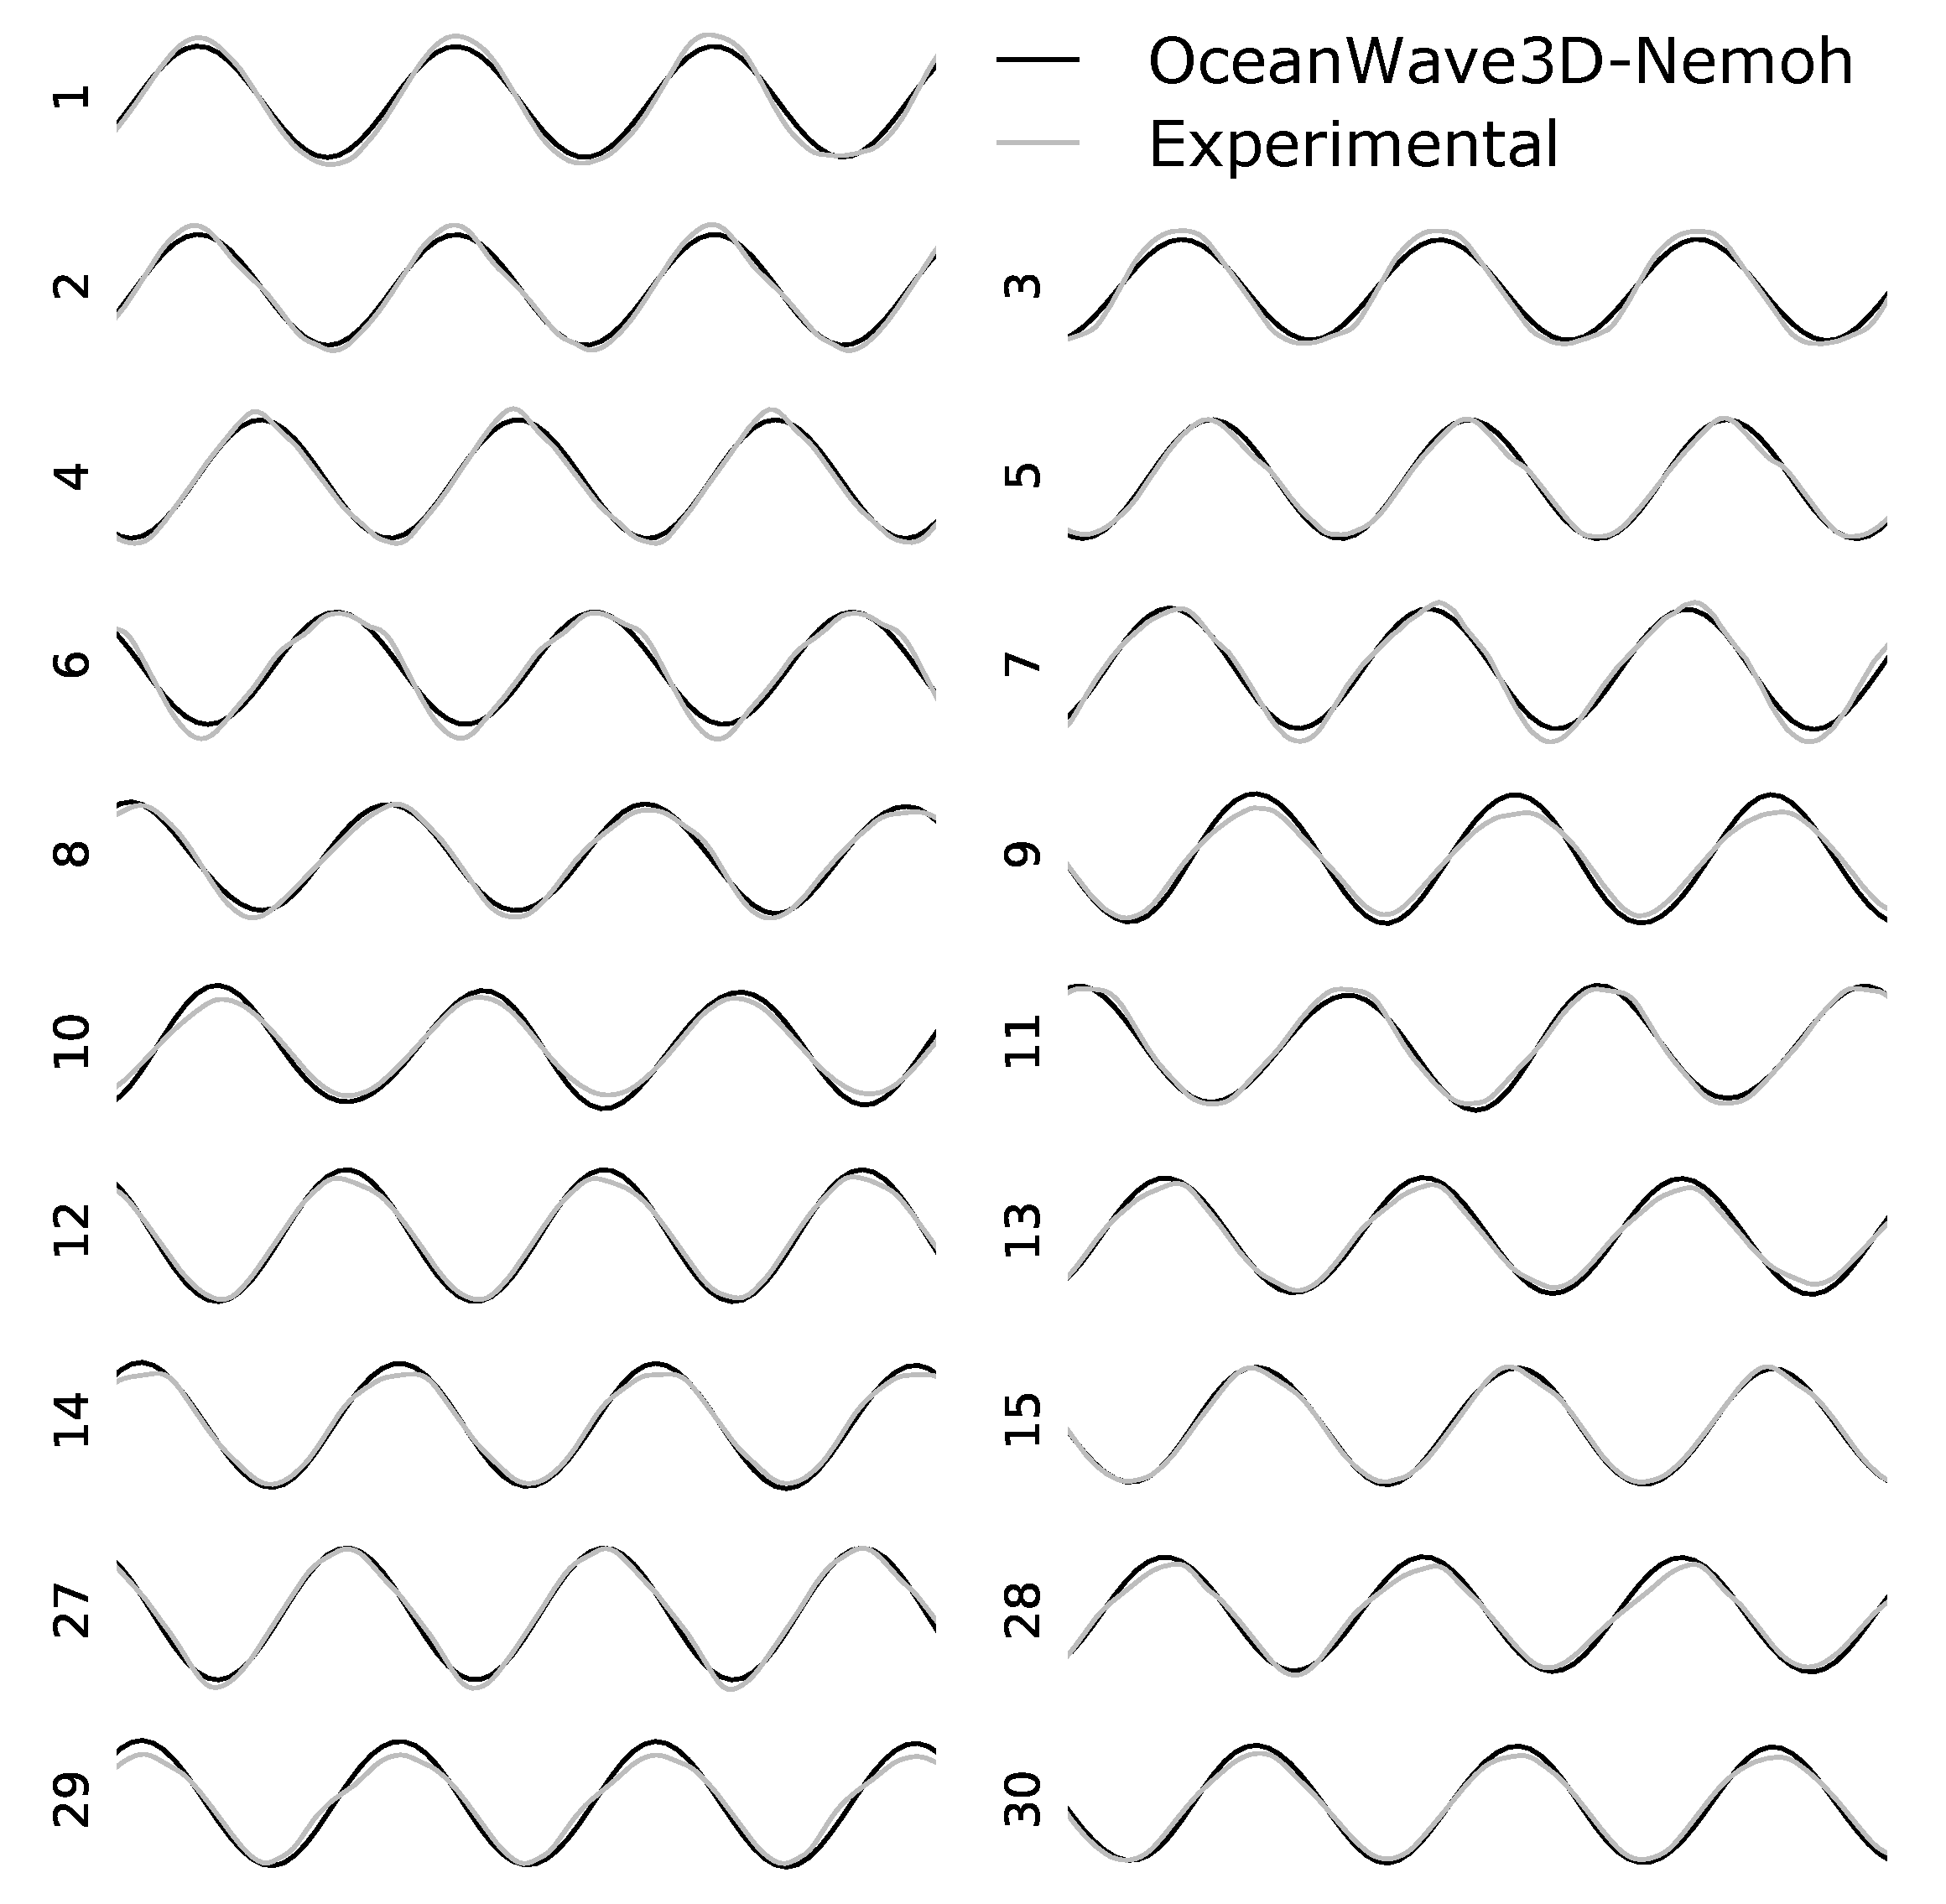
The first tested waves have a wave period of T = 1.18 s, which is close to the natural period T m of the WEC. In Figure 19, the surface elevations within a selected time window of the simulation are illustrated. All signals are displayed at the same scale. Overall, there is a good agreement with the experimental data. In some locations (e.g., Wave Gauges (WG) 6, 9, 12, 13, 28, 29), the experimental surface elevation has some clear non-linear behavior, which is logically not reproduced in the numerical results. These non-linearities possibly originate from both viscous effects, as well as non-linear wave radiation, as discussed in [17]. When the spherical bottom part of the WEC device is partly emerging above the free surface, the wave radiation becomes non-linear. The superposition of this non-linear radiated wave with the quasi-linear wave results in a non-linear combined wave. Since the WEC devices are heaving in resonance, this phenomenon is strongly present. A quantitative comparison between the data will be given in Section 4.3.3.

4.3.2. Regular Wave with Wave Period T = 1.26 s

The second wave has a period of T = 1.26 s. In Figure 20, the surface elevations within a selected time window of the simulation are illustrated. Again, there is a good agreement with the experimental data. In some locations (e.g., WG 4, 6, 8), the experimental surface elevation has some clear non-linear behavior (see Section 4.3.1), which is logically not reproduced in the numerical results. However, in general, the surface elevation looks more linear than in the first test. This can be due to the incident wave period, which is outside the natural period T m of the WEC. A more quantitative comparison between the data will be given in Section 4.3.3.

4.3.3. Comparison Summary

The error between the numerical and experimental data is again expressed as RMSE values. In Figure 21, the error on the surface elevation for each wave gauge of Figure 9 is given for both test cases of T = 1.18 s and T = 1.26 s, respectively. At the top of the figure, the location zone of the wave gauges is given. On average, the surface elevation differs 10 % from the experimental data, with slightly better results for the first test ( T = 1.18 s). The error values range from 4 % to 17 % . The wave gauges in the front and upper zone have the best correspondence with the experimental data ( 9 % error), while the center zone has the largest error ( 12 % error). Caution is necessary with interpreting these results, since the experimental data are inherently non-linear. The incident wave is a weakly non-linear Stokes second order wave. Additionally, the applied PTO system is a linear damper in theory, but behaves more like a non-linear Coulomb damper in practice. Nevertheless, this is the only dataset available for large WEC arrays, and the conditions are close enough to linear.

5. Conclusions

In this paper, a generic coupling methodology was introduced to perform numerical modeling of (closely-spaced) offshore floating or fixed structures. By combining the accurate near-field wave-structure interaction solver with fast far-field wave propagation models, it is possible to model regular and irregular waves propagating through offshore device clusters over a variable bathymetry. This was demonstrated by employing two different wave propagation models, MILDwave and OceanWave3D, to model wave propagation through floating wave energy converter arrays. The numerical comparison proved that both MILDwave-Nemoh and OceanWave3D-Nemoh are capable of providing accurate surface elevations for a range of different test cases. In general, it is advised to apply MILDwave-Nemoh, since it calculates reasonably faster. However, OceanWave3D-Nemoh can be applied for bathymetries with steep slopes, for the calculation of non-depth averaged 3D simulations and weakly non-linear simulations.
The introduced coupling methodology has limitations, as well. Firstly, since the methodology uses the superposition principle for obtaining a total wave field, only linear waves conditions lead to correct results. However, applying the methodology to weakly non-linear wave conditions only introduces a small error, as demonstrated in Section 4.3. Secondly, within the coupling zone, the solution is coming solely from the wave-structure interaction solver. It is thus necessary to have a flat bottom within that zone. Thirdly, typical BEM wave-structure interaction solvers are limited to a maximum number of fixed or floating bodies (e.g., Nemoh allows up to 25 bodies). However, in practice, they are enough for typical device farm applications. This limitation can be solved by applying a different type of wave-structure interaction solver. Fourthly, the coupling methodology does not allow direct simulation of irregular waves. Only a summation of several regular waves can be applied, which leads to an increase of the computational time.
In conclusion, despite some limitations, the coupling methodology has proven to be a valuable tool that is applicable in the following fields:
  • Far-field simulations of fixed/floating offshore devices, such as assessment of coastal impact, with significant higher accuracy than previously applied spectral methods;
  • Generic wave-wave and wave-structure interactions;
  • Assessing energy production of large WEC arrays;
  • Assessing wave propagation through large floating or fixed structure arrays, e.g., floating wind farms;
  • Optimization of floating or fixed structure array layout, based on the local wave climate and bathymetry.
Acknowledgments

The first author is grateful to receive the financial support from the “Agency for Innovation by Science and Technology in Flanders (IWT)” with the scholarship 141402. This research is also being supported by the Research Foundation Flanders (FWO), Belgium, Research Project No. 3G029114.

Author Contributions

Tim Verbrugghe set up the numerical experiments, under supervision of Andreas Kortenhaus. The simulations were performed by Raphael Rabussier. Tim Verbrugghe performed the comparison with experimental results. Vicky Stratigaki and Peter Troch proofread the text, assisted in structuring the publication and provided the basis technique for the coupling methodology.

Conflicts of Interest

The authors declare no conflict of interest.

Abbreviations

The following abbreviations are used in this manuscript:
WECWave Energy Converter
BEMBoundary Element Method
CFDComputational Fluid Dynamics
SPHSmoothed Particle Hydrodynamics
BVPBoundary Value Problem
PTOPower Take-Off
RAOResponse Amplitude Operator
DHIDanish Hydraulic Institute
WGWave Gauge
RMSERoot-Mean-Square Error
IWTAgency for Innovation by Science and Technology in Flanders
FWOResearch Foundation Flanders

References

  1. Gunn, K.; Stock-Williams, C. Quantifying the global wave power resource. Renew. Energy 2012, 44, 296–304. [Google Scholar] [CrossRef]
  2. Troch, P.; Beels, C.; De Rouck, J.; De Backer, G. Wake effects behind a farm of wave energy converters for irregular long-crested and short-crested waves. In Proceedings of the 32nd International Conference on Coastal Engineering (ICCE 2010), Engineering Foundation, Council on Wave Research, Shanghai, China, 30 June–5 July 2010; Volume 32, pp. 1–15. [Google Scholar]
  3. Stratigaki, V.; Troch, P.; Stallard, T.; Forehand, D.; Kofoed, J.P.; Folley, M.; Benoit, M.; Babarit, A.; Kirkegaard, J. Wave basin experiments with large wave energy converter arrays to study interactions between the converters and effects on other users in the sea and the coastal area. Energies 2014, 7, 701–734. [Google Scholar] [CrossRef] [Green Version]
  4. Todalshaug, J.H. Practical limits to the power that can be captured from ocean waves by oscillating bodies. Int. J. Mar. Energy 2013, 3–4, e70–e81. [Google Scholar] [CrossRef]
  5. Wolgamot, H.A.; Fitzgerald, C.J. Nonlinear hydrodynamic and real fluid effects on wave energy converters. Proc. Inst. Mech. Eng. Part A J. Power Energy 2015, 229, 1–23. [Google Scholar] [CrossRef]
  6. Folley, M.; Babarit, A.; Child, B.; Forehand, D.; O’Boyle, L.; Silverthorne, K.; Spinneken, J.; Stratigaki, V.; Troch, P. A review of numerical modeling of wave energy converter arrays. In Proceedings of the ASME 2012 31st International Conference on Ocean, Offshore and Arctic Engineering, Rio de Janeiro, Brazil, 1–6 July 2012; American Society of Mechanical Engineers: New York, NY, USA, 2012; pp. 535–545. [Google Scholar]
  7. Folley, M. Numerical Modelling of Wave Energy Converters: State-of-the-Art Techniques for Single Devices and Arrays; Academic Press: Cambridge, MA, USA, 2016. [Google Scholar]
  8. Rahmati, M.; Aggidis, G. Numerical and experimental analysis of the power output of a point absorber wave energy converter in irregular waves. Ocean Eng. 2016, 111, 483–492. [Google Scholar] [CrossRef]
  9. Delhommeau, G. Les Problemes de Diffraction-Radiation et de Resistance de Vagues: Etude Theorique et Resolution Numerique par la Methode des Singularites. Ph.D. Thesis, École Nationale Supérieure de Mécanique de Nante, Nantes, France, 1987. [Google Scholar]
  10. ANSYS Aqwa. Hydrodynamics Simulation and Diffraction Analysis. Available online: http://www.ansys.com/products/structures/ansys-aqwa (accessed on 6 June 2017).
  11. Hill, C. Wamit R User Manual. Available online: http://www.wamit.com/manual.htm (accessed on 6 June 2017).
  12. Babarit, A.; Delhommeau, G. Theoretical and numerical aspects of the open source BEM solver NEMOH. In Proceedings of the 11th European Wave and Tidal Energy Conference, Nantes, France, 6–11 September 2015; pp. 1–12. [Google Scholar]
  13. Yu, Y.; Li, Y. Reynolds-Averaged Navier–Stokes simulation of the heave performance of a two-body floating-point absorber wave energy system. Comput. Fluids 2013, 73, 104–114. [Google Scholar] [CrossRef]
  14. Agamloh, E.B.; Wallace, A.K.; Von Jouanne, A. Application of fluid–structure interaction simulation of an ocean wave energy extraction device. Renew. Energy 2008, 33, 748–757. [Google Scholar] [CrossRef]
  15. Finnegan, W.; Goggins, J. Numerical simulation of linear water waves and wave–structure interaction. Ocean Eng. 2012, 43, 23–31. [Google Scholar] [CrossRef]
  16. Devolder, B.; Rauwoens, P.; Troch, P. Numerical simulation of a single Floating Point Absorber Wave Energy Converter using OpenFOAM®. In Proceedings of the 2nd International Conference on Renewable Energies Offshore, Lisbon, Portugal, 24–26 October 2016; pp. 197–205. [Google Scholar]
  17. Mccallum, P.D. Numerical Methods for Modeling the Viscous Effects on the Interactions between Multiple Wave Energy Converters. Ph.D. Thesis, University of Edinburgh, Edinburgh, UK, 2017. [Google Scholar]
  18. Crespo, A.; Domínguez, J.; Rogers, B.; Gómez-Gesteira, M.; Longshaw, S.; Canelas, R.; Vacondio, R.; Barreiro, A.; García-Feal, O. DualSPHysics: Open-source parallel CFD solver based on Smoothed Particle Hydrodynamics (SPH). Comput. Phys. Commun. 2015, 187, 204–216. [Google Scholar] [CrossRef]
  19. Omidvar, P.; Stansby, P.K.; Rogers, B.D. Wave body interaction in 2D using smoothed particle hydrodynamics (SPH) with variable particle mass. Int. J. Numer. Methods Fluids 2012, 68, 686–705. [Google Scholar] [CrossRef]
  20. Manenti, S.; Panizzo, A.; Ruol, P.; Martinelli, L. SPH simulation of a floating body forced by regular waves. In Proceedings of the 3rd SPHERIC Workshop, Lausanne, Switzerland, 4–6 June 2008; pp. 38–41. [Google Scholar]
  21. Omidvar, P.; Stansby, P.K.; Rogers, B.D. SPH for 3D floating bodies using variable mass particle distribution. Int. J. Numer. Methods Fluids 2013, 72, 427–452. [Google Scholar] [CrossRef]
  22. Millar, D.L.; Smith, H.C.M.; Reeve, D.E. Modelling analysis of the sensitivity of shoreline change to a wave farm. Ocean Eng. 2007, 34, 884–901. [Google Scholar] [CrossRef]
  23. Alexandre, A.; Stallard, T.; Stansby, P.K. Transformation of Wave Spectra across a Line of Wave Devices. In Proceedings of the 8th European Wave and Tidal Energy Conference, Uppsala, Sweden, 7–10 September 2009; pp. 943–951. [Google Scholar]
  24. Carballo, R.; Iglesias, G. Wave farm impact based on realistic wave-WEC interaction. Energy 2013, 51, 216–229. [Google Scholar] [CrossRef]
  25. Charrayre, F.; Benoit, M.; Peyrard, C.; Babarit, A.; Edf, H.S.; Paristech, P. Modeling of interactions in a farm of wave energy converters taking into account the bathymetry. In Proceedings of the 14èmes Journées de l’Hydrodynamique, Val de Reuil, France, 18–20 November 2014; pp. 1–12. [Google Scholar]
  26. Stratigaki, V. Experimental Study and Numerical Modeling of Intra-Array Interactions and Extra-Array Effects of Wave Energy Converter Arrays. Ph.D. Thesis, Ghent University, Gent, Belgium, 2014. [Google Scholar]
  27. Troch, P.; Stratigaki, V. Chapter 10—Phase-Resolving Wave Propagation Array Models. In Numerical Modelling of Wave Energy Converters; Folley, M., Ed.; Academic Press: Cambridge, MA, USA, 2016; pp. 191–216. [Google Scholar]
  28. Venugopal, V.; Smith, G.H. Wave climate investigation for an array of wave power devices. In Proceedings of the 7th European Wave and Tidal Energy Conference, Porto, Portugal, 11–13 September 2007; pp. 1–10. [Google Scholar]
  29. Engsig-Karup, A.P.; Bingham, H.B.; Lindberg, O. An efficient flexible-order model for 3D nonlinear water waves. J. Comput. Phys. 2009, 228, 2100–2118. [Google Scholar] [CrossRef]
  30. Verbrugghe, T.; Troch, P.; Kortenhaus, A.; Stratigaki, V. Development of a numerical modeling tool for combined near field and far field wave transformations using a coupling of potential flow solvers. In Proceedings of the 2nd International Conference on Renewable Energies Offshore, Lisbon, Portugal, 24–26 October 2016; pp. 61–68. [Google Scholar]
  31. Viviano, A.; Musumeci, R.E.; Foti, E. A nonlinear rotational, quasi-2DH, numerical model for spilling wave propagation. Appl. Math. Model. 2015, 39, 1099–1118. [Google Scholar] [CrossRef]
  32. Li, Y.; Yu, Y.H. A synthesis of numerical methods for modeling wave energy converter-point absorbers. Renew. Sustain. Energy Rev. 2012, 16, 4352–4364. [Google Scholar] [CrossRef]
  33. Vidal, C.; Méndez Fernando, J.; Díaz, G.; Legaz, R. Impact of Santoña WEC installation on the littoral processes. In Proceedings of the 7th European Wave and Tidal Energy Conference, Porto, Portugal, 11–13 September 2007; pp. 11–14. [Google Scholar]
  34. Mendes, L.; Palha, A.; Fortes, C.J.; Sarmento, A. Analysis of the impact of a pilot zone for wave energy conversion offshore Portugal. In Proceedings of the Eighteenth International Offshore and Polar Engineering Conference, Vancouver, BC, Canada, 6–11 July 2008; International Society of Offshore and Polar Engineers: Mountain View, CA, USA, 2008; pp. 401–408. [Google Scholar]
  35. Le Crom, I.; Brito-Melo, A.; Sarmento, A. Maritime portuguese pilot zone for wave energy conversion: Modelling analysis of the impact on surfing conditions. In Proceedings of the 2nd International Conference on Ocean Energy, Brest, France, 15–17 October 2008. [Google Scholar]
  36. Troch, P. A Numerical Model for Propagation & Transformation of Linear Water Waves; Technical Report; Department of Civil Engineering, Ghent University: Gent, Belgium, 1998. [Google Scholar]
  37. Babarit, A.; Folley, M.; Charrayre, F.; Peyrard, C.; Benoit, M. On the modeling of WECs in wave models using far field coefficients. In Proceedings of the 10th European Wave and Tidal Energy Conference, Aalborg, Denmark, 2–5 September 2013; pp. 1–9. [Google Scholar]
  38. Stratigaki, V.; Vanneste, D.; Troch, P.; Gysens, S.; Willems, M. Numerical modeling of wave penetration in Ostend harbour. Coast. Eng. Proc. 2011, 1, 42. [Google Scholar] [CrossRef] [Green Version]
  39. Delhommeau, G. Amélioration des performances des codes de calcul de diffraction-radiation au premier ordre. In Proceedings of the 2èmes Journées de l’Hydrodynamique, Nantes, France, 13–15 February 1989. [Google Scholar]
  40. Radder, A.; Dingemans, M. Canonical equations for almost periodic, weakly nonlinear gravity waves. Wave Motion 1985, 7, 473–485. [Google Scholar] [CrossRef]
  41. Beels, C. Optimization of the Lay-Out of a Farm of Wave Energy Converters in the North Sea: Analysis of Wave Power Resources, Wake Effects, Production and Cost. Ph.D. Thesis, Ghent University, Gent, Belgium, 2009. [Google Scholar]
  42. Beels, C.; De Backer, G.; Mathys, P. Wave energy conversion in a sheltered sea. Sea Technol. 2008, 49, 21–24. [Google Scholar]
  43. Beels, C.; Troch, P.; De Backer, G.; Vantorre, M.; De Rouck, J. Numerical implementation and sensitivity analysis of a wave energy converter in a time-dependent mild-slope equation model. Coast. Eng. 2010, 57, 471–492. [Google Scholar] [CrossRef]
  44. Beels, C.; Troch, P.; De Visch, K.; Kofoed, J.P.; De Backer, G. Application of the time-dependent mild-slope equations for the simulation of wake effects in the lee of a farm of Wave Dragon wave energy converters. Renew. Energy 2010, 35, 1644–1661. [Google Scholar] [CrossRef]
  45. Beels, C.; Troch, P.; Kofoed, J.P.; Frigaard, P.; Kringelum, J.V.; Kromann, P.C.; Donovan, M.H.; De Rouck, J.; De Backer, G. A methodology for production and cost assessment of a farm of wave energy converters. Renew. Energy 2011, 36, 3402–3416. [Google Scholar] [CrossRef]
  46. Brorsen, M.; Helm-Petersen, J. On the Reflection of Short-Crested Waves in Numerical Models. In Proceedings of the 26th International Conference on Coastal Engineering, Copenhagen, Denmark, 22–26 June 1998; pp. 394–407. [Google Scholar]
  47. Engsig-Karup, A.P.; Glimberg, S.L.; Nielsen, A.S.; Lindberg, O. Fast Hydrodynamics on Heterogeneous Many-Core Hardware. In Designing Scientific Applications on GPUs; CRC Press: Boca Raton, FL, USA, 2013; pp. 251–294. [Google Scholar]
Figure 1. Visual representation of incident, reflected, radiated and diffracted waves around an array of three floating structures. The combination of these wave fields results in the total wave field around the three floating structures.
Energies 10 01697 g001
Figure 2. General concept of the coupling methodology between the numerical models.
Energies 10 01697 g002
Figure 3. Scheme for introducing information from the wave-structure interaction solver to the wave propagation model. Grey gradient zones are generation zones, and dark grey zones are absorption zones.
Energies 10 01697 g003
Figure 4. Scheme for propagation of incident waves in the wave propagation model. The grey gradient zone is a wave generation zone, and the dark grey zone is a wave absorption zone. No structure/device is present.
Energies 10 01697 g004
Figure 5. Linear boundary value problem, numerically solved in Nemoh. (Figure adapted from [12]).
Energies 10 01697 g005
Figure 6. Plan view of the WECwakes experimental arrangement in the DHI wave basin and 5 × 5-WEC rectilinear array. Grid at 1.0-m increments, wave gauge arrangement (x) and WEC positions (•) are indicated. The hatched region along the x-axis at the bottom of the figure denotes the extent of the wave paddles, while at the opposite end, the wave absorbing beach is shown. At the sides, plywood guide walls are used.
Energies 10 01697 g006
Figure 7. Sketch of the WECwakes WEC unit. D is the WEC diameter; d is the water depth; T is the draft of the WEC; while H b is the total height of the device.
Energies 10 01697 g007
Figure 8. Varying bathymetry profiles as used in the numerical simulations. L x is the wave propagation domain length.
Energies 10 01697 g008
Figure 9. Setup of both the experimental and computational domain; WEC array layout (•) and wave gauge distribution (×) used for the comparison with experimental tests. The code numbers of the used wave gauges are also shown, together with their zone name.
Energies 10 01697 g009
Figure 10. Iterative method to identify the correct external damping coefficient.
Energies 10 01697 g010
Figure 11. Illustration of grid size sensitivity analysis (here, d x = L / 10 ).
Energies 10 01697 g011
Figure 12. Sensitivity analysis for grid spacing, d x . Results from the coupling methodology applied to OceanWave3D, showing K D results along a longitudinal section in the middle of the domain.
Energies 10 01697 g012
Figure 13. Illustration of coupling radius R c sensitivity analysis. The WEC is illustrated as a solid black circle.
Energies 10 01697 g013
Figure 14. Sensitivity analysis for coupling radius, R c . Results from coupling methodology applied to OceanWave3D, showing K D results along a longitudinal section in the middle of the domain.
Energies 10 01697 g014
Figure 15. Contour plots of K D results for the coupled models: (a) MILDwave-Nemoh and (b) OceanWave3D-Nemoh.
Energies 10 01697 g015
Figure 16. K D results along the two longitudinal sections indicated in Figure 15 (Section 1 (S1): left; S2: right) for MILDwave-Nemoh, OceanWave3D-Nemoh and Nemoh.
Energies 10 01697 g016
Figure 17. Contour plots of relative K D errors comparing: (a) MILDwave-Nemoh and Nemoh; (b) OceanWave3D-Nemoh and Nemoh; (c) MILDwave-Nemoh and OceanWave3D-Nemoh.
Energies 10 01697 g017
Figure 18. RMSE values for whole domain between coupled wave propagation models MILDwave-Nemoh and OceanWave3D-Nemoh and the wave-structure interaction solver Nemoh.
Energies 10 01697 g018
Figure 19. Comparison of the wave signal between the OceanWave3D-Nemoh model and the experimental data for all 19 wave gauges in the experimental dataset for incident waves with period T = 1.18 s. The WG number (see Figure 9) is indicated at the left of each wave signal.
Energies 10 01697 g019
Figure 20. Comparison of the wave signal between the OceanWave3D-Nemoh model and the experimental data for all 19 wave gauges in the experimental dataset for incident waves with period T = 1.26 s. The WG number (see Figure 9) is indicated at the left of each wave signal.
Energies 10 01697 g020
Figure 21. Comparison of RMSE values for T = 1.18 s and T = 1.26 s for all 19 wave gauges of Figure 9 in the experimental dataset.
Energies 10 01697 g021
Table 1. Test program for the comparison of the coupling methodology.
Test Number #Wave TypeWave Height H (m)Wave Period T (s)Water Depth d (m)LayoutWEC-WEC Distance L W W (m)
1REG0.5850-
2REG0.5825-
3REG0.5825Energies 10 01697 i0013D
4REG0.5825Energies 10 01697 i0023D
5REG0.5825Energies 10 01697 i0033D
6REG0.5825Energies 10 01697 i0043D
7REG0.58Beach1Energies 10 01697 i0033D
8REG0.58Beach2Energies 10 01697 i0033D
9REG0.58Sea BottomEnergies 10 01697 i0033D
10IRR0.58Sea BottomEnergies 10 01697 i0033D
Table 2. Sensitivity analysis on grid size d x .
Testabcde
d x L / 40 L / 30 L / 20 L / 10 L / 5
Table 3. Sensitivity analysis on coupling radius R c .
Testiiiiiiivv
R c 3 d x 5 d x 10 d x 15 d x 20 d x